garfield eab 4 september 2014 - garfield county, · pdf files. boulder creek 08-013-0011 0.076...
TRANSCRIPT

Garfield EAB
4 September 2014Air Pollution Control Division

The atmosphere is complex, with many emission sources and types of pollution
Concerns include:
◦ ground level ozone
+ precursors (VOCs, NOx)
◦ particulates
◦ greenhouse gases
◦ nitrogen deposition
2
“Air respects no boundaries”

3
Colorado has a long history of oil and gas production Rapid development in the Piceance Basin in the early
2000s led to a number of citizen concerns and complaints on odors, dust, traffic, water, aesthetics, health
Air monitoring studies first commenced in 2002 Garfield County established a routine air monitoring
network in 2005 Increased development in the D-J Basin in the late
2000s led to increased local and citizen complaints and concerns similar to Piceance Basin
Additional field monitoring studies and regulations CDPHE held a series of outreach meetings in 2012-
2013 Local efforts to regulate oil and gas development
have also occurred

EPA has 6 “Criteria” pollutants for National Ambient Air Quality Standards (NAAQS) – primary focus for CDPHE/APCD◦ CO, O3, NO2, SO2, PM (PM10 & PM2.5), Pb
Designed to protect public health
Performed across State of Colorado◦ APCD has approximately 60 sites (other agencies also have
monitors)◦ Sites added or removed based on needs and concentrations
recorded
Mainly in population centers
Different types◦ “Continuous” provides hourly values
CO, O3, NOx/NOy, SO2, PM10, PM2.5, meteorology
◦ “Daily” provides 24-hour values PM10, PM2.5, air toxics
4

5
230
6630
4959
15180
3730
Garfield County, 2011CO (tons/year)
nonO&GPOINT
O&G
AREA
MOBILE
BIOGENIC
TOTAL = 30,730 TPY
255
765
2830
631
0
Garfield County, 2011PM10 (tons/year)
nonO&GPOINT
O&G
AREA
MOBILE
BIOGENIC
TOTAL = 4,481 TPY
86
9913
146
2530
471
Garfield County, 2011NOx (tons/year)
nonO&GPOINT
O&G
AREA
MOBILE
BIOGENIC
TOTAL = 13,146 TPY
212
35738
12711456
27966
Garfield County, 2011VOC (tons/year)
nonO&GPOINT
O&G
AREA
MOBILE
BIOGENIC
TOTAL = 66,643 TPY

6

7
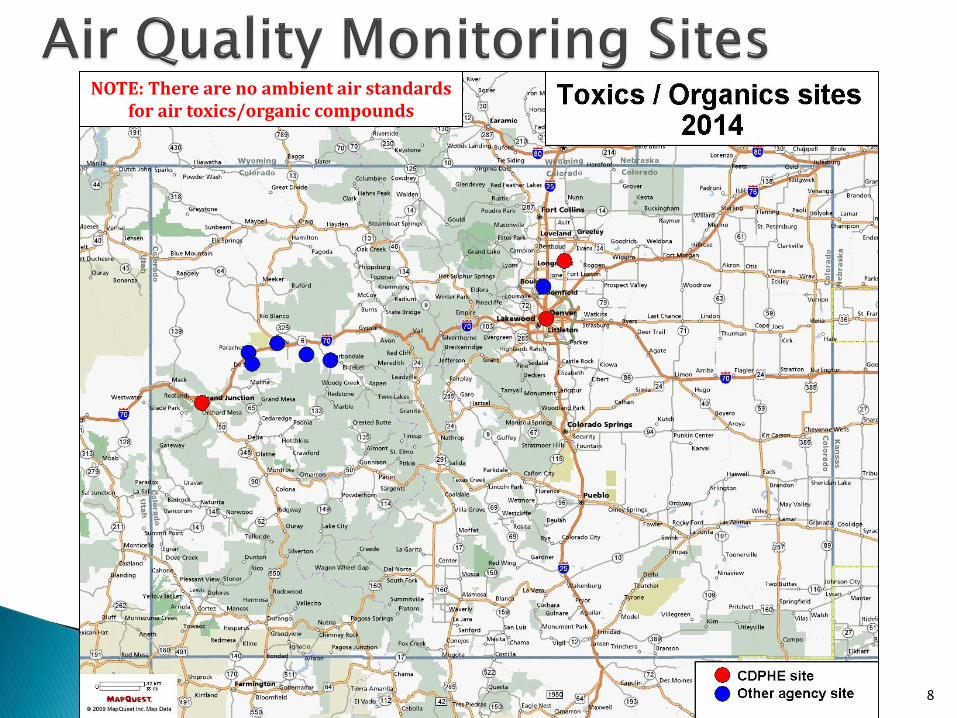
NOTE: There are no ambient air standards for air toxics/organic compounds
8

2011 2012 2013 2014 * 2011-2013 2012-2014 *
East Slope Sites 8-hr. O3 8-hr. O3 8-hr. O3 8-hr. O3 3-yr. Avg. 3-yr. Avg.
4th Max. 4th Max. 4th Max. 4th Max. 4th Max. 4th Max.
Value Value Value Value Value Value
Site Name AQS # (ppm) (ppm) (ppm) (ppm) (ppm) (ppm)
Welby 08-001-3001 0.075 0.077 0.077 0.066 0.076 0.073
Highland 08-005-0002 0.078 0.080 0.079 n/a 0.079 ---
Aurora East 08-005-0006 0.077 0.074 0.073 0.064 0.074 0.070
S. Boulder Creek 08-013-0011 0.076 0.076 0.079 0.069 0.077 0.074
CAMP 08-031-0002 --- 0.068 0.067 0.060 --- 0.065
La Casa 08-013-0026 --- --- 0.071 0.065 --- ---
Chatfield State Park 08-035-0004 0.082 0.086 0.083 0.072 0.083 0.080
USAF Academy 08-041-0013 0.074 0.075 0.074 0.064 0.074 0.071
Manitou Springs 08-041-0016 0.075 0.075 0.072 0.061 0.074 0.069
Welch 08-059-0005 0.077 0.079 0.080 0.064 0.078 0.074
Rocky Flats North 08-059-0006 0.081 0.084 0.085 0.074 0.083 0.081
NREL 08-059-0011 0.083 0.081 0.084 0.074 0.082 0.079
Aspen Park 08-059-0013 0.072 0.077 0.077 0.067 0.075 0.073
Fort Collins - West 08-069-0011 0.080 0.080 0.082 0.074 0.080 0.078
Fort Collins - CSU 08-069-1004 0.068 0.074 0.074 0.072 0.072 0.073
Weld County Tower 08-123-0009 0.077 0.080 0.073 0.070 0.076 0.074
NPS - Rocky Mtn. NP 08-069-0007 0.077 0.079 0.074 0.069 0.076 0.074
NOAA - BAO Tower n/a 0.076 0.077 0.071 n/a 0.074 ---
NOAA - Niwot Ridge n/a 0.067 0.076 0.072 n/a 0.071 ---
* 2014 data thru 7/31
Three Year Average 4th Maximum Ozone Values
9
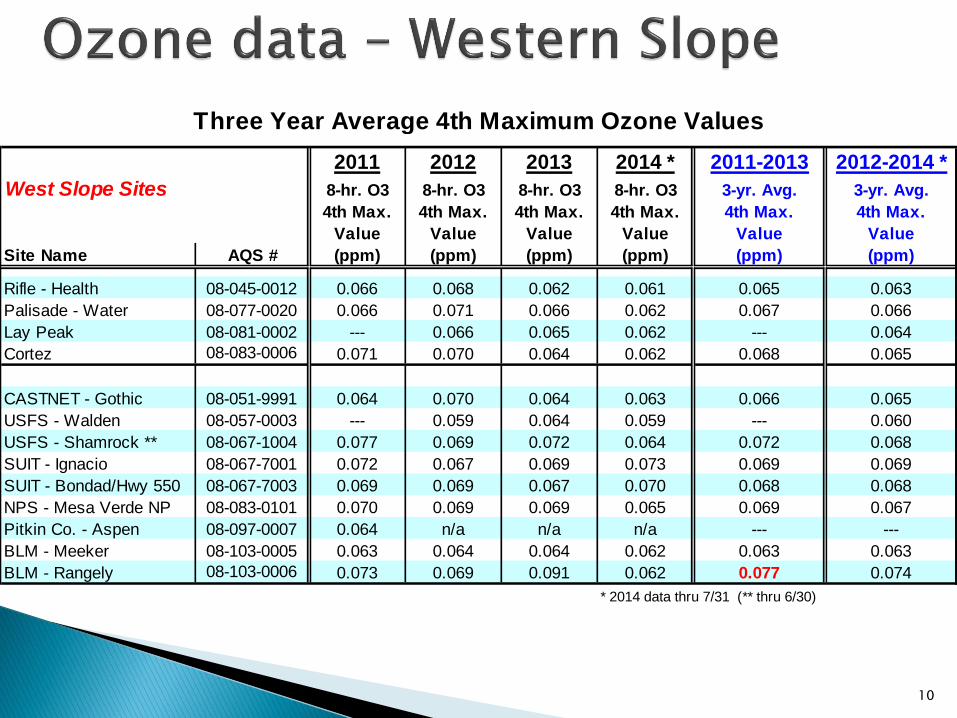
2011 2012 2013 2014 * 2011-2013 2012-2014 *
West Slope Sites 8-hr. O3 8-hr. O3 8-hr. O3 8-hr. O3 3-yr. Avg. 3-yr. Avg.
4th Max. 4th Max. 4th Max. 4th Max. 4th Max. 4th Max.
Value Value Value Value Value Value
Site Name AQS # (ppm) (ppm) (ppm) (ppm) (ppm) (ppm)
Rifle - Health 08-045-0012 0.066 0.068 0.062 0.061 0.065 0.063
Palisade - Water 08-077-0020 0.066 0.071 0.066 0.062 0.067 0.066
Lay Peak 08-081-0002 --- 0.066 0.065 0.062 --- 0.064
Cortez 08-083-0006 0.071 0.070 0.064 0.062 0.068 0.065
CASTNET - Gothic 08-051-9991 0.064 0.070 0.064 0.063 0.066 0.065
USFS - Walden 08-057-0003 --- 0.059 0.064 0.059 --- 0.060
USFS - Shamrock ** 08-067-1004 0.077 0.069 0.072 0.064 0.072 0.068
SUIT - Ignacio 08-067-7001 0.072 0.067 0.069 0.073 0.069 0.069
SUIT - Bondad/Hwy 550 08-067-7003 0.069 0.069 0.067 0.070 0.068 0.068
NPS - Mesa Verde NP 08-083-0101 0.070 0.069 0.069 0.065 0.069 0.067
Pitkin Co. - Aspen 08-097-0007 0.064 n/a n/a n/a --- ---
BLM - Meeker 08-103-0005 0.063 0.064 0.064 0.062 0.063 0.063
BLM - Rangely 08-103-0006 0.073 0.069 0.091 0.062 0.077 0.074
* 2014 data thru 7/31 (** thru 6/30)
Three Year Average 4th Maximum Ozone Values
10

EPA currently reviewing the NAAQS◦ “Policy Assessment for the Review of the Ozone National Ambient Air
Quality Standards, Second External Review Draft” released Jan. 2014◦ “Health Risk and Exposure Assessment for Ozone, Second External
Review Draft” released Jan. 2014◦ “Welfare Risk and Exposure Assessment for Ozone, Second External
Review Draft” released Jan. 2014
Clean Air Science Advisory Committee (CASAC) review recommends:◦ Primary standard “range between 60-70 ppb, with the caveat that
public health protections would be greater at the lower end of the range”
◦ Secondary standard based on a “biologically-relevant” W126 index with “ a level within the range of 7 ppm-hr to 13 ppm-hr”
EPA (based on court ruling) will issue a proposal by Dec, 1, 2014 (likely including new monitoring seasons)
EPA (based on court ruling) will promulgate a final NAAQS by Oct. 1, 2015
Monitoring season for Colorado likely to be Jan-Dec
11

“Continuous” data posted hourly on APCD Technical Services website and uploaded to EPA’s AIRNow website◦ http://www.colorado.gov/airquality/◦ http://airnow.gov/
Final validated data sent to EPA’s Air Quality System (AQS)
Forecasting performed daily and posted on APCD Technical Services website
Air quality advisories issued as needed Annual Data Report published and on APCD
website
12

13

14
http://www.garfield-county.com/air-quality/index.aspx

15
2002 EPA Well Study, Garfield County
2005 – 2007 Garfield VOC Study
2008 Garfield Targeted Well Study
2008 - current, Garfield County Monitoring
2013 – 2015 Garfield Oil and Gas Emissions and Dispersion Study
2010 – current, 3-State Study

16
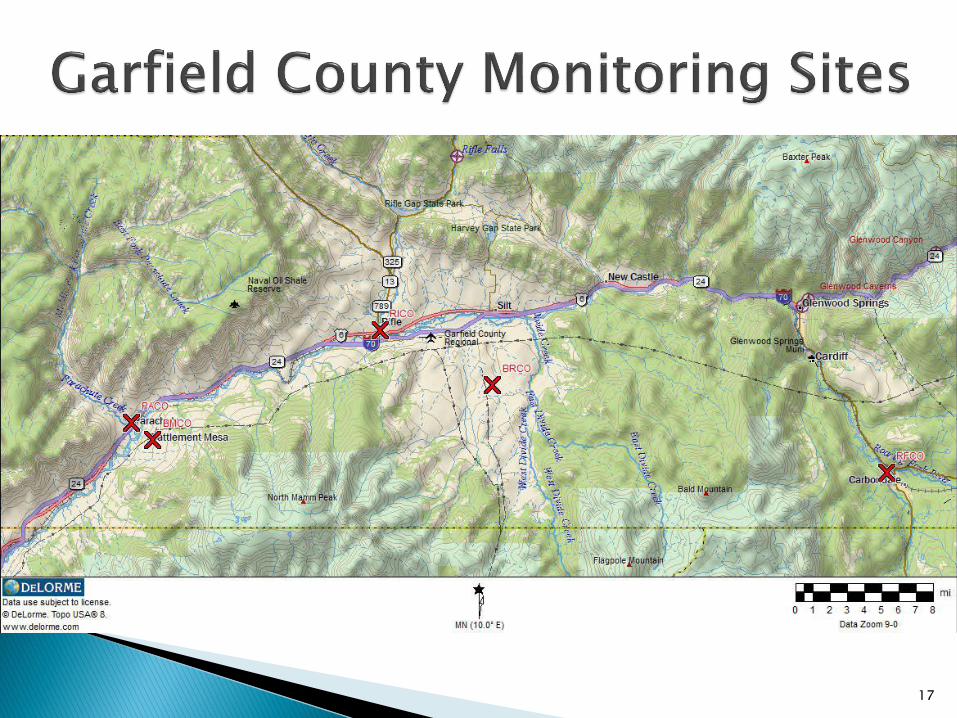
Led by Garfield County with assistance from CDPHE and Technical Advisory Committee
Funded by Garfield County and CDPHE
SNMOC’s and carbonyls, 24-hour samples◦ 4-5 sites each year
Purpose:◦ To evaluate air quality characteristics within Garfield County
related to oil and gas development◦ To continue to attempt to address concerns from local
citizens about air pollution in the area and potential health effects, primarily due to oil and gas development activities
◦ To develop long-term trends in different source areas◦ To gather information on ozone precursors
Some screening-level risk assessments completed
17

18

19
Conducted by Garfield County via a contract with Colorado State University
2013–2015
Desire to obtain more information related to emissions from oil and gas activities in Garfield County◦ Currently a limited amount of emissions data◦ Many citizens and local governments have expressed
concern about potential impacts to air quality and human health associated with increased drilling activity
$1.0 million Garfield County, $0.7 million from industry partners
Risk assessment not funded

20
Designed to:◦ Quantify emissions of chemical compounds
◦ characterize how these compounds are dispersed in the atmosphere
Focus on a variety of oil and gas activities◦ Drilling, fracking/flowback/completion
Specific activities/compounds for monitoring determined by technical advisory groups that include representatives from federal, state, local, industry

21
Multiple, independent approaches◦ Tracer method
◦ Dispersion modeling
Combination of time-integrated and continuous measurements to observe temporal and spatial variability
Mobile and fixed sampling platforms

22
VOC
Emissions from different processes
PTRMS
Real Time
CSU Mobile Lab
VOC Canisters
GC-MS/FID
Offline
On tripod mounts and on towers
TVOC
ppb RAE (PID)
~ 1min
Carbonyl
Cartridges
Offline
Acetylene
Tracer for plume identification
CRD
Real Time
Mobile 4WD Plume Tracker
Canisters
GC-FID
Offline
CH4
CRD
Real Time
Mobile 4WD Plume Tracker
Methane/Non-Methane
Hydrocarbon Analyzer (FID)
Mobile Lab
Met and other
15 m crank-up met. tower
Tripod deployable 3m met. stations
CO and NOx

23
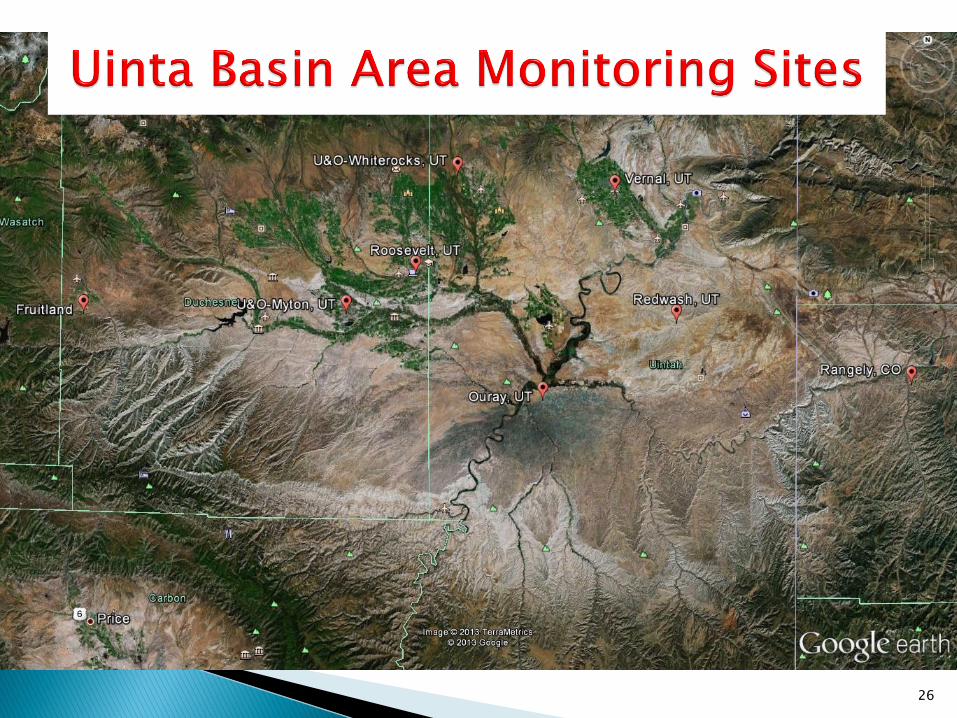
Collaborative effort involving Colorado, Utah, and Wyoming, as well as USFS, NPS, BLM, EPA
Goal is to reduce redundancy and increase consistency between agencies for air pollution analyses
Focus is on oil and gas development areas and ozone Includes Uinta Basin and Upper Green River Basin 3 major parts to the study:◦ Monitoring (3-years minimum)◦ Data warehouse (currently in development)◦ Modeling (base-case and future-year)
Goal is to have a readily updateable emissions inventory that will output model-ready files for use in state SIP activities as well as NEPA and EIS needs
Allows for cumulative effects analyses for oil and gas development

24

Issue: High wintertime ozone values Discovered in late 2009/early 2010 Similar to Upper Green River Basin in WY Primarily in UT, but some in CO
25
26

27
4th Maximum 8-hr. (ppm)
2006 2007 2008 2009 2010 2011 2012 2013 2014*
Lay Peak, CO 0.066 0.065 0.062
BLM-Meeker, CO 0.066 0.063 0.064 0.064 0.062
BLM-Rangely, CO 0.073 0.069 0.091 0.062
Roosevelt, UT 0.067 0.104 0.062
Fruitland, UT 0.065 0.070 0.069
U&O Myton, UT 0.111 0.108 0.067
NPS-Dinosaur NM, UT 0.068 0.063 0.066 0.063 0.068 0.090 0.075 0.114 0.064
Vernal, UT 0.064 0.102 0.061
Redwash, UT 0.067 0.098 0.100 0.067 0.112 0.061
Ouray, UT 0.067 0.117 0.116 0.070 0.133 0.079
U&O Whiterocks, UT 0.068 0.095
3-yr. Average of the 4th Max. 8-hr. (ppm)
2006-2008 2007-2009 2008-2010 2009-2011 2010-2012 2011-2013 2012-2014*
Lay Peak, CO 0.064
BLM-Meeker, CO 0.064 0.063 0.063
BLM-Rangely, CO 0.077 0.074
Roosevelt, UT 0.077
Fruitland, UT 0.068
U&O Myton, UT
NPS-Dinosaur NM, UT 0.065 0.064 0.065 0.073 0.077 0.093 0.084
Vernal, UT 0.075
Redwash, UT 0.088 0.088 0.093 0.080
Ouray, UT 0.100 0.101 0.106 0.094
U&O Whiterocks, UT
= Regulatory * Thru 7/31/2014
#.### = Exceeded level of NAAQS #.### = Violates NAAQS

28
0.050
0.060
0.070
0.080
0.090
0.100
0.110
0.120
0.130
0.140
0.150
20
06
20
07
20
08
20
09
20
10
20
11
20
12
20
13
20
14
*
Par
ts p
er m
illi
on
Year
8-Hour Ozone --- 4th MaximumUinta Basin
Rangely, CO
Roosevelt, UT
Myton, UT
Dinosaur NM, UT
Vernal, UT
Redwash, UT
Ouray, UT
Whiterocks, UT
Levelof 8-hr. NAAQS = 0.075 ppm
2006 to 2013 datafrom AQS,
*2014 thru 7/31DRAFT from AirNow
0.060
0.065
0.070
0.075
0.080
0.085
0.090
0.095
0.100
0.105
0.110
20
06
-20
08
20
07
-20
09
20
08
-20
10
20
09
-20
11
20
10
-20
12
20
11
-20
13
20
12
-20
14
*
Par
ts p
er m
illi
on
Year
8-Hour Ozone --- 3-year Avg. of 4th Max.Uinta Basin
Rangely, CO
Roosevelt, UT
Myton, UT
Dinosaur NM, UT
Vernal, UT
Redwash, UT
Ouray, UT
Whiterocks, UT
8-hr. NAAQS = 0.075 ppm
2006 to 2013 datafrom AQS,
*2014 thru 7/31DRAFT from AirNow

29
Involve State, Federal, Tribal, universities and industry
Ground, mobile vans and aircraft
Designed to:◦ Establish baseline ozone conditions
◦ Help develop more accurate emissions inventories
◦ capture atmospheric chemistry data under high ozone formation conditions
◦ determine ozone sensitivity to VOC, NOx, and the Basin’s unique winter photochemistry conditions
◦ develop a model to evaluate effectiveness of VOC and NOx mitigation

30
VOC readings were highest in gas producing areas and lower in oil producing and population centers
NOx readings were highest in population centers, lower in gas producing areas, and lowest in oil producing areas
Oil and gas operations are responsible for 98-99 percent of VOC emissions and 57-61 percent of NOx emissions
VOC controls may be more effective than NOxcontrols in reducing ozone levels
Nitrous acid and formaldehyde appear to be the biggest contributors to the creation of the chemically reactive radicals that drive ozone formation

31
High ozone formed when:◦ High pressure system to west
◦ Snow cover for increased albedo
◦ Strong inversion, low winds
◦ Mixing heights 300-400m
◦ Topographic isolation/recirculation of air mass
◦ Sunny days
◦ VOC and NOx sources/radicals
Build-up over a number of days
Flushes out with storm front

Rangely will has 3-years of “regulatory”
Violating UT sites will not have 3-years of “regulatory” data until end of 2014
Much of the land in UT is Tribal, so EPA has jurisdiction
UT has jurisdiction over non-tribal lands
UT is considering and implementing additional control measures
Number of potential policy options available
Preference is to coordinate as a whole basin, not piecemeal
32

33
Continue collaboration with Garfield County, including assistance on their emissions and dispersion study
Ensure that appropriate risk assessment analyses are performed for both North Front Range and Garfield emissions and dispersion studies are performed
Continue 3-State Study◦ 2011 and 2014 emissions inventories◦ Modeling for ozone◦ Monitoring – move Lay Peak site
Work with Utah and EPA as needed on Uinta Basin
