garden city, michigan census profile 2010 by data driven detroit
TRANSCRIPT

8/3/2019 Garden City, Michigan Census Profile 2010 by Data Driven Detroit
http://slidepdf.com/reader/full/garden-city-michigan-census-profile-2010-by-data-driven-detroit 1/16
Census Summary File 1
Profile
2631420
Garden City city
Table Name Page
2
33
3
4
5
5
5
6
7
77
8
8
9
9
10
10
1011
12
12
12
12
13
13
13
14
1415
15
15
NOTES 16
TENURE BY AGE OF HOUSEHOLDER
TENURE BY PRESENCE OF PEOPLE UNDER 18 YEARS (EXCLUDING HOUSEHOLDERS, SPOUSES, AND
UNMARRIED PARTNERS)
GROUP QUARTERS POPULATION BY GROUP QUARTERS TYPE
HISPANIC OR LATINO ORIGIN OF HOUSEHOLDER BY RACE OF HOUSEHOLDER
TOTAL POPULATION IN OCCUPIED HOUSING UNITS BY TENURE
AVERAGE HOUSEHOLD SIZE OF OCCUPIED HOUSING UNITS BY TENURE
TENURE BY RACE OF HOUSEHOLDER
TENURE BY HISPANIC OR LATINO ORIGIN OF HOUSEHOLDER
TENURE BY HOUSEHOLD SIZE
PRESENCE OF MULTIGENERATIONAL HOUSEHOLDS
HUSBAND-WIFE AND UNMARRIED-PARTNER HOUSEHOLDS BY SEX OF PARTNER BY PRESENCE OF
RELATED AND OWN CHILDREN UNDER 18 YEARSNONFAMILY HOUSEHOLDS BY SEX OF HOUSEHOLDER BY LIVING ALONE BY AGE OF HOUSEHOLDER
OCCUPANCY STATUS
TENURE
VACANCY STATUS
HOUSEHOLDS BY PRESENCE OF PEOPLE 75 YEARS AND OVER, HOUSEHOLD SIZE, AND HOUSEHOLD TYPE
HOUSEHOLD TYPE BY RELATIONSHIP
HOUSEHOLD TYPE BY RELATIONSHIP FOR THE POPULATION UNDER 18 YEARS
HOUSEHOLD TYPE FOR THE POPULATION UNDER 18 YEARS IN HOUSEHOLDS (EXCLUDING
HOUSEHOLDERS, SPOUSES, AND UNMARRIED PARTNERS)
FAMILY TYPE BY PRESENCE AND AGE OF OWN CHILDREN
FAMILY TYPE BY PRESENCE AND AGE OF RELATED CHILDREN
HOUSEHOLD TYPE
HOUSEHOLD TYPE BY HOUSEHOLD SIZE
HOUSEHOLD SIZE BY HOUSEHOLD TYPE BY PRESENCE OF OWN CHILDREN
HOUSEHOLDS BY PRESENCE OF PEOPLE UNDER 18 YEARS BY HOUSEHOLD TYPE BY AGE OF PEOPLE
UNDER 18 YEARS
HOUSEHOLDS BY PRESENCE OF PEOPLE 60 YEARS AND OVER, HOUSEHOLD SIZE, AND HOUSEHOLD TYPE
HOUSEHOLDS BY PRESENCE OF PEOPLE 65 YEARS AND OVER, HOUSEHOLD SIZE, AND HOUSEHOLD TYPE
Table of Contents
SEX BY AGE
MEDIAN AGE BY SEXHISPANIC OR LATINO, AND NOT HISPANIC OR LATINO BY RACE
ASIAN ALONE WITH ONE OR MORE ASIAN CATEGORIES FOR SELECTED GROUPS
HISPANIC OR LATINO BY SPECIFIC ORIGIN
ource: Data Driven Detroit analysis of Census 2000 and Census 2010 data from the U.S. Census Bureau
ataDrivenDetroit.org Created on 8/22/2011 [email protected] Page 1 o

8/3/2019 Garden City, Michigan Census Profile 2010 by Data Driven Detroit
http://slidepdf.com/reader/full/garden-city-michigan-census-profile-2010-by-data-driven-detroit 2/16
Census Summary File 1
Profile
2631420
Garden City city
Total population 30,047 27,692 -7.8%
Male 14,829 13,592 -8.3% 100.0% 100.0% 0.
Under 5 years 946 736 -22.2% 6.4% 5.4% -15
5 to 9 years 1,126 864 -23.3% 7.6% 6.4% -16
10 to 14 years 1,112 963 -13.4% 7.5% 7.1% -5
15 to 17 years 657 625 -4.9% 4.4% 4.6% 3
18 and 19 years 414 402 -2.9% 2.8% 3.0% 5
20 years 181 180 -0.6% 1.2% 1.3% 8
21 years 164 157 -4.3% 1.1% 1.2% 4
22 to 24 years 456 484 6.1% 3.1% 3.6% 15
25 to 29 years 971 821 -15.4% 6.5% 6.0% -7
30 to 34 years 1,276 920 -27.9% 8.6% 6.8% -2135 to 39 years 1,431 924 -35.4% 9.7% 6.8% -29
40 to 44 years 1,318 1,029 -21.9% 8.9% 7.6% -14
45 to 49 years 1,102 1,220 10.7% 7.4% 9.0% 20
50 to 54 years 823 1,097 33.3% 5.5% 8.1% 45
55 to 59 years 673 917 36.3% 4.5% 6.7% 48
60 and 61 years 197 274 39.1% 1.3% 2.0% 51
62 to 64 years 297 375 26.3% 2.0% 2.8% 37
65 and 66 years 189 239 26.5% 1.3% 1.8% 38
67 to 69 years 333 292 -12.3% 2.2% 2.1% -4
70 to 74 years 573 315 -45.0% 3.9% 2.3% -40
75 to 79 years 360 300 -16.7% 2.4% 2.2% -9
80 to 84 years 159 295 85.5% 1.1% 2.2% 102
85 years and over 71 163 129.6% 0.5% 1.2% 150
Female 15,218 14,100 -7.3% 100.0% 100.0% 0.
Under 5 years 929 742 -20.1% 6.1% 5.3% -13
5 to 9 years 1,096 801 -26.9% 7.2% 5.7% -21
10 to 14 years 1,064 893 -16.1% 7.0% 6.3% -9
15 to 17 years 619 567 -8.4% 4.1% 4.0% -1
18 and 19 years 343 383 11.7% 2.3% 2.7% 20
20 years 136 163 19.9% 0.9% 1.2% 2921 years 158 162 2.5% 1.0% 1.1% 10
22 to 24 years 429 454 5.8% 2.8% 3.2% 14
25 to 29 years 978 821 -16.1% 6.4% 5.8% -9
30 to 34 years 1,200 871 -27.4% 7.9% 6.2% -21
35 to 39 years 1,326 957 -27.8% 8.7% 6.8% -22
40 to 44 years 1,293 1,002 -22.5% 8.5% 7.1% -16
45 to 49 years 1,101 1,153 4.7% 7.2% 8.2% 1350 to 54 years 860 1,166 35.6% 5.7% 8.3% 46
%
ChanNumber Percent
SEX BY AGE
2000 2010 %
Change
2000 2010
ource: Data Driven Detroit analysis of Census 2000 and Census 2010 data from the U.S. Census Bureau
ataDrivenDetroit.org Created on 8/22/2011 [email protected] Page 2 o
8/3/2019 Garden City, Michigan Census Profile 2010 by Data Driven Detroit
http://slidepdf.com/reader/full/garden-city-michigan-census-profile-2010-by-data-driven-detroit 3/16
Census Summary File 1
Profile
2631420
Garden City city%
ChanNumber Percent
2000 2010 %
Change
2000 2010
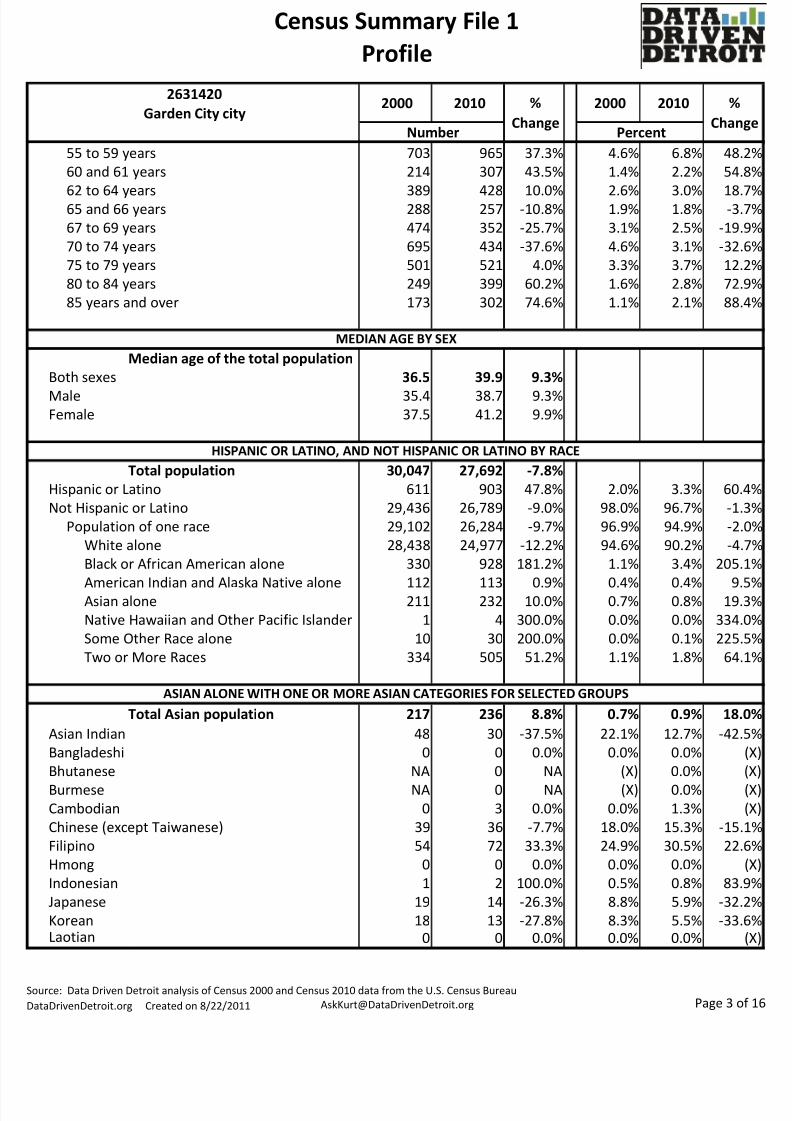
55 to 59 years 703 965 37.3% 4.6% 6.8% 48
60 and 61 years 214 307 43.5% 1.4% 2.2% 54
62 to 64 years 389 428 10.0% 2.6% 3.0% 1865 and 66 years 288 257 -10.8% 1.9% 1.8% -3
67 to 69 years 474 352 -25.7% 3.1% 2.5% -19
70 to 74 years 695 434 -37.6% 4.6% 3.1% -32
75 to 79 years 501 521 4.0% 3.3% 3.7% 12
80 to 84 years 249 399 60.2% 1.6% 2.8% 72
85 years and over 173 302 74.6% 1.1% 2.1% 88
Median age of the total population
Both sexes 36.5 39.9 9.3%
Male 35.4 38.7 9.3%Female 37.5 41.2 9.9%
Total population 30,047 27,692 -7.8%
Hispanic or Latino 611 903 47.8% 2.0% 3.3% 60
Not Hispanic or Latino 29,436 26,789 -9.0% 98.0% 96.7% -1
Population of one race 29,102 26,284 -9.7% 96.9% 94.9% -2
White alone 28,438 24,977 -12.2% 94.6% 90.2% -4
Black or African American alone 330 928 181.2% 1.1% 3.4% 205
American Indian and Alaska Native alone 112 113 0.9% 0.4% 0.4% 9Asian alone 211 232 10.0% 0.7% 0.8% 19
Native Hawaiian and Other Pacific Islander 1 4 300.0% 0.0% 0.0% 334
Some Other Race alone 10 30 200.0% 0.0% 0.1% 225
Two or More Races 334 505 51.2% 1.1% 1.8% 64
Total Asian population 217 236 8.8% 0.7% 0.9% 18.
Asian Indian 48 30 -37.5% 22.1% 12.7% -42
Bangladeshi 0 0 0.0% 0.0% 0.0%
Bhutanese NA 0 NA (X) 0.0%
Burmese NA 0 NA (X) 0.0%Cambodian 0 3 0.0% 0.0% 1.3%
Chinese (except Taiwanese) 39 36 -7.7% 18.0% 15.3% -15
Filipino 54 72 33.3% 24.9% 30.5% 22
Hmong 0 0 0.0% 0.0% 0.0%
Indonesian 1 2 100.0% 0.5% 0.8% 83
Japanese 19 14 -26.3% 8.8% 5.9% -32
Korean 18 13 -27.8% 8.3% 5.5% -33Laotian 0 0 0.0% 0.0% 0.0%
ASIAN ALONE WITH ONE OR MORE ASIAN CATEGORIES FOR SELECTED GROUPS
MEDIAN AGE BY SEX
HISPANIC OR LATINO, AND NOT HISPANIC OR LATINO BY RACE
ource: Data Driven Detroit analysis of Census 2000 and Census 2010 data from the U.S. Census Bureau
ataDrivenDetroit.org Created on 8/22/2011 [email protected] Page 3 o

8/3/2019 Garden City, Michigan Census Profile 2010 by Data Driven Detroit
http://slidepdf.com/reader/full/garden-city-michigan-census-profile-2010-by-data-driven-detroit 4/16
Census Summary File 1
Profile
2631420
Garden City city%
ChanNumber Percent
2000 2010 %
Change
2000 2010
Malaysian 0 0 0.0% 0.0% 0.0%
Nepalese NA 0 NA (X) 0.0%
Pakistani 10 16 60.0% 4.6% 6.8% 47Sri Lankan 1 0 -100.0% 0.5% 0.0% -100.
Taiwanese 4 0 -100.0% 1.8% 0.0% -100.
Thai 1 2 100.0% 0.5% 0.8% 83
Vietnamese 17 37 117.6% 7.8% 15.7% 100
All other Asians1
5 11 120.0% 2.3% 4.7% 102
Other Asian, specified 0 0 0.0% 0.0% 0.0%
Other Asian, not specified 5 11 120.0% 2.3% 4.7% 102
Not Hispanic or Latino 29,436 26,789 -9.0% 98.0% 96.7% -1
Hispanic or Latino 611 903 47.8% 2.0% 3.3% 60
Mexican 403 691 71.5% 66.0% 76.5% 16
Puerto Rican 55 71 29.1% 9.0% 7.9% -12
Cuban 10 14 40.0% 1.6% 1.6% -5
Dominican 0 5 0.0% 0.0% 0.6%
Central American (excluding Mexican) 5 19 280.0% 0.8% 2.1% 157
Costa Rican 0 0 0.0% 0.0% 0.0%
Guatemalan 0 5 0.0% 0.0% 0.6%
Honduran 4 2 -50.0% 0.7% 0.2% -66
Nicaraguan 0 2 0.0% 0.0% 0.2%
Panamanian 0 1 0.0% 0.0% 0.1%Salvadoran 1 9 800.0% 0.2% 1.0% 509
Other Central American 0 0 0.0% 0.0% 0.0%
South American 8 24 200.0% 1.3% 2.7% 103
Argentinean 4 6 50.0% 0.7% 0.7% 1
Bolivian 0 0 0.0% 0.0% 0.0%
Chilean 0 3 0.0% 0.0% 0.3%
Colombian 1 4 300.0% 0.2% 0.4% 170
Ecuadorian 3 6 100.0% 0.5% 0.7% 35
Paraguayan 0 0 0.0% 0.0% 0.0%
Peruvian 0 4 0.0% 0.0% 0.4%Uruguayan 0 1 0.0% 0.0% 0.1%
Venezuelan 0 0 0.0% 0.0% 0.0%
Other South American 0 0 0.0% 0.0% 0.0%
Other Hispanic or Latino 130 79 -39.2% 21.3% 8.7% -58
Spaniard 7 24 242.9% 1.1% 2.7% 132
Spanish 44 17 -61.4% 7.2% 1.9% -73
Spanish American 1 1 0.0% 0.2% 0.1% -32
All other Hispanic or Latino 78 37 -52.6% 12.8% 4.1% -67
HISPANIC OR LATINO BY SPECIFIC ORIGIN
ource: Data Driven Detroit analysis of Census 2000 and Census 2010 data from the U.S. Census Bureau
ataDrivenDetroit.org Created on 8/22/2011 [email protected] Page 4 o

8/3/2019 Garden City, Michigan Census Profile 2010 by Data Driven Detroit
http://slidepdf.com/reader/full/garden-city-michigan-census-profile-2010-by-data-driven-detroit 5/16
Census Summary File 1
Profile
2631420
Garden City city%
ChanNumber Percent
2000 2010 %
Change
2000 2010
Total households 11,479 10,894 -5.1% 100.0% 100.0% 0.
Family households 8,234 7,383 -10.3% 71.7% 67.8% -5Husband-wife family 6,426 5,246 -18.4% 56.0% 48.2% -14
Other family 1,808 2,137 18.2% 15.8% 19.6% 24
Male householder, no wife present 519 652 25.6% 4.5% 6.0% 32
Female householder, no husband present 1,289 1,485 15.2% 11.2% 13.6% 21
Nonfamily households 3,245 3,511 8.2% 28.3% 32.2% 14
Householder living alone 2,750 2,922 6.3% 24.0% 26.8% 12
Householder not living alone 495 589 19.0% 4.3% 5.4% 25
Total households 11,479 10,894 -5.1%
Family households 8,234 7,383 -10.3% 71.7% 67.8% -52-person household 3,228 2,949 -8.6% 39.2% 39.9% 1
3-person household 2,044 1,866 -8.7% 24.8% 25.3% 1
4-person household 1,820 1,502 -17.5% 22.1% 20.3% -8
5-person household 776 692 -10.8% 9.4% 9.4% -0
6-person household 256 259 1.2% 3.1% 3.5% 12
7-or-more-person household 110 115 4.5% 1.3% 1.6% 16
Nonfamily households 3,245 3,511 8.2% 28.3% 32.2% 14
1-person household 2,750 2,922 6.3% 84.7% 83.2% -1
2-person household 395 499 26.3% 12.2% 14.2% 16
3-person household 74 64 -13.5% 2.3% 1.8% -204-person household 16 17 6.3% 0.5% 0.5% -1
5-person household 5 4 -20.0% 0.2% 0.1% -26
6-person household 4 3 -25.0% 0.1% 0.1% -30
7-or-more-person household 1 2 100.0% 0.0% 0.1% 84
Total households 11,479 10,894 -5.1%
1-person household 2,750 2,922 6.3% 24.0% 26.8% 12
Male householder 1,187 1,310 10.4% 10.3% 12.0% 16
Female householder 1,563 1,612 3.1% 13.6% 14.8% 8
2-or-more-person household 8,729 7,972 -8.7% 76.0% 73.2% -3Family households 8,234 7,383 -10.3% 71.7% 67.8% -5
Husband-wife family 6,426 5,246 -18.4% 56.0% 48.2% -14
With own children under 18 years 2,902 2,096 -27.8% 25.3% 19.2% -23
No own children under 18 years 3,524 3,150 -10.6% 30.7% 28.9% -5
Other family 1,808 2,137 18.2% 15.8% 19.6% 24
Male householder, no wife present 519 652 25.6% 4.5% 6.0% 32
With own children under 18 years 239 287 20.1% 2.1% 2.6% 26No own children under 18 years 280 365 30.4% 2.4% 3.4% 37
HOUSEHOLD TYPE
HOUSEHOLD TYPE BY HOUSEHOLD SIZE
HOUSEHOLD SIZE BY HOUSEHOLD TYPE BY PRESENCE OF OWN CHILDREN
ource: Data Driven Detroit analysis of Census 2000 and Census 2010 data from the U.S. Census Bureau
ataDrivenDetroit.org Created on 8/22/2011 [email protected] Page 5 o

8/3/2019 Garden City, Michigan Census Profile 2010 by Data Driven Detroit
http://slidepdf.com/reader/full/garden-city-michigan-census-profile-2010-by-data-driven-detroit 6/16

8/3/2019 Garden City, Michigan Census Profile 2010 by Data Driven Detroit
http://slidepdf.com/reader/full/garden-city-michigan-census-profile-2010-by-data-driven-detroit 7/16
Census Summary File 1
Profile
2631420
Garden City city%
ChanNumber Percent
2000 2010 %
Change
2000 2010
Total households 11,479 10,894 -5.1%
Households with one or more people 60 yearsand over 3,659 3,856 5.4% 31.9% 35.4% 11
1-person household 1,287 1,438 11.7% 35.2% 37.3% 6
2-or-more-person household 2,372 2,418 1.9% 64.8% 62.7% -3
Family households 2,304 2,320 0.7% 63.0% 60.2% -4
Nonfamily households 68 98 44.1% 1.9% 2.5% 36
Households with no people 60 years and over 7,820 7,038 -10.0% 68.1% 64.6% -5
1-person household 1,463 1,484 1.4% 18.7% 21.1% 12
2-or-more-person household 6,357 5,554 -12.6% 81.3% 78.9% -2
Family households 5,930 5,063 -14.6% 75.8% 71.9% -5
Nonfamily households 427 491 15.0% 5.5% 7.0% 27
Total households 11,479 10,894 -5.1%
Households with one or more people 65 years
and over 2,993 2,974 -0.6% 26.1% 27.3% 4
1-person household 1,115 1,170 4.9% 37.3% 39.3% 5
2-or-more-person household 1,878 1,804 -3.9% 62.7% 60.7% -3
Family households 1,833 1,742 -5.0% 61.2% 58.6% -4
Nonfamily households 45 62 37.8% 1.5% 2.1% 38
Households with no people 65 years and over 8,486 7,920 -6.7% 73.9% 72.7% -11-person household 1,635 1,752 7.2% 19.3% 22.1% 14
2-or-more-person household 6,851 6,168 -10.0% 80.7% 77.9% -3
Family households 6,401 5,641 -11.9% 75.4% 71.2% -5
Nonfamily households 450 527 17.1% 5.3% 6.7% 25
Total households 11,479 10,894 -5.1%
Households with one or more people 75 years
and over 1,275 1,628 27.7% 11.1% 14.9% 34
1-person household 552 733 32.8% 43.3% 45.0% 42-or-more-person household 723 895 23.8% 56.7% 55.0% -3
Family households 706 870 23.2% 55.4% 53.4% -3
Nonfamily households 17 25 47.1% 1.3% 1.5% 15
Households with no people 75 years and over 10,204 9,266 -9.2% 88.9% 85.1% -4
1-person household 2,198 2,189 -0.4% 21.5% 20.1% -6
2-or-more-person household 8,006 7,077 -11.6% 78.5% 65.0% -17
Family households 7,528 6,513 -13.5% 73.8% 59.8% -19
Nonfamily households 478 564 18.0% 4.7% 5.2% 10
HOUSEHOLDS BY PRESENCE OF PEOPLE 60 YEARS AND OVER, HOUSEHOLD SIZE, AND HOUSEHOLD TYPE
HOUSEHOLDS BY PRESENCE OF PEOPLE 65 YEARS AND OVER, HOUSEHOLD SIZE, AND HOUSEHOLD TYPE
HOUSEHOLDS BY PRESENCE OF PEOPLE 75 YEARS AND OVER, HOUSEHOLD SIZE, AND HOUSEHOLD TYPE
ource: Data Driven Detroit analysis of Census 2000 and Census 2010 data from the U.S. Census Bureau
ataDrivenDetroit.org Created on 8/22/2011 [email protected] Page 7 o

8/3/2019 Garden City, Michigan Census Profile 2010 by Data Driven Detroit
http://slidepdf.com/reader/full/garden-city-michigan-census-profile-2010-by-data-driven-detroit 8/16
Census Summary File 1
Profile
2631420
Garden City city%
ChanNumber Percent
2000 2010 %
Change
2000 2010
Total population 30,047 27,692 -7.8%
In households 30,029 27,638 -8.0% 99.9% 99.8% -0In family households 26,146 23,405 -10.5% 87.1% 84.7% -2
Householder 8,234 7,383 -10.3% 27.4% 26.7% -2
Male 6,270 5,159 -17.7% 20.9% 18.7% -10
Female 1,964 2,224 13.2% 6.5% 8.0% 23
Spouse 6,426 5,246 -18.4% 21.4% 19.0% -11
Child2
10,214 9,197 -10.0% 34.0% 33.3% -2
Natural born or adopted 9,055 8,029 -11.3% 30.2% 29.1% -3
Biological child NA 7,882 NA (X) 28.5%
Adopted child NA 147 NA (X) 0.5%
Stepchild 600 509 -15.2% 2.0% 1.8% -7Grandchild 559 659 17.9% 1.9% 2.4% 28
Brother or sister 189 260 37.6% 0.6% 0.9% 49
Parent 189 189 0.0% 0.6% 0.7% 8
Parent-in-law NA 60 NA (X) 0.2%
Son-in-law or daughter-in-law NA 115 NA (X) 0.4%
Other relatives3
355 402 13.2% 1.2% 1.5% 23
Nonrelatives 539 728 35.1% 1.8% 2.6% 46
In nonfamily households 3,883 4,233 9.0% 12.9% 15.3% 18
Male householder 1,501 1,664 10.9% 5.0% 6.0% 20
Living alone 1,187 1,310 10.4% 4.0% 4.7% 19Not living alone 314 354 12.7% 1.0% 1.3% 22
Female householder 1,744 1,847 5.9% 5.8% 6.7% 15
Living alone 1,563 1,612 3.1% 5.2% 5.8% 12
Not living alone 181 235 29.8% 0.6% 0.9% 41
Nonrelatives 638 722 13.2% 2.1% 2.6% 23
In group quarters 18 54 200.0% 0.1% 0.2% 225
Institutionalized population 2 0 -100.0% 11.1% 0.0% -100.
Noninstitutionalized population 16 54 237.5% 88.9% 100.0% 12
Total population under 18 years 7,549 6,191 -18.0%
In households 7,549 6,191 -18.0% 100.0% 100.0% 0
Householder or spouse 0 0 0.0% 0.0% 0.0%
Related child 7,376 6,062 -17.8% 97.7% 97.9% 0
Own child 6,835 5,486 -19.7% 90.5% 88.6% -2
In husband-wife family 5,498 3,942 -28.3% 72.8% 63.7% -12
In other family 1,337 1,544 15.5% 17.7% 24.9% 40
HOUSEHOLD TYPE BY RELATIONSHIP
HOUSEHOLD TYPE BY RELATIONSHIP FOR THE POPULATION UNDER 18 YEARS
ource: Data Driven Detroit analysis of Census 2000 and Census 2010 data from the U.S. Census Bureau
ataDrivenDetroit.org Created on 8/22/2011 [email protected] Page 8 o

8/3/2019 Garden City, Michigan Census Profile 2010 by Data Driven Detroit
http://slidepdf.com/reader/full/garden-city-michigan-census-profile-2010-by-data-driven-detroit 9/16
Census Summary File 1
Profile
2631420
Garden City city%
ChanNumber Percent
2000 2010 %
Change
2000 2010
In male householder, no wife present
family 363 444 22.3% 4.8% 7.2% 49
In female householder, no husbandpresent family 974 1,100 12.9% 12.9% 17.8% 37
Other relatives 541 576 6.5% 7.2% 9.3% 29
Grandchild 449 501 11.6% 5.9% 8.1% 36
Other relatives 92 75 -18.5% 1.2% 1.2% -0
Nonrelatives 173 129 -25.4% 2.3% 2.1% -9
In group quarters 0 0 0.0% 0.0% 0.0%
Institutionalized population 0 0 0.0% (X) (X)
Noninstitutionalized population 0 0 0.0% (X) (X)
Total population under 18 years in
households (excl. householders,
spouses, & unmarried partners) NA 6,190 NA
In family households NA 6,138 NA
In husband-wife family NA 4,262 NA
In other family NA 1,876 NA
In male householder, no wife present family NA 541 NA
In female householder, no husband present
family NA 1,335 NAIn nonfamily households NA 52 NA
Total families 8,234 7,383 -10.3% 100.0% 100.0% 0.
Husband-wife family 6,426 5,246 -18.4% 78.0% 71.1% -9
With own children under 18 years 2,902 2,096 -27.8% 35.2% 28.4% -19
Under 6 years only 637 415 -34.9% 7.7% 5.6% -27
Under 6 years and 6 to 17 years 657 413 -37.1% 8.0% 5.6% -29
6 to 17 years only 1,608 1,268 -21.1% 19.5% 17.2% -12
No own children under 18 years 3,524 3,150 -10.6% 42.8% 42.7% -0Other family 1,808 2,137 18.2% 22.0% 28.9% 31
Male householder, no wife present 519 652 25.6% 6.3% 8.8% 40
With own children under 18 years 239 287 20.1% 2.9% 3.9% 33
Under 6 years only 58 73 25.9% 0.7% 1.0% 40
Under 6 years and 6 to 17 years 18 34 88.9% 0.2% 0.5% 110
6 to 17 years only 163 180 10.4% 2.0% 2.4% 23
No own children under 18 years 280 365 30.4% 3.4% 4.9% 45Female householder, no husband present 1,289 1,485 15.2% 15.7% 20.1% 28
FAMILY TYPE BY PRESENCE AND AGE OF OWN CHILDREN
HOUSEHOLD TYPE FOR THE POPULATION UNDER 18 YEARS IN HOUSEHOLDS (EXCLUDING HOUSEHOLDERS, SPOUSES, ANUNMARRIED PARTNERS)
ource: Data Driven Detroit analysis of Census 2000 and Census 2010 data from the U.S. Census Bureau
ataDrivenDetroit.org Created on 8/22/2011 [email protected] Page 9 o
8/3/2019 Garden City, Michigan Census Profile 2010 by Data Driven Detroit
http://slidepdf.com/reader/full/garden-city-michigan-census-profile-2010-by-data-driven-detroit 10/16
Census Summary File 1
Profile
2631420
Garden City city%
ChanNumber Percent
2000 2010 %
Change
2000 2010
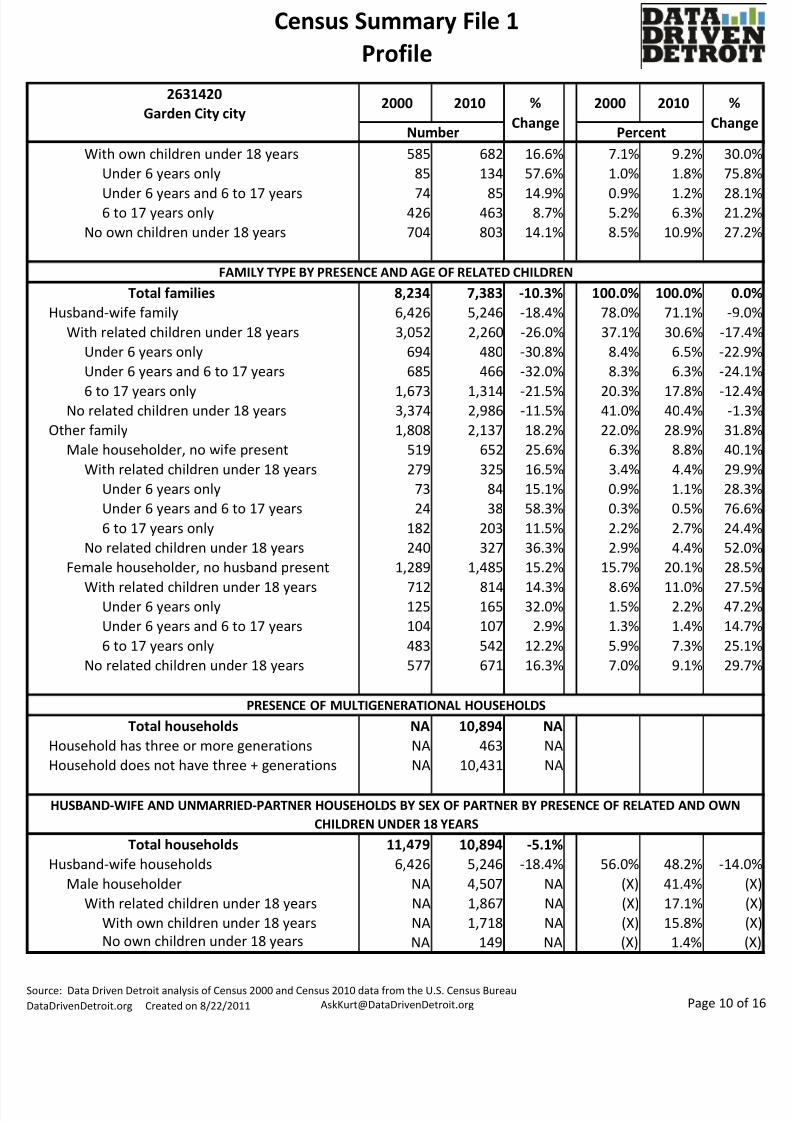
With own children under 18 years 585 682 16.6% 7.1% 9.2% 30
Under 6 years only 85 134 57.6% 1.0% 1.8% 75
Under 6 years and 6 to 17 years 74 85 14.9% 0.9% 1.2% 286 to 17 years only 426 463 8.7% 5.2% 6.3% 21
No own children under 18 years 704 803 14.1% 8.5% 10.9% 27
Total families 8,234 7,383 -10.3% 100.0% 100.0% 0.
Husband-wife family 6,426 5,246 -18.4% 78.0% 71.1% -9
With related children under 18 years 3,052 2,260 -26.0% 37.1% 30.6% -17
Under 6 years only 694 480 -30.8% 8.4% 6.5% -22
Under 6 years and 6 to 17 years 685 466 -32.0% 8.3% 6.3% -24
6 to 17 years only 1,673 1,314 -21.5% 20.3% 17.8% -12No related children under 18 years 3,374 2,986 -11.5% 41.0% 40.4% -1
Other family 1,808 2,137 18.2% 22.0% 28.9% 31
Male householder, no wife present 519 652 25.6% 6.3% 8.8% 40
With related children under 18 years 279 325 16.5% 3.4% 4.4% 29
Under 6 years only 73 84 15.1% 0.9% 1.1% 28
Under 6 years and 6 to 17 years 24 38 58.3% 0.3% 0.5% 76
6 to 17 years only 182 203 11.5% 2.2% 2.7% 24
No related children under 18 years 240 327 36.3% 2.9% 4.4% 52
Female householder, no husband present 1,289 1,485 15.2% 15.7% 20.1% 28
With related children under 18 years 712 814 14.3% 8.6% 11.0% 27Under 6 years only 125 165 32.0% 1.5% 2.2% 47
Under 6 years and 6 to 17 years 104 107 2.9% 1.3% 1.4% 14
6 to 17 years only 483 542 12.2% 5.9% 7.3% 25
No related children under 18 years 577 671 16.3% 7.0% 9.1% 29
Total households NA 10,894 NA
Household has three or more generations NA 463 NA
Household does not have three + generations NA 10,431 NA
Total households 11,479 10,894 -5.1%
Husband-wife households 6,426 5,246 -18.4% 56.0% 48.2% -14
Male householder NA 4,507 NA (X) 41.4%
With related children under 18 years NA 1,867 NA (X) 17.1%
With own children under 18 years NA 1,718 NA (X) 15.8%
No own children under 18 years NA 149 NA (X) 1.4%
FAMILY TYPE BY PRESENCE AND AGE OF RELATED CHILDREN
PRESENCE OF MULTIGENERATIONAL HOUSEHOLDS
HUSBAND-WIFE AND UNMARRIED-PARTNER HOUSEHOLDS BY SEX OF PARTNER BY PRESENCE OF RELATED AND OWN
CHILDREN UNDER 18 YEARS
ource: Data Driven Detroit analysis of Census 2000 and Census 2010 data from the U.S. Census Bureau
ataDrivenDetroit.org Created on 8/22/2011 [email protected] Page 10 o
8/3/2019 Garden City, Michigan Census Profile 2010 by Data Driven Detroit
http://slidepdf.com/reader/full/garden-city-michigan-census-profile-2010-by-data-driven-detroit 11/16
Census Summary File 1
Profile
2631420
Garden City city%
ChanNumber Percent
2000 2010 %
Change
2000 2010
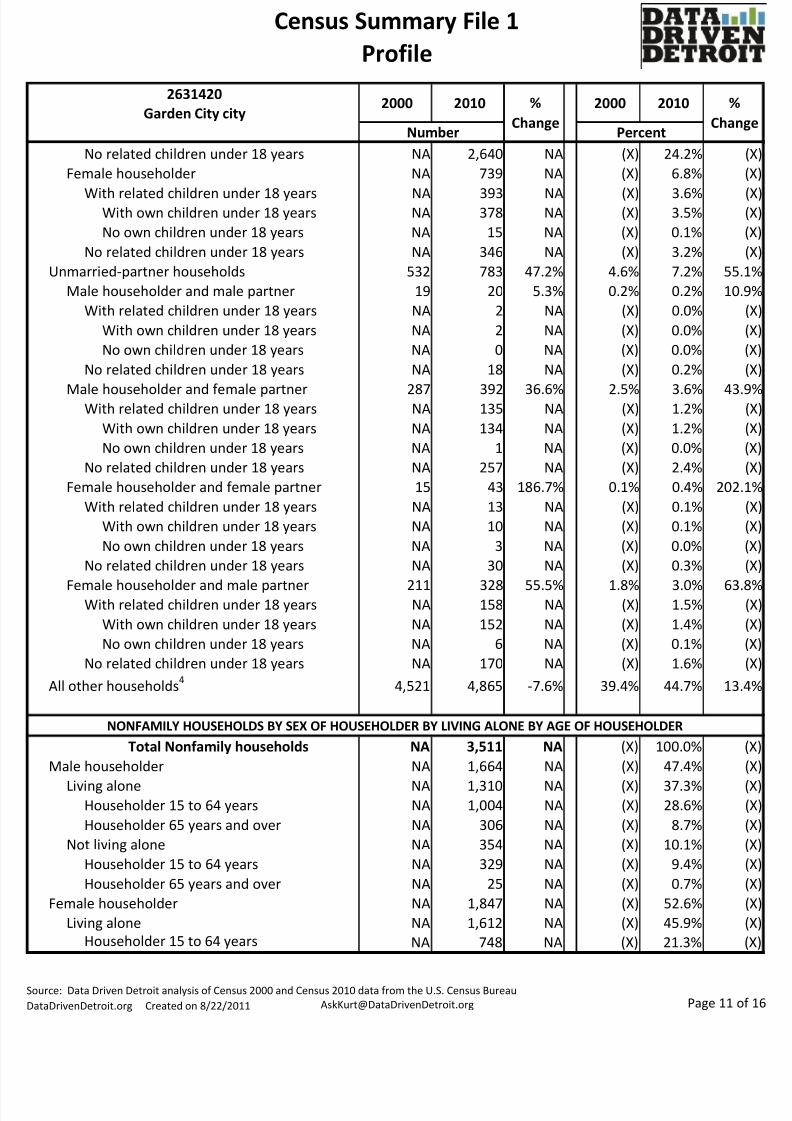
No related children under 18 years NA 2,640 NA (X) 24.2%
Female householder NA 739 NA (X) 6.8%
With related children under 18 years NA 393 NA (X) 3.6%With own children under 18 years NA 378 NA (X) 3.5%
No own children under 18 years NA 15 NA (X) 0.1%
No related children under 18 years NA 346 NA (X) 3.2%
Unmarried-partner households 532 783 47.2% 4.6% 7.2% 55
Male householder and male partner 19 20 5.3% 0.2% 0.2% 10
With related children under 18 years NA 2 NA (X) 0.0%
With own children under 18 years NA 2 NA (X) 0.0%
No own children under 18 years NA 0 NA (X) 0.0%
No related children under 18 years NA 18 NA (X) 0.2%
Male householder and female partner 287 392 36.6% 2.5% 3.6% 43With related children under 18 years NA 135 NA (X) 1.2%
With own children under 18 years NA 134 NA (X) 1.2%
No own children under 18 years NA 1 NA (X) 0.0%
No related children under 18 years NA 257 NA (X) 2.4%
Female householder and female partner 15 43 186.7% 0.1% 0.4% 202
With related children under 18 years NA 13 NA (X) 0.1%
With own children under 18 years NA 10 NA (X) 0.1%
No own children under 18 years NA 3 NA (X) 0.0%
No related children under 18 years NA 30 NA (X) 0.3%
Female householder and male partner 211 328 55.5% 1.8% 3.0% 63With related children under 18 years NA 158 NA (X) 1.5%
With own children under 18 years NA 152 NA (X) 1.4%
No own children under 18 years NA 6 NA (X) 0.1%
No related children under 18 years NA 170 NA (X) 1.6%
All other households4
4,521 4,865 -7.6% 39.4% 44.7% 13
Total Nonfamily households NA 3,511 NA (X) 100.0%
Male householder NA 1,664 NA (X) 47.4%
Living alone NA 1,310 NA (X) 37.3%Householder 15 to 64 years NA 1,004 NA (X) 28.6%
Householder 65 years and over NA 306 NA (X) 8.7%
Not living alone NA 354 NA (X) 10.1%
Householder 15 to 64 years NA 329 NA (X) 9.4%
Householder 65 years and over NA 25 NA (X) 0.7%
Female householder NA 1,847 NA (X) 52.6%
Living alone NA 1,612 NA (X) 45.9%
Householder 15 to 64 years NA 748 NA (X) 21.3%
NONFAMILY HOUSEHOLDS BY SEX OF HOUSEHOLDER BY LIVING ALONE BY AGE OF HOUSEHOLDER
ource: Data Driven Detroit analysis of Census 2000 and Census 2010 data from the U.S. Census Bureau
ataDrivenDetroit.org Created on 8/22/2011 [email protected] Page 11 o

8/3/2019 Garden City, Michigan Census Profile 2010 by Data Driven Detroit
http://slidepdf.com/reader/full/garden-city-michigan-census-profile-2010-by-data-driven-detroit 12/16
Census Summary File 1
Profile
2631420
Garden City city%
ChanNumber Percent
2000 2010 %
Change
2000 2010
Householder 65 years and over NA 864 NA (X) 24.6%
Not living alone NA 235 NA (X) 6.7%
Householder 15 to 64 years NA 211 NA (X) 6.0%Householder 65 years and over NA 24 NA (X) 0.7%
Total housing units 11,719 11,616 -0.9%
Occupied 11,479 10,894 -5.1% 98.0% 93.8% -4
Vacant 240 722 200.8% 2.0% 6.2% 203
Total occupied housing units 11,479 10,894 -5.1%
Owner occupied 9,898 8,994 -9.1% 86.2% 82.6% -4Owned with a mortgage or a loan NA 6,485 NA (X) 72.1%
Owned free and clear NA 2,509 NA (X) 27.9%
Renter occupied 1,581 1,900 20.2% 13.8% 17.4% 26
Total vacant housing units 240 722 200.8% 100.0% 100.0% 0.
For rent 59 140 137.3% 24.6% 19.4% -21
For sale only 50 188 276.0% 20.8% 26.0% 25
Rented or sold, not occupied5
36 52 44.4% 15.0% 7.2% -52
For seasonal, recreational, or occasional use 18 26 44.4% 7.5% 3.6% -52For migrant workers 0 0 0.0% 0.0% 0.0%
Other vacant 77 316 310.4% 32.1% 43.8% 36
Total occupied housing units 11,479 10,894 -5.1% 100.0% 100.0% 0.
Not Hispanic or Latino householder 11,292 10,646 -5.7% 98.4% 97.7% -0
Householder who is White alone 10,966 10,065 -8.2% 95.5% 92.4% -3
Householder who is Black or African
American alone 108 354 227.8% 0.9% 3.2% 245
Householder who is American Indian andAlaska Native alone 47 45 -4.3% 0.4% 0.4% 0
Householder who is Asian alone 68 68 0.0% 0.6% 0.6% 5
Householder who is Native Hawaiian and
Other Pacific Islander alone 1 1 0.0% 0.0% 0.0% 5
Householder who is Some Other Race alone 6 2 -66.7% 0.1% 0.0% -64
Householder who is Two or More Races 96 111 15.6% 0.8% 1.0% 21
Hispanic or Latino householder 187 248 32.6% 1.6% 2.3% 39
Householder who is White alone 146 187 28.1% 1.3% 1.7% 35
TENURE
VACANCY STATUS
HISPANIC OR LATINO ORIGIN OF HOUSEHOLDER BY RACE OF HOUSEHOLDER
OCCUPANCY STATUS
ource: Data Driven Detroit analysis of Census 2000 and Census 2010 data from the U.S. Census Bureau
ataDrivenDetroit.org Created on 8/22/2011 [email protected] Page 12 o
8/3/2019 Garden City, Michigan Census Profile 2010 by Data Driven Detroit
http://slidepdf.com/reader/full/garden-city-michigan-census-profile-2010-by-data-driven-detroit 13/16
Census Summary File 1
Profile
2631420
Garden City city%
ChanNumber Percent
2000 2010 %
Change
2000 2010
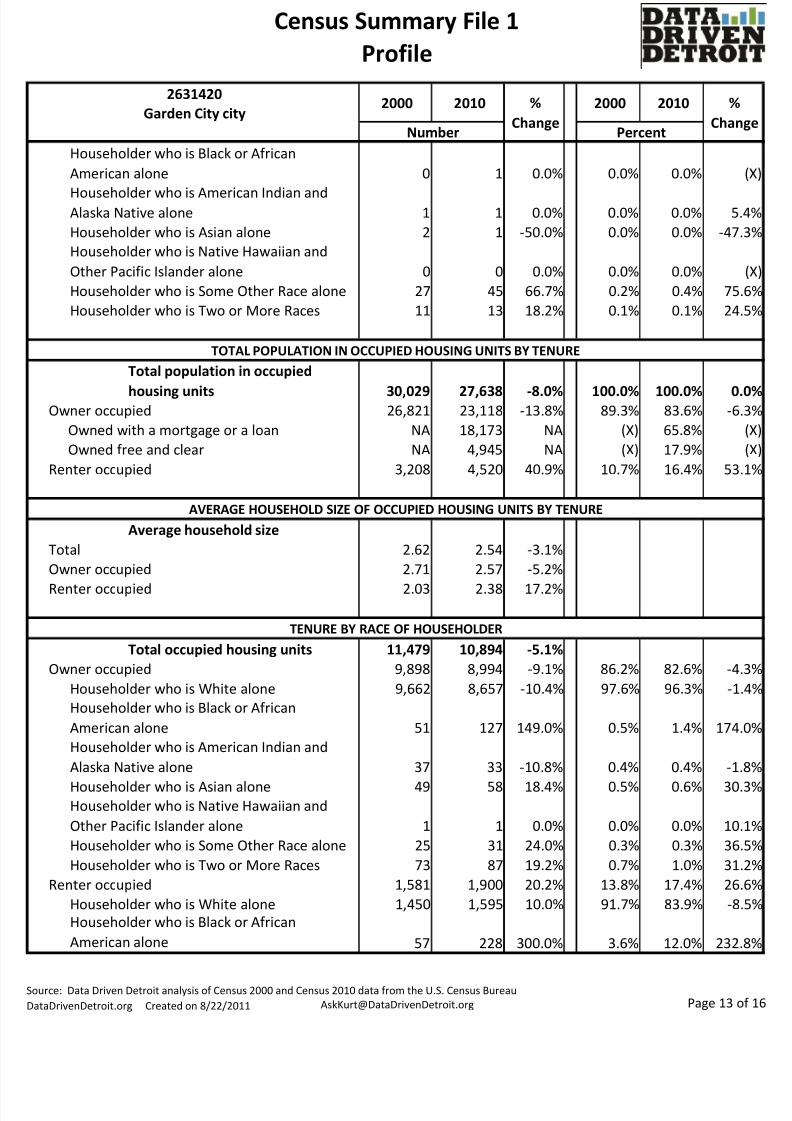
Householder who is Black or African
American alone 0 1 0.0% 0.0% 0.0%
Householder who is American Indian andAlaska Native alone 1 1 0.0% 0.0% 0.0% 5
Householder who is Asian alone 2 1 -50.0% 0.0% 0.0% -47
Householder who is Native Hawaiian and
Other Pacific Islander alone 0 0 0.0% 0.0% 0.0%
Householder who is Some Other Race alone 27 45 66.7% 0.2% 0.4% 75
Householder who is Two or More Races 11 13 18.2% 0.1% 0.1% 24
Total population in occupied
housing units 30,029 27,638 -8.0% 100.0% 100.0% 0.Owner occupied 26,821 23,118 -13.8% 89.3% 83.6% -6
Owned with a mortgage or a loan NA 18,173 NA (X) 65.8%
Owned free and clear NA 4,945 NA (X) 17.9%
Renter occupied 3,208 4,520 40.9% 10.7% 16.4% 53
Average household size
Total 2.62 2.54 -3.1%
Owner occupied 2.71 2.57 -5.2%
Renter occupied 2.03 2.38 17.2%
Total occupied housing units 11,479 10,894 -5.1%
Owner occupied 9,898 8,994 -9.1% 86.2% 82.6% -4
Householder who is White alone 9,662 8,657 -10.4% 97.6% 96.3% -1
Householder who is Black or African
American alone 51 127 149.0% 0.5% 1.4% 174
Householder who is American Indian and
Alaska Native alone 37 33 -10.8% 0.4% 0.4% -1
Householder who is Asian alone 49 58 18.4% 0.5% 0.6% 30Householder who is Native Hawaiian and
Other Pacific Islander alone 1 1 0.0% 0.0% 0.0% 10
Householder who is Some Other Race alone 25 31 24.0% 0.3% 0.3% 36
Householder who is Two or More Races 73 87 19.2% 0.7% 1.0% 31
Renter occupied 1,581 1,900 20.2% 13.8% 17.4% 26
Householder who is White alone 1,450 1,595 10.0% 91.7% 83.9% -8
Householder who is Black or African
American alone 57 228 300.0% 3.6% 12.0% 232
TOTAL POPULATION IN OCCUPIED HOUSING UNITS BY TENURE
AVERAGE HOUSEHOLD SIZE OF OCCUPIED HOUSING UNITS BY TENURE
TENURE BY RACE OF HOUSEHOLDER
ource: Data Driven Detroit analysis of Census 2000 and Census 2010 data from the U.S. Census Bureau
ataDrivenDetroit.org Created on 8/22/2011 [email protected] Page 13 o

8/3/2019 Garden City, Michigan Census Profile 2010 by Data Driven Detroit
http://slidepdf.com/reader/full/garden-city-michigan-census-profile-2010-by-data-driven-detroit 14/16
Census Summary File 1
Profile
2631420
Garden City city%
ChanNumber Percent
2000 2010 %
Change
2000 2010
Householder who is American Indian and
Alaska Native alone 11 13 18.2% 0.7% 0.7% -1
Householder who is Asian alone 21 11 -47.6% 1.3% 0.6% -56Householder who is Native Hawaiian and
Other Pacific Islander alone 0 0 0.0% 0.0% 0.0%
Householder who is Some Other Race alone 8 16 100.0% 0.5% 0.8% 66
Householder who is Two or More Races 34 37 8.8% 2.2% 1.9% -9
Total occupied housing units NA 10,894 NA
Owner occupied NA 8,994 NA (X) 82.6%
Not Hispanic or Latino householder NA 8,803 NA (X) 97.9%
Hispanic or Latino householder NA 191 NA (X) 2.1%Renter occupied NA 1,900 NA (X) 17.4%
Not Hispanic or Latino householder NA 1,843 NA (X) 97.0%
Hispanic or Latino householder NA 57 NA (X) 3.0%
Total occupied housing units 11,479 10,894 -5.1%
Owner occupied 9,898 8,994 -9.1% 86.2% 82.6% -4
1-person household 2,002 2,198 9.8% 20.2% 24.4% 20
2-person household 3,220 2,981 -7.4% 32.5% 33.1% 1
3-person household 1,910 1,647 -13.8% 19.3% 18.3% -54-person household 1,704 1,298 -23.8% 17.2% 14.4% -16
5-person household 723 564 -22.0% 7.3% 6.3% -14
6-person household 241 209 -13.3% 2.4% 2.3% -4
7-or-more-person household 98 97 -1.0% 1.0% 1.1% 8
Renter occupied 1,581 1,900 20.2% 13.8% 17.4% 26
1-person household 748 724 -3.2% 47.3% 38.1% -19
2-person household 403 467 15.9% 25.5% 24.6% -3
3-person household 208 283 36.1% 13.2% 14.9% 13
4-person household 132 221 67.4% 8.3% 11.6% 39
5-person household 58 132 127.6% 3.7% 6.9% 896-person household 19 53 178.9% 1.2% 2.8% 132
7-or-more-person household 13 20 53.8% 0.8% 1.1% 28
Total occupied housing units 11,479 10,894 -5.1%
Owner occupied 9,898 8,994 -9.1% 86.2% 82.6% -4
Householder 15 to 24 years 126 94 -25.4% 1.3% 1.0% -17
Householder 25 to 34 years 1,544 1,042 -32.5% 15.6% 11.6% -25
TENURE BY HISPANIC OR LATINO ORIGIN OF HOUSEHOLDER
TENURE BY HOUSEHOLD SIZE
TENURE BY AGE OF HOUSEHOLDER
ource: Data Driven Detroit analysis of Census 2000 and Census 2010 data from the U.S. Census Bureau
ataDrivenDetroit.org Created on 8/22/2011 [email protected] Page 14 o

8/3/2019 Garden City, Michigan Census Profile 2010 by Data Driven Detroit
http://slidepdf.com/reader/full/garden-city-michigan-census-profile-2010-by-data-driven-detroit 15/16
Census Summary File 1
Profile
2631420
Garden City city%
ChanNumber Percent
2000 2010 %
Change
2000 2010
Householder 35 to 44 years 2,464 1,562 -36.6% 24.9% 17.4% -30
Householder 45 to 54 years 1,953 2,203 12.8% 19.7% 24.5% 24
Householder 55 to 64 years 1,361 1,672 22.9% 13.8% 18.6% 35Householder 65 to 74 years 1,534 1,103 -28.1% 15.5% 12.3% -20
Householder 75 to 84 years 797 1,006 26.2% 8.1% 11.2% 38
Householder 85 years and over 119 312 162.2% 1.2% 3.5% 188
Renter occupied 1,581 1,900 20.2% 13.8% 17.4% 26
Householder 15 to 24 years 144 129 -10.4% 9.1% 6.8% -25
Householder 25 to 34 years 394 389 -1.3% 24.9% 20.5% -17
Householder 35 to 44 years 376 427 13.6% 23.8% 22.5% -5
Householder 45 to 54 years 229 395 72.5% 14.5% 20.8% 43
Householder 55 to 64 years 116 232 100.0% 7.3% 12.2% 66
Householder 65 to 74 years 128 155 21.1% 8.1% 8.2% 0Householder 75 to 84 years 136 104 -23.5% 8.6% 5.5% -36
Householder 85 years and over 58 69 19.0% 3.7% 3.6% -1
Total occupied housing units NA 10,894 NA
Owner-occupied NA 8,994 NA (X) 82.6%
With children under 18 years NA 2,752 NA (X) 30.6%
No children under 18 years NA 6,242 NA (X) 69.4%
Renter-occupied NA 1,900 NA (X) 17.4%
With children under 18 years NA 700 NA (X) 36.8%No children under 18 years NA 1,200 NA (X) 63.2%
Total population in group quarters 18 54 200.0% 100.0% 100.0% 0.
Institutionalized population 2 0 -100.0% 11.1% 0.0% -100.
Correctional facilities6
1 0 -100.0% 5.6% 0.0% -100.
Correctional facilities for adults NA 0 NA (X) 0.0%
Juvenile facilities NA 0 NA (X) 0.0%
Nursing facilities/Skilled-nursing facilities 0 0 0.0% 0.0% 0.0%
Other institutional facilities 1 0 -100.0% 5.6% 0.0% -100.Noninstitutionalized population 16 54 237.5% 88.9% 100.0% 12
College/University student housing 0 0 0.0% 0.0% 0.0%
Military quarters 0 0 0.0% 0.0% 0.0%
Other noninstitutional facilities 16 54 237.5% 88.9% 100.0% 12
TENURE BY PRESENCE OF PEOPLE UNDER 18 YEARS (EXCLUDING HOUSEHOLDERS, SPOUSES, AND UNMARRIED PARTNER
GROUP QUARTERS POPULATION BY GROUP QUARTERS TYPE
ource: Data Driven Detroit analysis of Census 2000 and Census 2010 data from the U.S. Census Bureau
ataDrivenDetroit.org Created on 8/22/2011 [email protected] Page 15 o

8/3/2019 Garden City, Michigan Census Profile 2010 by Data Driven Detroit
http://slidepdf.com/reader/full/garden-city-michigan-census-profile-2010-by-data-driven-detroit 16/16
Census Summary File 1
Profile
2631420
Garden City city%
ChanNumber Percent
2000 2010 %
Change
2000 2010
Notes
"NA" indicates the count is not available for 2000
"(X)" indicates the percent cannot be calculated
1"All other Asians" follows the 2000 category
2"Child" follows the 2010 category
3"Other relatives" follows the 2000 category
4"All other Households" follows the 2000 category
5"Rented or sold, not occupied" follows the 2000 category
6"Correctional facilities" follows the 2000 category