gao-15-329 accessible version, navy force … · goals of ensuring sea control, projecting u.s....
TRANSCRIPT

Accessible Version
NAVY FORCE STRUCTURE
Sustainable Plan and Comprehensive Assessment Needed to Mitigate Long-Term Risks to Ships Assigned to Overseas Homeports
Report to Congressional Committees
May 2015
GAO-15-329
United States Government Accountability Office
United States Government Accountability Office
Highlights of GAO-15-329, a report to congressional committees
May 2015
NAVY FORCE STRUCTURE Sustainable Plan and Comprehensive Assessment Needed to Mitigate Long-Term Risks to Ships Assigned to Overseas Homeports
Why GAO Did This Study Forward presence supports the Navy’s goals of ensuring sea control, projecting U.S. power, and providing maritime security. To meet these goals and combatant commanders’ growing demand for forward presence, the Navy has doubled the number of ships assigned to overseas homeports since 2006, to a total of 40 by the end of 2015, and plans to increase this number further in the future.
House Report 113-446 included a provision that GAO analyze the Navy’s decision-making process for determining when to homeport ships overseas and identify the relative costs and benefits of various approaches. This report addresses (1) the operational benefits, costs, and readiness effects associated with assigning ships to U.S. or overseas homeports and (2) the extent to which the Navy has identified and mitigated risks from homeporting ships overseas. GAO analyzed Navy policies and 5 to 10 years of historical cost, operational tempo, and readiness data and interviewed fleet officials.
What GAO Recommends GAO recommends that the Navy develop and implement a sustainable operational schedule for all ships homeported overseas and conduct a comprehensive assessment of the risks associated with overseas homeporting. The Department of Defense concurred with GAO’s recommendations.
What GAO Found Homeporting ships overseas considerably increases the forward presence— U.S. naval forces in overseas operating areas—that the Navy’s existing fleet provides and has other near-term benefits such as rapid crisis response, but incurs higher operations and support costs when compared to U.S.-homeported ships. GAO found that casualty reports—incidents of degraded or out-of-service equipment—have doubled over the past 5 years and that the material condition of overseas-homeported ships has decreased slightly faster than that of U.S.-homeported ships (see figure below). In addition, the Navy has spent hundreds of millions of dollars on overseas infrastructure and base operating costs since 2009, while moving large numbers of sailors, dependents, and ship repair work overseas. GAO also found that the high pace of operations the Navy uses for overseas-homeported ships limits dedicated training and maintenance periods, which has resulted in difficulty keeping crews fully trained and ships maintained.
Selected Operational Time, Costs, and Material Readiness Comparisons between Ships Homeported Overseas and in the United States
The Navy has not identified or mitigated the risks its increasing reliance on overseas homeporting poses to its force over the long term. GAO found that some ships homeported overseas have had consistently deferred maintenance that has resulted in long-term degraded material condition and increased maintenance costs, and could shorten a ship’s service life. The Navy began implementing a revised operational schedule in 2014 for U.S.-based ships that lengthens time between deployments, citing the need for a sustainable schedule. However, the Navy has not determined how—or whether—it will apply a more sustainable schedule to all ships homeported overseas. Although the Navy’s decision process for moving individual ships overseas identifies actions and resources needed, it does not assess risks that such moves pose to costs, readiness, or expected service lives of ships that the Navy can expect based on its historical experience operating ships from overseas homeports. Without a sustainable operational schedule and a comprehensive risk assessment on overseas homeporting, the Navy lacks information needed to make informed homeporting decisions and it will be difficult for the Navy to identify and mitigate the risks its homeporting decisions pose to its budget, readiness, and ship service lives over the long term.
View GAO-15-329. For more information, contact John Pendleton at (202) 512-3489 or [email protected].

Letter 1
Page i GAO-15-329 Navy Force Structure
Background 5 Homeporting Ships Overseas Has Operational Benefits but
Results in Additional Costs and Adverse Effects on Readiness and Ship Condition 8
The Navy Has Not Identified Costs and Risks Associated with the Increased Operational Tempo for Ships Homeported Overseas 30
Conclusions 40 Recommendations for Executive Action 41 Agency Comments and Our Evaluation 41
Appendix I: The Navy’s Use of Rotational Crewing 44
Appendix II: Overview of Navy Ships Used in Our Comparative Analyses 46
Appendix III: Scope and Methodology 48
Appendix IV: Overview of Navy’s Homeporting Process 55
Appendix V: Statistical Analysis of Deployed Days Under Way and Costs for Overseas- and U.S.-Homeported Ships 58
Appendix VI: Statistical Analysis of Average Daily Casualty Reports among Overseas- and U.S.-Homeported Ships 71
Appendix VII: Differences between Material Readiness Inspection Scores for Ships Homeported in the United States and Overseas 77
Appendix VIII: Comments from the Department of Defense 81
Appendix IX: GAO Contact and Staff Acknowledgments 83
Appendix X: Accessible Data 84
Tables
Table 1: Average Total Operations and Support Costs per Ship per Year, Fiscal Years 2004–2013 17
Table 2: Family Housing, Operation and Maintenance, and Military Construction Costs at Navy Overseas Homeports, Fiscal Years 2009–2018 20
Table 3: Summary of Navy Rotational Crewing Initiatives 45
Contents

Table 4: Descriptive Statistics for GAO’s Analysis of Deployed Days Under Way and Costs 58
Table 5: Fitted Models of Deployed Days Under Way 61 Table 6: Fitted Models of Sustainment Costs 64 Table 7: Fitted Models of Operational Costs 66 Table 8: Fitted Models of Personnel Costs 68 Table 9: Descriptive Statistics for Average Daily Casualty Reports
(CASREP) 71 Table 10: Summary of Estimated Parameters from Time-Series
Regression Models with Autoregressive Errors for the Average Daily Number of Casualty Reports (CASREP) 74
Table 11: Fitted Models of Casualty Reports 75 Data Tables for Highlights Figure: Selected Operational Time,
Costs, and Material Readiness Comparisons between Ships Homeported Overseas and in the United States 84
Data Table for Figure 1: Navy Ships Homeported Overseas from Fiscal Year 2006 to Fiscal Year 2017 by Location 84
Data Tables for Figure 4: Comparison of Forward-Presence Rates Provided on an Annual Basis for Ships Homeported in the United States and Overseas 85
Data Table for Figure 5: Percentage of Time Navy Allocates to Training and Maintenance versus Being Deployed and Available in Planned Schedules for Cruisers and Destroyers Homeported in the United States and Overseas as of February 2015 85
Data Table for Figure 6: Average Daily Casualty Reports for U.S.- and Overseas-Homeported Ships, January 2009–July 201486
Data Table for Figure 12: Average Board of Inspection and Survey (INSURV) Inspection Figure of Merit Scores for Cruisers’, Destroyers’, and Amphibious Ships’ Most Recent Material Inspection, Fiscal Years 2007–2014 86
Data Table for Figure 13: Average Board of Inspection and Survey (INSURV) Functional Area Scores for Cruisers’, Destroyers’, and Amphibious Ships’ Most Recent Material Inspection, Fiscal Years 2007–2014 87
Data Table for Figure 14: Average Board of Inspection and Survey (INSURV) Inspection Demonstration Scores for Cruisers’, Destroyers’, and Amphibious Ships’ Most Recent Material Inspection, Fiscal Years 2007–2014 87
Page ii GAO-15-329 Navy Force Structure
Figures
Page iii GAO-15-329 Navy Force Structure
Figure 1: Navy Ships Homeported Overseas from Fiscal Year 2006 to Fiscal Year 2017 by Location 6
Figure 2: Navy Ships Planned to Be Homeported Overseas by the End of Fiscal Year 2015 and Fleet Areas of Operations 7
Figure 3: Overseas-Homeported Ships Participating in Humanitarian Assistance Operation Damayan 11
Figure 4: Comparison of Forward-Presence Rates Provided on an Annual Basis for Ships Homeported in the United States and Overseas 13
Figure 5: Percentage of Time Navy Allocates to Training and Maintenance versus Being Deployed and Available in Planned Schedules for Cruisers and Destroyers Homeported in the United States and Overseas as of February 2015 16
Figure 6: Average Daily Casualty Reports for U.S.- and Overseas-Homeported Ships, January 2009–July 2014 27
Figure 7: USS Essex in Depot Maintenance Following 12 Years of Overseas Homeporting 33
Figure 8: Illustration of the Impact of a Potential 6-Year Decrease in Overseas-Homeported Amphibious Ships’ Service Lives on the Amphibious Warfare Ship Inventory 35
Figure 9: Comparison of Fleet Response Plan and Planned Navy Optimized Fleet Response Plan Operational Cycle for Surface Combatants Homeported in the United States as of February 2015 37
Figure 10: Littoral Combat Ship Crew Turnover in Singapore 45 Figure 11: The Navy’s Homeporting Process 55 Figure 12: Average Board of Inspection and Survey (INSURV)
Inspection Figure of Merit Scores for Cruisers’, Destroyers’, and Amphibious Ships’ Most Recent Material Inspection, Fiscal Years 2007–2014 78
Figure 13: Average Board of Inspection and Survey (INSURV) Functional Area Scores for Cruisers’, Destroyers’, and Amphibious Ships’ Most Recent Material Inspection, Fiscal Years 2007–2014 79
Figure 14: Average Board of Inspection and Survey (INSURV) Inspection Demonstration Scores for Cruisers’, Destroyers’, and Amphibious Ships’ Most Recent Material Inspection, Fiscal Years 2007–2014 80
Data Table for Figure 9: Comparison of Fleet Response Plan and Planned Navy Optimized Fleet Response Plan

Operational Cycle for Surface Combatants Homeported in the United States as of February 2015 86
Page iv GAO-15-329 Navy Force Structure
Abbreviations
CASREP casualty report CG cruiser CVN aircraft carrier DDG destroyer DOD Department of Defense FFG frigate INSURV Board of Inspection and Survey LCC amphibious command ship

LHA/LHD amphibious assault ship LPD amphibious transport dock LSD dock landing ship MCM mine countermeasures ship PC patrol coastal ship strategic laydown plan Strategic Laydown and Dispersal Plan
Page v GAO-15-329 Navy Force Structure
This is a work of the U.S. government and is not subject to copyright protection in the United States. The published product may be reproduced and distributed in its entirety without further permission from GAO. However, because this work may contain copyrighted images or other material, permission from the copyright holder may be necessary if you wish to reproduce this material separately.
Page 1 GAO-15-329 Navy Force Structure
441 G St. N.W. Washington, DC 20548
May 29, 2015
Congressional Committees
The presence of Naval forces outside the United States in overseas locations, referred to as forward presence, supports the Navy’s goals of building partnerships, deterring aggression without escalation, defusing threats, and containing conflict to prevent wider regional disruption.1 Navy ships provide forward presence through a combination of three deployment models: (1) deployments of ships and crews from homeports in the United States; (2) forward-deployed naval forces where ships are homeported overseas and the crews and their families reside in the host country; and (3) rotational crewing of ships, where crews rotate on and off a ship that is deployed for extended periods from a U.S. homeport.2 To meet the increasing demands of combatant commanders for forward presence in recent years, the Navy has extended deployments; increased operational tempos; and shortened, eliminated, or deferred training and maintenance. The Navy has also assigned more surface combatants and amphibious warfare ships to overseas homeports, has been using rotational crewing on the littoral combat ship, and is considering various homeporting options for its new class of destroyers, the DDG 1000.3 According to the Navy, homeporting ships overseas is an efficient method
1See Chief of Naval Operations Navigation Plan 2015-2019 and Department of Defense, Quadrennial Defense Review 2014. 2There is a fourth model, which the Navy refers to as “forward operating,” in which ships operate continuously in forward theaters from multiple overseas ports for several years. These ships are manned by civilian mariners and small detachments of military personnel who rotate on and off the ships individually. This model applies to the logistics and support ships operated by Military Sealift Command, which are not included in the scope of this review. 3The littoral combat ship is a surface combatant intended to operate in the shallow waters close to shore, known as the littorals, performing three principal missions: surface warfare, mine countermeasures, and antisubmarine warfare—to address threats posed by small surface boats, mines, and submarines, respectively. The Zumwalt-class guided missile destroyer (DDG 1000) is a multimission surface combatant tailored for land attack and littoral warfare. The Navy plans to build three of these ships and estimates initial operating capability to be reached in 2016.
Letter
for providing forward presence, with one ship operating continuously overseas providing the same level of presence as four ships deploying from homeports in the United States.
Page 2 GAO-15-329 Navy Force Structure
4 However, Navy leadership has acknowledged that, to achieve these operational benefits, it incurs increased infrastructure costs and operations and sustainment costs.
The House report accompanying a bill for the National Defense Authorization Act for Fiscal Year 2015 included a provision that we review and analyze the Navy’s process for deciding to homeport ships overseas and identify the relative costs and benefits of various approaches.5 This report (1) determines the operational benefits, costs, and readiness effects, if any, associated with assigning ships to U.S. or to overseas homeports and (2) assesses the extent to which the Navy has identified and taken steps to mitigate any risks from homeporting ships overseas.
To determine the operational benefits, costs, and readiness effects, if any, of homeporting ships in the United States and homeporting ships overseas, we selected surface combatants and amphibious warfare ships from the following ship classes for inclusion in our review: cruisers, destroyers, littoral combat ships, mine countermeasures ships, patrol coastal ships, amphibious assault ships, amphibious transport dock ships, dock landing ships, and amphibious command ships.6 We compared the operational benefits, costs, and readiness effects of the different
4Chief of Naval Operations, Testimony to the House Armed Services Committee (March 2014). 5H.R. Rep. No. 113-446, at 111-112 (2014). While the House Report discusses the Navy’s use of rotational crewing, we did not include rotational crewing in the scope of this review because there are limited historical data on this deployment model. The only ship class within our scope that uses rotational crewing is the littoral combat ship; however, only one ship from this class has completed an overseas deployment, so there are limited data on the costs, readiness, and operational benefits of this model. See GAO, Littoral Combat Ship: Deployment of USS Freedom Revealed Risks in Implementing Operational Concepts and Uncertain Costs, GAO-14-447 (Washington, D.C.: July 8, 2014). For more information on the Navy’s use of rotational crewing, see app. I. 6We excluded aircraft carriers from the scope of this engagement due to the limited sample size; we excluded submarines because their operational metrics are classified. There are submarines and their support ships homeported in Guam, a U.S. territory, and a submarine support ship homeported in Diego Garcia, but these support ships are also not included in our review since they are operated by the Military Sealift Command.

homeporting assignments for these ship classes using a variety of factors—including amount of forward presence provided to combatant commanders, ship operations and support costs, readiness data, ship inspection scores, and maintenance execution rates. For these analyses, we focused on comparisons between cruisers, destroyers, and amphibious warfare ships (amphibious assault ships, amphibious transport dock ships, dock landing ships, and amphibious command ships) homeported in the United States and those homeported overseas because these have historically been the ship classes most commonly homeported overseas and, therefore, the Navy has the most robust data available for them.
Page 3 GAO-15-329 Navy Force Structure
7 We selected time frames for each of the data series, primarily ranging from 5 to 10 years of historical data, after assessing their availability and reliability to maximize the amount of data available for us to make meaningful comparisons. We assessed the reliability of each of the data sources by reviewing Navy documentation and discussing with Navy officials the structure of its systems, data-collection processes and procedures, and data-quality controls. We determined that they were sufficiently reliable for the purposes of reporting the operational benefits, costs, and readiness effects of homeporting ships in the United States and overseas. We did not include mine countermeasures ships and patrol coastal ships in our comparative analysis because these ship classes have had relatively little recent experience deploying from U.S. homeports over the past 5 years according to Navy officials and limited comparative data were available.8
To understand the effects of overseas homeporting on infrastructure investments and base operating costs, we examined Navy documentation, such as leadership briefings on decisions to move ships to overseas homeports from 2009 through 2014 where officials stated additional infrastructure was required. These moves included decisions to homeport destroyers in Rota, Spain, and patrol coastal and mine countermeasures ships in Bahrain. We also analyzed cost data from 2009
7For more information on cruisers, destroyers, and amphibious ships used in our comparative analyses, see app. II. 8Naval Forces Europe officials explained that, as of April 2015, only two destroyers had been operating from homeports in Rota, Spain, for a year or less, and therefore limited operational data were available to draw conclusions for ships based in Rota, Spain.

through 2014 for family housing and operation and maintenance, which includes these ship moves, as well as military construction at overseas homeports. We assessed these data by reviewing Navy documentation and discussing with Navy officials data-collection processes and procedures and determined that they were reliable for the purposes of reporting the infrastructure investments and operating costs for overseas-homeported ships. To understand the economic effects of homeporting ships overseas, we reviewed the projected maintenance workload for large surface combatants that involved moving maintenance workload to overseas locations. These workload estimates included the destroyers moving from U.S. homeports to Rota, Spain (four ships) and Yokosuka, Japan (two ships) from the Office of the Chief of Naval Operations for the approximately 7- to 10-year period these ships are expected to be homeported overseas. We analyzed potential U.S.-based economic losses resulting from maintenance workload and relocation of sailors and dependents to overseas locations.
To assess the extent to which the Navy has identified and taken steps to mitigate any risks from homeporting ships overseas, we analyzed (1) key Navy and Department of Defense (DOD) guidance and policies for assigning ships to homeports in the United States and overseas and (2) the Navy’s required actions for evaluating, planning, and implementing changes to overseas force structure.
Page 4 GAO-15-329 Navy Force Structure
9 We also examined Navy force-structure requirements and the 2014 Navy Strategic Laydown and Dispersal Plan (strategic laydown plan)—as well as any planned changes to this laydown—to understand the basing construct for Navy ships.10 We reviewed previous Navy reports that studied the effect of high operational tempo, different deployment approaches, and deferred maintenance on the overall material condition of surface ships and on a ship’s service life.11 We also reviewed the Navy’s plan to implement a revised
9See Office of the Chief of Naval Operations Instruction 3111.17, Strategic Laydown and Dispersal Plan for the Operating Forces of the U.S. Navy (Nov. 22, 2013) and Chairman of the Joint Chiefs of Staff Instruction 2300.02G, Coordination of Overseas Force Structure Changes and Host-Nation Notification (Sept. 4, 2012). 10The annual Navy Strategic Laydown and Dispersal Plan presents the projected homeports of the Navy’s operating forces by type and quantity for a 10-year period. 11See, for example, Fleet Review Panel, Final Report, Fleet Review Panel of Surface Force Readiness (Feb. 26, 2010).

operational schedule—referred to as the optimized fleet response plan—and interviewed Navy officials to discuss this plan, its purpose, expected benefits, and impact on ships’ time allocated to maintenance, training, deployment, and operational availability. We compared the Navy’s plans to criteria for risk assessment in federal standards for internal control.
Page 5 GAO-15-329 Navy Force Structure
12 Our scope and methodology is described in detail in appendix III.
We conducted this performance audit from June 2014 to May 2015 in accordance with generally accepted government auditing standards. Those standards require that we plan and perform the audit to obtain sufficient, appropriate evidence to provide a reasonable basis for our findings and conclusions based on our audit objectives. We believe that the evidence obtained provides a reasonable basis for our findings and conclusions based on our audit objectives.
According to the Department of Defense, combatant commanders have traditionally used forward presence to enhance crisis response, provide deterrence, gain trust, create allies, and build partner capacity. Combatant commander demand for forward presence is at historically high levels and is rising. The Navy reports that it met about 44 percent of the requests from combatant commanders around the world for Navy forces to support ongoing operations and theater security cooperation efforts in its assignment of forces for fiscal year 2015.13 The Navy has reported that it would require over 150 more ships to fully source all combatant commander requests for Navy forces. To meet these increasing demands for forward presence in recent years, the Navy has extended deployments; increased operational tempos; and shortened, eliminated, or deferred training and maintenance.
12GAO, Standards for Internal Control in the Federal Government, GAO/AIMD-00-21.3.1 (Washington, D.C.: November 1999). 13U.S. Navy, Report to Congress: Naval Vessels and the Force Structure Assessment (July 2014).The Navy assigns its forces in response to combatant command requests that have been vetted and prioritized by the Joint Staff as part of its global force-management process.
Background
The Navy’s Use of Overseas Homeporting to Meet Increased Demands for Forward Presence

The Navy also has assigned more surface combatants and amphibious warfare ships to overseas homeports to meet increasing demands for presence. Since 2006, the Navy has nearly doubled the percentage of the fleet assigned to overseas homeports. In 2006, 20 ships were homeported overseas (7.1 percent of the fleet); by the end of fiscal year 2015, 40 ships are expected to be homeported overseas (14.1 percent of the fleet). By 2017, with an additional destroyer homeported in Yokosuka, Japan, 41 ships are expected to be homeported overseas, or 13.9 percent of the projected fleet (see fig.1).
Figure 1: Navy Ships Homeported Overseas from Fiscal Year 2006 to Fiscal Year 2017 by Location
Page 6 GAO-15-329 Navy Force Structure
Notes: These data include the aircraft carrier homeported in Yokosuka. The size of the Navy fleet increased from 281 to 284 between fiscal year 2006 and 2015. Frigates (FFG) were homeported in Yokosuka, Japan up to 2007, but the entire ship class is scheduled for decommissioning by the end of fiscal year 2015 so they are not included in this graphic.
The Navy plans to have surface and amphibious ships homeported in the following areas of operations by the end of fiscal year 2015 (see fig. 2):
· 5th Fleet area of operations: Manama, Bahrain (14 ships); · 6th Fleet area of operations: Gaeta, Italy, and Rota, Spain (5 ships);
and · 7th Fleet area of operations: Yokosuka and Sasebo, Japan (21 ships).
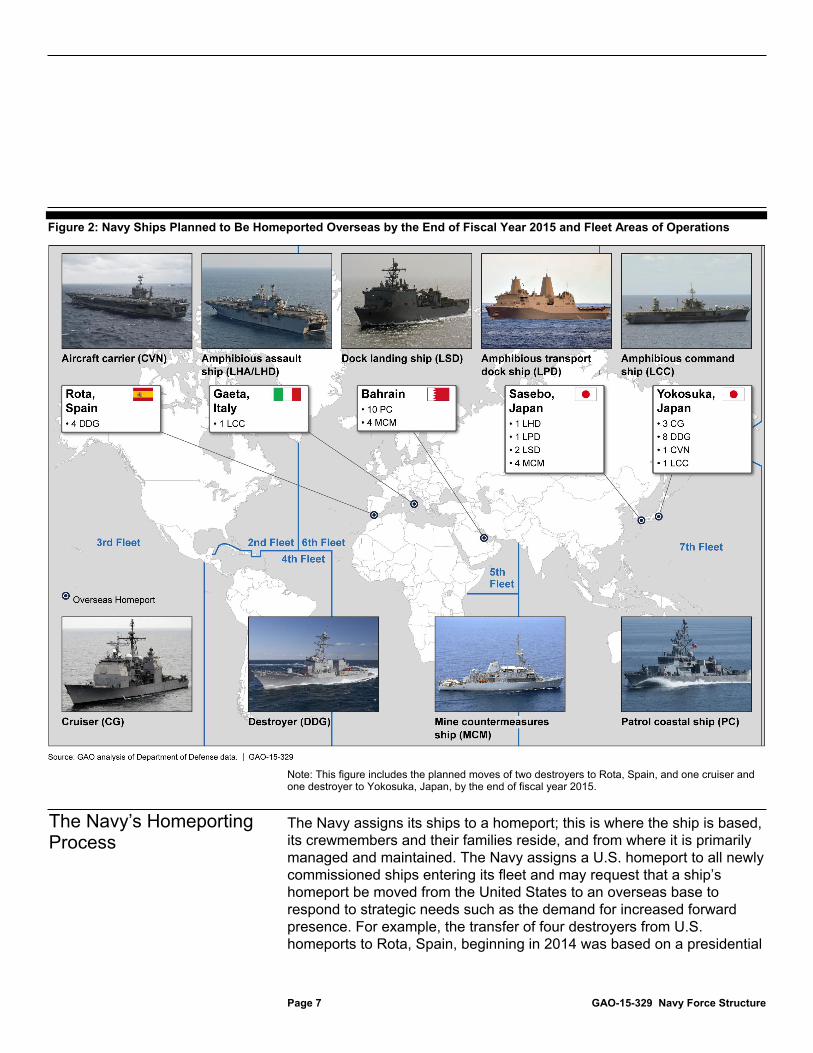
Figure 2: Navy Ships Planned to Be Homeported Overseas by the End of Fiscal Year 2015 and Fleet Areas of Operations
Page 7 GAO-15-329 Navy Force Structure
Note: This figure includes the planned moves of two destroyers to Rota, Spain, and one cruiser and one destroyer to Yokosuka, Japan, by the end of fiscal year 2015.
The Navy assigns its ships to a homeport; this is where the ship is based, its crewmembers and their families reside, and from where it is primarily managed and maintained. The Navy assigns a U.S. homeport to all newly commissioned ships entering its fleet and may request that a ship’s homeport be moved from the United States to an overseas base to respond to strategic needs such as the demand for increased forward presence. For example, the transfer of four destroyers from U.S. homeports to Rota, Spain, beginning in 2014 was based on a presidential
The Navy’s Homeporting Process
decision to provide ballistic missile defense in Europe.
Page 8 GAO-15-329 Navy Force Structure
14 The process of moving a ship to an overseas homeport involves changing the overseas force structure, which can include the physical movement of a military unit, the introduction or removal of military capability, treaty notification, host-nation notification, and public announcement of physical overseas force structure.15 Overseas force-structure changes require the approval of the Secretary of Defense and coordination with the U.S. State Department. According to Navy officials, forward-deployed ships are typically homeported overseas for a period of 7 to 10 years before being replaced with a ship of the same class from the United States. See appendix IV for an expanded discussion of the Navy’s complete homeporting process.
Homeporting ships overseas provides considerable additional time in a forward area of operations and other benefits ranging from increased opportunities for collaboration with partners and allies to faster response time for emerging crises. However, this additional time is available primarily because training and maintenance periods are shorter than those provided for ships homeported in the United States. We found that the Navy incurs higher operations and support costs for ships homeported overseas than for ships homeported in the United States, and moving ships overseas requires overseas infrastructure investments and results in U.S.-based economic losses. Further, the Navy’s high pace of operations for its overseas-homeported ships impacts crew training and the material condition of these ships—overseas-homeported ships have had lower material condition since 2012 and experienced a worsening trend in overall ship readiness when compared to U.S.-homeported ships.
14In September 17, 2009, the President announced the U.S. decision to adopt a new approach to ballistic missile defense in Europe. This plan is called the European Phased Adaptive Approach, which aims to protect North Atlantic Treaty Organization European populations, territory, and forces against the increasing threats posed by the proliferation of ballistic missiles. 15CJCSI 2300.02G, Coordination of Overseas Force Structure Changes and Host-Nation Notification.
Homeporting Ships Overseas Has Operational Benefits but Results in Additional Costs and Adverse Effects on Readiness and Ship Condition

Operating forward is one of the Chief of Naval Operations’ three tenets for the Navy, along with putting warfighting first and being ready.
Page 9 GAO-15-329 Navy Force Structure
16 According to Navy officials, maintaining forward presence through overseas homeporting allows the Navy to continuously perform missions in areas of strategic importance. The Navy acknowledges that some of the benefits of overseas homeporting are difficult to quantify but that this deployment model is integral to furthering U.S. interests and projecting influence across the globe. Some of these benefits are described here:17
· Regional partnership building: The Navy participates in numerous multilateral missions, drills, and training exercises with allies and partners around the globe to help strengthen relations and enhance partner capabilities and capacity. Having ships homeported overseas provides more opportunities for this regional partnership building, according to Navy officials. For example, the Navy’s 5th Fleet, headquartered in Bahrain, led the largest international mine countermeasures exercise to date in the Persian Gulf during the autumn of 2014. The exercise involved navies from 44 countries including the four U.S. Navy mine countermeasures ships homeported in Bahrain. According to Navy officials, ships homeported overseas can more frequently and readily get under way to conduct joint missions and exercises with host nation and neighboring navies than can ships homeported in the United States.
· Deterrent effect: Navy leaders cite the benefit of U.S. ships “flying the flag” in overseas ports. Navy officials told us that the continuous presence of U.S. ships in overseas homeports provides reassurance to allies and signals the United States’ commitment to global engagement, adding that U.S. naval presence provides a deterrent to existing and potential threats to the United States and its allies. For example, Navy officials added that the security against aggression that U.S. ships provide to European allies is of tangible value to these countries.
· Maintenance flexibility: Navy officials responsible for scheduling maintenance overseas, including those from 5th Fleet, 6th Fleet, and
16Chief of Naval Operations, CNO’s Navigation Plan 2015-2019 (Aug. 19, 2014). 17For Navy discussions of these benefits, see, for example, Chief of Naval Operations, Testimony to the House Armed Services Committee (March 2014), and U.S. Navy, Report to Congress: Naval Vessels and the Force Structure Assessment.
Ships Homeported Overseas Provide Additional Forward Presence and Other Benefits
U.S. Pacific Fleet, cited the flexibility, capacity, and diversity of the types of maintenance that can be performed on overseas-homeported ships since they are not subject to certain legal restrictions and limitations on maintenance that apply to U.S.-homeported ships. These statutory provisions require U.S.-homeported ships to be maintained primarily at U.S. shipyards, with only voyage repairs allowable in overseas shipyards.
Page 10 GAO-15-329 Navy Force Structure
18 · Reduced crisis response time: Navy officials state that ships
operating forward can more quickly and effectively respond to crises and contingencies. Ships homeported overseas can assist when a surge of force is needed to respond to an emerging crisis, as do U.S.-homeported ships in that area of operations while deployed. For example, ships homeported in Japan were able to provide timely humanitarian assistance to the Philippines as part of Operation Damayan following the destruction wrought by Typhoon Haiyan in 2013 (see fig. 3). Navy officials cite the importance of having forward presence distributed globally to more effectively conduct missions by reducing transit time. For example, transit from the United States to areas like the Persian Gulf or South China Sea can take weeks, whereas ships homeported in Bahrain or Japan are already present and can access these areas in a matter of hours or days.19
18Section 7310 of title 10 of the United States Code states that a naval vessel homeported in the United States or Guam may not be overhauled, repaired, or maintained in a shipyard outside the United States or Guam, other than in the case of voyage repairs. Voyage repairs include unplanned need-based maintenance, for example, repairs required by an equipment casualty or malfunction. While overseas homeported ships are not subject to this restriction, they are subject to a related limitation during the 15-month period prior to any realignment to U.S.-homeported status. 19Specific transit times are classified.

Figure 3: Overseas-Homeported Ships Participating in Humanitarian Assistance Operation Damayan
Page 11 GAO-15-329 Navy Force Structure
· Meeting presence requirements with current force structure: Navy officials stated that overseas homeporting allows the Navy to meet rising forward-presence requirements from the combatant commanders with the available force structure. For example, officials stated that the Navy would need many more ships deployed from the United States to provide the same level of presence that overseas-homeported ships are currently providing.
The Navy uses at least three metrics to assess a ship’s ability to provide forward presence: (1) how long the ship is in the operational area, (2) how much the ship is available for tasking, and (3) the amount of time the ship is actually under way. Navy officials cite the importance of measuring presence and operational availability in concert with deployed days under way. For example, they emphasized that there are intangible benefits gained by having a U.S. ship in an overseas port even if it is not operationally available.
· Presence is the number of days a ship spends in an area of operations—excluding depot maintenance periods—divided by 365. Ships homeported overseas are always physically in an area of operations (i.e., in the 4th, 5th, 6th, or 7th Fleet areas of operations); therefore, the Navy calculates that they provide as much as four times
more presence than U.S.-homeported ships, which must travel long stretches of ocean before entering one of the overseas areas of operations and then return to the United States after a multimonth deployment.
· Operational availability is the number of days a ship is available for operational tasking in a year. Operational availability measures the amount of time that a ship can get under way and execute a mission as required. For example, a ship can be considered operationally available even if it is in maintenance, if it is able to get under way and execute a mission in a short period of time. The Navy calculates that ships homeported overseas provide over three times more operational availability than U.S.-homeported ships.
· Deployed underway time is the number of days a ship spends away from port, referred to as underway days, deployed in the 4th, 5th, 6th, or 7th Fleet areas of operations.
Page 12 GAO-15-329 Navy Force Structure
20 This metric tracks the number of days that a ship is out of port, at sea, and performing a mission in these areas of operations. Our analysis of the number of deployed underway days provided by ships homeported in the United States and overseas from fiscal years 2003 through 2012 estimated that the average ship homeported overseas spent about 42 additional deployed days under way, compared to the average ship that was homeported in the United States (see fig. 4).21
20Ships also spend time under way around the United States in the 2nd and 3rd Fleet areas of operations when training or transiting to and from forward areas of operations. 21The 95 percent confidence interval of this estimate ranges from 12 to 72 days, and the estimate is distinguishable from zero at the 0.05 significance level, based on our statistical analysis of Navy data (see app. V). The Navy does not collect historical presence and operational availability data at the individual ship level; therefore, we relied on Navy planning assumptions used in the global force-management process and stated in prior Navy reports to illustrate the number of days provided.

Figure 4: Comparison of Forward-Presence Rates Provided on an Annual Basis for
Page 13 GAO-15-329 Navy Force Structure
Ships Homeported in the United States and Overseas
aWe made this estimate using our statistical analysis of average deployed underway days per ship from the Navy Energy Usage Reporting System. The difference between overseas and U.S.-homeported ships is statistically distinguishable from zero at the 0.05 level of significance. We compared cruisers, destroyers, and amphibious ships; we excluded mine countermeasures ships and patrol coastal ships because these ship classes have had limited recent experience deploying from U.S. homeports, according to Navy officials. bThe Navy does not collect historical presence and operational availability data at the individual ship level; therefore, we relied on Navy planning assumptions used in the global force-management process and stated in prior Navy reports to illustrate the number of days provided.
The Navy faces certain challenges associated with homeporting ships overseas. For example, unforeseen host-nation policy changes can affect renegotiation of international agreements, which may restrict base usage, or possibly remove the Navy presence entirely. This occurred in 1991, when a long-standing agreement between the Philippines and the United States ended, followed by the closing of Clark Air Base and Subic Bay Naval Base, which at that time served as the 7th Fleet’s primary logistics and repair hub and was home to over 12,000 Navy personnel and dependents. Through status-of-forces agreements, host nations may negotiate the size and scope of the naval footprint, and seek to place parameters on how those ships can be employed. These agreements are periodically renegotiated, and changes can affect Navy and U.S.

policymaker flexibility. Finally, Navy officials explained that ships homeported overseas have difficulty identifying appropriate training ranges for certain exercises and noted that utilizing foreign ports presents unique threat and security challenges compared to U.S. homeports.
Homeporting a ship overseas saves transit time to and from an area of operations and allows it be in this area longer.
Page 14 GAO-15-329 Navy Force Structure
22 However, our analysis shows that the primary reason for the greater number of deployed underway days provided by overseas-homeported ships results from the Navy’s decision to truncate training and maintenance periods on these ships in order to maximize their operational availability. Ships homeported overseas do not operate within the traditional fleet response plan cycles that apply to U.S.-based ships.23 Since the ships are in permanent deployment status during their time homeported overseas, they do not have designated ramp-up and ramp-down maintenance and training periods built into their operational schedules.24 Because the Navy expects these ships to be operationally available for the maximum amount of time, their intermediate and depot-level maintenance is instead executed through more frequent, shorter maintenance periods, or deferred until after the ship returns to a U.S. homeport, according to Navy officials.25
22Specific transit times are classified. 23The Navy fleet response plan is the primary force-generation model for the Navy consisting of four phases: maintenance, training, deployment, and availability. 24In completing a multivariate statistical analysis comparing ships’ deployed days under way in a given year to their deployed days under way in the following year, we found that ships homeported overseas did not have a consistent pattern of rotating in and out of operational and maintenance periods. For the average ship homeported overseas, there was no statistically distinguishable relationship between deployed days under way one year and the next. In other words, we could not detect a systematic pattern of rotating ships between periods of operations and maintenance for overseas-homeported ships, though this result may reflect our inability to detect such an effect with a modest amount of data. See app. V for more details. 25Depot maintenance is an action performed on materiel or software in the conduct of inspection, repair, overhaul, or the modification or rebuild of end-items, assemblies, subassemblies, and parts, that, among other things, requires extensive industrial facilities, specialized tools and equipment, or uniquely experienced and trained personnel that are not available in lower-echelon-level maintenance activities. Depot maintenance is a function and, as such, is independent of any location or funding source and may be performed in public or private sectors.
The Navy Reduces Training and Maintenance Periods on Ships Homeported Overseas

These officials explained that U.S.-homeported ships typically operate under the Navy’s fleet response plan, which, by contrast, provides for designated maintenance and training periods that prepare ships for deployment to areas of operations. These ships deploy for a notional period of 6 months (which in the past several years has frequently been extended to 8 to 10 months) and then return to their U.S. homeports to undergo postdeployment depot maintenance and leave and training periods for the crew.
Our analysis of the operational cycles of ships homeported in the United States and those homeported in Yokosuka, Japan, and Rota, Spain, found that, based on their notional operational cycles alone, Navy ships homeported overseas provide more deployed time than ships homeported in the United States primarily because the Navy reduces their training and maintenance periods (see fig. 5).
Page 15 GAO-15-329 Navy Force Structure
26 For example, our analysis of the Navy’s plans for U.S.-based cruisers and destroyers shows that the Navy plans for them to spend 41 percent of their time deployed or available for deployment and 60 percent of their time in dedicated training and maintenance periods.27 In contrast, the Navy plans for its Japan-based cruisers and destroyers to spend 67 percent of their time deployed, 33 percent of their time in maintenance, and do not include a dedicated training period.
26These are the Navy’s planned operational cycles. Actual executed cycles may differ. We excluded amphibious ships homeported both in the United States and overseas from this figure, since these ships operate on slightly different cycles than cruisers and destroyers, but the general reductions in dedicated training and maintenance periods are similar. 27Percentages do not add up to 100 due to rounding.

Figure 5: Percentage of Time Navy Allocates to Training and Maintenance versus
Page 16 GAO-15-329 Navy Force Structure
Being Deployed and Available in Planned Schedules for Cruisers and Destroyers Homeported in the United States and Overseas as of February 2015
Notes: Percentages do not add up to 100 due to rounding. Planned schedules are subject to change to meet operational requirements and have varied over time according to Navy officials. For the Fleet Response Plan, Navy officials explained that the available period can include extensions of a ship’s deployment, maintenance, or other tasking as required. In March 2015, Fleet Forces Command approved a revised schedule for the four destroyers homeported in Rota, Spain, based on a 32-month cycle with equal amounts of time dedicated for training and maintenance and for deployment.
The operational benefits the Navy describes that result from homeporting ships overseas also result in costs to the Navy and DOD more broadly. Our analysis of Navy operations and support cost data—personnel, operations, and sustainment costs from fiscal years 2004 through 2013 for surface and amphibious ships—found that annual per ship operations
Overseas-Homeported Ships Incur Additional Costs and Adverse Effects on Readiness and Ship Condition Higher Operations and Support Costs

and support costs for all ships homeported overseas are about 15 percent, or approximately $9 million, higher than for ships homeported in the United States, with some variance by ship class.
Page 17 GAO-15-329 Navy Force Structure
28 For example, destroyers homeported overseas incur about 17 percent higher average annual operations and support costs per ship, which would mean about $98 million per year in additional costs for the 12 destroyers that are expected to be homeported overseas by the end of fiscal year 2015 (see table 1).
Table 1: Average Total Operations and Support Costs per Ship per Year, Fiscal Years 2004–2013
Average total operations and support costs per ship per
year (constant fiscal year 2014 dollars)
Difference in costs per ship per year (constant
fiscal year 2014 dollars) Percentage difference in
costs per ship per year All U.S.-homeported ships $61,455,409 All overseas-homeported ships 70,420,832 $8,965,423 15% U.S.-homeported cruisers 62,476,943 Overseas-homeported cruisers 70,273,236 7,796,293 12 U.S.-homeported destroyers 48,542,953 Overseas-homeported destroyers 56,708,428 8,165,475 17 U.S.-homeported amphibious ships 89,539,092 Overseas-homeported amphibious ships 92,744,921 3,205,829 4
Source: GAO analysis of data from the Navy Visibility and Management of Operating and Support Costs database. | GAO-15-329
Note: This table does not include cost data associated with the two destroyers that changed homeports to Rota, Spain, in 2014 or the two additional destroyers that will change their homeports to Rota, Spain, in 2015. We compared cruisers, destroyers, and amphibious ships; we excluded mine countermeasures ships and patrol coastal ships because these ship classes have had limited recent experience deploying from U.S. homeports, according to Navy officials.
28Operations and support costs are derived from the Navy Visibility and Management of Operating and Support Costs database. Personnel costs include officer and enlisted pay, allowances, entitlements, and permanent change of station costs. Operations costs include fuel, oil, electricity, port services, ammunition, and other costs. Sustainment costs include intermediate- and depot-level maintenance costs and system-specific training and engineering support. We excluded modernization costs from our presentation of operations and support cost differences because Navy officials explained that ships homeported overseas undergo extensive modernization before they are homeported overseas, as part of the Navy’s strategy of putting the most advanced and capable units forward.

We completed statistical analyses of the differences in the cost components that make up overall operations and support costs—operations costs, sustainment costs, and personnel costs. Specifically, we conducted a multivariate statistical analysis to analyze how ships that were and were not homeported overseas compared to each other on various outcomes.
Page 18 GAO-15-329 Navy Force Structure
29 Our analysis showed that there are statistically meaningful associations between higher operational tempo while a ship is homeported overseas and additional operations and support costs. See appendix V for an expanded discussion of these differences and our methodology for analyzing them. Specifically, our analysis allowed us to estimate the following:
· Operations costs: The Navy spends an estimated $3.2 million more on average for each additional 50 deployed days under way (across all ships we analyzed). Ships that were homeported overseas for 2 consecutive years incurred $18.7 million more in operations costs, on average, compared to ships that were homeported in the United States over the same period.30
· Sustainment costs: Each additional 50 deployed days under way in a given year was associated with an estimated $0.7 million more in sustainment spending the following year (across all ships we analyzed). We also found that the Navy spent about $5.8 million more on sustainment in the year after the average ship returned to the United States after being homeported overseas than the average U.S.-homeported ship that was never homeported overseas (these costs would be incurred outside of those presented in table 1). This is consistent with the Navy’s practice of conducting more sustainment
29This analysis held constant all ship characteristics that did not change over time, such as class and year commissioned. In addition, the analysis held constant all changes over time observed among all ships, such as labor and material prices and trends in military operations. Lastly, the analysis of costs held constant the ratio of executed to required mandays, measured prior to when a ship was homeported overseas. See app. V for more details. 30The 95 percent confidence intervals for these estimates range from $2.9 million to $3.5 million and from $8.0 million to $29.4 million, respectively.
spending and depot maintenance when a ship returns from an overseas homeport to a U.S. homeport.
Page 19 GAO-15-329 Navy Force Structure
31 · Personnel costs: Overseas-homeported ships incurred an estimated
$1.3 million more per year in personnel costs, on average, than ships homeported in the United States due to higher housing allowances, cost of living adjustments, and permanent change of station costs.32
To better understand differences in personnel costs, we analyzed specific personnel costs associated with homeporting ships overseas, such as overseas housing allowances and cost of living adjustments. We found that when we factored overseas housing allowances and cost of living adjustments, the total compensation for sailors at overseas locations is greater than the compensation they would have received at homeports in the United States.33 These additional costs, as well as the generally higher costs of moving and housing sailors and their families at overseas locations, contribute to the higher overall operations and support costs for overseas-homeported ships presented in table 1. Moreover, these differences will likely be larger than they currently are once four destroyers are moved from Norfolk, Virginia (three ships) and Mayport, Florida (one ship) to Rota, Spain, by the end of 2015. For example, the Navy estimates that the increased housing allowances and cost of living adjustments for Rota-based sailors will be approximately $18 million per year, or an 89 percent increase in compensation costs based on the previous homeports of Norfolk, Virginia, and Mayport, Florida.
Further, Navy 5th and 7th Fleet officials explained that permanent change of station costs are also higher for personnel stationed overseas. For example, the costs of shipping household goods to Bahrain or Japan are higher than the costs for a comparable move between locations in the
31The 95 percent confidence intervals for these estimates range from $0.2 million to $1.3 million and from -$1.4 million to $13.0 million, respectively. The $5.8 million estimate is distinguishable from zero at the 0.11 significance level. 32The 95 percent confidence interval for this estimate ranges from $0.7 million to $2.0 million. 33For this analysis, we compared overseas housing allowances and cost of living adjustments for selected officer and enlisted ranks for homeports in Japan and Spain with the housing allowances those personnel would receive at primary homeports in the United States, including San Diego, California; Norfolk, Virginia; and Mayport, Florida.

United States. Additionally, due to hardship conditions in Bahrain, sailors there rotate more frequently than sailors homeported in the United States and other overseas locations. Further, unaccompanied sailors in Bahrain have the option to move their families anywhere in the United States for the duration of their 1-year tour, potentially doubling the number of moves associated with Bahrain-based assignments.
Page 20 GAO-15-329 Navy Force Structure
34
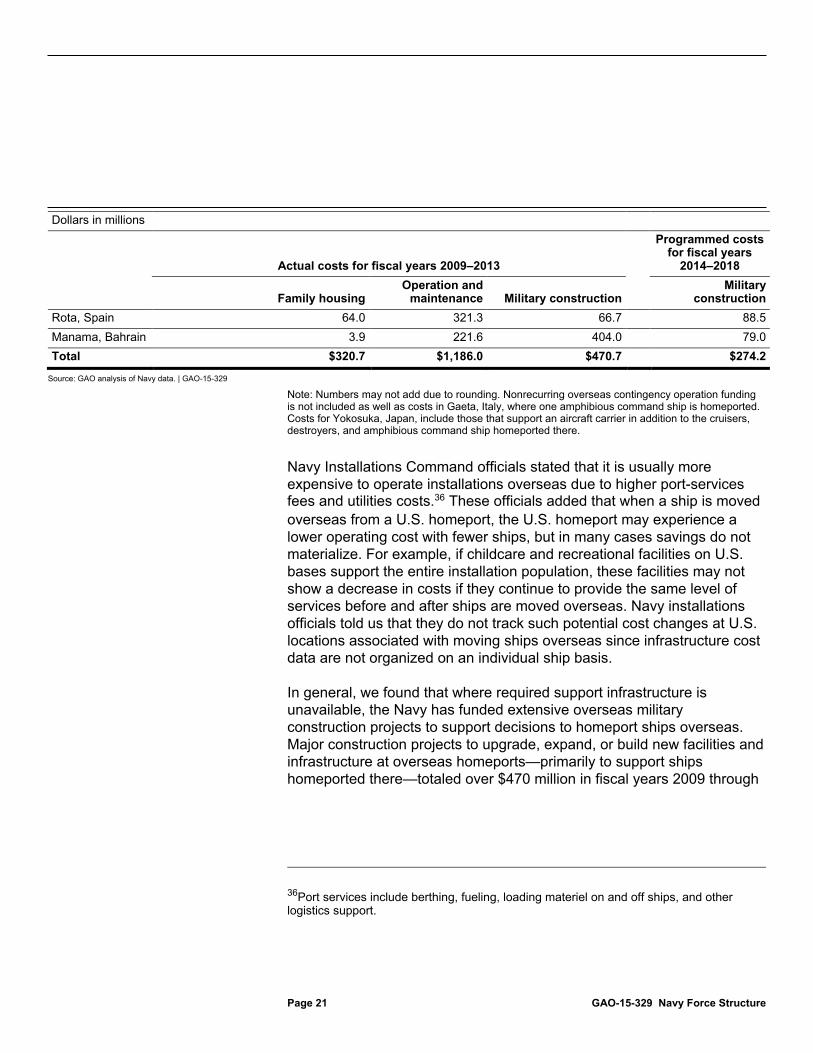
In addition to operations and support costs, the Navy seeks to provide consistent shore installation services and support, which for ships homeported overseas can require shore support investments.35 While we recognize that U.S.-homeported ships require infrastructure and base-operating investments in the United States, we were unable to systematically compare the infrastructure and base operating costs of homeporting a ship in the United States with homeporting a ship overseas as we did with operations and support costs due to a lack of available data. Specifically, the Navy does not track infrastructure cost data on an individual ship basis to allow for an accurate comparison as U.S. and overseas bases support homeported as well as other transiting ships. However, we found that the costs for operating and maintaining facilities at four of the overseas homeports in our review totaled nearly $1.2 billion over the past 5 fiscal years (see table 2).
Table 2: Family Housing, Operation and Maintenance, and Military Construction Costs at Navy Overseas Homeports, Fiscal Years 2009–2018
Dollars in millions
Actual costs for fiscal years 2009–2013
Programmed costs for fiscal years
2014–2018
Family housingOperation and
maintenance Military construction Military
construction Yokosuka, Japan $204.4 $439.4 $0 $12.7 Sasebo, Japan 48.3 203.7 0 94.0
34According to Navy officials, approximately 90 percent of Bahrain assignments are unaccompanied, meaning sailors are not authorized to bring their family members. 35Office of the Chief of Naval Operations Instruction 5450.339, Missions, Functions, and Tasks of Commander, Navy Installations Command (Apr. 21, 2011).
Infrastructure Investments and Base Operating Costs
Page 21 GAO-15-329 Navy Force Structure
Dollars in millions
Actual costs for fiscal years 2009–2013
Programmed costs for fiscal years
2014–2018
Family housingOperation and
maintenance Military construction Military
construction Rota, Spain 64.0 321.3 66.7 88.5 Manama, Bahrain 3.9 221.6 404.0 79.0 Total $320.7 $1,186.0 $470.7 $274.2
Source: GAO analysis of Navy data. | GAO-15-329
Note: Numbers may not add due to rounding. Nonrecurring overseas contingency operation funding is not included as well as costs in Gaeta, Italy, where one amphibious command ship is homeported. Costs for Yokosuka, Japan, include those that support an aircraft carrier in addition to the cruisers, destroyers, and amphibious command ship homeported there.
Navy Installations Command officials stated that it is usually more expensive to operate installations overseas due to higher port-services fees and utilities costs.36 These officials added that when a ship is moved overseas from a U.S. homeport, the U.S. homeport may experience a lower operating cost with fewer ships, but in many cases savings do not materialize. For example, if childcare and recreational facilities on U.S. bases support the entire installation population, these facilities may not show a decrease in costs if they continue to provide the same level of services before and after ships are moved overseas. Navy installations officials told us that they do not track such potential cost changes at U.S. locations associated with moving ships overseas since infrastructure cost data are not organized on an individual ship basis.
In general, we found that where required support infrastructure is unavailable, the Navy has funded extensive overseas military construction projects to support decisions to homeport ships overseas. Major construction projects to upgrade, expand, or build new facilities and infrastructure at overseas homeports—primarily to support ships homeported there—totaled over $470 million in fiscal years 2009 through
36Port services include berthing, fueling, loading materiel on and off ships, and other logistics support.
2013.
Page 22 GAO-15-329 Navy Force Structure
37 In addition, the Navy plans to spend more than $274 million at these locations over the next 4 years.38 For example, in Bahrain, since 2009 construction totaling nearly $483 million is planned or has been previously obligated and has been funded solely by the United States without host-nation contributions, according to Navy officials.39
Recent Navy decisions to move ships from U.S. homeports to overseas homeports provides insight into the infrastructure investments and base operating costs overseas homeporting requires. For example, infrastructure investments and base operating costs needed to support the recent move of three destroyers from Norfolk, Virginia, and one from Mayport, Florida, to Rota, Spain, required several infrastructure investments in order to provide the level of support these ships had when they were in U.S. homeports. While Naval Station Rota had some preexisting infrastructure that would support the destroyers, new investments and expansions are planned, such as
· ship-crew training facilities, · office space renovations, and · warehouse storage facilities.
In addition, the Navy estimates that the shore support requirements for the four destroyers homeported in Rota, Spain, will result in approximately 50 new civilian employees, 25 local national contractors assigned to various support positions, and 35 additional uniformed military personnel.
37These military construction projects supported the patrol coastal and mine countermeasures ships homeported in Bahrain and the destroyers homeported in Rota, Spain, and included pier upgrades, ammunition storage and maintenance facilities, and sailor housing. 38Construction projects costing less than $1,000,000 may be funded through operation and maintenance appropriations; other military construction must be funded by military construction, family housing, or other construction appropriations. See, for example, 10 U.S.C. §§ 2802 and 2805. 39The Navy, Department of State, and the host nation negotiate the level of host-nation support associated with each homeporting decision. The level of host-nation support varies widely from country to country. For example, Japan provides 84 percent of the maintenance work on Navy surface ships in Yokosuka. There is no similar host-nation contribution in Bahrain, Italy, and Spain.

Similar infrastructure investments and base operating costs have occurred in Bahrain as a result of the Navy decision to relocate patrol coastal and mine countermeasures ships from the United States to Bahrain in 2014. These decisions required investments related to sailor and dependent support facilities and other spending related to supporting ship maintenance and management. For example,
· upgrades and repairs for a dilapidated quay, · additional on-base housing for single sailors, and · new ship maintenance facilities.
In addition to Navy-funded military construction projects, other DOD entities have planned or obligated funds as a result of Navy decisions to homeport ships overseas. For example, in Rota, Spain, the Department of Defense Education Activity plans to upgrade and build new school facilities to support the additional dependent students of sailors who will be relocated to Spain with the four destroyers. These upgrades and new facilities are projected to cost DOD approximately $18 million, in addition to recurring annual operations and maintenance costs. DOD school facilities did not support the dependents of sailors aboard these destroyers when they were homeported in Norfolk, Virginia, and Mayport, Florida.
The decision to relocate ships from the United States to overseas homeport locations also results in economic losses in the United States. Navy and Joint Staff guidance direct the Navy to assess the operational and resource implications of potential homeporting changes and do not require the Navy to consider U.S.-based economic losses when making homeporting decisions.
Page 23 GAO-15-329 Navy Force Structure
40 Navy officials stated that they recognize there are economic implications to moving ships overseas; however, they emphasized that the Navy’s decision process focuses on meeting operational requirements and the associated resource needs, and does not estimate the U.S.-based economic impacts of moving ships overseas.
40See OPNAV Instruction 3111.17, Strategic Laydown and Dispersal Plan for the Operating Forces of the U.S. Navy, and CJCSI 2300.02G, Coordination of Overseas Force Structure Changes and Host-Nation Notification. Additionally, while not specific to ship homeporting, DOD’s general guidance for economic analysis notes that societal costs and benefits outside the federal government are usually not included in a DOD cost analysis. DOD Instruction 7041.3, Economic Analysis for Decisionmaking (Nov. 7, 1995).
U.S.-Based Economic Losses

We analyzed recent homeporting decisions—to relocate three destroyers from Norfolk, Virginia, to Rota, Spain; one destroyer from Mayport, Florida, to Rota, Spain; and two destroyers from San Diego, California, to Yokosuka, Japan, from 2014 through 2017—in order to estimate some of the potential U.S.-based economic losses resulting from these moves. We found that these decisions will result in the removal of approximately 1,800 sailors and 2,400 dependents from these local economies. Previous decisions of similar size and scope have prompted Navy officials to state that such relocations will result in significant losses to local economies, and the Congressional Research Service has reported that similar losses in numbers of crew and dependents have resulted in thousands of net job losses and significant declines in local economic activity.
Page 24 GAO-15-329 Navy Force Structure
41
Conversely, when announcing the plan in October 2011 to homeport four U.S. Navy destroyers in Rota, the Prime Minister of Spain announced that (1) this initiative would have a positive socioeconomic impact on Spain, particularly in the Bay of Cadiz area near Rota; (2) homeporting four ships in Rota will require investing in the Rota naval base’s infrastructure and contracting for services, thus generating approximately a thousand new jobs, both directly and indirectly; and (3) the effect on Spain’s defense industry will also be positive, since the United States will be bringing additional maintenance workload to Spanish shipyards. Navy 6th Fleet and U.S. Pacific Fleet officials also stated that overseas homeporting provides a benefit to host-nation contractors and economies by increasing the amount and complexity of maintenance required by U.S. Navy ships while they are homeported overseas.
Foreign shipyards gain additional maintenance workload when overseas-homeported ships are maintained abroad. This results in fewer ship maintenance labor hours being worked in the United States, affecting U.S.-based economic activity in general and economic activity at shipyards in particular. For example, we analyzed the projected workload transfer associated with recent decisions to relocate four destroyers to Rota, Spain, and two additional destroyers to Yokosuka, Japan, and
41Congressional Research Service, Navy Nuclear Aircraft Carrier (CVN) Homeporting at Mayport: Background and Issues for Congress (Aug. 8, 2013).

found that these decisions will result in an estimated decline in the United States of about 170 full-time-equivalent maintenance workers and $23 million per year in reduced maintenance expenditures, based on the expected annual amount of maintenance to be performed in Spain and Japan.
Page 25 GAO-15-329 Navy Force Structure
42
We found that high operational tempo for ships homeported overseas limits crew training when compared to ships homeported in the United States. Navy officials told us that U.S.-based crews are completely qualified and certified prior to deploying from their U.S. homeports, with few exceptions. In contrast, the high operational tempo of ships homeported overseas has resulted in a “train on the margins” approach. According to Navy officials, “training on the margins” means that there is little to no dedicated training time set aside for the ships, so that crews train while under way or in the limited time between underway periods. Officials told us that the training periods for destroyers based in Spain overlap with maintenance periods and that the high operational tempo of these ships means that training has to be planned and coordinated with precision to help ensure that crews are properly trained. In Japan, there are no dedicated training periods built into these ships’ operational schedules.43 As a result, these crews do not have all needed training and certifications.44 Over the course of this review, we found that between 9 percent and 17 percent of the warfare certifications for crews homeported
42For this analysis, we assumed 2,080 hours of work per full-time equivalent, recognizing that ship-repair industry workers receive vacation and holidays but also work high levels of overtime, according to Navy officials. We calculated maintenance losses based on revenue transfers from labor only and did not include material cost-related transfers because Navy officials explained that some portion of the material could be purchased in the United States. 43This includes the operational schedules of cruisers, destroyers, and amphibious ships homeported in Yokosuka and Sasebo, Japan. 44The Navy’s Surface Force Readiness Manual states that the high operational tempo and frequent tasking of ships homeported overseas requires that these ships always be prepared to execute complex operations and notes that this demand for continuous readiness requires a policy that ensures these ships do not lapse in training, readiness, material condition, or manning. See Commander, Naval Surface Force U.S. Pacific Fleet / Commander, Naval Surface Force Atlantic Instruction 3502.3, Surface Force Readiness Manual (Mar. 9, 2012).
Impacts on Crew Training

in Japan had expired.
Page 26 GAO-15-329 Navy Force Structure
45 Over three-quarters of the expired certifications in January 2015, including air warfare and electronic warfare, had been expired for 5 months or more. Navy officials told us that while these sailors may be technically proficient in duties that they regularly perform as part of routine missions while deployed overseas, they may not be adequately trained to perform other duties as required. For example, fleet officials told us that some expired certifications—like visit/board/search/seizure—are ancillary, while others—like air warfare—are more critical to the overseas missions conducted by these ships.
Our analysis also found the material condition of overseas-homeported ships has been lower than U.S.-homeported ships since 2012 and has worsened at a slightly faster rate over the past 5 years. The Navy uses casualty reports to provide information on the material condition of ships to determine current readiness.46 For example, casualty report data provide information on individual pieces of equipment or systems that are degraded or out of service, the lack of which will affect a ship’s ability to support required mission areas. We analyzed monthly casualty report data from January 2009 through July 2014 to estimate trends for overseas- and U.S.-homeported ships separately.47 We found a statistically significant increase in casualty reports for both overseas-homeported ships and U.S.-homeported ships during this period, indicating declining material condition across the fleet.48 Furthermore, we found that the number of casualty reports is increasing at a slightly faster
45In August 2014, 17.4 percent of the warfare certifications for crews homeported in Japan had expired. In January 2015, 8.5 percent of the warfare certifications for crews homeported in Japan had expired. Navy officials explained that although the scores appear to show some recent improvement, they have not been able to determine a trend and continue to emphasize the benefit of dedicated training periods for overseas-homeported ships. 46Casualty reports reflect equipment malfunctions that impact a ship’s ability to support required mission areas and suggest a deficiency in mission-essential equipment. 47To estimate the trends, we fit time-series regression models with autoregressive errors to monthly casualty report data. We used these models to estimate the trends separately for overseas- and U.S.-homeported ships. See app. VI for more details. 48We compared cruisers, destroyers, and amphibious ships; we excluded mine countermeasures ships and patrol coastal ships because these ship classes have had limited recent experience deploying from U.S. homeports, according to Navy officials.
Degraded Ship Condition

rate for overseas-homeported ships compared to U.S.-homeported ships (about 1 additional casualty report a year). For example, while overseas-homeported ships had lower daily average numbers of casualty reports per ship from 2009 through 2012, over the past 2 years overseas-homeported ships have had more casualties than U.S.-homeported ships, indicating that these ships may have lower material condition when compared to U.S.-homeported ships and a worsening trend in overall ship readiness (see fig. 6).
Page 27 GAO-15-329 Navy Force Structure
49
Figure 6: Average Daily Casualty Reports for U.S.- and Overseas-Homeported Ships, January 2009–July 2014
Note: Our analysis may not be fully representative of 2014’s casualty reports since it is based on 7 months of data (January 2014 through July 2014). These were the latest data available at the time of our review. We compared cruisers, destroyers, and amphibious ships; we excluded mine countermeasures ships and patrol coastal ships because these ship classes have had limited recent experience deploying from U.S. homeports, according to Navy officials.
49The casualty report data also show that mission-critical reports (categories 3 and 4) make up a small proportion of the average number of casualty reports per ship. For example, in 2014 the average number of casualty reports for all ships was about 27 and the mission critical reports account for about 1.0 of these.
Our analysis showed that casualty reports have nearly doubled for both overseas-homeported ships and U.S.-homeported ships over the past 5 years. To further analyze these observed differences over time, we conducted a multivariate statistical analysis that held constant certain factors that varied across ships and over time (see app. VI). Based on this analysis, we estimated that overseas-homeported ships had, on average, about 25 (+/-11.6) casualty reports and U.S.-homeported ships had about 20 (+/-1.7).
Page 28 GAO-15-329 Navy Force Structure
50 However, these numbers of casualty reports for U.S.- and overseas-homeported ships are not statistically distinguishable from one another. The casualty reports over the past 5 years comprise mostly category 2 casualty reports. We found that category-2 casualties—those that indicate that a deficiency exists in mission-essential equipment that causes a minor degradation in a ship’s primary mission or a major degradation or total loss of a secondary mission—are much more prevalent than more-serious category 3 and 4 casualties.51 For example, in 2014, we found that the average number of casualty reports for all ships was about 27, and category 3 and 4 reports accounted for about 1.0 of these. Navy officials acknowledged the increasing amount of casualty reports on Navy ships and a worsening trend in material ship condition. They stated that casualties require unscheduled maintenance and have a negative impact on fleet operations since there is an associated capability or capacity loss. Additionally, officials noted that two factors may have contributed to this increase, including (1) a cultural shift in the Navy emphasizing the timely identification and reporting of casualties and (2) adoption of an automated system for reporting casualties beginning in 2010, which may have made it easier to report casualties.
50The differences between these estimates are not statistically significant at the 95 percent confidence level. We completed a statistical analysis of these differences that held constant all ship characteristics that did not change over time, such as class and year commissioned. In addition, the analysis held constant all changes over time observed among all ships. See app. VI for more details. 51The Navy has three categories of casualty reports. Category 3 casualty reports indicate that a deficiency exists in mission-essential equipment that causes a major degradation, but not the loss of a primary mission. Category 4 casualty reports indicate that a deficiency exists in mission-essential equipment that causes a loss of at least one primary mission.
In addition, the ships homeported overseas get lower scores when inspected than U.S.-homeported ships. In addition to analyzing the reports of equipment casualties reported by the ships themselves, we also reviewed surface and amphibious ships’ inspection reports conducted in fiscal years 2007 through 2014. The Navy uses material inspection reports from the Board of Inspection and Survey (INSURV), the Navy’s ship-inspection entity, to determine the condition of ships. Ships undergo INSURV inspections about once every 6 years.
Page 29 GAO-15-329 Navy Force Structure
52 The data gathered include inspection results for structural components, individual pieces of equipment, and broad systems, as well as assessments of a ship’s warfighting capabilities. The Navy uses INSURV data to make life-cycle decisions on whether to retain or decommission Navy ships.53 INSURV assigns ships an overall inspection score—the INSURV Figure of Merit—which is a single-number representation of the ship’s overall material condition and represents a ranking of this condition relative to other ships. These scores are based on inspection of a ship’s functional areas (e.g., propulsion, information systems, weapons) and performance on various operational demonstrations (e.g., steering, full power ahead, gunnery firing). We found that ships homeported overseas have lower overall Figure of Merit scores and are rated lower in 62 percent of the functional areas and demonstrations.54 For example, ships homeported overseas had lower scores in functional areas, such as information systems and operations, and demonstrations, such as steering and anchoring. For a detailed presentation of the differences between Figure of Merit, functional area, and demonstration scores for ships homeported in the United States and overseas, see appendix VII.
52Office of the Chief of Naval Operations Instruction 4730.5R, Trials and Material Inspections of Ships Conducted by the Board of Inspection and Survey (May 27, 2014). 53Life-cycle readiness is a ship’s ability to achieve its expected service life. 54We compared cruisers, destroyers, and amphibious ships; we excluded mine countermeasures ships and patrol coastal ships because these ship classes have had limited recent experience deploying from U.S. homeports, according to Navy officials. Naval Forces Europe officials noted that, as of April 2015, destroyers homeported in Rota, Spain, had not yet completed an INSURV inspection. Because of the relatively small number of ships that were inspected during this period and, in particular, the small sample of ships homeported overseas, we did not conduct a statistical analysis of these data using the methods we used to analyze costs and ship conditions. Instead, we calculated simple descriptive statistics to characterize differences between ships homeported overseas and in the United States.
The Navy has not identified or mitigated the risks its increasing reliance on overseas homeporting poses to its force over the long term. We found that, due to the high pace of operations the Navy uses for overseas-homeported ships, some of these ships have had consistently deferred maintenance that has resulted in long-term degraded material condition and increased maintenance costs, and could shorten the ships’ service lives. The Navy is implementing a revised operational schedule for U.S.-based ships that is intended to lengthen time between deployments, citing the need for a sustainable schedule. However, the Navy has not determined how—or whether—it will apply a more sustainable schedule to all ships homeported overseas. Additionally, although the Navy’s decision processes for moving individual ships overseas identifies actions and resources needed, the Navy does not assess risks such moves pose to costs, readiness, or expected service life of ships that it can expect based on its historical experience of increased operational tempo for ships homeported overseas.
We found that some ships homeported overseas had consistently deferred maintenance, which causes long-term degraded material condition and increases depot maintenance costs, and could shorten these ships’ service lives. Overseas-homeported ships are maintained differently than those homeported in the United States, which has led to maintenance deferrals and higher maintenance costs. Maintenance officials told us that the focus for ships homeported overseas is on mission readiness, so overseas-homeported ships place priority on the maintenance of combat systems, for example, while systems with the potential to reduce ship service life—such as fuel and ballast tanks that require extended in-port periods to properly maintain—are subject to maintenance deferrals in order to allow the ship to sustain a high operational tempo.
Page 30 GAO-15-329 Navy Force Structure
55 These officials added that if such systems are left
55The Navy has found that tank and void maintenance has a direct impact on ship service life. See, for example, Fleet Review Panel, Final Report, Fleet Review Panel of Surface Force Readiness (Feb. 26, 2010). Ballast tank spaces include seawater tanks for ballast and damage control, compensated fuel tanks, potable water storage, and combined holding tanks. Navy officials told us that they have improved the paint on ballast tanks, which could help mitigate some of these corrosion issues; however, the effects of these changes on the long-term material condition are not known.
The Navy Has Not Identified Costs and Risks Associated with the Increased Operational Tempo for Ships Homeported Overseas
Deferred Maintenance on Ships Homeported Overseas Has Degraded Ship Condition, Increased Costs, and Will Likely Reduce Ship Service Life
unmaintained, corrosion of these tanks and other lower-priority ship components can fester to a critical point where more costly replacement or overhaul is ultimately required. Deferring this maintenance may yield benefits like greater operational availability in the short term, but it may lead to higher depot-level maintenance costs or service-life implications in the longer term. This is consistent with what we found in September 2012 that deferring maintenance can affect ship readiness and increase the costs of later repairs. For example, we found that the Navy had calculated that deferring maintenance on ballast tanks to the next major maintenance period will increase costs approximately 2.6 times.
Page 31 GAO-15-329 Navy Force Structure
56
The systematic deferral of maintenance that occurs on some overseas-homeported ships can also lead to situations where it becomes cost-prohibitive to keep a ship in service, which could result in retiring a ship before it reaches its expected service life. To better understand the extent of deferred maintenance on surface and amphibious ships, we analyzed the average ratio of executed to required labor days for maintenance on ships homeported overseas and in the United States. We found that, while cruisers and destroyers homeported overseas have their required maintenance executed at a higher rate than their U.S.-homeported counterparts, the amphibious ships homeported overseas have maintenance executed at a rate that is both much lower than what is required and much lower than what is executed on U.S.-homeported amphibious ships.57 Navy officials said that the results of our analysis are consistent with the historical high operational tempo and utilization of amphibious ships while they are homeported overseas.
A July 2014 Navy report to Congress stated that high operational tempo causes unplanned wear on equipment, which can reduce the expected
56GAO, Military Readiness: Navy Needs to Assess Risks to Its Strategy to Improve Ship Readiness, GAO-12-887 (Washington, D.C.: Sept. 21, 2012). 57We found that the average ratio of executed to required labor days for U.S.-homeported cruisers is .71 compared to .96 for overseas-homeported cruisers. We found that the average ratio of executed to required labor days for U.S.-homeported destroyers is .76 compared to .86 for overseas-homeported destroyers. We found that the average ratio of executed to required labor days for U.S.-homeported amphibious ships is .99 compared to .73 for overseas-homeported amphibious ships.
service life of ships.
Page 32 GAO-15-329 Navy Force Structure
58 Propulsion, electrical generation, and combat systems (e.g., radars and sonars) are used more extensively when a ship is under way, and rough sea states can induce more stress on a ship and its systems. The report adds that recovering this service life requires longer and more costly maintenance periods, which strain the maintenance base and compress time available for operations and training. Other Navy reports, such as the February 2010 Admiral Balisle surface ship readiness report, highlight the negative effects of high operational tempo, namely the reduction in expected service life for given ship classes, and a July 2011 Center for Naval Analyses study found that increases in operational tempo require increases in depot-level maintenance.59
Moreover, the Navy Surface Maintenance Engineering Planning Program, which oversees maintenance requirements for surface and amphibious ships and monitors life-cycle repairs, has found that the current maintenance strategy for amphibious ships homeported overseas will jeopardize their attainment of expected service lives.60 Specifically, the program found that the primary shortfall of the current strategy is that it does not include scheduled dry-docking periods necessary to conduct large scale tank and void maintenance while homeported in Sasebo, Japan. This, along with other contributing factors such as the ships’ high operational tempo, has led to overall degraded material condition of amphibious ships homeported there. For example, Navy officials stated that maintenance on the USS Essex, an amphibious assault ship, had been systematically deferred while the ship was homeported in Japan from June 2000 through February 2012, causing the ship to require the costliest depot maintenance work in surface Navy history when it returned to the United States (see fig. 7). During this depot maintenance period, the Essex required over twice the amount of maintenance work the Navy expected to perform. According to the Navy Surface Maintenance
58U.S. Navy, Report to Congress: Naval Vessels and the Force Structure Assessment. 59See Fleet Review Panel, Final Report, Fleet Review Panel of Surface Force Readiness (Feb. 26, 2010), and Center for Naval Analyses, The Effects of Operational Tempo on Ship Depot Requirements (July 2011). 60See, for example, Navy Surface Maintenance Engineering Planning Program, Technical Foundation Paper for LPD-17 Class Revised Type Commander Notionals (Mar. 8, 2011).
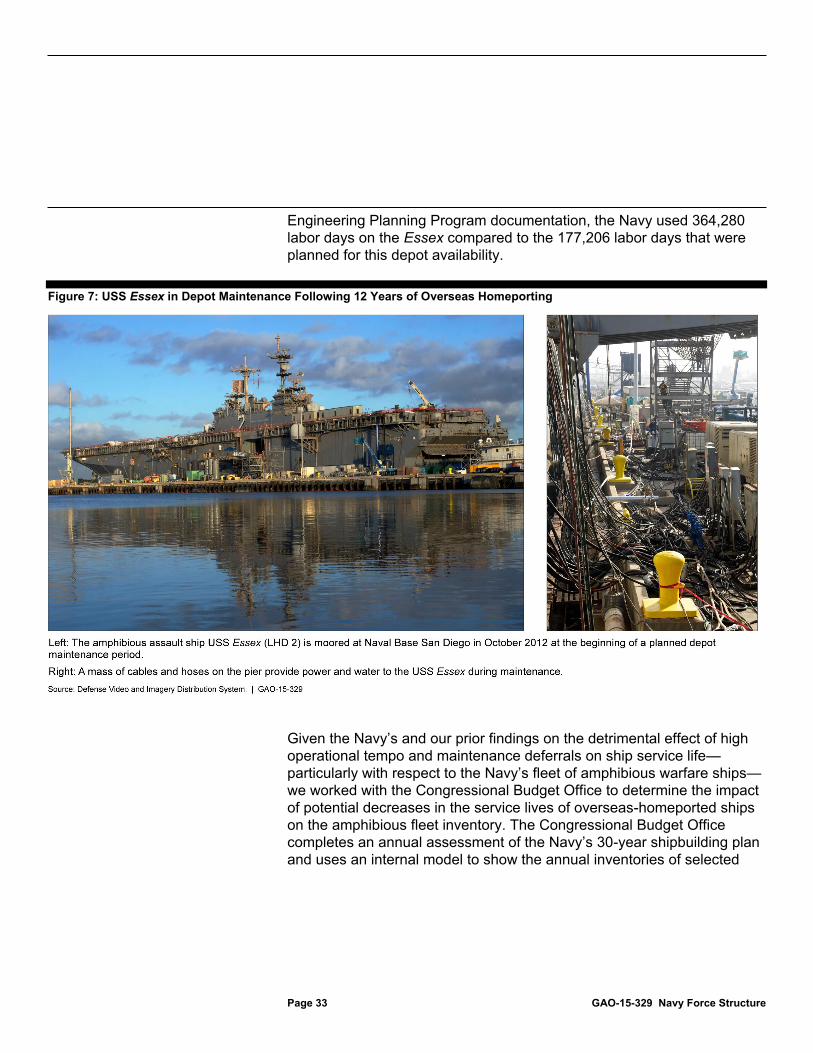
Engineering Planning Program documentation, the Navy used 364,280 labor days on the Essex compared to the 177,206 labor days that were planned for this depot availability.
Figure 7: USS Essex in Depot Maintenance Following 12 Years of Overseas Homeporting
Page 33 GAO-15-329 Navy Force Structure
Given the Navy’s and our prior findings on the detrimental effect of high operational tempo and maintenance deferrals on ship service life—particularly with respect to the Navy’s fleet of amphibious warfare ships—we worked with the Congressional Budget Office to determine the impact of potential decreases in the service lives of overseas-homeported ships on the amphibious fleet inventory. The Congressional Budget Office completes an annual assessment of the Navy’s 30-year shipbuilding plan and uses an internal model to show the annual inventories of selected

categories of ships under the Navy’s plan and how they align with the Navy’s goals for those categories of ships.
Page 34 GAO-15-329 Navy Force Structure
61 We asked the Congressional Budget Office to use its model to deduct 6 years from the service lives of the Amphibious Ready Group (one amphibious assault ship, two dock landing ships, and one amphibious transport dock ship) homeported in Sasebo, Japan, in order to illustrate the effects of these potential losses in service life on the amphibious fleet inventory. We deducted 6 years of service life based on discussions with Navy fleet and headquarters officials with the goal of choosing an appropriate time frame to illustrate the potential effects of reducing ship surface lives. For example, the upper time-frame limit we considered was based on the Navy’s prior proposal to retire an amphibious ship homeported overseas 16.5 years prior to the end of its expected service life.62 Navy officials agreed that 6 years is a reasonable time frame for illustrative purposes. We recognize that this is one potential outcome if the Navy chooses not to make the significant investments in depot maintenance that would be required to mitigate the effects on the service lives of ships returning from overseas homeports. According to the Navy, a minimum force of 33 amphibious ships represents the limit of acceptable risk in meeting amphibious assault force requirements. Figure 8 shows the results of the Congressional Budget Office analysis and that, if the overseas-homeported amphibious ships do not achieve their expected service lives, the Navy would not meet its goal for amphibious ship inventory beginning in 2035, and would worsen the gap projected by the Navy.
61Congressional Budget Office, An Analysis of the Navy’s Fiscal Year 2015 Shipbuilding Plan (December 2014). See the Scope and Methodology section for information related to the Congressional Budget Office’s shipbuilding plan model. 62In its fiscal year 2013 budget request, the Navy proposed decommissioning the USS Tortuga—a dock landing ship homeported overseas from March 2006 through September 2013—in 2014, which would have meant decommissioning the ship with 16.5 years left in its expected service life. In a series of legislative actions, Congress raised questions about the Navy’s decision to decommission the Tortuga and other ships early.

Figure 8: Illustration of the Impact of a Potential 6-Year Decrease in Overseas-Homeported Amphibious Ships’ Service Lives
Page 35 GAO-15-329 Navy Force Structure
on the Amphibious Warfare Ship Inventory
The Navy has taken steps to mitigate the risks of high operational tempo on U.S.-homeported ships by developing the optimized fleet response plan, which seeks to instill predictable operational schedules conducive to ensuring ships are able to adequately address their training and maintenance requirements. However, the Navy has not determined how—or whether—it will apply the optimized fleet response plan to all ships homeported overseas. The Navy recognizes that the current high operational tempo and long deployments of its U.S.-homeported ships are unsustainable over the long term, placing strain on sailors and their families, and constraining the ability to complete the required
The Navy Is Taking Steps to Address High Operational Tempo for U.S.-Homeported Ships but Has Not Determined Whether Those Steps Will Apply to All Ships Homeported Overseas
maintenance that is necessary for ships to reach their expected service lives.
Page 36 GAO-15-329 Navy Force Structure
63 For example, the Navy lengthened deployments in direct response to world events, such as operations in Iraq and Afghanistan over the past decade and the crisis in Syria in 2013.
In November 2014, the Navy issued a new policy establishing responsibility for the execution of the optimized fleet response plan, noting in the policy that changes in the global landscape have demonstrated the need for an optimized process to ensure continuous availability of manned, maintained, equipped, and trained Navy forces capable of surging forward to respond to combatant commander forward-presence requests while also maintaining long-term sustainability of the force.64 The Navy’s optimized fleet response plan seeks to provide a more sustainable force-generation model for Navy ships, as it reduces deployment lengths and injects more predictability for maintenance and training into ship schedules. According to the policy, this framework establishes a readiness-generation cycle that operationally and administratively aligns forces while aligning and stabilizing manning, maintenance and modernization, logistics, inspections and evaluations, and training. According to Navy officials, adherence to this new force-generation model is necessary in order to protect the long-term readiness and sustainability of the force. As a result, it is implementing, beginning in 2014, a revised operational schedule, referred to as the optimized fleet response plan, which is based on a 36-month cycle, with 7-month deployments for U.S.-homeported ships and designated periods for crew training and ship maintenance (see fig. 9).
63Commander, U.S. Fleet Forces Command, Optimized Fleet Response Plan Update (July 3, 2014). 64Chief of Naval Operations Instruction 3000.15A, Optimized Fleet Response Plan (Nov. 10, 2014).

Figure 9: Comparison of Fleet Response Plan and Planned Navy Optimized Fleet
Page 37 GAO-15-329 Navy Force Structure
Response Plan Operational Cycle for Surface Combatants Homeported in the United States as of February 2015
Note: Percentages do not add up to 100 due to rounding.
While the Navy has recognized the challenges the high pace of operations poses to the U.S.-based fleet and has begun implementing the optimized fleet response plan for carrier strike groups65 deployed from U.S. homeports, according to Pacific Fleet and Fleet Forces Command officials, it has not determined how—or whether—it will apply the optimized fleet response plan or a similar sustainable operational schedule to all ships homeported overseas.66 As discussed earlier, we found that the high pace of operations the Navy uses for overseas-homeported ships limits their dedicated training and maintenance periods, which has resulted in difficulty keeping crews fully trained and ships maintained. In addition, we found that casualty reports for both U.S.- and overseas-homeported ships have doubled over the past 5 years, with the material condition of overseas-homeported ships having decreased slightly faster than U.S.-homeported ships. Navy officials told us they are
65Carrier strike groups typically include an aircraft carrier with an air wing, two destroyers, a cruiser, a submarine, and a support ship. 66The U.S. Pacific Fleet and U.S. Fleet Forces Command organize, man, train, maintain, and equip Navy forces, develop and submit budgets, and develop required and sustainable levels of fleet readiness, with U.S. Fleet Forces Command serving as the lead for fleet training requirements and policies to generate combat-ready Navy forces.

considering changes to the operational schedules of overseas-homeported ships but, as of February 2015, have not finalized and implemented any formal changes. In March 2015, Fleet Forces Command approved an optimized fleet response plan for the four destroyers homeported in Rota, Spain, to help resolve potential training and maintenance concerns. This schedule, however, applies to only 4 of the 40 surface and amphibious ships the Navy plans to homeport overseas by the end of fiscal year 2015. Further, Navy officials told us that ships homeported overseas are expected to continue their high levels of utilization and expressed concerns about the service’s ability to adhere to a more disciplined operational schedule in light of ever-increasing demands for naval forces from the combatant commanders. Navy officials also cited instances when requests for forces from combatant commanders, and other emergent needs, have resulted in DOD-directed extensions of deployments and activations of ships that were not scheduled for deployment. Without an operational schedule that balances presence demands and long-term sustainability for ships homeported overseas, the Navy risks continuing the pattern of deferred ship maintenance that leads to higher maintenance costs over the long term and threatens achievement of full ship service lives.
The Navy has not assessed the costs and risks its increasing reliance on overseas homeporting poses to its force over the long term. Office of the Chief of Naval Operations Instruction 3111.17 details the Navy’s multistep process for assessing potential homeport decisions; this process produces the annual Strategic Laydown and Dispersal Plan (strategic laydown plan) which projects ship homeports 10 years into the future.
Page 38 GAO-15-329 Navy Force Structure
67 During development of the plan, the Navy draws on policy, planning, programming, budget, and strategic documents, such as the Navy force-structure assessment and the 30-year shipbuilding plan, to recommend assigning ships to specific homeports. The strategic laydown process involves a range of stakeholders, including representatives from the Navy staff, Fleet Forces Command, Pacific Fleet, Naval component commanders, and Navy Installations Command.68 These stakeholders
67See app. IV for an expanded discussion of the Navy’s complete homeporting process. 68Office of the Chief of Naval Operations Instruction 3111.17, Strategic Laydown and Dispersal Plan for the Operating Forces of the U.S. Navy.
The Navy Has Not Assessed Long-Term Operations and Support Costs or Risks to Ship Condition and Service Life Posed by Overseas Homeporting

evaluate potential homeporting decisions across a range of criteria, including enhancing the overall operational availability and efficiency of Navy forces, aligning capability with combatant commanders’ needs, and maximizing the use of existing infrastructure.
However, officials explained that the strategic laydown process primarily focuses on short-term requirements, such as the need for pier space, housing, and maintenance facilities, and related near-term resource needs. We found that the Navy does not assess the long-term effect on operations and support costs or the risks posed to readiness and expected ship service life in light of historical execution trends and high operational tempo of ships that are homeported overseas. Additionally, senior Navy officials explained that they would benefit from a more thorough understanding of the risks and operational implications associated with their increasing reliance on overseas homeporting to meet combatant commander presence demands. Further exacerbating the strain on its fleet, the Navy reported in July 2014 that it intends to increase the number of ships homeported overseas to respond to increasing combatant commander demands for forward naval presence.
Page 39 GAO-15-329 Navy Force Structure
69 Federal standards for internal control state that decision makers should comprehensively identify risks associated with achieving program objectives, analyze them to determine their potential effect, and decide how to manage the risk and identify mitigating actions. According to the standards, this is an ongoing process, since operating conditions continually change.70
Without a comprehensive assessment that identifies and assesses long-term costs, readiness, and force-structure effects on the Navy’s surface and amphibious fleet from its increasing reliance on overseas homeporting, the Navy lacks information needed to make any necessary adjustments to its overseas force structure or informed homeporting decisions in the future. Having such an assessment would help decision makers to identify and mitigate risks posed by increased long-term operations and support costs; deferred maintenance and truncated
69U.S. Navy, Report to Congress: Naval Vessels and the Force Structure Assessment. 70GAO/AIMD-00-21.3.1.
training periods; and degraded material condition of the ships, increased maintenance requirements, and reduced ship service life.
Today’s fleet of surface combatants and amphibious warfare ships provides core capabilities that enable the Navy to fulfill a wide array of missions—all through forward presence. With combatant commanders’ demand for forward presence at historically high levels and growing, the Navy has chosen to make several near-term decisions, including extending deployments and assigning more surface and amphibious ships to overseas homeports, to meet presence demands with its existing force structure. It is also in the process of considering various homeporting options for its new class of destroyers, the DDG 1000. While homeporting ships overseas provides considerable additional naval presence in a forward area of operations and other near-term benefits—when compared with homeporting ships in the United States—it increases costs and decreases crew and ship readiness in the near term and degrades the material condition of the ships over the long term, possibly threatening their ability to reach their intended service lives, particularly in the amphibious fleet. To address concerns, the Navy has developed the optimized fleet response plan, citing the need for a schedule that is sustainable over the long term, with more predictability for maintenance and training and improved quality of life for sailors. The Navy is implementing this revised operational schedule for U.S.-based ships and approved in March 2015 a revised schedule for the four destroyers homeported in Rota, Spain; however, it has not determined how—or whether—it will apply a more sustainable schedule to its 36 surface and amphibious ships homeported overseas outside of Rota, Spain. The Navy also has not fully identified and mitigated risks to its force structure associated with its increasing reliance on overseas homeporting. The Navy’s process for determining where to homeport ships focuses on the short-term resource needs of these decisions, but it does not assess long-term costs or risks to readiness and ship service life that can result from the high operational tempo of ships homeported overseas. If the Navy does not have an operational schedule that balances presence demands and long-term sustainability for ships homeported overseas and has not conducted a comprehensive assessment of the risks that overseas homeporting poses to its surface and amphibious ship force structure, it risks incurring higher operations, support, and infrastructure costs, reducing ship service lives, and potentially exacerbating strains on its fleet and shipbuilding budget over the long term. Further, if the Navy does not include such risk assessments when making future force-
Page 40 GAO-15-329 Navy Force Structure
Conclusions

structure decisions, it risks returning to a more costly and less sustainable operational schedule as it adjusts its presence overseas.
To balance combatant commanders’ demands for forward presence with the Navy’s needs to sustain a ready force over the long term and identify and mitigate risks consistent with Federal Standards for Internal Control, we recommend that the Secretary of Defense direct the Secretary of the Navy to take the following two actions:
· to fully implement its optimized fleet response plan, develop and implement a sustainable operational schedule for all ships homeported overseas; and
· develop a comprehensive assessment of the long-term costs and risks to the Navy’s surface and amphibious fleet associated with its increasing reliance on overseas homeporting to meet presence requirements, make any necessary adjustments to its overseas presence based on this assessment, and reassess these risks when making future overseas homeporting decisions and developing future strategic laydown plans.
In written comments on a draft of this report, DOD concurred with our two recommendations. In its comments, DOD stated that it concurred with the overall findings of the report and noted that the decision to accept risks, such as deferred maintenance and increased consumption of service life, was based on the operational decision to provide increased presence to meet combatant commander requirements. DOD’s comments are summarized below and reprinted in their entirety in appendix VIII. DOD also provided technical comments, which we have incorporated as appropriate.
DOD concurred with our recommendation to develop and implement a sustainable operational schedule for ships homeported overseas. In its comments, DOD stated that Fleet Forces Command in March 2015 approved an optimized fleet response plan for the four destroyers homeported in Rota, Spain. We modified the report to note that the Navy had approved a revised operational schedule for 4 of the 40 surface and amphibious ships the Navy plans to homeport overseas by the end of fiscal year 2015. DOD stated that the formal review of optimized fleet response plans for the remaining ships homeported overseas will be scheduled for a future date.
Page 41 GAO-15-329 Navy Force Structure
Recommendations for Executive Action
Agency Comments and Our Evaluation

DOD also concurred with our recommendation to develop a comprehensive assessment of the long-term costs and risks to the Navy’s surface and amphibious fleet associated with its increasing reliance on overseas homeporting. DOD stated that the Navy will conduct an assessment of the long-term costs and risk of overseas homeporting and incorporate that into future homeporting decision processes.
We are sending copies of this report to the appropriate congressional committees, the Secretary of Defense, and the Secretary of the Navy. In addition, the report is available at no charge on the GAO website at http://www.gao.gov.
If you or your staff have any questions about this report, please contact me at (202) 512-3489 or at [email protected]. Contact points for our Offices of Congressional Relations and Public Affairs may be found on the last page of this report. Key contributors to this report are listed in appendix IX.
John H. Pendleton Director Defense Capabilities and Management
Page 42 GAO-15-329 Navy Force Structure
List of Committees
The Honorable John McCain Chairman The Honorable Jack Reed Ranking Member Committee on Armed Services United States Senate
The Honorable Thad Cochran Chairman The Honorable Richard Durbin Ranking Member Subcommittee on Defense Committee on Appropriations United States Senate
The Honorable Mac Thornberry Chairman The Honorable Adam Smith Ranking Member Committee on Armed Services House of Representatives
The Honorable Rodney Frelinghuysen Chairman The Honorable Pete Visclosky Ranking Member Subcommittee on Defense Committee on Appropriations House of Representatives
Page 43 GAO-15-329 Navy Force Structure

Appendix I: The Navy’s Use of Rotational Crewing
The Navy has used rotational crewing—the practice of using more than one crew to operate a single ship—for over 40 years on its ballistic-missile submarines, but did not begin using this crewing concept in the surface fleet until the mid-1990s and has limited its use to a small number of ships and ship types.
Page 44 GAO-15-329 Navy Force Structure
1 Specifically:
· Mine countermeasures ships began using rotational crewing in the 1990s in Japan and the Persian Gulf, and patrol coastal ships began using rotational crewing in 2003 in the Persian Gulf. These ship classes discontinued the use of rotational crewing in 2013 with fleet managers stating that having permanent crews led to improved material condition of the ships.
· The Navy is using rotational crewing on its new class of surface ship, the littoral combat ship. In March 2013, the Navy deployed its first littoral combat ship—USS Freedom—to Singapore for 10 months for the first-ever overseas-based operational deployment of the ship class. The USS Freedom Blue and Gold crews executed a crew turnover midway through the deployment in the port of Sembawang in Singapore (see fig. 10). The program is rotating three crews between every two ships, one of which will be operating forward, beginning with the deployment of USS Fort Worth to Singapore in November 2014. The Navy plans to rotationally crew littoral combat ships in Bahrain by 2018 in addition to Singapore.
1For a discussion of the various types of rotational crewing constructs, see GAO, Force Structure: Ship Rotational Crewing Initiatives Would Benefit from Top-Level Leadership, Navy-wide Guidance, Comprehensive Analysis, and Improved Lessons-Learned Sharing, GAO-08-418 (Washington, D.C.: May 29, 2008).
Appendix I: The Navy’s Use of Rotational Crewing
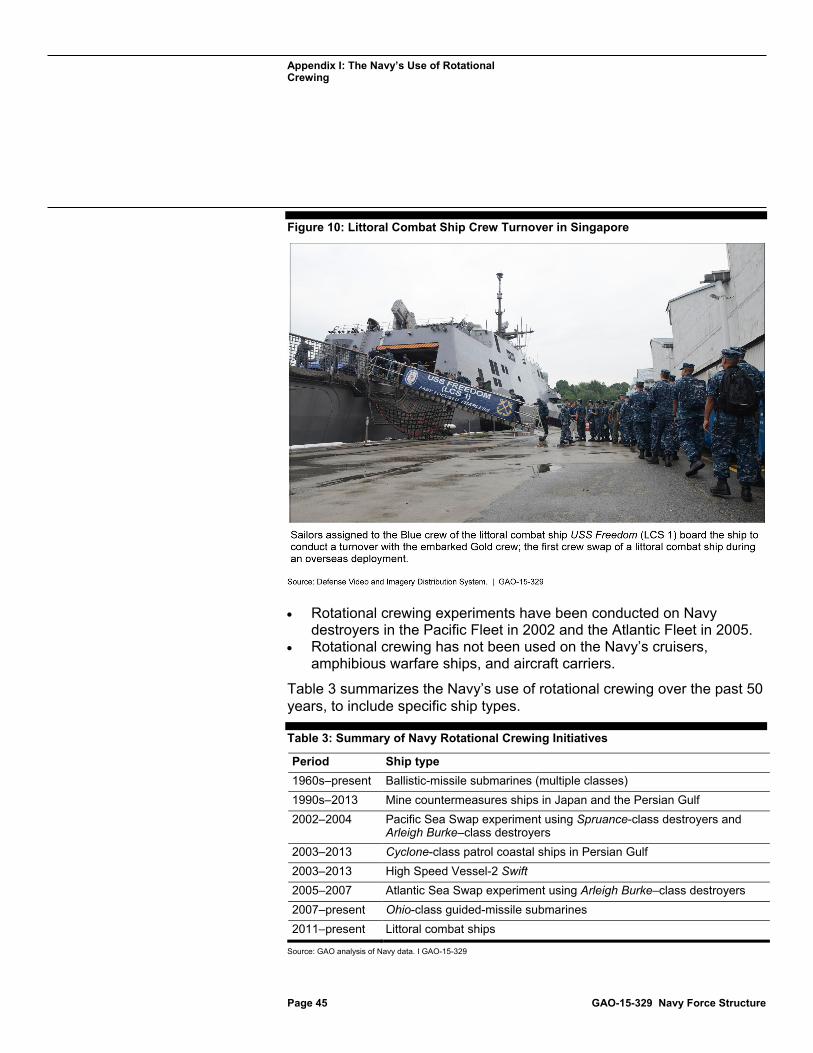
Appendix I: The Navy’s Use of Rotational Crewing
Figure 10: Littoral Combat Ship Crew Turnover in Singapore
Page 45 GAO-15-329 Navy Force Structure
· Rotational crewing experiments have been conducted on Navy destroyers in the Pacific Fleet in 2002 and the Atlantic Fleet in 2005.
· Rotational crewing has not been used on the Navy’s cruisers, amphibious warfare ships, and aircraft carriers.
Table 3 summarizes the Navy’s use of rotational crewing over the past 50 years, to include specific ship types.
Table 3: Summary of Navy Rotational Crewing Initiatives
Period Ship type 1960s–present Ballistic-missile submarines (multiple classes) 1990s–2013 Mine countermeasures ships in Japan and the Persian Gulf 2002–2004 Pacific Sea Swap experiment using Spruance-class destroyers and
Arleigh Burke–class destroyers 2003–2013 Cyclone-class patrol coastal ships in Persian Gulf 2003–2013 High Speed Vessel-2 Swift 2005–2007 Atlantic Sea Swap experiment using Arleigh Burke–class destroyers 2007–present Ohio-class guided-missile submarines 2011–present Littoral combat ships
Source: GAO analysis of Navy data. I GAO-15-329

Appendix II: Overview of Navy Ships Used in Our Comparative Analyses
Page 46 GAO-15-329 Navy Force Structure
Appendix II: Overview of Navy Ships Used in Our Comparative Analyses

Appendix II: Overview of Navy Ships Used in Our Comparative Analyses
Page 47 GAO-15-329 Navy Force Structure

Appendix III: Scope and Methodology
To determine the operational benefits, costs, and readiness effects, if any, of homeporting ships in the United States and overseas, we selected surface combatants and amphibious warfare ships from the following ship classes for inclusion in our review: guided-missile cruisers (CG 47 class), guided-missile destroyers (DDG 51 class), littoral combat ships (LCS class), mine countermeasures ships (MCM 1 class), patrol coastal ships (PC 1 class), amphibious assault ships (LHA 1 and LHD 1 classes), amphibious transport dock ships (LPD 4 and LPD 17 classes), dock landing ships (LSD 41 and LSD 49 classes), and amphibious command ships (LCC 19 class).
Page 48 GAO-15-329 Navy Force Structure
1 These ships represent over half of the Navy fleet and provide a variety of capabilities, sizes, missions, and histories of overseas homeporting. We compared the operational benefits, costs, and readiness effects of the different homeporting assignments for these ship classes using a variety of factors—including operational tempo, ship operations and support costs, casualty reports, readiness inspection scores, and maintenance execution rates. Specifically, Navy officials provided the following data from authoritative Navy sources:
· Navy Visibility and Management of Operating and Support Costs—operations and support costs per ship in constant fiscal year 2014 dollars, fiscal years 2004 through 2013;2
· Navy Energy Usage Reporting System—deployed underway days per ship, fiscal years 2003 through 2012;
· Commander, Navy Installations Command—family housing, operation and maintenance, and military construction costs by overseas homeport location, fiscal years 2009 through 2018 (programmed);
· Fleet Forces Command—daily numbers of casualty reports per ship, January 2009 through July 2014;
· Board of Inspection and Survey—material inspection data per ship, fiscal years 2007 through 2014; and
1We excluded aircraft carriers from the scope of this engagement due to the limited sample size; we excluded submarines because their operational metrics are classified. There are submarines and their support ships homeported in Guam, a U.S. territory, and a submarine support ship homeported in Diego Garcia, but these support ships are also not included in our review since they are operated by the Military Sealift Command. 2Naval Sea Systems Command adjusted the historical operations and support costs for inflation to fiscal year 2014 constant dollars, using the appropriate Navy inflation factors.
Appendix III: Scope and Methodology

Appendix III: Scope and Methodology
· Office of the Chief of Naval Operations—maintenance execution rates, life of each ship.
We selected the time frames for each of the data series above after assessing their availability and reliability to maximize the amount of data available for us to make meaningful comparisons. We assessed the reliability of each of the data sources. The Navy provided information based on our questions regarding data reliability, including information on an overview of the data, data-collection processes and procedures, data quality controls, and overall perceptions of data quality. The Navy provided documentation of how the systems are structured and what written procedures are in place to help ensure that the appropriate information is collected and properly categorized. Additionally, we interviewed Navy officials to obtain further clarification on data reliability, discuss how the data were collected and reported, and explain how we planned to use the data. After assessing the data, we determined that they were sufficiently reliable for the purposes of reporting the operational benefits, costs, and readiness effects of homeporting ships in the United States and overseas.
For our comparative analyses, we focused on comparisons between cruisers, destroyers, and amphibious warfare ships (amphibious assault ships, amphibious transport dock ships, dock landing ships, and amphibious command ships) homeported in the United States and those homeported overseas because these historically have been the ship classes most commonly homeported overseas and, therefore, the Navy has the most robust data available for them. We did not include mine countermeasures ships and patrol coastal ships in our comparative analysis because these ship classes have had relatively little recent experience deploying from U.S. homeports over the past 5 years, according to Navy officials, and limited comparative data were available.
Page 49 GAO-15-329 Navy Force Structure
3 To understand the effects of overseas homeporting on infrastructure investments and base operating costs, we examined Navy documentation, such as leadership briefings on several recent decisions to move ships to overseas homeports from 2009 through 2014 where
3Naval Forces Europe officials explained that, as of April 2015, only two destroyers had been operating from homeports in Rota, Spain, for a year or less, and therefore limited operational data were available to draw conclusions for ships based in Rota, Spain.
Appendix III: Scope and Methodology
officials stated additional infrastructure was required. These moves included decisions to homeport destroyers in Rota, Spain, and patrol coastal and mine countermeasures ships in Bahrain. We also analyzed cost data from 2009 through 2014, which includes these ship moves, for family housing, operation and maintenance, and military construction at overseas homeports. We assessed these data by reviewing Navy documentation and discussing with Navy officials data-collection processes and procedures and determined that they were reliable for the purposes of reporting the infrastructure investments and operating costs for overseas-homeported ships. We also obtained and analyzed Navy policies and procedures for determining surface force readiness and ship operational cycles.
Page 50 GAO-15-329 Navy Force Structure
4
We also analyzed the economic effects of homeporting ships overseas; specifically, the decreases in maintenance labor hours in the United States that results from maintenance work being performed in foreign shipyards while Navy ships are homeported overseas. To do so, we obtained the projected maintenance workload for the large surface combatants—destroyers moving from U.S. homeports to Rota, Spain (four ships) and Yokosuka, Japan (two ships)—from the Office of the Chief of Naval Operations for the approximately 7- to 10-year period these ships are expected to be homeported overseas. Rota, Spain, and Yokosuka, Japan, represent the only overseas homeports that the Navy plans to relocate ships to in the next several years. We converted this number of maintenance labor hours into full-time equivalents. For this analysis, we assumed 2,080 hours of work per full-time equivalent, recognizing that ship repair industry workers receive vacation and holidays but also work high levels of overtime, according to Navy officials. We also applied the fiscal year 2014 labor rates associated with shipyards in each port that the destroyers were leaving in the United States—Norfolk, Virginia; Mayport, Florida; and San Diego, California—to determine the annual economic losses in U.S. shipyards in terms of maintenance expenditures and full-time equivalents. We calculated maintenance losses based on revenue transfers from labor and did not
4See, for example, Commander, Naval Surface Force U.S. Pacific Fleet / Commander, Naval Surface Force Atlantic, Instruction 3502.3, Surface Force Readiness Manual (Mar. 9, 2012), and Commander, U.S. Fleet Forces Command, and Commander, Pacific Fleet, Instruction 3000.15, Fleet Response Plan (2007).

Appendix III: Scope and Methodology
include material cost-related transfers because Navy officials explained that some portion of the material could be purchased in the United States.
We interviewed officials from the Naval Sea Systems Command; Commander, Naval Surface Force, U.S. Pacific Fleet; Commander, Naval Surface Force, U.S. Atlantic Fleet; Fleet Forces Command; U.S. Pacific Fleet; 5th Fleet; 6th Fleet; and 7th Fleet to discuss these data, our analyses, and their observations on the costs, readiness effects, and operational benefits of homeporting ships overseas.
To assess the extent to which the Navy has identified and taken steps to mitigate any risks from homeporting ships overseas, we analyzed (1) key Navy and Department of Defense (DOD) guidance and policies for assigning ships to homeports in the United States and overseas and (2) the Navy’s required actions for evaluating, planning, and implementing changes to overseas force structure.
Page 51 GAO-15-329 Navy Force Structure
5 We interviewed Navy and State Department officials to discuss these documents and determine whether decision-making processes are in place and are being followed and what factors, data, and lessons learned the Navy considers in making these decisions. We also examined Navy force-structure requirements and the 2014 Navy Strategic Laydown and Dispersal Plan to understand the basing construct for Navy ships, as well as any planned changes to the laydown.6 We also analyzed previous Navy reports that studied the effect of high operational tempo, different deployment approaches, and deferred maintenance on the overall material condition of surface ships and on a ship’s service life.7
5See Office of the Chief of Naval Operations Instruction 3111.17, Strategic Laydown and Dispersal Plan for the Operating Forces of the U.S. Navy (Nov. 22, 2013), and Chairman of the Joint Chiefs of Staff Instruction 2300.02G, Coordination of Overseas Force Structure Changes and Host-Nation Notification (Sept. 4, 2012). 6The annual Navy Strategic Laydown and Dispersal Plan presents the projected homeports of the Navy’s operating forces by type and quantity for a 10-year period. See Office of the Chief of Naval Operations Instruction 3111.17, Strategic Laydown and Dispersal Plan for the Operating Forces of the U.S. Navy. 7See, for example, Fleet Review Panel, Final Report, Fleet Review Panel of Surface Force Readiness (Feb. 26, 2010).

Appendix III: Scope and Methodology
To illustrate the effect of potential decreases in ship service life on the amphibious fleet inventory, we worked with the Congressional Budget Office, which completes an annual assessment of the Navy’s 30-year shipbuilding plan and uses an internal model to show the annual inventories of selected categories of ships under the Navy’s plan and how they align with the Navy’s goals for those categories of ships.
Page 52 GAO-15-329 Navy Force Structure
8 The Congressional Budget Office published results of this model in December 2014 (see the upper panel of fig. 8). We asked the Congressional Budget Office to use the model to deduct 6 years from the service lives of the Amphibious Ready Group (one amphibious assault ship, two dock landing ships, and one amphibious transport dock ship) homeported in Sasebo, Japan, in order to determine the effects of these potential losses in service life on the amphibious fleet inventory. The Congressional Budget Office used its model to conduct this analysis and provided us with the outputs found in the lower panel of figure 8. We summarized the results, and Congressional Budget Office officials concurred that our representation accurately depicts the predicted effects of reduced service life on the amphibious fleet inventory. We deducted 6 years of service life based on our discussions with Navy fleet and headquarters officials regarding what constituted a reasonable reduction to a ship’s service life. For example, the upper time-frame limit we considered was based on the Navy’s prior proposal to retire an amphibious ship homeported overseas 16.5 years prior to the end of its expected service life. We recognize that this is one potential outcome if the Navy chose not to make the significant investments in depot maintenance required to mitigate effects to ship service life for ships returning from overseas homeports. We chose the Sasebo-based ships because this is the primary homeport for amphibious ships located outside of the United States. Finally, we also reviewed the Navy’s plan to implement a revised operational schedule—referred to as the optimized fleet response plan—and interviewed Navy officials to discuss this plan, its purpose, expected benefits, and impact on ships’ time allocated to maintenance, training, deployment, and operational
8Congressional Budget Office, An Analysis of the Navy’s Fiscal Year 2015 Shipbuilding Plan (December 2014).
Appendix III: Scope and Methodology
availability. We compared the Navy’s plans to criteria for risk assessment in federal standards for internal control.
Page 53 GAO-15-329 Navy Force Structure
9
We interviewed officials, and where appropriate obtained documentation, at the following locations:
Department of Defense
· Office of the Secretary of Defense
· Policy · Cost Assessment and Program Evaluation
· Joint Staff
Department of the Navy
· Office of the Chief of Naval Operations
· Global Force Management · Strategy and Plans · Logistics
· U.S. Fleet Forces Command · U.S. Pacific Fleet · Commander, Naval Surface Force, U.S. Pacific Fleet · Commander, Naval Surface Force, U.S. Atlantic Fleet · U.S. 5th Fleet · U.S. 6th Fleet · U.S. 7th Fleet · Commander, Navy Installations Command · Navy Region
· Japan · Europe, Africa, Southwest Asia, Detachment Bahrain
· Naval Sea Systems Command · Navy Surface Warfare Center, Corona · Surface Maintenance Engineering Planning Program · Board of Inspection and Survey
9GAO, Standards for Internal Control in the Federal Government, GAO/AIMD-00-21.3.1 (Washington, D.C.: November 1999).
Appendix III: Scope and Methodology
· Commander, Naval Regional Maintenance Center
Other Organizations
· U.S. State Department · Congressional Budget Office · RAND Corporation
We conducted this performance audit from June 2014 to May 2015 in accordance with generally accepted government auditing standards. Those standards require that we plan and perform the audit to obtain sufficient, appropriate evidence to provide a reasonable basis for our findings and conclusions based on our audit objectives. We believe that the evidence obtained provides a reasonable basis for our findings and conclusions based on our audit objectives.
Page 54 GAO-15-329 Navy Force Structure

Appendix IV: Overview of Navy’s Homeporting Process
The Navy’s process for assigning and changing ship homeports is illustrated in figure 11 below, with particular emphasis on moving a ship’s homeport from the United States to an overseas homeport. The Navy has historically assigned new ships entering its fleet a U.S. homeport. Based on strategic needs and priorities, it may change a ship’s homeport from the United States to one overseas. By fiscal year 2017, the Navy plans to have 41 ships homeported overseas.
Figure 11: The Navy’s Homeporting Process
Page 55 GAO-15-329 Navy Force Structure
The Navy’s Strategic Laydown and Dispersal Plan (strategic laydown plan) is intended to provide strategic rationale and guidance for subsequent, required actions to approve and implement a homeport change. The Navy’s recommendations for homeporting are based on 13 criteria, ranging from compliance with environmental laws to a consideration of planned military construction projects. The Navy updates
Appendix IV: Overview of Navy’s Homeporting Process
Appendix IV: Overview of Navy’s Homeporting Process
its strategic laydown plan annually and briefs the results of its plan to Congress each year.
From the strategic laydown plan, the lead fleet commander (either the United States Fleet Forces Commander or the United States Pacific Fleet Commander) provides a requirements letter to his or her respective command to initiate the early planning process for a homeport change. This includes the vetting of near-term needs to support the homeport change (i.e., what will be required in terms of manpower, logistics, budgeting, etc.) prior to recommending a new homeport by means of an Organization Change Request—the Navy’s official means for changing homeport designation.
The fleet commander then submits its Organization Change Request to the Chief of Naval Operations, who must approve it before final approval from the Secretary of the Navy. The Office of the Secretary of the Navy then submits the homeport change proposal in the form of an Overseas Force Structure Change to the Joint Staff and Office of the Secretary of Defense. According to Office of the Secretary of Defense officials, the Office of the Secretary of Defense must ensure resourcing requirements associated with the proposed Overseas Force Structure Change are clearly articulated and identify whether funding has been budgeted or programmed. The Joint Staff reviews the proposal to ensure it has a number of required elements, including cost estimates for the homeport change, prior coordination with the State Department on potential host-nation sensitivities, and an assessment of the impact on personnel and their families.
The combatant command that would be homeporting the ship in its area of operations must also conduct an assessment of political-military considerations, force structure, and infrastructure and short-term resource implications of the requested Overseas Force Structure Change to inform the Joint Staff and Office of the Secretary of Defense of the relative values, benefits, and costs of the proposal.
The Joint Staff and Office of the Secretary of Defense review the final proposal and coordinate with the State Department prior to submitting the Overseas Force Structure Change for ultimate Secretary of Defense
Page 56 GAO-15-329 Navy Force Structure
Appendix IV: Overview of Navy’s Homeporting Process
review and approval. Following approval by the Secretary of Defense, the State Department notifies and works with the host nation on timing and the official announcement of the homeport change, and the Department of Defense generates military orders to move the ship from a U.S. homeport to one overseas.
Page 57 GAO-15-329 Navy Force Structure
1
1Normally, the State Department, to include the affected U.S. embassies, works in conjunction with the Office of the Secretary of Defense, Joint Staff, the geographic combatant command, and possibly the service component command for the host-nation notification and public announcement of the approved Overseas Force Structure Change.
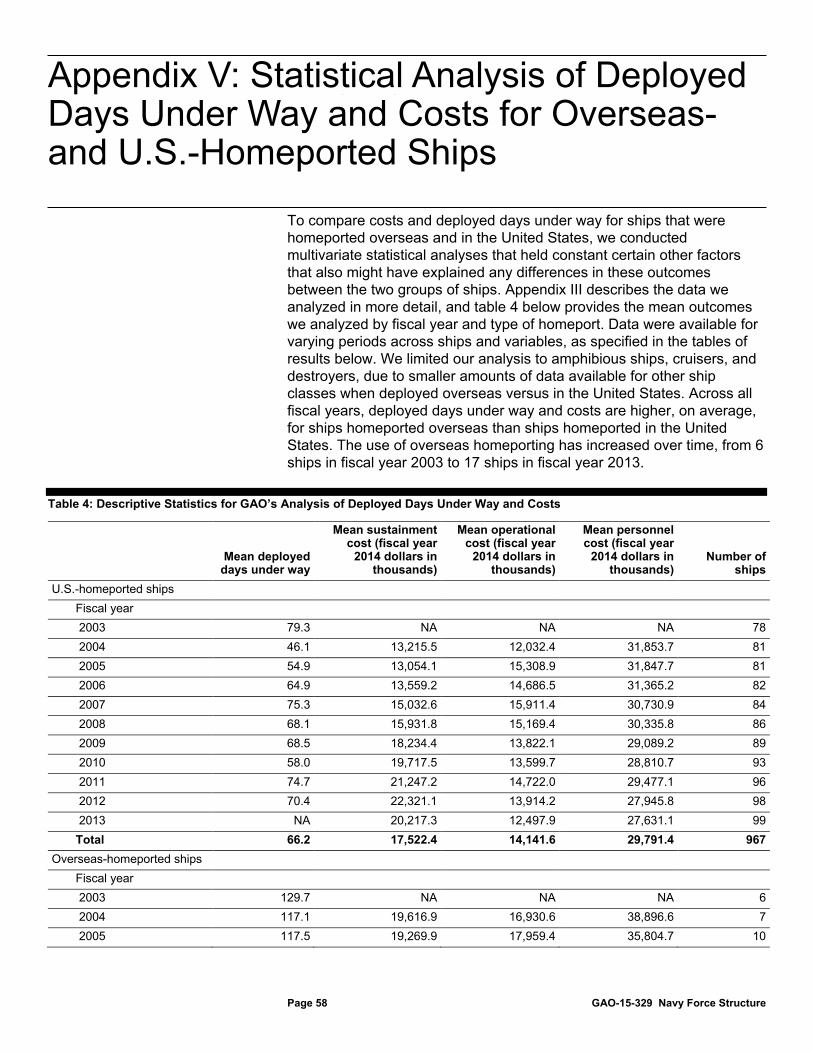
Appendix V: Statistical Analysis of Deployed Days Under Way and Costs for Overseas- and U.S.-Homeported Ships
To compare costs and deployed days under way for ships that were homeported overseas and in the United States, we conducted multivariate statistical analyses that held constant certain other factors that also might have explained any differences in these outcomes between the two groups of ships. Appendix III describes the data we analyzed in more detail, and table 4 below provides the mean outcomes we analyzed by fiscal year and type of homeport. Data were available for varying periods across ships and variables, as specified in the tables of results below. We limited our analysis to amphibious ships, cruisers, and destroyers, due to smaller amounts of data available for other ship classes when deployed overseas versus in the United States. Across all fiscal years, deployed days under way and costs are higher, on average, for ships homeported overseas than ships homeported in the United States. The use of overseas homeporting has increased over time, from 6 ships in fiscal year 2003 to 17 ships in fiscal year 2013.
Table 4: Descriptive Statistics for GAO’s Analysis of Deployed Days Under Way and Costs
Page 58 GAO-15-329 Navy Force Structure
Mean deployed days under way
Mean sustainment cost (fiscal year
2014 dollars in thousands)
Mean operational cost (fiscal year
2014 dollars in thousands)
Mean personnel cost (fiscal year
2014 dollars in thousands)
Number of ships
U.S.-homeported ships Fiscal year 2003 79.3 NA NA NA 78 2004 46.1 13,215.5 12,032.4 31,853.7 81 2005 54.9 13,054.1 15,308.9 31,847.7 81 2006 64.9 13,559.2 14,686.5 31,365.2 82 2007 75.3 15,032.6 15,911.4 30,730.9 84 2008 68.1 15,931.8 15,169.4 30,335.8 86 2009 68.5 18,234.4 13,822.1 29,089.2 89 2010 58.0 19,717.5 13,599.7 28,810.7 93 2011 74.7 21,247.2 14,722.0 29,477.1 96 2012 70.4 22,321.1 13,914.2 27,945.8 98 2013 NA 20,217.3 12,497.9 27,631.1 99 Total 66.2 17,522.4 14,141.6 29,791.4 967
Overseas-homeported ships Fiscal year 2003 129.7 NA NA NA 6 2004 117.1 19,616.9 16,930.6 38,896.6 7 2005 117.5 19,269.9 17,959.4 35,804.7 10
Appendix V: Statistical Analysis of Deployed Days Under Way and Costs for Overseas- and U.S.-Homeported Ships

Appendix V: Statistical Analysis of Deployed Days Under Way and Costs for Overseas- and U.S.-Homeported Ships
Page 59 GAO-15-329 Navy Force Structure
Mean deployed days under way
Mean sustainment cost (fiscal year
2014 dollars in thousands)
Mean operational cost (fiscal year
2014 dollars in thousands)
Mean personnel cost (fiscal year
2014 dollars in thousands)
Number of ships
2006 110.9 17,368.8 16,546.0 32,126.2 13 2007 135.3 19,877.5 17,068.6 30,660.5 14 2008 133.7 21,628.1 17,699.9 32,002.5 15 2009 141.5 17,164.2 17,658.6 32,252.6 15 2010 133.3 19,973.6 16,922.3 31,434.0 15 2011 129.1 23,600.7 15,898.7 31,165.6 16 2012 118.4 28,717.8 17,707.3 37,498.7 16 2013 NA 16,629.3 15,586.8 31,357.4 17 Total 127.5 20,565.6 16,941.4 32,913.9 144
Source: GAO analysis of Navy data. I GAO-15-329
Note: NA denotes years when we could not obtain data from the Navy. This table includes statistics for destroyers, cruisers, and amphibious ships only.
In this appendix, we describe the statistical methods we used and the results of our analysis for each outcome. Our use of statistical methods provides limited assurance that our results reflect the influence of overseas homeporting, rather than other related factors. This improves upon simple comparisons of the raw data, as in table 4. However, we did not design the analysis to account for all relevant factors, and therefore our results are not conclusive causal estimates.
Operational tempo is potentially a primary mechanism by which overseas homeporting may affect costs. Navy officials told us that ships generally are under way for longer periods when homeported overseas. Higher operational tempo increases the proportion of time spent in operations and training compared to time spent in depot maintenance. This, in turn, may increase operational costs and reduce opportunities for sustainment spending.
We analyzed this scenario by comparing ships’ deployed days under way in a given year from fiscal year 2003 and 2012 to their deployed days under way in the prior year, separately for overseas- and U.S.-homeported ships. This allowed us to examine how the Navy rotates ships in and out of periods of higher maintenance or operations, as well as whether this rotation varied according to whether ships were homeported overseas or in the United States.
Deployed Days Under Way

Appendix V: Statistical Analysis of Deployed Days Under Way and Costs for Overseas- and U.S.-Homeported Ships
We fit the following statistical models to our data, in order to more formally analyze these associations:
Page 60 GAO-15-329 Navy Force Structure
Daysit = δ Overseasit + μ + τ + eit (Model 1.1)
Daysit = β Daysi(t-1) + μ + τ + eit (Model 1.2)
Daysit = β1 Daysi(t-1) + β2 Daysi(t-1) * Overseasi(t-1) + δ Overseasi(t-1) + μ + τ + eit
(Model 1.3)
Daysit = β1 Daysi(t-1) + β2 Daysi(t-1) * Overseasi(t-1) + δ Overseasi(t-1) +
(Model 1.4)
α1 Mandaysi(t-1) + α2 Mandaysi(t-2) + μ + τ + eit
For ship i and fiscal year t, Days measured the number of deployed days under way, Overseas indicated being homeported overseas, Mandays measured the ratio of executed to required mandays, μ and τ were vectors of ship and fiscal year fixed effects, respectively, and e was random error.
Our estimation process applied the “within transformation,” which expressed the observations for each ship as deviations from its over-time mean. This eliminated the need to explicitly estimate ship fixed effects, μ, while still estimating the difference between overseas and U.S.-homeported ships, δ, consistent with common statistical practice for this type of model.1 The fixed effects held constant all ship characteristics that did not change over time, such as class and year commissioned. The fiscal year fixed effects in τ held constant all changes over time observed among all ships, such as labor and material prices, trends in military operations, and policy changes that applied uniformly across ships.
1Jeffrey M. Wooldridge, Econometric Analysis of Cross Section and Panel Data (Cambridge, MA: MIT Press, 2002), 267-269.

Appendix V: Statistical Analysis of Deployed Days Under Way and Costs for Overseas- and U.S.-Homeported Ships
In model 1.4, we included additional controls for the percentage of required mandays that were executed, measured concurrently and prior to when we measured homeport type. Navy officials said that they considered a ship’s maintenance history when deciding whether and when to homeport a ship overseas. Controlling for prior executed maintenance allowed us to compare outcomes among ships having similar maintenance histories. An explicit covariate was necessary, because the ratio could vary within ships over time and therefore was not absorbed by ship or year fixed effects. Table 5 provides estimates of the models’ key parameters, which we derived using least-squares methods with asymptotic robustness corrections for potentially heteroskedastic and nonindependent errors within ships.
Page 61 GAO-15-329 Navy Force Structure
2
Table 5: Fitted Models of Deployed Days Under Way
Model 1.1 Model 1.2 Model 1.3 Model 1.4 Overseas-homeported (current year)
42.06 (15.41)
Overseas-homeported (1 year lag)
30.60 (25.84)
44.24 (24.91)
Deployed days under way (1-year lag)
-0.43 (0.04)
-0.47 (0.04)
-0.51 (0.04)
Deployed days under way x Overseas-homeported (1-year lags)
0.43
(0.14) 0.35
(0.11)
Percent required mandays executed (1-year lag)
-8.61
(8.77)
Percent required mandays executed (2-year lag)
6.36
(7.97)
Ship fixed effects Yes Yes Yes Yes Fiscal year fixed effects Yes Yes Yes Yes Fiscal years analyzed 2003–2012 2004–2012 2004–2012 2004–2012 N 994 879 879 789
2M. Arellano, “Computing Robust Standard Errors for Within-Groups Estimators,” Oxford Bulletin of Economics and Statistics 49, no. 4 (1987): 431-434.

Appendix V: Statistical Analysis of Deployed Days Under Way and Costs for Overseas- and U.S.-Homeported Ships
Page 62 GAO-15-329 Navy Force Structure
Model 1.1 Model 1.2 Model 1.3 Model 1.4RMSE 60.99 54.11 52.40 51.93
Source: GAO analysis of Navy data. I GAO-15-329
Note: Upper entries are linear regression coefficients (scaled in days), with cluster-robust standard errors in parentheses.
Based on model 1.1, we estimated that a ship homeported overseas in the current year spent about 42.1 additional deployed days under way, compared to the average ship that was not homeported overseas, with a 95 percent confidence interval of [11.8, 72.3]3 implying a difference distinguishable from zero at the 0.05 significance level.4 Specifically, we estimated that ships homeported overseas were deployed for 110.7 days [84.3, 137.0], on average, compared to 68.6 days [64.8, 72.5] for U.S.-homeported ships. This is a moderately large difference, given that the middle 50 percent of ships in our analysis ranged from 0 to 136 deployed days under way and the median ship was under way for 66 days (across all years in our data).
We found that ships tended to be under way for fewer days in the current year if they were under way for more days in the prior year. For each additional 50 days that the average ship was under way in the prior year, we estimated that the ship was under way for an average of 21.5 [17.7, 25.3] fewer days in the current year (based on model 1.2). This pattern is consistent with the Navy’s practice of rotating ships in and out of operations and depot maintenance.
However, we found that overseas-homeported ships appeared to have a different pattern of rotation. Model 1.3 implied that the average U.S.-homeported ship could expect to spend about 23.6 fewer days [20.0. 27.1] under way this year for each additional 50 days it was under way in the prior year. In contrast, for the average overseas-homeported ship, there was no statistically distinguishable relationship between days under
3Here and in subsequent references, we include 95 percent confidence intervals in brackets following the statistical estimates that precede them. 4For our analysis of all outcomes, we summarized differences between overseas- and U.S.-homeported ships using in-sample average predicted values. Specifically, we fixed the value of the relevant homeport indicator variables to a given value, calculated predicted values, and then averaged the predictions over the sample.
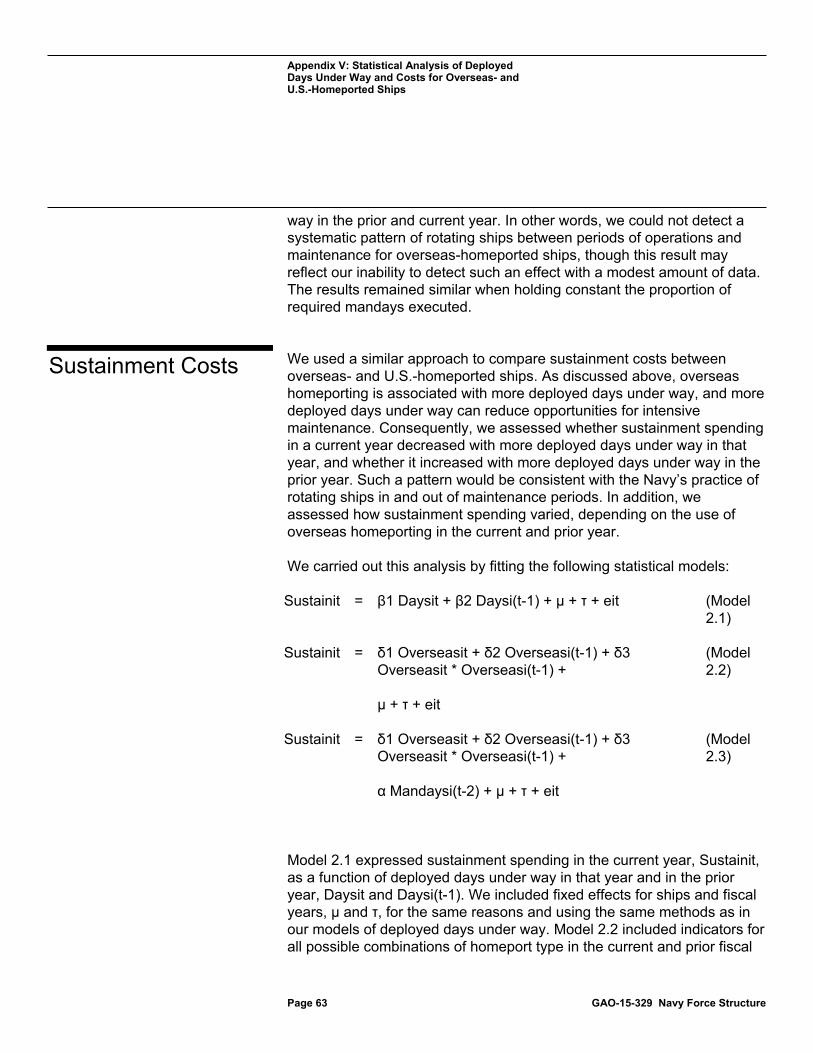
Appendix V: Statistical Analysis of Deployed Days Under Way and Costs for Overseas- and U.S.-Homeported Ships
way in the prior and current year. In other words, we could not detect a systematic pattern of rotating ships between periods of operations and maintenance for overseas-homeported ships, though this result may reflect our inability to detect such an effect with a modest amount of data. The results remained similar when holding constant the proportion of required mandays executed.
We used a similar approach to compare sustainment costs between overseas- and U.S.-homeported ships. As discussed above, overseas homeporting is associated with more deployed days under way, and more deployed days under way can reduce opportunities for intensive maintenance. Consequently, we assessed whether sustainment spending in a current year decreased with more deployed days under way in that year, and whether it increased with more deployed days under way in the prior year. Such a pattern would be consistent with the Navy’s practice of rotating ships in and out of maintenance periods. In addition, we assessed how sustainment spending varied, depending on the use of overseas homeporting in the current and prior year.
We carried out this analysis by fitting the following statistical models:
Page 63 GAO-15-329 Navy Force Structure
Sustainit = β1 Daysit + β2 Daysi(t-1) + μ + τ + eit (Model 2.1)
Sustainit = δ1 Overseasit + δ2 Overseasi(t-1) + δ3 Overseasit * Overseasi(t-1) +
(Model 2.2)
μ + τ + eit
Sustainit = δ1 Overseasit + δ2 Overseasi(t-1) + δ3 Overseasit * Overseasi(t-1) +
(Model 2.3)
α Mandaysi(t-2) + μ + τ + eit
Model 2.1 expressed sustainment spending in the current year, Sustainit, as a function of deployed days under way in that year and in the prior year, Daysit and Daysi(t-1). We included fixed effects for ships and fiscal years, μ and τ, for the same reasons and using the same methods as in our models of deployed days under way. Model 2.2 included indicators for all possible combinations of homeport type in the current and prior fiscal
Sustainment Costs

Appendix V: Statistical Analysis of Deployed Days Under Way and Costs for Overseas- and U.S.-Homeported Ships
year, denoted Overseasit and Overseasi(t-1), with ships that were homeported overseas in neither year serving as the omitted reference group. Since homeport type is causally prior to deployed days under way, we did not control for both variables simultaneously, in order to avoid posttreatment control bias.
Page 64 GAO-15-329 Navy Force Structure
5 Lastly, model 2.3 included a control for the ratio of executed to required mandays for the same reasons as in our models of deployed days under way. We again measured this ratio in the fiscal year prior to the earliest measurement of homeport type (a 2-year lag). Table 6 provides estimates of these models’ parameters, using the same estimation methods as we used to fit models of deployed days underway.
Table 6: Fitted Models of Sustainment Costs
Model 2.1 Model 2.2 Model 2.3 Deployed days under way (current year)
-30.6 (8.5)
Deployed days under way (1-year lag)
14.8 (5.2)
Overseas-homeported (current year)
-3,276.6 (3,327.3)
-4,612.3 (3,773.7)
Overseas-homeported (1-year lag)
6,723.7 (4,112.5)
6,481.0 (4,524.0)
Overseas-homeported (current year) x Overseas-homeported (1-year lag)
-7,242.9
(4,390.1) -5,998.1
(4,622.8)
Percent required mandays executed (2-year lag)
-564.1 (1,710.2)
Ship fixed effects Yes Yes Yes Fiscal year fixed effects Yes Yes Yes Fiscal years analyzed 2004–2012 2004–2013 2004–2013 N 861 974 896
5Paul R. Rosenbaum, “The Consequences of Adjustment for a Concomitant Variable That Has Been Affected by the Treatment,” Journal of the Royal Statistical Society, Series A (General) 147, no. 5 (1984): 656-666.

Appendix V: Statistical Analysis of Deployed Days Under Way and Costs for Overseas- and U.S.-Homeported Ships
Page 65 GAO-15-329 Navy Force Structure
Model 2.1 Model 2.2 Model 2.3RMSE 9473.9 9,888.4 10,010.5
Source: GAO analysis of Navy data. I GAO-15-329
Note: Upper entries are linear regression coefficients (scaled in thousands of dollars), with cluster-robust standard errors in parentheses. Sustainment costs are scaled in thousands of dollars.
Our results were consistent with a similar pattern of rotating in and out of operational and maintenance periods when analyzing sustainment costs. Based on model 2.1, we estimated that for each additional 50 days that the average ship spent under way in the current year, the Navy could expect to spend about $1.5 million [0.7, 2.4] less on sustainment in that year (50 days multiplied by an estimated marginal effect of -$30,600). Days under way are periods when ships cannot enter depot maintenance, which would prevent the Navy from spending large amounts on sustainment. Accordingly, we estimated that an additional 50 days under way in the prior year was associated with $0.7 million [0.2, 1.3] more spending on sustainment in the current year.6 The data suggest that the Navy performs maintenance in roughly 2-year cycles. Ships rotate in and out of higher operational tempo, and the Navy concentrates sustainment spending on specific periods.
Given this pattern, overseas homeporting should be associated with more sustainment spending in the year when the ship returns to U.S.-homeported status and has more opportunities for depot maintenance. Accordingly, based on model 2.2, we found that Navy spent about $5.8 million [-1.4, 13.0] more on sustainment in the year after the average ship returned to a U.S. homeport, compared to the average ship that was never homeported overseas. (This difference is distinguishable from zero at the 0.11 level of significance, however.) The results remained similar when holding constant the proportion of required mandays executed.
The Navy’s pattern of rotating ships in and out of maintenance periods suggests that overseas homeporting should have the opposite
6Although these estimates may appear to suggest that the sustainment spending deferred in the current year is about twice as much as the sustainment spending that will be performed in the next year, the estimates are not statistically distinguishable from each other.
Operational Costs

Appendix V: Statistical Analysis of Deployed Days Under Way and Costs for Overseas- and U.S.-Homeported Ships
associations with operational costs as it did with sustainment costs. More deployed days under way in a current year should be associated with higher operational costs in that year. However, operational costs may be lower in the following year, when ships may spend more time in maintenance. Since overseas deployments are associated with more deployed days under way, they may have analogous associations with operating costs.
We assessed this scenario by estimating identical statistical models as those we fit to the data on sustainment costs, except that we substituted operational costs as the outcome variable. All other model assumptions remained the same. Table 7 provides estimates of these models’ parameters.
Table 7: Fitted Models of Operational Costs
Page 66 GAO-15-329 Navy Force Structure
Model 3.1 Model 3.2 Model 3.3 Deployed days under way (current year)
64.6 (2.9)
Deployed days under way (1-year lag)
-10.9 (2.0)
Overseas-homeported (current year)
-1,018.6 (975.7)
-1,154.9 (1,259.6)
Overseas-homeported (1-year lag)
-14,859.5 (5,305.1)
-14,966.1 (5,249.2)
Overseas-homeported (current year) x Overseas-homeported (1-year lag)
18,708.3 (5,469.3)
18,689.0 (5,432.1)
Percent required mandays executed (2-year lag)
-99.6 (575.2)
Ship fixed effects Yes Yes Yes Fiscal year fixed effects Yes Yes Yes Fiscal years analyzed 2004–2012 2004–2013 2004–2013 N 861 974 896 RMSE 3,475.5 5,620.3 5,615.2
Source: GAO analysis of Navy data. I GAO-15-329
Note: Upper entries are linear regression coefficients (scaled in thousands of dollars), with cluster-robust standard errors in parentheses. Operational costs are scaled in thousands of dollars.
Appendix V: Statistical Analysis of Deployed Days Under Way and Costs for Overseas- and U.S.-Homeported Ships
Our analysis of operational costs found results consistent with those on deployed days under way and sustainment costs. As expected, higher operational tempo in the current year was associated with more operational spending in that year, with the Navy spending an additional $3.2 million [2.9, 3.5], on average, for each additional 50 days under way based on model 3.1. The same 50-day change in deployed days under way in the prior year was associated with a $0.5 million [0.4, 0.7] decrease in operational spending in the current year. This pattern is the opposite of what we observed with sustainment spending and is consistent with rotating ships in and out of maintenance periods.
Model 3.2 suggests that homeporting ships overseas across 2 consecutive years was associated with higher operational spending. Ships that were homeported overseas for 2 consecutive years had $18.7 million [8.0, 29.4] more in operational costs, on average, compared to ships that were not homeported overseas during the same period. The average ship experienced a $12.6 million [3.5, 21.7] decline in operational spending during the first year it returned to U.S. homeport status, compared to the average ship that was not homeported overseas. Curiously, ships in the first year of being homeported overseas, after being homeported in the United States during the prior year, had no different operational costs on average than ships that remained homeported in the United States in both years. The results remained similar when holding constant the proportion of required mandays executed, although the standard error of the estimated difference between overseas- and U.S.-homeported ships in the current year was somewhat larger.
Personnel costs are more likely to have a straightforward association with overseas homeporting. Unlike sustainment and operational costs, which are somewhat inversely related and linked to operational tempo, personnel costs are not as directly tied to cycles of operations and maintenance. As we discuss in the report, overseas homeporting can involve additional costs related to relocating sailors and paying higher living allowances and cost of living salary adjustments than the Navy would have paid to sailors homeported in the United States. These costs are more directly related to the use of overseas homeports, rather than being indirectly related through operational tempo. As a result, we can more directly compare personnel costs between ships that were homeported overseas and in the United States, without accounting for operational tempo.
Page 67 GAO-15-329 Navy Force Structure
Personnel Costs

Appendix V: Statistical Analysis of Deployed Days Under Way and Costs for Overseas- and U.S.-Homeported Ships
To confirm our assumption that operational tempo should not be as strongly associated with personnel costs, particularly from the prior year, we first estimated the following model:
Page 68 GAO-15-329 Navy Force Structure
Personnelit = β1 Daysit + β2 Daysi(t-1) + μ + τ + eit (Model 4.1)
The model expressed personnel costs as a function of deployed days under way in the current and prior years. The model included ship and year fixed effects and was fit using the same methods as in the models above. The first column of table 8 provides estimates of the model’s parameters.
Table 8: Fitted Models of Personnel Costs
Model 4.1 Model 4.2 Model 4.3 Deployed days under way (current year)
3.3 (0.8)
Deployed days under way (1-year lag)
0.5 (0.8)
Overseas-homeported (current year)
1,335.8 (338.3)
1,424.6 (383.5)
Percent required mandays executed (1-year lag)
-132.7 (88.0)
Ship fixed effects Yes Yes Yes Fiscal year fixed effects Yes Yes Yes Fiscal years analyzed 2004–2012 2004–2013 2004–2013 N 861 974 929 RMSE 1,059.4 1,276.9 1,258.3
Source: GAO analysis of Navy data. I GAO-15-329
Note: Upper entries are linear regression coefficients (scaled in thousands of dollars), with cluster-robust standard errors in parentheses. Personnel costs are scaled in thousands of dollars.
Our analysis from model 4.1 found that an additional 50 days under way in the current year was associated with an average of $0.16 million [0.08, 0.25] additional personnel spending in the same year—a small difference, compared to the analogous $1.5 million and $3.2 million increases for sustainment and operational costs. The prior year’s days under way were not meaningfully associated with the current year’s personnel spending.
Appendix V: Statistical Analysis of Deployed Days Under Way and Costs for Overseas- and U.S.-Homeported Ships
As a result, we estimated the difference in personnel costs between overseas- and U.S.-homeported ships measured in the current year, omitting the interactions with deployed days under way and the 1-year lag used in the models above. Our models took the following form:
Page 69 GAO-15-329 Navy Force Structure
Personnelit = δ Overseasit + μ + τ + eit (Model 4.2)
Personnelit = δ Overseasit + α Mandaysi(t-1) + μ + τ + eit (Model 4.3)
Parameter estimates for models 4.2 and 4.3 appear in table 8. Based on model 4.2, we estimated that ships homeported overseas had about $1.3 million [0.7, 2.0] higher personnel costs, on average, than ships that were homeported in the United States. The results remained similar when holding constant the proportion of required mandays executed.
Our statistical analysis described the associations among homeport type, deployed days under way, and various types of cost, holding constant factors such as ship type, age, and common trends in military operations and price levels. In addition, we estimated the statistical precision of these associations. Our analysis found that overseas homeporting was associated with higher operational tempo, in the form of more deployed days under way, as well as higher sustainment, operational, and personnel costs. Despite its ability to account for certain alternative explanations and quantify uncertainty, our analysis has several limitations that affect the interpretation and use of its findings.
We did not design our analysis to credibly isolate the causal relationship between homeport type and the outcomes of interest. Rather, we applied statistical methods to account for specific factors in the data available, in order to rule out a limited number of alternative explanations for the observed differences.
The variation in homeport type over time within ships allowed us to use ship and fiscal year fixed effects, which can be powerful methods to control for many unobserved, stable factors without explicitly measuring them. Nevertheless, the validity of our findings is limited by the lack of available data on other factors that could vary over time within ships. These factors could be systematically associated with homeport type and the outcomes of interest, such as variation over time in the type of operations conducted by overseas- versus U.S.-homeported ships. Our results are biased to the extent that these factors exist.
Summary and Limitations of the Results

Appendix V: Statistical Analysis of Deployed Days Under Way and Costs for Overseas- and U.S.-Homeported Ships
Lastly, the modest amount of data available limits the precision of our estimates. Although we were able to estimate statistically meaningful differences between homeport types in some cases, as described above, a maximum of 11 fiscal years and 1,111 ship-year observations gave us limited data with which to estimate the relationships of interest. As the Navy continues to accumulate data over time, the precision of these estimates should increase accordingly. Our results are preliminary and should be interpreted cautiously, consistent with estimated sampling variances, until they are replicated with additional data.
Page 70 GAO-15-329 Navy Force Structure
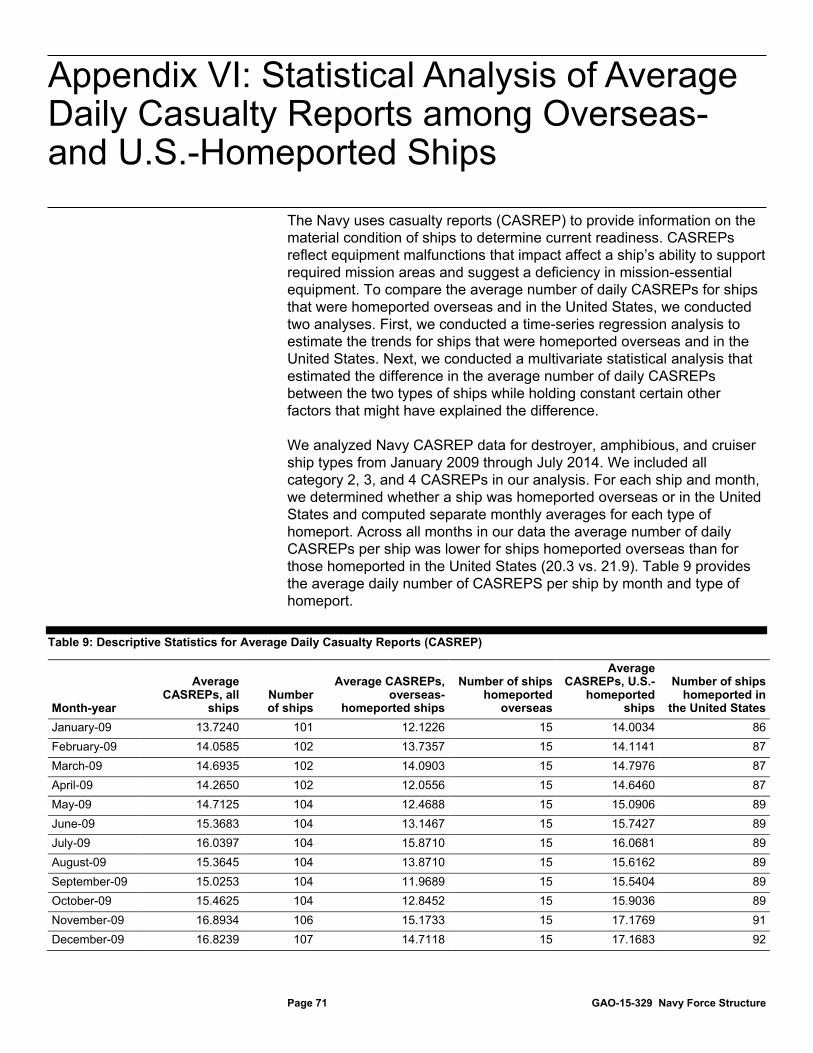
Appendix VI: Statistical Analysis of Average Daily Casualty Reports among Overseas- and U.S.-Homeported Ships
The Navy uses casualty reports (CASREP) to provide information on the material condition of ships to determine current readiness. CASREPs reflect equipment malfunctions that impact affect a ship’s ability to support required mission areas and suggest a deficiency in mission-essential equipment. To compare the average number of daily CASREPs for ships that were homeported overseas and in the United States, we conducted two analyses. First, we conducted a time-series regression analysis to estimate the trends for ships that were homeported overseas and in the United States. Next, we conducted a multivariate statistical analysis that estimated the difference in the average number of daily CASREPs between the two types of ships while holding constant certain other factors that might have explained the difference.
We analyzed Navy CASREP data for destroyer, amphibious, and cruiser ship types from January 2009 through July 2014. We included all category 2, 3, and 4 CASREPs in our analysis. For each ship and month, we determined whether a ship was homeported overseas or in the United States and computed separate monthly averages for each type of homeport. Across all months in our data the average number of daily CASREPs per ship was lower for ships homeported overseas than for those homeported in the United States (20.3 vs. 21.9). Table 9 provides the average daily number of CASREPS per ship by month and type of homeport.
Table 9: Descriptive Statistics for Average Daily Casualty Reports (CASREP)
Page 71 GAO-15-329 Navy Force Structure
Month-year
Average CASREPs, all
ships Number of ships
Average CASREPs, overseas-
homeported ships
Number of ships homeported
overseas
Average CASREPs, U.S.-
homeported ships
Number of ships homeported in
the United StatesJanuary-09 13.7240 101 12.1226 15 14.0034 86 February-09 14.0585 102 13.7357 15 14.1141 87 March-09 14.6935 102 14.0903 15 14.7976 87 April-09 14.2650 102 12.0556 15 14.6460 87 May-09 14.7125 104 12.4688 15 15.0906 89 June-09 15.3683 104 13.1467 15 15.7427 89 July-09 16.0397 104 15.8710 15 16.0681 89 August-09 15.3645 104 13.8710 15 15.6162 89 September-09 15.0253 104 11.9689 15 15.5404 89 October-09 15.4625 104 12.8452 15 15.9036 89 November-09 16.8934 106 15.1733 15 17.1769 91 December-09 16.8239 107 14.7118 15 17.1683 92
Appendix VI: Statistical Analysis of Average Daily Casualty Reports among Overseas- and U.S.-Homeported Ships
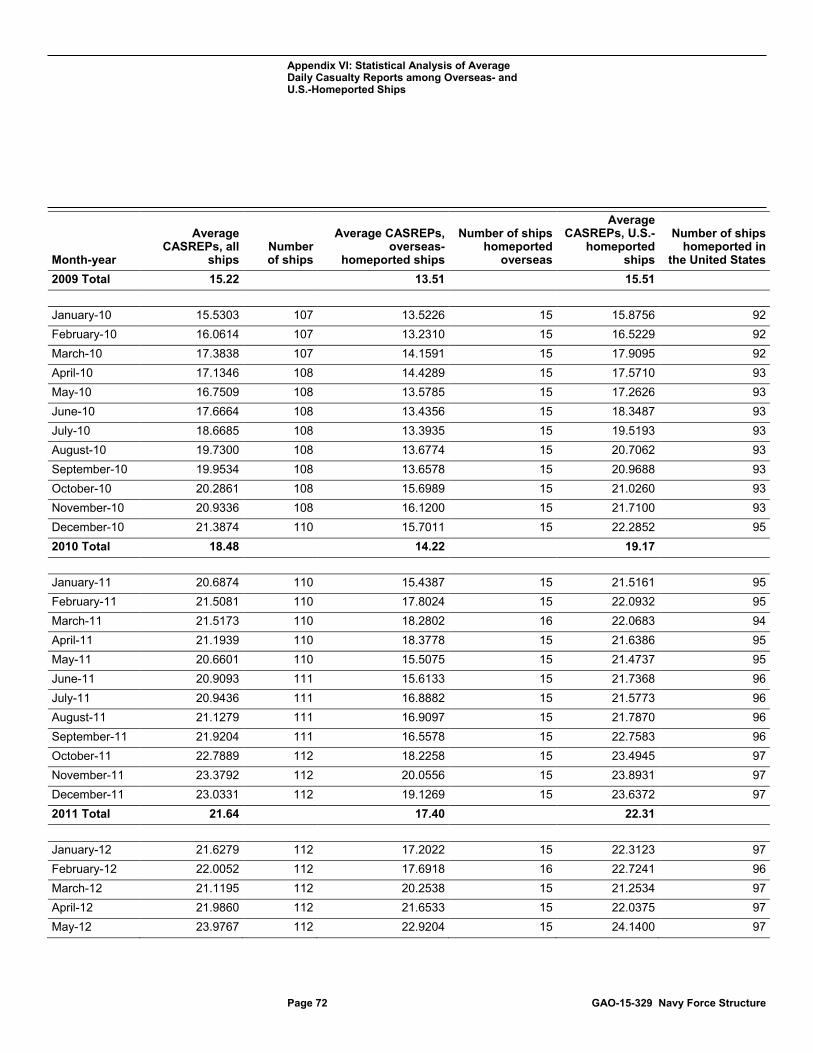
Appendix VI: Statistical Analysis of Average Daily Casualty Reports among Overseas- and U.S.-Homeported Ships
Page 72 GAO-15-329 Navy Force Structure
Month-year
Average CASREPs, all
ships Number of ships
Average CASREPs, overseas-
homeported ships
Number of ships homeported
overseas
Average CASREPs, U.S.-
homeported ships
Number of ships homeported in
the United States2009 Total 15.22 13.51 15.51
January-10 15.5303 107 13.5226 15 15.8756 92 February-10 16.0614 107 13.2310 15 16.5229 92 March-10 17.3838 107 14.1591 15 17.9095 92 April-10 17.1346 108 14.4289 15 17.5710 93 May-10 16.7509 108 13.5785 15 17.2626 93 June-10 17.6664 108 13.4356 15 18.3487 93 July-10 18.6685 108 13.3935 15 19.5193 93 August-10 19.7300 108 13.6774 15 20.7062 93 September-10 19.9534 108 13.6578 15 20.9688 93 October-10 20.2861 108 15.6989 15 21.0260 93 November-10 20.9336 108 16.1200 15 21.7100 93 December-10 21.3874 110 15.7011 15 22.2852 95 2010 Total 18.48 14.22 19.17
January-11 20.6874 110 15.4387 15 21.5161 95 February-11 21.5081 110 17.8024 15 22.0932 95 March-11 21.5173 110 18.2802 16 22.0683 94 April-11 21.1939 110 18.3778 15 21.6386 95 May-11 20.6601 110 15.5075 15 21.4737 95 June-11 20.9093 111 15.6133 15 21.7368 96 July-11 20.9436 111 16.8882 15 21.5773 96 August-11 21.1279 111 16.9097 15 21.7870 96 September-11 21.9204 111 16.5578 15 22.7583 96 October-11 22.7889 112 18.2258 15 23.4945 97 November-11 23.3792 112 20.0556 15 23.8931 97 December-11 23.0331 112 19.1269 15 23.6372 97 2011 Total 21.64 17.40 22.31
January-12 21.6279 112 17.2022 15 22.3123 97 February-12 22.0052 112 17.6918 16 22.7241 96 March-12 21.1195 112 20.2538 15 21.2534 97 April-12 21.9860 112 21.6533 15 22.0375 97 May-12 23.9767 112 22.9204 15 24.1400 97

Appendix VI: Statistical Analysis of Average Daily Casualty Reports among Overseas- and U.S.-Homeported Ships
Page 73 GAO-15-329 Navy Force Structure
Month-year
Average CASREPs, all
shipsNumber of ships
Average CASREPs, overseas-
homeported ships
Number of ships homeported
overseas
Average CASREPs, U.S.-
homeported ships
Number of ships homeported in
the United StatesJune-12 23.6796 113 24.5378 15 23.5483 98 July-12 23.8390 113 26.6000 15 23.4164 98 August-12 23.9903 113 24.5398 15 23.9062 98 September-12 24.4383 113 24.9889 15 24.3541 98 October-12 24.3814 114 23.8473 15 24.4624 99 November-12 24.9480 114 24.8089 15 24.9690 99 December-12 23.9791 114 25.8194 15 23.7002 99 2012 Total 23.34 22.89 23.41
January-13 23.0775 114 23.0101 16 23.0885 98 February-13 25.3835 114 24.8095 15 25.4704 99 March-13 25.4842 114 27.1333 15 25.2343 99 April-13 26.7541 114 28.9844 15 26.4162 99 May-13 26.1691 115 28.5011 15 25.8194 100 June-13 26.6687 116 28.8444 15 26.3455 101 July-13 26.7241 116 27.3828 15 26.6263 101 August-13 25.9830 116 27.0989 15 25.8173 101 September-13 26.3227 116 30.4875 16 25.6563 100 October-13 27.2525 116 27.2817 15 27.2482 101 November-13 27.0934 116 29.0222 15 26.8069 101 December-13 26.1098 116 28.8495 15 25.7030 101 2013 Total 26.09 27.61 25.86
January-14 24.8223 116 27.1312 15 24.4794 101 February-14 24.7509 116 28.3281 16 24.1786 100 March-14 25.5220 116 28.5484 16 25.0377 100 April-14 26.6345 117 30.9583 16 25.9495 101 May-14 27.1922 117 28.3226 16 27.0131 101 June-14 27.9464 117 28.5333 17 27.8467 100 July-14 29.2316 117 32.3548 17 28.7006 100 2014 Total 26.61 29.22 26.19
Total All Years 21.70 20.26 21.93
Source: GAO analysis of Navy data. I GAO-15-329
In this appendix, we describe the statistical methods we used and the results of our analysis for the average daily number of CASREPs per
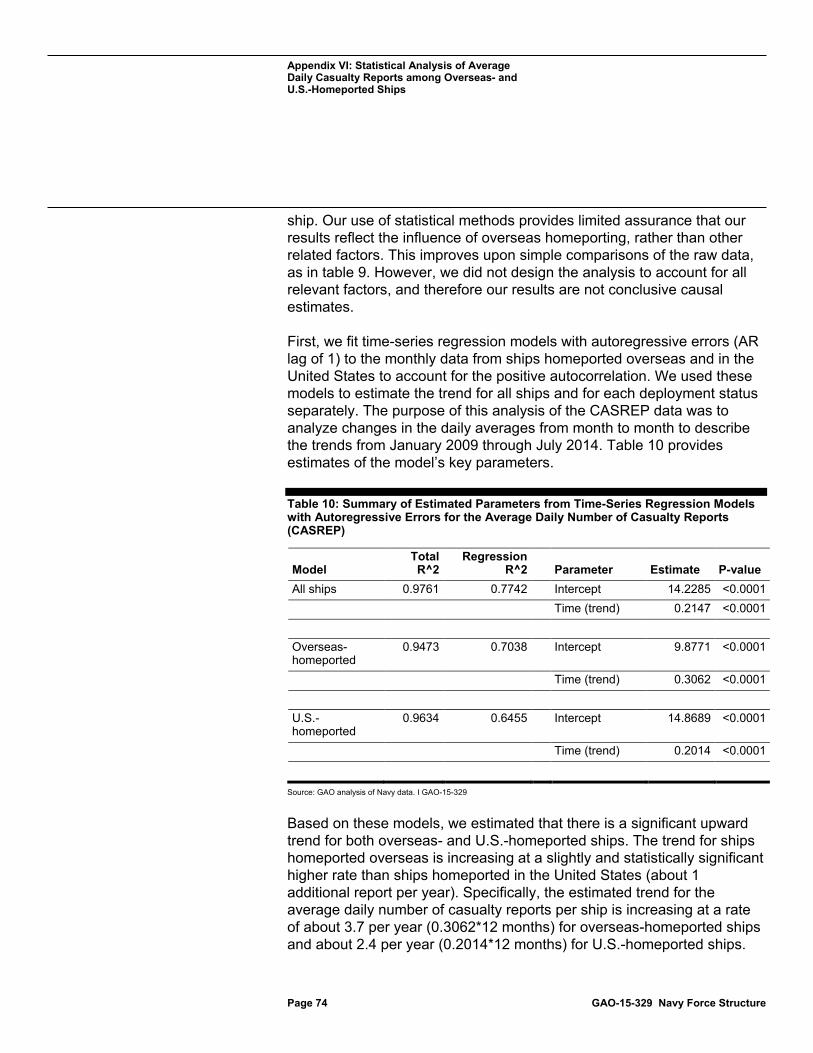
Appendix VI: Statistical Analysis of Average Daily Casualty Reports among Overseas- and U.S.-Homeported Ships
ship. Our use of statistical methods provides limited assurance that our results reflect the influence of overseas homeporting, rather than other related factors. This improves upon simple comparisons of the raw data, as in table 9. However, we did not design the analysis to account for all relevant factors, and therefore our results are not conclusive causal estimates.
First, we fit time-series regression models with autoregressive errors (AR lag of 1) to the monthly data from ships homeported overseas and in the United States to account for the positive autocorrelation. We used these models to estimate the trend for all ships and for each deployment status separately. The purpose of this analysis of the CASREP data was to analyze changes in the daily averages from month to month to describe the trends from January 2009 through July 2014. Table 10 provides estimates of the model’s key parameters.
Table 10: Summary of Estimated Parameters from Time-Series Regression Models
Page 74 GAO-15-329 Navy Force Structure
with Autoregressive Errors for the Average Daily Number of Casualty Reports (CASREP)
Model Total R^2
Regression R^2 Parameter Estimate P-value
All ships 0.9761 0.7742 Intercept 14.2285 <0.0001 Time (trend) 0.2147 <0.0001
Overseas-homeported
0.9473 0.7038 Intercept 9.8771 <0.0001
Time (trend) 0.3062 <0.0001
U.S.-homeported
0.9634 0.6455 Intercept 14.8689 <0.0001
Time (trend) 0.2014 <0.0001
Source: GAO analysis of Navy data. I GAO-15-329
Based on these models, we estimated that there is a significant upward trend for both overseas- and U.S.-homeported ships. The trend for ships homeported overseas is increasing at a slightly and statistically significant higher rate than ships homeported in the United States (about 1 additional report per year). Specifically, the estimated trend for the average daily number of casualty reports per ship is increasing at a rate of about 3.7 per year (0.3062*12 months) for overseas-homeported ships and about 2.4 per year (0.2014*12 months) for U.S.-homeported ships.
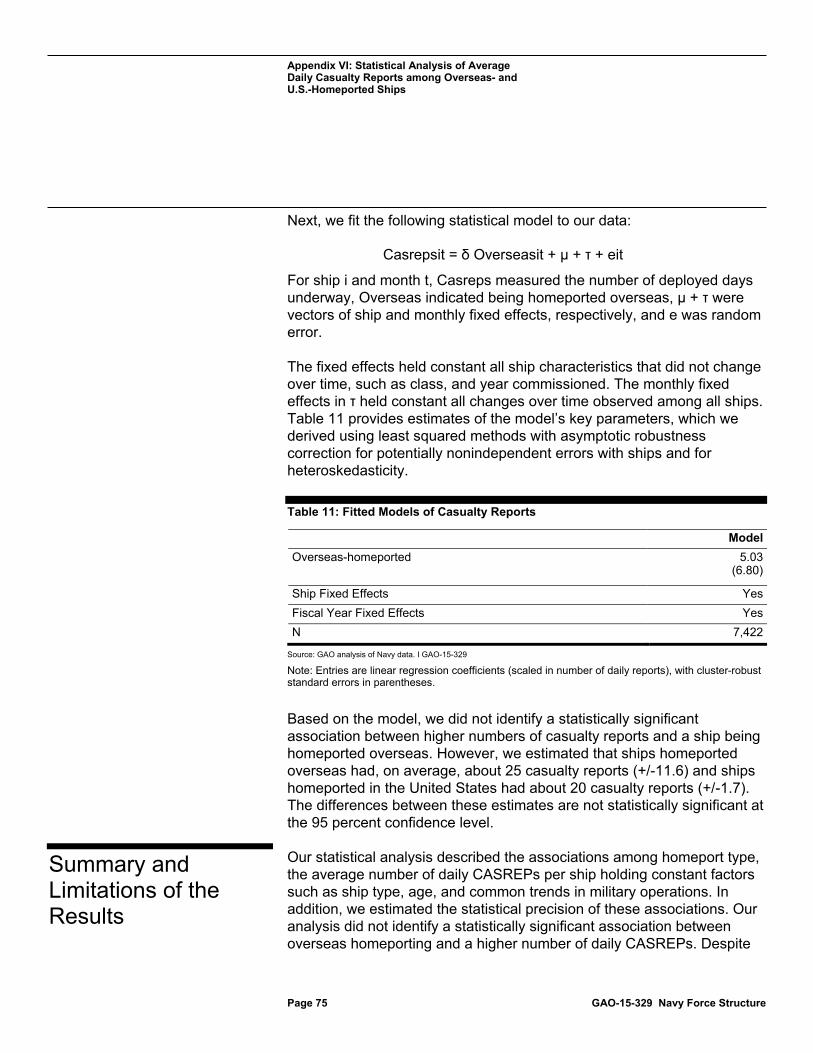
Appendix VI: Statistical Analysis of Average Daily Casualty Reports among Overseas- and U.S.-Homeported Ships
Next, we fit the following statistical model to our data:
Casrepsit = δ Overseasit + μ + τ + eit
For ship i and month t, Casreps measured the number of deployed days underway, Overseas indicated being homeported overseas, μ + τ were vectors of ship and monthly fixed effects, respectively, and e was random error.
The fixed effects held constant all ship characteristics that did not change over time, such as class, and year commissioned. The monthly fixed effects in τ held constant all changes over time observed among all ships. Table 11 provides estimates of the model’s key parameters, which we derived using least squared methods with asymptotic robustness correction for potentially nonindependent errors with ships and for heteroskedasticity.
Table 11: Fitted Models of Casualty Reports
Page 75 GAO-15-329 Navy Force Structure
Model Overseas-homeported 5.03
(6.80)
Ship Fixed Effects Yes Fiscal Year Fixed Effects Yes N 7,422
Source: GAO analysis of Navy data. I GAO-15-329
Note: Entries are linear regression coefficients (scaled in number of daily reports), with cluster-robust standard errors in parentheses.
Based on the model, we did not identify a statistically significant association between higher numbers of casualty reports and a ship being homeported overseas. However, we estimated that ships homeported overseas had, on average, about 25 casualty reports (+/-11.6) and ships homeported in the United States had about 20 casualty reports (+/-1.7). The differences between these estimates are not statistically significant at the 95 percent confidence level.
Our statistical analysis described the associations among homeport type, the average number of daily CASREPs per ship holding constant factors such as ship type, age, and common trends in military operations. In addition, we estimated the statistical precision of these associations. Our analysis did not identify a statistically significant association between overseas homeporting and a higher number of daily CASREPs. Despite
Summary and Limitations of the Results

Appendix VI: Statistical Analysis of Average Daily Casualty Reports among Overseas- and U.S.-Homeported Ships
its ability to account for certain alternative explanations and quantify uncertainty, our analysis has certain limitations that affect the interpretation and use of its findings.
The variation in homeport type over time within ships allowed us to use ship and fiscal year fixed effects, which can be powerful methods to control for many unobserved factors without explicitly measuring them. Nevertheless, the validity of our findings is limited by the lack of available data on other factors that could vary over time within ships. Our results are biased to the extent that these factors exist. Our results are preliminary and should be interpreted cautiously, consistent with estimated sampling variances, until they are replicated with additional data.
Page 76 GAO-15-329 Navy Force Structure

Appendix VII: Differences between Material Readiness Inspection Scores for Ships Homeported in the United States and Overseas
Figures 12–14 provide a detailed presentation of the differences between Board of Inspection and Survey (INSURV) Figure of Merit, functional area, and demonstration scores for the most recent material inspections from fiscal years 2007 through 2014 for ships homeported in the United States and overseas. INSURV assigns ships an overall inspection score, as well as scores in functional areas and demonstrations:
· Figure of Merit score: INSURV assigns ships an overall inspection score—the INSURV Figure of Merit—which is a single-number representation of the ship’s overall material condition and represents a ranking of this condition relative to other ships.
· Functional area scores: These scores are based on inspection of a ship’s systems (e.g., propulsion, information systems, weapons).
· Demonstration scores: These scores are based on inspection of a ship’s performance on various operational demonstrations (e.g., steering, full power ahead, gunnery firing).
We compared cruisers, destroyers, and amphibious ships; we excluded mine countermeasures ships and patrol coastal ships since these ship classes have had limited recent experience deploying from U.S. homeports according to Navy officials.
Page 77 GAO-15-329 Navy Force Structure
1 Because of the relatively small number of ships that were inspected during this period and, in particular, the small sample of ships homeported overseas, we did not conduct a statistical analysis of these data using the methods we used to analyze costs and ship conditions. Instead, we calculated simple descriptive statistics to characterize differences between ships homeported overseas and in the United States.
Figure 12 shows that the average INSURV Figure of Merit scores for overseas-homeported cruisers, destroyers, and amphibious ships are lower than those of U.S.-homeported ships.
1Naval Forces Europe officials noted that, as of April 2015, destroyers homeported in Rota, Spain, had not yet completed an INSURV inspection.
Appendix VII: Differences between Material Readiness Inspection Scores for Ships Homeported in the United States and Overseas

Appendix VII: Differences between Material Readiness Inspection Scores for Ships Homeported in the United States and Overseas
Figure 12: Average Board of Inspection and Survey (INSURV) Inspection Figure of Merit Scores for Cruisers’, Destroyers’, and
Page 78 GAO-15-329 Navy Force Structure
Amphibious Ships’ Most Recent Material Inspection, Fiscal Years 2007–2014
Figure 13 shows that overseas-homeported cruisers, destroyers, and amphibious ships are lower in 11 of 19 functional area scores compared to U.S.-homeported ships.

Appendix VII: Differences between Material Readiness Inspection Scores for Ships Homeported in the United States and Overseas
Figure 13: Average Board of Inspection and Survey (INSURV) Functional Area Scores for Cruisers’, Destroyers’, and
Page 79 GAO-15-329 Navy Force Structure
Amphibious Ships’ Most Recent Material Inspection, Fiscal Years 2007–2014
Figure 14 shows that overseas-homeported cruisers, destroyers, and amphibious ships are lower in 7 of 10 demonstration scores compared to U.S.-homeported ships.

Appendix VII: Differences between Material Readiness Inspection Scores for Ships Homeported in the United States and Overseas
Figure 14: Average Board of Inspection and Survey (INSURV) Inspection Demonstration Scores for Cruisers’, Destroyers’, and
Page 80 GAO-15-329 Navy Force Structure
Amphibious Ships’ Most Recent Material Inspection, Fiscal Years 2007–2014

Appendix VIII: Comments from the Department of Defense
Page 81 GAO-15-329 Navy Force Structure
Appendix VIII: Comments from the Department of Defense

Appendix VIII: Comments from the Department of Defense
Page 82 GAO-15-329 Navy Force Structure

Appendix IX: GAO Contact and Staff Acknowledgments
John H. Pendleton, (202) 512-3489 or
In addition to the contact named above, Suzanne Wren, Assistant Director; Jim Ashley; Steven Banovac; Joanne Landesman; Amie Lesser; Carol Petersen; Michael Silver; Grant Sutton; Jeff Tessin; Chris Watson; and Michael Willems made key contributions to this report.
Page 83 GAO-15-329 Navy Force Structure
Appendix IX: GAO Contact and Staff Acknowledgments
GAO Contact
Staff Acknowledgments
(351940)

Appendix X: Accessible Data
Data Tables for Highlights Figure: Selected Operational Time, Costs, and Material
Page 84 GAO-15-329 Navy Force Structure
Readiness Comparisons between Ships Homeported Overseas and in the United States
Average deployed days under way per ship per year (Fiscal years 2004—2012)
Average total operations and support costs per ship per year (Fiscal years 2004—2013)
U.S.-homeported ships 69 days $61 million Overseas-homeported ships
111 days $70 million
Average daily number of casualty reports per ship (January 2009—July 2014)
Fiscal year U.S.-homeported ships Overseas-homeported ships 2009 15.51 13.51 2010 19.17 14.22 2011 22.31 17.4 2012 23.41 22.89 2013 25.86 27.61 2014 26.19 29.22
Source: GAO analysis of Navy data. | GAO-15-329
Data Table for Figure 1: Navy Ships Homeported Overseas from Fiscal Year 2006 to Fiscal Year 2017 by Location
Ships
Fiscal year Yokosuka, Japan Sasebo, Japan Gaeta, Italy Manama, Bahrain Rota, Spain 2006 11 6 1 2 0 2007 11 6 1 4 0 2008 11 6 1 4 0 2009 11 6 1 4 0 2010 11 8 1 4 0 2011 11 8 1 4 0 2012 11 8 1 4 0 2013 11 8 1 4 0 2014 11 8 1 14 2 2015 13 8 1 14 4 2016 (Projected) 13 8 1 14 4 2017 (Projected) 14 8 1 14 4
Source: GAO analysis of Navy data. | GAO-15-329
Appendix X: Accessible Data

Appendix X: Accessible Data
Notes: These data include the aircraft carrier homeported in Yokosuka. The size of the Navy fleet increased from 281 to 284 between fiscal year 2006 and 2015. Frigates (FFG) were homeported in Yokosuka, Japan up to 2007, but the entire ship class is scheduled for decommissioning by the end of fiscal year 2015 so they are not included in this graphic.
Data Tables for Figure 4: Comparison of Forward-Presence Rates Provided on an Annual Basis for Ships Homeported in the
Page 85 GAO-15-329 Navy Force Structure
United States and Overseas
GAO historical analysis [Note A] (fiscal years 2003—2012) Percent of year
U.S.-homeported ships Overseas-homeported ships Deployed underway time 19% 30%
Navy planning assumptions [Note B] Percent of year
U.S.-homeported ships Overseas-homeported ships Presence 19% 67% Operational availability 25% 80%
Source: GAO analysis of Navy data. | GAO-15-329 aWe made this estimate using our statistical analysis of average deployed underway days per ship from the Navy Energy Usage Reporting System. The difference between overseas and U.S.-homeported ships is statistically distinguishable from zero at the 0.05 level of significance. We compared cruisers, destroyers, and amphibious ships; we excluded mine countermeasures ships and patrol coastal ships because these ship classes have had limited recent experience deploying from U.S. homeports, according to Navy officials. bThe Navy does not collect historical presence and operational availability data at the individual ship level; therefore, we relied on Navy planning assumptions used in the global force-management process and stated in prior Navy reports to illustrate the number of days provided.
Data Table for Figure 5: Percentage of Time Navy Allocates to Training and Maintenance versus Being Deployed and Available in Planned Schedules for Cruisers and Destroyers Homeported in the United States and Overseas as of February 2015
Maintenance Training Deployed Available Fleet Response Plan (U.S.-based, 27-month cycle) 19% (5 months) 41% (11 months) 22% (6 months) 19% (5 months) Planned schedules for cruisers and destroyers (Japan-based, 24-month cycle)
33% (8 months) 0% 67% (16 months 0%
Planned schedules for destroyers (Spain-based, 24-month cycle)
33% (8 months) 17% (4 months) 50% (12 months) 0%
Source: GAO analysis of Navy data. | GAO-15-329
Notes: Percentages do not add up to 100 due to rounding. Planned schedules are subject to change to meet operational requirements and have varied over time according to Navy officials. For the Fleet Response Plan, Navy officials explained that the available period can include extensions of a ship’s deployment, maintenance, or other tasking as required. In March 2015, Fleet Forces Command approved a revised schedule for the four destroyers homeported in Rota, Spain, based on a 32-month cycle with equal amounts of time dedicated for training and maintenance and for deployment.

Appendix X: Accessible Data
Data Table for Figure 6: Average Daily Casualty Reports for U.S.- and Overseas-
Page 86 GAO-15-329 Navy Force Structure
Homeported Ships, January 2009–July 2014
Average number of casualty reports per ship
Fiscal year U.S.-homeported ships Overseas-homeported ships 2009 15.51 13.51 2010 19.17 14.22 2011 22.31 17.4 2012 23.41 22.89 2013 25.86 27.61 2014 26.19 29.22
Source: GAO analysis of Navy data. | GAO-15-329
Note: Our analysis may not be fully representative of 2014’s casualty reports since it is based on 7 months of data (January 2014 through July 2014). These were the latest data available at the time of our review. We compared cruisers, destroyers, and amphibious ships; we excluded mine countermeasures ships and patrol coastal ships because these ship classes have had limited recent experience deploying from U.S. homeports, according to Navy officials.
Data Table for Figure 9: Comparison of Fleet Response Plan and Planned Navy Optimized Fleet Response Plan Operational Cycle for Surface Combatants Homeported in the United States as of February 2015
Maintenance Training Deployed Available Fleet Response Plan (U.S.-based, 27-month cycle)
19% (5 months) 41% (11 months)
22% (6 months) 19% (5 months)
Optimized Fleet Response Plan (U.S.-based, 36-month cycle)
17% (6 months) 31% (11 months)
19% (7 months) 33% (12 months)
Source: GAO analysis of Navy data. | GAO-15-329
Note: Percentages do not add up to 100 due to rounding.
Data Table for Figure 12: Average Board of Inspection and Survey (INSURV) Inspection Figure of Merit Scores for Cruisers’, Destroyers’, and Amphibious Ships’ Most Recent Material Inspection, Fiscal Years 2007–2014
Score
U.S.-homeported ships Overseas-homeported ships INSURV Figure of Merit 0.71 0.78
Source: GAO analysis of Navy data. | GAO-15-329

Appendix X: Accessible Data
Data Table for Figure 13: Average Board of Inspection and Survey (INSURV)
Page 87 GAO-15-329 Navy Force Structure
Functional Area Scores for Cruisers’, Destroyers’, and Amphibious Ships’ Most Recent Material Inspection, Fiscal Years 2007–2014
Score
Functional areas U.S.-homeported ships
Overseas-homeported ships
Damage control 0.75 0.7 Deck 0.78 0.74 Auxiliaries 0.83 0.83 Electrical 0.84 0.83 Propulsion 0.8 0.78 Anti-sub warfare 0.84 0.85 Communications 0.8 0.78 Information systems 0.79 0.71 Navigation 0.88 0.87 Operations 0.82 0.77 Weapons 0.77 0.8 Aviation 0.82 0.82 Navy occupational safety and Health
0.85 0.87
Ventilation 0.78 0.78 Environmental protection 0.78 0.77 Supply 0.83 0.8 Habitability 0.82 0.79 Medical 0.93 0.93 Preservation 0.81 0.81
Source: GAO analysis of Navy data. | GAO-15-329
Data Table for Figure 14: Average Board of Inspection and Survey (INSURV) Inspection Demonstration Scores for Cruisers’, Destroyers’, and Amphibious Ships’ Most Recent Material Inspection, Fiscal Years 2007–2014
Score
Demonstrations U.S.-homeported ships
Overseas-homeported ships
Steering demo 0.89 0.81 Anchoring demo 0.84 0.79 Full power ahead 0.78 0.75 Quick reversal ahead to astern 0.88 0.78

Appendix X: Accessible Data
Page 88 GAO-15-329 Navy Force Structure
DemonstrationsU.S.-homeported ships
Overseas-homeported ships
Quick reversal astern to ahead 0.87 0.76 Anti-sub warfare demo 0.83 0.83 Anti-air warfare demo 0.78 0.8 Self-defense detect-to-engage 0.76 0.72 Gunnery firing demo 0.81 0.81 Ballast demo 0.86 0.77
Source: GAO analysis of Navy data. | GAO-15-329
The Government Accountability Office, the audit, evaluation, and investigative arm of Congress, exists to support Congress in meeting its constitutional responsibilities and to help improve the performance and accountability of the federal government for the American people. GAO examines the use of public funds; evaluates federal programs and policies; and provides analyses, recommendations, and other assistance to help Congress make informed oversight, policy, and funding decisions. GAO’s commitment to good government is reflected in its core values of accountability, integrity, and reliability.
The fastest and easiest way to obtain copies of GAO documents at no cost is through GAO’s website (http://www.gao.gov). Each weekday afternoon, GAO posts on its website newly released reports, testimony, and correspondence. To have GAO e-mail you a list of newly posted products, go to http://www.gao.gov and select “E-mail Updates.”
The price of each GAO publication reflects GAO’s actual cost of production and distribution and depends on the number of pages in the publication and whether the publication is printed in color or black and white. Pricing and ordering information is posted on GAO’s website, http://www.gao.gov/ordering.htm.
Place orders by calling (202) 512-6000, toll free (866) 801-7077, or TDD (202) 512-2537.
Orders may be paid for using American Express, Discover Card, MasterCard, Visa, check, or money order. Call for additional information.
Connect with GAO on Facebook, Flickr, Twitter, and YouTube. Subscribe to our RSS Feeds or E-mail Updates. Listen to our Podcasts. Visit GAO on the web at www.gao.gov.
Contact:
Website: http://www.gao.gov/fraudnet/fraudnet.htm E-mail: [email protected] Automated answering system: (800) 424-5454 or (202) 512-7470
Katherine Siggerud, Managing Director, [email protected], (202) 512-4400, U.S. Government Accountability Office, 441 G Street NW, Room 7125, Washington, DC 20548
Chuck Young, Managing Director, [email protected], (202) 512-4800 U.S. Government Accountability Office, 441 G Street NW, Room 7149 Washington, DC 20548
GAO’s Mission
Obtaining Copies of GAO Reports and Testimony
Order by Phone
Connect with GAO
To Report Fraud, Waste, and Abuse in Federal Programs
Congressional Relations
Public Affairs
PleasePrintonRecycledPaper.