gao-01-561 dairy industry: information on milk prices and
TRANSCRIPT

Report to Congressional RequestersUnited States General Accounting Office
GAO
June 2001 DAIRY INDUSTRY
Information on MilkPrices and ChangingMarket Structure
GAO-01-561

Page i GAO-01-561 Milk Prices and Changing Market Structure
Letter 1
Appendix I Objectives, Scope, and Methodology 7
Appendix II Factors That Influence the Price of Fluid Milk as It
Moves From the Farm to the Consumer 15
Appendix III Analysis of Farm-to-Retail Prices for 2-Percent
Milk in Selected Markets 26
Appendix IV Retail Prices for Four Kinds of Fluid Milk in
Selected Markets 63
Appendix V Monthly Retail, Wholesale-, Cooperative-, and
Farm-Level Prices for Four Kinds of Fluid Milk in
Selected Markets 79
Appendix VI Consolidation Trends and the Degree of
Concentration in the Dairy Industry 96
Appendix VII Research Measuring the Impact of Concentration
and Market Power on the Dairy Industry and Fluid
Milk Sector 107
Appendix VIII GAO Contacts and Staff Acknowledgments 120
Contents

Page ii GAO-01-561 Milk Prices and Changing Market Structure
Tables
Table 1: Portion of the Retail Price of a Gallon of 2-Percent MilkReceived by Farmers, Cooperatives, Wholesale MilkProcessors, and Retailers for 15 Markets, March 1998Through September 2000 26
Table 2: Increases or Decreases in the Farm-to-Retail Price Spreadfor a Gallon of 2-Percent Milk for 15 Markets, March 1998Through September 2000 28
Table 3: Correlation Between Farm-Level Price Changes andChanges in Cooperative, Wholesale, and Retail Prices for aGallon of 2-Percent Milk for 15 Markets, March 1998Through September 2000 29
Table 4: Correlation Between Cooperative-Level Price Changes andChanges in Wholesale and Retail Prices for a Gallon of2-Percent Milk for 15 Markets, March 1998 ThroughSeptember 2000 30
Table 5: Correlation Between Wholesale-Level Price Changes andChanges in Retail Prices for a Gallon of 2-Percent Milk for15 Markets, March 1998 Through September 2000 30
Table 6: Average Annual Retail Price for a Gallon of 2-Percent Milkin Selected Markets, 1998 31
Table 7: Average Annual Retail Price for a Gallon of 2-Percent Milkin Selected Markets, 1999 32
Table 8: Average Annual Retail Price for a Gallon of 2-Percent Milkin Selected Markets, 2000 32
Table 9: Atlanta, Georgia, Market, Per Gallon Milk Prices, March1998 Through September 2000 80
Table 10: Boston, Massachusetts, Market, Per Gallon Milk Prices,March 1998 Through September 2000 81
Table 11: Charlotte, North Carolina, Market, Per Gallon MilkPrices, March 1998 Through September 2000 82
Table 12: Cincinnati, Ohio, Market, Per Gallon Milk Prices, March1998 Through September 2000 83
Table 13: Dallas, Texas, Market, Per Gallon Milk Prices, March1998 Through September 2000 84
Table 14: Denver, Colorado, Market, Per Gallon Milk Prices, March1998 Through September 2000 86
Table 15: Miami, Florida, Market, Per Gallon Milk Prices, March1998 Through September 2000 87
Table 16: Milwaukee, Wisconsin, Market, Per Gallon Milk Prices,March 1998 Through September 2000 88
Page iii GAO-01-561 Milk Prices and Changing Market Structure
Table 17: Minneapolis, Minnesota, Market, Per Gallon Milk Prices,March 1998 Through September 2000 89
Table 18: New Orleans, Louisiana, Market, Per Gallon Milk Prices,March 1998 Through September 2000 90
Table 19: Phoenix, Arizona, Market, Per Gallon Milk Prices, March1998 Through September 2000 91
Table 20: Salt Lake City, Utah, Market, Per Gallon Milk Prices,March 1998 Through September 2000 92
Table 21: San Diego, California, Market, Per Gallon Milk Prices,March 1998 Through September 2000 93
Table 22: Seattle, Washington, Market, Per Gallon Milk Prices,March 1998 Through September 2000 94
Table 23: Washington, D.C., Market, Per Gallon Milk Prices, March1998 Through September 2000 95
Table 24: Share of Milk Delivered By the Four Largest DairyCooperatives in Selected Markets for the Month ofDecember, 1997-1999 99
Table 25: Recent Major Acquisitions of Dairy Processors in theUnited States by Suiza Foods Corporation and Dean FoodsCompany 100
Table 26: Percentage of Fluid Milk Marketed by the Top Four FluidMilk Processors in 14 Selected Markets, for the Month ofDecember, 1997-1999 101
Table 27: Market Share of the Top Four Supermarkets in SelectedMarkets in 1992 and 1998 103
Figures
Figure 1: Selected Fluid Milk Markets with the CorrespondingDefense Commissaries Used for Our Analysis of MilkPrices, and the Federal Milk Marketing Order Areas--January 1, 2000 10
Figure 2: Selected Fluid Milk Markets and the CorrespondingFederal Milk Marketing Orders (as they existed prior toJanuary 1, 2000), Used In Our Analysis of Concentrationat the Dairy Cooperative and Processor Levels 13
Figure 3: Estimated Costs of Marketing a Gallon of 2-Percent Milkin the New York Metropolitan Area, 1995 22
Figure 4: Farm, Cooperative, Wholesale, and Retail Prices for aGallon of 2-Percent Fluid Milk for the Atlanta, Georgia,Market 33
Page iv GAO-01-561 Milk Prices and Changing Market Structure
Figure 5: Farm, Cooperative, Wholesale, and Retail Prices for aGallon of 2-Percent Fluid Milk for the Boston,Massachusetts, Market 35
Figure 6: Farm, Cooperative, Wholesale, and Retail Prices for aGallon of 2-Percent Fluid Milk for the Charlotte, NorthCarolina, Market 37
Figure 7: Farm, Cooperative, Wholesale, and Retail Prices for aGallon of 2-Percent Fluid Milk for the Cincinnati, Ohio,Market 39
Figure 8: Farm, Cooperative, Wholesale, and Retail Prices for aGallon of 2-Percent Fluid Milk for the Dallas, Texas,Market 41
Figure 9: Farm, Cooperative, Wholesale, and Retail Prices for aGallon of 2-Percent Fluid Milk for the Denver, Colorado,Market 43
Figure 10: Farm, Cooperative, Wholesale, and Retail Prices for aGallon of 2-Percent Fluid Milk for the Miami, Florida,Market 45
Figure 11: Farm, Cooperative, Wholesale, and Retail Prices for aGallon of 2-Percent Fluid Milk for the Milwaukee,Wisconsin, Market 47
Figure 12: Farm, Cooperative, Wholesale, and Retail Prices for aGallon of 2-Percent Fluid Milk for the Minneapolis,Minnesota, Market 49
Figure 13: Farm, Cooperative, Wholesale, and Retail Prices for aGallon of 2-Percent Fluid Milk for the New Orleans,Louisiana, Market 51
Figure 14: Farm, Cooperative, Wholesale, and Retail Prices for aGallon of 2-Percent Fluid Milk for the Phoenix, Arizona,Market 53
Figure 15: Farm, Cooperative, Wholesale, and Retail Prices for aGallon of 2-Percent Fluid Milk for the Salt Lake City, Utah,Market 55
Figure 16: Farm, Cooperative, Wholesale, and Retail Prices for aGallon of 2-Percent Fluid Milk for the San Diego,California, Market 57
Figure 17: Farm, Cooperative, Wholesale, and Retail Prices for aGallon of 2-Percent Fluid Milk for the Seattle, Washington,Market 59
Figure 18: Farm, Cooperative, Wholesale, and Retail Prices for aGallon of 2-Percent Fluid Milk for the Washington, D.C.,Market 61

Page v GAO-01-561 Milk Prices and Changing Market Structure
Figure 19: Atlanta, Georgia, Market, Retail Prices for Whole,2-Percent, 1-Percent, and Skim Milk 64
Figure 20: Boston, Massachusetts, Market, Retail Prices for Whole,2-Percent, 1-Percent, and Skim Milk 65
Figure 21: Charlotte, North Carolina, Market, Retail Prices forWhole, 2-Percent, 1-Percent, and Skim Milk 66
Figure 22: Cincinnati, Ohio, Market, Retail Prices for Whole, 2-Percent, 1-Percent, and Skim Milk 67
Figure 23: Dallas, Texas, Market, Retail Prices for Whole,2-Percent, 1-Percent, and Skim Milk 68
Figure 24: Denver, Colorado, Market, Retail Prices for Whole,2-Percent, 1-Percent, and Skim Milk 69
Figure 25: Miami, Florida, Market, Retail Prices for Whole,2-Percent, 1-Percent, and Skim Milk 70
Figure 26: Milwaukee, Wisconsin, Market, Retail Prices for Whole,2-Percent, 1-Percent, and Skim Milk 71
Figure 27: Minneapolis, Minnesota, Market, Retail Prices for Whole,2-Percent, 1-Percent, and Skim Milk 72
Figure 28: New Orleans, Louisiana, Market, Retail Prices for Whole,2-Percent, 1-Percent, and Skim Milk 73
Figure 29: Phoenix, Arizona, Market, Retail Prices for Whole,2-Percent, 1-Percent, and Skim Milk 74
Figure 30: Salt Lake City, Utah, Market, Retail Prices for Whole,2-Percent, 1-Percent, and Skim Milk 75
Figure 31: San Diego, California, Market, Retail Prices for Whole,2-Percent, 1-Percent, and Skim Milk 76
Figure 32: Seattle, Washington, Market, Retail Prices for Whole,2-Percent, 1-Percent, and Skim Milk 77
Figure 33: Washington, D.C., Market, Retail Prices for Whole,2-Percent, 1-Percent, and Skim Milk 78
Abbreviations
AMS Agricultural Marketing ServiceDOD Department of DefenseERS Economic Research ServiceGAO General Accounting OfficeNASS National Agricultural Statistics Service
Page 1 GAO-01-561 Milk Prices and Changing Market Structure
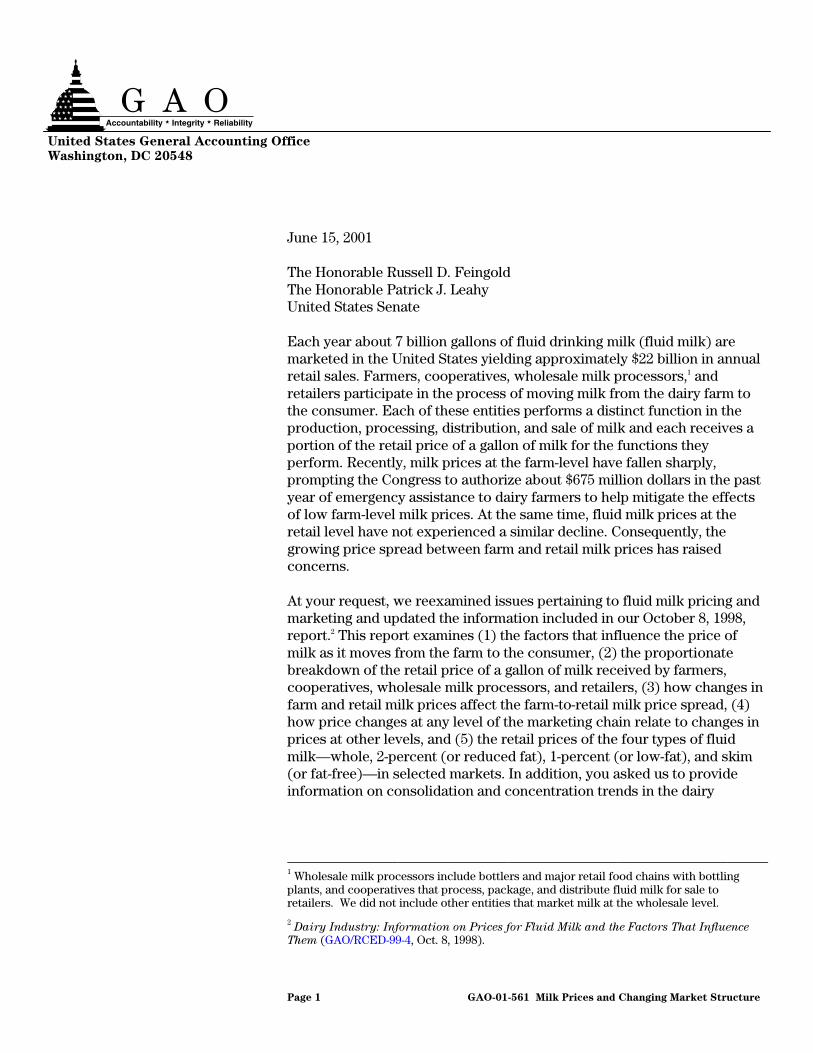
June 15, 2001
The Honorable Russell D. FeingoldThe Honorable Patrick J. LeahyUnited States Senate
Each year about 7 billion gallons of fluid drinking milk (fluid milk) aremarketed in the United States yielding approximately $22 billion in annualretail sales. Farmers, cooperatives, wholesale milk processors,1 andretailers participate in the process of moving milk from the dairy farm tothe consumer. Each of these entities performs a distinct function in theproduction, processing, distribution, and sale of milk and each receives aportion of the retail price of a gallon of milk for the functions theyperform. Recently, milk prices at the farm-level have fallen sharply,prompting the Congress to authorize about $675 million dollars in the pastyear of emergency assistance to dairy farmers to help mitigate the effectsof low farm-level milk prices. At the same time, fluid milk prices at theretail level have not experienced a similar decline. Consequently, thegrowing price spread between farm and retail milk prices has raisedconcerns.
At your request, we reexamined issues pertaining to fluid milk pricing andmarketing and updated the information included in our October 8, 1998,report.2 This report examines (1) the factors that influence the price ofmilk as it moves from the farm to the consumer, (2) the proportionatebreakdown of the retail price of a gallon of milk received by farmers,cooperatives, wholesale milk processors, and retailers, (3) how changes infarm and retail milk prices affect the farm-to-retail milk price spread, (4)how price changes at any level of the marketing chain relate to changes inprices at other levels, and (5) the retail prices of the four types of fluidmilk—whole, 2-percent (or reduced fat), 1-percent (or low-fat), and skim(or fat-free)—in selected markets. In addition, you asked us to provideinformation on consolidation and concentration trends in the dairy
1 Wholesale milk processors include bottlers and major retail food chains with bottlingplants, and cooperatives that process, package, and distribute fluid milk for sale toretailers. We did not include other entities that market milk at the wholesale level.
2 Dairy Industry: Information on Prices for Fluid Milk and the Factors That Influence
Them (GAO/RCED-99-4, Oct. 8, 1998).
United States General Accounting Office
Washington, DC 20548
Page 2 GAO-01-561 Milk Prices and Changing Market Structure
industry and what is known about the impact of concentration on fluidmilk prices.
To provide this information, we conducted a comparative analysis of fluidmilk prices at each level of the marketing chain for selected markets in 14states nationwide and the District of Columbia during the period of March1998 through September 2000.3 Except for our retail price comparison ofthe four types of milk, our analysis generally focused on 2-percent milksold in gallon containers—the largest volume of milk sold nationwide.
In summary, we found the following:
• As we reported in 1998, prices at all levels of the fluid milk marketingchain are determined by the interaction of numerous supply and demandfactors. A number of factors influence the supply of milk that entities atone level of the fluid milk marketing chain are willing to sell to entities atthe next level, including the costs incurred in the production andmarketing of fluid milk; government policies that establish minimumprices for unprocessed milk used for fluid purposes; the degree ofcompetition existing in the market place; and the price that the entitiesexpect to receive for the milk. Similarly, the retail price of milk andsubstitute goods, along with the size, age, tastes, and income levels of thepopulation living in a given marketing area, can influence that area’sdemand for fluid milk. Furthermore, the retail price of milk is influencedby retailers’ operating costs, their need to earn a return on theirinvestment, and other factors, such as the pricing strategies whichretailers and their competitors use to set prices for milk and otherproducts. Since we last reported on this issue, the most significantchanges affecting fluid milk prices are the modifications made to thefederal milk marketing order system, including the method used to setminimum prices for unprocessed milk in federally regulated markets.These changes resulted in the federally established minimum prices forfluid milk being higher in most markets than they would have been if thechanges had not been made.
• Between March 1998 and September 2000, on average, farmers received43 percent, cooperatives 5 percent, wholesale milk processors 33 percent,and retailers 19 percent of the retail price of a gallon of 2-percent milk in
3 The 15 markets included in our report are: Atlanta, Boston, Charlotte, Cincinnati, Dallas,Denver, Miami, Milwaukee, Minneapolis, New Orleans, Phoenix, Salt Lake City, San Diego,Seattle, and Washington, D.C.

Page 3 GAO-01-561 Milk Prices and Changing Market Structure
the markets we reviewed. However, these numbers varied widelydepending on the specific market. For example, the farmers’ portion of theprice of a gallon of 2-percent milk ranged from 35 percent to 52 percent,while retailers collected anywhere from 2 percent to 33 percent,depending on the location analyzed.
• For the period we reviewed, the price spread between farm-level andretail-level milk prices increased in 9 of the 15 markets. Retail pricesremained steady or increased in 12 of the 15 markets. However, farm-levelprices in almost all of the markets showed no statistically significant trendwhen we compared prices at the beginning and end of our review period.Farm prices did experience considerable volatility, with price peaks incertain months that were significantly higher than other months.
• As expected, changes in milk prices at one level of the milk marketingchain had the tendency to translate directly to price changes at the nextimmediate level for our review period. For example, we found a strongcorrelation between changes in farm and cooperative prices and betweenwholesale and retail prices in most of the markets we reviewed. Incontrast, the correlation between changes in farm-level and retail-levelprices was weaker.
• Retail prices for the four kinds of milk varied significantly in the marketswe analyzed. For example, we found that some markets sold 1-percentmilk at the lowest price while others sold skim and 2-percent milk at thelowest price.
• The dairy industry, like much of the agricultural sector, has faced anincreased amount of consolidation in the past decade. As a result, dairyfarms, cooperatives, wholesale milk processors, and retail grocery storeshave all witnessed consolidation leading to fewer, but larger, players in theindustry and a greater degree of concentration at each level of themarketing chain. For example, between 1997 and 1999 in 11 of the 14federal markets for which we could obtain data, the degree ofconcentration—measured as the market share of the top four players inthe market—-at the cooperative level increased from 72 to 77 percent. Atthe wholesale level for these 14 federal markets, the degree ofconcentration increased from 69 to 76 percent. If high levels ofconcentration occur in a market or industry that lacks competition or hasbarriers to entry, it can raise concerns and lead to a federal investigationor intervention by the Federal Trade Commission (FTC) or theDepartment of Justice. In recent years, FTC and Justice have intervened inseveral cases where merger and consolidation activities of dairyprocessors or retail grocery stores would have reduced competition insome markets. However, only a limited amount of research has beenconducted to determine the impact of concentration on fluid milk prices.The relevant studies that we reviewed show mixed results about the

Page 4 GAO-01-561 Milk Prices and Changing Market Structure
effects of concentration on prices. While some studies reported that theincreased concentration could lead to greater market power and higherprices, others noted that the increased concentration led to greatereconomies of scale and lower costs.
We presented a draft of this report to USDA and DOD for comment. USDAand DOD officials generally agreed with the information presented in thereport. The agencies also provided us with technical clarifications that weincorporated as appropriate.
This report is divided into seven appendixes, each describing an aspect ofour analysis of fluid milk prices in 15 markets between March 1998 andSeptember 2000. Appendix I describes in detail our objectives, scope, andmethodology. Appendix II describes the factors that influence prices asmilk moves from the farmer to the consumer. Appendix III providesinformation on average fluid milk prices at the farm, cooperative,wholesale, and retail levels; changes in farm and retail milk prices andhow they affect the farm-to-retail price spread; and the extent to whichprice changes at one level in the milk marketing chain are related to pricechanges at other levels. Appendix IV compares retail prices of whole,2-percent, 1-percent, and skim milk. Appendix V provides the averagemonthly prices of the four types of milk at each level of the milk marketingchain. Appendix VI provides information on consolidation trends andconcentration levels in the dairy industry. Appendix VII provides atechnical review of recent research to measure the effects of industryconcentration and market power on fluid milk prices.
We provided the U.S. Department of Agriculture (USDA) and theDepartment of Defense (DOD) with a draft of this report for their reviewand comment. On May 18, 2001, we met with officials from USDA’sAgricultural Marketing Service (AMS) including the Chief Economist ofAMS, Economic Research Service, and others to obtain their oralcomments on the draft report. The USDA officials generally agreed withthe information presented in the report, but reiterated their concernsabout our use of commissary prices as proxy for wholesale milk prices.(USDA officials had raised similar concerns for our 1998 report.)
According to the officials, commissary prices may not be a good surrogatefor wholesale prices because (1) some of the commissaries are not in closeproximity to the markets we analyzed, (2) the wholesale price data werederived from a single store in each market we analyzed, and (3) thecommissary price is generally based on contracts awarded to the
Agency Comments
Page 5 GAO-01-561 Milk Prices and Changing Market Structure
lowest-cost bidder and may not reflect the wholesale prices paid byretailers in a given market. However, commissary prices were the bestsurrogate we could obtain for wholesale prices. Actual wholesale pricedata are considered proprietary industry data and were unavailable. Wegenerally agree with USDA’s concerns that commissary prices may not befully representative of wholesale prices because they are derived from asingle store in each of the markets and are often based on contractsawarded to the lowest-cost bidder. However, we disagree with USDA’scomment that the commissaries we selected were not in close proximityto the markets we analyzed. As displayed in figure 1 in appendix I, foralmost all of the 15 markets included in our analysis, the commissary thatwe selected was within the marketing area being analyzed.
USDA officials also provided us with technical comments that weincorporated into the report as appropriate.
In its comments on a draft of this report, DOD stated that it agreed withthe milk price information obtained from the defense commissaries. Inaddition, DOD provided us with technical comments that we haveincluded as appropriate.
To update our information of the major factors influencing milk prices, wecontacted several national dairy experts working with the federalgovernment, cooperatives, processors, or in academia. We also reviewedlegislation, studies, and other publications detailing current trends andtransformations in the structure of the dairy industry. To update ourinformation on the pricing relationships among the various levels of themilk marketing chain, we analyzed milk prices in 15 selected marketsnationwide, ensuring that (1) these markets provided geographicalcoverage, (2) at least one market was located in each of the new federalmilk marketing orders, and (3) the selected markets included both stateand federally regulated markets. For these 15 markets, we obtained dataon the prices received by farmers, cooperatives, wholesale milkprocessors, and retailers, from USDA, a state milk control agency, DOD,and a private data-collection company. We limited our data collectionefforts to whole, 2-percent, 1-percent, and skim milk sold in galloncontainers—which together constitute about 66 percent of the milk sold inthe United States. We limited our detailed data analysis primarily to2-percent milk sold in gallon containers. As a result, our analysis may notreflect pricing trends for all types of milk. (See app. I for a detaileddescription of our scope and methodology.) We did not verify the accuracyof the data we received because we did not have access to the information

Page 6 GAO-01-561 Milk Prices and Changing Market Structure
from which they were compiled. We therefore attributed all the data usedin our analysis to the source from which we obtained it. To provideinformation on trends in consolidation in the dairy industry and the impactof concentration on fluid milk prices, we analyzed national and regionalmilk marketing data collected by USDA for the month of December for theconsecutive years of 1997, 1998, and 1999, and reviewed recent academicand government studies on this issue.
We conducted our review from July 2000 through May 2001 in accordancewith generally accepted government auditing standards.
As arranged with your offices, unless you publicly announce its contentsearlier, we will make no further distribution of this report until 30 daysafter the date of this letter. At that time, we will send copies to the SenateCommittee on Agriculture, Nutrition, and Forestry; the House Committeeon Agriculture; other appropriate congressional committees; interestedMembers of Congress; the Honorable Ann M. Veneman, Secretary ofAgriculture; the Honorable Donald H. Rumsfeld, Secretary of Defense; theHonorable Mitchell Daniels, Jr., Director, Office of Management andBudget; and other interested parties. Copies will also be made available toothers upon request.
If you or your staff have any questions about this report, please contact meor Anu Mittal at (202) 512-3841. Other key contributors to this report arelisted in appendix VIII.
Lawrence J. DyckmanDirector, Natural Resources and Environment
Appendix I: Objectives, Scope, and
Methodology
Page 7 GAO-01-561 Milk Prices and Changing Market Structure
In April 2000, Senators Feingold and Leahy requested that GAO examine anumber of issues concerning the pricing and marketing of fluid drinkingmilk (fluid milk) in the United States. Specifically, they asked us to updatethe information contained in our 1998 report, entitled Dairy Industry:
Information on Prices for Fluid Milk and the Factors That Influence
Them (GAO/RCED-99-4, Oct. 8, 1998). This report examines (1) the factorsthat influence the price of milk as it moves from the farm to the consumer,(2) the proportionate breakdown of the retail price of a gallon of milkreceived by farmers, cooperatives, wholesale milk processors, andretailers, (3) how changes in farm and retail milk prices affect the farm-to-retail milk price spread, (4) how price changes at any level of themarketing chain relate to price changes at other levels, and (5) the retailprices of the four types of fluid milk—whole milk, 2-percent (or reduced-fat), 1-percent (or low-fat), and skim (or fat-free) milk—in selectedmarkets. In addition, you asked us to provide information on consolidationtrends in the dairy industry and the impact that the resulting concentrationhas had on the price of fluid milk.
To obtain current information on the major factors that influence the priceof milk as it moves from the farm to the consumer, we updated theinformation contained in our October 1998 report by reviewing documentsand interviewing officials from the U.S. Department of Agriculture’s(USDA), Agricultural Marketing Service (AMS), Economic ResearchService (ERS), and Rural Business-Cooperative Service. We also obtaineddocuments from and the views of academic researchers at CornellUniversity, the University of Connecticut, the University of Wisconsin, andTexas A&M University, and industry representatives of the FoodMarketing Institute and International Dairy Foods Association. In ourreport, we use Cornell University’s 1995 data on the cost of marketing agallon of 2-percent milk in the New York metropolitan area because it isthe most current data available. We also asked the various governmentofficials, academic researchers, and industry representatives that wecontacted to comment on the current relevance and accuracy of thesedata.
To obtain information on the proportionate breakdown of the retail priceof a gallon of fluid milk received by farmers, cooperatives, wholesale milkprocessors, and retailers; changes in farm and retail prices and their effecton farm-to-retail price spreads; and the relationship among price changesat different marketing levels, we obtained information on milk prices in 15selected markets throughout the United States. These markets wereselected because (1) the data were available for these locations, (2) theyprovided geographical coverage of the nation, and (3) they represented
Appendix I: Objectives, Scope, andMethodology

Appendix I: Objectives, Scope, and
Methodology
Page 8 GAO-01-561 Milk Prices and Changing Market Structure
both state- and federally-regulated markets. For these markets, wecollected data on the prices received by farmers, cooperatives, wholesalemilk processors, and retailers for March 1998 through September 2000. Welimited our data collection efforts to the sale of whole, 2-percent,1-percent, and skim milk sold in gallon containers, which constitute about66 percent of the fluid milk sold in the United States.
No precise method exists by which to calculate or determine the price thatfarmers receive for fluid milk. Because dairy farmers receive a blend pricefor their milk—which is the average price for milk used for fluid andmanufactured products—it is not possible to precisely calculate the valueof milk used for just fluid milk. Any selected method only provides anapproximation of the value received by farmers for milk that is to be usedfor fluid purposes, and should not be viewed as a precise measure.Therefore, to determine an estimated farm-level price for fluid milk, weused data provided by AMS. AMS developed an adjustment, which wededucted from the announced cooperative Class I price, to obtain theestimated farm-level fluid milk price for each of the selected cities in ourreview except San Diego, California which is not covered by the FederalMilk Marketing Order program.1 The AMS-developed adjustment takes intoconsideration farm-to-plant hauling costs, cooperative dues and capitalassessments, mandatory advertising and promotion costs, competitive andreceiving credits, and a representative estimate of the value ofreimbursements to cooperatives for the services performed for handlersand for transportation costs not covered by the order minimum price. AnAMS official noted that values of some of the items that make up theadjustment are not available for the fluid milk market in a specific city, butrather for all the milk used in an entire order’s marketing area in which thecity is located. Therefore, an order-wide value used for any of these itemsprovides an estimate rather than the actual city-level value for the item.Also, the values for two of the adjustment items—reimbursements tocooperatives for services performed for handlers and for transportationcosts not covered by the order minimum price—were not readily availableso they were estimated indirectly based on other reported data items and,in some cases, anecdotal information provided by industry members.However, even after considering these limitations, AMS believes that theestimated farm level price provides a good representation of the price that
1 Under the federal milk marketing orders, a classified pricing plan provides differentclasses and minimum prices for milk depending on how the milk is used. Milk used in fluidproducts is placed in Class I, which is the highest-priced class. Milk used for variousmanufactured products is placed in lower-priced classes.
Appendix I: Objectives, Scope, and
Methodology
Page 9 GAO-01-561 Milk Prices and Changing Market Structure
dairy farmers receive for fluid milk. For the farm-level price for the SanDiego, California, market, we used the California mailbox price data thatare collected by the state. The mailbox price is the weighted average ofthe prices received by all dairy farmers in the market and therefore iscomputed as the total net dollars received for milk divided by the totalpounds of milk marketed.
To determine cooperative-level prices, we used AMS’ announcedcooperative prices to represent prices that wholesale milk processors paidto cooperatives. Wholesale milk processors in federally regulated marketsgenerally purchase milk from cooperatives and pay the federal minimumprice for fluid milk plus premiums that are negotiated betweencooperatives and wholesale milk processors. The announced cooperativeprice is the Class I milk price announced by the major cooperative in eachof the markets. The announced cooperative price does not apply to allClass I sales in federally regulated markets and is not necessarily the priceactually received for all of the fluid milk sold by the major cooperative.The announced cooperative prices have not been verified by USDA asactually having been paid by handlers. For San Diego, California—astate-regulated market—we used the minimum fluid prices established bythe state. Data on the premiums paid in excess of these minimums werenot available for this market. See appendix II for a detailed discussion ofover-order premiums.
To determine wholesale-level prices, we used the prices paid by theDepartment of Defense’s Commissary Agency under competitive andnon-competitive contracts to wholesalers. We used commissary prices as asurrogate for privately established wholesale prices because (1) defensecommissaries sell groceries at cost to active and retired military personneland (2) wholesale price data are considered proprietary by industryofficials and were not available to us. According to Defense Commissaryofficials, the commissary network of stores ranks seventh in the UnitedStates in terms of sales volume for supermarket chains. For each of the 15markets we reviewed, we selected a nearby commissary and the DefenseCommissary Agency provided us with the monthly wholesale prices thatselected commissaries paid for gallons of whole, 2-percent, 1-percent, andskim milk. We recognize that these locations may not provide an idealmatch with the other price data analyzed for a given location; however,these were the best wholesale data that we could obtain. In thoselocations where commissaries sold more than one brand of milk, weobtained the prevailing price for the brand that had the highest salesvolume for the period we reviewed. Figure 1 shows the locations of the

Appendix I: Objectives, Scope, and
Methodology
Page 10 GAO-01-561 Milk Prices and Changing Market Structure
15 selected markets, corresponding commissaries, and the federal milkmarketing order areas.
Figure 1: Selected Fluid Milk Markets With the Corresponding Defense Commissaries Used for Our Analysis of Milk Prices,and the Federal Milk Marketing Order Areas--January 1, 2000
Source: Based on USDA and Defense Commissary Agency information.
PacificNorthwest
UpperMidwest
AppalachianSoutheast
Central
Southwest
Western
Northeast
Florida
Arizona/Las Vegas
Mideast
Hanscom Air Force Base
Department of Defense Commissaries
Fluid Milk Markets
Federal milk marketing order areas
Not federally regulated
Fort Bragg
Charlotte
New OrleansNaval Air Station
Kelly AirForce Base
San Diego
Atlanta
Miami
New Orleans
Everett Naval Station
Fitzsimons U.S. Army Garrison
Fort McCoyWright Patterson Air Force Base
Denver
Salt LakeCity
Boston
Washington, D.C.
Cincinnati
Minneapolis
Seattle
Bolling Air Force Base
Athens Naval Supply Corps School
Key West Naval Air Station
Dallas
Hill Air Force BaseGreat Lakes Naval Training Center
San Diego Naval Station
Luke Air Force Base
Milwaukee
Phoenix

Appendix I: Objectives, Scope, and
Methodology
Page 11 GAO-01-561 Milk Prices and Changing Market Structure
For retail-level prices, we contracted with A.C. Nielsen, a private datacollection and analysis company, to obtain average monthly retail pricesfor gallons of whole, 2-percent, 1-percent, and skim milk for supermarketswith yearly sales exceeding $2 million for the markets included in ouranalysis.
To determine the (1) proportionate breakdown of the retail price of agallon of milk received by farmers, cooperatives, wholesale milkprocessors, and retailers; (2) how changes in retail and farm prices affectthe farm-to-retail price spread; and (3) how price changes at any level ofthe marketing chain relate to changes in prices at other levels, we limitedour analysis to 2-percent milk, which currently represents the largestvolume of reduced-fat milk sold nationwide. Therefore, our analysis of2-percent prices may not necessarily reflect pricing patterns and trends forthe other three kinds of milk. (Appendix III includes graphs that show therelationships among the farm, cooperative, wholesale, and retail prices fora gallon of 2-percent milk for each of the 15 markets.) Because farm-leveland cooperative-level prices reflect a higher milkfat content than ispresent in 2-percent milk, we adjusted these prices to reflect the value ofremoving milkfat and replacing it with skim milk.2 This adjustmentallowed us to use farm- and cooperative-level prices that were comparableto the wholesale- and retail-level prices for our analysis.
To determine the degree that farm and retail prices had changed and theeffect these changes had on the farm-to-retail price spread from March1998 through September 2000 for each of the 15 markets, we used astatistical procedure to estimate farm-level and retail prices at thebeginning and end of the period.3 We used estimated rather than actualprices to reduce the influence of the starting and ending months and years
2 For San Diego, California, we used prices that were adjusted for 2-percent milkfat and10-percent nonfat milk solids so that they were comparable with retail milk sold in thatstate.
3 A regression procedure was used for each market to determine whether the price couldbe reliably predicted as a function of time for both farm-level and retail prices. Thisprocedure allowed us to estimate initial and final prices for farm-level and retail prices thattake into account the variability in these price series during the 31-month period. Astatistically significant relationship indicates that a stable trend, either up or down, wasfound between price and time. For statistically significant relationships, a final priceestimate (computed for the last month of our data series) was calculated and compared toan estimated price calculated for the first month. In the absence of a statistically significantrelationship—when no trend differing from zero was found—initial and final estimates ofprice are the same, even if actual beginning and final prices differ.

Appendix I: Objectives, Scope, and
Methodology
Page 12 GAO-01-561 Milk Prices and Changing Market Structure
selected for our analysis in markets in which there was considerablemonth-to-month variability in milk prices. The differences between theestimated initial and final prices represent the trend changes during theperiod. In some cases, this difference may be zero because there is noapparent trend. We calculated the change in the farm-to-retail price spreadas the estimated retail price difference minus the estimated farm pricedifference.
To describe the relationship between price changes at any given level inthe milk marketing chain and price changes at the other levels, we testedfor correlations between price changes at the various levels for each of the15 markets included in our analysis. Specifically, we calculatedcoefficients describing the degree of correlation between changes infarm-level prices and price changes at the cooperative, wholesale, andretail levels; price changes at the cooperative-level and price changes atthe wholesale and retail levels; and price changes at the wholesale andretail levels. In appendix III, we report those correlation coefficients thatare statistically different from zero at the 95-percent confidence level.
To provide information on the retail prices for four kinds of milk, weanalyzed the retail price data that we obtained from A.C. Nielsen. Thesedata are arrayed in appendix IV for each of the selected 15 markets forMarch 1998 through September 2000.
To obtain information on consolidation trends in the dairy industry, wereviewed reports and studies by USDA, dairy and supermarket industryorganizations, and academic experts. We interviewed USDA officials andother dairy industry experts regarding the structural changes occurring inthe dairy industry and retail food industry. To determine the degree ofconcentration at various levels of the fluid milk marketing chain, weestimated the market share of the four largest dairy cooperatives and thefour largest wholesalers in each of 14 federally-regulated markets includedin our review. For this analysis, we obtained proprietary data from USDAfor those federal milk marketing order areas (as they existed prior toJanuary 2000), that corresponded to the 14 selected markets. For each ofthe 14 markets, we analyzed data on total milk deliveries by dairycooperatives and on total fluid milk processed by wholesalers during themonth of December in 1997, 1998, and 1999. Figure 2 shows the locationsof the 14 markets and their corresponding federal milk marketing orderarea as it existed prior to January 2000. In addition, we obtained data fromthe Economic Research Service on market share of the four largestsupermarkets in 1992 and 1998 for the 15 markets included in our review.

Appendix I: Objectives, Scope, and
Methodology
Page 13 GAO-01-561 Milk Prices and Changing Market Structure
Figure 2: Selected Fluid Milk Markets and the Corresponding Federal Milk Marketing Orders (as they existed prior toJanuary 1, 2000), Used in Our Analysis of Concentration at the Dairy Cooperative and Processor Levels
Source: Based on USDA information.
To obtain information on the impact of concentration and market poweron fluid milk prices, we summarized the methods and results of severaleconomic studies relating to market power in the dairy industry or fluidmilk market. We reviewed the economic literature on this issue anddiscussed our observations about these studies with several USDAofficials and other agricultural economists familiar with dairy andindustrial organization. We also analyzed the economic issues surrounding
PacificNorthwest(Seattle)
UpperMidwest(Minneapolis)
Carolina(Charlotte)
Southeast(Atlanta, New Orleans)
Eastern Colorado(Denver)
SoutheasternFlorida(Miami)
Central Arizona(Phoenix)
Chicago Regional(Milwaukee)
Texas(Dallas)
Ohio Valley(Cincinnati)
NewEngland(Boston)
MiddleAtlantic(Washington, D.C.)
GreatBasin(Salt Lake City)

Appendix I: Objectives, Scope, and
Methodology
Page 14 GAO-01-561 Milk Prices and Changing Market Structure
the application of market power models to the dairy industry and the fluidmilk market.

Appendix II: Factors That Influence the Price
of Fluid Milk as It Moves From the Farm to
the Consumer
Page 15 GAO-01-561 Milk Prices and Changing Market Structure
Each year the United States processes about 7 billion gallons of theapproximately 20 billion gallons of raw milk into fluid milk products, suchas flavored milks, buttermilk, whole, 2-percent, 1-percent, and skim milk,that yield approximately $22 billion in retail sales. The rest of the raw milksupply is used to produce manufactured products, such as butter, icecream, yogurt, powdered milk, and cheese. Dairy farmers receive a pricefor unprocessed milk, and each entity involved in the processing andmarketing of fluid milk adds value to the product and receives a portion ofthe difference between the farm and retail price. (This difference is knownas the price spread.) This appendix describes how unprocessed milkprices are determined at the farm level and the factors that influence theprice of milk as it moves from the farm to the retail level. In addition, itprovides information on the costs associated with marketing milk, asestimated by researchers at Cornell University, and industry officials’views regarding these estimates. We could not obtain specific cost data forour analysis because wholesale and retail cost data in the private sectorare proprietary.
Farm level prices for the unprocessed milk that is sold for use in fluid milkproducts are determined by supply and demand forces that are influencedby federal and state dairy programs. Federal and state programs ensurethat farm prices do not fall below a minimum level or provide a safety netfor individual farmers who lack market power compared with otherentities, such as wholesale milk processors and retailers. The primaryfederal programs include the milk marketing order and dairy price supportprograms.
About 70 percent of the milk produced in the United States is regulatedunder the federal milk marketing order program. The federal program setsminimum prices that must be paid to farmers for unprocessed fluid grademilk in specified marketing order areas. These prices vary by the class ofproduct for which the milk is used, and for milk used in fluid products theminimum price also varies by location.
Since our last report, the method for determining the minimum price forfluid milk under the federal milk marketing order program has changed asa result of reforms authorized by the Federal Agriculture Improvement and
Appendix II: Factors That Influence the Priceof Fluid Milk as It Moves From the Farm tothe Consumer
Federal and StatePolicies InfluenceMilk Prices at theFarm Level

Appendix II: Factors That Influence the Price
of Fluid Milk as It Moves From the Farm to
the Consumer
Page 16 GAO-01-561 Milk Prices and Changing Market Structure
Reform Act of 1996 (1996 farm bill).1 As of January 1, 2000, minimumprices are no longer based on the price of Grade B milk—manufacturing-grade milk that can only be used for manufactured dairyproducts—in Minnesota and Wisconsin. Under the revised program, USDAuses the following four classes of milk prices: (1) Class I prices for milkused for fluid purposes; (2) Class II prices for milk used for softmanufactured products such as yogurt and ice cream; (3) Class III pricesfor milk used in hard cheese production; and (4) Class IV prices for milkused for butter and powdered milk. This modification to the orderrecognizes that the markets for cheese and butter/powdered milk aredistinct and therefore should be priced separately. Under the revisedfederal milk marketing order program, the minimum price that processorspay for Class I milk is based on the higher of the Class III or Class IV pricein each month.2 In addition, for milk used for fluid products, Class Idifferentials are also added to the higher of the Class III or Class IV pricesto set the minimum Class I price in every county of the contiguous 48states. USDA estimates that after the changes went into effect onJanuary 1, 2000, the average Class I differential increased by 7 cents perhundredweight.
Dairy farmers who sell milk to wholesale milk processors who areregulated by a federal milk marketing order receive an average price orblend price that is based on the weighted average of the four usage classesfor all the raw milk sold to all processors regulated by that marketingorder. The average price of milk they receive depends, in part, on theextent that the total milk supply in an order is being used for fluid ormanufacturing purposes. For example, in some areas of the country, suchas the Southeast region, fluid milk accounted for a greater proportion of adairy farmer’s milk check—about 66 percent in October 2000. However, inthat same month, in other parts of the country, such as the Upper Midwestregion, fluid milk prices accounted for only about 20 percent of a dairyfarmer’s milk check. Buyers of milk regulated by federal and stateprograms are permitted to pay farmers prices in excess of the establishedminimums—known as over order premiums.
1 The 1996 farm bill authorized USDA to reform the federal milk marketing order programto include (1) the consolidation of the existing 31 milk marketing orders to between 10 and14 orders and (2) revising the basic formula price which is used to set the federal minimumprice for milk.
2 According to a USDA estimate, in calendar year 2000, this change resulted in about a$1.76 per hundredweight increase in the Class I milk price in calendar year 2000.

Appendix II: Factors That Influence the Price
of Fluid Milk as It Moves From the Farm to
the Consumer
Page 17 GAO-01-561 Milk Prices and Changing Market Structure
Some areas, such as California, which are not under the federal milkmarketing order program, are covered by state programs. In these areas,dairy farmers are paid the minimum milk prices that are established by thestate government. These minimum prices may be higher than federalminimum prices.
In addition to federal and state regulatory programs that enforce minimummilk prices, in 1996, the Congress approved the creation of the NortheastInterstate Dairy Compact for six New England states.3 The Compactsupplements federal and state programs by setting the minimum price tobe paid by processors for fluid milk marketed in the six-state area. In July1997, the Compact set a minimum price of $16.94 per hundredweight forfluid milk, and that minimum price has not changed. Consequently, inmonths when the federal minimum price for fluid milk for the Northeastmilk marketing order falls below the Compact price, milk processors inthat order must pay at least the Compact price on their Class I use. Inother months, when the federal minimum price is higher than the Compactprice, milk processors must pay at least the federal minimum price. Sincethe Compact price was established, federal minimum prices in theNortheast milk marketing order have ranged between $13.50 to $20.50 perhundredweight. Dairy farmers from other states that supply milk to theCompact area also benefit from the Compact set minimum. A number ofother regions in the country, such as some southeastern states, areconsidering the adoption of similar compact arrangements.
Farm-level prices are also influenced by the dairy price support programcreated in 1949. This program supports farm-level prices by providing astanding offer from the government to purchase butter, cheese, and nonfatdry milk at specified prices. The prices offered for these dairy products areintended to provide sufficient revenue so that dairy product manufacturerscan pay farmers, on average, the legislatively mandated support price. Thisprogram has the effect of providing a floor for the price of milk used formanufacturing purposes. As a result, it influences the price that farmersreceive for milk used for fluid purposes under the milk marketing orderprogram because the support price sets a floor below whichmanufacturing product prices are unlikely to fall for very long. The pricesupport program offers a safety net to all dairy farmers, including those
3 The six compact states include Connecticut, Maine, Massachusetts, New Hampshire,Rhode Island, and Vermont. The Compact is scheduled to terminate, unless reauthorized,by September 30, 2001.

Appendix II: Factors That Influence the Price
of Fluid Milk as It Moves From the Farm to
the Consumer
Page 18 GAO-01-561 Milk Prices and Changing Market Structure
who do not participate in federal or state milk marketing orders. The 1996farm bill provided for the dairy price support program to terminate by theend of 1999. However, the Congress has twice extended the program andthe current authority extends the program through calendar year 2001.
The decrease in farm-level milk prices from the latter part of 1999 through2000 has been largely attributed to record increases in production during1998 through 2000. During this time period, milk production increased byalmost 7 percent, and even though demand was relatively strong, it wasnot strong enough to absorb the increase in production without decreasingthe price. According to USDA, farm-level prices for milk in 2001 arerecovering due to a decline in milk production and continued strongdemand for milk.
The price at which cooperatives sell raw milk to wholesale milkprocessors is influenced by the minimum price established by federal andstate milk marketing order programs, the cost of services that thecooperatives provide, the relative market power of cooperatives and milkprocessors, the supply of milk available from farmers, and the demand forfluid and manufactured milk products by consumers.
About 83 percent of all milk produced in the United States is marketedthrough dairy cooperatives that are owned and financed byfarmer-members.4 Cooperatives can either (1) process, package, anddistribute fluid milk or manufactured dairy products to retail outlets forsales to consumers or (2) sell the unprocessed milk to wholesale milkprocessors who process, package, and distribute fluid milk ormanufactured dairy products for sale to retail outlets.5 Cooperativesoperate like corporate businesses to perform services for their members.Some distinctive features of cooperatives include member-user ownershipand control, services at cost to their members, and distribution of incometo their members on the basis of their patronage. For example, Land O’Lakes, one of the largest dairy cooperatives in the country, serves over
4 Milk not marketed through cooperatives is sold directly to processors or, in someinstances, is processed into dairy products by farmers themselves. Cooperatives processedand marketed about 14 percent of all fluid milk produced in 1997, down from about16 percent in 1992.
5 See our report entitled Dairy Industry: Information on Marketing Channels and Prices
for Fluid Milk (GAO/RCED-98-70, Mar. 16, 1998) for more information on the role ofcooperatives and other entities in the marketing of fluid milk.
Services Provided byDairy CooperativesAffect the Price ofMilk
Appendix II: Factors That Influence the Price
of Fluid Milk as It Moves From the Farm to
the Consumer
Page 19 GAO-01-561 Milk Prices and Changing Market Structure
11,000 members and processes about 12 billion pounds of milk annually.According to company documents, all Land O’ Lakes members are ownersof the cooperative and participate in a democratic process by which theydirect the policies of the organization, and they share the profits of thebusiness based on their business volume.
Most dairy cooperatives require that farmers sign a 1 year membershipagreement that commits them to market all of their milk through thecooperative.6 In return, the cooperative commits to performing a variety ofservices for its members. Some reasons that farmers join dairycooperatives are to:
• guarantee a market outlet for their milk,• gain bargaining power to obtain the best price in the market,• have their milk marketed efficiently, including the assurance that their
milk will be accurately weighed and tested, and• be effectively represented in legislative, regulatory, and public relations
matters.
Cooperatives generally sell unprocessed milk that will be used for fluidpurposes to wholesale milk processors at prices above the federal or stateminimums. In federally or state-regulated markets, any differencesbetween the prices charged to the wholesalers and the minimum pricesare known as over-order premiums. Over-order premiums are set by themarketplace and, in part, compensate cooperatives for the services theyprovide to wholesalers. These services include (1) transporting milk fromdifferent milk-producing areas, (2) scheduling milk deliveries to coincidewith demand, and (3) standardizing the component content of milkdeliveries. In addition, over-order premiums reflect both marketconditions and market power acquired by cooperatives relative toprocessors. According to some dairy experts, actual supply and demandconditions in the market have a greater impact on the amount ofover-order premiums charged by cooperatives than the market powerexercised by the cooperatives. In commenting on a draft of this report, aUSDA official stated that over-order premiums offset the market power ofcooperatives relative to processors. According to this official, processorsmay have market power that is attributable to concentration in theindustry and because they are purchasing a perishable commodity.
6 Typically, these agreements are self-renewing.

Appendix II: Factors That Influence the Price
of Fluid Milk as It Moves From the Farm to
the Consumer
Page 20 GAO-01-561 Milk Prices and Changing Market Structure
The price at which wholesale milk processors7 sell fluid milk to retailers isinfluenced by the price that wholesalers pay to acquire the unprocessedmilk; the costs they incur for processing, packaging, and distributing fluidmilk to retail outlets; the wholesalers’ need to earn a return on investmentin order to remain in business; and consumer demand for fluid milk.Wholesalers provide processing services including pasteurization,homogenization, and the standardization of milkfat and nonfat solids inflavored milks, buttermilk, whole, 2-percent, 1-percent, and skim milk.Wholesalers also package these products into a variety of types and sizesof containers and arrange for their distribution to retail outlets for sale toconsumers. In addition to shipping the products to retailers, somewholesalers provide different levels of in-store service, according toindustry officials. For example, some wholesalers provide a full range ofservices to retailers including unloading the milk on the store dock,restocking the dairy case, and removing outdated or leaking containers,while others may not provide any services to retailers beyond deliveringproducts to the shipping docks. Differences in wholesale-level pricesreflect differences in any or all of these factors.
Furthermore, according to dairy industry officials we contacted, in somehighly regulated markets, state regulations may increase both wholesaleand retail milk prices. For example, an official from one of the nation’slargest grocery wholesalers told us that the distribution of milk in NorthDakota is restricted to wholesale distributors that are state approved.Consequently, milk can only be delivered to retail stores on trucks that areowned by an approved wholesale distributor. This requirement prohibitsretailers and non-approved wholesale distributors from using their owntrucks to deliver milk to retail stores, which in some cases may be a lesscostly and more economical delivery method, especially in isolated, ruralareas.
Typically, wholesale cost and pricing data for the private sector are notavailable to the public because such data are considered proprietary anddo not reflect standard terms of sale. Furthermore, any sharing of cost orpricing data with competitors or others could be considered a violation ofstate and/or federal antitrust laws. However, in 1997, researchers atCornell University published a study that estimated these costs based on
7 Wholesale milk processors include bottlers and major retail food chains with bottlingplants, and cooperatives that process, package, and distribute fluid milk for sale toretailers. We did not include other entities that market milk at the wholesale level.
Wholesalers’Processing,Packaging, andDistributing CostsInfluence the Price ofFluid Milk
Appendix II: Factors That Influence the Price
of Fluid Milk as It Moves From the Farm to
the Consumer
Page 21 GAO-01-561 Milk Prices and Changing Market Structure
information obtained from a survey of wholesalers. The researcherssurveyed 35 well-managed plants that were operated by 23 companies.8
The 35 plants in the sample included 22 proprietary plants, 5 cooperativeplants, and 8 supermarket-owned plants. The plants processed an averageof 28 million pounds of milk per month, ranging from slightly more than13 million pounds to more than 51 million pounds. Distribution costestimates were based on large accounts served by the plants, includingsupermarkets, large convenience stores, and club stores.
The Cornell researchers estimated that in 1995, the total cost to sell agallon of 2-percent milk for a large supermarket in the New Yorkmetropolitan area was about $2.12. (This amount also included anestimated 19 cents per gallon for handling costs incurred by the retailerand the retailer’s return on investment.) According to officials of dairycooperatives, wholesalers, and retailers of fluid milk, the estimatesdeveloped by the researchers at Cornell University were generallyrepresentative of the cost of performing fluid milk processing andmarketing functions in 1995. However, many of the costs included in theCornell study have increased significantly since 1995. We were unable toidentify any other study with more recent estimated costs and the Cornellstudy has also not been updated.
In addition, dairy industry experts told us that the costs for distributingmilk in other markets could be significantly higher than the 10 cents pergallon estimated in the study for the New York metropolitan area. Inparticular, distribution costs in rural markets could range as high as25 cents to 40 cents per gallon of milk. According to one industry official,delivery costs to rural markets are higher than some urban marketsbecause wholesalers have to deliver smaller quantities of fluid milkproducts to more isolated, rural stores. These additional costs are oftenreflected in higher wholesale and retail prices for fluid milk in these areas.Figure 3 shows the various estimated costs associated with marketing agallon of 2-percent milk through supermarkets in the New Yorkmetropolitan area in 1995.
8 E. M. Erba, R.D. Aplin, and M.W. Stephenson, An Analysis of Processing and
Distribution Productivity and Costs in 35 Fluid Milk Plants. R.B. 97-03, Department ofAgricultural, Resource, and Management Economics. (Ithaca, NY: Cornell University,1997).

Appendix II: Factors That Influence the Price
of Fluid Milk as It Moves From the Farm to
the Consumer
Page 22 GAO-01-561 Milk Prices and Changing Market Structure
Figure 3: Estimated Costs of Marketing a Gallon of 2-Percent Milk in the New YorkMetropolitan Area, 1995
Furthermore, industry representatives told us that the Cornell study didnot include a wide range of marketing costs that wholesalers incur. Theystated that, in recent years, wholesalers have had to engage in a variety ofnew marketing activities due to the changing nature of demand for milkproducts and competition in the beverage market. For example, a 1999report commissioned by the Fluid Milk Processor Promotion Board foundthat between 1995 and 1999, the annual growth rate in fluid milkconsumption was about 0.4 percent, whereas the annual growth rate inconsumption of other competing beverages, such as soft drinks, fruitjuices, and bottled water, was 3.7 percent. The report found that fluid milk
‚
2%Selling ($0.05)
•
3%Return on investment ($0.06)
•
3%Administrative ($0.07)
•
5%Distribution ($0.10)
• 5%Packaging ($0.10)
•
11% •
Plant ($0.24)
62%•
Raw product ($1.31)
•
9%Retailing ($0.19)

Appendix II: Factors That Influence the Price
of Fluid Milk as It Moves From the Farm to
the Consumer
Page 23 GAO-01-561 Milk Prices and Changing Market Structure
is experiencing intense competition from branded beverages that haveco-opted many of the benefits of milk, for example, juices that have beenfortified with calcium. According to dairy industry experts, as otherbeverage competitors have eroded the market share of fluid milk products,milk processors have had to be more creative in providing a wider range ofproducts, in a wider assortment of packaging, for a broader variety ofoutlets. Consequently, they have incurred higher costs for (1) research anddevelopment of new products and packaging, (2) new packagingmachinery and equipment, (3) packaging materials, (4) handling anddistribution, and (5) advertising and promotion for both new and existingproducts. These elevated marketing costs are ultimately reflected in higherwholesale and retail prices for fluid milk.
When retailers sell fluid milk to consumers, the prices are influenced notonly by supply and demand considerations that determine the overallretail-level market price for fluid milk, but also by specific considerationsthat affect prices at individual retail outlets. To determine the overall pricecharged at the retail level, the quantity of fluid milk supplied by retailers isinfluenced by the prices that retailers have to pay wholesalers to acquirethe product; retailers’ operating costs, such as labor, rent, and utilities; thevolume of milk sold; and their need to earn a return on investment to stayin business. On the other hand, the amount of fluid milk that consumerspurchase at the retail level is influenced by factors beyond the price offluid milk, such as the size, age, income levels, and tastes of the populationin the marketing area, and the prices of substitutes. Studies performed byeconomists and others over the years have shown that the demand formilk at the retail level is relatively insensitive to changes in price becauseof the lack of close substitutes. Generally, these studies have concludedthat a 1-percent increase or decrease in the price of fluid milk will result inless than a 1-percent decrease or increase in the quantity that consumerswill purchase. However, several industry officials told us that they believethat the demand for milk in recent years, although still relativelyinsensitive to changes in price, has become more sensitive than in the past.In commenting on a draft of this report, USDA officials disagreed with theviews of industry officials and believe that demand for milk is generallyinsensitive to milk price changes.
Additional considerations influence the manner in which retail prices formilk are set at individual retail outlets. To meet their stores’ goals, such asprofit maximization and increased market share, retailers use acombination of strategies for pricing fluid milk. In developing these pricingstrategies, retailers consider their retailing costs, the prices charged by
Retail Milk PricesDepend on the PricingStrategies Used byRetailers

Appendix II: Factors That Influence the Price
of Fluid Milk as It Moves From the Farm to
the Consumer
Page 24 GAO-01-561 Milk Prices and Changing Market Structure
their competitors, the role that milk prices play in attracting customers totheir stores, the convenience offered by their store compared with otherstores, and their desire to build an image of quality or low prices for theirstores. The retail pricing strategies that are primarily based on a retailer’soperating costs are generally referred to as vertical pricing strategies,whereas those strategies that are based on responding to prices chargedby competitors are referred to as horizontal pricing strategies. Retailersgenerally use a combination of horizontal and vertical pricing strategieswhen setting prices for fluid milk.
Retailers who emphasize a vertical pricing strategy set retail prices in amanner that allows them to recoup (1) the price paid to wholesalers;(2) operating costs such as rent, labor, interest expense, and generaloverhead; and (3) a return on investment. Some retailers charge differentmarkups on various products sold in their stores while seeking an overallprofit margin target for the store. For example, a retailer wishing topromote a low-cost image for the store may sell gallons of 2-percent milkat or near cost while raising the price of other items in the store. On theother hand, retailers wishing to increase the profitability of their dairyproducts might maintain relatively high prices for fluid milk but set lowerprices for other items in the store. Retailers’ pricing strategy choices willdepend on their views about the importance of milk prices versus theprices of other products sold in their stores in influencing consumers’overall perceptions about their stores.
Retailers who emphasize a horizontal pricing strategy set fluid milk pricesin response to the prices being charged by competitors in their area.Retailers who emphasize such strategies are very sensitive to price levelsat neighboring retail outlets and will adjust their prices accordingly tocreate an image of lower or more competitive prices. Also, retailers whoemphasize horizontal pricing strategies may be less sensitive to marketsignals on the wholesale price of milk. Instead, they may continue to pricemilk at a certain price even though wholesalers have either increased ordecreased prices.
Furthermore, retail prices are influenced by state regulations andcustomers’ desire for convenience or high quality. For example, stateregulations that prohibit wholesalers and retailers from selling milk belowcost can result in higher retail milk prices. Such regulations preventretailers from using lower-priced milk as a means of attracting morecustomers to their stores. In addition, according to industry officials, retailprices for fluid milk may be influenced by the fact that some consumersare willing to pay a higher price for convenience and quality. For example,

Appendix II: Factors That Influence the Price
of Fluid Milk as It Moves From the Farm to
the Consumer
Page 25 GAO-01-561 Milk Prices and Changing Market Structure
convenience stores sell only a limited number of items, allowingconsumers to purchase fluid milk quickly and spend less time in the store.As a result, these stores can charge a higher price for fluid milk thansupermarkets charge primarily for the convenience that they provide.Similarly, retail stores that emphasize high-quality products may stockwidely recognized brand-label fluid milk products for which theircustomers are willing to pay a higher price because they associate thebrand label with better quality. Industry officials told us that some retailersbelieve that a stable retail price for milk may also help create animpression of high quality. However, some recent research on milk pricestability indicates that some consumers value price variability over stableprices because it allows them to take advantage of lower prices.9
9 “Empirical Tests of the Argument that Consumers Value Stable Retail Milk Prices”,Journal of Agribusiness, 18-II (2000): 155-72.

Appendix III: Analysis of Farm-to-Retail
Prices for 2-Percent Milk in Selected Markets
Page 26 GAO-01-561 Milk Prices and Changing Market Structure
This appendix summarizes our analysis of farm-to-retail prices for a gallonof 2-percent milk in 15 selected markets nationwide for March 1998through September 2000. Our analysis includes information on (1) theproportionate breakdown of the price of a gallon of milk received byfarmers, cooperatives, wholesale milk processors, and retailers; (2) howchanges in farm and retail milk prices affect the farm-to-retail milk pricespread; and (3) how price changes at any level of the marketing chainrelate to changes in prices at other levels. We limited our analysis togallons of 2-percent milk because in recent years sales of milk productswith a reduced fat content have increased and account for about63 percent of all retail sales of fluid milk. Of this amount, sales of 2-percentmilk account for about 55 percent of the total sales of milk with a reducedfat content. The farm and cooperative prices, which are included in ouranalysis and presented in this appendix, have been adjusted for 2-percentmilkfat. Our analysis of 2-percent milk prices may not reflect pricingpatterns and trends for the other three kinds of milk. Complete data onprices for all four kinds of milk—whole, 1-percent, and skim as well as2-percent—are presented in appendix V.
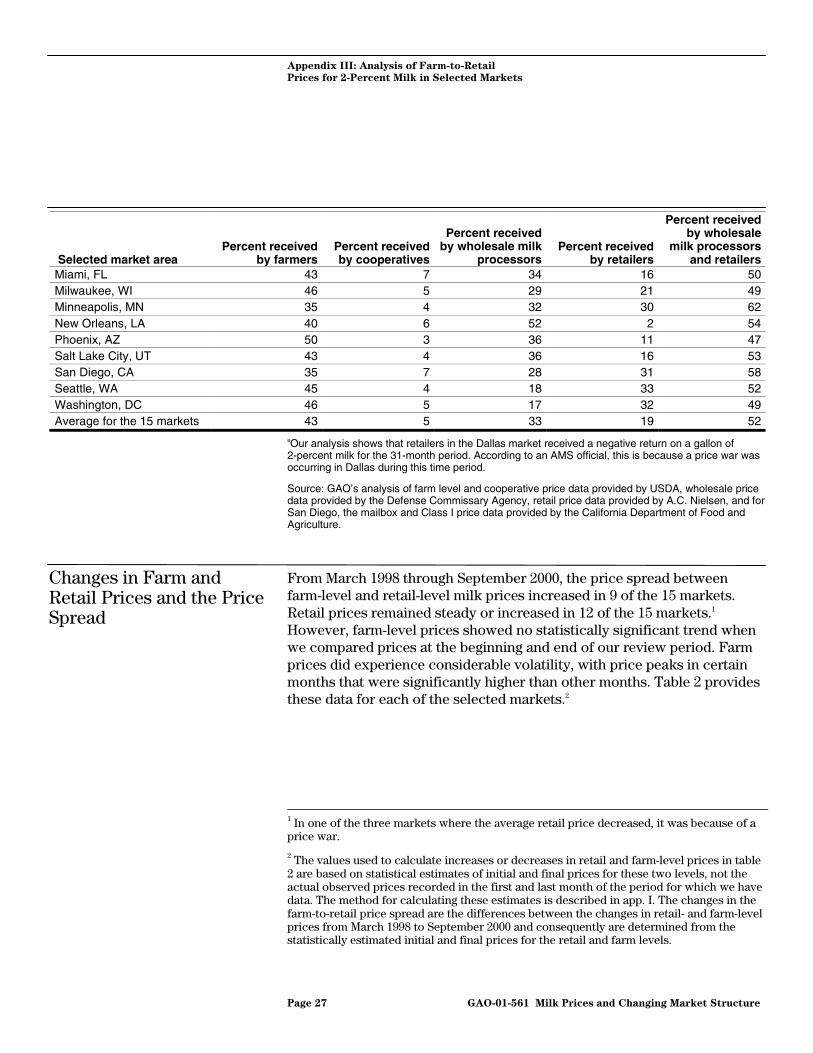
Between March 1998 and September 2000, on average, farmers received43 percent, cooperatives 5 percent, wholesale milk processors 33 percent,and retailers 19 percent of the retail price of a gallon of 2-percent milk inthe markets we reviewed. However, these numbers varied widelydepending on the specific market. For example, the farmers’ portion of theprice of a gallon of milk ranged from 35 percent to 52 percent, whileretailers collected anywhere from 2 percent to 33 percent. Table 1provides these data for each of the selected markets.
Table 1: Portion of the Retail Price of a Gallon of 2-Percent Milk Received by Farmers, Cooperatives, Wholesale MilkProcessors, and Retailers for 15 Markets, March 1998 Through September 2000
Selected market areaPercent received
by farmersPercent receivedby cooperatives
Percent receivedby wholesale milk
processorsPercent received
by retailers
Percent receivedby wholesale
milk processorsand retailers
Atlanta, GA 39 6 31 24 55Boston, MA 47 5 23 25 48Charlotte, NC 42 5 29 24 53Cincinnati, OH 50 5 36 9 45Dallas, TX 52 4 65 (21)a 43Denver, CO 38 4 24 33 57
Appendix III: Analysis of Farm-to-RetailPrices for 2-Percent Milk in Selected Markets
Portion Received byFarmers,Cooperatives,Wholesale MilkProcessors, andRetailers
Appendix III: Analysis of Farm-to-Retail
Prices for 2-Percent Milk in Selected Markets
Page 27 GAO-01-561 Milk Prices and Changing Market Structure
Selected market areaPercent received
by farmersPercent receivedby cooperatives
Percent receivedby wholesale milk
processorsPercent received
by retailers
Percent receivedby wholesale
milk processorsand retailers
Miami, FL 43 7 34 16 50Milwaukee, WI 46 5 29 21 49Minneapolis, MN 35 4 32 30 62New Orleans, LA 40 6 52 2 54Phoenix, AZ 50 3 36 11 47Salt Lake City, UT 43 4 36 16 53San Diego, CA 35 7 28 31 58Seattle, WA 45 4 18 33 52Washington, DC 46 5 17 32 49Average for the 15 markets 43 5 33 19 52
aOur analysis shows that retailers in the Dallas market received a negative return on a gallon of2-percent milk for the 31-month period. According to an AMS official, this is because a price war wasoccurring in Dallas during this time period.
Source: GAO’s analysis of farm level and cooperative price data provided by USDA, wholesale pricedata provided by the Defense Commissary Agency, retail price data provided by A.C. Nielsen, and forSan Diego, the mailbox and Class I price data provided by the California Department of Food andAgriculture.
From March 1998 through September 2000, the price spread betweenfarm-level and retail-level milk prices increased in 9 of the 15 markets.Retail prices remained steady or increased in 12 of the 15 markets.1
However, farm-level prices showed no statistically significant trend whenwe compared prices at the beginning and end of our review period. Farmprices did experience considerable volatility, with price peaks in certainmonths that were significantly higher than other months. Table 2 providesthese data for each of the selected markets.2
1 In one of the three markets where the average retail price decreased, it was because of aprice war.
2 The values used to calculate increases or decreases in retail and farm-level prices in table2 are based on statistical estimates of initial and final prices for these two levels, not theactual observed prices recorded in the first and last month of the period for which we havedata. The method for calculating these estimates is described in app. I. The changes in thefarm-to-retail price spread are the differences between the changes in retail- and farm-levelprices from March 1998 to September 2000 and consequently are determined from thestatistically estimated initial and final prices for the retail and farm levels.
Changes in Farm andRetail Prices and the PriceSpread
Appendix III: Analysis of Farm-to-Retail
Prices for 2-Percent Milk in Selected Markets
Page 28 GAO-01-561 Milk Prices and Changing Market Structure
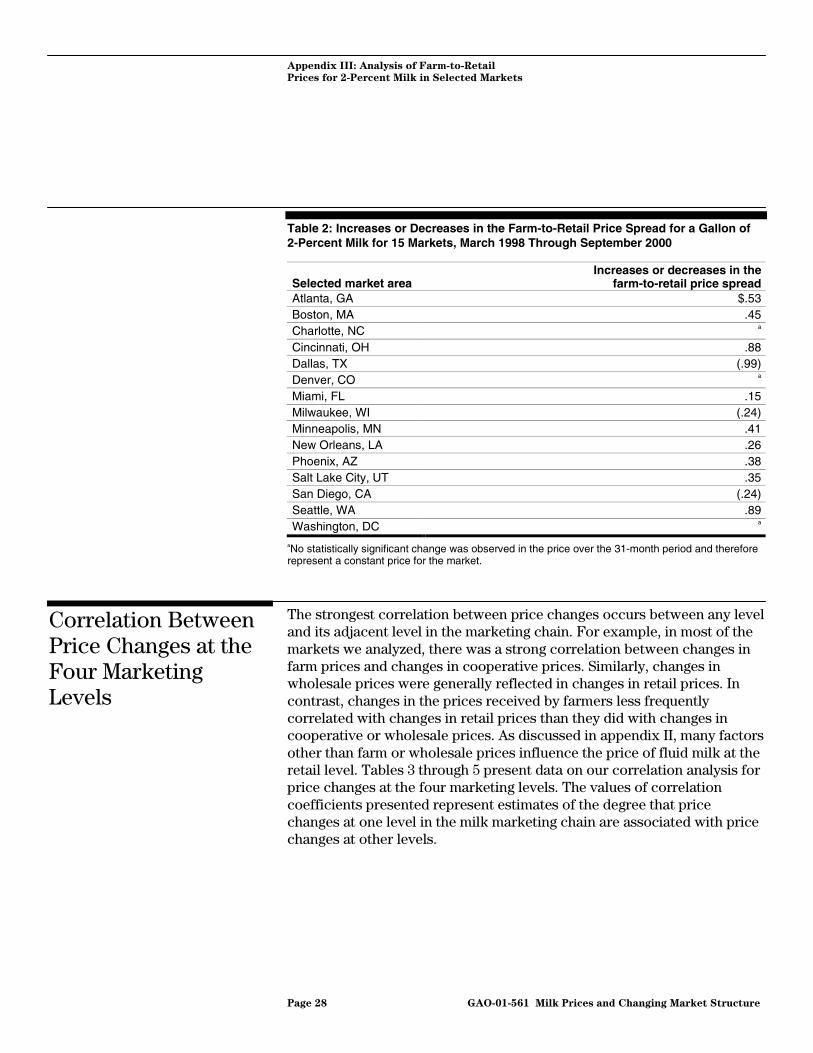
Table 2: Increases or Decreases in the Farm-to-Retail Price Spread for a Gallon of2-Percent Milk for 15 Markets, March 1998 Through September 2000
Selected market areaIncreases or decreases in the
farm-to-retail price spreadAtlanta, GA $.53Boston, MA .45Charlotte, NC a
Cincinnati, OH .88Dallas, TX (.99)Denver, CO a
Miami, FL .15Milwaukee, WI (.24)Minneapolis, MN .41New Orleans, LA .26Phoenix, AZ .38Salt Lake City, UT .35San Diego, CA (.24)Seattle, WA .89Washington, DC a
aNo statistically significant change was observed in the price over the 31-month period and thereforerepresent a constant price for the market.
The strongest correlation between price changes occurs between any leveland its adjacent level in the marketing chain. For example, in most of themarkets we analyzed, there was a strong correlation between changes infarm prices and changes in cooperative prices. Similarly, changes inwholesale prices were generally reflected in changes in retail prices. Incontrast, changes in the prices received by farmers less frequentlycorrelated with changes in retail prices than they did with changes incooperative or wholesale prices. As discussed in appendix II, many factorsother than farm or wholesale prices influence the price of fluid milk at theretail level. Tables 3 through 5 present data on our correlation analysis forprice changes at the four marketing levels. The values of correlationcoefficients presented represent estimates of the degree that pricechanges at one level in the milk marketing chain are associated with pricechanges at other levels.
Correlation BetweenPrice Changes at theFour MarketingLevels

Appendix III: Analysis of Farm-to-Retail
Prices for 2-Percent Milk in Selected Markets
Page 29 GAO-01-561 Milk Prices and Changing Market Structure
Table 3: Correlation Between Farm-Level Price Changes and Changes in Cooperative, Wholesale, and Retail Prices for aGallon of 2-Percent Milk for 15 Markets, March 1998 Through September 2000
Selected market areaCorrelation coefficients for
cooperative pricesCorrelation coefficients for
wholesale pricesCorrelation coefficients for
retail pricesAtlanta, GA .9952* .6684* .0916Boston, MA .9994* .7197* .5485*Charlotte, NC .9967* .8780* .6787*Cincinnati, OH .9995* .5501* .2302Dallas, TX .9986* .1391 .4452*Denver, CO .9980* .7788* .6198*Miami, FL .9913* a .4988*Milwaukee, WI .9995* (.0290) .6997*Minneapolis, MN .9995* .5684* .4588*New Orleans, LA .9956* .7477* .4326*Phoenix, AZ .9941* .7318* .2938Salt Lake City, UT .9984* .5722* .4873*San Diego, CA .7342* .7064* .5411*Seattle, WA .9999* .7593* .2244Washington, DC .9998* .7297* .6430*
Note: In calculating the correlation coefficients for each market, we omitted the months for which datawere missing.
*Indicates that the correlation coefficient is statistically significant (i.e., p < .05). However, we have notincluded the p-values in the table.
aWe could not calculate the correlation coefficients for the wholesale level for Miami, Florida, becausethe wholesale price did not change during our analysis period.

Appendix III: Analysis of Farm-to-Retail
Prices for 2-Percent Milk in Selected Markets
Page 30 GAO-01-561 Milk Prices and Changing Market Structure
Table 4: Correlation Between Cooperative-Level Price Changes and Changes in Wholesale and Retail Prices for a Gallon of2-Percent Milk for 15 Markets, March 1998 Through September 2000
Selected market area Correlation coefficients for wholesale prices Correlation coefficients for retail pricesAtlanta, GA .6564* .1484Boston, MA .7161* .5414*Charlotte, NC .8601* .6989*Cincinnati, OH .5450* .2253Dallas, TX .1664 .4156*Denver, CO .7926* .6358*Miami, FL a .5443*Milwaukee, WI (.0136) .6957*Minneapolis, MN .5667* .4745*New Orleans, LA .7791* .4831*Phoenix, AZ .7632* .3475*Salt Lake City, UT .5561* .4761*San Diego, CA .9667* .7077*Seattle, WA .7593* .2274Washington, DC .7288* .6429*
Note: In calculating the correlation coefficients for each market, we omitted the months for which datawere missing.
*Indicates that the correlation coefficient is statistically significant (i.e., p < .05). However, we have notincluded the p-values in the table.
aWe could not calculate the correlation coefficients for the wholesale level for Miami, Florida, becausethe wholesale price did not change during our analysis period.
Table 5: Correlation Between Wholesale-Level Price Changes and Changes in Retail Prices for a Gallon of 2-Percent Milk for15 Markets, March 1998 Through September 2000
Selected market area Correlation coefficients for retail pricesAtlanta, GA .0823Boston, MA .7153*Charlotte, NC .4510*Cincinnati, OH .7459*Dallas, TX (.5796)*Denver, CO .5719*Miami, FL a
Milwaukee, WI (.3925)*Minneapolis, MN .3257New Orleans, LA .7715*Phoenix, AZ .5492*Salt Lake City, UT .7312*San Diego, CA .7968*Seattle, WA (.1000)Washington, DC .2200
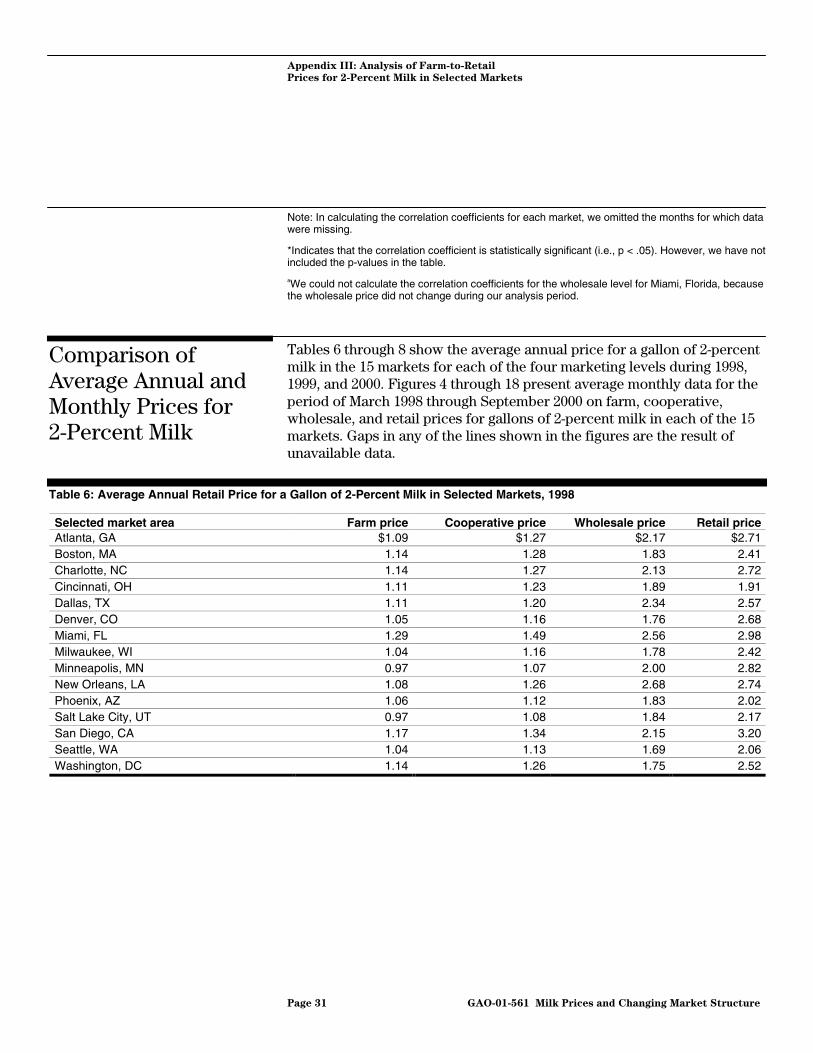
Appendix III: Analysis of Farm-to-Retail
Prices for 2-Percent Milk in Selected Markets
Page 31 GAO-01-561 Milk Prices and Changing Market Structure
Note: In calculating the correlation coefficients for each market, we omitted the months for which datawere missing.
*Indicates that the correlation coefficient is statistically significant (i.e., p < .05). However, we have notincluded the p-values in the table.
aWe could not calculate the correlation coefficients for the wholesale level for Miami, Florida, becausethe wholesale price did not change during our analysis period.
Tables 6 through 8 show the average annual price for a gallon of 2-percentmilk in the 15 markets for each of the four marketing levels during 1998,1999, and 2000. Figures 4 through 18 present average monthly data for theperiod of March 1998 through September 2000 on farm, cooperative,wholesale, and retail prices for gallons of 2-percent milk in each of the 15markets. Gaps in any of the lines shown in the figures are the result ofunavailable data.
Table 6: Average Annual Retail Price for a Gallon of 2-Percent Milk in Selected Markets, 1998
Selected market area Farm price Cooperative price Wholesale price Retail priceAtlanta, GA $1.09 $1.27 $2.17 $2.71Boston, MA 1.14 1.28 1.83 2.41Charlotte, NC 1.14 1.27 2.13 2.72Cincinnati, OH 1.11 1.23 1.89 1.91Dallas, TX 1.11 1.20 2.34 2.57Denver, CO 1.05 1.16 1.76 2.68Miami, FL 1.29 1.49 2.56 2.98Milwaukee, WI 1.04 1.16 1.78 2.42Minneapolis, MN 0.97 1.07 2.00 2.82New Orleans, LA 1.08 1.26 2.68 2.74Phoenix, AZ 1.06 1.12 1.83 2.02Salt Lake City, UT 0.97 1.08 1.84 2.17San Diego, CA 1.17 1.34 2.15 3.20Seattle, WA 1.04 1.13 1.69 2.06Washington, DC 1.14 1.26 1.75 2.52
Comparison ofAverage Annual andMonthly Prices for2-Percent Milk
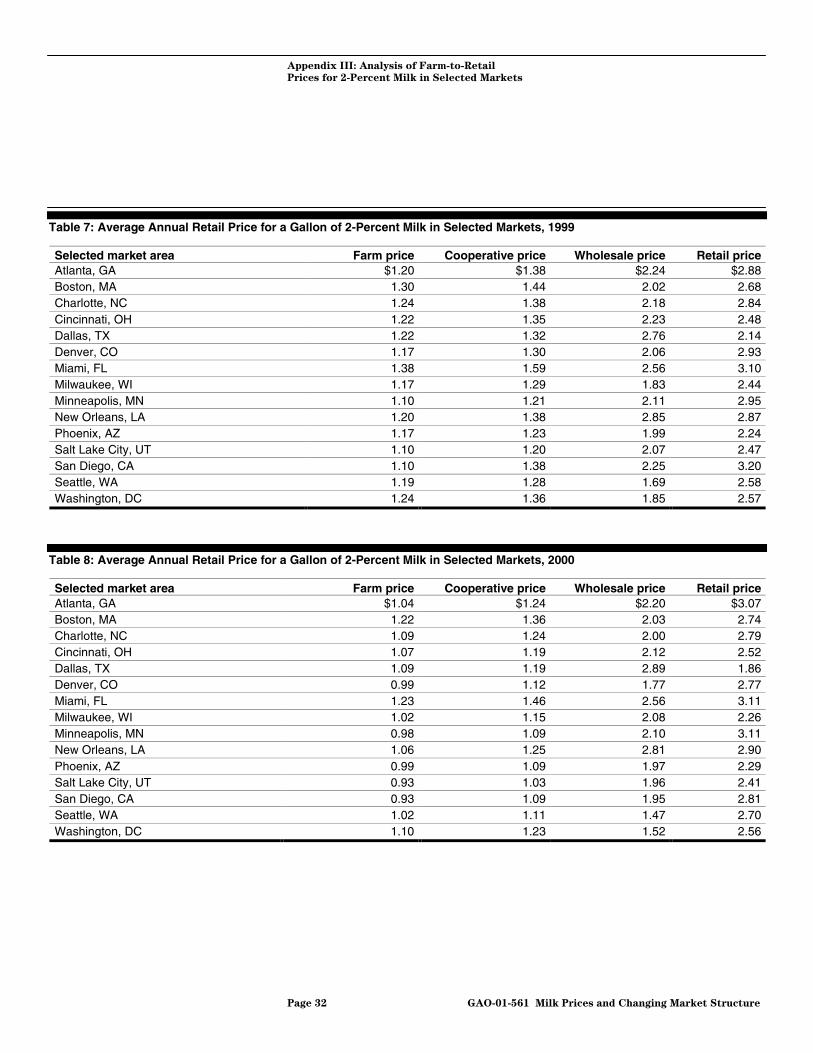
Appendix III: Analysis of Farm-to-Retail
Prices for 2-Percent Milk in Selected Markets
Page 32 GAO-01-561 Milk Prices and Changing Market Structure
Table 7: Average Annual Retail Price for a Gallon of 2-Percent Milk in Selected Markets, 1999
Selected market area Farm price Cooperative price Wholesale price Retail priceAtlanta, GA $1.20 $1.38 $2.24 $2.88Boston, MA 1.30 1.44 2.02 2.68Charlotte, NC 1.24 1.38 2.18 2.84Cincinnati, OH 1.22 1.35 2.23 2.48Dallas, TX 1.22 1.32 2.76 2.14Denver, CO 1.17 1.30 2.06 2.93Miami, FL 1.38 1.59 2.56 3.10Milwaukee, WI 1.17 1.29 1.83 2.44Minneapolis, MN 1.10 1.21 2.11 2.95New Orleans, LA 1.20 1.38 2.85 2.87Phoenix, AZ 1.17 1.23 1.99 2.24Salt Lake City, UT 1.10 1.20 2.07 2.47San Diego, CA 1.10 1.38 2.25 3.20Seattle, WA 1.19 1.28 1.69 2.58Washington, DC 1.24 1.36 1.85 2.57
Table 8: Average Annual Retail Price for a Gallon of 2-Percent Milk in Selected Markets, 2000
Selected market area Farm price Cooperative price Wholesale price Retail priceAtlanta, GA $1.04 $1.24 $2.20 $3.07Boston, MA 1.22 1.36 2.03 2.74Charlotte, NC 1.09 1.24 2.00 2.79Cincinnati, OH 1.07 1.19 2.12 2.52Dallas, TX 1.09 1.19 2.89 1.86Denver, CO 0.99 1.12 1.77 2.77Miami, FL 1.23 1.46 2.56 3.11Milwaukee, WI 1.02 1.15 2.08 2.26Minneapolis, MN 0.98 1.09 2.10 3.11New Orleans, LA 1.06 1.25 2.81 2.90Phoenix, AZ 0.99 1.09 1.97 2.29Salt Lake City, UT 0.93 1.03 1.96 2.41San Diego, CA 0.93 1.09 1.95 2.81Seattle, WA 1.02 1.11 1.47 2.70Washington, DC 1.10 1.23 1.52 2.56
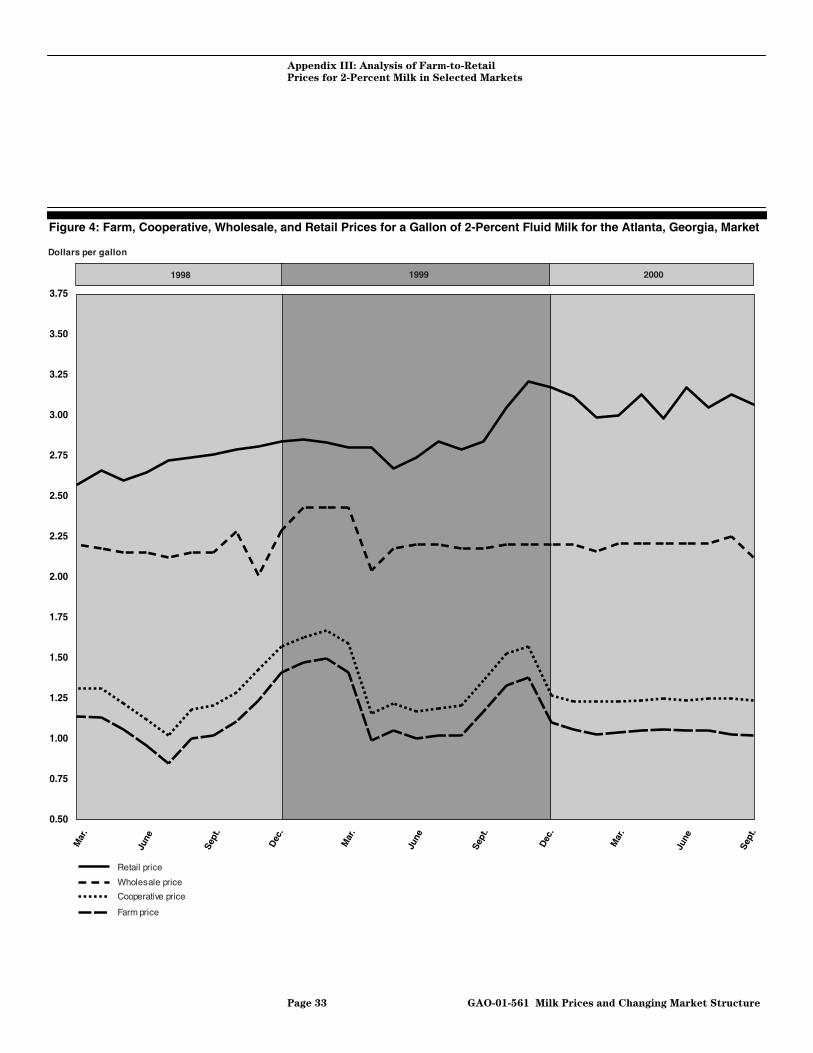
Appendix III: Analysis of Farm-to-Retail
Prices for 2-Percent Milk in Selected Markets
Page 33 GAO-01-561 Milk Prices and Changing Market Structure
Figure 4: Farm, Cooperative, Wholesale, and Retail Prices for a Gallon of 2-Percent Fluid Milk for the Atlanta, Georgia, Market
1998 1999 2000
0.50
0.75
1.00
1.25
1.50
1.75
2.00
2.25
2.50
2.75
3.00
3.25
3.50
3.75
Dollars per gallon
Retail price
Wholesale price
Cooperative price
Farm price
Mar
.
June
Sept
.
Dec
.
Mar
.
June
Sept
.
Dec
.
Mar
.
June
Sept
.

Appendix III: Analysis of Farm-to-Retail
Prices for 2-Percent Milk in Selected Markets
Page 34 GAO-01-561 Milk Prices and Changing Market Structure
Note: For the Atlanta, Georgia, market, the farm price is the USDA estimated farm level Class I priceadjusted to 2-percent milkfat content; the cooperative price is the announced cooperative Class Iprice for Atlanta adjusted to 2-percent milkfat content; the wholesale price is the price paid by thecommissary at the Athens Naval Supply Corps School; and the retail price is the A.C. Nielsen pricefor the Atlanta market.

Appendix III: Analysis of Farm-to-Retail
Prices for 2-Percent Milk in Selected Markets
Page 35 GAO-01-561 Milk Prices and Changing Market Structure
Figure 5: Farm, Cooperative, Wholesale, and Retail Prices for a Gallon of 2-Percent Fluid Milk for the Boston, Massachusetts,Market
1998 1999 2000
0.50
0.75
1.00
1.25
1.50
1.75
2.00
2.25
2.50
2.75
3.00
3.25
3.50
3.75
Retail price
Wholesale price
Cooperative price
Farm price
Dollars per gallon
Mar
.
June
Sept
.
Dec
.
Mar
.
June
Sept
.
Dec
.
Mar
.
June
Sept
.

Appendix III: Analysis of Farm-to-Retail
Prices for 2-Percent Milk in Selected Markets
Page 36 GAO-01-561 Milk Prices and Changing Market Structure
Note: For the Boston, Massachusetts, market, the farm price is the USDA estimated farm levelClass I price adjusted to 2-percent milkfat content; the cooperative price is the effective cooperativeClass I price for Boston adjusted to 2-percent milkfat content; the wholesale price is the price paid bythe commissary at the Hanscom Air Force Base; and the retail price is the A.C. Nielsen price for theBoston market.

Appendix III: Analysis of Farm-to-Retail
Prices for 2-Percent Milk in Selected Markets
Page 37 GAO-01-561 Milk Prices and Changing Market Structure
Figure 6: Farm, Cooperative, Wholesale, and Retail Prices for a Gallon of 2-Percent Fluid Milk for the Charlotte, NorthCarolina, Market
1998 1999 2000
0.50
0.75
1.00
1.25
1.50
1.75
2.00
2.25
2.50
2.75
3.00
3.25
3.50
3.75
Retail price
Wholesale price
Cooperative price
Farm price
Dollars per gallon
Mar
.
June
Sept
.
Dec
.
Mar
.
June
Sept
.
Dec
.
Mar
.
June
Sept
.

Appendix III: Analysis of Farm-to-Retail
Prices for 2-Percent Milk in Selected Markets
Page 38 GAO-01-561 Milk Prices and Changing Market Structure
Note: For the Charlotte, North Carolina, market, the farm price is the USDA estimated farm levelClass I price adjusted to 2-percent milkfat content; the cooperative price is the announcedcooperative Class I price for Charlotte adjusted to 2-percent milkfat content; the wholesale price is theprice paid by the commissary at Fort Bragg; and the retail price is the A.C. Nielsen price for theCharlotte market.

Appendix III: Analysis of Farm-to-Retail
Prices for 2-Percent Milk in Selected Markets
Page 39 GAO-01-561 Milk Prices and Changing Market Structure
Figure 7: Farm, Cooperative, Wholesale, and Retail Prices for a Gallon of 2-Percent Fluid Milk for the Cincinnati, Ohio, Market
1998 1999 2000
0.50
0.75
1.00
1.25
1.50
1.75
2.00
2.25
2.50
2.75
3.00
3.25
3.50
3.75
Farm price
Cooperative price
Wholesale price
Retail price
Dollars per gallon
Mar
.
June
Sept
.
Dec
.
Mar
.
June
Sept
.
Dec
.
Mar
.
June
Sept
.

Appendix III: Analysis of Farm-to-Retail
Prices for 2-Percent Milk in Selected Markets
Page 40 GAO-01-561 Milk Prices and Changing Market Structure
Note: For the Cincinnati, Ohio, market, the farm price is the USDA estimated farm level Class I priceadjusted to 2-percent milkfat content; the cooperative price is the announced cooperative Class Iprice for Cincinnati adjusted to 2-percent milkfat content; the wholesale price is the price paid by thecommissary at the Wright Patterson Air Force Base; and the retail price is the A.C. Nielsen price forthe Cincinnati market.

Appendix III: Analysis of Farm-to-Retail
Prices for 2-Percent Milk in Selected Markets
Page 41 GAO-01-561 Milk Prices and Changing Market Structure
Figure 8: Farm, Cooperative, Wholesale, and Retail Prices for a Gallon of 2-Percent Fluid Milk for the Dallas, Texas, Market
1998 1999 2000
0.50
0.75
1.00
1.25
1.50
1.75
2.00
2.25
2.50
2.75
3.00
3.25
3.50
3.75
Farm price
Cooperative price
Wholesale price
Retail price
Dollars per gallon
Mar
.
June
Sept
.
Dec
.
Mar
.
June
Sept
.
Dec
.
Mar
.
June
Sept
.

Appendix III: Analysis of Farm-to-Retail
Prices for 2-Percent Milk in Selected Markets
Page 42 GAO-01-561 Milk Prices and Changing Market Structure
Note: For the Dallas, Texas, market, the farm price is the USDA estimated farm level Class I priceadjusted to 2-percent milkfat content; the cooperative price is the announced cooperative Class Iprice for Dallas adjusted to 2-percent milkfat content; the wholesale price is the GAO estimated pricepaid by the commissary at the Kelly Air Force Base; and the retail price is the A.C. Nielsen price forthe Dallas market. Because data were not available for all wholesale 2-percent milk prices exceptSeptember 2000, we estimated these prices as equal to the lower of the whole milk prices or the1-percent milk prices.

Appendix III: Analysis of Farm-to-Retail
Prices for 2-Percent Milk in Selected Markets
Page 43 GAO-01-561 Milk Prices and Changing Market Structure
Figure 9: Farm, Cooperative, Wholesale, and Retail Prices for a Gallon of 2-Percent Fluid Milk for the Denver, Colorado,Market
1998 1999 2000
Retail price
Wholesale price
Cooperative price
Farm price
0.50
0.75
1.00
1.25
1.50
1.75
2.00
2.25
2.50
2.75
3.00
3.25
3.50
3.75
Dollars per gallon
Mar
.
June
Sept
.
Dec
.
Mar
.
June
Sept
.
Dec
.
Mar
.
June
Sept
.

Appendix III: Analysis of Farm-to-Retail
Prices for 2-Percent Milk in Selected Markets
Page 44 GAO-01-561 Milk Prices and Changing Market Structure
Note: For the Denver, Colorado, market, the farm price is the USDA estimated farm level Class I priceadjusted to 2-percent milkfat content; the cooperative price is the announced cooperative Class Iprice for Denver adjusted to 2-percent milkfat content; the wholesale price is the price paid by thecommissary at the Fitzsimons U.S. Army Garrison; and the retail price is the A.C. Nielsen price for theDenver market. Gaps in any of the lines are the result of unavailable data.

Appendix III: Analysis of Farm-to-Retail
Prices for 2-Percent Milk in Selected Markets
Page 45 GAO-01-561 Milk Prices and Changing Market Structure
Figure 10: Farm, Cooperative, Wholesale, and Retail Prices for a Gallon of 2-Percent Fluid Milk for the Miami, Florida, Market
1998 1999 2000
0.50
0.75
1.00
1.25
1.50
1.75
2.00
2.25
2.50
2.75
3.00
3.25
3.50
3.75
Retail price
Wholesale price
Cooperative price
Farm price
Dollars per gallon
Mar
.
June
Sept
.
Dec
.
Mar
.
June
Sept
.
Dec
.
Mar
.
June
Sept
.

Appendix III: Analysis of Farm-to-Retail
Prices for 2-Percent Milk in Selected Markets
Page 46 GAO-01-561 Milk Prices and Changing Market Structure
Note: For the Miami, Florida, market, the farm price is the USDA estimated farm level Class I priceadjusted to 2-percent milkfat content; the cooperative price is the announced cooperative Class Iprice for Miami adjusted to 2-percent milkfat content; the wholesale price is the price paid by thecommissary at the Key West Naval Air Station; and the retail price is the A.C. Nielsen price for theMiami market.

Appendix III: Analysis of Farm-to-Retail
Prices for 2-Percent Milk in Selected Markets
Page 47 GAO-01-561 Milk Prices and Changing Market Structure
Figure 11: Farm, Cooperative, Wholesale, and Retail Prices for a Gallon of 2-Percent Fluid Milk for the Milwaukee, Wisconsin,Market
1998 1999 2000
Dollars per gallon
0.50
0.75
1.00
1.25
1.50
1.75
2.00
2.25
2.50
2.75
3.00
3.25
3.50
3.75
Farm priceCooperative price
Wholesale price
Retail price
Mar
.
June
Sept
.
Dec
.
Mar
.
June
Sept
.
Dec
.
Mar
.
June
Sept
.

Appendix III: Analysis of Farm-to-Retail
Prices for 2-Percent Milk in Selected Markets
Page 48 GAO-01-561 Milk Prices and Changing Market Structure
Note: For the Milwaukee, Wisconsin, market, the farm price is the USDA estimated farm level Class Iprice adjusted to 2-percent milkfat content; the cooperative price is the announced cooperativeGClass I price for Milwaukee adjusted to 2-percent milkfat content; the wholesale price is the pricepaid by the commissary at the Great Lakes Naval Training Center; and the retail price is the A.C.Nielsen price for the Milwaukee market.

Appendix III: Analysis of Farm-to-Retail
Prices for 2-Percent Milk in Selected Markets
Page 49 GAO-01-561 Milk Prices and Changing Market Structure
Figure 12: Farm, Cooperative, Wholesale, and Retail Prices for a Gallon of 2-Percent Fluid Milk for the Minneapolis,Minnesota, Market
1998 1999 2000
0.50
0.75
1.00
1.25
1.50
1.75
2.00
2.25
2.50
2.75
3.00
3.25
3.50
3.75
Farm price
Cooperative price
Wholesale price
Retail price
Dollars per gallon
Mar
.
June
Sept
.
Dec
.
Mar
.
June
Sept
.
Dec
.
Mar
.
June
Sept
.

Appendix III: Analysis of Farm-to-Retail
Prices for 2-Percent Milk in Selected Markets
Page 50 GAO-01-561 Milk Prices and Changing Market Structure
Note: For the Minneapolis, Minnesota, market, the farm price is the USDA estimated farm levelClass I price adjusted to 2-percent milkfat content; the cooperative price is the announcedcooperative Class I price for Minneapolis adjusted to 2-percent milkfat content; the wholesale price isthe price paid by the commissary at Fort McCoy; and the retail price is the A.C. Nielsen price for theMinneapolis market.

Appendix III: Analysis of Farm-to-Retail
Prices for 2-Percent Milk in Selected Markets
Page 51 GAO-01-561 Milk Prices and Changing Market Structure
Figure 13: Farm, Cooperative, Wholesale, and Retail Prices for a Gallon of 2-Percent Fluid Milk for the New Orleans,Louisiana, Market
1998 1999 2000
0.50
0.75
1.00
1.25
1.50
1.75
2.00
2.25
2.50
2.75
3.00
3.25
3.50
3.75
Farm price
Cooperative price
Wholesale price
Retail price
Dollars per gallon
Mar
.
June
Sept
.
Dec
.
Mar
.
June
Sept
.
Dec
.
Mar
.
June
Sept
.

Appendix III: Analysis of Farm-to-Retail
Prices for 2-Percent Milk in Selected Markets
Page 52 GAO-01-561 Milk Prices and Changing Market Structure
Note: For the New Orleans, Louisiana, market, the farm price is the USDA estimated farm levelClass I price adjusted to 2-percent milkfat content; the cooperative price is the announcedcooperative Class I price for New Orleans adjusted to 2-percent milkfat content; the wholesale price isthe price paid by the commissary at the New Orleans Naval Air Station; and the retail price is the A.C.Nielsen price for the New Orleans-Mobile market.
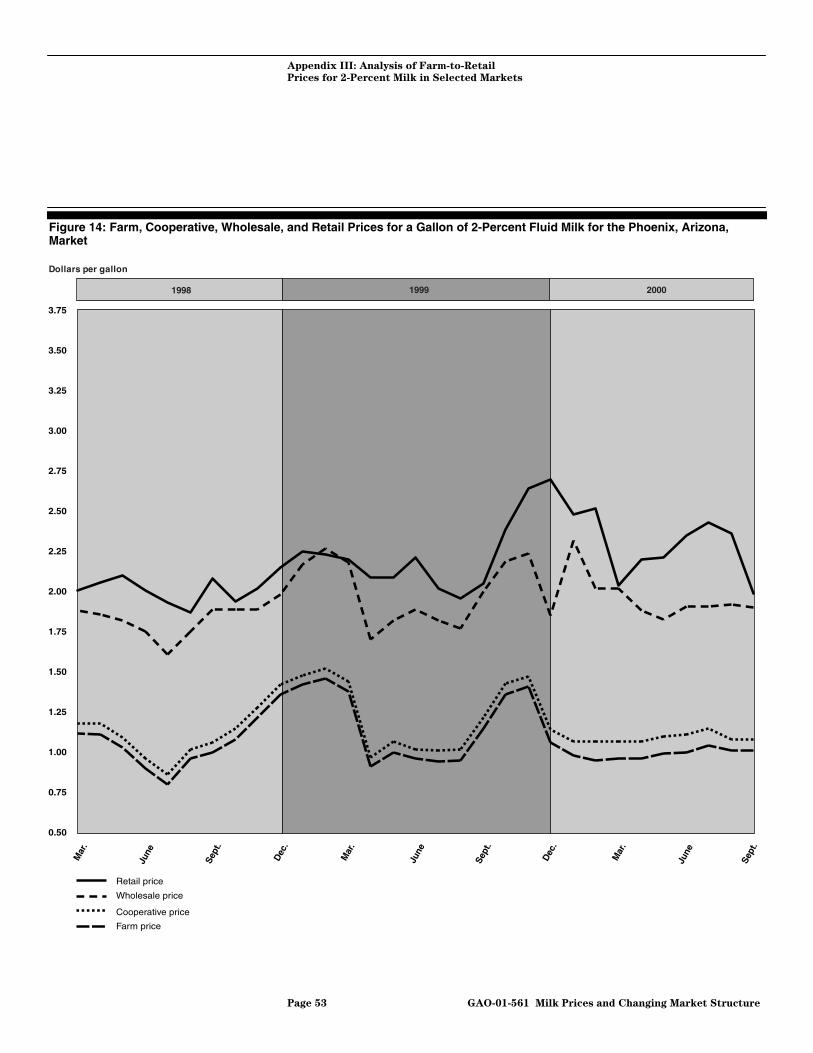
Appendix III: Analysis of Farm-to-Retail
Prices for 2-Percent Milk in Selected Markets
Page 53 GAO-01-561 Milk Prices and Changing Market Structure
Figure 14: Farm, Cooperative, Wholesale, and Retail Prices for a Gallon of 2-Percent Fluid Milk for the Phoenix, Arizona,Market
1998 1999 2000
Dollars per gallon
0.50
0.75
1.00
1.25
1.50
1.75
2.00
2.25
2.50
2.75
3.00
3.25
3.50
3.75
Farm price
Cooperative price
Wholesale price
Retail price
Mar
.
June
Sept
.
Dec
.
Mar
.
June
Sept
.
Dec
.
Mar
.
June
Sept
.
Appendix III: Analysis of Farm-to-Retail
Prices for 2-Percent Milk in Selected Markets
Page 54 GAO-01-561 Milk Prices and Changing Market Structure
Note: For the Phoenix, Arizona, market, the farm price is the USDA estimated farm level Class I priceadjusted to 2-percent milkfat content; the cooperative price is the announced cooperative Class Iprice for Phoenix adjusted to 2-percent milkfat content; the wholesale price is the price paid by thecommissary at the Luke Air Force Base; and the retail price is the A.C. Nielsen price for the Phoenixmarket.

Appendix III: Analysis of Farm-to-Retail
Prices for 2-Percent Milk in Selected Markets
Page 55 GAO-01-561 Milk Prices and Changing Market Structure
Figure 15: Farm, Cooperative, Wholesale, and Retail Prices for a Gallon of 2-Percent Fluid Milk for the Salt Lake City, Utah,Market
1998 1999 2000
Dollars per gallon
0.50
0.75
1.00
1.25
1.50
1.75
2.00
2.25
2.50
2.75
3.00
3.25
3.50
3.75
Farm price
Cooperative price
Wholesale price
Retail price
Mar
.
June
Sept
.
Dec
.
Mar
.
June
Sept
.
Dec
.
Mar
.
June
Sept
.

Appendix III: Analysis of Farm-to-Retail
Prices for 2-Percent Milk in Selected Markets
Page 56 GAO-01-561 Milk Prices and Changing Market Structure
Note: For the Salt Lake City, Utah, market, the farm price is the USDA estimated farm level Class Iprice adjusted to 2-percent milkfat content; the cooperative price is the announced cooperativeClass I price for Salt Lake City adjusted to 2-percent milkfat content; the wholesale price is the pricepaid by the commissary at the Hill Air Force Base; and the retail price is the A.C. Nielsen price for theSalt Lake City-Boise market. Gaps in any of the lines are the result of unavailable data.

Appendix III: Analysis of Farm-to-Retail
Prices for 2-Percent Milk in Selected Markets
Page 57 GAO-01-561 Milk Prices and Changing Market Structure
Figure 16: Farm, Cooperative, Wholesale, and Retail Prices for a Gallon of 2-Percent Fluid Milk for the San Diego, California,Market
1998 1999 2000
Dollars per gallon
0.50
0.75
1.00
1.25
1.50
1.75
2.00
2.25
2.50
2.75
3.00
3.25
3.50
3.75
Farm price
Cooperative price
Wholesale price
Retail price
Mar
.
June
Sept
.
Dec
.
Mar
.
June
Sept
.
Dec
.
Mar
.
June
Sept
.
Appendix III: Analysis of Farm-to-Retail
Prices for 2-Percent Milk in Selected Markets
Page 58 GAO-01-561 Milk Prices and Changing Market Structure
Note: For the San Diego, California, market, the farm price is the California mailbox price adjusted to2-percent milkfat content; the cooperative price is the Southern California Class I price adjusted to2-percent milkfat content; the wholesale price is the price paid by the commissary at the San DiegoNaval Station; and the retail price is the A.C. Nielsen price for the San Diego market.

Appendix III: Analysis of Farm-to-Retail
Prices for 2-Percent Milk in Selected Markets
Page 59 GAO-01-561 Milk Prices and Changing Market Structure
Figure 17: Farm, Cooperative, Wholesale, and Retail Prices for a Gallon of 2-Percent Fluid Milk for the Seattle, Washington,Market
1998 1999 2000
Dollars per gallon
0.50
0.75
1.00
1.25
1.50
1.75
2.00
2.25
2.50
2.75
3.00
3.25
3.50
3.75
Farm price
Cooperative price
Wholesale price
Retail price
Mar
.
June
Sept
.
Dec
.
Mar
.
June
Sept
.
Dec
.
Mar
.
June
Sept
.
Appendix III: Analysis of Farm-to-Retail
Prices for 2-Percent Milk in Selected Markets
Page 60 GAO-01-561 Milk Prices and Changing Market Structure
Note: For the Seattle, Washington, market, the farm price is the USDA estimated farm level Class Iprice adjusted to 2-percent milkfat content; the cooperative price is the announced cooperativeClass I price for Seattle adjusted to 2-percent milkfat content; the wholesale price is the price paid bythe commissary at the Everett Naval Station; and the retail price is the A.C. Nielsen price for theSeattle market. Gaps in any of the lines are the result of unavailable data.
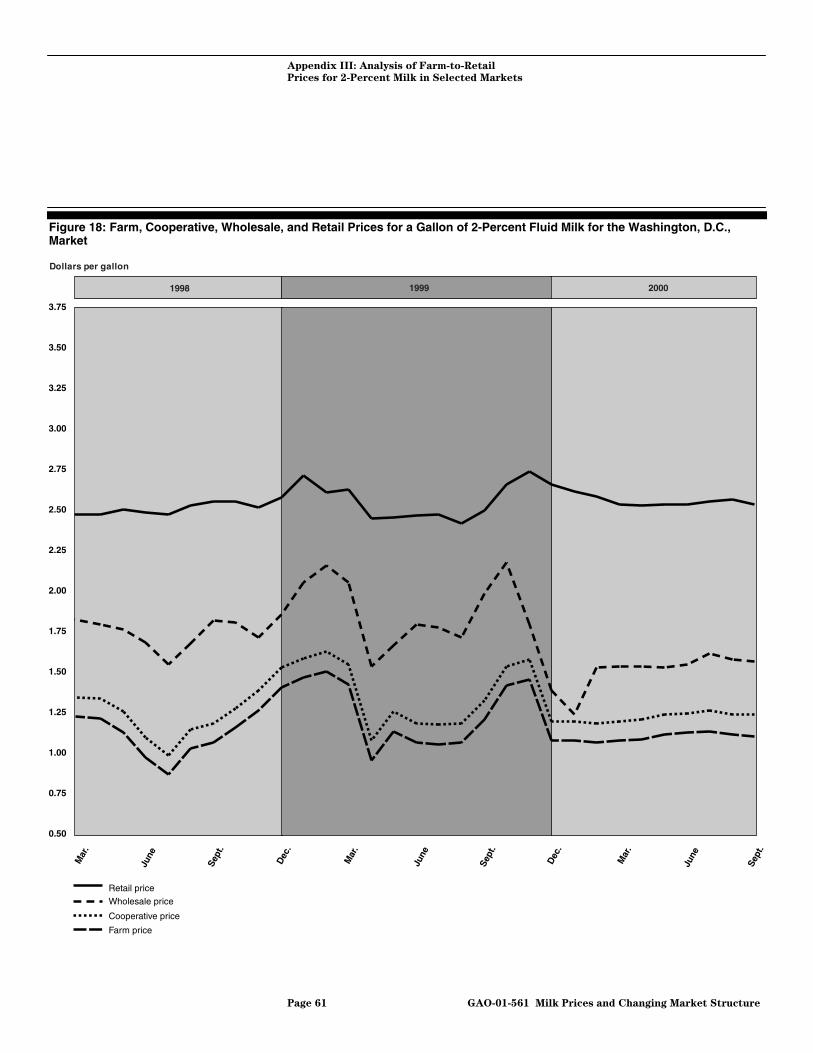
Appendix III: Analysis of Farm-to-Retail
Prices for 2-Percent Milk in Selected Markets
Page 61 GAO-01-561 Milk Prices and Changing Market Structure
Figure 18: Farm, Cooperative, Wholesale, and Retail Prices for a Gallon of 2-Percent Fluid Milk for the Washington, D.C.,Market
1998 1999 2000
Dollars per gallon
0.50
0.75
1.00
1.25
1.50
1.75
2.00
2.25
2.50
2.75
3.00
3.25
3.50
3.75
Farm price
Cooperative price
Wholesale price
Retail price
Mar
.
June
Sept
.
Dec
.
Mar
.
June
Sept
.
Dec
.
Mar
.
June
Sept
.

Appendix III: Analysis of Farm-to-Retail
Prices for 2-Percent Milk in Selected Markets
Page 62 GAO-01-561 Milk Prices and Changing Market Structure
Note: For the Washington, D.C., market, the farm price is the USDA estimated farm level Class I priceadjusted to 2-percent milkfat content; the cooperative price is the announced cooperative Class Iprice for Washington, D.C. adjusted to 2-percent milkfat content; the wholesale price is the price paidby the commissary at the Bolling Air Force Base; and the retail price is the A.C. Nielsen price for theWashington, D.C. market.

Appendix IV: Retail Prices for Four Kinds of
Fluid Milk in Selected Markets
Page 63 GAO-01-561 Milk Prices and Changing Market Structure
This appendix provides information on the average retail price for whole,2-percent, 1-percent, and skim milk in 15 selected markets for the periodof March 1998 through September 2000. We found that the retail pricingpatterns varied significantly in the markets we analyzed. For example, inthe Seattle market from March 1998 through September 2000, the averageprice for 2-percent milk was generally lower than the average price forwhole, 1-percent, or skim milk. On the other hand, for this period in theMinneapolis market, the average price of skim milk was generally lowerthan the price of whole, 2-percent, or 1-percent milk. In other markets,such as San Diego, the lowest-priced milk shifted among 2-percent,1-percent, and skim over the same period. Figures 19 through 33 provideinformation on the average retail price for each of the four kinds of milkfor the 15 markets for the period of March 1998 through September 2000.
Appendix IV: Retail Prices for Four Kinds ofFluid Milk in Selected Markets
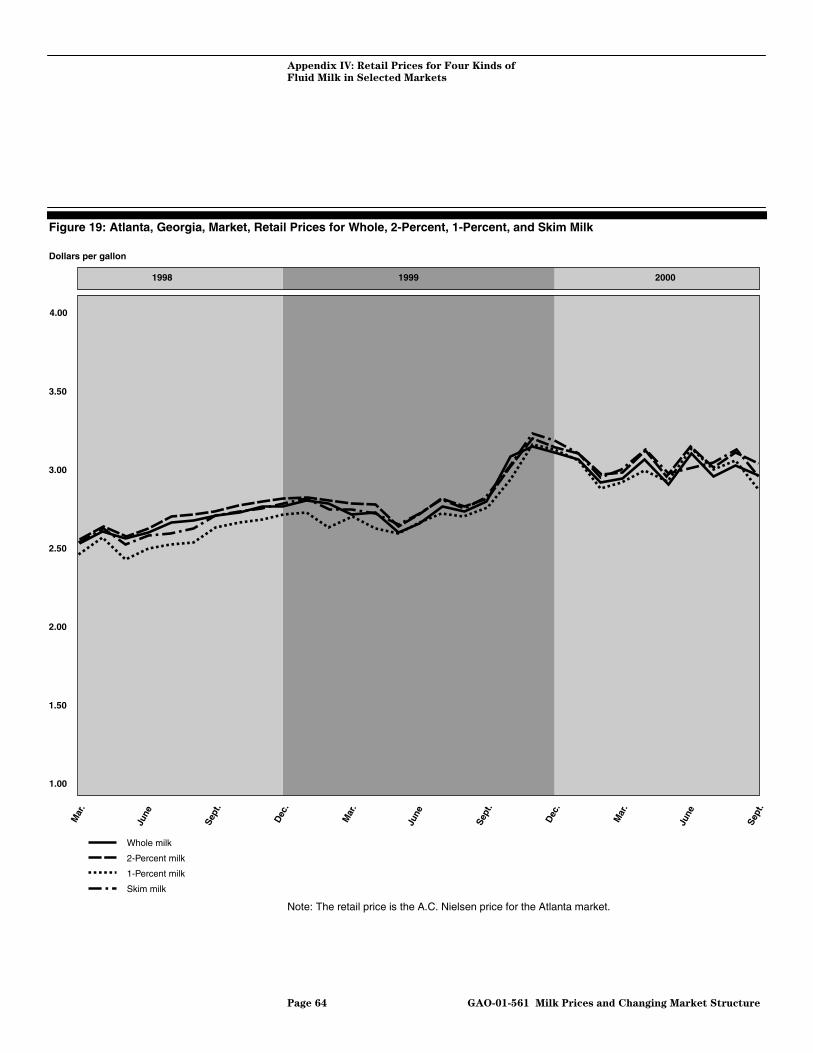
Appendix IV: Retail Prices for Four Kinds of
Fluid Milk in Selected Markets
Page 64 GAO-01-561 Milk Prices and Changing Market Structure
Figure 19: Atlanta, Georgia, Market, Retail Prices for Whole, 2-Percent, 1-Percent, and Skim Milk
Note: The retail price is the A.C. Nielsen price for the Atlanta market.
Whole milk
2-Percent milk
1-Percent milk
Skim milk
1998 1999 2000
Dollars per gallon
Mar
.
Sept
.
Dec
.
Mar
.
Sept
.
Dec
.
Mar
.
Sept
.
1.00
1.50
2.00
2.50
3.00
3.50
4.00
June
June
June

Appendix IV: Retail Prices for Four Kinds of
Fluid Milk in Selected Markets
Page 65 GAO-01-561 Milk Prices and Changing Market Structure
Figure 20: Boston, Massachusetts, Market, Retail Prices for Whole, 2-Percent, 1-Percent, and Skim Milk
Note: The retail price is the A.C. Nielsen price for the Boston market.
1998 1999 2000
Dollars per gallon
Mar
.
Sept
.
Dec
.
Mar
.
Sept
.
Dec
.
Mar
.
Sept
.
1.00
1.50
2.00
2.50
3.00
3.50
4.00
Whole milk
2-Percent milk
1-Percent milk
Skim milk
June
June
June

Appendix IV: Retail Prices for Four Kinds of
Fluid Milk in Selected Markets
Page 66 GAO-01-561 Milk Prices and Changing Market Structure
Figure 21: Charlotte, North Carolina, Market, Retail Prices for Whole, 2-Percent, 1-Percent, and Skim Milk
Note: The retail price is the A.C. Nielsen price for the Charlotte market.
1998 1999 2000
Dollars per gallon
Mar
.
Sept
.
Dec
.
Mar
.
Sept
.
Dec
.
Mar
.
Sept
.
1.00
1.50
2.00
2.50
3.00
3.50
4.00
Whole milk
2-Percent milk
1-Percent milk
Skim milk
June
June
June

Appendix IV: Retail Prices for Four Kinds of
Fluid Milk in Selected Markets
Page 67 GAO-01-561 Milk Prices and Changing Market Structure
Figure 22: Cincinnati, Ohio, Market, Retail Prices for Whole, 2-Percent, 1-Percent, and Skim Milk
Note: The retail price is the A.C. Nielsen price for the Cincinnati market.
1998 1999 2000
Dollars per gallon
Mar
.
Sept
.
Dec
.
Mar
.
Sept
.
Dec
.
Mar
.
Sept
.
1.00
1.50
2.00
2.50
3.00
3.50
4.00
Whole milk
2-Percent milk
1-Percent milk
Skim milk
June
June
June

Appendix IV: Retail Prices for Four Kinds of
Fluid Milk in Selected Markets
Page 68 GAO-01-561 Milk Prices and Changing Market Structure
Figure 23: Dallas, Texas, Market, Retail Prices for Whole, 2-Percent, 1-Percent, and Skim Milk
Note: The retail price is the A.C. Nielsen price for the Dallas market.
1998 1999 2000
Dollars per gallon
Mar
.
Sept
.
Dec
.
Mar
.
Sept
.
Dec
.
Mar
.
Sept
.
1.00
1.50
2.00
2.50
3.00
3.50
4.00
Whole milk
2-Percent milk
1-Percent milk
Skim milk
June
June
June

Appendix IV: Retail Prices for Four Kinds of
Fluid Milk in Selected Markets
Page 69 GAO-01-561 Milk Prices and Changing Market Structure
Figure 24: Denver, Colorado, Market, Retail Prices for Whole, 2-Percent, 1-Percent, and Skim Milk
Note: The retail price is the A.C. Nielsen price for the Denver market.
1998 1999 2000
Dollars per gallon
Mar
.
Sept
.
Dec
.
Mar
.
Sept
.
Dec
.
Mar
.
Sept
.
1.00
1.50
2.00
2.50
3.00
3.50
4.00
Whole milk
2-Percent milk
1-Percent milk
Skim milk
June
June
June

Appendix IV: Retail Prices for Four Kinds of
Fluid Milk in Selected Markets
Page 70 GAO-01-561 Milk Prices and Changing Market Structure
Figure 25: Miami, Florida, Market, Retail Prices for Whole, 2-Percent, 1-Percent, and Skim Milk
Note: The retail price is the A.C. Nielsen price for the Miami market.
1998 1999 2000
Dollars per gallon
Mar
.
Sept
.
Dec
.
Mar
.
Sept
.
Dec
.
Mar
.
Sept
.
1.00
1.50
2.00
2.50
3.00
3.50
4.00
Whole milk
2-Percent milk
1-Percent milk
Skim milk
June
June
June
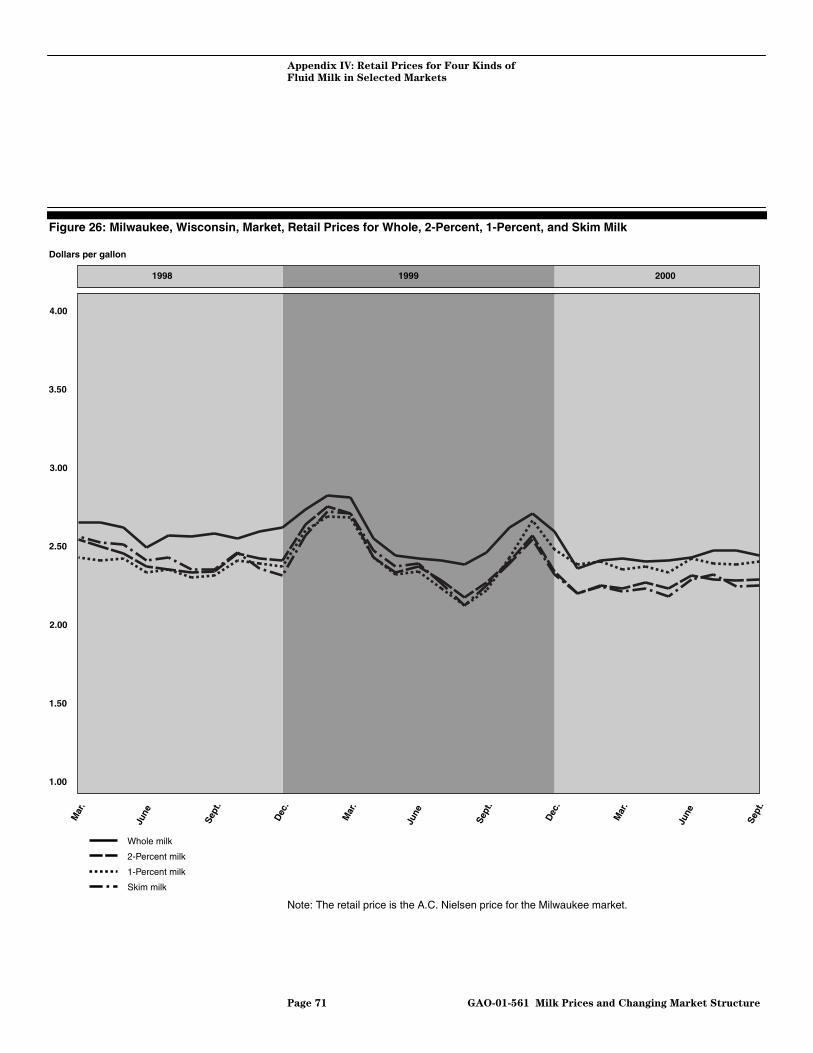
Appendix IV: Retail Prices for Four Kinds of
Fluid Milk in Selected Markets
Page 71 GAO-01-561 Milk Prices and Changing Market Structure
Figure 26: Milwaukee, Wisconsin, Market, Retail Prices for Whole, 2-Percent, 1-Percent, and Skim Milk
Note: The retail price is the A.C. Nielsen price for the Milwaukee market.
1998 1999 2000
Dollars per gallon
Mar
.
Sept
.
Dec
.
Mar
.
Sept
.
Dec
.
Mar
.
Sept
.
1.00
1.50
2.00
2.50
3.00
3.50
4.00
Whole milk
2-Percent milk
1-Percent milk
Skim milk
June
June
June

Appendix IV: Retail Prices for Four Kinds of
Fluid Milk in Selected Markets
Page 72 GAO-01-561 Milk Prices and Changing Market Structure
Figure 27: Minneapolis, Minnesota, Market, Retail Prices for Whole, 2-Percent, 1-Percent, and Skim Milk
Note: The retail price is the A.C. Nielsen price for the Minneapolis market.
1998 1999 2000
Dollars per gallon
Mar
.
Sept
.
Dec
.
Mar
.
Sept
.
Dec
.
Mar
.
Sept
.
1.00
1.50
2.00
2.50
3.00
3.50
4.00
Whole milk
2-Percent milk
1-Percent milk
Skim milk
June
June
June

Appendix IV: Retail Prices for Four Kinds of
Fluid Milk in Selected Markets
Page 73 GAO-01-561 Milk Prices and Changing Market Structure
Figure 28: New Orleans, Louisiana, Market, Retail Prices for Whole, 2-Percent, 1-Percent, and Skim Milk
Note: The retail price is the A.C. Nielsen price for the New Orleans-Mobile market.
1998 1999 2000
Dollars per gallon
Mar
.
Sept
.
Dec
.
Mar
.
Sept
.
Dec
.
Mar
.
Sept
.
1.00
1.50
2.00
2.50
3.00
3.50
4.00
Whole milk
2-Percent milk
1-Percent milk
Skim milk
June
June
June

Appendix IV: Retail Prices for Four Kinds of
Fluid Milk in Selected Markets
Page 74 GAO-01-561 Milk Prices and Changing Market Structure
Figure 29: Phoenix, Arizona, Market, Retail Prices for Whole, 2-Percent, 1-Percent, and Skim Milk
Note: The retail price is the A.C. Nielsen price for the Phoenix market.
Whole milk
2-Percent milk
1-Percent milk
Skim milk
1998 1999 2000
Dollars per gallon
Mar
.
Sept
.
Dec
.
Mar
.
Sept
.
Dec
.
Mar
.
Sept
.
1.00
1.50
2.00
2.50
3.00
3.50
4.00
June
June
June
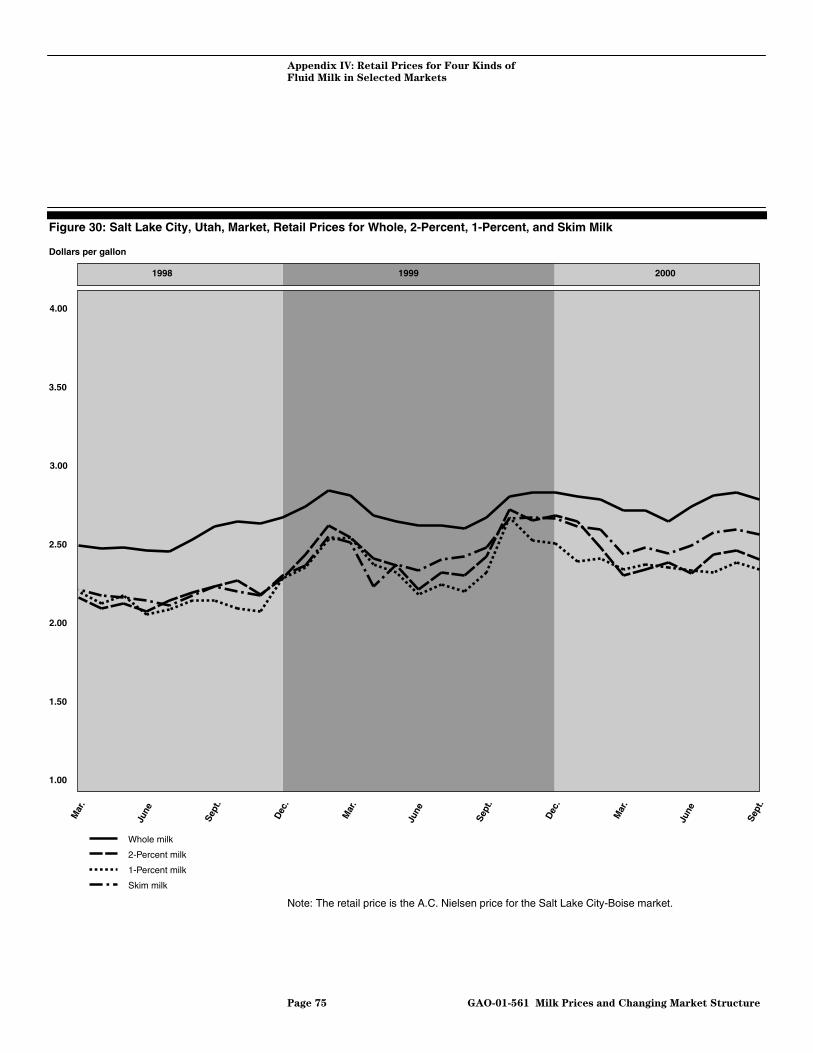
Appendix IV: Retail Prices for Four Kinds of
Fluid Milk in Selected Markets
Page 75 GAO-01-561 Milk Prices and Changing Market Structure
Figure 30: Salt Lake City, Utah, Market, Retail Prices for Whole, 2-Percent, 1-Percent, and Skim Milk
Note: The retail price is the A.C. Nielsen price for the Salt Lake City-Boise market.
Whole milk
2-Percent milk
1-Percent milk
Skim milk
1998 1999 2000
Dollars per gallon
Mar
.
Sept
.
Dec
.
Mar
.
Sept
.
Dec
.
Mar
.
Sept
.
1.00
1.50
2.00
2.50
3.00
3.50
4.00
June
June
June

Appendix IV: Retail Prices for Four Kinds of
Fluid Milk in Selected Markets
Page 76 GAO-01-561 Milk Prices and Changing Market Structure
Figure 31: San Diego, California, Market, Retail Prices for Whole, 2-Percent, 1-Percent, and Skim Milk
Note: The retail price is the A.C. Nielsen price for the San Diego market.
Whole milk
2-Percent milk
1-Percent milk
Skim milk
1998 1999 2000
Dollars per gallon
Mar
.
June
Sept
.
Dec
.
Mar
.
June
Sept
.
Dec
.
Mar
.
June
Sept
.
1.00
1.50
2.00
2.50
3.00
3.50
4.00

Appendix IV: Retail Prices for Four Kinds of
Fluid Milk in Selected Markets
Page 77 GAO-01-561 Milk Prices and Changing Market Structure
Figure 32: Seattle, Washington, Market, Retail Prices for Whole, 2-Percent, 1-Percent, and Skim Milk
Note: The retail price is the A.C. Nielsen price for the Seattle market.
Whole milk
2-Percent milk
1-Percent milk
Skim milk
1998 1999 2000
Dollars per gallon
Mar
.
June
Sept
.
Dec
.
Mar
.
June
Sept
.
Dec
.
Mar
.
June
Sept
.
1.00
1.50
2.00
2.50
3.00
3.50
4.00

Appendix IV: Retail Prices for Four Kinds of
Fluid Milk in Selected Markets
Page 78 GAO-01-561 Milk Prices and Changing Market Structure
Figure 33: Washington, D.C., Market, Retail Prices for Whole, 2-Percent, 1-Percent, and Skim Milk
Note: The retail price is the A.C. Nielsen price for the Washington, D.C. market.
Whole milk
2-Percent milk
1-Percent milk
Skim milk
1998 1999 2000
Dollars per gallon
Mar
.
June
Sept
.
Dec
.
Mar
.
June
Sept
.
Dec
.
Mar
.
June
Sept
.
1.00
1.50
2.00
2.50
3.00
3.50
4.00

Appendix V: Monthly Retail, Wholesale-,
Cooperative-, and Farm-Level Prices for Four
Kinds of Fluid Milk in Selected Markets
Page 79 GAO-01-561 Milk Prices and Changing Market Structure
This appendix provides data for the period March 1998 through September2000 on the average monthly retail- and wholesale-level prices for a gallonof whole, 2-percent, 1-percent, and skim milk, and cooperative- andfarm-level prices for a gallon of unprocessed milk, for 15 selected markets.These data are presented in tables 9 through 23.
Appendix V: Monthly Retail, Wholesale-,Cooperative-, and Farm-Level Prices for FourKinds of Fluid Milk in Selected Markets

Appendix V: Monthly Retail, Wholesale-,
Cooperative-, and Farm-Level Prices for Four
Kinds of Fluid Milk in Selected Markets
Page 80 GAO-01-561 Milk Prices and Changing Market Structure
Table 9: Atlanta, Georgia, Market, Per Gallon Milk Prices, March 1998 Through September 2000
Farm Cooperative Wholesale RetailYear Month Whole 2% 1% Skim Whole 2% 1% Skim
Mar. $1.32 $1.49 $2.27 $2.20 $2.15 $2.12 $2.54 $2.58 $2.47 $2.56Apr. 1.32 1.50 2.27 2.18 2.12 2.08 2.62 2.66 2.59 2.65May 1.29 1.45 2.23 2.15 2.09 2.05 2.57 2.60 2.45 2.55June 1.25 1.41 2.23 2.15 2.09 2.05 2.61 2.65 2.51 2.60July 1.15 1.31 2.13 2.12 1.93 1.87 2.67 2.72 2.54 2.61Aug. 1.32 1.50 2.24 2.15 2.04 1.95 2.70 2.74 2.55 2.64Sept. 1.45 1.63 2.24 2.15 2.10 2.06 2.73 2.76 2.65 2.73Oct. 1.47 1.65 2.39 2.28 2.13 2.02 2.75 2.79 2.69 2.76Nov. 1.48 1.66 2.28 2.01 2.13 1.95 2.79 2.81 2.70 2.77Dec. 1.59 1.74 2.29 2.29 2.28 2.19 2.79 2.84 2.73 2.80
1998
Avg. 1.36 1.54 2.26 2.17 2.11 2.03 2.68 2.71 2.59 2.67Jan. 1.65 1.81 2.43 2.43 2.43 2.42 2.81 2.85 2.75 2.83Feb. 1.68 1.85 2.43 2.43 2.43 2.43 2.80 2.83 2.66 2.78Mar. 1.59 1.76 2.43 2.43 2.43 2.43 2.73 2.80 2.71 2.78Apr. 1.12 1.29 2.11 2.04 2.03 1.99 2.75 2.80 2.65 2.75May 1.19 1.36 2.24 2.18 2.15 2.14 2.62 2.67 2.61 2.68June 1.21 1.38 2.27 2.20 2.15 2.15 2.68 2.74 2.67 2.73July 1.19 1.37 2.25 2.20 2.15 2.15 2.78 2.84 2.75 2.82Aug. 1.20 1.38 2.25 2.18 2.12 2.12 2.76 2.79 2.72 2.78Sept. 1.34 1.53 2.25 2.18 2.12 2.12 2.81 2.84 2.79 2.85Oct. 1.48 1.67 2.30 2.20 2.15 2.15 3.00 3.05 2.96 3.04Nov. 1.52 1.71 2.30 2.20 2.15 2.15 3.17 3.21 3.19 3.25Dec. 1.21 1.38 2.25 2.20 2.15 2.05 3.12 3.17 3.16 3.20
1999
Avg. 1.36 1.54 2.29 2.24 2.21 2.19 2.84 2.88 2.80 2.87Jan. 1.18 1.35 2.25 2.20 2.15 2.15 3.09 3.12 3.09 3.13Feb. 1.14 1.34 2.24 2.16 2.10 1.95 2.94 2.99 2.90 2.97Mar. 1.15 1.35 2.24 2.21 2.20 2.09 2.96 3.00 2.94 3.01Apr. 1.17 1.36 2.24 2.21 2.20 2.09 3.09 3.13 3.10 3.15May 1.20 1.39 2.24 2.21 2.20 2.09 2.92 2.98 2.95 3.00June 1.20 1.39 2.24 2.21 2.20 2.09 3.11 3.17 3.16 3.20July 1.23 1.43 2.24 2.21 2.20 2.09 2.97 3.05 3.02 3.08Aug. 1.19 1.41 2.30 2.25 2.18 2.07 3.05 3.13 3.09 3.14Sept. 1.18 1.40 2.30 2.12 2.09 2.06 2.99 3.07 2.90 2.99
2000
Avg. 1.18 1.38 2.25 2.20 2.17 2.08 3.01 3.07 3.02 3.07
Note: For the Atlanta, Georgia, market, the farm level price is the USDA estimated farm level Class Iprice for 3.5 percent milkfat content; the cooperative price is the announced cooperative Class I pricefor Atlanta for 3.5 percent milkfat content; the wholesale price is the price paid by the commissary atthe Athens Naval Supply Corps School; and the retail price is the A.C. Nielsen price for the Atlantamarket. Prices may not average due to rounding.
Source: GAO’s analysis of price data provided by USDA, the Defense Commissary Agency, and A.C.Nielsen.

Appendix V: Monthly Retail, Wholesale-,
Cooperative-, and Farm-Level Prices for Four
Kinds of Fluid Milk in Selected Markets
Page 81 GAO-01-561 Milk Prices and Changing Market Structure
Table 10: Boston, Massachusetts, Market, Per Gallon Milk Prices, March 1998 Through September 2000
Farm Cooperative Wholesale RetailYear Month Whole 2% 1% Skim Whole 2% 1% Skim
Mar. $1.36 $1.51 $1.61 $1.66 $1.65 $1.60 $2.53 $2.37 $2.35 $2.30Apr. 1.36 1.50 1.61 1.66 1.65 1.60 2.53 2.40 2.34 2.27May 1.36 1.50 1.61 1.66 1.65 1.60 2.53 2.41 2.36 2.30June 1.36 1.50 1.61 1.66 1.65 1.60 2.53 2.40 2.36 2.29July 1.36 1.50 1.86 1.91 1.90 1.85 2.53 2.44 2.37 2.28Aug. 1.36 1.50 1.86 1.91 1.90 1.85 2.55 2.39 2.32 2.25Sept. 1.45 1.59 1.86 1.91 1.90 1.85 2.56 2.40 2.31 2.28Oct. 1.47 1.61 1.86 1.91 1.90 1.85 2.55 2.40 2.33 2.27Nov. 1.48 1.62 1.86 1.91 1.90 1.85 2.55 2.40 2.29 2.21Dec. 1.56 1.70 2.06 2.11 2.10 2.05 2.59 2.49 2.33 2.31
1998
Avg. 1.41 1.55 1.78 1.83 1.82 1.77 2.55 2.41 2.34 2.28Jan. 1.63 1.77 2.13 2.18 2.17 2.12 2.70 2.59 2.51 2.42Feb. 1.67 1.81 2.17 2.22 2.21 2.16 2.82 2.70 2.62 2.56Mar. 1.58 1.72 2.08 2.13 2.12 2.07 2.80 2.69 2.62 2.55Apr. 1.36 1.50 1.86 1.91 1.90 1.85 2.71 2.64 2.50 2.44May 1.36 1.50 1.86 1.91 1.90 1.85 2.68 2.58 2.48 2.42June 1.36 1.50 1.86 1.91 1.90 1.85 2.69 2.61 2.49 2.43July 1.36 1.50 1.86 1.91 1.90 1.85 2.69 2.63 2.51 2.46Aug. 1.36 1.50 1.86 1.91 1.90 1.85 2.68 2.62 2.50 2.43Sept. 1.36 1.50 1.86 1.91 1.90 1.85 2.68 2.62 2.51 2.45Oct. 1.54 1.68 2.05 2.01 2.09 2.04 2.82 2.77 2.67 2.58Nov. 1.58 1.72 2.29 2.25 2.21 2.20 2.90 2.89 2.78 2.69Dec. 1.36 1.50 2.07 2.03 1.99 1.98 2.85 2.82 2.72 2.67
1999
Avg. 1.46 1.60 2.00 2.02 2.02 1.97 2.75 2.68 2.58 2.51Jan. 1.36 1.50 2.07 2.03 1.99 1.98 2.85 2.77 2.73 2.63Feb. 1.36 1.50 2.07 2.03 1.99 1.98 2.82 2.74 2.68 2.64Mar. 1.36 1.50 2.07 2.03 1.99 1.98 2.79 2.72 2.64 2.62Apr. 1.36 1.50 2.07 2.03 1.99 1.98 2.81 2.73 2.67 2.64May 1.36 1.50 2.07 2.03 1.99 1.98 2.82 2.74 2.69 2.67June 1.36 1.50 2.07 2.03 1.99 1.98 2.83 2.75 2.72 2.67July 1.36 1.50 2.07 2.03 1.99 1.98 2.83 2.73 2.71 2.67Aug. 1.36 1.50 2.07 2.03 1.99 1.98 2.84 2.74 2.71 2.67Sept. 1.36 1.50 2.07 2.03 1.99 1.98 2.84 2.74 2.72 2.67
2000
Avg. 1.36 1.50 2.07 2.03 1.99 1.98 2.83 2.74 2.70 2.65
Note: For the Boston, Massachusetts, market, the farm level price is the USDA estimated farm levelClass I price for 3.5 percent milkfat content; the cooperative price is the effective cooperative Class Iprice for Boston for 3.5 percent milkfat content; the wholesale price is the price paid by thecommissary at the Hanscom Air Force Base; and the retail price is the A.C. Nielsen price for theBoston market which includes Rhode Island and parts of New Hampshire. Prices may not averagedue to rounding.
Source: GAO’s analysis of price data provided by USDA, the Defense Commissary Agency, and A.C.Nielsen.

Appendix V: Monthly Retail, Wholesale-,
Cooperative-, and Farm-Level Prices for Four
Kinds of Fluid Milk in Selected Markets
Page 82 GAO-01-561 Milk Prices and Changing Market Structure
Table 11: Charlotte, North Carolina, Market, Per Gallon Milk Prices, March 1998 Through September 2000
Farm Cooperative Wholesale RetailYear Month Whole 2% 1% Skim Whole 2% 1% Skim
Mar. $1.37 $1.49 $2.30 $2.21 $2.22 $2.15 $2.68 $2.66 $2.68 $2.68Apr. 1.38 1.50 2.30 2.21 2.22 2.15 2.67 2.63 2.65 2.66May 1.33 1.45 2.14 2.11 2.13 2.05 2.68 2.65 2.67 2.68June 1.30 1.41 2.08 2.05 2.07 1.99 2.62 2.61 2.61 2.66July 1.19 1.31 1.97 1.95 1.95 1.89 2.69 2.67 2.68 2.68Aug. 1.36 1.50 2.16 2.07 2.02 1.95 2.75 2.72 2.74 2.74Sept. 1.50 1.63 2.28 2.19 2.14 2.07 2.80 2.78 2.80 2.81Oct. 1.51 1.65 2.28 2.17 2.12 2.04 2.84 2.82 2.85 2.85Nov. 1.53 1.66 2.24 2.15 2.10 2.02 2.85 2.83 2.86 2.86Dec. 1.61 1.74 2.30 2.23 2.18 2.10 2.86 2.85 2.88 2.88
1998
Avg. 1.41 1.54 2.21 2.13 2.12 2.04 2.74 2.72 2.74 2.75Jan. 1.68 1.81 2.40 2.35 2.32 2.30 2.93 2.91 2.95 2.95Feb. 1.72 1.85 2.43 2.43 2.43 2.43 2.98 2.97 3.02 3.02Mar. 1.63 1.76 2.34 2.32 2.30 2.29 3.01 2.99 3.04 3.04Apr. 1.15 1.29 1.99 1.97 1.95 1.93 2.85 2.83 2.86 2.87May 1.22 1.36 2.05 2.04 2.02 2.00 2.72 2.71 2.74 2.76June 1.24 1.38 2.13 2.12 2.10 2.08 2.72 2.71 2.74 2.76July 1.23 1.37 2.09 2.08 2.05 2.03 2.71 2.70 2.73 2.75Aug. 1.23 1.38 2.05 2.06 2.05 2.20 2.70 2.68 2.71 2.73Sept. 1.38 1.53 2.20 2.20 2.20 2.20 2.80 2.77 2.80 2.81Oct. 1.52 1.67 2.30 2.28 2.28 2.24 2.88 2.88 2.90 2.92Nov. 1.57 1.71 2.32 2.30 2.30 2.26 3.04 3.02 3.06 3.07Dec. 1.24 1.38 2.02 2.00 2.00 1.98 2.97 2.94 2.97 2.96
1999
Avg. 1.40 1.54 2.19 2.18 2.17 2.16 2.86 2.84 2.88 2.89Jan. 1.21 1.35 2.02 2.00 2.00 1.98 2.90 2.87 2.88 2.88Feb. 1.19 1.34 2.02 2.00 2.00 1.98 2.92 2.89 2.90 2.90Mar. 1.20 1.35 2.02 2.00 2.00 1.98 2.86 2.81 2.81 2.80Apr. 1.22 1.36 2.02 2.00 2.00 1.98 2.72 2.70 2.72 2.73May 1.24 1.39 2.02 2.00 2.00 1.98 2.75 2.74 2.76 2.77June 1.24 1.39 2.02 2.00 2.00 1.98 2.84 2.79 2.78 2.78July 1.28 1.43 2.02 2.00 2.00 1.98 2.78 2.75 2.78 2.78Aug. 1.24 1.41 2.02 2.00 2.00 1.98 2.73 2.69 2.73 2.76Sept. 1.24 1.40 2.02 2.00 2.00 1.98 2.87 2.84 2.87 2.87
2000
Avg. 1.23 1.38 2.02 2.00 2.00 1.98 2.82 2.79 2.80 2.81
Note: For the Charlotte, North Carolina, market, the farm level price is the USDA estimated farm levelClass I price for 3.5 percent milkfat content; the cooperative price is the announced cooperativeClass I price for Charlotte for 3.5 percent milkfat content; the wholesale price is the price paid by thecommissary at Fort Bragg; and the retail price is the A.C. Nielsen price for the Charlotte market.Prices may not average due to rounding.
Source: GAO’s analysis of price data provided by USDA, the Defense Commissary Agency, and A.C.Nielsen.

Appendix V: Monthly Retail, Wholesale-,
Cooperative-, and Farm-Level Prices for Four
Kinds of Fluid Milk in Selected Markets
Page 83 GAO-01-561 Milk Prices and Changing Market Structure
Table 12: Cincinnati, Ohio, Market, Per Gallon Milk Prices, March 1998 Through September 2000
Farm Cooperative Wholesale RetailYear Month Whole 2% 1% Skim Whole 2% 1% Skim
Mar. $1.35 $1.47 $2.15 $1.89 $1.89 $1.85 $1.42 $1.42 $1.41 $1.39Apr. 1.35 1.48 2.15 1.89 1.89 1.85 1.53 1.54 1.57 1.56May 1.31 1.43 2.15 1.89 1.89 1.85 1.84 1.86 1.89 1.89June 1.24 1.36 2.15 1.89 1.89 1.85 2.00 2.00 2.02 2.01July 1.14 1.27 2.09 1.89 1.89 1.80 2.02 2.01 2.03 2.02Aug. 1.33 1.46 1.99 1.85 1.80 1.75 2.00 1.96 1.99 1.98Sept. 1.48 1.60 2.09 1.89 1.89 1.80 2.05 2.03 2.03 2.02Oct. 1.50 1.62 2.09 1.89 1.89 1.80 1.92 1.90 1.88 1.86Nov. 1.51 1.63 2.09 1.89 1.89 1.80 2.04 2.04 2.01 2.00Dec. 1.59 1.71 2.09 1.89 1.89 1.80 2.29 2.28 2.29 2.28
1998
Avg. 1.38 1.50 2.10 1.89 1.88 1.82 1.91 1.91 1.91 1.90Jan. 1.66 1.78 2.43 2.27 2.03 1.88 2.50 2.50 2.51 2.45Feb. 1.70 1.82 2.49 2.34 2.20 2.10 2.58 2.57 2.59 2.53Mar. 1.61 1.73 2.49 2.34 2.20 2.10 2.49 2.46 2.47 2.39Apr. 1.10 1.22 2.19 1.99 1.90 1.95 2.35 2.33 2.33 2.31May 1.20 1.33 2.19 1.99 1.90 1.80 2.39 2.38 2.33 2.35June 1.22 1.34 2.19 1.99 1.90 1.80 2.34 2.34 2.35 2.32July 1.17 1.30 2.29 2.22 2.17 2.06 2.45 2.43 2.23 2.21Aug. 1.18 1.31 2.29 2.22 2.17 2.06 2.24 2.25 2.23 2.18Sept. 1.39 1.51 2.29 2.22 2.17 2.06 2.60 2.59 2.50 2.54Oct. 1.56 1.69 2.48 2.37 2.29 2.23 2.61 2.52 2.42 2.41Nov. 1.61 1.73 2.73 2.62 2.53 2.39 2.77 2.71 2.75 2.72Dec. 1.20 1.32 2.32 2.21 2.12 1.98 2.70 2.67 2.70 2.68
1999
Avg. 1.38 1.51 2.37 2.23 2.13 2.03 2.50 2.48 2.45 2.42Jan. 1.16 1.27 2.17 2.06 1.97 1.83 2.61 2.58 2.57 2.53Feb. 1.13 1.25 2.17 2.06 1.97 1.83 2.52 2.49 2.51 2.47Mar. 1.16 1.28 2.20 2.09 2.00 1.86 2.53 2.50 2.48 2.45Apr. 1.17 1.29 2.20 2.09 2.00 1.86 2.49 2.45 2.50 2.46May 1.22 1.34 2.26 2.14 2.03 1.88 2.57 2.49 2.53 2.48June 1.22 1.34 2.25 2.12 2.01 1.85 2.44 2.42 2.45 2.40July 1.29 1.41 2.32 2.17 2.03 1.87 2.52 2.53 2.46 2.45Aug. 1.26 1.38 2.32 2.17 2.03 1.87 2.70 2.66 2.53 2.51Sept. 1.25 1.37 2.32 2.17 2.03 1.87 2.57 2.55 2.49 2.49
2000
Avg. 1.21 1.32 2.25 2.12 2.01 1.86 2.55 2.52 2.50 2.47
Note: For the Cincinnati, Ohio, market, the farm level price is the USDA estimated farm level Class Iprice for 3.5 percent milkfat content; the cooperative price is the announced cooperative Class I pricefor Cincinnati for 3.5 percent milkfat content; the wholesale price is the price paid by the commissaryat Wright Patterson Air Force Base; and the retail price is the A.C. Nielsen price for the Cincinnatimarket. Prices may not average due to rounding.
Source: GAO’s analysis of price data provided by USDA, the Defense Commissary Agency, and A.C.Nielsen.
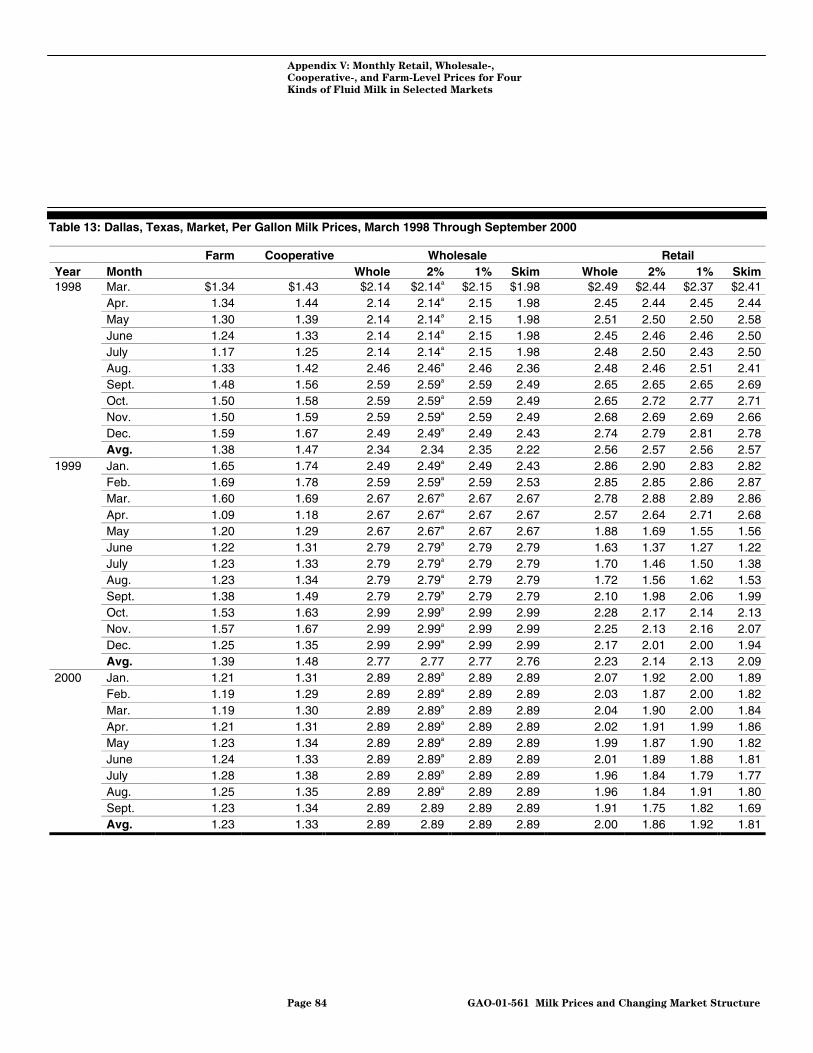
Appendix V: Monthly Retail, Wholesale-,
Cooperative-, and Farm-Level Prices for Four
Kinds of Fluid Milk in Selected Markets
Page 84 GAO-01-561 Milk Prices and Changing Market Structure
Table 13: Dallas, Texas, Market, Per Gallon Milk Prices, March 1998 Through September 2000
Farm Cooperative Wholesale RetailYear Month Whole 2% 1% Skim Whole 2% 1% Skim
Mar. $1.34 $1.43 $2.14 $2.14a $2.15 $1.98 $2.49 $2.44 $2.37 $2.41Apr. 1.34 1.44 2.14 2.14a 2.15 1.98 2.45 2.44 2.45 2.44May 1.30 1.39 2.14 2.14a 2.15 1.98 2.51 2.50 2.50 2.58June 1.24 1.33 2.14 2.14a 2.15 1.98 2.45 2.46 2.46 2.50July 1.17 1.25 2.14 2.14a 2.15 1.98 2.48 2.50 2.43 2.50Aug. 1.33 1.42 2.46 2.46a 2.46 2.36 2.48 2.46 2.51 2.41Sept. 1.48 1.56 2.59 2.59a 2.59 2.49 2.65 2.65 2.65 2.69Oct. 1.50 1.58 2.59 2.59a 2.59 2.49 2.65 2.72 2.77 2.71Nov. 1.50 1.59 2.59 2.59a 2.59 2.49 2.68 2.69 2.69 2.66Dec. 1.59 1.67 2.49 2.49a 2.49 2.43 2.74 2.79 2.81 2.78
1998
Avg. 1.38 1.47 2.34 2.34 2.35 2.22 2.56 2.57 2.56 2.57Jan. 1.65 1.74 2.49 2.49a 2.49 2.43 2.86 2.90 2.83 2.82Feb. 1.69 1.78 2.59 2.59a 2.59 2.53 2.85 2.85 2.86 2.87Mar. 1.60 1.69 2.67 2.67a 2.67 2.67 2.78 2.88 2.89 2.86Apr. 1.09 1.18 2.67 2.67a 2.67 2.67 2.57 2.64 2.71 2.68May 1.20 1.29 2.67 2.67a 2.67 2.67 1.88 1.69 1.55 1.56June 1.22 1.31 2.79 2.79a 2.79 2.79 1.63 1.37 1.27 1.22July 1.23 1.33 2.79 2.79a 2.79 2.79 1.70 1.46 1.50 1.38Aug. 1.23 1.34 2.79 2.79a 2.79 2.79 1.72 1.56 1.62 1.53Sept. 1.38 1.49 2.79 2.79a 2.79 2.79 2.10 1.98 2.06 1.99Oct. 1.53 1.63 2.99 2.99a 2.99 2.99 2.28 2.17 2.14 2.13Nov. 1.57 1.67 2.99 2.99a 2.99 2.99 2.25 2.13 2.16 2.07Dec. 1.25 1.35 2.99 2.99a 2.99 2.99 2.17 2.01 2.00 1.94
1999
Avg. 1.39 1.48 2.77 2.77 2.77 2.76 2.23 2.14 2.13 2.09Jan. 1.21 1.31 2.89 2.89a 2.89 2.89 2.07 1.92 2.00 1.89Feb. 1.19 1.29 2.89 2.89a 2.89 2.89 2.03 1.87 2.00 1.82Mar. 1.19 1.30 2.89 2.89a 2.89 2.89 2.04 1.90 2.00 1.84Apr. 1.21 1.31 2.89 2.89a 2.89 2.89 2.02 1.91 1.99 1.86May 1.23 1.34 2.89 2.89a 2.89 2.89 1.99 1.87 1.90 1.82June 1.24 1.33 2.89 2.89a 2.89 2.89 2.01 1.89 1.88 1.81July 1.28 1.38 2.89 2.89a 2.89 2.89 1.96 1.84 1.79 1.77Aug. 1.25 1.35 2.89 2.89a 2.89 2.89 1.96 1.84 1.91 1.80Sept. 1.23 1.34 2.89 2.89 2.89 2.89 1.91 1.75 1.82 1.69
2000
Avg. 1.23 1.33 2.89 2.89 2.89 2.89 2.00 1.86 1.92 1.81

Appendix V: Monthly Retail, Wholesale-,
Cooperative-, and Farm-Level Prices for Four
Kinds of Fluid Milk in Selected Markets
Page 85 GAO-01-561 Milk Prices and Changing Market Structure
aBecause data were not available for all wholesale 2-percent prices except Sept. 2000, we estimatedthese prices as equal to the lower of the whole milk prices or the 1-percent milk prices.
Note: For the Dallas, Texas, market, the farm level price is the USDA estimated farm level Class Iprice for 3.5 percent milkfat content; the cooperative price is the announced cooperative Class I pricefor Dallas for 3.5 percent milkfat content; the wholesale price is the price paid by the commissary atKelly Air Force Base; and the retail price is the A.C. Nielsen price for the Dallas market. Prices maynot average due to rounding.
Source: GAO’s analysis of price data provided by USDA, the Defense Commissary Agency, and A.C.Nielsen.

Appendix V: Monthly Retail, Wholesale-,
Cooperative-, and Farm-Level Prices for Four
Kinds of Fluid Milk in Selected Markets
Page 86 GAO-01-561 Milk Prices and Changing Market Structure
Table 14: Denver, Colorado, Market, Per Gallon Milk Prices, March 1998 Through September 2000
Farm Cooperative Wholesale RetailYear Month Whole 2% 1% Skim Whole 2% 1% Skim
Mar. $1.28 $1.39 $1.96 $1.80 $1.69 $1.68 $2.84 $2.51 $2.57 $2.65Apr. 1.29 1.39 1.88 1.72 1.60 1.60 2.84 2.65 2.53 2.63May 1.24 1.35 1.88 1.72 1.60 1.60 2.83 2.48 2.51 2.60June 1.18 1.29 1.88 1.72 1.60 1.60 2.82 2.57 2.49 2.60July 1.09 1.19 1.77 1.55 1.38 1.32 2.80 2.59 2.40 2.45Aug. 1.28 1.38 1.96 1.68 1.47 1.38 2.91 2.73 2.55 2.62Sept. 1.42 1.53 2.11 1.84 1.62 1.53 3.04 2.82 2.65 2.75Oct. 1.44 1.55 2.14 1.85 1.57 1.50 3.01 2.78 2.62 2.76Nov. 1.45 1.55 2.14 1.77 1.40 1.30 2.95 2.80 2.54 2.57Dec. 1.53 1.64 2.24 1.93 1.62 1.55 3.08 2.87 2.66 2.77
1998
Avg. 1.32 1.43 2.00 1.76 1.56 1.51 2.91 2.68 2.55 2.64Jan. 1.60 1.70 2.35 2.15 1.95 1.93 3.20 3.02 2.85 2.89Feb. 1.63 1.75 2.43 2.28 2.15 2.15 3.34 3.15 3.03 2.99Mar. 1.55 1.66 2.35 2.19 2.07 2.07 3.29 3.12 2.98 2.92Apr. 1.04 1.17 1.88 1.72 1.60 1.60 3.03 2.89 2.75 2.68May 1.16 1.29 2.08 1.93 1.82 1.82 2.89 2.74 2.61 2.56June 1.18 1.31 2.13 2.06 2.01 1.97 2.92 2.77 2.64 2.56July 1.13 1.26 2.09 1.99 1.94 1.89 2.74 2.64 2.53 2.47Aug. 1.14 1.27 2.11 1.95 1.86 1.77 2.83 2.68 2.59 2.51Sept. 1.33 1.46 2.32 2.19 2.13 2.07 3.04 2.86 2.74 2.66Oct. 1.52 1.65 a a a a 3.28 3.07 3.03 2.92Nov. 1.56 1.69 2.54 2.42 2.37 2.32 3.37 3.17 3.15 3.02Dec. 1.15 1.28 1.94 1.75 1.66 1.60 3.21 3.05 2.91 2.85
1999
Avg. 1.33 1.46 2.20 2.06 1.96 1.93 3.09 2.93 2.82 2.75Jan. 1.09 1.22 1.94 1.75 1.66 1.60 3.35 3.14 2.97 2.84Feb. 1.06 1.19 1.92 1.74 1.66 1.60 3.20 2.92 2.85 2.88Mar. 1.08 1.21 1.93 1.75 1.66 1.60 3.19 2.92 2.82 2.79Apr. 1.09 1.21 1.94 1.75 1.66 1.60 2.97 2.75 2.68 2.60May 1.13 1.26 1.99 1.78 1.68 1.60 2.75 2.64 2.53 2.49June 1.15 1.28 1.99 1.77 1.66 1.58 2.73 2.67 2.55 2.53July 1.22 1.35 2.06 1.83 1.70 1.60 2.71 2.66 2.57 2.49Aug. 1.17 1.30 2.02 1.79 1.66 1.60 2.67 2.60 2.52 2.49Sept. 1.16 1.29 2.01 1.79 1.69 1.60 2.63 2.58 2.50 2.44
2000
Avg. 1.13 1.26 1.98 1.77 1.67 1.60 2.91 2.77 2.67 2.62aData not available.
Note: For the Denver, Colorado, market, the farm level price is the USDA estimated farm level Class Iprice for 3.5 percent milkfat content; the cooperative price is the announced cooperative Class I pricefor Denver for 3.5 percent milkfat content; the wholesale price is the price paid by the commissary atFitzsimons U.S. Army Garrison; and the retail price is the A.C. Nielsen price for the Denver market.Prices may not average due to rounding.
Source: GAO’s analysis of price data provided by USDA, the Defense Commissary Agency, and A.C.Nielsen.

Appendix V: Monthly Retail, Wholesale-,
Cooperative-, and Farm-Level Prices for Four
Kinds of Fluid Milk in Selected Markets
Page 87 GAO-01-561 Milk Prices and Changing Market Structure
Table 15: Miami, Florida, Market, Per Gallon Milk Prices, March 1998 Through September 2000
Farm Cooperative Wholesale RetailYear Month Whole 2% 1% Skim Whole 2% 1% Skim
Mar. $1.51 $1.71 $2.56 $2.56 a $2.56 $3.00 $3.02 $2.88 $2.89Apr. 1.51 1.70 2.56 2.56 a 2.56 3.00 3.02 2.88 2.89May 1.47 1.65 2.56 2.56 a 2.56 2.96 2.98 2.82 2.84June 1.44 1.63 2.56 2.56 a 2.56 2.90 2.92 2.77 2.80July 1.36 1.55 2.56 2.56 a 2.56 2.90 2.93 2.78 2.80Aug. 1.53 1.74 2.56 2.56 a 2.56 2.96 2.97 2.81 2.83Sept. 1.66 1.87 2.56 2.56 a 2.56 3.04 3.03 2.86 2.86Oct. 1.68 1.89 2.56 2.56 a 2.56 3.05 3.03 2.86 2.86Nov. 1.68 1.89 2.56 2.56 a 2.56 2.96 2.97 2.81 2.82Dec. 1.77 1.96 2.56 2.56 a 2.56 2.95 2.96 2.83 2.83
1998
Avg. 1.56 1.76 2.56 2.56 a 2.56 2.97 2.98 2.83 2.84Jan. 1.82 2.01 2.56 2.56 a 2.56 3.10 3.13 3.05 3.06Feb. 1.86 2.05 2.56 2.56 a 2.56 3.21 3.23 3.16 3.16Mar. 1.76 1.96 2.56 2.56 a 2.56 3.24 3.27 3.19 3.20Apr. 1.30 1.49 2.56 2.56 a 2.56 2.98 3.04 2.96 2.97May 1.37 1.56 2.56 2.56 a 2.56 2.93 2.98 2.90 2.91June 1.39 1.58 2.56 2.56 a 2.56 2.93 2.98 2.90 2.90July 1.37 1.58 2.56 2.56 a 2.56 2.94 2.95 2.87 2.88Aug. 1.39 1.62 2.56 2.56 a 2.56 2.96 2.97 2.90 2.91Sept. 1.53 1.77 2.56 2.56 a 2.56 3.00 3.05 2.96 2.96Oct. 1.66 1.89 2.56 2.56 a 2.56 3.16 3.17 3.08 3.09Nov. 1.70 1.93 2.56 2.56 a 2.56 3.22 3.24 3.14 3.16Dec. 1.40 1.60 2.56 2.56 a 2.56 3.12 3.17 3.08 3.09
1999
Avg. 1.55 1.75 2.56 2.56 a 2.56 3.07 3.10 3.02 3.02Jan. 1.35 1.58 2.56 2.56 a 2.56 3.06 3.08 2.99 3.01Feb. 1.33 1.55 2.56 2.56 a 2.56 3.15 3.15 3.07 3.08Mar. 1.34 1.56 2.56 2.56 a 2.56 3.20 3.25 3.19 3.20Apr. 1.37 1.58 2.56 2.56 a 2.56 3.13 3.15 3.07 3.08May 1.40 1.61 2.56 2.56 a 2.56 3.06 3.10 3.01 3.01June 1.39 1.60 2.56 2.56 a 2.56 3.05 3.08 2.99 3.00July 1.42 1.65 2.56 2.56 a 2.56 3.02 3.06 2.95 2.98Aug. 1.37 1.62 2.56 2.56 a 2.56 2.95 3.03 2.92 2.96Sept. 1.36 1.61 2.56 2.56 a 2.56 3.06 3.09 2.99 3.01
2000
Avg. 1.37 1.60 2.56 2.56 a 2.56 3.07 3.11 3.02 3.04aData not available.
Note: For the Miami, Florida, market, the farm level price is the USDA estimated farm level Class Iprice for 3.5 percent milkfat content; the cooperative price is the announced cooperative Class I pricefor Miami for 3.5 percent milkfat content; the wholesale price is the price paid by the commissary atthe Key West Naval Air Station; and the retail price is the A.C. Nielsen price for the Miami market.Prices may not average due to rounding.
Source: GAO’s analysis of price data provided by USDA, the Defense Commissary Agency, and A.C.Nielsen.

Appendix V: Monthly Retail, Wholesale-,
Cooperative-, and Farm-Level Prices for Four
Kinds of Fluid Milk in Selected Markets
Page 88 GAO-01-561 Milk Prices and Changing Market Structure
Table 16: Milwaukee, Wisconsin, Market, Per Gallon Milk Prices, March 1998 Through September 2000
Farm Cooperative Wholesale RetailYear Month Whole 2% 1% Skim Whole 2% 1% Skim
Mar. $1.31 $1.43 $1.85 $1.75 $1.75 $1.75 $2.65 $2.54 $2.43 $2.56Apr. 1.27 1.39 1.85 1.75 1.75 1.75 2.65 2.50 2.41 2.52May 1.23 1.35 1.85 1.75 1.75 1.75 2.62 2.45 2.42 2.51June 1.16 1.28 1.85 1.75 1.75 1.75 2.49 2.37 2.33 2.41July 1.06 1.18 1.85 1.75 1.75 1.75 2.57 2.35 2.35 2.43Aug. 1.26 1.38 1.85 1.75 1.75 1.75 2.56 2.33 2.30 2.35Sept. 1.40 1.52 1.85 1.75 1.75 1.75 2.58 2.34 2.31 2.35Oct. 1.42 1.54 1.95 1.85 1.85 1.85 2.55 2.45 2.41 2.46Nov. 1.46 1.58 1.95 1.85 1.85 1.85 2.59 2.42 2.39 2.36Dec. 1.54 1.66 1.95 1.85 1.85 1.85 2.62 2.41 2.37 2.31
1998
Avg. 1.31 1.43 1.88 1.78 1.78 1.78 2.59 2.42 2.37 2.43Jan. 1.60 1.73 1.95 1.85 1.85 1.85 2.73 2.64 2.60 2.57Feb. 1.65 1.77 1.95 1.85 1.85 1.85 2.82 2.75 2.69 2.72Mar. 1.56 1.68 1.95 1.85 1.85 1.85 2.81 2.71 2.68 2.71Apr. 1.04 1.16 1.95 1.85 1.85 1.85 2.55 2.43 2.43 2.47May 1.16 1.28 1.95 1.85 1.85 1.85 2.44 2.33 2.32 2.37June 1.17 1.29 1.95 1.85 1.85 1.85 2.42 2.37 2.34 2.39July 1.12 1.24 1.95 1.85 1.85 1.85 2.41 2.28 2.23 2.26Aug. 1.13 1.24 1.95 1.85 1.85 1.85 2.38 2.17 2.12 2.12Sept. 1.32 1.43 1.95 1.85 1.85 1.85 2.46 2.27 2.22 2.25Oct. 1.51 1.63 1.95 1.85 1.85 1.85 2.62 2.40 2.43 2.39Nov. 1.55 1.67 1.95 1.85 1.85 1.85 2.71 2.57 2.66 2.54Dec. 1.14 1.26 1.66 1.62 1.63 1.64 2.59 2.34 2.48 2.32
1999
Avg. 1.33 1.45 1.93 1.83 1.83 1.83 2.58 2.44 2.43 2.43Jan. 1.13 1.26 1.93 1.88 1.48 1.88 2.36 2.20 2.38 2.20Feb. 1.09 1.22 2.05 2.05 2.07 2.07 2.41 2.25 2.40 2.24Mar. 1.12 1.24 2.08 2.08 2.08 2.08 2.42 2.23 2.35 2.21Apr. 1.13 1.26 2.08 2.08 2.08 2.08 2.40 2.27 2.37 2.23May 1.18 1.30 2.12 2.11 2.09 2.08 2.41 2.23 2.33 2.18June 1.17 1.30 2.12 2.11 2.09 2.08 2.43 2.31 2.42 2.29July 1.25 1.38 2.19 2.16 2.12 2.09 2.47 2.29 2.39 2.32Aug. 1.20 1.33 2.15 2.13 2.11 2.09 2.47 2.28 2.38 2.24Sept. 1.19 1.32 2.15 2.13 2.11 2.09 2.44 2.29 2.40 2.25
2000
Avg. 1.16 1.29 2.10 2.08 2.03 2.06 2.42 2.26 2.38 2.24
Note: For the Milwaukee, Wisconsin, market, the farm level price is the USDA estimated farm levelClass I price for 3.5 percent milkfat content; the cooperative price is the announced cooperativeClass I price for Milwaukee for 3.5 percent milkfat content; the wholesale price is the price paid by thecommissary at the Great Lakes Naval Training Center; and the retail price is the A.C. Nielsen pricefor the Milwaukee market. Prices may not average due to rounding.
Source: GAO’s analysis of price data provided by USDA, the Defense Commissary Agency, and A.C.Nielsen.

Appendix V: Monthly Retail, Wholesale-,
Cooperative-, and Farm-Level Prices for Four
Kinds of Fluid Milk in Selected Markets
Page 89 GAO-01-561 Milk Prices and Changing Market Structure
Table 17: Minneapolis, Minnesota, Market, Per Gallon Milk Prices, March 1998 Through September 2000
Farm Cooperative Wholesale RetailYear Month Whole 2% 1% Skim Whole 2% 1% Skim
Mar. $1.25 $1.36 $2.10 $2.06 $2.02 $1.99 $2.95 $2.89 $2.87 $2.84Apr. 1.20 1.30 2.10 2.06 2.02 1.99 2.96 2.89 2.86 2.83May 1.15 1.26 2.10 2.04 1.98 1.94 2.91 2.83 2.80 2.77June 1.08 1.19 2.07 2.02 1.96 1.92 2.84 2.76 2.74 2.71July 0.99 1.09 2.00 1.94 1.88 1.83 2.80 2.70 2.67 2.61Aug. 1.19 1.29 1.89 1.80 1.71 1.63 2.87 2.74 2.70 2.62Sept. 1.33 1.44 2.08 1.94 1.81 1.70 2.95 2.84 2.79 2.72Oct. 1.36 1.46 2.22 2.07 1.94 1.83 2.93 2.83 2.77 2.69Nov. 1.36 1.47 2.23 2.06 1.91 1.79 2.95 2.83 2.77 2.70Dec. 1.45 1.55 2.25 2.01 1.79 1.62 2.95 2.91 2.88 2.84
1998
Avg. 1.24 1.34 2.10 2.00 1.90 1.82 2.91 2.82 2.79 2.73Jan. 1.51 1.62 2.34 2.16 1.99 1.86 3.01 2.98 2.96 2.95Feb. 1.56 1.67 2.43 2.36 2.27 2.21 3.01 2.98 2.96 2.95Mar. 1.47 1.57 2.48 2.46 2.41 2.38 3.01 2.96 2.94 2.94Apr. 1.01 1.12 2.39 2.36 2.31 2.28 2.87 2.79 2.78 2.76May 1.06 1.17 1.87 1.83 1.78 1.75 2.82 2.73 2.72 2.70June 1.09 1.20 2.00 1.96 1.92 1.89 2.87 2.81 2.79 2.77July 1.06 1.18 2.03 2.02 2.02 2.01 2.88 2.81 2.80 2.73Aug. 1.08 1.19 1.99 1.96 1.95 1.92 2.87 2.79 2.78 2.67Sept. 1.26 1.38 1.99 1.92 1.87 1.80 2.93 2.92 2.92 2.83Oct. 1.45 1.57 2.19 2.15 2.12 2.07 3.06 3.17 3.19 3.02Nov. 1.49 1.61 2.50 2.46 2.43 2.38 3.17 3.28 3.32 3.11Dec. 1.09 1.20 1.66 1.62 1.63 1.64 3.08 3.19 3.23 3.01
1999
Avg. 1.26 1.37 2.16 2.11 2.06 2.02 2.96 2.95 2.95 2.87Jan. 1.08 1.20 2.08 2.03 2.03 2.03 2.97 3.06 3.06 2.89Feb. 1.05 1.16 2.05 2.05 2.07 2.07 2.94 3.06 3.09 2.90Mar. 1.07 1.18 2.08 2.08 2.08 2.08 2.92 3.05 3.09 2.89Apr. 1.09 1.20 2.08 2.11 2.08 2.08 2.97 3.08 3.12 2.92May 1.13 1.25 2.12 2.11 2.09 2.08 3.00 3.10 3.14 2.94June 1.13 1.24 2.12 2.11 2.09 2.08 3.00 3.12 3.17 2.95July 1.21 1.32 2.19 2.16 2.12 2.09 2.99 3.13 3.17 2.97Aug. 1.17 1.28 2.15 2.13 2.11 2.09 3.02 3.18 3.22 2.99Sept. 1.13 1.25 2.15 2.13 2.11 2.09 3.04 3.19 3.23 3.00
2000
Avg. 1.12 1.23 2.11 2.10 2.09 2.08 2.98 3.11 3.14 2.94
Note: For the Minneapolis, Minnesota, market, the farm level price is the USDA estimated farm levelClass I price for 3.5 percent milkfat content; the cooperative price is the announced cooperativeClass I price for Minneapolis for 3.5 percent milkfat content; the wholesale price is the price paid bythe commissary at Fort McCoy; and the retail price is the A.C. Nielsen price for the Minneapolismarket. Prices may not average due to rounding.
Source: GAO’s analysis of price data provided by USDA, the Defense Commissary Agency, and A.C.Nielsen.

Appendix V: Monthly Retail, Wholesale-,
Cooperative-, and Farm-Level Prices for Four
Kinds of Fluid Milk in Selected Markets
Page 90 GAO-01-561 Milk Prices and Changing Market Structure
Table 18: New Orleans, Louisiana, Market, Per Gallon Milk Prices, March 1998 Through September 2000
Farm Cooperative Wholesale RetailYear Month Whole 2% 1% Skim Whole 2% 1% Skim
Mar. $1.31 $1.48 $2.59 $2.59 $2.59 $2.59 $2.76 $2.70 $2.68 $2.73Apr. 1.31 1.49 2.59 2.59 2.59 2.59 2.77 2.71 2.71 2.71May 1.29 1.45 2.59 2.59 2.59 2.59 2.77 2.71 2.72 2.71June 1.24 1.40 2.53 2.53 2.53 2.53 2.74 2.68 2.69 2.67July 1.13 1.30 2.45 2.45 2.45 2.45 2.72 2.66 2.68 2.64Aug. 1.31 1.49 2.61 2.61 2.61 2.61 2.81 2.75 2.76 2.73Sept. 1.43 1.61 2.81 2.81 2.81 2.81 2.86 2.79 2.76 2.75Oct. 1.45 1.63 2.81 2.81 2.81 2.81 2.84 2.77 2.74 2.73Nov. 1.47 1.65 2.81 2.81 2.81 2.81 2.85 2.78 2.74 2.70Dec. 1.58 1.73 2.96 2.96 2.96 2.96 2.86 2.80 2.75 2.73
1998
Avg. 1.35 1.52 2.68 2.68 2.68 2.68 2.80 2.74 2.72 2.71Jan. 1.64 1.80 2.96 2.96 2.96 2.96 2.90 2.85 2.82 2.81Feb. 1.67 1.84 2.96 2.96 2.96 2.96 2.93 2.89 2.87 2.88Mar. 1.57 1.75 2.96 2.96 2.96 2.96 2.93 2.88 2.87 2.88Apr. 1.06 1.24 2.66 2.66 2.66 2.66 2.83 2.78 2.78 2.74May 1.18 1.35 2.66 2.66 2.66 2.66 2.82 2.75 2.79 2.74June 1.20 1.37 2.79 2.79 2.79 2.79 2.84 2.78 2.81 2.78July 1.20 1.38 2.79 2.79 2.79 2.79 2.79 2.72 2.75 2.72Aug. 1.21 1.39 2.75 2.75 2.75 2.75 2.86 2.79 2.82 2.79Sept. 1.35 1.54 2.75 2.75 2.75 2.75 2.94 2.88 2.95 2.92Oct. 1.50 1.69 2.95 2.95 2.95 2.95 3.01 2.97 3.02 2.98Nov. 1.55 1.73 3.10 3.10 3.10 3.10 3.08 3.06 3.10 3.07Dec. 1.23 1.40 2.85 2.85 2.85 2.85 3.06 3.03 3.10 3.03
1999
Avg. 1.36 1.54 2.85 2.85 2.85 2.85 2.91 2.87 2.89 2.86Jan. 1.19 1.37 2.75 2.75 2.75 2.75 2.98 2.87 2.97 2.95Feb. 1.16 1.35 2.75 2.75 2.75 2.75 2.93 2.76 2.89 2.95Mar. 1.17 1.36 2.75 2.75 2.75 2.75 2.91 2.85 2.92 2.98Apr. 1.18 1.38 2.81 2.81 2.81 2.81 2.97 2.91 2.95 2.98May 1.22 1.40 2.81 2.81 2.81 2.81 2.96 2.90 2.97 3.03June 1.21 1.40 2.85 2.85 2.85 2.85 2.97 2.91 2.95 2.98July 1.25 1.44 2.85 2.85 2.85 2.85 3.00 2.95 2.94 2.96Aug. 1.20 1.42 2.85 2.85 2.85 2.85 2.97 2.93 2.93 2.96Sept. 1.19 1.41 2.85 2.85 2.85 2.85 3.03 2.98 2.98 3.00
2000
Avg. 1.20 1.39 2.81 2.81 2.81 2.81 2.97 2.90 2.94 2.98
Note: For the New Orleans, Louisiana, market, the farm level price is the USDA estimated farm levelClass I price for 3.5 percent milkfat content; the cooperative price is the announced cooperativeClass I price for New Orleans for 3.5 percent milkfat content; the wholesale price is the price paid bythe commissary at the New Orleans Naval Air Station; and the retail price is the A.C. Nielsen price forthe New Orleans market. Prices may not average due to rounding.
Source: GAO’s analysis of price data provided by USDA, the Defense Commissary Agency, and A.C.Nielsen.
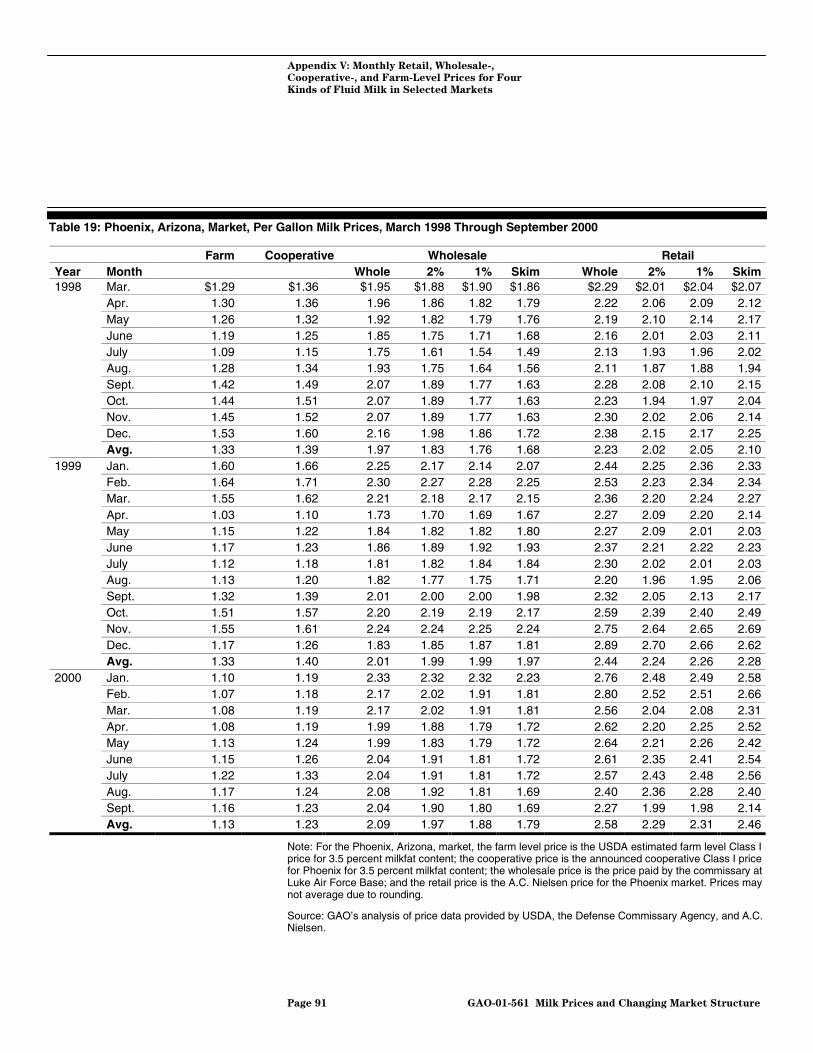
Appendix V: Monthly Retail, Wholesale-,
Cooperative-, and Farm-Level Prices for Four
Kinds of Fluid Milk in Selected Markets
Page 91 GAO-01-561 Milk Prices and Changing Market Structure
Table 19: Phoenix, Arizona, Market, Per Gallon Milk Prices, March 1998 Through September 2000
Farm Cooperative Wholesale RetailYear Month Whole 2% 1% Skim Whole 2% 1% Skim
Mar. $1.29 $1.36 $1.95 $1.88 $1.90 $1.86 $2.29 $2.01 $2.04 $2.07Apr. 1.30 1.36 1.96 1.86 1.82 1.79 2.22 2.06 2.09 2.12May 1.26 1.32 1.92 1.82 1.79 1.76 2.19 2.10 2.14 2.17June 1.19 1.25 1.85 1.75 1.71 1.68 2.16 2.01 2.03 2.11July 1.09 1.15 1.75 1.61 1.54 1.49 2.13 1.93 1.96 2.02Aug. 1.28 1.34 1.93 1.75 1.64 1.56 2.11 1.87 1.88 1.94Sept. 1.42 1.49 2.07 1.89 1.77 1.63 2.28 2.08 2.10 2.15Oct. 1.44 1.51 2.07 1.89 1.77 1.63 2.23 1.94 1.97 2.04Nov. 1.45 1.52 2.07 1.89 1.77 1.63 2.30 2.02 2.06 2.14Dec. 1.53 1.60 2.16 1.98 1.86 1.72 2.38 2.15 2.17 2.25
1998
Avg. 1.33 1.39 1.97 1.83 1.76 1.68 2.23 2.02 2.05 2.10Jan. 1.60 1.66 2.25 2.17 2.14 2.07 2.44 2.25 2.36 2.33Feb. 1.64 1.71 2.30 2.27 2.28 2.25 2.53 2.23 2.34 2.34Mar. 1.55 1.62 2.21 2.18 2.17 2.15 2.36 2.20 2.24 2.27Apr. 1.03 1.10 1.73 1.70 1.69 1.67 2.27 2.09 2.20 2.14May 1.15 1.22 1.84 1.82 1.82 1.80 2.27 2.09 2.01 2.03June 1.17 1.23 1.86 1.89 1.92 1.93 2.37 2.21 2.22 2.23July 1.12 1.18 1.81 1.82 1.84 1.84 2.30 2.02 2.01 2.03Aug. 1.13 1.20 1.82 1.77 1.75 1.71 2.20 1.96 1.95 2.06Sept. 1.32 1.39 2.01 2.00 2.00 1.98 2.32 2.05 2.13 2.17Oct. 1.51 1.57 2.20 2.19 2.19 2.17 2.59 2.39 2.40 2.49Nov. 1.55 1.61 2.24 2.24 2.25 2.24 2.75 2.64 2.65 2.69Dec. 1.17 1.26 1.83 1.85 1.87 1.81 2.89 2.70 2.66 2.62
1999
Avg. 1.33 1.40 2.01 1.99 1.99 1.97 2.44 2.24 2.26 2.28Jan. 1.10 1.19 2.33 2.32 2.32 2.23 2.76 2.48 2.49 2.58Feb. 1.07 1.18 2.17 2.02 1.91 1.81 2.80 2.52 2.51 2.66Mar. 1.08 1.19 2.17 2.02 1.91 1.81 2.56 2.04 2.08 2.31Apr. 1.08 1.19 1.99 1.88 1.79 1.72 2.62 2.20 2.25 2.52May 1.13 1.24 1.99 1.83 1.79 1.72 2.64 2.21 2.26 2.42June 1.15 1.26 2.04 1.91 1.81 1.72 2.61 2.35 2.41 2.54July 1.22 1.33 2.04 1.91 1.81 1.72 2.57 2.43 2.48 2.56Aug. 1.17 1.24 2.08 1.92 1.81 1.69 2.40 2.36 2.28 2.40Sept. 1.16 1.23 2.04 1.90 1.80 1.69 2.27 1.99 1.98 2.14
2000
Avg. 1.13 1.23 2.09 1.97 1.88 1.79 2.58 2.29 2.31 2.46
Note: For the Phoenix, Arizona, market, the farm level price is the USDA estimated farm level Class Iprice for 3.5 percent milkfat content; the cooperative price is the announced cooperative Class I pricefor Phoenix for 3.5 percent milkfat content; the wholesale price is the price paid by the commissary atLuke Air Force Base; and the retail price is the A.C. Nielsen price for the Phoenix market. Prices maynot average due to rounding.
Source: GAO’s analysis of price data provided by USDA, the Defense Commissary Agency, and A.C.Nielsen.

Appendix V: Monthly Retail, Wholesale-,
Cooperative-, and Farm-Level Prices for Four
Kinds of Fluid Milk in Selected Markets
Page 92 GAO-01-561 Milk Prices and Changing Market Structure
Table 20: Salt Lake City, Utah, Market, Per Gallon Milk Prices, March 1998 Through September 2000
Farm Cooperative Wholesale RetailYear Month Whole 2% 1% Skim Whole 2% 1% Skim
Mar. $1.21 $1.32 $2.00 $1.90 $1.84 $1.79 $2.49 $2.16 $2.20 $2.21Apr. 1.21 1.32 2.00 1.89 1.82 1.76 2.47 2.09 2.12 2.17May 1.17 1.28 a a a a 2.48 2.12 2.17 2.16June 1.10 1.21 a a a a 2.46 2.07 2.05 2.14July 1.00 1.11 1.90 1.77 1.68 1.61 2.45 2.14 2.08 2.11Aug. 1.19 1.30 1.80 1.63 1.52 1.42 2.53 2.19 2.14 2.17Sept. 1.34 1.45 1.99 1.78 1.64 1.51 2.61 2.23 2.14 2.23Oct. 1.36 1.47 2.15 1.86 1.65 1.47 2.64 2.27 2.09 2.20Nov. 1.37 1.48 2.15 1.86 1.65 1.47 2.63 2.18 2.07 2.17Dec. 1.45 1.56 2.26 2.06 1.93 1.81 2.67 2.28 2.28 2.30
1998
Avg. 1.24 1.35 2.03 1.84 1.72 1.61 2.54 2.17 2.13 2.19Jan. 1.54 1.63 2.26 2.06 1.93 1.81 2.74 2.43 2.35 2.36Feb. 1.58 1.68 2.34 2.22 2.14 2.07 2.84 2.62 2.53 2.55Mar. 1.49 1.58 2.39 2.27 2.19 2.11 2.81 2.54 2.54 2.51Apr. 0.97 1.07 2.31 2.19 2.11 2.03 2.68 2.41 2.37 2.23May 1.09 1.18 1.88 1.75 1.67 1.59 2.64 2.36 2.32 2.37June 1.10 1.20 2.00 1.91 1.85 1.79 2.62 2.21 2.18 2.33July 1.05 1.15 2.02 1.93 1.87 1.81 2.62 2.32 2.24 2.40Aug. 1.06 1.17 1.97 1.87 1.79 1.72 2.60 2.30 2.20 2.42Sept. 1.26 1.35 1.98 1.87 1.77 1.69 2.67 2.42 2.32 2.48Oct. 1.44 1.57 2.18 2.08 1.99 1.92 2.80 2.72 2.67 2.66Nov. 1.48 1.58 2.42 2.32 2.23 2.16 2.83 2.65 2.52 2.67Dec. 1.08 1.17 2.43 2.35 2.27 2.23 2.83 2.68 2.50 2.66
1999
Avg. 1.26 1.36 2.18 2.07 1.98 1.91 2.72 2.47 2.39 2.47Jan. 1.02 1.12 2.03 1.95 1.87 1.83 2.80 2.64 2.39 2.61Feb. 1.01 1.11 1.98 1.92 1.85 1.83 2.78 2.48 2.41 2.59Mar. 1.02 1.12 1.96 1.91 1.85 1.83 2.71 2.30 2.34 2.43Apr. 1.03 1.12 1.97 1.92 1.85 1.83 2.71 2.34 2.37 2.48May 1.08 1.17 1.99 1.94 1.86 1.84 2.64 2.38 2.35 2.44June 1.10 1.19 2.04 1.97 1.88 1.84 2.74 2.31 2.33 2.49July 1.15 1.26 2.09 2.01 1.91 1.87 2.81 2.43 2.32 2.57Aug. 1.11 1.21 2.15 2.05 1.93 1.87 2.83 2.46 2.38 2.59Sept. 1.11 1.20 a a a a 2.78 2.40 2.34 2.56
2000
Avg. 1.07 1.17 2.03 1.96 1.88 1.84 2.76 2.41 2.36 2.53aData not available.
Note: For the Salt Lake City, Utah, market, the farm level price is the USDA estimated farm levelClass I price for 3.5 percent milkfat content; the cooperative price is the announced cooperativeClass I price for Salt Lake City for 3.5 percent milkfat content; the wholesale price is the price paid bythe commissary at Hill Air Force Base; and the retail price is the A.C. Nielsen price for the Salt LakeCity market. Prices may not average due to rounding.
Source: GAO’s analysis of price data provided by USDA, the Defense Commissary Agency, and A.C.Nielsen.

Appendix V: Monthly Retail, Wholesale-,
Cooperative-, and Farm-Level Prices for Four
Kinds of Fluid Milk in Selected Markets
Page 93 GAO-01-561 Milk Prices and Changing Market Structure
Table 21: San Diego, California, Market, Per Gallon Milk Prices, March 1998 Through September 2000
Farm Cooperative Wholesale RetailYear Month Whole 2% 1% Skim Whole 2% 1% Skim
Mar. $1.13 $1.33 $2.11 $2.08 $2.08 $1.84 $3.36 $3.16 $3.21 $3.41Apr. 1.11 1.33 2.11 2.08 2.08 1.84 3.37 3.16 3.18 3.42May 1.10 1.33 2.11 2.08 2.08 1.84 3.39 3.23 3.19 3.39June 1.19 1.21 2.00 1.98 2.00 1.77 3.41 3.26 3.24 3.33July 1.22 1.21 2.00 1.98 2.00 1.77 3.10 2.97 2.89 2.99Aug. 1.33 1.38 2.20 2.16 2.16 1.90 3.22 3.10 3.00 3.08Sept. 1.43 1.38 2.20 2.16 2.16 1.90 3.25 3.14 3.02 3.13Oct. 1.55 1.54 2.36 2.30 2.30 2.00 3.40 3.26 3.10 3.19Nov. 1.48 1.54 2.36 2.30 2.30 2.00 3.46 3.28 3.15 3.23Dec. 1.48 1.67 2.49 2.42 2.42 2.09 3.56 3.44 3.24 3.29
1998
Avg. 1.30 1.39 2.19 2.15 2.16 1.90 3.35 3.20 3.12 3.24Jan. 1.37 1.67 2.49 2.42 2.42 2.09 3.59 3.44 3.26 3.34Feb. 1.22 1.72 2.53 2.47 2.47 2.13 3.62 3.42 3.26 3.35Mar. 1.20 1.72 2.53 2.47 2.47 2.13 3.61 3.43 3.27 3.34Apr. 1.05 1.22 2.09 2.08 2.08 1.85 3.13 3.00 2.96 2.91May 1.04 1.22 2.09 2.08 2.08 1.85 3.00 2.78 2.67 2.78June 1.09 1.24 2.09 2.08 2.08 1.85 2.98 2.83 2.71 2.79July 1.13 1.24 2.09 2.08 2.08 1.85 3.10 2.99 2.89 2.83Aug. 1.29 1.28 2.13 2.12 2.12 1.89 3.14 3.00 2.92 2.86Sept. 1.24 1.28 2.13 2.12 2.12 1.89 3.25 3.07 2.87 2.82Oct. 1.18 1.70 2.55 2.49 2.47 2.16 3.72 3.49 3.25 3.10Nov. 1.12 1.70 2.55 2.49 2.47 2.16 3.86 3.59 3.31 3.09Dec. 0.98 1.20 2.12 2.11 2.11 1.89 3.64 3.40 3.12 2.97
1999
Avg. 1.16 1.43 2.28 2.25 2.25 1.98 3.39 3.20 3.04 3.02Jan. 0.94 1.05 1.97 1.96 1.96 1.75 3.41 3.17 2.89 2.77Feb. 0.92 1.03 1.95 1.97 1.98 1.79 3.31 3.09 2.85 2.75Mar. 0.93 1.02 1.88 1.90 1.90 1.74 3.16 2.97 2.80 2.71Apr. 0.95 1.14 1.94 1.95 1.94 1.77 2.98 2.86 2.83 2.72May 0.96 1.18 1.97 1.96 1.95 1.77 2.80 2.72 2.82 2.71June 1.00 1.20 1.97 1.95 1.95 1.77 2.70 2.62 2.75 2.65July 1.02 1.27 1.97 1.95 1.95 1.77 2.73 2.64 2.76 2.69Aug. 1.03 1.22 1.97 1.95 1.95 1.77 2.68 2.61 2.73 2.65Sept. 1.06 1.21 1.97 1.95 1.95 1.77 2.65 2.57 2.67 2.66
2000
Avg. 0.98 1.15 1.95 1.95 1.95 1.77 2.93 2.81 2.79 2.70
Note: For the San Diego, California, market, the farm level price is the California mailbox price; thecooperative price is the Southern California Class I price for 3.5 percent milkfat content; thewholesale price is the price paid by the commissary at the San Diego Naval Station; and the retailprice is the A.C. Nielsen price for the San Diego market. Prices may not average due to rounding.
Source: GAO’s analysis of price data provided by the California Department of Food and Agriculture,the Defense Commissary Agency, and A.C. Nielsen.
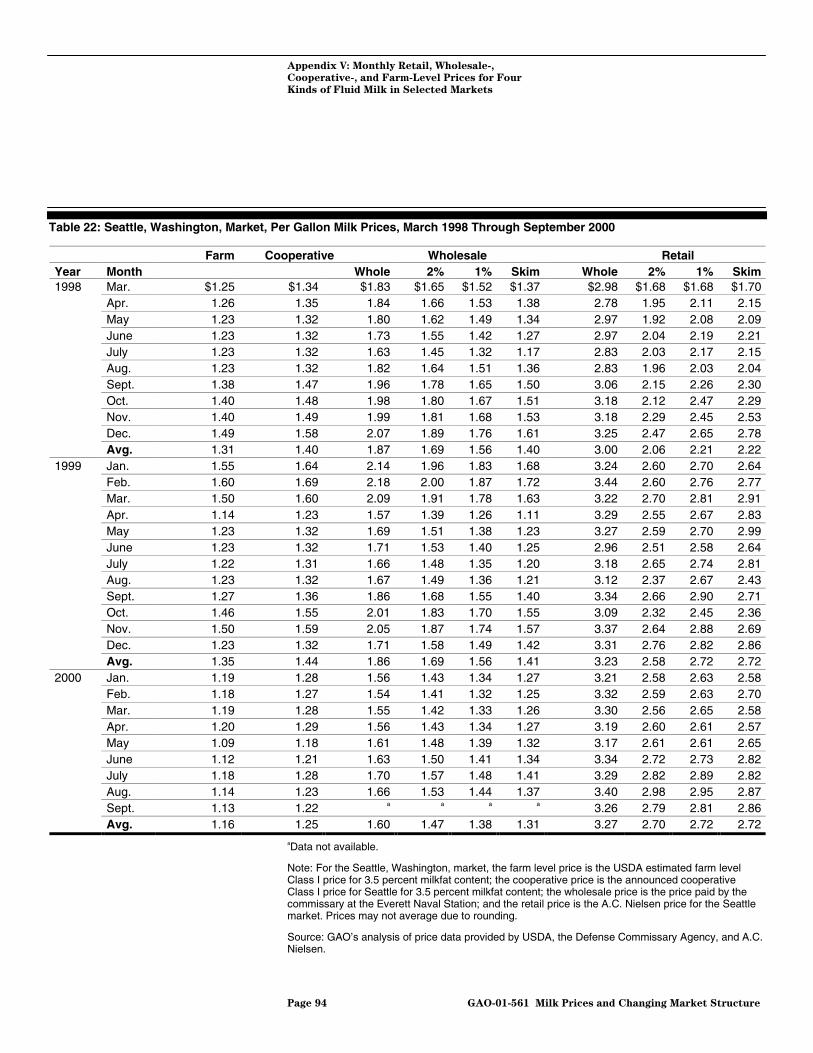
Appendix V: Monthly Retail, Wholesale-,
Cooperative-, and Farm-Level Prices for Four
Kinds of Fluid Milk in Selected Markets
Page 94 GAO-01-561 Milk Prices and Changing Market Structure
Table 22: Seattle, Washington, Market, Per Gallon Milk Prices, March 1998 Through September 2000
Farm Cooperative Wholesale RetailYear Month Whole 2% 1% Skim Whole 2% 1% Skim
Mar. $1.25 $1.34 $1.83 $1.65 $1.52 $1.37 $2.98 $1.68 $1.68 $1.70Apr. 1.26 1.35 1.84 1.66 1.53 1.38 2.78 1.95 2.11 2.15May 1.23 1.32 1.80 1.62 1.49 1.34 2.97 1.92 2.08 2.09June 1.23 1.32 1.73 1.55 1.42 1.27 2.97 2.04 2.19 2.21July 1.23 1.32 1.63 1.45 1.32 1.17 2.83 2.03 2.17 2.15Aug. 1.23 1.32 1.82 1.64 1.51 1.36 2.83 1.96 2.03 2.04Sept. 1.38 1.47 1.96 1.78 1.65 1.50 3.06 2.15 2.26 2.30Oct. 1.40 1.48 1.98 1.80 1.67 1.51 3.18 2.12 2.47 2.29Nov. 1.40 1.49 1.99 1.81 1.68 1.53 3.18 2.29 2.45 2.53Dec. 1.49 1.58 2.07 1.89 1.76 1.61 3.25 2.47 2.65 2.78
1998
Avg. 1.31 1.40 1.87 1.69 1.56 1.40 3.00 2.06 2.21 2.22Jan. 1.55 1.64 2.14 1.96 1.83 1.68 3.24 2.60 2.70 2.64Feb. 1.60 1.69 2.18 2.00 1.87 1.72 3.44 2.60 2.76 2.77Mar. 1.50 1.60 2.09 1.91 1.78 1.63 3.22 2.70 2.81 2.91Apr. 1.14 1.23 1.57 1.39 1.26 1.11 3.29 2.55 2.67 2.83May 1.23 1.32 1.69 1.51 1.38 1.23 3.27 2.59 2.70 2.99June 1.23 1.32 1.71 1.53 1.40 1.25 2.96 2.51 2.58 2.64July 1.22 1.31 1.66 1.48 1.35 1.20 3.18 2.65 2.74 2.81Aug. 1.23 1.32 1.67 1.49 1.36 1.21 3.12 2.37 2.67 2.43Sept. 1.27 1.36 1.86 1.68 1.55 1.40 3.34 2.66 2.90 2.71Oct. 1.46 1.55 2.01 1.83 1.70 1.55 3.09 2.32 2.45 2.36Nov. 1.50 1.59 2.05 1.87 1.74 1.57 3.37 2.64 2.88 2.69Dec. 1.23 1.32 1.71 1.58 1.49 1.42 3.31 2.76 2.82 2.86
1999
Avg. 1.35 1.44 1.86 1.69 1.56 1.41 3.23 2.58 2.72 2.72Jan. 1.19 1.28 1.56 1.43 1.34 1.27 3.21 2.58 2.63 2.58Feb. 1.18 1.27 1.54 1.41 1.32 1.25 3.32 2.59 2.63 2.70Mar. 1.19 1.28 1.55 1.42 1.33 1.26 3.30 2.56 2.65 2.58Apr. 1.20 1.29 1.56 1.43 1.34 1.27 3.19 2.60 2.61 2.57May 1.09 1.18 1.61 1.48 1.39 1.32 3.17 2.61 2.61 2.65June 1.12 1.21 1.63 1.50 1.41 1.34 3.34 2.72 2.73 2.82July 1.18 1.28 1.70 1.57 1.48 1.41 3.29 2.82 2.89 2.82Aug. 1.14 1.23 1.66 1.53 1.44 1.37 3.40 2.98 2.95 2.87Sept. 1.13 1.22 a a a a 3.26 2.79 2.81 2.86
2000
Avg. 1.16 1.25 1.60 1.47 1.38 1.31 3.27 2.70 2.72 2.72aData not available.
Note: For the Seattle, Washington, market, the farm level price is the USDA estimated farm levelClass I price for 3.5 percent milkfat content; the cooperative price is the announced cooperativeClass I price for Seattle for 3.5 percent milkfat content; the wholesale price is the price paid by thecommissary at the Everett Naval Station; and the retail price is the A.C. Nielsen price for the Seattlemarket. Prices may not average due to rounding.
Source: GAO’s analysis of price data provided by USDA, the Defense Commissary Agency, and A.C.Nielsen.

Appendix V: Monthly Retail, Wholesale-,
Cooperative-, and Farm-Level Prices for Four
Kinds of Fluid Milk in Selected Markets
Page 95 GAO-01-561 Milk Prices and Changing Market Structure
Table 23: Washington, D.C., Market, Per Gallon Milk Prices, March 1998 Through September 2000
Farm Cooperative Wholesale RetailYear Month Whole 2% 1% Skim Whole 2% 1% Skim
Mar. $1.40 $1.52 $1.96 $1.83 $1.75 $1.67 $2.49 $2.48 $2.47 $2.43Apr. 1.41 1.53 1.97 1.80 1.70 1.60 2.53 2.48 2.47 2.42May 1.36 1.49 1.92 1.77 1.67 1.57 2.52 2.51 2.45 2.46June 1.26 1.38 1.85 1.69 1.58 1.48 2.50 2.49 2.46 2.43July 1.16 1.29 1.75 1.55 1.42 1.29 2.49 2.48 2.41 2.43Aug. 1.36 1.48 1.93 1.68 1.52 1.36 2.54 2.53 2.45 2.46Sept. 1.50 1.62 2.07 1.82 1.65 1.48 2.65 2.56 2.51 2.49Oct. 1.52 1.64 2.09 1.81 1.62 1.44 2.63 2.56 2.44 2.37Nov. 1.50 1.62 2.08 1.72 1.46 1.21 2.63 2.52 2.39 2.27Dec. 1.58 1.70 2.17 1.86 1.65 1.44 2.56 2.58 2.41 2.23
1998
Avg. 1.41 1.53 1.98 1.75 1.60 1.45 2.55 2.52 2.45 2.40Jan. 1.65 1.77 2.26 2.06 1.92 1.79 2.75 2.72 2.58 2.40Feb. 1.70 1.82 2.31 2.16 2.06 1.96 2.84 2.61 2.52 2.35Mar. 1.60 1.72 2.22 2.06 1.96 1.85 2.89 2.63 2.56 2.36Apr. 1.09 1.21 1.70 1.54 1.44 1.33 2.63 2.45 2.34 2.15May 1.29 1.41 1.82 1.67 1.57 1.47 2.52 2.46 2.32 2.22June 1.28 1.41 1.91 1.80 1.73 1.66 2.52 2.47 2.34 2.26July 1.24 1.36 1.91 1.78 1.70 1.61 2.51 2.48 2.38 2.32Aug. 1.25 1.37 1.91 1.72 1.60 1.48 2.45 2.42 2.33 2.26Sept. 1.37 1.49 2.15 1.99 1.90 1.79 2.53 2.50 2.40 2.34Oct. 1.56 1.68 2.34 2.18 2.08 1.97 2.73 2.66 2.57 2.51Nov. 1.60 1.72 1.93 1.80 1.72 1.68 2.80 2.74 2.67 2.61Dec. 1.19 1.31 1.52 1.39 1.31 1.27 2.73 2.66 2.58 2.55
1999
Avg. 1.40 1.52 2.00 1.85 1.75 1.66 2.66 2.57 2.47 2.36Jan. 1.20 1.32 1.37 1.24 1.16 1.12 2.69 2.62 2.53 2.52Feb. 1.18 1.30 1.63 1.53 1.37 1.31 2.66 2.59 2.50 2.49Mar. 1.19 1.31 1.64 1.54 1.38 1.32 2.61 2.54 2.45 2.45Apr. 1.21 1.33 1.64 1.54 1.38 1.32 2.60 2.53 2.45 2.46May 1.26 1.38 1.69 1.53 1.43 1.37 2.60 2.54 2.46 2.46June 1.28 1.40 1.71 1.55 1.45 1.39 2.61 2.54 2.47 2.46July 1.32 1.45 1.78 1.62 1.52 1.46 2.61 2.56 2.47 2.47Aug. 1.28 1.40 1.74 1.58 1.48 1.42 2.62 2.57 2.49 2.49Sept. 1.27 1.39 1.73 1.57 1.47 1.41 2.57 2.54 2.46 2.46
2000
Avg. 1.24 1.36 1.66 1.52 1.40 1.35 2.62 2.56 2.47 2.47
Note: For the Washington, D.C., market, the farm level price is the USDA estimated farm level Class Iprice for 3.5 percent milkfat content; the cooperative price is the announced cooperative Class I pricefor Washington, D.C. for 3.5 percent milkfat content; the wholesale price is the price paid by thecommissary at Bolling Air Force Base; and the retail price is the A.C. Nielsen price for theWashington, D.C., market. Prices may not average due to rounding.
Source: GAO’s analysis of price data provided by USDA, the Defense Commissary Agency, and A.C.Nielsen.

Appendix VI: Consolidation Trends and the
Degree of Concentration in the Dairy Industry
Page 96 GAO-01-561 Milk Prices and Changing Market Structure
During the last decade, the dairy industry, like much of the agriculturalsector, has experienced increasing consolidation. At each level of themarketing chain, including dairy farms, cooperatives, wholesale milkprocessors, and retail grocery stores, there are fewer, but larger, players inthe industry. Increased consolidation has in turn led to a greater degree ofconcentration in the industry (measured by the market share of the topfour players in a given market). This appendix provides information on thetrends in consolidation at each level of the milk marketing chain and thelevel of concentration that exists at the cooperative, wholesale, and retaillevels for the markets included in our review. It also describes some of thekey factors that federal agencies consider along with the degree ofconcentration in an industry when making antitrust determinations.
The number of dairy farms in the United States has steadily decreasedsince the mid-1960s, according to the 1997 Census of Agriculture. Whiledairy farms are not unique in this regard, the decrease in number of dairyfarms has been significant. For example, between 1987 and 1997, thenumber of dairy farms declined from 202,068 to 116,874, or about42 percent. The American Farm Bureau Federation recently reported thatthe number of dairy farms had further declined to 83,025 in 2000, aone-year decrease of 4,502 farms. In addition, the number of dairy cows inthe United States has also declined. According to the National AgriculturalStatistics Service, the number of dairy cows decreased from 9.68 million to9.16 million, or about 5 percent, from 1992 to 1999. Furthermore, smalldairy farms are being replaced by larger operations. Although the averagedairy farm size for the nation is about 82 dairy cows, it can vary greatly byregion. For example, in California, more than 40 percent of the dairy farmshave 500 or more dairy cows.
While the total number of dairy farms and cows in the United States hasdeclined during the 1990s, average milk production per cow has increasedsignificantly due to technological and genetic advancements. The resulthas been an overall increase in the nation’s milk production. From 1992through 1999, average milk production per cow increased by about14 percent, from 15,570 pounds in 1992 to 17,771 pounds in 1999. TotalU.S. milk production increased from 150.8 billion pounds to 162.7 billionpounds, or about 8 percent, between 1992 and 1999; and for 2000, it isestimated to reach about 167.7 billion pounds.
According to an industry analysis, these trends in numbers and size ofdairy farms are expected to continue because larger farms are associatedwith lower costs of production and greater economies of scale. Given
Appendix VI: Consolidation Trends and theDegree of Concentration in the DairyIndustry
Consolidation ofDairy Farms

Appendix VI: Consolidation Trends and the
Degree of Concentration in the Dairy Industry
Page 97 GAO-01-561 Milk Prices and Changing Market Structure
similar management practices, larger farms tend to be more cost-effectivebecause fixed costs like machinery and land are spread over more units ofproduction. In addition, larger farms may receive volume premiums andhauling discounts because they can market greater volumes of milk moreefficiently.
Dairy cooperative unification activities1 in the 1960s and 1970s led to theemergence of regional cooperatives, however, in recent years, unificationamong dairy cooperatives has resulted in the creation of multi-regionalcooperatives. These multi-regional cooperatives in many cases market asignificant percentage of the total milk produced in the United States. Forexample, in January 1998, four major dairy cooperatives—Mid-AmericaDairymen, Inc., the Southern Region of Associated Milk Producers, Inc.,Milk Marketing, Inc., and Western Dairymen Cooperative—combined toform Dairy Farmers of America, the largest dairy cooperative in thecountry. In 1999, this newly created cooperative had over 24,000 farmermembers in 43 states and marketed almost 35 billion pounds of milk orabout 21 percent of all the milk produced in the country.
As dairy cooperatives continue to unify, the level of concentration at thecooperative-level—as measured by the market share of the top dairycooperatives—has also increased. In 1999, the nation’s top four dairycooperatives marketed about 40 percent of all the milk produced in theUnited States, or about 23 percent more than in 1990.2 The level ofconcentration is significantly higher at the local level. We analyzed datacollected by USDA to determine the market share of dairy cooperatives in11 of the 14 federally regulated markets selected for our review. We didnot include three federally regulated markets—Denver, Miami, andPhoenix—in our analysis because of confidentiality reasons. Our analysisindicated that the percentage of milk marketed by the four largestcooperatives in each of the 11 markets was significantly higher than thenational average, and ranged from 59 to 97 percent in December 1997 andfrom 64 to 97 percent in December 1999. In all of the 11 markets, themarket share of the four largest cooperatives increased or remained the
1 Unification activities include mergers, acquisitions, or consolidations.
2 Hoard’s Dairyman, Oct. 10, 2000. The top four dairy cooperatives in 1999 were DairyFarmers of America; California Dairies, Inc.; Land O’Lakes, Inc.; and Northwest DairyAssociation and in 1990 were Associated Milk Producers, Inc.; Mid-America Dairymen, Inc.;Farmers Union Milk Marketing Cooperative; and California Milk Producers Association.
Unification of DairyCooperatives
Appendix VI: Consolidation Trends and the
Degree of Concentration in the Dairy Industry
Page 98 GAO-01-561 Milk Prices and Changing Market Structure
same between 1997 and 1999. Table 24 shows the market share of the topfour cooperatives in each of the 11 federally regulated markets included inour review for the month of December 1997 through 1999. (Please seeappendix I for a detailed description of our analysis and the geographicarea covered by each of these markets.)
According to industry experts, the increased unification activities of dairycooperatives has occurred for a variety of reasons and is expected tocontinue. Specifically, general consolidation trends in the rest of the dairyindustry are causing cooperatives to turn to unification as a means ofmaintaining or acquiring market prominence and enhancing the bargainingposition of their members. Unification allows cooperatives to integratetheir operations both horizontally and vertically, as well as reapeconomies of size and scale, and more efficiently use availablemanufacturing capacity. Unification also often leads to more streamlinedoperations and reduced costs. For example, reductions in administrativeoverhead and hauling costs, and gains in bargaining strength in themarketplace were some of the primary reasons cited for combining fourmajor dairy cooperatives into one cooperative—the Dairy Farmers ofAmerica. In addition, dairy cooperatives are participating in a variety ofjoint ventures with other entities in the dairy industry to ensure an outletfor the milk they market for their members. For example, Dairy Farmersof America is involved in joint ventures with other dairy cooperatives aswell as large proprietary firms such as Suiza Foods Corporation.

Appendix VI: Consolidation Trends and the
Degree of Concentration in the Dairy Industry
Page 99 GAO-01-561 Milk Prices and Changing Market Structure
Table 24: Share of Milk Delivered By the Four Largest Dairy Cooperatives in Selected Markets for the Month of December,1997-1999
Market share of top four cooperativesa (percent)Selected market area Federal Milk Marketing Order December 1997 December 1998 December 1999Atlanta, GA Southeast 61.5 69.9 71.5Boston, MA New England 68.5 70.4 69.6Charlotte, NC Carolina 77.6 79.5 85.2Cincinnati, OH Ohio Valley 61.6 63.9 63.8Dallas, TX Texas 96.5 98.2 97.1Denver, CO Eastern Colorado b b b
Miami, FL Southeastern Florida b b b
Milwaukee, WI Chicago Regional 63.1 62.7 64.7Minneapolis, MN Upper Midwest 59.3 57.0 63.5New Orleans, LA Southeast 61.5 69.9 71.5Phoenix, AZ Central Arizona b b b
Salt Lake City, UT Great Basin 85.4 89.0 93.2Seattle, WA Pacific Northwest 84.8 84.2 85.0Washington, DC Middle Atlantic 77.1 77.0 76.8Average for the 11 markets 72.4 74.7 76.5
Note: To determine the level of concentration in 11 of the 14 federally regulated marketing areasincluded in this report, we obtained proprietary data from USDA for the month of December for 1997through 1999. Appendix I provides additional details on our analysis of these data and the geographicarea covered by the 14 markets.
aIn some of the markets the number of cooperatives marketing milk was less than four.Consequently, the market share data for some of the markets included in this table represent fewerthan four cooperatives. We have not disclosed which markets had fewer than four cooperatives forconfidentiality reasons.
bData not available for the market because of confidentiality reasons.
Through aggressive acquisitions of independent dairy processing plants, ahandful of fluid milk processing firms in recent years have becomedominant players in the dairy industry at the wholesale level. Thesecompanies have generally pursued the business strategy of acquiringstrong regional dairy processing plants so that they can strengthen theirpresence in existing markets, while expanding their geographic coverageto a national level. According to industry sources, Suiza FoodsCorporation and Dean Foods Company—currently the two leadingwholesale fluid milk processors in the nation—have attained their statusprimarily through acquisitions of other dairy processing firms. TogetherSuiza and Dean Foods have acquired about 50 dairy processors during theperiod from 1997 to 2000. Table 25 shows some of the major acquisitionsmade by these companies between 1997 and 2000. On April 5, 2001, Suizaannounced that it was acquiring Dean Foods. If this merger is approved by
Concentration at theWholesale Level

Appendix VI: Consolidation Trends and the
Degree of Concentration in the Dairy Industry
Page 100 GAO-01-561 Milk Prices and Changing Market Structure
federal regulators, the combined company will process about one-third ofthe U.S. fluid milk market. Industry sources are concerned about theimpact that this merger may have on the competitiveness of the fluid milksector.
Table 25: Recent Major Acquisitions of Dairy Processors in the United States by Suiza Foods Corporation and Dean FoodsCompany
Acquisitions by Suiza FoodsCorporation
Year Company AcquiredValue of Annual Sales at Time
of AcquisitionValley of Virginia Cooperative Milk Producers Association $209 million2000Southern Foods Group $1.3 billionAdohr Farms $148 million1999Broughton Foods Company $202 millionLand-O-Sun Dairies $464 million1998Tuscan Farms/Lehigh Valley Dairies $523 millionGarelick Farms and Franklin Plastics $370 million1997Dairy Fresh $125 million
Acquisitions by Dean FoodsCompany
Year Company AcquiredValue of Annual Sales at Time
of AcquisitionLand O’ Lakes (upper Midwest fluid milk operations) $310 million2000Dairy Express, Inc. $13 millionAlta-Dena Certified Dairy $200 millionBerkeley Farms, Inc. $160 millionU.C. Milk Company $35 millionBarber Dairies $200 million
1999
Hillside Dairy $30 millionPurity Dairies $100 millionCoburg Dairy $70 millionWengert’s Dairy $40 millionAmerican Stores Co. (dairy operations) $250 millionSani-Dairy Division of The Penn Traffic Company $65 millionMaplehurst Dairy $70 million
1998
H. Meyer Dairy $70 million1997 Tri-State Dairy, Inc. NA
Source: GAO’s analysis of various industry publications.
The acquisition and consolidation trend at the wholesale level has led tohigher concentration ratios for fluid milk processors in some markets.According to the 1997 Census of Manufacturers, the market share for the
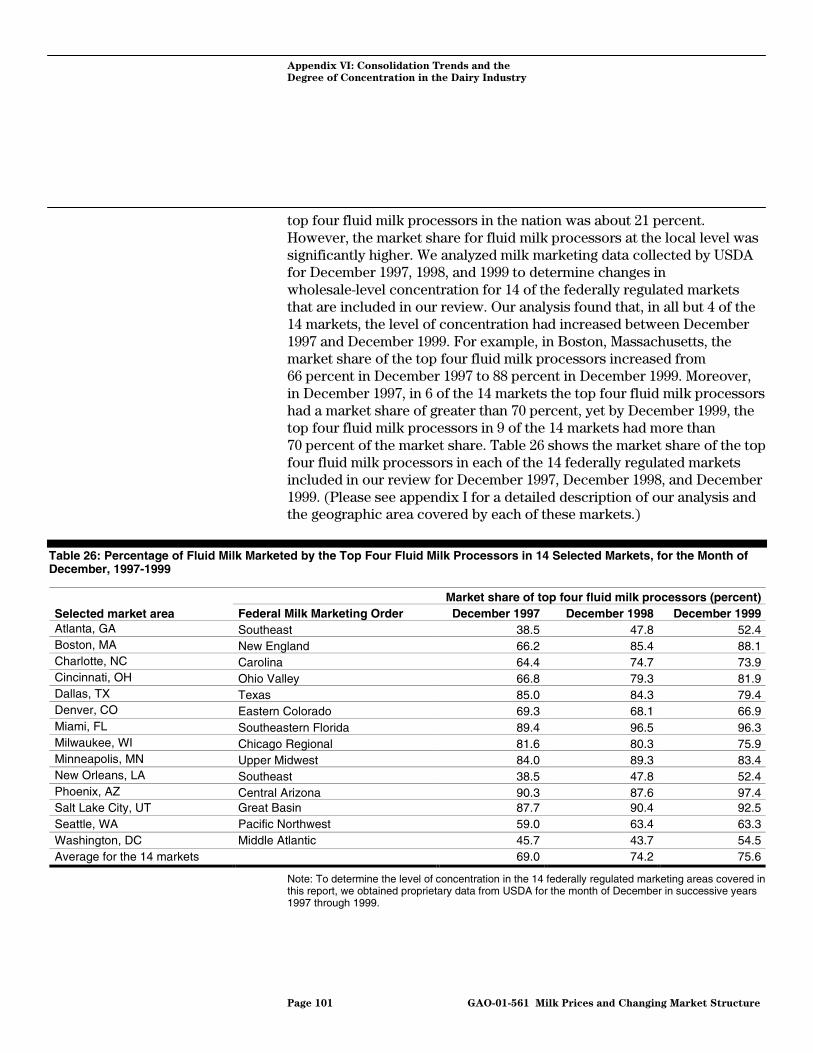
Appendix VI: Consolidation Trends and the
Degree of Concentration in the Dairy Industry
Page 101 GAO-01-561 Milk Prices and Changing Market Structure
top four fluid milk processors in the nation was about 21 percent.However, the market share for fluid milk processors at the local level wassignificantly higher. We analyzed milk marketing data collected by USDAfor December 1997, 1998, and 1999 to determine changes inwholesale-level concentration for 14 of the federally regulated marketsthat are included in our review. Our analysis found that, in all but 4 of the14 markets, the level of concentration had increased between December1997 and December 1999. For example, in Boston, Massachusetts, themarket share of the top four fluid milk processors increased from66 percent in December 1997 to 88 percent in December 1999. Moreover,in December 1997, in 6 of the 14 markets the top four fluid milk processorshad a market share of greater than 70 percent, yet by December 1999, thetop four fluid milk processors in 9 of the 14 markets had more than70 percent of the market share. Table 26 shows the market share of the topfour fluid milk processors in each of the 14 federally regulated marketsincluded in our review for December 1997, December 1998, and December1999. (Please see appendix I for a detailed description of our analysis andthe geographic area covered by each of these markets.)
Table 26: Percentage of Fluid Milk Marketed by the Top Four Fluid Milk Processors in 14 Selected Markets, for the Month ofDecember, 1997-1999
Market share of top four fluid milk processors (percent)Selected market area Federal Milk Marketing Order December 1997 December 1998 December 1999Atlanta, GA Southeast 38.5 47.8 52.4Boston, MA New England 66.2 85.4 88.1Charlotte, NC Carolina 64.4 74.7 73.9Cincinnati, OH Ohio Valley 66.8 79.3 81.9Dallas, TX Texas 85.0 84.3 79.4Denver, CO Eastern Colorado 69.3 68.1 66.9Miami, FL Southeastern Florida 89.4 96.5 96.3Milwaukee, WI Chicago Regional 81.6 80.3 75.9Minneapolis, MN Upper Midwest 84.0 89.3 83.4New Orleans, LA Southeast 38.5 47.8 52.4Phoenix, AZ Central Arizona 90.3 87.6 97.4Salt Lake City, UT Great Basin 87.7 90.4 92.5Seattle, WA Pacific Northwest 59.0 63.4 63.3Washington, DC Middle Atlantic 45.7 43.7 54.5Average for the 14 markets 69.0 74.2 75.6
Note: To determine the level of concentration in the 14 federally regulated marketing areas covered inthis report, we obtained proprietary data from USDA for the month of December in successive years1997 through 1999.

Appendix VI: Consolidation Trends and the
Degree of Concentration in the Dairy Industry
Page 102 GAO-01-561 Milk Prices and Changing Market Structure
According to industry sources, consolidation at the wholesale level in thedairy industry has increased in response to on-going consolidation at theretail level. The wave of supermarket mergers in the 1990’s has providedfluid milk processors incentives to acquire other processors to supplyprivate label (store brand) milk to the growing supermarket chains. BothSuiza and Dean Foods have been active in this regard. Wholesalerscontend that they can meet the increasing demands and requirements oflarge retail accounts only through consolidation. Moreover, industryofficials cite decreasing demand for fluid milk and fragmentation of thedairy industry as additional reasons that are driving the need forwholesale-level consolidation. By following a strategy of integratingregional dairies and consolidating their operations (often by closing somedairy plants in an area), these companies hope to raise the efficiency andprofitability of the sector that historically has had low profit margins.
U.S. supermarkets, which account for approximately 76 percent ofnational fluid milk retail sales, have undergone unprecedentedconsolidation and structural change in recent years. According to a recentEconomic Research Service analysis, large retailers have acquired almost3,500 supermarkets nationwide since 1996, representing annual sales ofmore than $67 billion. Two of the largest food retailing combinations inhistory were announced in 1998: the acquisition of Fred Meyer—thenation’s sixth largest food retailer—by top-ranked Kroger Company; andthe merger of Albertson’s—the fourth largest U.S. food retailer—withsecond-ranked American Stores. The magnitude of these mergers andacquisitions has resulted in the emergence of multiregional food retailingoperations that are approaching an almost nationwide scope. For example,after the Kroger Company acquired Fred Meyer, the combined firmoperated 2,288 supermarkets in 31 states and had sales of about $45 billionin 1999 which made up 10.4 percent of total grocery store salesnationwide.
The increase in mergers and acquisitions among large food retailers hasled to an increase in retail-level concentration at the national level and inmany local markets. In 1992, the top four grocery retailers in the countryaccounted for almost 16 percent of total grocery sales nationwide. In 1998,the top four grocery retailers accounted for almost 29 percent of total
Concentration at theRetail Level
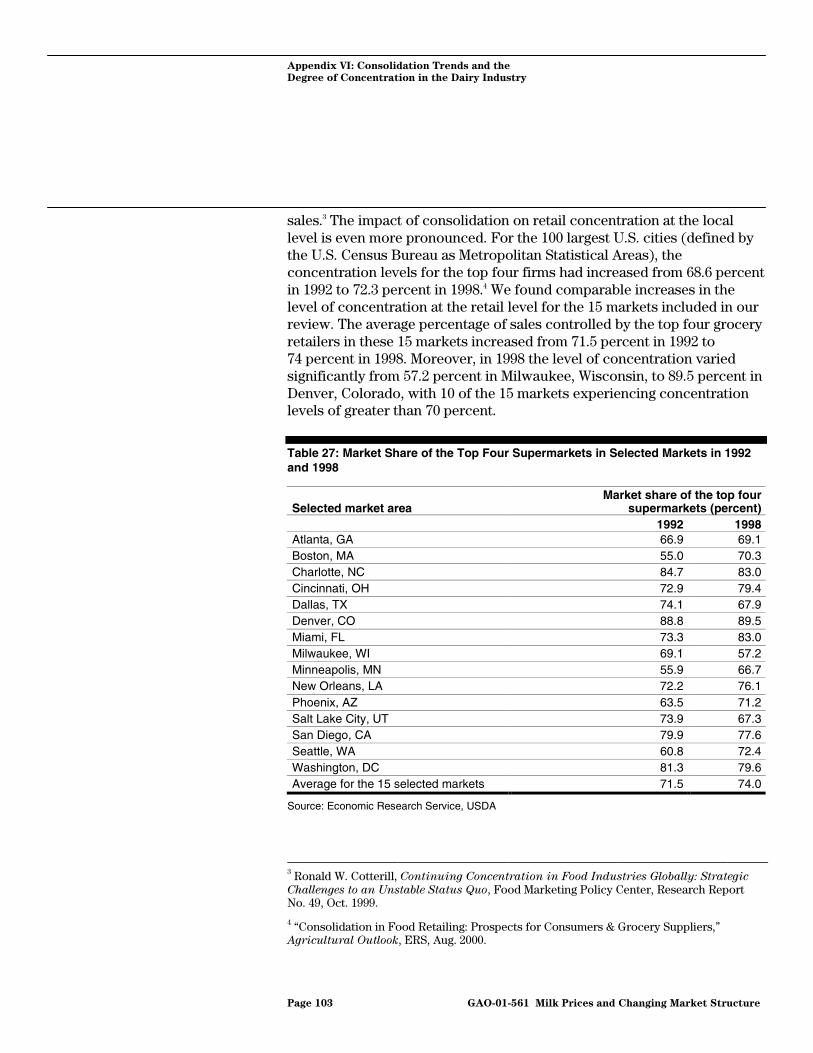
Appendix VI: Consolidation Trends and the
Degree of Concentration in the Dairy Industry
Page 103 GAO-01-561 Milk Prices and Changing Market Structure
sales.3 The impact of consolidation on retail concentration at the locallevel is even more pronounced. For the 100 largest U.S. cities (defined bythe U.S. Census Bureau as Metropolitan Statistical Areas), theconcentration levels for the top four firms had increased from 68.6 percentin 1992 to 72.3 percent in 1998.4 We found comparable increases in thelevel of concentration at the retail level for the 15 markets included in ourreview. The average percentage of sales controlled by the top four groceryretailers in these 15 markets increased from 71.5 percent in 1992 to74 percent in 1998. Moreover, in 1998 the level of concentration variedsignificantly from 57.2 percent in Milwaukee, Wisconsin, to 89.5 percent inDenver, Colorado, with 10 of the 15 markets experiencing concentrationlevels of greater than 70 percent.
Table 27: Market Share of the Top Four Supermarkets in Selected Markets in 1992and 1998
Selected market areaMarket share of the top four
supermarkets (percent)1992 1998
Atlanta, GA 66.9 69.1Boston, MA 55.0 70.3Charlotte, NC 84.7 83.0Cincinnati, OH 72.9 79.4Dallas, TX 74.1 67.9Denver, CO 88.8 89.5Miami, FL 73.3 83.0Milwaukee, WI 69.1 57.2Minneapolis, MN 55.9 66.7New Orleans, LA 72.2 76.1Phoenix, AZ 63.5 71.2Salt Lake City, UT 73.9 67.3San Diego, CA 79.9 77.6Seattle, WA 60.8 72.4Washington, DC 81.3 79.6Average for the 15 selected markets 71.5 74.0
Source: Economic Research Service, USDA
3 Ronald W. Cotterill, Continuing Concentration in Food Industries Globally: Strategic
Challenges to an Unstable Status Quo, Food Marketing Policy Center, Research ReportNo. 49, Oct. 1999.
4 “Consolidation in Food Retailing: Prospects for Consumers & Grocery Suppliers,”Agricultural Outlook, ERS, Aug. 2000.
Appendix VI: Consolidation Trends and the
Degree of Concentration in the Dairy Industry
Page 104 GAO-01-561 Milk Prices and Changing Market Structure
According to industry experts, consolidation is expected to continue at thefood retail level for a number of reasons. In particular, retail food storesare responding to the slowing growth in grocery store sales and increasedcompetition from nontraditional retailers, such as mass-merchandisersand warehouse club operators, by becoming larger and offering a greatervariety of goods and services to their customers. In addition, food retailersinvolved in recent mergers and acquisitions have cited lower costs andefficiency gains as the primary benefits of consolidation. These retailersbelieve they can lower procurement, marketing, and distribution coststhrough consolidation and increased size. Efficiency gains can also helpoffset the cost of providing more variety and services to customers.Another contributing factor to growth through mergers and acquisitions isthe greater capital expenditure required to build new stores comparedwith the cost of purchasing existing stores. Considering the time necessaryto achieve positive store profitability, the financial risk of building a newstore is often greater than purchasing an existing store.
In 2000, concerned about the increasing level of market concentration inthe dairy industry, several congressional leaders from both the House andSenate requested the Department of Justice and the Federal TradeCommission (FTC) to investigate possible market abuses by dairyprocessors and food retailers. Market concentration is a useful indicatorof the likely potential competitive effect of a merger or consolidation andis a factor the Department of Justice and the FTC consider in reviewingmergers and consolidations for potential violations of antitrust laws.
While concentration levels play an important role in federal reviews of aproposed consolidation, other factors are also important to regulators inmaking antitrust determinations. High concentration levels may beindicative of noncompetitive circumstances where buyers or sellers canexercise some degree of market power.5 In addition, federal regulators aremore likely to challenge a consolidation that results in a substantialincrease in concentration levels for a market that is already highlyconcentrated. However, federal regulators also consider the following aspart of their review of proposed consolidations:
5 Market power is the ability of buyers or sellers to influence prices above or below theprices that would have been set in a competitive market.
Federal Response toIncreasedConcentration Levels

Appendix VI: Consolidation Trends and the
Degree of Concentration in the Dairy Industry
Page 105 GAO-01-561 Milk Prices and Changing Market Structure
• whether anti-competitive effects, such as unilateral price increases orelimination of competition, are likely to occur because of the merger;
• the ease of entry into a given market after the merger; and• whether the efficiencies being claimed from the merger can be verified
and attributed to the merger and not to reductions in competition.
If the results of a federal review indicate that a proposed consolidationmay substantially lessen competition in a market—amounting to aviolation of the antitrust laws—regulators may require the divestiture ofone or more of the merging firms’ holdings to an independent third party.This will help preserve competition in the affected market. Examples ofrecent federal interventions relating to dairy or retail food industrymergers that required divestiture to preserve competition in a marketinclude the following:
• In 1997, the Department of Justice sued to block the acquisition ofBorden/Meadows Gold Dairies Holdings, Inc. by Mid-America Dairymen,Inc.—the largest dairy cooperative in the nation at the time. TheDepartment was concerned that the acquisition would substantially lessencompetition for milk sales to public schools throughout eastern Texas andLouisiana. The final decree allowed the acquisition, but required thedivestiture of nine plants—five in Texas, three in Louisiana, and one inNew Mexico. A newly created firm was allowed to purchase the divestedplants.
• In 1998, the Department of Justice approved Dean Foods Company’sacquisition of Barber Dairies, Inc. only after the parties agreed to sell aBarber Dairies plant in Huntsville, Alabama. The Department wasconcerned that the original proposed acquisition would have lessenedcompetition in bidding for milk supplied to school districts in at least 18counties in Alabama.
• In 1999, the Department of Justice sued to block Suiza FoodsCorporation’s acquisition of the Broughton Foods Company, because itwas believed that the merger would result in higher prices for milk sold toschool districts in Kentucky. The final judgment (which approved anagreement by the parties) allowed the acquisition, but required thedivestiture of Southern Belle Dairy—a holding of Broughton FoodsCompany—before the acquisition could proceed.
• In 1999, FTC opposed Albertson’s Inc.’s proposed acquisition of AmericanStores Company because it would lessen supermarket competition inCalifornia, Nevada, and New Mexico. It was believed that the proposedacquisition could result in higher prices, or reduced quality and selectionfor consumers. The FTC ultimately allowed the acquisition, but only after

Appendix VI: Consolidation Trends and the
Degree of Concentration in the Dairy Industry
Page 106 GAO-01-561 Milk Prices and Changing Market Structure
the companies agreed to divest 144 supermarkets and five supermarketsites in 57 local markets to respond to these concerns.
• In 2000, FTC opposed Delhaize America, Inc.’s proposed merger withHannaford Bros. Co. because it was alleged that the proposed mergerwould have resulted in reduced competition in the relevant marketsthrough the elimination of direct competition and increased likelihood ofDelhaize exercising unilateral market power and increasing prices forconsumers. The FTC ultimately allowed the merger, but only after thecompanies agreed to divest 37 Hannaford stores and one supermarket sitein a number of markets in Virginia and North Carolina.

Appendix VII: Research Measuring the Impact
of Concentration and Market Power on the
Dairy Industry and Fluid Milk Sector
Page 107 GAO-01-561 Milk Prices and Changing Market Structure
As a result of increased consolidation in many agricultural markets,economists have recently attempted to estimate the degree of marketpower in these industries. In general, market power refers to the ability ofbuyers or sellers to influence prices above or below the prices that wouldhave been set in a competitive market. According to economic theory,there is a strong link between the structure of an industry, in particular thedegree of concentration, and the power firms exert over prices in themarket. Notable recent examples of studies measuring the degree ofmarket power have been primarily from the beef and meatpackingindustries [Schroeter, (1988)1; Schroeter and Azzam (1990)2; Azzam andPagoulatos, (1990)3; Muth and Wohlgenant (1999) 4; Morrison Paul, (2000);5
and others]. As we described in appendix VI, the fluid milk market and thedairy industry have also experienced an increase in both consolidation andconcentration. However, fewer empirical studies have been conducted tomeasure the effects of concentration and market power in this sectorbecause certain characteristics make economic modeling more difficultfor this industry. In this appendix, we examine the various difficulties thatresearchers face when they try to measure market power in the dairyindustry, and we summarize those economic studies that we identified thathave tried to measure the impact of concentration and market power onthe dairy industry and/or fluid milk market.
1 J.R. Schroeter, “Estimating the Degree of Market Power in the Beef Packing Industry,”The Review of Economics and Statistics 70 (February 1988): 158-62.
2 J.R. Schroeter, and A. Azzam, “Measuring Market Power in Multi-Product Oligopolies: TheU.S. Meat Industry,” Applied Economics 22 (October 1990): 1365-76.
3 A.M. Azzam and E. Pagoulatos, “Testing Oligopolistic and Oligopsonistic Behavior: AnApplication to the U.S. Meat-Packing Industry,” Journal of Agricultural Economics 41(September 1990): 362-69.
4 Mary K. Muth and Michael K. Wolhgenant, “A Test for Market Power Using Marginal Inputand Output Prices with Application to the U.S. Beef Processing Industry,” American
Journal of Agricultural Economics 81 (August 1999): 638-43.
5 Catherine J. Morrison Paul, Cost Economies and Market Power in U.S. Meatpacking,Giannini Foundation # 44, University of California Giannini Foundation for AgriculturalEconomics, May 2000.
Appendix VII: Research Measuring theImpact of Concentration and Market Poweron the Dairy Industry and Fluid Milk Sector
Appendix VII: Research Measuring the Impact
of Concentration and Market Power on the
Dairy Industry and Fluid Milk Sector
Page 108 GAO-01-561 Milk Prices and Changing Market Structure
Economists use economic models to help explain how a market behavesbased on certain market parameters and assumptions. One standard modelassumption has typically been that of perfect competition in a market—that is, many small buyers and sellers, a standardized product, free entryand exit, and perfect knowledge. However, when there is a departure fromperfect competition, for example in a highly concentrated market, certainmodeling complications arise. In more concentrated markets, firms makestrategic decisions that can lead to different price and productionoutcomes than would occur in a perfectly competitive model. This couldhappen because large and dominant firms in the market may exert somepower over the selling and/or buying price. While measuring theseoutcomes is complex in any market, the nature of the U.S. dairy industryleads to further analytical complications. Some of these complicationsinclude (1) the diversity of the dairy market structure from one region ofthe country to another, (2) the presence of market power at successivestages of the dairy industry, (3) layers of federal price intervention, (4) avariety of vertical and horizontal arrangements such as joint venturesbetween the various levels of the market, and (5) a lack of actual pricedata at the wholesale level. These difficulties are described in greaterdetail below.
First, because there is no single prototype that describes all of the fluidmilk markets that exist across the country, it would be difficult, if notimpossible, for one type of economic model to capture market powereffects nationally or in all regions of the country. Although the trend in thefluid milk industry is toward increasing concentration at all levels, there isnevertheless significant diversity in market structure from one region ofthe country to another. For example, in one region of the country themarket structure consists of a few cooperatives bargaining with one largeprocessor. In another region, a few cooperatives bargain with a fewprocessors that are, in turn, bargaining with a few large retailers, while inanother part of the country, there is only one large cooperative bargainingwith one large processor—which is known as a “bilateral monopoly”situation. Therefore, any generalizations made about market power from aparticular economic model may not be entirely applicable orrepresentative of the entire country or all regional markets.
Second, because market power may exist at each successive level of thefluid milk marketing chain, capturing these effects with any one economicmodel becomes problematic. For example, in this sector, there may besituations in which retailers exercise an oligopoly power over consumers;processors exercise an oligopsony power over farmers; and at the sametime, there is imperfect competition between processors and retailers.
Difficulties inMeasuring MarketPower in the DairyIndustry

Appendix VII: Research Measuring the Impact
of Concentration and Market Power on the
Dairy Industry and Fluid Milk Sector
Page 109 GAO-01-561 Milk Prices and Changing Market Structure
While theoretical models exist that capture these successive market powereffects, they have rarely been applied to actual agricultural markets, suchas fluid milk. In general, while a variety of approaches measure marketpower, most empirical models deal with only one side of the market,either the seller side (oligopoly power) or the buyer side (oligopsonypower). In these models, there is an assumption that on one side of themarket, price is taken as a given, while on the other side, buyers and/orsellers may or may not exercise some market power. Some analysts haveapplied the theory of “bilateral oligopoly” (high levels of market power onboth the buyer and seller sides of the market) to the U.S. wholesale marketfor beef (Schroeter et al., 2000).6 This type of analysis has not yet beenconducted for the fluid milk market. More recently however, Dhar (2001)7
has applied a two-stage oligopoly model (two-stage seller market power)to the processing and retailing sectors of the fluid milk market for theBoston milk market (See below).
Third, market power models are not well suited to those agriculturalsectors that contain layers of government intervention in the priceformation process, such as the dairy markets. Because governmentprograms, such as the federal milk marketing order program and the dairyprice support program, set a floor under farm prices, it is difficult toincorporate the effects of market power from dominant buyers and/orsellers. For example, in such markets, estimating the effect of buyermarket power would be limited to the extent that a buyer could reduceover-order premiums, because prices could not fall below the floor set bythe government programs.
Fourth, developing realistic models of market power in the dairy and fluidmilk industry is difficult because many of the dairy processors andcooperatives are involved in other horizontal and vertical arrangements,which do not fit well into the typical conceptual framework. For example,both Dairy Farmers of America, Inc. (DFA) and Suiza Foods makeextensive use of joint ventures with other entities. DFA, for example, isinvolved in joint ventures with other dairy cooperatives as well as largeproprietary firms such as Suiza Foods. At the same time, Suiza Foods has
6 John R. Schroeter, Azzedine M. Azzam, and Mingxia Zhang, “Measuring Market Power inBilateral Oligopoly: The Wholesale Market for Beef.” Southern Economic Journal 66 (3)(2000): 526-47.
7 Tirtha P. Dhar, “Two-Stage Oligopoly Pricing with Differentiated Products: The BostonFluid Milk Market,” Ph.D dissertation, University of Connecticut, 2001.

Appendix VII: Research Measuring the Impact
of Concentration and Market Power on the
Dairy Industry and Fluid Milk Sector
Page 110 GAO-01-561 Milk Prices and Changing Market Structure
vertical supply arrangements with Ahold USA, which has as itssubsidiaries the retail grocery outlets of Stop & Shop, Giant Foods, Bi-Lo,and Tops Markets.
Last, developing a model of market power for fluid milk is difficultbecause of a lack of data at the wholesale level in most dairy markets.Actual wholesale price data from dairy processors are proprietary and arenot obtainable in the public domain. Without a good series of data at thislevel, it is difficult for researchers to accurately measure the extent ofpower that buyers and sellers can exert on the market.
Economic studies that model issues of market power in agricultural andother industries have evolved in recent years. First, there were thestructure-conduct-performance (SCP) studies,8 which assumed thatmarket power was a function of several structural variables such asmarket concentration, product differentiation, or entry barriers. In thesestudies, markets were assumed to display a certain behavior or “conduct”(collusion or strategic behavior) from their structure, leading to a certainperformance variable, such as profitability or efficiency. One weakness ofthese types of models, however, is that concentration ratios (a structuralvariable that is often used to explain conduct) are actually endogenousvariables. Over the last two decades, the New Empirical IndustrialOrganization (NEIO) approach to measuring market power becamepopular. The NEIO studies base their inferences of market power oneconometric models that measure firm conduct. One of the main strengthsof this approach is that it is grounded in microeconomic theory. Morerecently, researchers have developed models estimating market powerbased on cointegration techniques,9 as well as experimental economicdesigns.
We identified several academic studies that measure market power in thedairy industry or fluid milk market, representing a wide variety of differenttypes of economic models. These studies differ according to geographic
8 In its simplest, linear version, the structure, conduct, performance paradigm consists ofthe following linear framework: market structure determines the behavior of firms in amarket and the behavior of firms in a market determines various aspects of marketperformance. However, this paradigm has been found to also have many interactive as wellas feedback effects.
9 Studies of cointegration are concerned with methods of econometric estimation thatpreserve the information about forms of covariation between series.
Review of RecentStudies Measuring theEffect of MarketPower in the FluidMilk Market
Appendix VII: Research Measuring the Impact
of Concentration and Market Power on the
Dairy Industry and Fluid Milk Sector
Page 111 GAO-01-561 Milk Prices and Changing Market Structure
scope, stage of the marketing chain, and different time period. Moreover,except for the Dhar dissertation, most of these studies did not take intoaccount the effects of market concentration at successive levels of themilk marketing chain. When taken together, we found that these studieshad mixed results when estimating the effects of market power on sellerand/or buyer price in the dairy industry and/or fluid milk market.
Suzuki et al., (1994)10 developed an imperfect competition model of theU.S. dairy market for the purposes of analyzing dairy policy deregulation.In order to do this, they use the theory that Bresnahan11 developed to solvefor a parameter that they consider an aggregate indicator of the degree ofcompetition in this market. While the authors do not explicitly break outthe oligopsonistic power of processors, they assume that their indicatorreflects the combined effects of both cooperatives’ as well as processors’market power. In their model, the market power parameter equals oneunder monopoly or collusion, and zero under perfect competition orprice-taking behavior. To empirically estimate the model, the authorsspecify equations for raw milk production and demand for fluid milk andmanufactured dairy products. They then solve for the market powerparameter using estimated prices, quantities, and demand elasticities forfluid milk and manufactured dairy products. The authors also test thevalidity of their imperfectly competitive model for the analysis of milkmarket deregulation by using a dynamic simulation approach for theperiod 1980 to 1990.
The authors found that their derived annual average estimates of thedegree-of-competition parameter implied neither perfect competition norpure monopoly, but implied a certain degree of market imperfection thathad been steadily declining from 1977 to 1990. They explained this degreeof imperfect competition as the consequences of a shift in the balance ofpower caused by the unification of dairy cooperatives, consolidation ofmanufacturing firms, and the consolidation of the federal milk marketingorders. Moreover, the authors did not find significant differences betweenthe results of their imperfectly competitive model and the conventional
10 Nobuhiro Suzuki, Harry M. Kaiser, John E. Lenz, and Olan K. Forker, “An Analysis of U.S.Dairy Policy Deregulation using an Imperfect Competition Model,” Agricultural and
Resource Economics Review, 23 (1994): 84-93.
11 T.B. Bresnahan, “The Oligopoly Solution Concept is Identified,” Economic Letters 10(1982): 87-92.
Suzuki et al., (1994)—Imperfect CompetitionModel of the U.S. MilkMarket
Appendix VII: Research Measuring the Impact
of Concentration and Market Power on the
Dairy Industry and Fluid Milk Sector
Page 112 GAO-01-561 Milk Prices and Changing Market Structure
model assuming perfect competition, assuming the fluid price differentialwas exogenous, in estimating the effects of milk market deregulation.
The Madhavan study (1994)12 examined empirically the price-settingbehavior of the Associated Milk Producers, Inc. (AMPI), a largecooperative with more than 30,000 members in the 1970s. The cooperativeconsolidated power in the 1960s through numerous mergers and wasinvolved in a Department of Justice antitrust suit in which it was chargedwith “predatory and exclusionary” practices. The mergers, which wereprotected under the Capper-Volstead Act,13 were not challenged. However,AMPI did lose that part of the antitrust suit charging it with conspiracy tomonopolize. The authors developed a model of spatial limit pricing to testfor market power in 14 AMPI markets during the period from 1972 to 1980(the AMPI Southern regional markets). They tested the model using themethod of Seemingly Unrelated Regressions,14 adjusting for serialcorrelation.
The authors of the study found that AMPI successfully obtained and usedseller market power, and that its market power was proportional to itsmarket share. During this period, price-cost margins averaged about33 cents. However, after the antitrust decree, margins fell significantly toabout 4 cents and were no longer related to market share. These resultswere robust to several specifications of the model as well as underdifferent industry trends.
12 Ananth Madhavan, Robert T. Masson, and William H. Lesser, “Cooperation forMonopolization? An Empirical Analysis of Cartelization,” The Review of Economics and
Statistics 76 (1994): 161-75.
13 The Capper-Volstead Act grants agricultural cooperatives an antitrust exemption.
14 The method of seemingly unrelated regression technique provides a gain in efficiency byusing information on the explanatory variables that are included in the system of equationsbut are excluded from the ith equation.
Madhavan et al., (1994)—AStudy of Market Power bya Cooperative

Appendix VII: Research Measuring the Impact
of Concentration and Market Power on the
Dairy Industry and Fluid Milk Sector
Page 113 GAO-01-561 Milk Prices and Changing Market Structure
The Liu et al., study (1995)15 uses the NEIO approach to estimate thedegree of seller market power exercised by U.S. fluid and manufactureddairy processors. This approach, based on the seminal article byApplebaum (1982),16 estimates (rather than assumes) econometrically aconduct parameter called a “conjectural variation”--an index of the degreeof market power. This conduct parameter can range between zero andone, with zero representing perfect competition and a value of oneimplying the monopoly, or perfect cartel, solution. The Liu study alsoincorporates government price supports on manufactured milk products.Under this type of model, it is assumed that milk processing at thewholesale level follows a fixed proportions technology between farm milkand other inputs. The model uses quarterly data from 1976 to 1992 onUSDA’s Dairy Situation and Outlook series for wholesale supply anddemand quantities; Class I and II federal marketing order minimum pricesand price differentials; and input wage and energy price indices from theDepartment of Labor. Liu proceeds by using a two-stage, nonlinear leastsquares estimation method with instrumental variables.17
The average industry conduct parameters of this study show that theprocessing markets for fluid milk and manufactured dairy products weresomewhat noncompetitive. Over this time period, Liu’s analysis showedthat the conduct parameters were statistically significant and averaged0.176 for fluid milk processors and 0.100 for manufactured productprocessors, both estimates closer to the perfectly competitive result (zero)than the monopolistic result (one). The authors explained these results bysaying that fluid milk processors behave in a less competitive manner thanmanufactured product processors because markets for fluid milk are lessnational in scope than markets for manufactured dairy products. Theauthors also noted that both parameters did not seem to increase overtime and that this was reassuring because the industry had become moreconcentrated over the sample period from 1976 to 1992.
15 Donald J. Liu, Shin-Hwa Sun, and Harry Kaiser, “Market Conduct under GovernmentPrice Intervention in the U.S. Dairy Industry,” Journal of Agricultural and Resource
Economics 20 (2) (1995): 301-15.
16 E. Appelbaum, “The Estimation of the Degree of Oligopoly Power,” Journal of
Econometrics 19 (1982): 287-99.
17 The instrumental variable technique is a general estimation procedure applicable tosituations in which the independent variable is not independent of the disturbance term.The two-stage least square technique is a special case of the instrumental variabletechnique in which the “best” instrumental variables are used in the regression.
Liu et al., (1995)—A Studyof Seller Market Power inFluid and ManufacturedMilk Markets

Appendix VII: Research Measuring the Impact
of Concentration and Market Power on the
Dairy Industry and Fluid Milk Sector
Page 114 GAO-01-561 Milk Prices and Changing Market Structure
A study by Lopez, Azzam, and Liron-Espana (2000)18 addresses theunresolved issue of the tradeoff between market power and cost efficiencyin U.S. food industries, including the fluid milk processing industry. Theimportance of this study stems from one of the main questions in antitrustcases—whether the increased cost efficiency from greater concentrationoutweighs the effects of increased prices due to greater market power. Toaddress this question, the study provides estimates of oligopoly power andeconomies of size for 32 food processing industries using the 4-digitStandard Industrial Classification (SIC) of the U.S. Department ofCommerce. The authors develop a NEIO empirical model that separatesthe impacts of concentration on oligopoly power and cost-efficiency, and,hence, on output prices as well as input use. In addition to measuringconjectural variation elasticities (a measure of collusive market conductwhich implies market power), this paper also measures the amount thatprice is above the marginal cost (the oligopoly Lerner index)—a somewhatmore direct measure of market power. In the specification of thetheoretical model, the authors identify an expression that separates thechange in output price of an industry with respect to a change in the levelof concentration as measured by the Herfindahl-Hirschman index.19 Thisexpression is divided into (1) a term that measures the oligopoly-powereffect (consisting of one plus a weighted industry conjectural elasticityterm divided by the industry demand elasticity) and (2) a cost-efficiencyterm that includes input prices and output quantity.
The econometric model adapts the oligopsony model of Azzam (1997) tothe oligopoly power case. Specifically, the model consists of fiveequations: the pricing equation, three input demand equations, and anoutput demand equation. The model was estimated with a system of fiveequations with non-linear 3-stage least squares regression analysis.20
Principal data sources for the study included the National Bureau of
18 Rigoberto A. Lopez, Azzedine M. Azzam, and Carmen Liron-Espana, “Oligopoly Powerand Cost Effects of Industrial Concentration in U.S. Food Processing,” Working Paper,Storrs Agricultural Experiment Station, University of Connecticut, Storrs, Connecticut,October, 2000.
19 The Herfindahl-Hirschman index is a measure of firm concentration that describes thesize-distribution, or the relative importance of both large and small firms in an industry. Itis defined as the sum of the squares of the market shares of the firms in an industry.
20 The three-stage least squares regression estimation technique is the systems counterpartto two-stage least squares (as defined in footnote 17 above). This estimator is statisticallyconsistent and asymptotically more efficient than the two-stage least squares estimator.
Lopez et al., (2000)—AStudy of the Trade OffBetween Oligopoly Powerand Cost Effects ofIndustrial Concentration inFood Processing

Appendix VII: Research Measuring the Impact
of Concentration and Market Power on the
Dairy Industry and Fluid Milk Sector
Page 115 GAO-01-561 Milk Prices and Changing Market Structure
Economic Research (NBER) of Bartelsman, Becker, and Gray (2000)21
database for index prices of inputs and panel data. As mentioned above,data are used at the 4-digit SIC level.
An overall result of this study contradicts the results of other analyses,which showed that increases in technical efficiencies offset any losses toconsumers from increased concentration. In particular, in the fluid milkindustry (SIC 2026), these results show that a very strong tradeoff existsbetween cost efficiency and increased oligopoly power. In other words,while the results show significant gains in cost efficiency, there are alsosignificant and positive effects on output price in the fluid milk industrydue to market power. Moreover, at the wholesale level for fluid milk, whilethere are cost efficiencies, they may not be passed on because of theoligopoly-power effects.
The USDA study (2000)22 examines market power at the national level forseven food categories: beef, pork, poultry, eggs, dairy, fresh fruit, and freshvegetables. The authors use a cointegrated23 model of quasi-reduced formretail and farm price equations, a general market-clearing condition forfinal industry output, and a general market-clearing condition for farminputs. The critical feature of the model is that within the same industry,one firm’s production function may be different from other firms’production functions.24 Therefore, the authors argue that, unlike the NEIOmarket power models, this model does not depend upon the restriction ofidentical firms or fixed production technologies across firms. The modelsuggests that one can test for oligopsony and oligopoly power based onthe acceptance or rejection of the testable restriction of symmetry, asimplied by the theory of profit functions under perfect competition. Allretail prices in the model were constructed from annual averageConsumer Price Index data, U.S. city averages from 1958 to 1997. Farm
21 E.J. Bartelsmen, R.A. Becher, and W.B. Gray. The NBER-CES Manufacturing Industry
Database, (http://www.nber.org/productivity.html), June 2000.
22 A.J. Reed and J.S. Clark, U.S. Department of Agriculture. Structural Change and
Competition in Seven U.S. Food Markets. Food and Rural Economics Division, EconomicResearch Service, Technical Bulletin Number 1881, February 2000.
23 A cointegrated model links trends across variables, and in this case, provides a market-clearing representation.
24 A production function describes the technical relationship that transforms inputs(resources) into ouputs (commodities). For each level of input used, the function assigns aunique level of output.
U.S. Department ofAgriculture, EconomicResearch Service (2000)—Study of Structural Changeand Competition in SevenU.S. Food Markets

Appendix VII: Research Measuring the Impact
of Concentration and Market Power on the
Dairy Industry and Fluid Milk Sector
Page 116 GAO-01-561 Milk Prices and Changing Market Structure
level prices were constructed from non-seasonally adjusted annualProducer Price Index data for farm products.
Using this model, the authors find competitive markets on the buyer sideas well as the seller side for all seven food markets, including the dairymarket. They explain this result by suggesting that trends in concentrationin agricultural markets may be efficient solutions to unpredictable trendsin consumer demand for food.
The Doyon Model (2001)25 uses a totally different approach than the usualeconometric methods for analyzing the effects of market power; in thiscase oligopsony or buyer market power, in the fluid milk industry.Laboratory market experiments are used to find evidence of deviationsfrom the competitive equilibrium in the U.S. market for raw milk. Alaboratory experiment allows for the collection of data in a controlledenvironment, such that the use of exogenous and subjective data inmodels is avoided. The experimental task was a 2 x 2-matrix laboratorygame,26 with the treatments being oligopsony and regulation. Theexperiment allows for variation in the number of buyers (oligopsony) andthe presence or absence of regulation.
The results of the study indicated that when oligopsony is introduced, inthe absence of regulation, buyers gain market power. The increase inmarket power is measured by a reduction in market price and quantitypurchased relative to the competitive equilibrium. However, when priceregulation is present, a reduction in the number of buyers has nostatistically significant effect. From this evidence, the author draws theconclusion that regulation successfully neutralizes the oligopsony effectsrelative to the competitive equilibrium.
25 Maurice A. Doyon, “The Effect of the Elimination of Federal Milk Marketing Orders onFarm Level Markets: A Laboratory Experiment,” Department of Agri-Food and ConsumerScience, Universite Laval, Quebec, Canada (2001).
26 In game theory, a 2 x 2 game represents two players with two possible actions in theiraction sets.
Doyon Model (2001)—Experimental SimulationModel of Buyer MarketPower of Fluid Milk

Appendix VII: Research Measuring the Impact
of Concentration and Market Power on the
Dairy Industry and Fluid Milk Sector
Page 117 GAO-01-561 Milk Prices and Changing Market Structure
A doctoral dissertation by Dhar (2001)27 is one of the first attempts toapply to the U.S. fluid milk market a model of market power that considerssuccessive rather than single stage oligopoly. Specifically, this analysislooks at the Boston fluid milk processor and retailer market channels inorder to capture the horizontal and vertical channel relationships. Also,the author addresses the issue of modeling product differentiation at thefluid milk brand level within this oligopolistic framework. Throughout theanalysis, the author uses this framework to examine the impact of theNortheast Dairy Compact (NEDC) on the Boston fluid milk market.
The dissertation consists of three separate, but related types of analysis.First, using the Panel Vector Auto Regression technique,28 the authoranalyzes the dynamic nature of retail competition on fluid milk in theBoston and the New York markets. The author found that the retail priceresponse is short in these markets—in most cases not more than two timeperiods. In addition, it was found that, during this time period, there was amuch stronger “reacting” oligopolistic market structure in the Bostonmarket.
Second, the author develops a comparative static, cost pass-through modelunder different market structure and conduct scenarios. This modelconsists of a two-stage vertical market system where there are twoprocessors at the first stage and two retailers at the second stage. Withinthis vertical structure, the author assumes three different conduct orgame-theoretic assumptions: (1) a complete vertical coordination game,(2) a vertical Nash model,29 where retailers and processors both maximizeprofit by setting prices simultaneously, and (3) a vertical Stackelberggame,30 where the retailer moves first and decides on price and the
27 Tirtha P. Dhar, ”Two-Stage Oligopoly Pricing with Differentiated Products: The BostonFluid Milk Market,” Ph.D dissertation, University of Connecticut, 2001.
28 Vector Autoregression models are systems of linear regressions that have the advantageto better consider the interactions between variables as well as model a more completedynamic scenario. Panel vector autoregression models are VAR models which use paneldata.
29 A Nash equilibrium is a situation in which economic actors interacting with one anothereach choose their best strategy given the strategies that all the other actors have chosen. ABertrand equilibrium, which this model is implying, is simply a Nash equilibrium in pricesrather than quantities.
30 A Stackelberg game implies a move sequence, in which players select strategies in agiven order. Each player’s strategy is a best response to the fixed strategies of the playerspreceding him.
Dhar Dissertation(2001)–DifferentiatedProducts OligopolyModel of the BostonFluid Milk Market

Appendix VII: Research Measuring the Impact
of Concentration and Market Power on the
Dairy Industry and Fluid Milk Sector
Page 118 GAO-01-561 Milk Prices and Changing Market Structure
processor maximizes profit by taking into account the reaction of theretailer. Having defined these assumptions, the author then lays out thebasic equations underlying the theoretical model and the costpass-through derivations. To estimate this model, the author then specifiesa simple linear demand system, a cost function, and first order conditionsbased on the profit functions for the processing and retailing sectors. Aprivate data collection company’s scanner data for monthly average fluidmilk prices, the Boston Class I fluid milk price, price reduction activities,and package sizes for four retail chains are used in the estimation for theperiod 1996 through 1998. In addition, a binary variable was incorporatedto account for the implementation of the Northeast Dairy Compact. Theresults of this part of the dissertation suggest that the total pass-through ofa 1-percent raw milk price increase is almost 100 percent, while rates ofpass-through at the wholesale and retail level are approximately50 percent. For the total channel, the rate is near 25 percent, which is theretail monopoly level.
The third part of the dissertation is the most comprehensive part of thestudy. It incorporated recent developments in characteristics-basedNested Logit31 demand systems as well as a flexible Generalized Leontiefcost function.32 In addition, this part of the study uses modeling techniquesto account for product differentiation at the brand level. Data for this partof the study are also more comprehensive, providing marketing and retailprice related information for the aggregate and top four supermarketchains in the Boston market from February 1996 to July 2000. The resultsfrom this portion of the dissertation suggest that retailers do have marketpower and that brand differentiation is the result of interaction betweenretailers and processors. Both the second and third part of the dissertationfound a significant price enhancing effect of the Northeast Dairy Compact.
31 A logit regression model is a type of qualitative dependent variable model in which thedependent variable is from a finite set of discrete alternatives, such as a (0,1) dummyvariable. The logit model is one type of qualitative dependent variable model that followsthe logistic probability function.
32 A generalized Leontief cost function is one type of a flexible functional form of a dualcost function. These types of cost functions are “flexible” because they place littlerestrictions on the value of the function or its first or second derivatives. In general, lessrestrictive and more flexible forms are desirable, but require more information to specifysuch forms.

Appendix VII: Research Measuring the Impact
of Concentration and Market Power on the
Dairy Industry and Fluid Milk Sector
Page 119 GAO-01-561 Milk Prices and Changing Market Structure
According to the author, due to focal point pricing,33 competition betweenchannel players was lessened due to the Compact.
33 Focal point pricing or focal point signaling involves the use of publicly disclosed priceand cost information (here such as a federal milk marketing order price or a Compactprice) as a mechanism for tacit collusion in an oligopolistic market.

Appendix VIII: GAO Contacts and Staff
Acknowledgments
Page 120 GAO-01-561 Milk Prices and Changing Market Structure
Lawrence J. Dyckman, (202) 512-3841Anu Mittal, (202) 512-9846
In addition to those named above, Jay Cherlow, James Dishmon, BarbaraEl Osta, Rebecca Johnson, and Jay Scott made key contributions to thisreport.
Appendix VIII: GAO Contacts and StaffAcknowledgments
GAO Contacts
StaffAcknowledgments
(150191)

The first copy of each GAO report is free. Additional copies of reports are$2 each. A check or money order should be made out to theSuperintendent of Documents. VISA and MasterCard credit cards are alsoaccepted.
Orders for 100 or more copies to be mailed to a single address arediscounted 25 percent.
Orders by mail:
U.S. General Accounting OfficeP.O. Box 37050Washington, DC 20013
Orders by visiting:
Room 1100700 4th St., NW (corner of 4th and G Sts. NW)Washington, DC 20013
Orders by phone:
(202) 512-6000fax: (202) 512-6061TDD (202) 512-2537
Each day, GAO issues a list of newly available reports and testimony. Toreceive facsimile copies of the daily list or any list from the past 30 days,please call (202) 512-6000 using a touchtone phone. A recorded menu willprovide information on how to obtain these lists.
Orders by Internet
For information on how to access GAO reports on the Internet, send ane-mail message with “info” in the body to:
or visit GAO’s World Wide Web home page at:
http://www.gao.gov
Contact one:
• Web site: http://www.gao.gov/fraudnet/fraudnet.htm• E-mail: [email protected]• 1-800-424-5454 (automated answering system)
Ordering Information
To Report Fraud,Waste, and Abuse inFederal Programs