gamma ray spectrometric methods in uranium …...gamma ray spectrometric methods in uranium...
TRANSCRIPT
lOB. GAMMA RAY SPECTROMETRIC METHODS IN URANIUM EXPLORATION THEORY AND OPERATIONAL PROCEDURES
R.L. GrastyGeological Survey of Canada, Ottawa
Grasty, R.L., Gamma ray spectrometric methods in uranium exploration - theory and operationalprocedures; in Geophysics and Geochemistry in the Search for Metallic Ores; Peter J. Hood, editor;Geological Survey of Canada, Economic Geology Report 31, p. 147-161, 1979.
Abstract
Many of the instrumental and operational problems in airborne gamma ray surveys have beensolved and reliable data can now be provided. Multi-channel recording is an integral part of manysurvey operations and can be used to minimize energy calibration problems due to spectral drift andcan also be used to increase sensitivity for uranium. 1n areas where suitable lakes cannot be found,upward looking crystals have proven essential for monitoring variations of atmospheric backgroundfrom decay products of radon. To correct for variations of cosmic radiation due to changes intopographic relief, an energy window above that of the natural gamma ray emissions from the groundis often used.
Construction of concrete calibration pads and the utilization of calibration strips has greatlyfacilitated the standardization of airborne data from different detector configurations. The energyand angular distribution of the natural gamma-radiation field over uniformly radioactive ground cannow be calculated reliably. By incorporating the detector response, the sensitivity of a particularsystem to each of the radioelements can be evaluated.
Resume
De nombreux probl~mes relies aux instruments et aux travaux de leves aeriens a rayons gammaontete resolus; il est maintenant possible d'en obtenir des donnees sures. L'enregistrement multicanalfait partie integrante de nombreux travaux de leves et peut servir a reduire au minimum les probl~mes
d'etalonnage energetique dus a la derive spectrale; il peut aussi etre utilise pour accroftre la sensibilitea l'uranium. Dans des regions ou il n'est pas possible de trouver des lacs convenables, des cristauxd'orientation ascendante se sont averes essentiels pour Ie controle des variations de la zone de fondatmospherique a partir de la famille radioactive du radon. On utilise souvent, pour corriger lesvariations de radiation cosmique dues aux changements du relief topographique, une fenetreenergetique au-dessus de celIe des emissions naturelles de rayons gamma provenant du sol.
La construction de blocs d'etalonnage en beton et l'utilisation de bandes d'etallonnage ontgrandement facilite la normalisation des donnees aeriennes a partir des diversesconfigurationsdecelees par Ie detecteur. L'energie et la distribution angulaire du champ naturel de rayonnementgamma au-dessus d'un terrain radioactif uniforme peuvent maintenant etre calculees avec justesse. Enjoignant les donnees du detecteur, on peut evaluer la sensibilite d'un systeme a chacun desradioelements.
THE NATURAL GAMMA-RADIATION FIELD
Basic Considerations
While studying the phosphorescence of various materialsBecquerel discovered that an invisible radiation was emittedby several uranium salts that was capable of traversing thinlayers of opaque material and fogging a photographic plate(Becquerel, 1896a, b). Soon afterwards Schmidt (1898) andCurie (1898) independently observed that a similar radiationwas emitted by compounds of thorium. Through the work ofVillard (1900), Rutherford (1903), and Strutt (1903) it wasshown that three characteristic types of radiation wereemitted, alpha, beta, and gamma radiation. Potassium wasfound by Campbell and Wood to emit beta radiation in 1906although it was not until 1927 that it was observed byKolhorster to emit gamma radiation (Campbell and Wood,1906; Campbell, 1907; Kolhorster, 1928).
Alpha rays or alpha particles are doubly positi velycharged helium nuclei and are absorbed by a few centimetresof air. Beta particles are electrons carrying unit negativecharge, are more penetrating and can travel up to a metre orso. Gamma radiation, an electromagnetic radiation similar innature to X-rays is strongly penetrating and was found frommeasurements by Wulf (1910) on the Eiffel Tower to becapable of ionizing air at heights of 300 m.
The absorption of gamma radiation takes place in threedistinct ways, by the photoelectric effect, by scattering, andby pair production.
In the photoelectric effect the energy of the gamma rayis completely absorbed through the emission of an electron.The scattering process known as the Compton effect takesplace when a gamma ray photon collides with an electron,imparts part of its energy to the electron, and is scattered atan angle to the original direction of the incident photon. Thisprocess predominates for moderate gamma ray energies in awide range of materials. The third process, pair productioncan only take place if the incident photon has an energygreater than 1.02 MeV, since 1.02 MeV is necessary for thecreation of an electron-positron pair. This interactionpredominates at high energies particularly in materials ofhigh atomic number. Because most materials (rocks, air andwater) encountered in airborne radioactivity measurementshave a low atomic number and because most natural gammarays have moderate to low energies (Jess than 2.62 MeV)Compton scattering is the predominant absorption processoccurring between the source of the radioacti vi ty and thedetector.
148 R.L. Grasty
If a collimated beam of radiation of intensity I isincident upon an absorbing layer of thickness dx, the amountof radiation absorbed dI is proportional both to dx and to I sothat:
dl = - jJ Idx
The proportional factor jJ is a characteristic propertyof the medium known as the linear attenuation coefficientand is a function of the gamma ray energy. If the intensity Ihas the value 1
0when no absorbing material is present then it
follows that
I = I e-jJxo
divided by the density of the material. At aircraft altitudesof 100 m or more the intensity of gamma rays below0.10 MeV emitted by rocks and soils in the ground will beconsiderably reduced and dominated by Compton-scatteredhigh-energy gamma radiation. It is apparent that themeasurement of natural radioactivity must be carried outwi thin a few hundred metres of the ground and only gammarays originating from a few tens of centimetres below thesurface of the ground can be detected.
All rocks and soils are radioactive and emit gammaradiation. The three major sources are:
1. Potassium-40, which is 0.12 per cent of the totalpotassium and emits gamma ray photons of energy1.46 MeV.
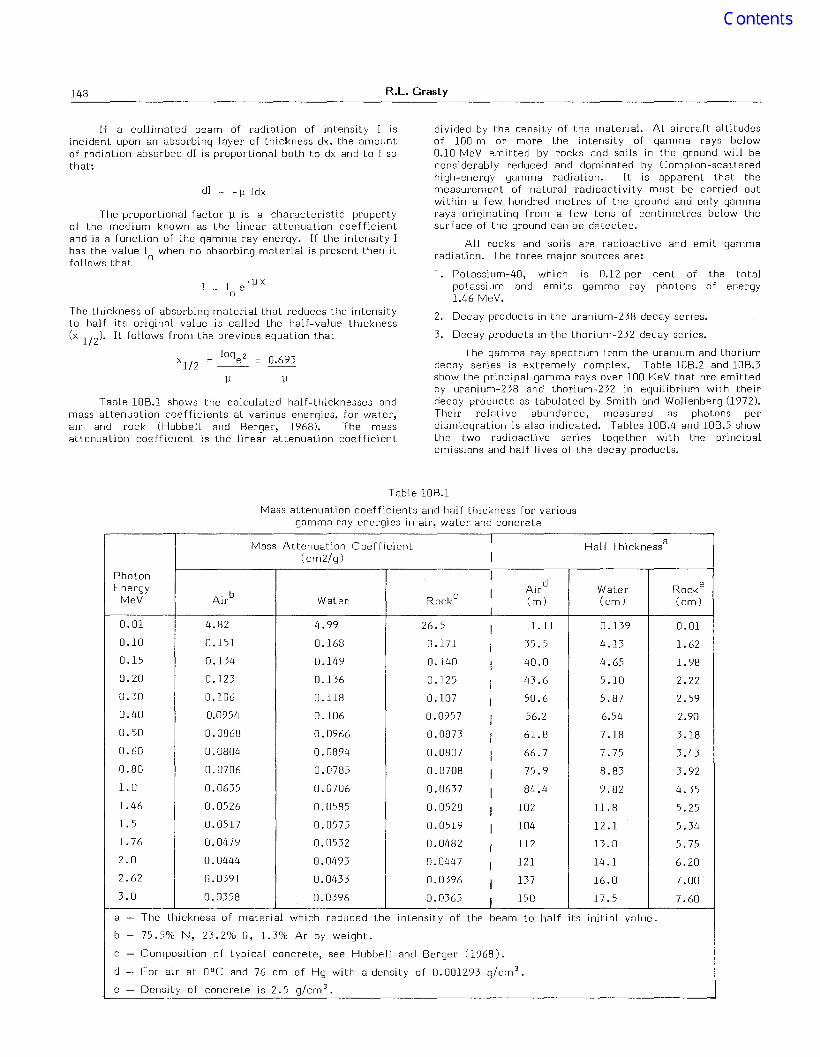
Table 10B.l shows the calculated half-thicknesses andmass attenuation coefficients at various energies, for water,air and rock (Hubbell and Berger, 1968). The massattenuation coefficient is the linear attenuation coefficient
The thickness of absorbing material that reduces the intensityto half its original value is called the half-value thickness(x 1/2)' It follows from the previous equation that
xl
/2
= loge 2 0.693
jJ jJ
2. Decay products in the uranium-238 decay series.
3. Decay products in the thorium-232 decay series.
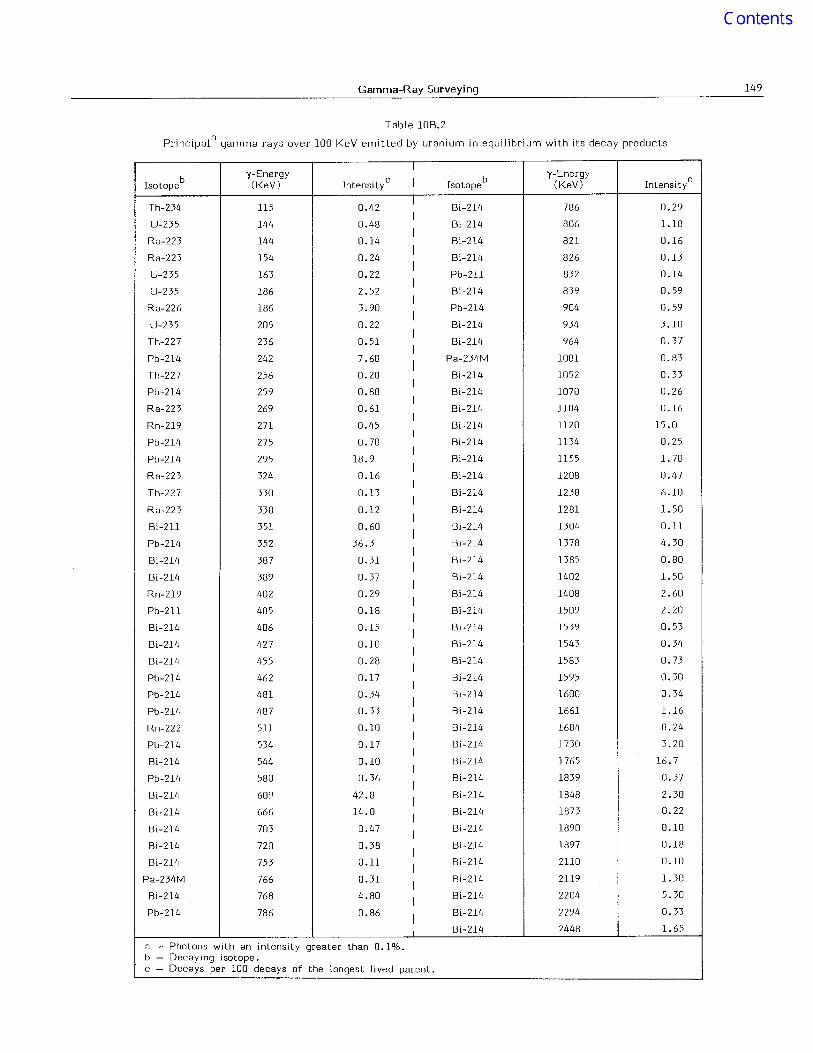
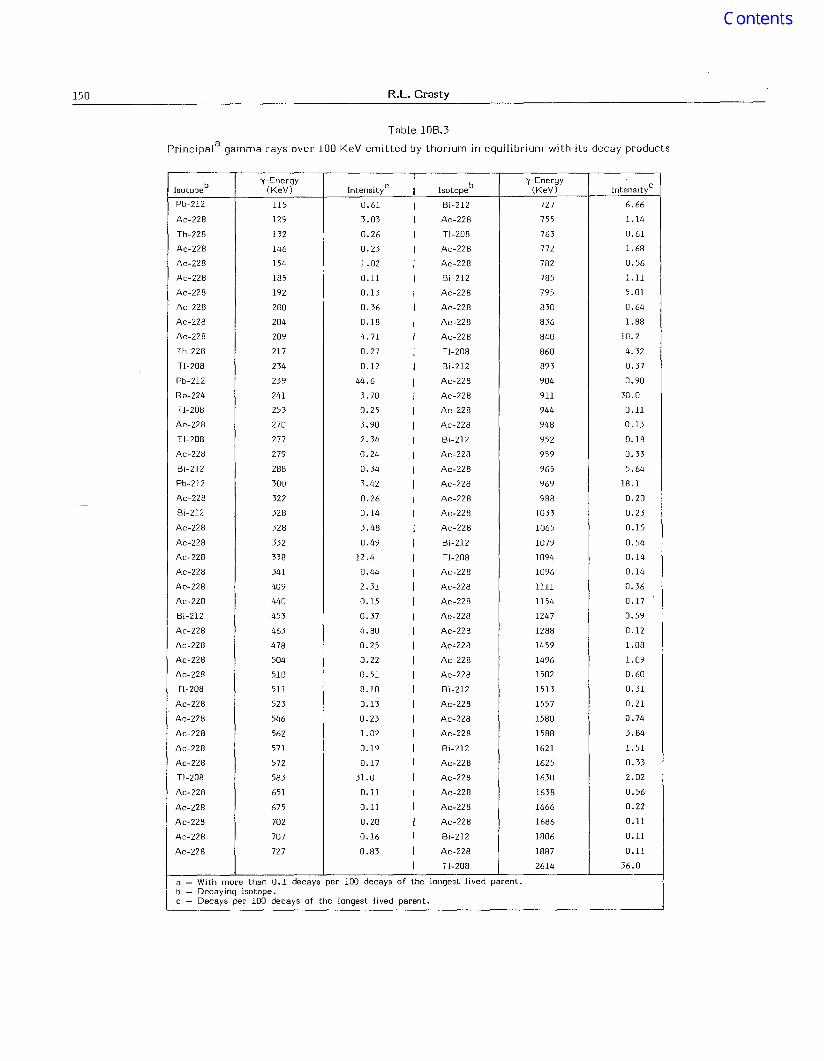
The gamma ray spectrum from the uranium and thoriumdecay series is extremely complex. Table 10B.2 and 10B.3show the principal gamma rays over 100 KeV that are emittedby uranium-238 and thorium-232 in equilibrium with theirdecay products as tabulated by Smith and Wollenberg (1972).Their relati ve abundance, measured as photons perdisintegration is also indicated. Tables 10B.4 and 10B.5 showthe two radioacti ve series together with the principalemissions and half lives of the decay products.
Table 10B.l
Mass attenuation coefficients and half thickness for variousgamma ray energies in air, water and concrete
PhotonEnergy
MeV
0.01
0.10
0.15
0.20
0.30
0.40
0.50
0.60
0.80
1.0
1.46
1.5
1. 76
2.0
2.62
3.0
4.82
0.151
0.134
0.123
0.106
0.0954
0.0868
0.0804
0.0706
0.0635
0.0526
0.0517
0.0479
0.0444
0.0391
0.0358
Mass Attenuation Coefficient(cm2/g)
Water
4.99
0.168
0.149
0.136
0.118
0.106
0.0966
0.0894
0.0785
0.0706
0.0585
0.0575
0.0532
0.0493
0.0433
0.0396
26.5
0.171
0.140
0.125
0.107
0.0957
0.0873
0.0807
0.0708
0.0637
0.0528
0.0519
0.0482
0.0447
0.0396
0.0365
T
I
III
I
I
II
I
IIIIII
III
II
A. dIr
(m)
1.11
35.5
40.0
43.6
50.6
56.2
61. 8
66.7
75.9
84.4
102
104
112
121
137
150
Half Thicknessa
Water(em)
0.139
4.13
4.65
5.10
5.87
6.54
7.18
7.75
8.83
9.82
11.8
12.1
13.0
14.1
16.0
17 .5
Rocke(cm)
0.01
1.62
1. 98
2.22
2.59
2.90
3.18
3.43
3.92
4.35
5.25
5.34
5.75
6.20
7.00
7.60
a - The thickness of material which reduced the intensity of the beam to half its initial value.
b - 75.5% N, 23.2% 0, 1.3% Ar by weight.
c - Composition of typical concrete, see Hubbell and Berger (1968).
d - For air at DoC and 76 cm of Hg with a density of 0.001293 g/cm 3•
e - Density of concrete is 2.5 g/cm 3•
Gamma-Ray Surveying
Table 10B.2
Principala gamma rays over 100 KeV emitted by uranium in equilibrium with its decay products
y-EnergyI
y-EnergyIsotope
b (KeV) IntensityC I Isotopeb (KeV) Intensit/
Th-234 115 0.42I
Bi-Zl4 786 0.29
U-235I
144 0.48 Bi-214 806 1.10
Ra-223I
144 0.14 Bi-Zl4 821 0.16
Ra-223 154 0.24I
Bi-Zl4 826 0.13
U-235I
Pb-211163 0.22 832 0.14
U-235I
186 2.52 Bi-214 839 0.59
Ra-226I
186 3.90 Pb-Zl4 904 0.59I
U-235 205 0.22 Bi-Zl4 934 3.10
Th-227 236 0.51 Bi-214 964 0.37
Pb-214 242 7.60 Pa-234M 1001 0.83
Th-227 256 0.28 Bi-214 1052 0.33
Pb-Zl4 259 0.80 Bi-Zl4 1070 0.26
Ra-223 269 0.61 Bi-214 1104 0.16
Rn-219 271 0.45 Bi-Zl4 1120 15.0
Pb-Zl4 275 0.70 Bi-214 1134 0.25
Pb-Zl4 295 18.9 Bi-214 1155 1. 70
Ra-223 324 0.16 Bi-Zl4 1208 0.47
Th-227 330 0.13 Bi-214 1238 6.10
Ra-223 338 0.12 Bi-214 1281 1. 50
Bi-Zll 351 0.60 Bi-Zl4 1304 0.11
Pb-Zl4 352 36.3 Bi-214 1378 4.30
Bi-Zl4 387 0.31 Bi-Zl4 1385 0.80
Bi-Zl4 389 0.37 Bi-Zl4 1402 1. 50
Rn-Zl9 402 0.29 Bi-214 1408 2.60
Pb-211 405 0.18 Bi-Zl4 1509 2.20
Bi-Zl4 406 0.15I
Bi-Zl4 1539 0.53
Bi-Zl4 427 0.10 Bi-214 1543 0.34
Bi-214 455 0.28 Bi-214 1583 0.73
Pb-214 462 0.17 Bi-Zl4 1595 0.30
Pb-Zl4 481 0.34 Bi-214 1600 0.34
Pb-214 487 0.33 Bi-214 1661 1.16
Rn-222 511 0.10 Bi-Zl4 1684 0.24
Pb-Zl4 534 0.17 Bi-214 1730 3.20
Bi-214 544 0.10 Bi-Zl4 1765 16.7
Pb-214 580 0.36 Bi-214 1839 0.37
Bi-214 609 42.8 Bi-214 1848 2.30
Bi-214 666 14.0 Bi-214 1873 0.22
Bi-Zl4 703 0.47 Bi-214 1890 0.10
Bi-Zl4 720 0.38 Bi-214 1897 0.18
Bi-Zl4 753 0.11 Bi-214 2110 0.10
Pa-234M 766 0.31 Bi-214 2119 1. 30
Bi-214 768 4.80 Bi-214 2204 5.30
Pb-Zl4 786 0.86 Bi-214 2294 0.33
Bi-214 2448 1.65
a - Photons with an intensity greater than 0.1%.b - Decaying isotope.c - Decays per 100 decays of the longest lived parent.
149
150 R.L. Grasty
Table 108.3
Principala gamma rays over 100 KeV emiLted by thorium in equilibrium with its decay products
b y-Energy Ib
y-EnergyIsotope (KeV) IntensityC I Isotope (KeV) IntensityC
Pb-212 115 0.61 I BI-212 727 6.66
Ac-228 129 3.03 I Ac-228 755 1.14
Th-228 132 0.26 I Tl-208 763 0.61
Ac-228 146 0.23 I Ac-228 772 1.68
Ac-228 154 1.02 I Ac-228 782 0.56
Ac-228 185 0.11 I Bi-212 785 loll
Ac-228 192 0.13 I Ac-228 795 5.01
Ac-228 200 0.36 I Ac-228 830 0.64
Ac-228 204 0.18 I Ac-228 836 1.88
Ac-228 209 4.71 I Ac-228 840 10.2
Th-228 217 0.27 I Tl-208 860 4.32
Tl-208 234 0.12 I Bi-212 893 0.37
Pb-212 239 44.6 I Ac-228 904 0.90
Ra-224 241 3.70 I Ac-228 911 30.0
Tl-208 253 0.25 I Ac-228 944 0.11
Ac-228 270 3.90 I Ac-228 948 0.13
TI-208 277 2.34 I Bi-212 952 0.18
Ac-228 279 0.24 I Ac-228 959 0.33
Bi-212 288 0.34 I Ac-228 965 5.64
Pb-212 300 3.42 I Ac-228 969 18.1
Ac-228 322 0.26 I Ac-228 988 0.20
Bi-212 328 0.14 I Ac-228 1033 0.23
Ac-228 328 3.48 I Ac-228 1065 0.15
Ac-228 332 0.49 I Bi-212 1079 0.54
Ac-228 338 12.4 I Tl-208 1094 0.14
Ac-228 341 0.44 I Ac-228 1096 0.14
Ac-228 409 2.31 I Ac-228 1111 0.36
Ac-228 440 0.15 I Ac-228 1154 0.17
Bi-212 453 0.37 I Ac-228 1247 0.59
Ac-228 463 4.80 I Ac-228 1288 0.12
Ac-228 478 0.25 I AC 4 228 1459 1.08
Ac-228 504 0.22 I Ac-228 1496 1.09
Ac-228 510 0.51 I Ac-228 1502 0.60
Tl-208 511 8.10 I BI-212 1513 0.31
Ac-228 523 0.13 I Ac-228 1557 0.21
Ac-228 546 0.23 I Ac-228 1580 0.74
Ac-228 562 1.02 I Ac-228 1588 3.84
Ac-228 571 0.19 I Bi-212 1621 1.51
Ac-228 572 0.17 I Ac-228 1625 0.33
Tl-208 583 31.0 I Ac-228 1630 2.02
Ac-228 651 0.11 I Ac-228 1638 0.56
Ac-228 675 0.11 I Ac-228 1666 0.22
Ac-228 702 0.20 I Ac-228 1686 0.11
Ac-228 707 0.16 I BI-212 1806 0.11
Ac-228 727 0.83 I Ac-228 1887 0.11
I Tl-208 2614 36.0
a - With more than 0.1 decays per 100 decays of the longest lived parent.b - Decaying isotope.c - Decays per 100 decays of the longest Ii ved parent.
Gamma-Ray Surveying 151
where Q, no, ~, h, and A are the same parameters as inEquation (1).
Characteristics of Gamma Radiation
In order to monitor variations of the threeradioelements in the ground by airborne gamma rayspectrometry, it is necessary to understand the behaviour ofthe gamma radiation field. The first theoretical work on thevariation in intensity of the natural gamma radiation fieldwith elevation above the surface of the earth was carried outby Eve (1911). He evaluated the intensity of the gammaradiation, measured in terms of the number (n) of ionsproduced per second per cubic centimetre of air and showedthat
(2)
(1)
(3)
-Ahx_e__ dxx2
2n~Qno~~-Ah/ZdZo
n
where
Q is the mean radium content of the rocks
where
no is the number of ions produced per cubic centimetre persecond in air at normal temperature and pressure, onecentimetre from one curie of radium,
A is the linear attenuation coefficient of gamma rays in air,
~ is the linear attenuation coefficient of gamma rays in theground, and
z is sine, (n/2-e) being the angle sub tended at a detector adistance h above the surface by an elementary ring belowthe surface.
Gockel (1910) carried out the first airborne experimentsto measure the ionizing effect of the gamma radiation fromthe ground using an electroscope mounted in a balloon andfound an erratic variation with altitude, probably because offluctuations in the concentration of radon daughters in theatmosphere.
Hess (1911, 1912) was the first to obtain definite resultsusing a balloon and showed that while the ionizationdecreased slightly up to a distance of 1000 m, above 2000 mit began to increase and at 5000 m was two to three times thevalue found at ground level. These results can be explained ifthe radon daughter concentration decreases initially withaltitude and at the higher elevation the ionization ispredominated by cosmic radiation.
Substituting x = liz in Equation (1) we arrive at thecommonly used expression
No is the count rate with a gamma ray detector at groundlevel, and
N is the count rate at an altitude h.
The E2 function is known as the exponential integral ofthe second kind and in Russian literature is often referred toas the King function. King (1912) generalized Equation (2)and derived the variation of gamma ray intensity, N, withaltitude above a circular disc of thickness d subtending anangle 2~ at the point of measurement. N is given by
N = 2nQno E2(Ah) - E2(Ah+ ~ d)
~
cos~ [{E2(Ah "') - E2(Ah+ ~ d)}Jcos'¥ cos<l>
Table 10B.5
The Th-232 decay series
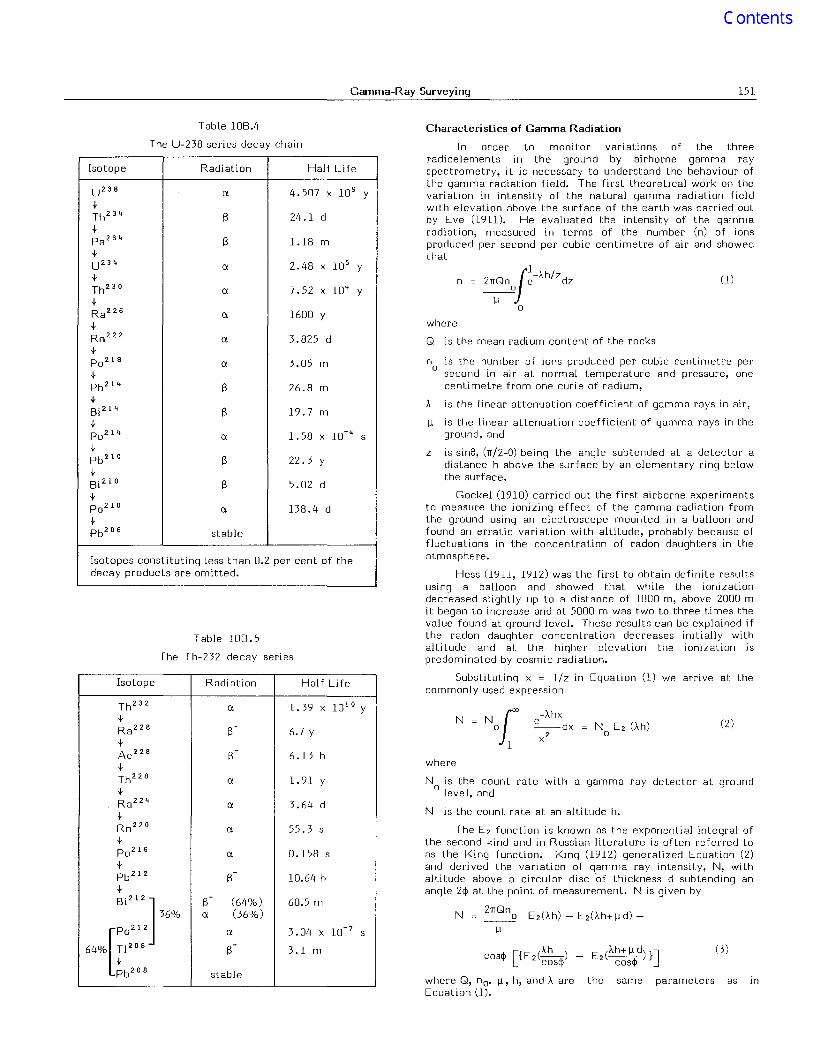
Table 10B.4
The U-238 series decay chain
Isotope Radiation Half Life
Th2 32 a 1. 39 x 10 10Y
+Ra 228 (3 -
6.7 Y+Ac 228 (3 - 6.13 h+Th 228 a 1. 91 Y+Ra 224 a 3.64 d+Rn 220 a 55.3 s+P0 216 a 0.158 s+Pb 212 (3 -
10.64 h+Bl'" ]
(3 - (64%) 60.5 m36% a (36%)
r"'"a 3.04 x 10- 7 s
64% Jl208 (3- 3.1 m
Pb 208 stable
Isotope Radiation Half Life
U 238 a 4.507 x 10 9Y
+Th 234 (3 24.1 d+Pa 234 (3 1.18 m+U 234 a 2.48 x 10⁵ Y+Th 230 a 7.52 x 10⁴ y+Ra 226 a 1600 y+Rn 222 a 3.825 d+P0 218 a 3.05 m+pb21l, (3 26.8 m+Bi 214 (3 19.7 m+P0 214 a 1.58 x 10⁻⁴ s+Pb 210 (3 22.3 y+Bi 210 (3 5.02 d+P0 210 a 138.4 d+Pb 206 stable
Isotopes constituting less than 0.2 per cent of thedecay products are omitted.
152 R.L. Grasty
Diameter of Circle (m)
Percentage of Potassiuma
Uraniuma
Thorium a
Infini te Source (]J = 0.00680/m) (]J = 0.00619/m) (]J = 0.00506/m)
10 74.5 76.2 79.6
20 1l0.9 113.3 100.0
30 143.4 146.8 154.1
40 176.1 180.6 190.1
50 211.5 217.2 229.5
60 252.2 259.5 275.5
70 302.7 312.3 333.5
80 372.7 385.8 415.2
90 493.3 513.4 559.5
~ -- Linear attenuation coefficient taken from Table 1 for air atDoC and 76 cm Hg.
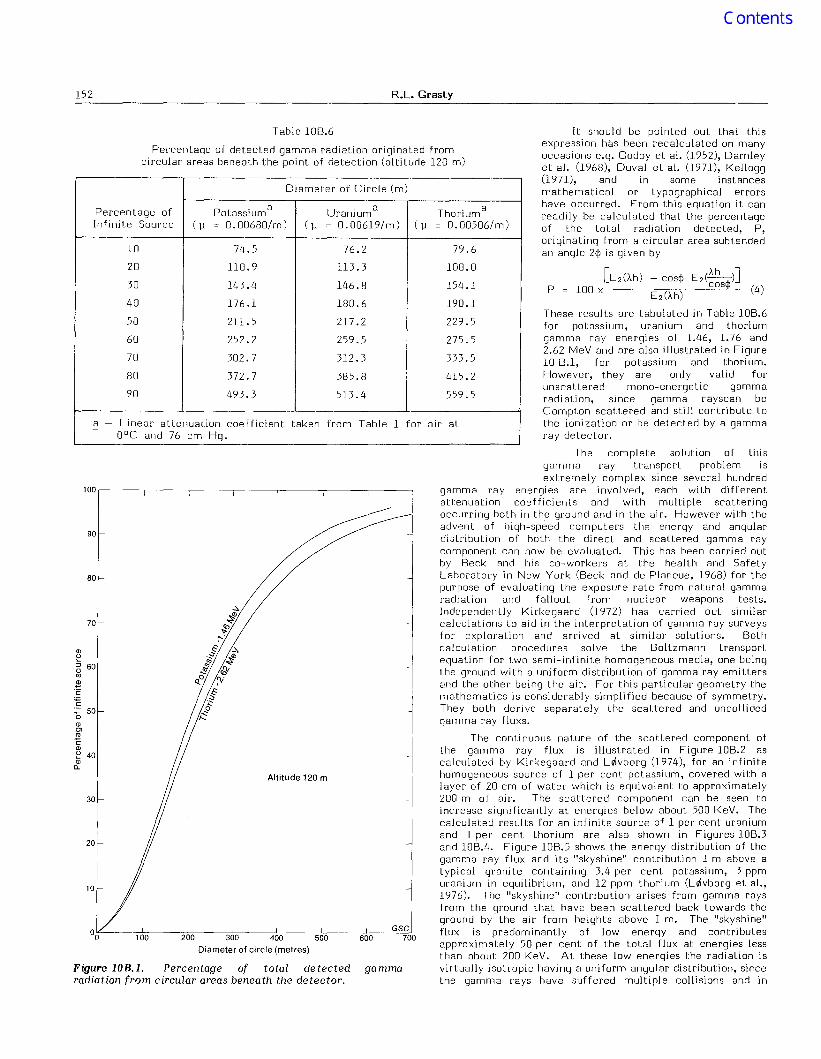
Table 10B.6 It should be pointed out that thisexpression has been recalculated on manyoccasions e.g. Godby et a!. (1952), Darnleyet a!. (1968), Duval et a!. (1971), Kellogg(1971), and in some instancesmathematical or typographical errorshave occurred. From this equation it canreadily be calculated that the percentageof the total radiation detected, P,originating from a circular area sub tendedan angle 2¢ is gi ven by
[Ez(Ah) - cos¢ Ez(Ah ,,)]cos,/,
P = 100 x EZ(Ah) (4)
These results are tabulated in Table 10B.6for potassium, uranium and thoriumgamma ray energies of 1.46, 1.76 and2.62 MeV and are also illustrated in Figure10 B.l, for potassium and thorium.However, they are only valid forunscattered mono-energetic gammaradiation, since gamma rayscan beCompton scattered and still contribute tothe ionization or be detected by a gammaray detector.
The complete solution of thisgamma ray transport problem isextremely complex since several hundred
gamma ray energies are involved, each with differentattenuation coefficients and with multiple scatteringoccurring both in the ground and in the air. However with theadvent of high-speed computers the energy and angulardistribution of both the direct and scattered gamma raycomponent can now be evaluated. This has been carried outby Beck and his co-workers at the health and SafetyLaboratory in New York (Beck and de Planque, 1968) for thepurpose of evaluating the exposure rate from natural gammaradiation and fallout from nuclear weapons tests.Independently Kirkegaard (1972) has carried out similarcalculations to aid in the interpretation of gamma ray surveysfor exploration and arrived at similar solutions. Bothcalculation procedures solve the Boltzmann transportequation for two semi-infinite homogeneous media, one beingthe ground with a uniform distribution of gamma ray emittersand the other being the air. For this particular geometry themathematics is considerably simplified because of symmetry.They both derive separately the scattered and uncollidedgamma ray fluxs.
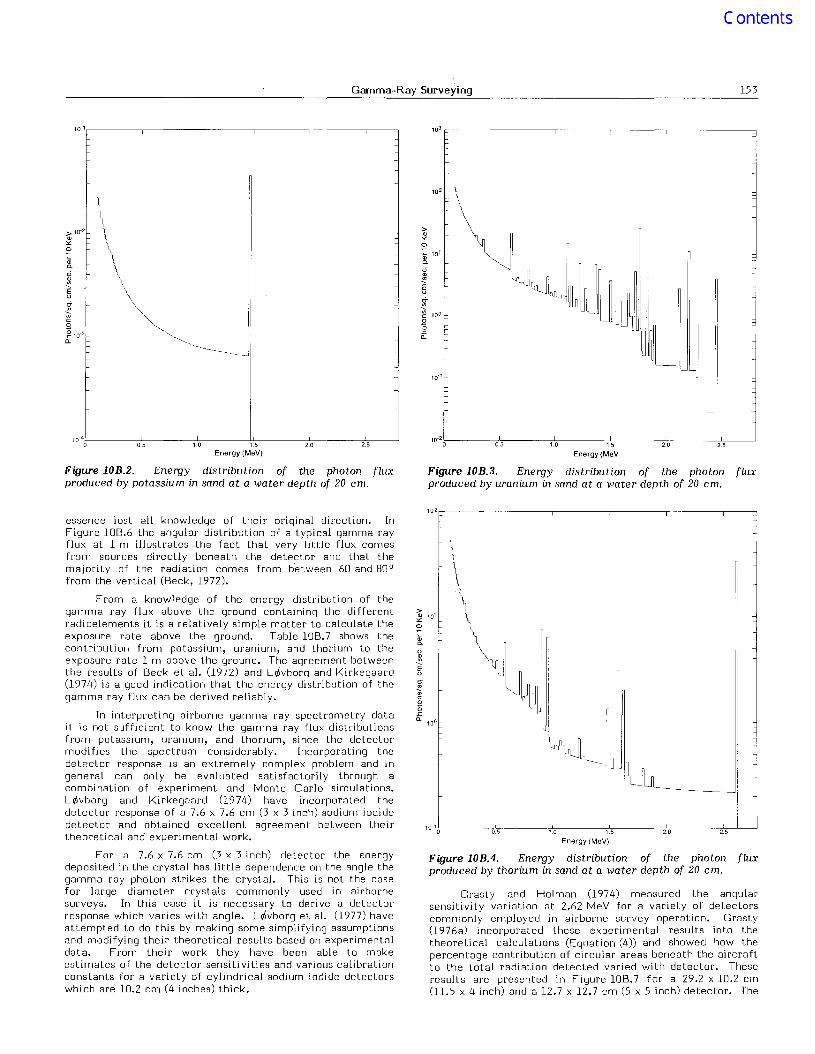
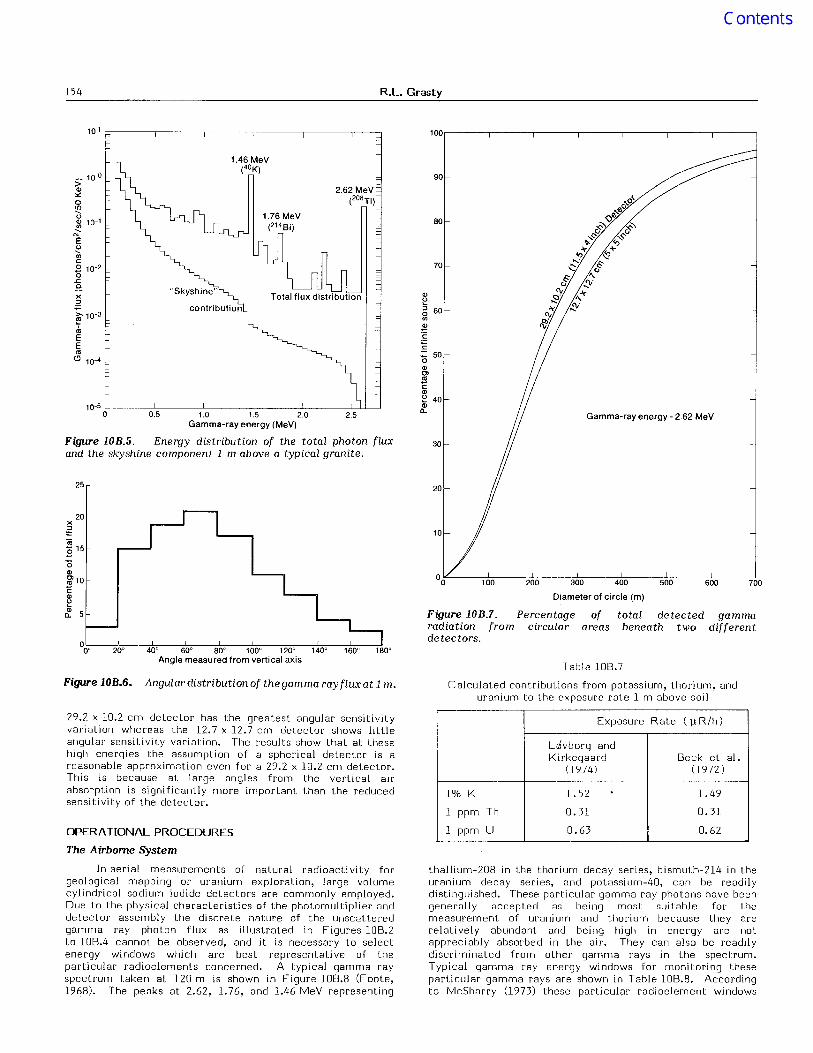
The continuous nature of the scattered component ofthe gamma ray flux is illustrated in Figure 10B.2 ascalculated by Kirkegaard and Lvlvborg (1974), for an infinitehomogeneous source of 1 per cent potassium, covered with alayer of 20 cm of water which is equivalent to approximately200 m of air. The scattered component can be seen toincrease significantly at energies below about 500 KeV. Thecalculated results for an infinite source of 1 per cent uraniumand 1 per cent thorium are also shown in Figures 10B.3and 10B.4. Figure 10B.5 shows the energy distribution of thegamma ray flux and its "skyshine" contribution 1 m above atypical granite containing 3.4 per cent potassium, 3 ppmuranium in equilibrium, and 12 ppm thorium (Lvlvborg et al.,1976). The "skyshine" contribution arises from gamma raysfrom the ground that have been scattered back towards theground by the air from heights above 1 m. The "skyshine"flux is predominantly of low energy and contributesapproximately 50 per cent of the total flux at energies lessthan about 200 KeV. At these low energies the radiation isvirtually isotropic having a uniform angular distribution, sincethe gamma rays have suffered multiple collisions and in
gamma
Percentage of detected gamma radiation originated fromcircular areas beneath the point of detection (altitude 120 m)
~----=-:!:-:':----=:�~--~'-=---.~c_--~'c--~6-·010c------G",S"'7C::'=l00100 200 300 400 500
Diameter of circle (metres)
10
100
90
80
70
Q)
l::':0 600U)
2·c~
50'0Q)CJ)
'"cQ)u 40Q;
Cl.
Altitude 120 m
30
20
Figure 10Rl. Percentage of total detectedradiation from circular areas beneath the detector.
Gamma-Ray Surveying 153
>10-2
""o
10-40~-----,J075----1c".oo-----.J1~5~----;;2"'0----n2.'<5------l
Energy (MeV)
Figure 10B.2. Energy distribution of the photon fluxproduced by potassium in sand at a water depth of 20 em.
essence lost all knowledge of their original direction. InFigure 10B.6 the angular distribution of a typical gamma rayflux at 1 m illustrates the fact that very little flux comesfrom sources directly beneath the detector and that themajority of the radiation comes from between 60 and 80 0
from the vertical (Beck, 1972).
From a knowledge of the energy distribution of thegamma ray flux above the ground containing the differentradioelements it is a relatively simple matter to calculate theexposure rate above the ground. Table 10B.7 shows thecontribution from potassium, uranium, and thorium to theexposure rate 1 m above the ground. The agreement betweenthe results of Beck et al. (1972) and Liilvborg and Kirkegaard(1974) is a good indication that the energy distribution of thegamma ray flux can be derived reliably.
In interpreting airborne gamma ray spectrometry datait is not sufficient to know the gamma ray flux distributionsfrom potassium, uranium, and thorium, since the detectormodifies the spectrum considerably. Incorporating thedetector response is an extremely complex problem and ingeneral can only be evaluated satisfactorily through acombination of experimeAt and Monte Carlo simulations.Liilvborg and Kirkegaard (1974) have incorporated thedetector response of a 7.6 x 7.6 cm (3 x 3 inch) sodium iodidedetector and obtained excellent agreement between theirtheoretical and experimental work.
For a 7.6 x 7.6 cm (3 x 3 inch) detector the energydeposited in the crystal has little dependence on the angle thegamma ray photon strikes the crystal. This is not the casefor large diameter crystals commonly used in airbornesurveys. In this case it is necessary to deri ve a detectorresponse which varies with angle. Liilvborg et al. (1977) haveattempted to do this by making some simplifying assumptionsand modifying their theoretical results based on experimentaldata. From their work they have been able to makeestimates of the detector sensitivities and various calibrationconstants for a variety of cylindrical sodium iodide detectorswhich are 10.2 cm (4 inches) thick.
10-21.-0 ----~0,,-5------c,~0-----Ol~5----~2.0~----J,2};.5~----.l
Energy (MeV
Figure 10B.3. Energy distribution of the photon fluxproduced by uranium in sand at a water depth of 20 em.
10',----.-,-----,--------,-------,--------,----=
10-1,1 ----n'c'----,''n-----,J'<--------;,,-------f;c--L-~o~ 05 1.0 1.5 20 25
Energy (MeV)
Figure 10B.4. Energy distribution of the photon fluxproduced by thorium in sand at a water depth of 20 em.
Grasty and Holman (1974) measured the angularsensitivity variation at 2.62 MeV for a variety of detectorscommonly employed in airborne survey operation. Grasty(1976a) incorporated these experimental results into thetheoretical calculations (Equation (4» and showed how thepercentage contribution of circular areas beneath the aircraftto the total radiation detected varied with detector. Theseresults are presented in Figure 10B.7 for a 29.2 x 10.2 cm(1l.5 x 4 inch) and a 12.7 x 12.7 cm (5 x 5 inch) detector. The
154 R.L. Grasty
25
Figure 10B.6. Angular distribution of the gamma ray flux at 1 m.
700600
total detected gammabeneath two different
Gamma-ray energy - 2.62 MeV
ofareas
200 300 400 500
Diameter of circle (m)
100
100,----....,----,-----,-------,----,------,.---------,
Figure 10B.7. Percentageradiation from circulardetectors.
Tallie 10B.7
Calculated contributions from potassium, thorium, anduranium to the exposure rate 1 m above soil
10
80
70
30
20
90
Q>U
~ 60UJ
$'c;;::c;;: 50oQ>Ol
'"EQ>
~ 40Q>(L
°0-L'------,2"'0.,.-O-----,40~o,-----6::':0""-----::8'=c0',----,----1-!-0.,.-0°,-----:-12~0"" ---,l.,,40;:-;:'---,1:c:670',----~
Angle measured from vertical axis
~ 10°>Q>~
o~
~ 10-1-...'"E~UJcB 10-2o
.s::
.eo)(::>;>. 10-3
~'"EE
'"Cl 10-4
10-5 L- "'---- -'--- -'-- -'-- -"---LL---.J
o 0.5 1.0 1.5 2.0 2.5Gamma-ray energy (MeV)
Figure 108.5. Energy distribution of the total photon fluxand the skyshine component 1 m above a typical granite.
20)(
~
'":§ 15
'0Q>
g'10EQ>U
£ 5
29.2 x 10.2 cm detector has the greatest angular sensitivityvariation whereas the 12.7 x 12.7 cm detector shows littleangular sensitivity variation. The results show that at thesehigh energies the assumption of a spherical detector is areasonable approximation even for a 29.2 x 10.2 cm detector.This is because at large angles from the vertical airabsorption is significantly more important than the reducedsensitivity of the detector.
OPERATIONAL PROCEDURES
The Airborne System
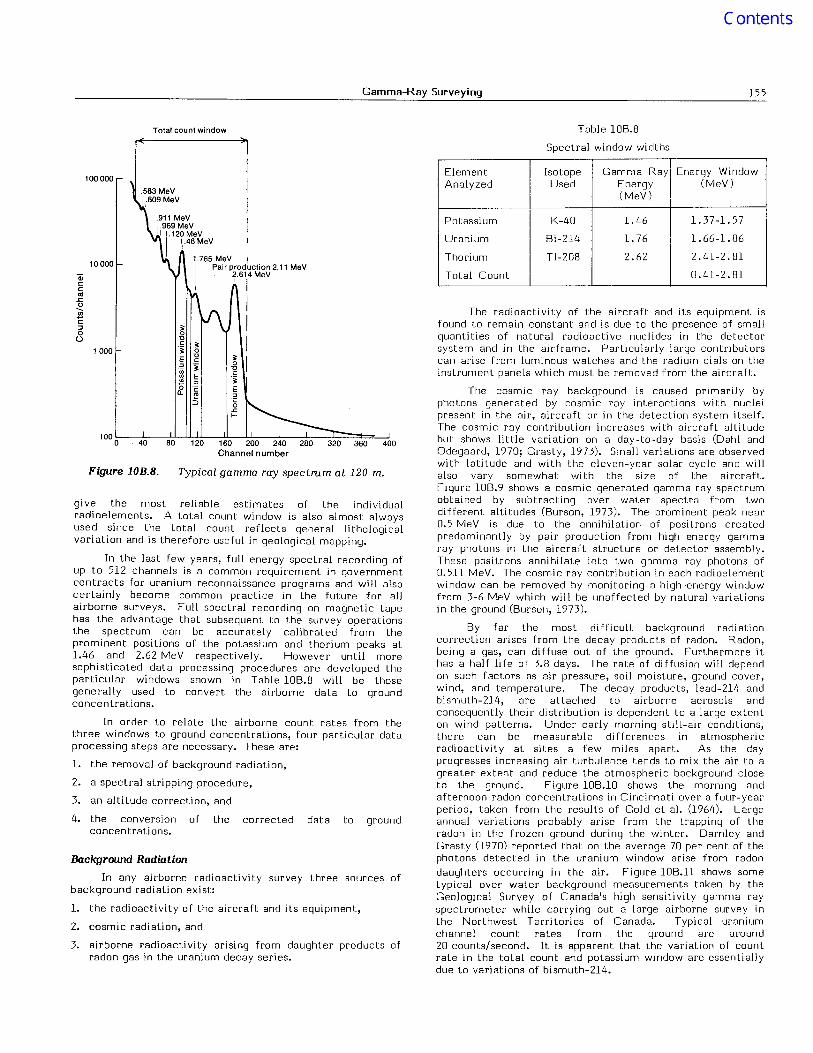
In aerial measurements of natural radioactivity forgeological mapping or uranium exploration, large volumecylindrical sodium iodide detectors are commonly employed.Due to the physical characteristics of the photomultiplier anddetector assembly the discrete nature of the unscatteredgamma ray photon flux as illustrated in Figures 10B.2to 10B.4 cannot be observed, and it is necessary to selectenergy windows which are best representative of theparticular radioelements concerned. A typical gamma rayspectrum taken at 120 m is shown in Figure 10B.8 (Foote,1968). The peaks at 2.62, 1.76, and 1.46 MeV representing
Exposure Rate (jl R/h)
Lyjvborg andKirkegaard Beck et al.
(1974) (1972)
1% K 1. 52 1.49
1 ppm Th 0.31 0.31
1 ppm U 0.63 0.62
thallium-208 in the thorium decay series, bismuth-214 in theuranium decay series, and potassium-40, can be readilydistinguished. These particular gamma ray photons have beengenerally accepted as being most suitable for themeasurement of uranium and thorium because they arerelatively abundant and being high in energy are notappreciably absorbed in the air. They can also be readilydiscriminated from other gamma rays in the spectrum.Typical gamma ray energy windows for monitoring theseparticular gamma rays are shown in Table 10B.8. Accordingto McSharry (1973) these particular radioelement windows
Gamma-Ray Surveying 155
Total count window Table 10B.8
Spectral window widths
1000L----.JL-~-l.LLL-16110--.J2UO-0--2..14-0--21.80-~r::::~3::i61=0=--4,.J00
Channel number
Element Isotope Gamma Ray Energy WindowAnalyzed Used Energy (MeV)
(MeV)
Potassium K-40 1.46 1.37-1.57
Uranium Bi-214 1. 76 1.66-1.86
Thorium Tl-208 2.62 2.41-2.81
Total Count 0.41-2.81
The radioactivity of the aircraft and its equipment isfound to remain constant and is due to the presence of smallquantities of natural radioactive nuclides in the detectorsystem and in the airframe. Particularly large contributorscan arise from luminous watches and the radium dials on theinstrument panels which must be removed from the aircraft.
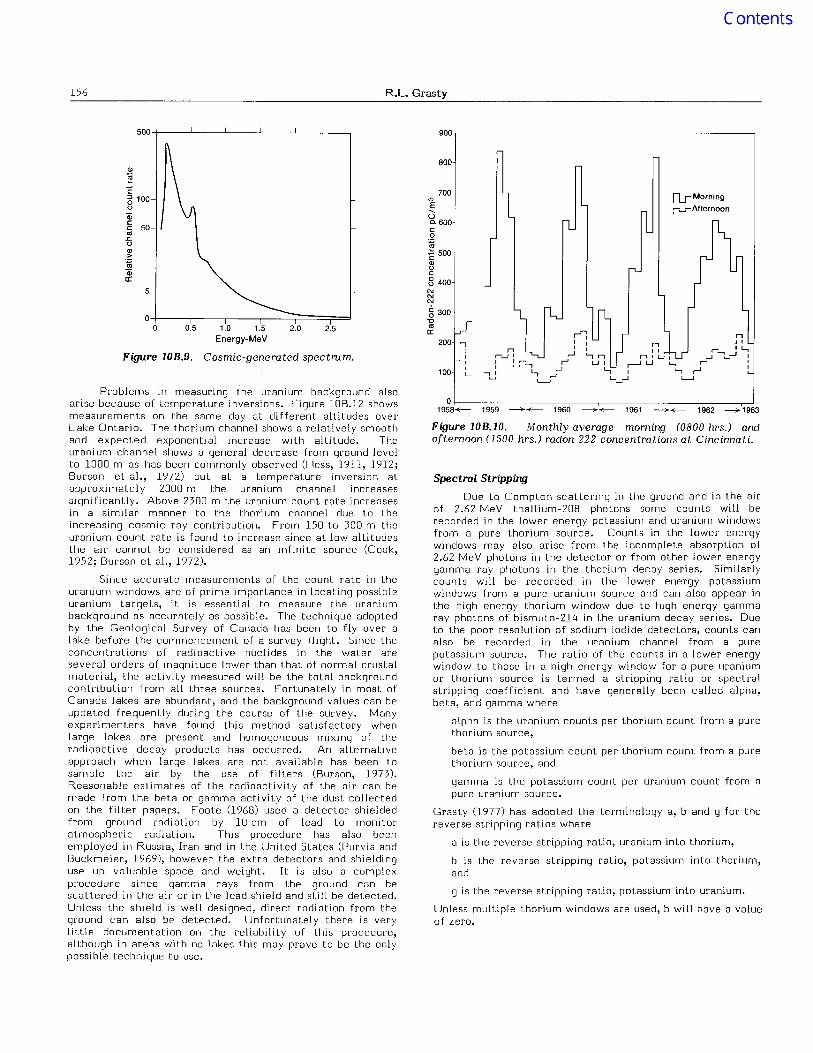
The cosmic ray background is caused primarily byphotons generated by cosmic ray interactions wi th nucleipresent in the air, aircraft or in the detection system itself.The cosmic ray contribution increases with aircraft altitudebut shows little variation on a day-to-day basis (Dahl andOdegaard, 1970; Grasty, 1973). Small variations are observedwi th lati tude and wi th the eleven-year solar cycle and willalso vary somewhat with the size of the aircraft.Figure 10B.9 shows a cosmic generated gamma ray spectrumobtained by subtracting over water spectra from twodifferent altitudes (Burson, 1973). The prominent peak near0.5 MeV is due to the annihilation of positrons createdpredominantly by pair production from high energy gammaray photons in the aircraft structure or detector assembly.These positrons annihilate into two gamma ray photons of0.511 MeV. The cosmic ray contribution in each radioelementwindow can be removed by monitoring a high-energy windowfrom 3-6 MeV which will be unaffected by natural variationsin the ground (Burson, 1973).
By far the most difficulL background radiationcorrection arises from the decay products of radon. Radon,being a gas, can diffuse out of the ground. Furthermore ithas a half life of 3.8 days. The rate of diffusion will dependon such factors as air pressure, soil moisture, ground cover,wind, and temperature. The decay products, lead-214 andbismuth-214, are attached to airborne aerosols andconsequently their distribution is dependent to a large extenton wind patterns. Under early morning still-air conditions,there can be measurable differences in atmosphericradioactivity at sites a few miles apart. As the dayprogresses increasing air turbulence tends to mix the air to agreater extent and reduce the atmospheric background closeto the ground. Figure 10B.I0 shows the morning andafternoon radon concentrations in Cincinnati over a four-yearperiod, taken from the results of Gold et al. (1964). Largeannual variations probably arise from the trapping of theradon in the frozen ground during the winter. Darnley andGrasty (1970) reported that on the average 70 per cent of thephotons detected in the uranium window arise from radondaug"hters occurring in the air. Figure 10B.11 shows sometypical over water background measurements taken by theGeological Survey of Canada's high sensitivity gamma rayspectrometer while carrying out a large airborne survey inthe Northwest Territories of Canada. Typical uraniumchannel count rates from the ground are around20 counts/second. It is apparent that the variation of countrate in the total count and potassium window are essentiallydue to variations of bismuth-214.
Typical gamma ray spectrum at 120 m.
10000
Figure lOB.B.
100000
~o"0c:";;E::>.§.c:f-
1000
give the most reliable estimates of the individualradioelements. A total count window is also almost alwaysused since the total count reflects general lithologicalvariation and is therefore useful in geological mapping.
In the last few years, full energy spectral recording ofup to 512 channels is a common requirement in governmentcontracts for uranium reconnaissance programs and will alsocertainly become common practice in the future for allairborne surveys. Full spectral recording on magnetic tapehas the advantage that subsequent to the survey operationsthe spectrum can be accurately calibrated from theprominent positions of the potassium and thorium peaks at1.46 and 2.62 MeV respectively. However until moresophisticated data processing procedures are developed theparticular windows shown in Table 10B.8 will be thosegenerally used to convert the airborne data to groundconcentrations.
In order to relate the airborne count rates from thethree windows to ground concentrations, four particular dataprocessing steps are necessary. These are:
1. the removal of background radiation,
2. a spectral stripping procedure,
3. an altitude correction, and
4. the conversion of the corrected data to groundconcentrations.
Background Radiation
In any airborne radioactivity survey three sources ofbackground radiation exist:
1. the radioactivity of the aircraft and its equipment,
2. cosmic radiation, and
3. airborne radioactivity arising from daughter products ofradon gas in the uranium decay series.
156 R.L. Grasty
500+ __-'---__L-_--J__--'-__--'---, 900-,---------------------------,
n..r- Morningi......-Afternoon
r--:I I
,., I ,
r---l I ,...J ~ n: ~-, r L.J I
-:! '-,,..J L...j,- ~ ~
...,I I, ,
I,L
800
100
700
'"E"-<.J0.600co~~ 500c
'"uc8400
'"'"'"§ 300"0
'"a:200
2.52.01.0 1.5Energy-MeV
Cosmic-generated spectrum.
o-l------,----,------,----=:;==::;=='o 0.5
5
'"~c~ 100uQicc 50
'"J::U
'">~Qia:
Figure lOB.9.
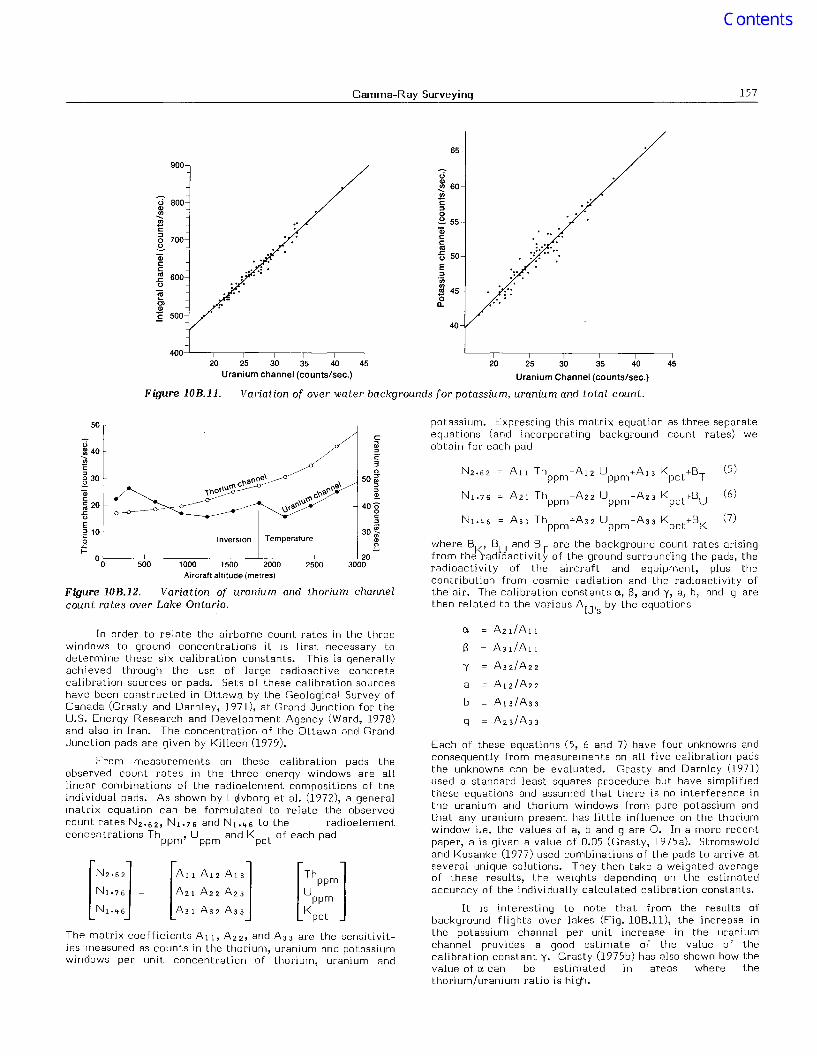
Problems in measuring the uranium background alsoarise because of temperature inversions. Figure 10B.12 showsmeasurements on the same day at different altitudes overLake Ontario. The thorium channel shows a relatively smoothand expected exponential increase with altitude. Theuranium channel shows a general decrease from ground levelto 1000 m as has been commonly observed (Hess, 1911, 1912;Burson et aI., 1972) but at a temperature inversion atapproximately 2000 m the uranium channel increasessignificantly. Above 2300 m the uranium count rate increasesin a similar manner to the thorium channel due to theincreasing cosmic ray contribution. From 150 to 300 m theuranium count rate is found to increase since at low altitudesthe air cannot be considered as an infinite source (Cook,1952; Burson et aI., 1972).
Since accurate measurements of the count rate in theuranium windows are of prime importance in locating possibleuranium targets, it is essential to measure the uraniumbackground as accurately as possible. The technique adoptedby the Geological Survey of Canada has been to fly over alake before the commencement of a survey flight. Since theconcentrations of radioactive nuclides in the water areseveral orders of magnitude lower than that of normal crustalmateri aI, the acti vi t y measured will be the total backgroundcontribution from all three sources. Fortunately in most ofCanada lakes are abundant, and the background values can beupdated frequently during the course of the survey. Manyexperimenters have found this method satisfactory whenlarge lakes are present and homogeneous mixing of theradioactive decay products has occurred. An alternativeapproach when large lakes are not available has been tosample the air by the use of filters (Burson, 1973).Reasonable estimates of the radioactivity of the air can bemade from the beta or gamma activity of the dust collectedon the filter papers. Foote (1968) used a detector shieldedfrom ground radiation by 10 cm of lead to monitoratmospheric radiation. This procedure has also beenemployed in Russia, Iran and in the United States (Purvis andBuckmeier, 1969), however the extra detectors and shieldinguse up valuable space and weight. It is also a complexprocedure since gamma rays from the ground can bescattered in the air or in the lead shield and still be detected.Unless the shield is well designed, direct radiation from theground can also be detected. Unfortunately there is verylittle documentation on the reliability of this procedure,although in areas with no lakes this may prove to be the onlypossible technique to use.
01-----,.--------,-----,----------.----'1958~ 1959 ----+~ 1960 ----+~ 1961 ----+~ 1962 ----+1963
Figure lOB.lO. Monthlyaverage morning (0800 hrs.J andafternoon (1500 hrs.J radon 222 concentrations at Cincinnati.
Spectral Stripping
Due to Compton scattering in the ground and in the airof 2.62 MeV thallium-208 photons some counts will berecorded in the lower energy potassium and uranium windowsfrom a pure thorium source. Counts in the lower energywindows may also arise from the incomplete absorption of2.62 MeV photons in the detector or from other lower energygamma ray photons in the thorium decay series. Similarlycounts will be recorded in the lower energy potassiumwindows from a pure uranium source and can also appear inthe high energy thorium window due to high energy gammaray photons of bismuth-214 in the uranium decay series. Dueto the poor resolution of sodium iodide detectors, counts canalso be recorded in the uranium channel from a purepotassium source. The ratio of the counts in a lower energywindow to those in a high energy window for a pure uraniumor thorium source is termed a stripping ratio or spectralstripping coefficient and have generally been called alpha,beta, and gamma where
alpha is the uranium counts per thorium count from a purethorium source,
beta is the potassium count per thorium count from a purethorium source, and
gamma is the potassium count per uranium count from apure uranium source.
Grasty (1977) has adopted the terminology a, band g for thereverse stripping ratios where
a is the reverse stripping ratio, uranium into thorium,
b is the reverse stripping ratio, potassium into thorium,and
g is the reverse stripping ratio, potassium into uranium.
Unless multiple thorium windows are used, b will have a valueof zero.
Gamma-Ray Surveying 157
65
900.;
~ 60UJ
.; 800 C'" "UJ 0--..UJ .' .e 55c Qi"0 700 c:
.e c:.,Qi
.<: 50c: .' . "c: E.,
600 ".<: '00
" UJa; ., 450, '02
D-
E 50040
400452045 25 30 35 40
Uranium Channel (counts/sec.)
Variation of over water backgrounds for potassium, uranium and total count.
20 25 30 35 40Uranium channel (counts/sec.)
Figure lOB.ll.
Figure lOB.12. Variation of uranium and thorium channelcount rates over Lake Ontario.
o o:---cc5o:':;oo-----c1~00::0=-----c1-=5~00=---L-20J,0-=0---2--"50--cO---3~o06°
Aircraft altitude (metres)
(6)
(5)N 2. 62 All Th +A12 U +A13 Kpct+B Tppm ppm
A2l Th +A22 U +A23 Kpc ! +BUppm ppm •
A3l Th +A32 U +A33 K t+BK (7)ppm ppm pc
where BK
, BU
and BT
are the background count rates arisingfrom the radioactivity of the ground surrounding the pads, theradioactivity of the aircraft and equipment, plus thecontribution from cosmic radiation and the radioactivity ofthe air. The calibration constants 0'., S, and y, a, b, and g arethen related to the various AIJ,s by the equations
potassium. Expressing this matrix equation as three separateequations (and incorporating background count rates) weobtain for each pad
c0;::J
c'3
"50 ~::J::J!!!.
400oc:::J
30 ~1Il
"Inversion Temperature
50
o~ 40
'"E::J
.[ 30
4ic:lii 20.c:oE::J 10.§
.c:f-
In order to relate the airborne count rates in the threewindows to ground concentrations it is first necessary todetermine these six calibration constants. This is generallyachieved through the use of large radioacti ve concretecalibration sources or pads. Sets of these calibration sourceshave been constructed in Ottawa by the Geological Survey ofCanada (Grasty and Darnley, 1971), at Grand Junction for theU.S. Energy Research and Development Agency (Ward, 1978)and also in Iran. The concentration of the Ottawa and GrandJunction pads are given by Killeen (1979).
From measurements on these calibration pads theobserved count rates in the three energy windows are alllinear combinations of the radioelement compositions of theindividual pads. As shown by L~vborg et al. (1972), a generalmatrix equation can be formulated to relate the observedcount rates N 2. 62 , Nl. 76 and N l •4 6 to the radioelementconcentrations Th , U and K of each pad
ppm ppm pct
The matrix coefficients All, A 22 , and A 33 are the sensitivities measured as counts in the thorium, uranium and potassiumwindows per unit concentration of thorium, uranium and
0'. A2t1All
S A31/Al 1
Y A32/A22
a A 1 2/A22
b A13/A33
g A23/A 33
Each of these equations (5, 6 and 7) have four unknowns andconsequently from measurements on all five calibration padsthe unknowns can be evaluated. Grasty and Darnley (1971)used a standard least squares procedure but have simplifiedthese equations and assumed that there is no interference inthe uranium and thorium windows from pure potassium andthat any uranium present has little influence on the thoriumwindow i.e. the values of a, band g are O. In a more recentpaper, a is given a value of 0.05 (Grasty, 1975a). Stromswoldand Kosanke (1977) used combinations of the pads to arri ve atseveral unique solutions. They then take a weighted averageof these results, the weights depending on the estimatedaccuracy of the individually calculated calibration constants.
It is interesting to note that from the results ofbackground flights over lakes (Fig. 10B.ll), the increase inthe potassium channel per unit increase in the uraniumchannel provides a good estimate of the value of thecalibration constant y. Grasty (1975b) has also shown how thevalue of 0'. can be estimated in areas where thethorium/uranium ratio is high.
158 R.L. Grasty
Figure lOB.13.
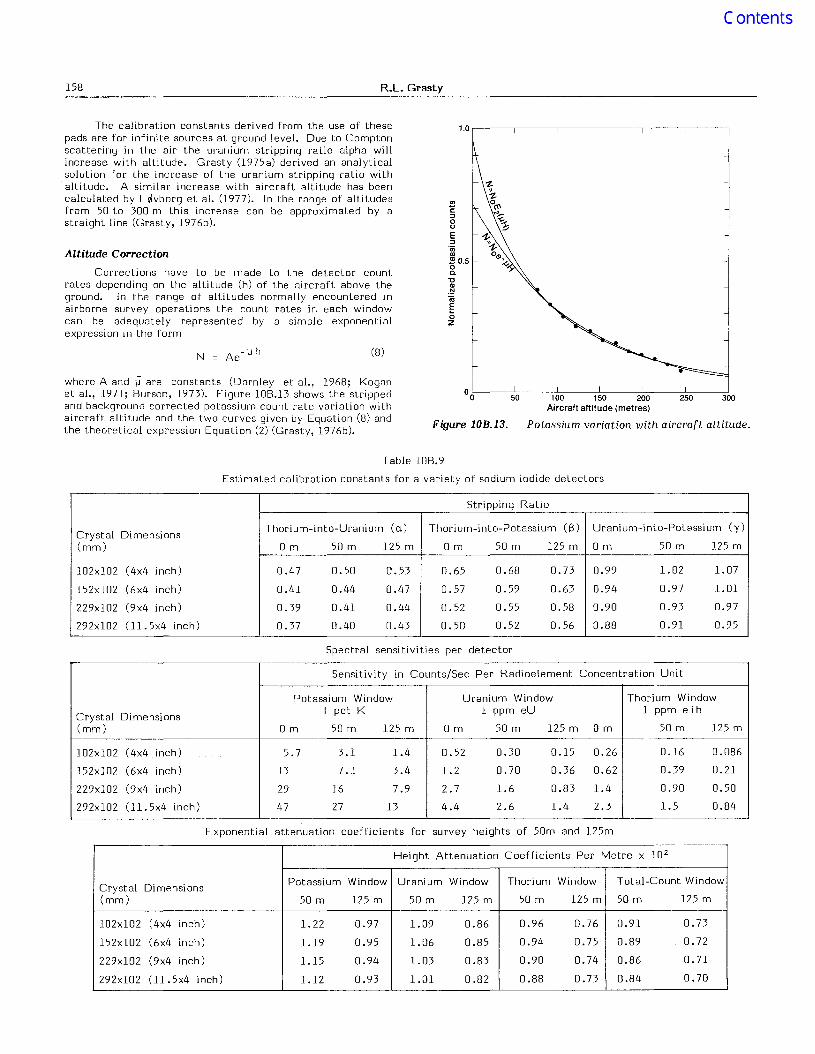
The calibration constants deri ved from the use of thesepads are for infinite sources at ground level. Due to ComptonscatLering in the air the uranium stripping ratio alpha willincrease with altitude. Grasty (1975a) derived an analyticalsolution for the increase of the uranium stripping ratio withaltitude. A similar increase with aircrafL altitude has beencalculated by L~vborg et al. (1977). In the range of altitudesfrom 50 to 300 m this increase can be approximated by astraight line (Grasty, 1976b).
Altitude Correction
Corrections have to be made to the detector countrates depending on the altitude (h) of the aircrafL above theground. In the range of altitudes normally encountered inairborne survey operations the count rates in each windowcan be adequately represented by a simple exponentialexpression in the form
(8)
where A and ]l FIre constants (Darnley et aI., 1968; Koganet aI., 1971; Burson, 1973). Figure 10B.13 shows the strippedand background corrected potassium count rate variation withaircrafL altitude and the two curves given by Equation (8) andthe theoretical expression Equation (2) (Grasty, 1976b).
1.o,---,-------,----,------,------,-------,
Ul
C:::>ooE:::>.0;Ul
~ 0.5o0."0OJ.~
coE(;z
o0.:----='50=-------;1-':-00=-------,-15':-:0,----2~0:-:c0-----,2~5--:-0--~300
Aircraft altitude (metres)
Potassium variation with aircraft altitude.
Table 10B.9
Estimated calibration constants for a variety of sodium iodide detectors
Stripping Ratio
Crystal DimensionsThorium-into-Uranium (a) Thorium-into-Potassium (S) Uranium-into-Potassium (y)
(mm) Om 50 m 125 m Om 50 m 125 m Om 50 m 125 m
102xl02 (4x4 inch) 0.47 0.50 0.53 0.65 0.68 0.73 0.99 1.02 1.07
152xl02 (6x4 inch) 0.41 0.44 0.47 0.57 0.59 0.63 0.94 0.97 1.01
229xl02 (9x4 inch) 0.39 0.41 0.44 0.52 0.55 0.58 0.90 0.93 0.97
292xl02 (11.5x4 inch) 0.37 0.40 0.43 0.50 0.52 0.56 0.88 0.91 0.95
Spectral sensitivities per detector
Sensitivity in Counts/Sec Per Radioelement Concentration Uni t
Potassium Window Uranium Window Thorium Window
Crystal Dimensions1 pct K 1 ppm eU 1 ppm eTh
(mm) Om 50 m 125 m Om 50 m 125 m Om 50 m 125 m
102xl02 (4x4 inch) 5.7 3.1 1.4 0.52 0.30 0.15 0.26 0.16 0.086
152xl02 (6x4 inch) 13 7.1 3.4 1.2 0.70 0.36 0.62 0.39 0.21
229xl02 (9x4 inch) 29 16 7.9 2.7 1.6 0.83 1.4 0.90 0.50
292xl02 (l1.5x4 inch) 47 27 13 4.4 2.6 1.4 2.3 1.5 0.84
Exponential attenuation coefficients for survey heights of 50m and 125m
Height Attenuation Coefficients Per Metre x 10 2
Crystal DimensionsPotassium Window Uranium Window Thorium Window Total-Count Window
(mm) 50 m 125 m 50 m 125 m 50 m 125 m 50 m 125 m
102xl02 (4x4 inch) 1.22 0.97 1.09 0.86 0.96 0.76 0.91 0.73
152xl02 (6x4 inch) 1.19 0.95 1.06 0.85 0.94 0.75 0.89 0.72
229xl02 (9x4 inch) 1.15 0.94 1.03 0.83 0.90 0.74 0.86 0.71
292xl02 (U.5x4 inch) 1.12 0.93 1.01 0.82 0.88 0.73 0.84 0.70
Gamma-Ray Surveying 159
REFERENCES
Recommendations for Future Worlc
Probably one of the most difficult problems toovercome in providing reliable and consistent airborne gammaray spectrometry data is due to the presence of radon and itsdecay products in the air. This is particularly true in areaswhere lakes cannot be found. A systematic study of the useof upward-looking crystals could provide valuable informationon the best way of utilizing this particular technique.
In areas with large variations in topographic relief it iscommon practice to remove the effect of the varyingcosmic ray component by monitoring a cosmic ray windowfrom 3-6 MeV. A problem in utilizing this procedure arisesbecause of the low count rate observed in this particularwindow. A possible procedure which would allow morefrequent and accurate updates of the cosmic ray componentcould be to relate it directly to a barometric altimeter.
Considerable effort is now being spent in uraniumreconnaissance programs and it is essential to use systemswhich are properly calibrated in order that the results fromthe different systems can be compared. There is considerabledifficulty in finding suitable calibration strips which arereadily accessible. A possible solution which warrants furtherattention is to utilize the calibration pads and simulate theabsorption effects of the air by covering them with materialsuch as plywood sheet. This technique could well prove to bethe most reliable and accurate technique for evaluating thecalibration constants for an airborne detection system.
Conversion to Ground Concentration
From flights over a test strip of known groundconcentration the sensitivity of the spectrometer in terms ofcounts per unit concentration per unit time can be readilyobtained. The United States Department of Energy hasselected a calibration strip near Las Vegas for the purpose ofcalibrating systems involved in the U.S. National UraniumReconnaissance program (Geodata International Inc., 1977).The mean concentrations of this strip are 2.4 per centpotassium, 2.8 ppm uranium and 11.6 ppm thorium. Thiscalibration strip suffers from the fact that the groundconcentration is not uniform and different concentrationsmust be assigned to the strip depending on the aircraftaltitude and particular detector configuration. TheGeological Survey of Canada test strip, a few miles fromOttawa, has concentrations of 2.0 per cent potassium,0.9 ppm uranium, and 7.7 ppm thorium (Grasty, 1975c; Grastyand Charbonneau, 1974). Because of the low uraniumconcentration, this strip is not ideal for the accuratecalibration of the uranium channel.
Lqlvborg et al. (1977) have calculated the sensitivities,exponential height correction parameters and strippingratios, el, S, and y for four different cylindrical sodium iodidedetectors which are 10 cm thick. These results are presentedin Table lOB.9 and serve as a useful guide in the design ofairborne systems. When the calibration constants for aparticular system are known, it is a relatively simple matterto convert the airborne count rates to ground concentrations(Grasty, 1977).
Curie, S.1898: Rayons emis par les composes de l'uranium et du
thorium; C.R. Acad. Sci., Paris, v. 126,p. 1101-1103.
Dahl, J.B. and <Ddegaard, H.1970: Areal measurements of water equivalent of snow
deposits by means of natural radioactivity in theground; in Isotope Hydrology, IAEA Vienna,Austria, p-:-191-210.
Darnley, A.G., Bristow, Q., and Donhoffer, O.K.1968: Airborne gamma-ray spectrometer experiments
over the Canadian Shield; in Nuclear Techniquesand Mineral Resources ITiiternational AtomicAgency, Vienna), p. 163-186.
Darnley, A.G. and Grasty, R.L.1970: Mapping from the air by gamma-ray
spectrometry; Proc. Third InternationalGeochemical Symposium, Toronto, Can. Inst. Min.Met. Spec. Vol. 11, p. 485-500.
Duval, J.S., Jr., Cook, B., and Adams, J.A.S.1971: Circle of investigation of an airborne gamma-ray
spectrometer; J. Geophys. Res., v. 76, p. 8466.
An analysis of airborne surveying for surfaceradioactivity; Geophysics, v. 17 (4), p. 687-706.
On the ionization of the atmosphere due toradioacti ve matter; Phil. Mag., v. 21, p. 26.
Cook, J.C.1952:
Beck, H., DeCampo, J., and Gogolak, C.1972: In situ Ge(Li) and NaI(Tl) gamma-ray
spectrometry; Rept. HASL-258, U.S. AtomicEnergy Comm.
Beck, H. and de Planque, G.1968: The radiation field in air due to distributed gamma
ray sources in the ground; Rept. HASL-195, U.S.Atomic Energy Comm.
Becquerel, H.1896a: Sur les radiations invisibles emises par les corps
phosphorescents; C.R. Acad. Sci., Paris, v. 122,p. 500-503.
1896b: Sur les radiations invisibles emises par les selsd'uraniurn; C.R. Acad. Sci., Paris, v. 122,p.689-694.
Burson, Z.G.1973: Airborne surveys of terrestrial gamma radiation in
environmental research; IEEE Transactions onNuclear Science, v. NS-21 (1).
Burson, Z.G., Boyns, P.K., and Fritzsche, A.E.1972: Technical procedures for characterizing the
terrestrial gamma radiation environment by aerialsurveys; Proceedings of the Second InternationalSymposium on the Natural Radiation Environment,Houston, Texas. J.A.S. Adams, W.M. Lowder, andT.F. Gesell (eds.).
Campbell, N.R.1907: The S rays from potassium; Proc. Camb. Phil.
Soc., v. 14, p. 211.
Campbell, N.R. and Wood, A.1906: The radioactivity of the alkali metals; Proc.
Camb. Phil. Soc., v. 14, p. 15.
Eve, A.S.1911:
The physics of environmental gamma radiationfields; Proceedings of the Second InternationalSymposium on the Natural Radiation Environment,Houston, Texas. J.A.S. Adams, W.M. Lowder, andT.F. Gesell (eds.).
Beck, H.1972:
160 R.L. Grasty
Foote, R.S.1968: Improvement in airborne gamma radiation data
analyses for anomalous radiation by removal ofenvironmental and pedologic radiation changes; inSymposium on the Use of Nuclear Techniques Tilthe Prospecting and Development of MineralResources, International Atomic Energy Meeting,Buenos Aires.
Geodata International Inc.1977: Lake Mead dynamic test range for calibration of
airborne gamma radiation measuring systems;ERDA Report GJBX46(77).
Gockel, V.A.1910: Luftelektrische beobachtungen bei einer
Ballonfahrt; Phys. Zeit., v. 11, p. 280-282.
Godby, E.A., Connock, S.H.G., Steljes, J.F., Cowper, G., andCarmichael, H.
1952: Aerial prospecting for radioactive materials; Nat.Res. Coun. Lab. Joint Rept., MR-17 CRR-495,90 p.
Gold, S., Barkham, H.W., Shlien, B., and Kahn, B.1964: Measurement of naturally occurring radionuclides
in air; The Natural Radiation Environment, Univ.Chicago Press, p. 369-382.
Grasty, R.L.1973: Snow-water equivalent measurement using natural
gamma emission; Nord. Hydr., v. 4, p. 1-16.
1975a: Uranium measurement by airborne gamma-rayspectrometry; Geophysics, v. 40 0), p. 503-519.
1975b: Uranium stripping determination au naturel forairborne gamma-ray spectrometry; in Report ofActi vities, Part A, Geol. Surv. Can., Paper 75-1A,p.87.
1975c: Atmospheric absorption of 2.62 MeV gamma-rayphotons emitted from the ground; Geophysics,v. 40 (6), p. 1058-1065.
1976a: The circle of investigation of airborne gamma-rayspectrometers; in Report of Acti vities, Part B,Geol. Surv. Can.~Paper 76-1B, p. 77-79.
1976b: A calibration procedure for an airborne gammaray spectrometer; Geol. Surv. Can., Paper 76-16,p. 1-9.
1977: A general calibration procedure for airbornegamma-ray spectrometers; in Report ofActivities, Part C, Geol. Surv. Can., Paper 77-1C,p. 61-62.
Grasty, R.L. and Charbonneau, B.W.1974: Gamma-ray spectrometer calibration facilities; in
Report of Activities, Part B, Geol. Surv. Can-:-;Paper 74-1B, p. 69-71.
Grasty, R.L. and Darnley, A.G.1971: The calibration of gamma-ray spectrometers for
ground and airborne use; Geol. Surv. Can.,Paper 71-17, 27 p.
Grasty, R.L. and Holman, P.B.1974: Optimum detector sizes for airborne gamma-ray
surveys; in Report of Activities, Part B, Geol.Surv. Can~Paper 74-1B, p. 72-74.
King, L.V.1912:
Hess, V.F.1911:
1912:
Uber die Absorption der y-strahlen in der Atmosph are; Phys. Zeit., v. 12, p. 998-1001.
Uber beobachtungen der durchdringendenStrahlung bei sieben Freiballonfahrten; Phys.Zeit., v. 13, p. 1084-1091.
Hubbell, J.H. and Berger, M.J.1968: Attenuation coefficients, energy absorption
coefficients, and related quantities; EngineeringCompendium on Radiation Shielding, v. 1, SpringerVerlag, Berlin.
Kellogg, W.C.1971: Calculation of airborne radioactivity survey
responses: theory, method, and field test; AnnualMeeting of A.I.M.E., New York.
Killeen, P.G.1979: Gamma ray spectrometric methods in uranium
exploration: Application and interpretation; inGeophysics and Geochemistry in the Search forMetallic Ores; Geol. Surv. Can., Econ. Geol.Rept. 31, Paper loC.
Absorption problems in radioactivity; Phil. Mag.,v. 23, p. 242.
Kirkegaard, P.1972: Double-PI calculation of gamma-ray transport in
semi-infinite media; Ris~-M-146o.
Kirkegaard, P. and L~vborg, L.1974: Computer modelling of terrestrial gamma
radiation fields; Ris~ Report No. 303.
Kogan, R.M., Nazarov, I.M., and Fridman, Sh.D.1971: Gamma spectrometry of natural environments and
formations - theory of the method,applications togeology and geophysics; Israel Program forScientific Translations, 5778, Jerusalem.
Kolhorster, W.1928: Gammastrahlen an Kaliumsalzen; Naturwiss, v. 16
(2), p. 28.
L~vborg, L., Grasty, R.L., and Kirkegaard, P.1977: A guide to the calibration constants for aerial
gamma-ray surveys in geoexploration; AmericanNuclear Society Symposium on Aerial Techniquesfor Environmental Monitoring, Las Vegas.
L~vborg, L. and Kirkegaard, P.1974: Response of 3"x3" Nal(TJ) detectors to terrestrial
gamma radiation; Nuclear Instruments andMethods 121, p. 239-251, North-Holland PublishingCo.
L~vborg, L., Kirkegaard, P., and Mose Christiansen, E.1976: The design of Nal(Tl) scintillation detectors for
use in gamma-ray surveys of geological sources;IAEA Symposium on Exploration of Uranium OreDeposits, Vienna.
L~vborg, L., Kirkegaard, P., and Rose-Hansen, J.1972: Quantitative interpretation of the gamma-ray
spectra from geologic formations; Proc. of theSecond Int. Symp. on the Natural RadiationEnvironment, Houston, Texas, J.A.S. Adams,W.M. Lowder, and T.F. Gesell (eds.).
McSharry, P.J.1973: Reducing errors in airborne gamma ray
spectrometry; Austr. Soc. Explor. Geophys. Bull.,v. 4 (1), p. 31.
Purvis, A.E. and Buckmeier, F.J.1969: Comparison of airborne spectral gamma radiation
data with field verification measurements; Proc.Sixth Int. Symp. on Remote Sensing ofEnvironment, v. 1.
Rutherford, E.1903: The magnetic and electric deviation of the easily
absorbed rays from radium; Phil. Mag., v. 5,p.l77.
Gamma-Ray Surveying 161
Ward, D.L.1978: Construction of calibration facility Walker Field,
Grand Junction, Colorado; ERDA Open FileGJBX-37(78).
Strutl, R.J.1903: On the intensely penetrating rays of radium; Proc.
Roy. Soc., v. 72, p. 208.
Villard, M.P.1900: Sur Ie rayonnement du radium; Comptes Rendus,
v. 130, p. 1178.
Schmidt, G.C.1898: CJber die von den Thorverbindungen and einigen
anderen substanzen ausgehende Strahlung; Ann. d.Phys. u. Chem., v. 65, p. 141.
Smith, A.R. and Wollenberg, H.A.1972: High-resolution gamma ray spectrometry for
laboratory analysis of the uranium and thoriumdecay series; Proc. 2nd Int. Symp. on the NaturalRadiation Environment, Houston, Texas.J.A.S. Adams, W.M. Lowder, and T.F. Gesell(eds.). U.S. Dept. of Commerce, Springfield,Virginia, p. 181-231.
Stromswold, D.C. and Kosanke, K.L.1977: Calibration and error analysis for spectral
radiation detectors; IEEE Nuclear Science Symp.,San Francisco, California.
Wulf, V.T.1910: Beobachtungen uber die Strahlung hoher
durchdringungsfahigkeit auf dem Eiffelturm; Phys.Zeit, v. 11, p. 810.