gallup online q12 reports - uva · the color of the grandmean meter corresponds to percentile...
TRANSCRIPT

GALLUP ONLINE
Q12 REPORTS

Q12 Reports
Copyright © 2014 Gallup, Inc. All rights reserved. 2
Table of Contents
Copyright Standards .................................................................................................................................................. 3
How to Access Q12 Reports ........................................................................................................................................ 4
Summary View ........................................................................................................................................................... 5
Summary Card ........................................................................................................................................................................ 6
Report Period and Type .......................................................................................................................................................... 7
Business Unit Selection .......................................................................................................................................................... 8
Scorecard View ........................................................................................................................................................... 9
Survey Questions ................................................................................................................................................................... 10
Engagement Hierarchy ......................................................................................................................................................... 12
Indices ................................................................................................................................................................................... 13
Column Customization ......................................................................................................................................................... 14
Business Unit Selection ......................................................................................................................................................... 16
Printing and Saving Reports .................................................................................................................................... 18
Q12 Reports
Copyright © 2014 Gallup, Inc. All rights reserved. 3
COPYRIGHT STANDARDS
This document contains proprietary research, copyrighted materials, and literary property of Gallup, Inc. It is for the guidance of your organization only and is not to be copied, quoted, published, or divulged to others outside your organization. All of Gallup, Inc.’s content is protected by copyright. Neither the client nor the participants shall copy, modify, resell, reuse, or distribute the program materials beyond the scope of what is agreed upon in writing by Gallup, Inc. Any violation of this Agreement shall be considered a breach of contract and misuse of Gallup, Inc.’s intellectual property. This document is of great value to Gallup, Inc. Accordingly, international and domestic laws and penalties guaranteeing patent, copyright, trademark, and trade secret protection safeguard the ideas, concepts, and recommendations related within this document. No changes may be made to this document without the express written permission of Gallup, Inc. Gallup® and Q12® are trademarks of Gallup, Inc. All rights reserved. All other trademarks and copyrights are property of their respective owners. r.1411

Q12 Reports
Copyright © 2014 Gallup, Inc. All rights reserved. 4
HOW TO ACCESS Q12 REPORTS
1. From your Web browser, navigate to Gallup Online.
2. On the Login page, type your Gallup Online user ID in the User ID field.
Gallup Online Login page
3. Type your Gallup Online password in the Password field.
NOTE: If you do not have a password or you have forgotten it, click Need help with your user ID or password? and follow the instructions on the site to create your password or reset an existing one.
4. Click Login to display the Gallup Online home page. This is known as the My Gallup page.
My Gallup page
5. In the Our Workplace area, click Q12 Reports.
Q12 Reports
Copyright © 2014 Gallup, Inc. All rights reserved. 5
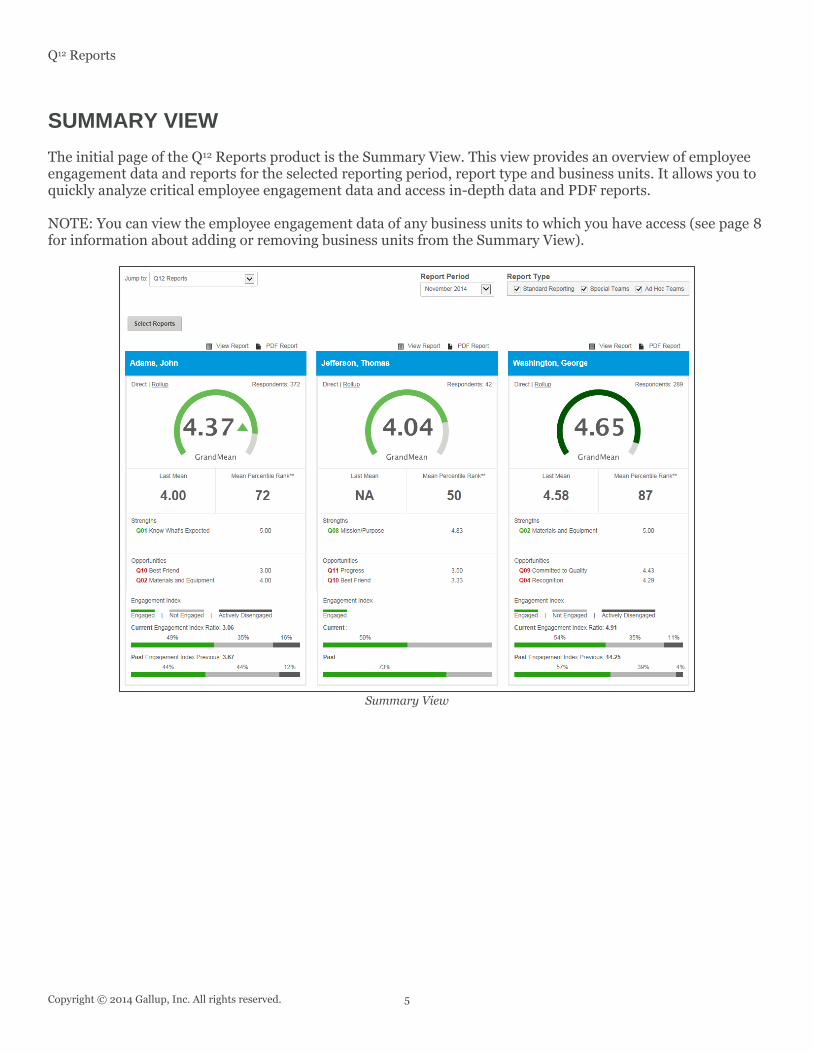
SUMMARY VIEW
The initial page of the Q12 Reports product is the Summary View. This view provides an overview of employee engagement data and reports for the selected reporting period, report type and business units. It allows you to quickly analyze critical employee engagement data and access in-depth data and PDF reports. NOTE: You can view the employee engagement data of any business units to which you have access (see page 8 for information about adding or removing business units from the Summary View).
Summary View

Q12 Reports
Copyright © 2014 Gallup, Inc. All rights reserved. 6
SUMMARY CARD
The Summary View primarily consists of Summary Cards for each of your selected business units. Click View Report above a Summary Card to display the business unit’s Scorecard View and access in-depth reporting data for the unit (see page 9 for information about the Scorecard View). Click PDF Report above a Summary Card to generate a PDF version of the business unit’s employee engagement report (see page 18 for information about printing and saving reports). A Summary Card displays the following information:
* One or two items may appear here, depending on your organization’s Gallup Online configuration.
The name of the business unit. Select to display the unit’s direct or rollup data. The average response, on a 5-point scale, across all Q12 items. The GrandMean from the previous survey. The highest scoring Q12 item relative to Gallup’s global database. * The current survey’s ratio of engaged respondents to actively disengaged respondents. The previous survey’s ratio of engaged respondents to actively disengaged respondents.
The number of respondents represented by the data (i.e., who completed the survey). Whether there was meaningful change in GrandMean values between survey periods, and whether the change was an increase or decrease. The percentile rank in Gallup’s global database of the current GrandMean. The two lowest scoring Q12 items relative to Gallup’s global database. * The current survey’s percentage of respondents who are engaged, not engaged or actively disengaged. The previous survey’s percentage of respondents who were engaged, not engaged or actively disengaged.

Q12 Reports
Copyright © 2014 Gallup, Inc. All rights reserved. 7
ADDITIONAL INFORMATION
Direct data represents the responses of individuals who report directly to the business unit.
Rollup data represents the responses of individuals who report directly and indirectly to the business unit.
The color of the GrandMean meter corresponds to percentile ranges in Gallup’s global database:
The GrandMean is greater than or equal to the 75th percentile.
The GrandMean is within the 50th to 74th percentile.
The GrandMean is within the 25th to 49th percentile.
The GrandMean is less than the 25th percentile.
For less than 1,000 respondents, meaningful change equates to a GrandMean difference of 0.2 or more.
For 1,000 respondents or more, meaningful change equates to a GrandMean difference of 0.1 or more.
Meaningful change does not appear if there was no previous survey or the current report does not qualify for past data.
The Strengths, Opportunities and Engagement Index sections appear depending on your organization’s Gallup Online configuration. Your organization may choose to include all, some or none of these sections.
The Engagement Index section does not appear if there are less than 30 respondents.
For 30-99 respondents, the Engagement Index section only displays the percentage of respondents who are engaged.
REPORT PERIOD AND TYPE
The upper-right corner of the Summary View displays the currently selected report period and type. Use the Report Period drop-down list to select a different reporting period, and use the Report Type check boxes to filter the data that appear on the page.
Report Period and Report Type options
Q12 Reports
Copyright © 2014 Gallup, Inc. All rights reserved. 8
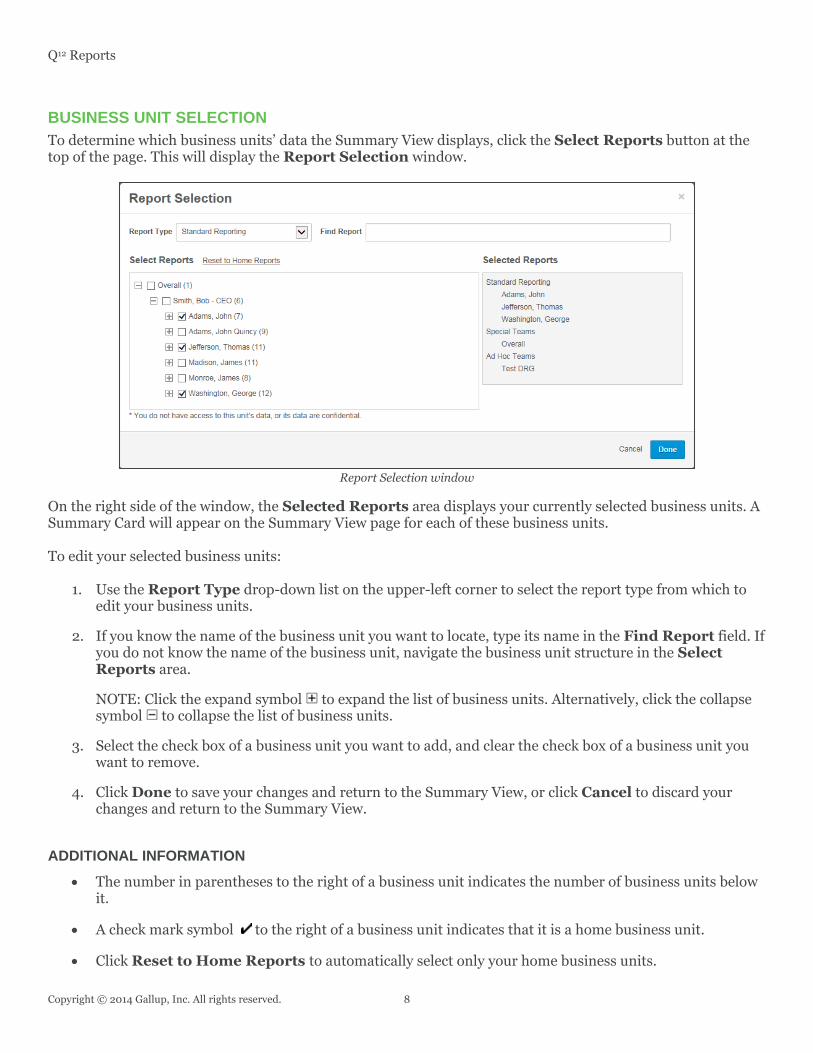
BUSINESS UNIT SELECTION
To determine which business units’ data the Summary View displays, click the Select Reports button at the top of the page. This will display the Report Selection window.
Report Selection window
On the right side of the window, the Selected Reports area displays your currently selected business units. A Summary Card will appear on the Summary View page for each of these business units. To edit your selected business units:
1. Use the Report Type drop-down list on the upper-left corner to select the report type from which to edit your business units.
2. If you know the name of the business unit you want to locate, type its name in the Find Report field. If you do not know the name of the business unit, navigate the business unit structure in the Select Reports area.
NOTE: Click the expand symbol to expand the list of business units. Alternatively, click the collapse symbol to collapse the list of business units.
3. Select the check box of a business unit you want to add, and clear the check box of a business unit you want to remove.
4. Click Done to save your changes and return to the Summary View, or click Cancel to discard your changes and return to the Summary View.
ADDITIONAL INFORMATION
The number in parentheses to the right of a business unit indicates the number of business units below it.
A check mark symbol to the right of a business unit indicates that it is a home business unit.
Click Reset to Home Reports to automatically select only your home business units.

Q12 Reports
Copyright © 2014 Gallup, Inc. All rights reserved. 9
SCORECARD VIEW
The Scorecard View of the Q12 Reports product provides detailed information about a business unit’s employee engagement data for the selected reporting period. It allows you to conduct an in-depth review of the survey data and generate PDF reports.
Scorecard View
The upper section of the Scorecard View displays the report period, report type and the business unit breadcrumb. You can use these options to view employee engagement data for different report periods or business units (see page 16 for information about selecting a business unit). To generate a PDF version of the business unit’s employee engagement report, click the print symbol on the upper-right corner of the page (see page 18 for information about printing and saving reports).
Scorecard View upper section
The middle section of the Scorecard View consists of the employee engagement summary data, which mirrors the data that appear on the business unit’s Summary Card in the Summary View (see page 6 for information

Q12 Reports
Copyright © 2014 Gallup, Inc. All rights reserved. 10
about the Summary Card data). The GrandMean values of comparison business units also appear here in the GrandMean area (see page 11 for information about selecting comparison units).
Scorecard View middle section
The lower section of the Scorecard View consists of three tabs: Survey Questions, Engagement Hierarchy and Indices.
SURVEY QUESTIONS
The Survey Questions tab offers a collective view of all the questions included on the survey. The information on this tab provides a convenient way of viewing engagement data for individual questions, as well as comparing data against other business units.
Survey Questions tab

Q12 Reports
Copyright © 2014 Gallup, Inc. All rights reserved. 11
The Survey Questions tab primarily consists of employee engagement data for each of the questions that appear on the survey. You can choose which data appear here by clicking Edit Columns on the upper-right corner of the tab (see page 14 for information about customizing columns). NOTE: For a list of available learning resources related to employee engagement, click Learn More on the upper-right corner of the tab. QUESTION SELECTION
At the top of the tab, you can select which data to view:
Q12 Questions View data for all of the Q12 items and the Overall Satisfaction item. Additional Questions View data for any custom questions included on the survey. All View data for all survey questions (i.e., Q12 items and custom questions).
NOTE: To learn more about a particular Q12 item, click the information symbol to the right of the item. This will display a tooltip box with the Q12 item’s full text and any relevant resources (e.g., a PDF or video about the question). COMPARISON UNITS
At the top of the tab, you can also choose to view other business units’ employee engagement data, allowing you to compare their data against that of the unit you are currently viewing. Comparison units’ data appear on the Survey Questions tab by default. Clear the check boxes of the units whose data you want to hide.
Comparison units

Q12 Reports
Copyright © 2014 Gallup, Inc. All rights reserved. 12
ENGAGEMENT HIERARCHY
The Engagement Hierarchy tab contains information pertaining to the Gallup Engagement Hierarchy. This hierarchy represents the stages an employee goes through on the path to complete engagement, and allows you to easily see where a business unit’s strengths and weaknesses lie in regards to employee engagement.
Engagement Hierarchy tab
Each hierarchy level displays the Q12 items that comprise it. To hide a level’s Q12 items, click its corresponding Collapse link on the right side of the page. You can also choose which data appear here by clicking Edit Columns on the upper-right corner of the tab (see page 14 for more information about customizing columns). NOTE: For a list of available learning resources related to employee engagement, click Learn More on the upper-right corner of the tab.

Q12 Reports
Copyright © 2014 Gallup, Inc. All rights reserved. 13
INDICES
The Indices tab lists available indices and their respective scores. Each index displays the questions that comprise it. To hide an index’s questions, click its corresponding Collapse link on the right side of the page. You can also choose which data appear here by clicking Edit Columns on the upper-right corner of the tab (see the following section for more information about customizing columns). NOTE: For a list of available learning resources related to employee engagement, click Learn More on the upper-right corner of the tab.
Indices tab

Q12 Reports
Copyright © 2014 Gallup, Inc. All rights reserved. 14
COLUMN CUSTOMIZATION
To customize which data appear on each of the Scorecard View tabs, click Edit Columns on the upper-right corner of a tab. This will display the Edit Columns window.
Edit Columns window
The Available Columns area lists the data columns available for you to view on the current Scorecard View tab. The Selected Columns area lists the data columns that will appear on the tab. The top-to-bottom order of the data columns in the Selected Columns area reflects their left-to-right order on the current Scorecard View tab.
To add a data column to the current Scorecard View tab, select it in the Available Columns area, and
then click the add button .
To remove a data column from the current Scorecard View tab, select it in the Selected Columns
area, and then click the remove button .
To change the order of a data column as it appears on the current Scorecard View tab, select the column
in the Selected Columns area, and then use the up button and down button to reposition the column.
Due to the width of the Scorecard View, you can only add a certain amount of data columns to the Selected Columns area. The bottom of the Edit Columns window indicates the amount of space available.

Q12 Reports
Copyright © 2014 Gallup, Inc. All rights reserved. 15
AVAILABLE COLUMNS
The following data columns are available on the Q12 Reports product’s Scorecard View tabs:
Total N The number of respondents. Current Mean The average response, on a 5-point scale. Last Mean The average response, on a 5-point scale, from the previous survey. Current Top Box The percentage of “5” (Strongly Agree/Extremely Satisfied) responses. Last Top Box The percentage of “5” (Strongly Agree/Extremely Satisfied) responses from the
previous survey. Gallup Overall The average response, on a 5-point scale, in Gallup’s overall database for the Mean n nth percentile. Gallup Overall The percentage of “5” (Strongly Agree/Extremely Satisfied) responses in Top Box n Gallup’s overall database for the nth percentile. Frequency The breakdown of percentages for each response. Distribution Meaningful Whether mean values increased, decreased, or remained the same between Change survey periods. The following symbols appear in this column:
For less than 1,000 respondents, the current mean is 0.2 or more greater than the last mean. For 1,000 respondents or more, the current mean is 0.1 or more greater than the last mean.
For less than 1,000 respondents, the current mean is 0.2 or more less
than the last mean. For 1,000 respondents or more, the current mean is 0.1 or more less than the last mean.
Mean Percentile The percentile rank in Gallup’s overall database of the current mean. Rank Top Box Percentile The percentile rank in Gallup’s overall database of the current top box value. Rank
ADDITIONAL INFORMATION
If there was no previous survey, NA appears for columns that require previous survey data.
The color of the Mean Percentile Rank and Top Box Percentile Rank values corresponds to percentile ranges in Gallup’s global database:
The value is greater than or equal to the 75th percentile.
The value is within the 50th to 74th percentile.

Q12 Reports
Copyright © 2014 Gallup, Inc. All rights reserved. 16
The value is within the 25th to 49th percentile.
The value is less than the 25th percentile.
BUSINESS UNIT SELECTION
The upper section of the Scorecard View provides options for selecting a different business unit, allowing you to view the employee engagement data of other business units to which you have access. These options include the Select Report button and the business unit breadcrumb.
Scorecard View upper section
SELECT REPORT
Click Select Report if you know the name of the business unit you want to select, or if you know its location in the hierarchy. This will display the Report Selection window.
Report Selection window
On the right side of the window, the My Reports area displays your current business unit. The Scorecard View currently displays employee engagement data for this unit. To select a business unit:
1. If you know the name of the business unit you want to select, type its name in the Find Report field. If you do not know the name of the business unit, navigate the business unit structure in the Select Report area.
NOTE: Click the expand symbol to expand the list of business units. Alternatively, click the collapse symbol to collapse the list of business units.
Q12 Reports
Copyright © 2014 Gallup, Inc. All rights reserved. 17
NOTE: The number in parentheses to the right of a business unit indicates the number of business units below it.
2. Click the name of the business unit you want to select.
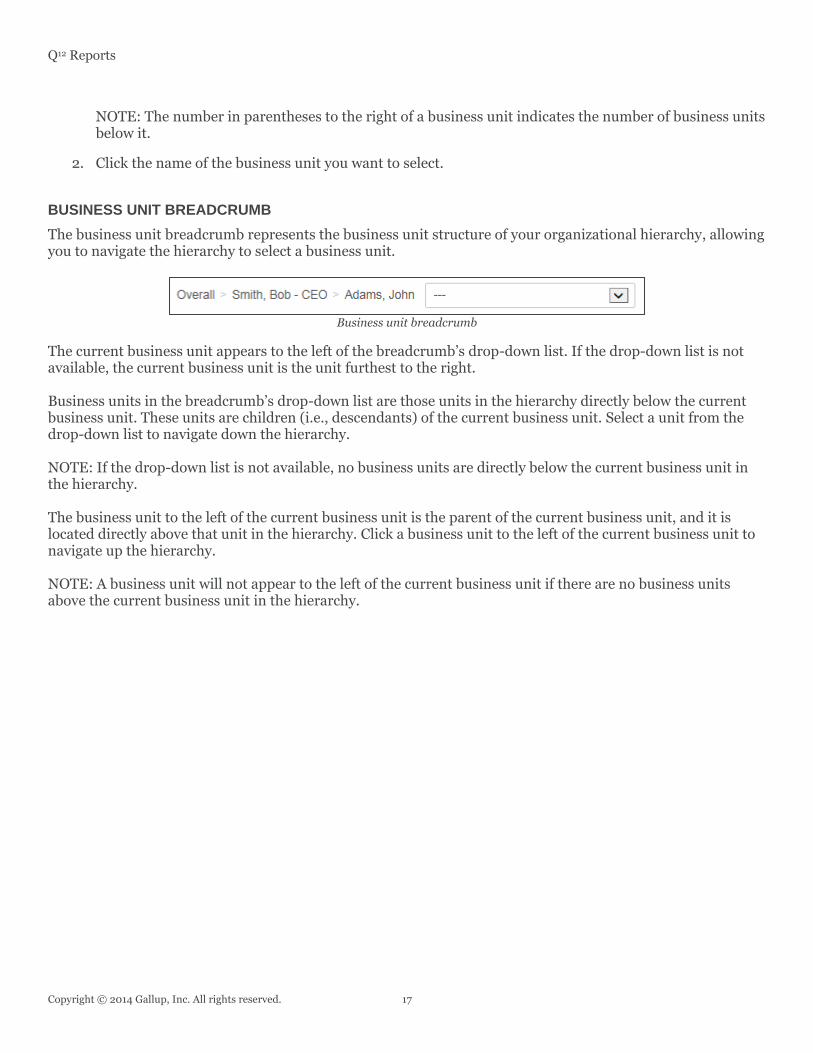
BUSINESS UNIT BREADCRUMB
The business unit breadcrumb represents the business unit structure of your organizational hierarchy, allowing you to navigate the hierarchy to select a business unit.
Business unit breadcrumb
The current business unit appears to the left of the breadcrumb’s drop-down list. If the drop-down list is not available, the current business unit is the unit furthest to the right. Business units in the breadcrumb’s drop-down list are those units in the hierarchy directly below the current business unit. These units are children (i.e., descendants) of the current business unit. Select a unit from the drop-down list to navigate down the hierarchy. NOTE: If the drop-down list is not available, no business units are directly below the current business unit in the hierarchy. The business unit to the left of the current business unit is the parent of the current business unit, and it is located directly above that unit in the hierarchy. Click a business unit to the left of the current business unit to navigate up the hierarchy. NOTE: A business unit will not appear to the left of the current business unit if there are no business units above the current business unit in the hierarchy.
Q12 Reports
Copyright © 2014 Gallup, Inc. All rights reserved. 18
PRINTING AND SAVING REPORTS
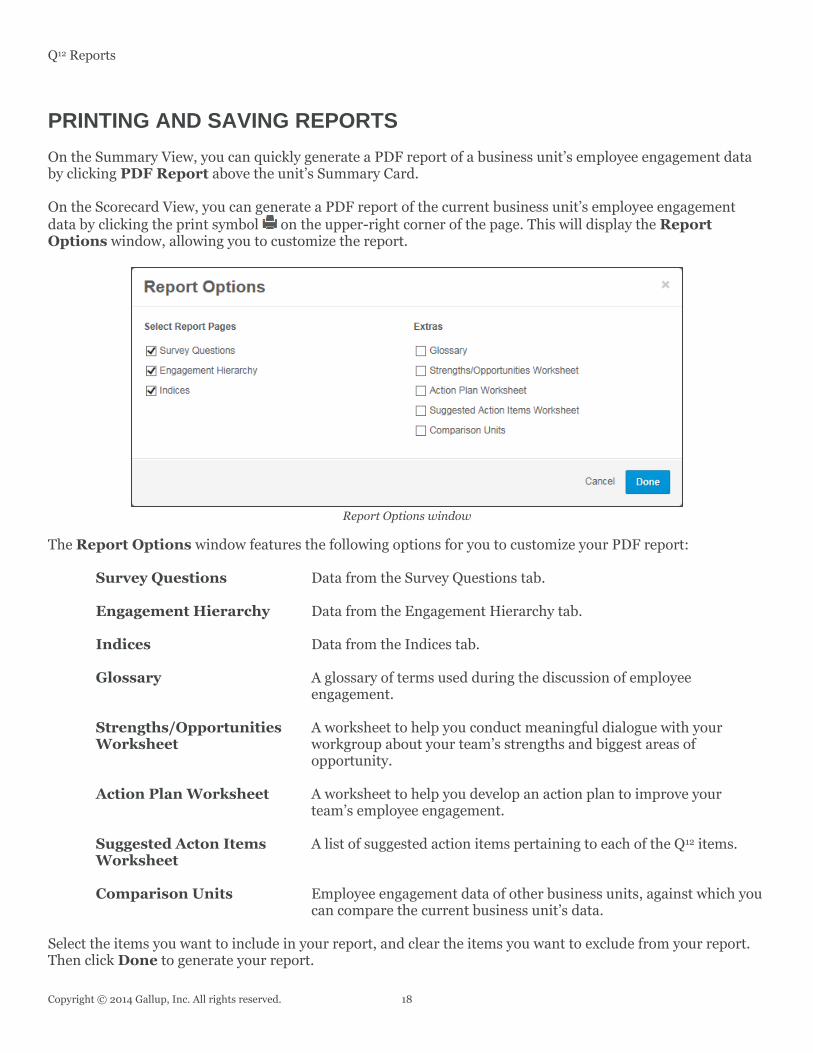
On the Summary View, you can quickly generate a PDF report of a business unit’s employee engagement data by clicking PDF Report above the unit’s Summary Card. On the Scorecard View, you can generate a PDF report of the current business unit’s employee engagement data by clicking the print symbol on the upper-right corner of the page. This will display the Report Options window, allowing you to customize the report.
Report Options window
The Report Options window features the following options for you to customize your PDF report:
Survey Questions Data from the Survey Questions tab. Engagement Hierarchy Data from the Engagement Hierarchy tab. Indices Data from the Indices tab. Glossary A glossary of terms used during the discussion of employee
engagement. Strengths/Opportunities A worksheet to help you conduct meaningful dialogue with your Worksheet workgroup about your team’s strengths and biggest areas of
opportunity. Action Plan Worksheet A worksheet to help you develop an action plan to improve your
team’s employee engagement. Suggested Acton Items A list of suggested action items pertaining to each of the Q12 items. Worksheet Comparison Units Employee engagement data of other business units, against which you
can compare the current business unit’s data. Select the items you want to include in your report, and clear the items you want to exclude from your report. Then click Done to generate your report.