gallup-mckinley county schools - nmpsfa.org
TRANSCRIPT

Gallup-McKinley County Schools
Five-Year Facilities Master Plan Update 2017-2022
FinalMay 2017
21606.0000
Architectural Research Consultants, Incorporated
Goals / Process
Existing and Projected Conditions
Capital Improvement Plan
Section 1
Section 2
Section 3
Volume 1

Board of Education
Charles Long, District 2 - PresidentKevin Mitchell, District 1 - Vice PresidentPriscilla Manuelito, District 3 - Secretary Christopher Mortensen, District 4 - MemberMichael Schaaf, District 5 - Member
Administration
Mike Hyatt - SuperintendentRon Triplehorn - Facilities and Technology DirectorDanny Radcliffe - Maintenance Director
FMP Steering Committee
Loria Carter - GMCS parent, IECRyan Dashner - Principal, Indian Hills ESRichard Ferguson - GMCS Zone 4 DirectorCarrie Lovato - Principal, Gallup MSJack McFarland - Principal, Hiroshi Miyamura HSDanny Radcliffe - GMCS Maintenance DirectorBill Sprick - PSFA, Facility PlannerRon Triplehorn - GMCS Facilities and Technology Director
Schools
Thank you to all principals, administrative assistants, custodians, school staff, teachers and students for giving us their time during the assessments
Credits
Architectural Research Consultants, Incorporated Albuquerque, New Mexico

Gallup-McKinley County Schools i May 2017 Facilities Master Plan 2017-2022 Draft FinalARC 21606.000
Table of ContentsIntroduction ..................................................................................................................... vAbbreviations and Definitions .......................................................................................... vi
1 Goals / Process .........................................................................................................1-11.1 Goals ..................................................................................................................1-11.2 Process ................................................................................................................1-3
2 Existing and Projected Conditions .............................................................................2-12.1 Programs ............................................................................................................2-12.2 Site / Facilities ....................................................................................................2-32.3 District Growth ................................................................................................2-112.4 Enrollment .......................................................................................................2-132.5 Utilization and Capacity ...................................................................................2-402.6 Technology .......................................................................................................2-512.7 Energy Management ........................................................................................2-512.8 Capital Funding ................................................................................................2-52
3 Capital Improvement Plan ........................................................................................3-13.1 Total Capital Needs ............................................................................................3-13.2 Prioritization Process ........................................................................................3-113.3 Capital Plan ......................................................................................................3-15

Gallup-McKinley County Schools ii May 2017 Facilities Master Plan 2017-2022 Draft FinalARC 21606.000
List of ExhibitsExhibit 1-1 Facilities Master Planning Process .......................................................1-3Exhibit 1-2 Stakeholder Participation and Roles ....................................................1-4Exhibit 2-1 Student Demographics Data .................................................................2-1Exhibit 2-2 School Grading and Status ...................................................................2-2Exhibit 2-3 Facility Ages ..........................................................................................2-4Exhibit 2-4 Overview of Capital Investments in GMCS Schools ...........................2-5Exhibit 2-5 Actual GSF/Student Compared with PSFA GSF/Student ..................2-6Exhibit 2-6 Facilities Inventory ................................................................................2-7Exhibit 2-7 Portables and Teacher Housing Inventory ............................................2-9Exhibit 2-8 District Boundaries .............................................................................2-10Exhibit 2-9 School Locations ................................................................................2-10Exhibit 2-10 GMCS Historic Enrollment ............................................................2-13Exhibit 2-11 GMCS Historic Enrollment by Grade ............................................2-14Exhibit 2-12 GMCS Historic Enrollment by School Level .................................2-14Exhibit 2-13 GMCS HS Assignment Areas .........................................................2-15Exhibit 2-14 ES Assignment Areas ......................................................................2-16Exhibit 2-15 ES Assignment Areas in Gallup ......................................................2-16Exhibit 2-16 MS and HS Assignment Areas in Gallup ........................................2-17Exhibit 2-17 Detailed Map of HS Assignment Areas in Gallup ..........................2-17Exhibit 2-18 GMCS Historic Gallup Subarea Enrollment ..................................2-18Exhibit 2-19 Elementary School Enrollment in Gallup Subarea ..........................2-19Exhibit 2-20 East Gallup ES Enrollment Chart ...................................................2-19Exhibit 2-21 West Gallup ES Enrollment Chart ..................................................2-20Exhibit 2-22 Outlying Gallup ES Enrollment Chart ...........................................2-20Exhibit 2-23 Middle School Enrollment in Gallup Subarea .................................2-21Exhibit 2-24 GMCS MS Enrollment Chart ........................................................2-21Exhibit 2-25 High School Enrollment in Gallup Subarea ....................................2-22Exhibit 2-26 High School Enrollment in Gallup Subarea ....................................2-22Exhibit 2-27 GMCS Enrollment in Other District Subareas ...............................2-23Exhibit 2-28 GMCS Enrollment by Other District Subarea Chart .....................2-24Exhibit 2-29 Crownpoint Schools Enrollment Chart ...........................................2-24Exhibit 2-30 Navajo Schools Enrollment Chart ...................................................2-25Exhibit 2-31 Ramah Schools Enrollment Chart ...................................................2-25Exhibit 2-32 Thoreau Schools Enrollment Chart..................................................2-26Exhibit 2-33 Tohatchi Schools Enrollment Chart ................................................2-26Exhibit 2-34 GMCS Other Schools and Programs Enrollment by Grade ...........2-27

Gallup-McKinley County Schools iii May 2017 Facilities Master Plan 2017-2022 Draft FinalARC 21606.000
Exhibit 2-35 State Charter Schools in GMCS .....................................................2-27Exhibit 2-36 GMCS Cohort Survival Ratios ........................................................2-28Exhibit 2-37 Enrollment Projections by Range ......................................................2-29Exhibit 2-38 Enrollment Projections by Grade ......................................................2-30Exhibit 2-39 Projected Enrollment by Level ..........................................................2-30Exhibit 2-40 Elementary School Enrollment Projections ......................................2-31Exhibit 2-41 Middle School Enrollment Projections .............................................2-31Exhibit 2-42 High School Enrollment Projections ................................................2-32Exhibit 2-43 Detailed ES Enrollment Projections by School and by Grade ..........2-33Exhibit 2-44 Detailed MS Enrollment Projections by School and by Grade .........2-36Exhibit 2-45 Detailed HS Enrollment Projections by School and by Grade .........2-36Exhibit 2-46 Crownpoint Detailed Enrollment Projections by School and by
Grade ................................................................................................................2-37Exhibit 2-47 Navajo Detailed Enrollment Projections by School and Grade ........2-38Exhibit 2-48 Ramah Detailed Enrollment Projections by School and Grade ........2-38Exhibit 2-49 Thoreau Detailed Enrollment Projections by School and Grade .......2-39Exhibit 2-50 Tohatchi Detailed Enrollment Projections by School and Grade .....2-39Exhibit 2-51 GMCS Capacity and Classroom Needs............................................2-41Exhibit 2-52 GMCS ES Utilization Analysis 2016-17 .........................................2-43Exhibit 2-53 GMCS MS and HS Utilization Analysis 2016-17 ...........................2-44Exhibit 2-54 GMCS School Capacities .................................................................2-45Exhibit 2-55 GMCS ES Transfers 2016-17 ..........................................................2-46Exhibit 2-56 Available Seats Analysis for Proposed Boundary Adjustment
and Current Enrollment Projections ................................................................2-49Exhibit 2-57 Summary of Capital Funding since the Last FMP ..........................2-53Exhibit 2-58 PSCOC Awards Since the Last FMP .............................................2-53Exhibit 2-59 ARC scores for GMCS Facility Conditions Since 2008 ..................2-54Exhibit 2-60 Future Financial Resources Available ................................................2-54Exhibit 2-61 Current Rankings with wNMCI Values ..........................................2-55Exhibit 3-1 Capital Needs by Facility ......................................................................3-1Exhibit 3-2 Funding Sources for Maintenance, CIPs and Broadband ....................3-2Exhibit 3-3 Comparative School District Facility Distances ....................................3-2Exhibit 3-4 Facility Needs by Site ............................................................................3-3Exhibit 3-5 Total Percentage Facility Score by School ............................................3-4Exhibit 3-6 Renewal Requirements..........................................................................3-5Exhibit 3-7 GMCS Facility Renewal Requirements by School ...............................3-7Exhibit 3-8 Prioritization Process ..........................................................................3-11

Gallup-McKinley County Schools iv May 2017 Facilities Master Plan 2017-2022 Draft FinalARC 21606.000
Exhibit 3-9 Prioritized Code Compliance ...........................................................3-12Exhibit 3-10 Capital Needs Sorted by Category Code .........................................3-12Exhibit 3-11 Prioritized Facility Renewal ............................................................3-13Exhibit 3-12 Prioritized Programmatic .................................................................3-13Exhibit 3-13 Prioritized Districtwide Funds ........................................................ 3-14Exhibit 3-14 Prioritized Transportation ................................................................3-14Exhibit 3-15 PSFA FAD-Ranked Schools ...........................................................3-16 Exhibit 3-16 Prioritization for Capital Plan Option 1 .........................................3-17

Gallup-McKinley County Schools v May 2017 Facilities Master Plan 2017-2022 Draft FinalARC 21606.000
IntroductionThis section discusses the goals for the desired
future state of the district’s educational programs and facilities.
This document is a Facilities Master Plan (FMP) Update for Gallup-McKinley County Schools. The intent of the plan is to guide capital planning decisions to support the district’s educational mission and meet state adequacy standards. The Public School Capital Outlay Council (PSCOC)/Public School Facilities Authority (PSFA) requires that all New Mexico public school districts have a five-year facility master plan as a prerequisite for eligibility to receive state capital outlay assistance. This master plan is in accordance with guidance issued by the PSCOC/PSFA.
The Facilities Master Plan serves as a flexible tool to present issues to the community, board of education, and district staff for input and revision on a periodic basis. Preparation of the FMP used a systematic process that strives to identify needs and wisely allocate capital resources to bring district facilities up to state adequacy standards and district policies with respect to:• Life/health/safety• Educational/programmatic needs
(additions and remodeling to meet various educational standards) and curriculum needs
• Renewal needs (replacement schools, remodeling, refurbishing, planning studies, deferred maintenance, and major system replacement)
• Provision for necessary growth (new schools, additions, remodeling, site acquisition, and design planning studies)
• Educational technology
The FMP addresses four major questions:• Where do we want to be? – identifies
district facility goals.• Where are we now? – identifies the
adequacy of district facilities and capacity to meet future needs.
• Where we are going? – analyzes information about future enrollment, program changes, classroom needs and financial resources.
• How do we get there? – identifies the gaps between existing conditions and the ideal future state, develops a strategy to meet needs, and presents a prioritized list of capital projects.
The master plan has four sections:• Section 1 – Goals / Process provides
information about district goals and the master planning process.
• Section 2 – Existing and Projected Conditions provides information about district facilities, demographics, enrollment, technology and capital resources.
• Section 3 – Capital Improvement Plan provides information about capital needs, district priorities and capital strategies.
• Section 4 – Master Plan Support Material and Appendix provides detailed information about district school and support facilities, growth/enrollment/utilization, facility evaluation and cost estimating data.

Gallup-McKinley County Schools vi May 2017 Facilities Master Plan 2017-2022 Draft FinalARC 21606.000
Abbreviations and Definitions
ADA Americans with Disabilities ActARC Architectural Research Consultants, IncorporatedELL English language learners
ES Elementary schoolFAD Facilities assessment database
FMAR Facility Maintenance Assessment ReportFMP Facilities master plan
GMCS Gallup-McKinley County SchoolsGO BOND General obligation bond
GSF Gross square feetHS High school
HVAC Heating, ventilation and air conditioningIEP Individualized education program
LEA Local Education AgencyM&O Maintenance and Operations
MS Middle schoolNMCI New Mexico Condition Index
PARCC Partnership for Assessment of Readiness for College and CareersPE Physical education
PED Public Education DepartmentPRE-K pre-kindergarten
PSCOC Public School Capital Outlay CouncilPSFA Public School Facilities AuthorityPTR Pupil/teacher ratio
SF Square feet

Gallup-McKinley County Schools 1-1 May 2017 Facilities Master Plan 2017-2022 Draft FinalARC 21606.000
This section discusses the goals for the desired future state of the district’s educational programs and facilities and the process for developing the facilities master plan.
1.1 Goals District mission
Gallup-McKinley County Schools (GMCS) will...• Empower students through partnerships
with parents, schools, and communities.• Develop students who are self-directed
life-long learners.• Promote the essential skills and positive
character traits.• Provide a safe and healthy environment.
District vision• The district’s vision is to grow students to
be productive citizens in a multicultural society.
District educational philosophy• Education is a continuous part of
the life process. It exists to help each student develop self-confidence, self-identity, creativity, and productivity so that the efficient and happy individual will hopefully continue in society as a dedicated and productive member.
• Education should provide rich and varied experience opportunities for all citizens.
(Source: Educational Specifications, GMCS Elementary Schools, October, 2012)
Five-year educational programmatic goals
The learning system of Gallup-McKinley County Schools is founded on the sound principle that every child can learn and succeed, and the system must meet the needs of all children by recognizing that student success for every child is the fundamental goal.
Specifically, the District Learning System will be designed and implemented to support student proficiency in content and process standards.
The Board shall give tribal officials and parents of Indian students the opportunity to comment on the participation of Indian students on an equal basis in the school program with all other students educated by the district. The New Mexico Bilingual Multicultural Education Act of 1973 ensures equal educational opportunities for students. It is designed to encourage the cognitive and effective development of students by:• Utilizing the cultural and linguistic
background of students in the curriculum;• Providing students with opportunities to
expand their conceptual and linguistic abilities and potentials in a successful and positive manner; and
• Teaching students to appreciate the value and beauty of cultural diversity. The Act provides for bilingual education, and the district is committed to provide equal educational opportunities to students.
(Source: GMCS Policy Manual)
1 Goals / Process
Gallup-McKinley County Schools 1-2 May 2017 Facilities Master Plan 2017-2022 Draft FinalARC 21606.000
Relationship between the school district and the community
The Board recognizes that the public has substantial resources of training and experience that could be useful to schools. The strength of the local district is in large measure determined by the manner and degree to which these resources are utilized in an advisory capacity and to the degree that these resources are involved in supporting the improvement of the local educational program.
(Source: GMCS Policy Manual)
Desired future state of the district’s facilities aligned with the statewide Adequacy Standards
Facilities Master Plan goals1. Ensure the safety and comfort of students,
staff and other users. 2. Address health and safety issues in a
timely manner.3. Work towards a better funded
maintenance system to minimize reactive maintenance and maximize preventive maintenance.
4. Support sustainability in design and operation of facilities. Furnish satisfying, productive, and quality indoor spaces that increase efficiencies in all systems to save energy and reduce operational and legacy costs.
5. Provide viable, community-oriented schools that enable staff and students to meet district vision and mission statements, and PED’s curricular requirements.
6. Support facility and site maintenance to extend the life of building systems.
7. Continue upgrading of older schools
as PSCOC award funding becomes available.
8. Support the implementation of the Educational Technology Plan.
9. Continue the program to fund and sources of funding for facility improvements to supplement state and taxation revenues.
10. Assess each capital project for efficiencies, lessons learned, sustainability opportunities, material choices for longevity and realized operational cost savings.
11. Address interim needs at schools without PSCOC awards through the district’s yearly small projects and deferred maintenance list.
12 Work towards right-sized schools across the district.
13. Continue the investment in administrative facilities.
Long-range (10-20 year) facility needs and educational program delivery trends
Priority in the development of facilities shall be based on identified educational needs and on programs developed to meet those needs.
The Board establishes these broad goals for development:
1. To integrate facilities planning with other aspects of planning in a comprehensive educational program.
2. To base educational specifications for school buildings on identifiable learner needs.
3. To design for sufficient flexibility to permit program modification or the installation of new programs.
4. To design school buildings as economically as feasible, providing

Gallup-McKinley County Schools 1-3 May 2017 Facilities Master Plan 2017-2022 Draft FinalARC 21606.000
Exhibit 1-1 Facilities Master Planning Process
that learner needs are effectively and adequately met by the design.
5. To involve the community, school staff members, available experts, and the latest in related current development and research in building plans and specifications.
6. To analyze life-cycle costs as they compare with capital expenditures versus a maintenance and operations expense projection.
7. To analyze the core facility as it relates to future expansion.
8. To design school buildings for community use when feasible.
(Source: GMCS Policy Manual)
1.2 ProcessFacilities Master Plan process
The Gallup-McKinley County Schools conducted a comprehensive assessment of district facilities and their ability to meet state and district standards, as well as accommodate existing and projected enrollments and programmatic needs. The district’s administrative staff managed the process and Architectural Research Consultants, Incorporated (ARC) conducted the evaluations and studies.
The FMP process is illustrated in Exhibit 1-1. The process for this FMP began in August, 2016 and continued through April, 2017.
District and School Staff
Collect facts describing• Present conditions Facility use and capacity Current use and utilization Surrounding context Adequacy to state
standards and district policy
• Future conditions Anticipated growth / change Facility requirements Capital resources
Inventory / Analysis of Conditions
CommunityDistrict and School Staff
Stakeholder Participation
Project Organization
Planning initiation
Collect historic and existing data
Document and communicate plan
Existing and projected conditions
Summary issues and drivers
Vision of future and strategies to accommodate future needs
Draft and final documents
ReportingSynthesis Alternatives & Strategies
Diagram of the FMP Process
• Determine vision for the future Goals Planning criteria Desired future state
• Determine gap between existing and desire future state
• Identify and explore alternatives
• Choose preferred alternative and refine plan
• Develop implementation strategy
Agree upon project goals, scope, workplace, budgets
Identify planning participants
Identify process for making decisions
Gather existing information
Board
FMP Steering Committee
Gallup-McKinley County Schools 1-4 May 2017 Facilities Master Plan 2017-2022 Draft FinalARC 21606.000
The evaluation of facility conditions is the foundation for the facilities master plan. The FMP field evaluation process took place in September through November 2016. ARC evaluated all schools while school was in session and synthesized information gathered from the community and stakeholders, from interviews and questionnaires, from visual inspections by architecturally trained staff, and from review of PSFA databases. ARC documented all building condition deficiencies and identified capital improvement costs to correct deficiencies. All capital needs were reviewed and validated with district staff and with the FMP steering committee.
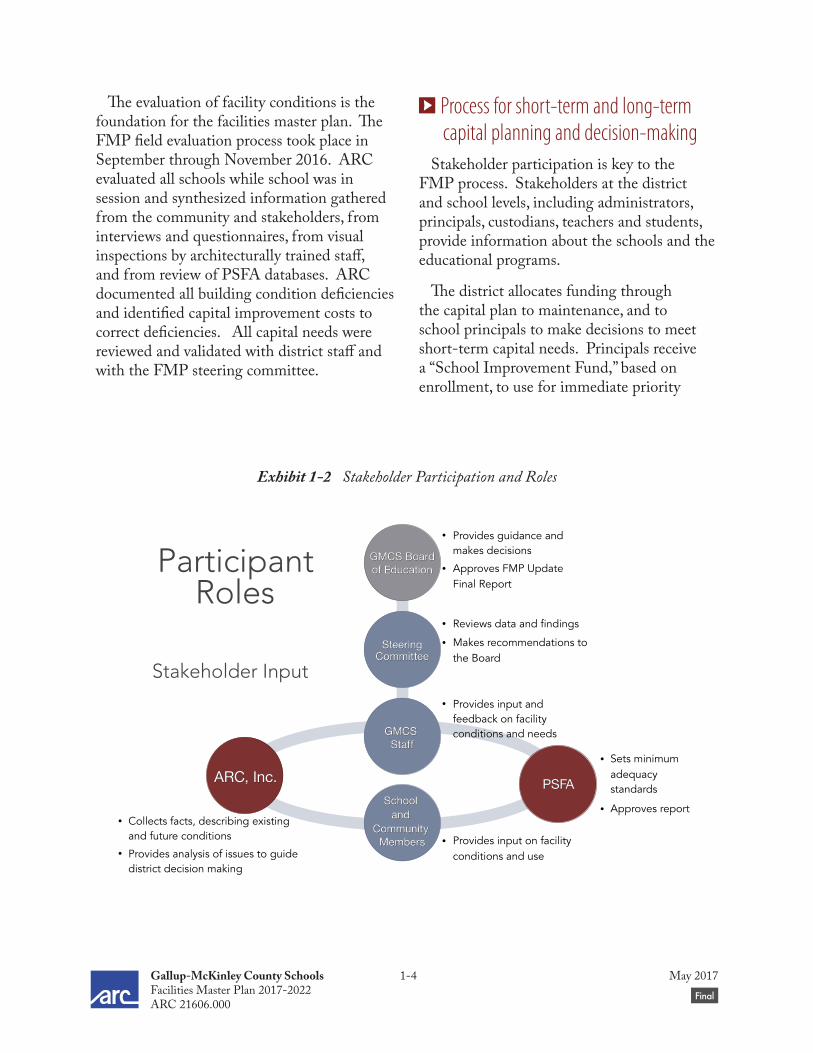
Process for short-term and long-term capital planning and decision-making
Stakeholder participation is key to the FMP process. Stakeholders at the district and school levels, including administrators, principals, custodians, teachers and students, provide information about the schools and the educational programs.
The district allocates funding through the capital plan to maintenance, and to school principals to make decisions to meet short-term capital needs. Principals receive a “School Improvement Fund,” based on enrollment, to use for immediate priority
Exhibit 1-2 Stakeholder Participation and Roles
• Provides guidance and makes decisions
• Approves FMP Update Final Report
• Reviews data and findings
• Makes recommendations to the Board
• Collects facts, describing existingand future conditions
• Provides analysis of issues to guide district decision making
• Sets minimum adequacy standards
• Approves report
• Provides input on facility conditions and use
• Provides input and feedback on facility conditions and needs
Stakeholder Input
Participant Roles
School and
Community Members
GMCS Boardof Education
GMCS Staff
SteeringCommittee
ARC, Inc. PSFASchool
and Community
Members
GMCS Boardof Education
GMCS Staff
SteeringCommittee
ARC, Inc. PSFA

Gallup-McKinley County Schools 1-5 May 2017 Facilities Master Plan 2017-2022 Draft FinalARC 21606.000
needs at schools. Principals often use the funds to meet immediate technology and program needs. Maintenance funds allow the maintenance department to address building system needs on a regular schedule and with flexibility to respond to emergencies.
The FMP process facilitates the district’s long-term capital planning. Exhibit 1-2 illustrates participant roles in the decision-making process for the GMCS FMP Update.
The FMP steering committee was comprised of principals from each school level, a district administrator, maintenance, facilities and technology directors, PSFA staff and a parent and IEC member. The steering committee held three meetings, reviewed FMP goals and all findings, prioritized projects and forwarded a capital plan recommendation to the Board.
The Board of Education has the authority to approve the 5-Year Facility Master Plan Update.
Community inputGMCS recognizes that the success of the
this FMP and the implementation of projects depend on strong partnerships with the local communities in Gallup and the county, with parents, students and the school communities, and with the State of New Mexico.
Stakeholder participation occurs at all stages of the planning process, which provides the district and the community with multiple opportunities to review and study information and to make decisions. ARC engages community input through the following methods.• Schools
– Online principal questionnaire – School site interview with principal – Teacher, student and custodian site
input during site evaluations• District
– FMP goal setting exercises – Department interviews – Site visits – Meetings to review findings
• Community – Community input meeting – Presentation to Indian Education
Committee (by district staff ) – Steering committee meetings – Meetings with community members,
city planners, for growth study• School Board (public meetings)
– Workshop presentation of findings – Review and approval of FMP

Gallup-McKinley County Schools 1-6 May 2017 Facilities Master Plan 2017-2022 Draft FinalARC 21606.000
This page is intentionally blank.

Gallup-McKinley County Schools 2-1 May 2017 Facilities Master Plan 2017-2022 Draft FinalARC 21606.000
2 Existing and Projected Conditions
This section provides an overview of the district’s current educational programs and facilities configuration, and community involvement.
2.1 Programs Gallup-McKinley County Schools programs
serve 11,409 students from preschool through grade 12, including programs for students through age 22 to graduate and learn life skills.
GMCS offers a full day preschool and pre-K program. The preschool program is a federally funded program (through IDEA) to provide services to children with identified developmental delays starting at age 3. The students have an individualized education program (IEP), allowing facilities to receive state funding. The pre-K program provides preschool education to children starting at age 4 and is funded by a state grant. PSCOC does not fund facilities for the pre-K program.
All district schools receive Title 1 federal funding. GMCS serves a high percentage of
economically disadvantaged students, as determined by eligibility for Free or Reduced Price Lunch Program; 92.3% of students in the GMCS Local Education Agency (LEA) were economically disadvantaged in the 2015/16 school year. NMPED reports that 79.5% of students are American Indian, 28% are English Language Learners (ELL) and 12.6% are students with disabilities.
The New Mexico Public Education Department grades the school educational programs. Overall, school grades at GMCS reveal consistent growth in student performance in Partnership for Assessment of Readiness for College and Careers (PARCC) scores. The district received a C grade overall. See Exhibit 2-2 for the current NMPED grades for GMCS schools.
2.1.1 Number of Schools, Types and Grade Configuration
GMCS has 40 sites and campuses for school, administrative and support facilities, including teacher housing. The district
School Grading is part of state and federal law that mandates accountability for all public schools. The Elementary and Secondary Education Act (ESEA) enacted in 1965 requires schools to show annual improvement in mathematics and reading. New Mexico statute specifies additional requirements that schools demonstrate progress through an A-F letter grade for each school. Individual school report cards can be found online at http://aae.ped.state.nm.us/.
NEW MEXICO PUBLIC EDUCATION DEPARTMENT Gallup McKinley County Schools
What are school grades?
What are School District Report Cards?
Definitions and Abbreviations
Each LEA under the jurisdiction of the Public Education Department (PED) annually receives a comprehensive report of their achievement, accountability, teacher qualifications, and post-secondary success. This report is compiled for 89 districts that include regular and locally authorized charter schools, and all state-authorized charter schools. Non-PED schools are exempt from both school grading and School District Report Cards and include private, home, and Bureau of Indian Education schools.
What is contained in this report?
This report provides a concise summary of the LEA and its schools:
LEA Demographic ProfileAccountability Summaries of School Grades Cohort Graduation Rates (4, 5, and 6 Year) Status of Non-GraduatesAchievement Proficiencies in Reading, Mathematics, and Science NAEP Statewide Summary for Grades 4 and 8School Board Member TrainingBudgeted ExpendituresTeacher CredentialsPost-Secondary Achievement (College Going, Credit Accumulation)Parent Survey on the Quality of Education
Local Educational Authority is a broad term that encompasses districts with multiple schools or independent state-authorized charter schools. Locally authorized charter schools are not LEAs and are reported with their parent district.
Asian: Afr Am: Amer Indian:Cauc:ELL: ED:
SWD: Q1:
Q3:
Schools with students most economically disadvantaged (top 25%) and least disadvantaged (bottom 25%).
These are ELL students new to U.S. schools who qualify for exemption from the reading assessment.
Asian or Pacific IslanderAfrican AmericanAmerican IndianCaucasianEnglish Language LearnersEconomically Disadvantaged as determined by eligibility for Free or Reduced Price Lunch ProgramStudents with disabilities; does not include special education students who are giftedThe lowest performing 25% (one quarter) of students in reading or mathematicsThe higher performing 75% (three quarters) of students in reading or mathematics
LEA
Subgroups
Recently Arrived
School District Report Card 2015-2016
High/Low Poverty Schools
164,149171,545
82,1167,302
205,8534,345
35,543
240,43849,72948,275
329
48.951.124.5
2.261.3
1.310.6
71.614.814.4
0.1
5,7215,965
61332
1,641102
9,291
10,7861,4703,268
0
49.051.0
5.20.3
14.00.9
79.5
92.312.628.0
0.014,844 4.41,580 13.5
Student Demographics
Number % Number %
StateLEA
CaucasianAfrican AmericanHispanicAsianAmerican Indian
ELLSWDED
MigrantRecently Arrived
FemaleMale
Source: LEA 120th-day submission to the PED
100.0 100.0All Students 335,69411,686
Pacific IslanderMultiracial
0.10.0
70 0.0
0.253512
4
36
11.1
7 19.4
4 11.1
C
School Grading SummaryDistrict Grade
Schools Rated in District
Schools in Priority Status
Schools in Focus Status
Schools in Strategic Status
0 0.0Schools in Reward Status
Total Number Percent
Source: PED Accountability Bureau
100.0
The district grade is determined by the average of school grades in the district. For a description of status, see page 2.
Gallup McKinley County Schools School District Report Card 2015-2016Page 1 of 9
Exhibit 2-1 Student Demographics Data
Source: NMPED School District Report Card 2015-2016

Gallup-McKinley County Schools 2-2 May 2017 Facilities Master Plan 2017-2022 Draft FinalARC 21606.000
operates 35 schools, including 18 elementary schools, seven middle schools, eight high schools, one alternative school, and one charter school, which is located in facilities at the UNM Gallup campus.
School configurations are:• Elementary Schools - all preschool-5
– Catherine A. Miller ES – Chee Dodge ES – Crownpoint ES – David Skeet ES – Del Norte ES (opened 2017) – Indian Hills ES – Jefferson ES – Juan de Oñate ES (closed 2017) – Lincoln ES – Navajo ES – Ramah ES (replaced 2017) – Red Rock ES – Rocky View ES
– Roosevelt ES – Stagecoach ES – Thoreau ES – Tobe Turpen ES – Tohatchi ES – Twin Lakes ES – Washington ES (closed 2017)
• Middle Schools - all grades 6-8 – Chief Manuelito MS – Crownpoint MS – Gallup MS – John F. Kennedy MS – Navajo MS – Thoreau MS – Tohatchi MS
• High Schools – Crownpoint HS, grades 9-12 – Gallup HS, grades 9-12 – Hiroshi Miyamura HS, grades 9-12 – Navajo Pine HS, grades 9-12
Accountability - School Grading and StatusStatus refers to schools that are in some form of improvement that requires increased monitoring and educational enhancement. The improvement categories are *** Priority Status (5% of schools that are lowest performing) ** Focus Status (additional 10% of schools that are low performing with large gaps between lower and higher performing groups) * Strategic Status (additional 10% of schools that are low performing with large gaps between lower and higher performing groups) ^ Reward Status (the top 5% of schools in the state)A school's status is footnoted next to its overall letter grade and, where blank, means the school is not in any status. Only schools receiving Title I funds are eligible, which in 2016 represented 654 schools.
SchoolOverallGrade School
OverallGrade
Achievement - Proficiency Summaries by GradeThe assessments were developed to measure grade-level standards that New Mexico educators and the public determined are important for students to master. Results include all students enrolled within the LEA or school, regardless of whether for a full academic year or not. Students are assessed in reading and mathematics in grades 3-11 and in science in grades 4, 7, and 11. Note that proficiencies do not include the assessment for grades KN, 1 and 2.
Reading Mathematics Science
Proficient(%)Grade
NotProficient
(%)Proficient
(%)
NotProficient
(%)Proficient
(%)
NotProficient
(%)
State Current3 7075 3025State Prior3 7474 2626
LEA Current3 8188 1912LEA Prior3 8390 1710
State Current4 7775 572325 43State Prior4 8176 571924 43
LEA Current4 8387 801713 20LEA Prior4 8988 801112 20
State Current5 7575 2625State Prior5 7976 2124
LEA Current5 8185 1915LEA Prior5 8987 1113
State Current6 8076 2024State Prior6 8178 1922
LEA Current6 8883 1217LEA Prior6 9390 710
State Current7 8277 551823 45State Prior7 8579 601521 40
LEA Current7 9284 76 816 24
Chee Dodge Elementary C * Chief Manuelito Middle BChurch Rock Elementary D ** Crownpoint Elementary C ***Crownpoint High C Crownpoint Middle ADavid Skeet Elementary B * Gallup Central Alternative C **Gallup High C ** Gallup Middle BIndian Hills Elementary A Jefferson Elementary CJohn F Kennedy Middle B Juan de Onate Elementary C ***Lincoln Elementary B Middle College High Charter BMiyamura High C Navajo Elementary D **Navajo Middle D Navajo Pine High C **Ramah Elementary D ** Ramah High CRed Rock Elementary B Rocky View Elementary C ***Roosevelt Elementary D Stagecoach Elementary D **Thoreau Elementary B Thoreau High CThoreau Middle D Tobe Turpen Elementary C *Tohatchi Elementary C Tohatchi High BTohatchi Middle C *** Tse Yi Gai High BTwin Lakes Elementary C * Washington Elementary C
Gallup McKinley County Schools School District Report Card 2015-2016Page 2 of 9
Exhibit 2-2 School Grading and Status

Gallup-McKinley County Schools 2-3 May 2017 Facilities Master Plan 2017-2022 Draft FinalARC 21606.000
– Ramah Mid-HS, grades 6-12 – Thoreau HS, grades 9-12 – Tohatchi HS, grades 9-12 – Tse’Yi’Gai HS, grades 8-12
• Alternative High Schools – Gallup Central Alternative HS, grades
9-12• Charter Schools
– Middle College HS, grades 10-12
2.1.2 Assumptions / Anticipated Changes in Programs
Since its last FMP, the district has implemented a capital program to replace older elementary schools in partnership with the state PSCOC. This program has included the consolidation of schools in the Gallup area. Washington ES and Juan de Oñate ES will close when Del Norte ES opens. The district will demolish Washington ES to complete the Del Norte ES campus. The district plans to rebuild Lincoln ES and demolish the old facilities. When this school opens, the district will close Roosevelt ES.
A boundary adjustment was approved in 2014, but has not yet been implemented. ARC reviewed the proposed boundaries, and based on current enrollment projections, recommends that the district redo the boundary study to balance Gallup elementary school enrollments.
In 2016, GMCS changed the preschool and pre-K programs from half day to full day. The effect of this change was a reduction in enrollment. Demand for preschool services remains strong, especially in the county communities.
Tse’Yi’Gai HS has expanded its program to accept 8th grade students.
See Section 2.5.2 for additional information on programs and PTRs.
2.1.3 Shared / Joint Use FacilitiesThe district shares facilities with the
community after school hours for community programs.
School-based health clinics are located at Crownpoint HS, Thoreau HS, Tse’Yi’Gai HS, and Crownpoint MS. These clinics share use of the student health office or suite, and require separate, locked storage to meet their program needs. The student health suites need facilities to meet personal hygiene needs in a safe manner.
The city aquatic center is located on district-owned property.
The district has excess GSF at several facilities, creating the opportunity to increase joint use of facilities in the future.
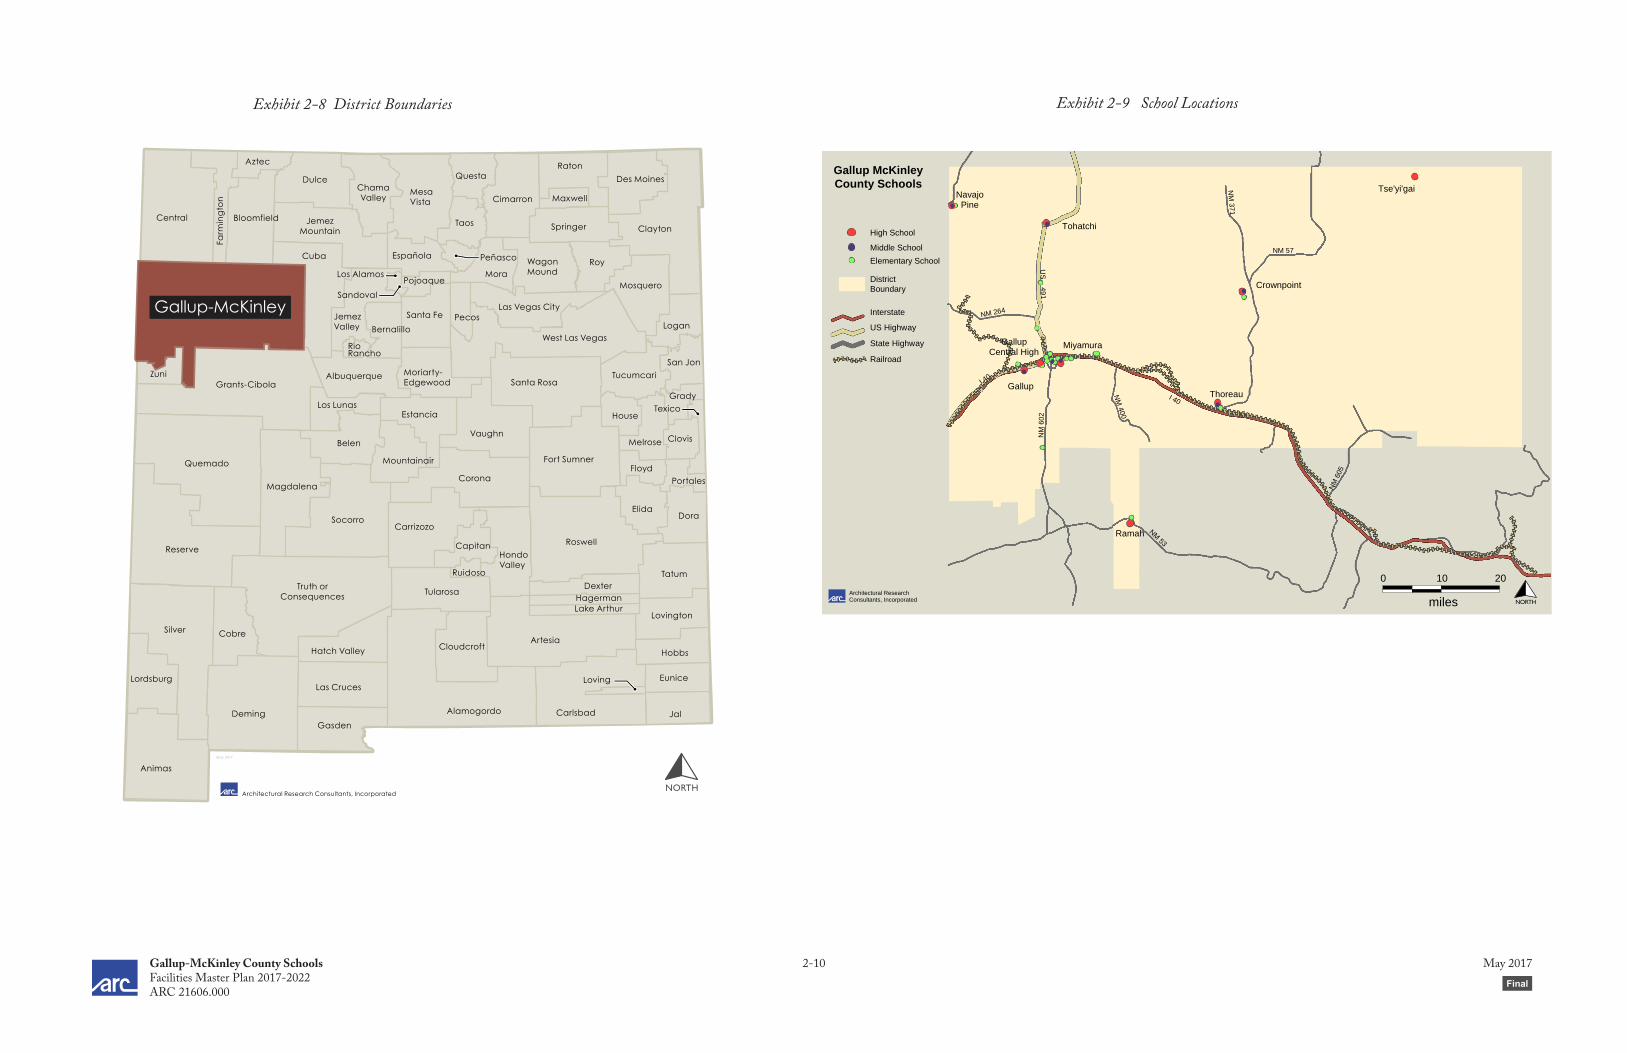
2.2 Site / Facilities2.2.1 Location
GMCS is the largest district by land area in the state of New Mexico. The district includes all of McKinley County in west central New Mexico (see location map, Exhibit 2-8). The district encompasses the city of Gallup and a large area of the Navajo Nation, serving over 90 distinct communities. GMCS operates schools in seven communities and has Memorandums of Understanding to transport students across district boundaries to GMCS schools.
2.2.2 Existing Site / FacilitiesThe district has over 2.5 million square

Gallup-McKinley County Schools 2-4 May 2017 Facilities Master Plan 2017-2022 Draft FinalARC 21606.000
feet of permanent facilities, and over 82,000 square feet of portable facilities in school and administrative facilities on about 745 acres. Exhibit 2-6 includes an inventory of all district sites and facilities.
School sites comprise 2.4 million square feet in permanent buildings and 70,000 square feet in portable buildings on 717 acres. The district has land leases with the Navajo Nation for schools located in Navajo, Crownpoint, Tohatchi, Twin Lakes, Tse’Yi’Gai, Thoreau, and Chichiltah.
Administrative facilities comprise 32,000 square feet of permanent buildings and 7,000 square feet in portables on 10 acres of land.
The district owns teacher housing in five communities. It also owns vacant facilities and stored portables throughout its area.
There is some vacant, undeveloped land in the district.
School facilities range in age from 0 to 63 years, and the distribution of facility ages is fairly evenly spread (see Exhibit 2-3). The average facility age is 23 years old. Five years ago, the average age of facilities was 29 years; the decrease reflects the ongoing capital program to replace older facilities. With 34 school facilities, the district needs to address the replacement of three or four facilities in each five-year FMP to keep pace with the aging of buildings over their 50- to 60-year life cycle.
ARC prepared an overview of recent capital investments in GMCS schools showing facility location and age (Exhibit 2-4). Investments have been well distributed throughout the district communities.
Del Norte Elementary SchoolRamah Elementary School
Catherine A. Miller Elementary SchoolJefferson Elementary School
Crownpoint Elementary SchoolThoreau Middle School
Hiroshi Miyamura High SchoolTohatchi Elementary School
Gallup Middle SchoolJohn F. Kennedy Middle SchoolChief Manuelito Middle School
Navajo Middle SchoolRamah Mid / High School
Indian Hills Elementary SchoolTwin Lakes Elementary School
Tse'Yi'Gai High SchoolTohatchi Middle School
Navajo Elementary SchoolTobe Turben Elementary School
Gallup High SchoolRocky View Elementary SchoolDavid Skeet Elementary SchoolStagecoach Elementary School
Chee Dodge Elementary SchoolNavajo Pine High SchoolCrownpoint High School
Thoreau High SchoolTohatchi High School
Crownpoint Middle SchoolRed Rock Elementary SchoolRoosevelt Elementary School
Lincoln Elementary SchoolThoreau Elementary School
Gallup Central Alternative High School
0 14 28 42 56 70
636262
585150
3937
333029
2726
2320
171514131313121110
888
665
1100
Maintenance and life cycle needs
Rebuild and renovation needs
10
Exhibit 2-3 Facility Ages

Gallup-McKinley County Schools 2-5 May 2017 Facilities Master Plan 2017-2022 Draft FinalARC 21606.000
LegendFacility age < 20 yearsFacility age 20 - 40 yearsFacility age > 40 yearsFacility funded for capital investments
Overview of Capital Improvements by area - 10 years
Area School Facility ageCapital
InvestmentProject Year of work
Entry Security
Synthetic Field
Track Upgrade
New Roof
Crownpoint ES 5 ✔ New school 2012 ✔
Crownpoint MS 50 ✔ New addition 2007 ✔
Crownpoint HS 33 ✔ Roof 2013 ✔ ✔ ✔
Crownpoint teacherages ✔ New units
Tohatchi ES 8 ✔ New school 2009 ✔
Twin Lakes ES 13
Tohatchi MS 14 ✔
Tohatchi HS 39 ✔ Gym roof 2011 ✔ ✔ ✔
Tohatchi teacherages ✔ New units
Navajo ES 15 ✔
Navajo MS 11 ✔
Navajo Pine HS 30 ✔ Roof 2013 ✔ ✔ ✔
Navajo teacherages New units
Thoreau ES 62 ✔ New school Funded
Thoreau MS 6 ✔ New school 2011
Thoreau HS 37 ✔ Roof 2012 ✔ ✔ ✔
Thoreau teacherages New units
Ramah ES 0 ✔ New school 2017 ✔
Ramah MS / HS 12
Tse'Yi'Gai HS 13 ✔
Tse'Yi'Gai teacherages ✔ New units
Chee Dodge ES 29 ✔
Catherine A Miller ES 1 ✔ New school 2016
David Skeet ES 26 ✔
Del Norte ES 0 ✔ New school 2017
Indian Hills ES 13 ✔
Jefferson ES 1 ✔ New school 2016
Juan de Oñate ES 40 Close school
Lincoln ES 62 ✔ New school Funded
Red Rock ES 51 ✔
Rocky View ES 23 ✔
Roosevelt ES 58 Close school
Stagecoach ES 27 ✔
Tobe Turpen ES 17 ✔
Washington ES 52 Demolish
Chief Manuelito MS 10 ✔ New school 2007 ✔
Gallup MS 8 ✔ Upgrade 2009 District stadium
JFK MS 8 ✔ New and upgrade 2009
Gallup HS 20 ✔ Structural and drainage 2016 ✔
Hiroshi Miyamura HS 6 ✔ New and upgrade 2011 ✔
Gallup Central Alt HS 63
Ra
ma
hTs
e'Y
i'Ga
iG
allu
p
Projects - accommplishments since the last FMPFacility capital investments over 10 years
Cro
wn
po
int
Toh
atc
hi
Na
vajo
Tho
rea
u
Exhibit 2-4 Overview of Capital Investments in GMCS Schools
LegendFacility age < 20 yearsFacility age 20 - 40 yearsFacility age > 40 yearsFacility funded for capital investments
Overview of Capital Improvements by area - 10 years
Area School Facility ageCapital
InvestmentProject Year of work
Entry Security
Synthetic Field
Track Upgrade
New Roof
Crownpoint ES 5 ✔ New school 2012 ✔
Crownpoint MS 50 ✔ New addition 2007 ✔
Crownpoint HS 33 ✔ Roof 2013 ✔ ✔ ✔
Crownpoint teacherages ✔ New units
Tohatchi ES 8 ✔ New school 2009 ✔
Twin Lakes ES 13
Tohatchi MS 14 ✔
Tohatchi HS 39 ✔ Gym roof 2011 ✔ ✔ ✔
Tohatchi teacherages ✔ New units
Navajo ES 15 ✔
Navajo MS 11 ✔
Navajo Pine HS 30 ✔ Roof 2013 ✔ ✔ ✔
Navajo teacherages New units
Thoreau ES 62 ✔ New school Funded
Thoreau MS 6 ✔ New school 2011
Thoreau HS 37 ✔ Roof 2012 ✔ ✔ ✔
Thoreau teacherages New units
Ramah ES 0 ✔ New school 2017 ✔
Ramah MS / HS 12
Tse'Yi'Gai HS 13 ✔
Tse'Yi'Gai teacherages ✔ New units
Chee Dodge ES 29 ✔
Catherine A Miller ES 1 ✔ New school 2016
David Skeet ES 26 ✔
Del Norte ES 0 ✔ New school 2017
Indian Hills ES 13 ✔
Jefferson ES 1 ✔ New school 2016
Juan de Oñate ES 40 Close school
Lincoln ES 62 ✔ New school Funded
Red Rock ES 51 ✔
Rocky View ES 23 ✔
Roosevelt ES 58 Close school
Stagecoach ES 27 ✔
Tobe Turpen ES 17 ✔
Washington ES 52 Demolish
Chief Manuelito MS 10 ✔ New school 2007 ✔
Gallup MS 8 ✔ Upgrade 2009 District stadium
JFK MS 8 ✔ New and upgrade 2009
Gallup HS 20 ✔ Structural and drainage 2016 ✔
Hiroshi Miyamura HS 6 ✔ New and upgrade 2011 ✔
Gallup Central Alt HS 63
Ra
ma
hTs
e'Y
i'Ga
iG
allu
p
Projects - accommplishments since the last FMPFacility capital investments over 10 years
Cro
wn
po
int
Toh
atc
hi
Na
vajo
Tho
rea
u
The table below is an overview of capital investments and shows facility location and age.

Gallup-McKinley County Schools 2-6 May 2017 Facilities Master Plan 2017-2022 Draft FinalARC 21606.000
Facility SizeThe size of many schools in the district is
large, providing a high GSF per student when compared to the state adequacy standard (as determined by the PSFA Adequacy Planning Guide Appendix A: Maximum Building Gross Square Footage (GSF) per Student table and the PSFA GSF calculator workbook). The table below compares the actual GSF/student for district schools with the PSFA GSF / Student to Adequacy. The
table compares the current size of the school with the maximum school size for a new school with the same enrollment.
The excess GSF over adequacy districtwide, or the difference between existing school size and maximum PSFA school size, is 838,939 GSF. Using an average cost per GSF for maintenance and operations of $7.50 per GSF (from PSFA cost data), the district could realize savings over $6 million by reducing the size of the schools to adequacy standards.
Exhibit 2-5 Actual GSF/Student Compared with PSFA GSF/Student
School 2016-17 Enrollment
GSF/Student
PSFA GSF/Student to Adequacy
Existing GSF2017 PSFA Standards
GSF
Catherine A. Miller Elementary 386 127.1 133 49,058 51,332
Chee Dodge Elementary School 317 183.1 136 58,036 43,187
Crownpoint Elementary School 348 138.2 135 48,108 46,902
David Skeet Elementary School 185 233.1 142 43,124 26,355
Del Norte Elementary School* 453 89.6 130 40,603 58,812
Indian Hills Elementary School 291 201.1 137 58,506 40,002
Jefferson Elementary School 338 179.9 135 60,795 45,714
Lincoln Elementary School - existing campus 233 176.0 140 41,005 32,666
Navajo Elementary School 268 215.4 139 57,728 37,131
Ramah Elementary School 183 162.2 143 29,675 26,087
Red Rock Elementary School 386 125.4 133 48,411 51,332
Rocky View Elementary School 320 158.9 136 50,855 43,551
Roosevelt Elementary School 202 182.7 142 36,911 28,615
Stagecoach Elementary School 308 198.9 137 61,250 42,092
Thoreau Elementary School 319 144.1 136 45,979 43,430
Tobe Turpen Elementary School 415 123.2 132 51,110 54,622
Tohatchi Elementary School 209 274.0 141 57,257 29,538
Twin Lakes Elementary School 200 210.6 142 42,129 28,350
Chief Manuelito Middle School 608 183.7 135 111,696 81,955
Crownpoint Middle School 144 350.7 164 50,498 23,626
Gallup Middle School 415 180.1 147 74,740 60,993
John F. Kennedy Middle School 663 179.2 131 118,779 87,068
Navajo Middle School 128 395.8 165 50,657 21,130
Thoreau Middle School 232 248.5 159 57,663 36,776
Tohatchi Middle School 189 242.8 161 45,894 30,473
Crownpoint High School 254 355.8 197 90,361 49,979
Gallup High School 925 330.6 137 305,830 126,533
Hiroshi Miyamura High School 1,170 169.6 115 198,476 134,427
Navajo Pine High School 140 553.0 207 77,415 28,974
Ramah High School 192 335.6 202 64,430 38,843
Thoreau High School 361 321.8 187 116,170 67,580
Tohatchi High School 277 484.3 195 134,143 53,935
Tse'Yi'Gai High School 113 565.5 209 63,898 23,659
Gallup Central Alternative High School 237 170.5 198 40,412 46,994
Totals 11,409 240.9 152.3 2,481,602 1,642,663
Gallup-McKinley County Schools 2-7 May 2017 Facilities Master Plan 2017-2022 Draft FinalARC 21606.000
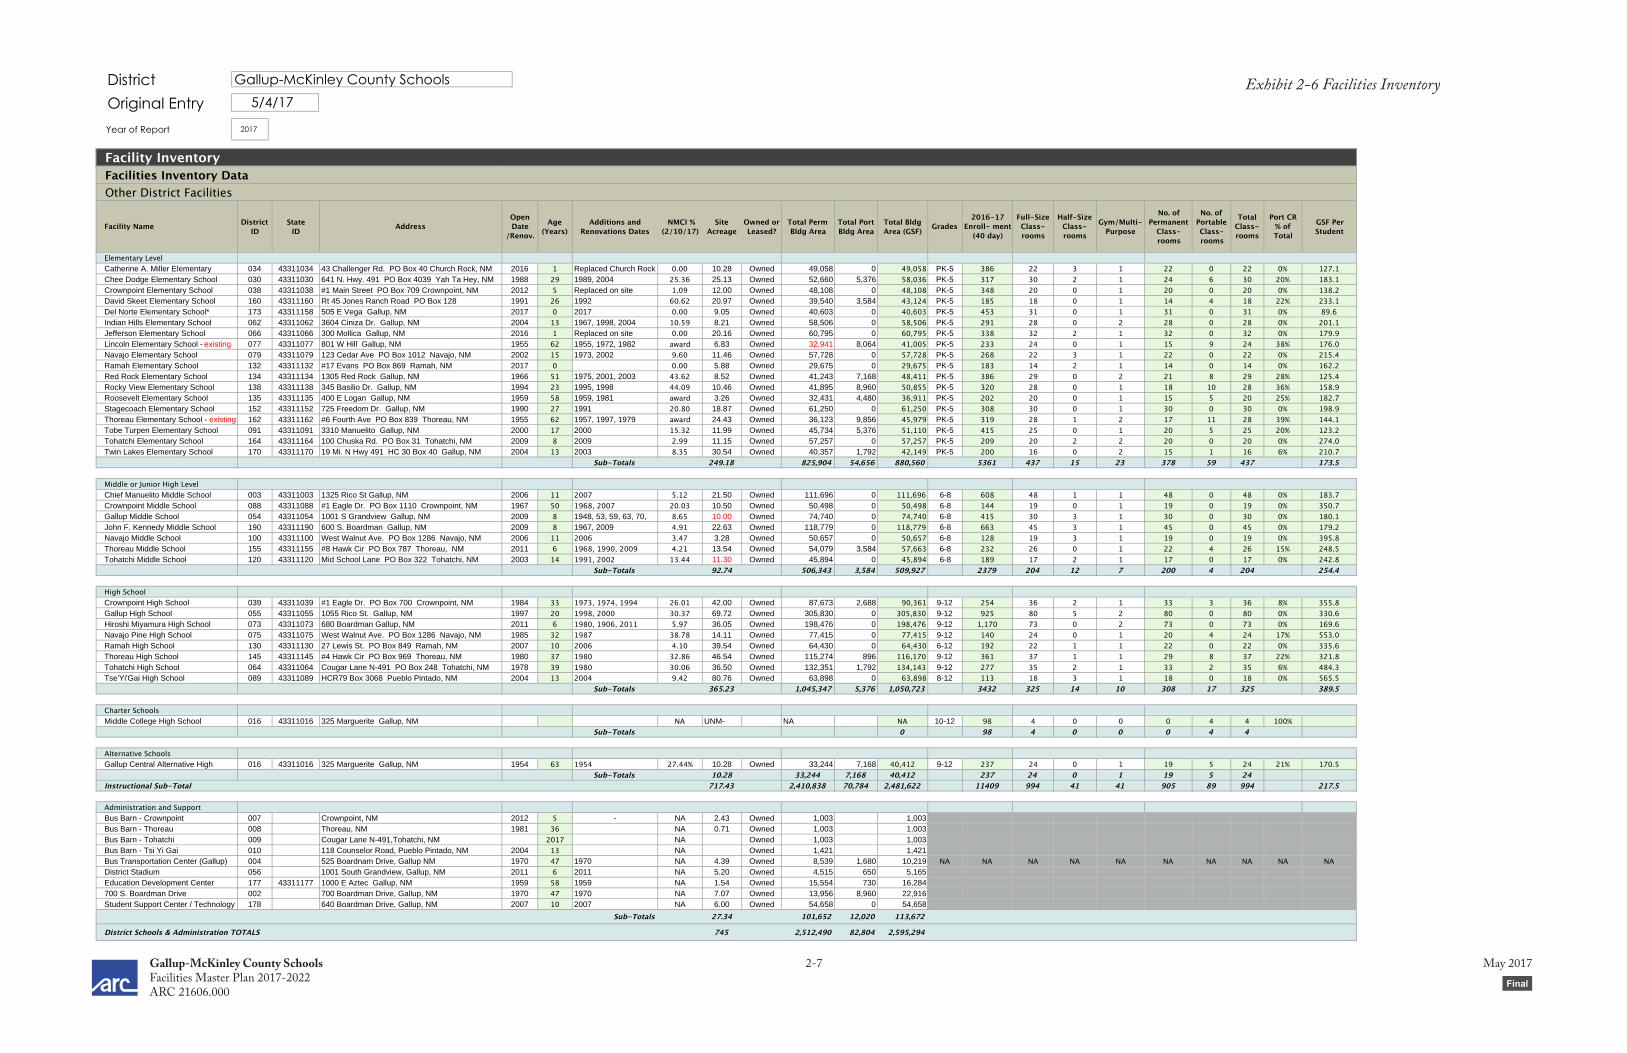
Exhibit 2-6 Facilities InventoryGallup-McKinley County Schools
2017
Facility InventoryFacilities Inventory DataOther District Facilities
Facility Name District ID
State ID Address
Open Date
/Renov.
Age (Years)
Additions and Renovations Dates
NMCI % (2/10/17)
Site Acreage
Owned or Leased?
Total Perm Bldg Area
Total Port Bldg Area
Total Bldg Area (GSF) Grades
2016-17Enroll- ment
(40 day)
Full-Size Class- rooms
Half-Size Class-rooms
Gym/Multi-Purpose
No. of Permanent
Class- rooms
No. of Portable Class- rooms
Total Class- rooms
Port CR % of Total
GSF Per Student
Elementary LevelCatherine A. Miller Elementary 034 43311034 43 Challenger Rd. PO Box 40 Church Rock, NM 2016 1 Replaced Church Rock 0.00 10.28 Owned 49,058 0 49,058 PK-5 386 22 3 1 22 0 22 0% 127.1Chee Dodge Elementary School 030 43311030 641 N. Hwy. 491 PO Box 4039 Yah Ta Hey, NM 1988 29 1989, 2004 25.36 25.13 Owned 52,660 5,376 58,036 PK-5 317 30 2 1 24 6 30 20% 183.1Crownpoint Elementary School 038 43311038 #1 Main Street PO Box 709 Crownpoint, NM 2012 5 Replaced on site 1.09 12.00 Owned 48,108 0 48,108 PK-5 348 20 0 1 20 0 20 0% 138.2David Skeet Elementary School 160 43311160 Rt 45 Jones Ranch Road PO Box 128 1991 26 1992 60.62 20.97 Owned 39,540 3,584 43,124 PK-5 185 18 0 1 14 4 18 22% 233.1Del Norte Elementary School* 173 43311158 505 E Vega Gallup, NM 2017 0 2017 0.00 9.05 Owned 40,603 0 40,603 PK-5 453 31 0 1 31 0 31 0% 89.6Indian Hills Elementary School 062 43311062 3604 Ciniza Dr. Gallup, NM 2004 13 1967, 1998, 2004 10.59 8.21 Owned 58,506 0 58,506 PK-5 291 28 0 2 28 0 28 0% 201.1Jefferson Elementary School 066 43311066 300 Mollica Gallup, NM 2016 1 Replaced on site 0.00 20.16 Owned 60,795 0 60,795 PK-5 338 32 2 1 32 0 32 0% 179.9Lincoln Elementary School - existing 077 43311077 801 W Hill Gallup, NM 1955 62 1955, 1972, 1982 award 6.83 Owned 32,941 8,064 41,005 PK-5 233 24 0 1 15 9 24 38% 176.0Navajo Elementary School 079 43311079 123 Cedar Ave PO Box 1012 Navajo, NM 2002 15 1973, 2002 9.60 11.46 Owned 57,728 0 57,728 PK-5 268 22 3 1 22 0 22 0% 215.4Ramah Elementary School 132 43311132 #17 Evans PO Box 869 Ramah, NM 2017 0 0.00 5.88 Owned 29,675 0 29,675 PK-5 183 14 2 1 14 0 14 0% 162.2Red Rock Elementary School 134 43311134 1305 Red Rock Gallup, NM 1966 51 1975, 2001, 2003 43.62 8.52 Owned 41,243 7,168 48,411 PK-5 386 29 0 2 21 8 29 28% 125.4Rocky View Elementary School 138 43311138 345 Basilio Dr. Gallup, NM 1994 23 1995, 1998 44.09 10.46 Owned 41,895 8,960 50,855 PK-5 320 28 0 1 18 10 28 36% 158.9Roosevelt Elementary School 135 43311135 400 E Logan Gallup, NM 1959 58 1959, 1981 award 3.26 Owned 32,431 4,480 36,911 PK-5 202 20 0 1 15 5 20 25% 182.7Stagecoach Elementary School 152 43311152 725 Freedom Dr. Gallup, NM 1990 27 1991 20.80 18.87 Owned 61,250 0 61,250 PK-5 308 30 0 1 30 0 30 0% 198.9Thoreau Elementary School - existing 162 43311162 #6 Fourth Ave PO Box 839 Thoreau, NM 1955 62 1957, 1997, 1979 award 24.43 Owned 36,123 9,856 45,979 PK-5 319 28 1 2 17 11 28 39% 144.1Tobe Turpen Elementary School 091 43311091 3310 Manuelito Gallup, NM 2000 17 2000 15.32 11.99 Owned 45,734 5,376 51,110 PK-5 415 25 0 1 20 5 25 20% 123.2Tohatchi Elementary School 164 43311164 100 Chuska Rd. PO Box 31 Tohatchi, NM 2009 8 2009 2.99 11.15 Owned 57,257 0 57,257 PK-5 209 20 2 2 20 0 20 0% 274.0Twin Lakes Elementary School 170 43311170 19 Mi. N Hwy 491 HC 30 Box 40 Gallup, NM 2004 13 2003 8.35 30.54 Owned 40,357 1,792 42,149 PK-5 200 16 0 2 15 1 16 6% 210.7
Sub-Totals 249.18 825,904 54,656 880,560 5361 437 15 23 378 59 437 173.5
Middle or Junior High LevelChief Manuelito Middle School 003 43311003 1325 Rico St Gallup, NM 2006 11 2007 5.12 21.50 Owned 111,696 0 111,696 6-8 608 48 1 1 48 0 48 0% 183.7Crownpoint Middle School 088 43311088 #1 Eagle Dr. PO Box 1110 Crownpoint, NM 1967 50 1968, 2007 20.03 10.50 Owned 50,498 0 50,498 6-8 144 19 0 1 19 0 19 0% 350.7Gallup Middle School 054 43311054 1001 S Grandview Gallup, NM 2009 8 1948, 53, 59, 63, 70, 8.65 10.00 Owned 74,740 0 74,740 6-8 415 30 3 1 30 0 30 0% 180.1John F. Kennedy Middle School 190 43311190 600 S. Boardman Gallup, NM 2009 8 1967, 2009 4.91 22.63 Owned 118,779 0 118,779 6-8 663 45 3 1 45 0 45 0% 179.2Navajo Middle School 100 43311100 West Walnut Ave. PO Box 1286 Navajo, NM 2006 11 2006 3.47 3.28 Owned 50,657 0 50,657 6-8 128 19 3 1 19 0 19 0% 395.8Thoreau Middle School 155 43311155 #8 Hawk Cir PO Box 787 Thoreau, NM 2011 6 1968, 1990, 2009 4.21 13.54 Owned 54,079 3,584 57,663 6-8 232 26 0 1 22 4 26 15% 248.5Tohatchi Middle School 120 43311120 Mid School Lane PO Box 322 Tohatchi, NM 2003 14 1991, 2002 13.44 11.30 Owned 45,894 0 45,894 6-8 189 17 2 1 17 0 17 0% 242.8
Sub-Totals 92.74 506,343 3,584 509,927 2379 204 12 7 200 4 204 254.4
High SchoolCrownpoint High School 039 43311039 #1 Eagle Dr. PO Box 700 Crownpoint, NM 1984 33 1973, 1974, 1994 26.01 42.00 Owned 87,673 2,688 90,361 9-12 254 36 2 1 33 3 36 8% 355.8Gallup High School 055 43311055 1055 Rico St. Gallup, NM 1997 20 1998, 2000 30.37 69.72 Owned 305,830 0 305,830 9-12 925 80 5 2 80 0 80 0% 330.6Hiroshi Miyamura High School 073 43311073 680 Boardman Gallup, NM 2011 6 1980, 1906, 2011 5.97 36.05 Owned 198,476 0 198,476 9-12 1,170 73 0 2 73 0 73 0% 169.6Navajo Pine High School 075 43311075 West Walnut Ave. PO Box 1286 Navajo, NM 1985 32 1987 38.78 14.11 Owned 77,415 0 77,415 9-12 140 24 0 1 20 4 24 17% 553.0Ramah High School 130 43311130 27 Lewis St. PO Box 849 Ramah, NM 2007 10 2006 4.10 39.54 Owned 64,430 0 64,430 6-12 192 22 1 1 22 0 22 0% 335.6Thoreau High School 145 43311145 #4 Hawk Cir PO Box 969 Thoreau, NM 1980 37 1980 32.86 46.54 Owned 115,274 896 116,170 9-12 361 37 1 1 29 8 37 22% 321.8Tohatchi High School 064 43311064 Cougar Lane N-491 PO Box 248 Tohatchi, NM 1978 39 1980 30.06 36.50 Owned 132,351 1,792 134,143 9-12 277 35 2 1 33 2 35 6% 484.3Tse'Yi'Gai High School 089 43311089 HCR79 Box 3068 Pueblo Pintado, NM 2004 13 2004 9.42 80.76 Owned 63,898 0 63,898 8-12 113 18 3 1 18 0 18 0% 565.5
Sub-Totals 365.23 1,045,347 5,376 1,050,723 3432 325 14 10 308 17 325 389.5
Charter SchoolsMiddle College High School 016 43311016 325 Marguerite Gallup, NM NA UNM- NA NA 10-12 98 4 0 0 0 4 4 100%
Sub-Totals 0 98 4 0 0 0 4 4
Alternative SchoolsGallup Central Alternative High 016 43311016 325 Marguerite Gallup, NM 1954 63 1954 27.44% 10.28 Owned 33,244 7,168 40,412 9-12 237 24 0 1 19 5 24 21% 170.5
Sub-Totals 10.28 33,244 7,168 40,412 237 24 0 1 19 5 24Instructional Sub-Total 717.43 2,410,838 70,784 2,481,622 11409 994 41 41 905 89 994 217.5
Administration and SupportBus Barn - Crownpoint 007 Crownpoint, NM 2012 5 - NA 2.43 Owned 1,003 1,003Bus Barn - Thoreau 008 Thoreau, NM 1981 36 NA 0.71 Owned 1,003 1,003Bus Barn - Tohatchi 009 Cougar Lane N-491,Tohatchi, NM 2017 NA Owned 1,003 1,003Bus Barn - Tsi Yi Gai 010 118 Counselor Road, Pueblo Pintado, NM 2004 13 NA Owned 1,421 1,421Bus Transportation Center (Gallup) 004 525 Boardnam Drive, Gallup NM 1970 47 1970 NA 4.39 Owned 8,539 1,680 10,219 NA NA NA NA NA NA NA NA NA NADistrict Stadium 056 1001 South Grandview, Gallup, NM 2011 6 2011 NA 5.20 Owned 4,515 650 5,165Education Development Center 177 43311177 1000 E Aztec Gallup, NM 1959 58 1959 NA 1.54 Owned 15,554 730 16,284700 S. Boardman Drive 002 700 Boardman Drive, Gallup, NM 1970 47 1970 NA 7.07 Owned 13,956 8,960 22,916Student Support Center / Technology 178 640 Boardman Drive, Gallup, NM 2007 10 2007 NA 6.00 Owned 54,658 0 54,658
Sub-Totals 27.34 101,652 12,020 113,672
District Schools & Administration TOTALS 745 2,512,490 82,804 2,595,294
5/4/17
District
Original Entry
Year of Report

Gallup-McKinley County Schools 2-8 May 2017 Facilities Master Plan 2017-2022 Draft FinalARC 21606.000
Exhibit 2-6 Facilities Inventory Continued
Facility InventoryFacilities Inventory DataOther District Facilities
Facility Name District ID
State ID Address
Open Date
/Renov.
Age (Years)
Additions and Renovations Dates
NMCI % (2/10/17)
Site Acreage
Owned or Leased?
Total Perm Bldg Area
Total Port Bldg Area
Total Bldg Area (GSF) Grades
2016-17Enroll- ment
(40 day)
Full-Size Class- rooms
Half-Size Class-rooms
Gym/Multi-Purpose
No. of Permanent
Class- rooms
No. of Portable Class- rooms
Total Class- rooms
Port CR % of Total
GSF Per Student
LeasedAquatics Center 4.50 Owned NA 0
Sub-Totals 4.50
Teacher Housing Crownpoint Housing - New OwnedNavajo Pine Housing - New OwnedThoreau Housing - New OwnedTohatchi Housing - New OwnedTse'Yi'Gai Housing - New Owned
Sub-Totals 0
Housing - Vacant, to be demolishedCrownpoint Housing - Old Owned 16,770 16,770Navajo ES Housing - Old Owned 24,000 24,000Thoreau HS Housing - Old Owned 25,080 25,080Thoreau ES Housing - Old Owned 10,000 10,000Tohatchi Housing - Old Owned 15,000 15,000
Sub-Totals 90,850 90,850
Closed SchoolsJuan de Oñate ES 505 E Vega, Gallup, NM 5.52 Owned 32,941 32,941Washington ES - to be demolished 700 West Wilson, Gallup, NM NA Owned 40,824 40,824Ramah ES - Old 17 Evans, Ramah, NM 13.27 Owned 22,200 22,200Church Rock ES - demolished 43 Challenger Road, Church Rock, NM NA Demo'd 28,310 28,310
Sub-Totals 18.79 124,275 124,275
Other Portables - Stored and abandoned@ Chee Dodge ES 5,376 5,376@ David Skeet ES 896 896@ Stagecoach ES 3,584 3,584@ Twin Lakes ES 1,792 1,792@ Gallup MS 5,376 5,376@ John F Kennedy MS 2,728 2,728@ Crownpoint HS 4,480 4,480@ Navajo Pine HS 3,584 3,584@ Ramah HS 1,792 1,792@ Thoreau HS 10,752 10,752@Tohatchi HS 1,792 1,792@ 700 S. Boardman Drive 6,272 6,272
Sub-Totals 48,424 48,424Other District Facilities Subtotal 215,125 48,424 263,549
Districtwide TOTALS 768.05 2,727,615 131,228 2,858,843

Gallup-McKinley County Schools 2-9 May 2017 Facilities Master Plan 2017-2022 Draft FinalARC 21606.000
Inventory of Portable Buildings and Teacher Housing
Exhibit 2-7 Portables and Teacher Housing Inventory
School Name Portables Total Portables - Single Portables - Double
Portables usable
Portables unusable
Teacherages - usable units
Unoccupied Teacherages or housing units
Notes
034 Catherine A. Miller Elementary School 0030 Chee Dodge Elementary School 6 6 6038 Crownpoint Elementary School 0160 David Skeet Elementary School 4 3 1 3 1 1 1 single portable is unusable173 Del Norte Elementary School 0062 Indian Hills Elementary School 0066 Jefferson Elementary School 0077 Lincoln Elementary School 9 9 Art, OT/PT, RTI. 5th, 5th. GATE, Instructional Coach, SpEd Resource, Office (2 SpEd base, 1 counselor, 2 ?)079 Navajo Elementary School 0 14 Teacherages = 5 buildings @ 4800 SF each132 Ramah Elementary School 0134 Red Rock Elementary School 8 8 8138 Rocky View Elementary School 10 10 10135 Roosevelt Elementary School 5 5 5 2= classes, 2=storage or navajo or gifted??, 1=counselor152 Stagecoach Elementary School 3 2 1 3 Un-used or unusable?The three portable classrooms are not in use and intended to be moved. 162 Thoreau Elementary School 11 11 11 2 Priority for Demolition. 2 long old stone teacherage buildings091 Tobe Turben Elementary School 5 4 1 5 New portable just delivered at site, shown as vacant164 Tohatchi Elementary School 0170 Twin Lakes Elementary School 2 2 1 1 3 Parent/liason space, and unused, one new teacherage duplex and one old trailer003 Chief Manuelito Middle School 0 15 in portable site storage088 Crownpoint Middle School 0054 Gallup Middle School 6 6 Vacant arts building across the street. Portables abandoned, no ramps or stairs190 John F. Kennedy Middle School 1 1 1 Used for storage per field notes. School also has storage building - manufactured, 2728 SF.100 Navajo Middle School 0155 Thoreau Middle School 3 2 1 3120 Tohatchi Middle School 0 Nearby district portable storage039 Crownpoint High School 8 8 3 5 60 13 Buildings on campus requiring demolition: paint bld., portables, teacherages, old aux gym. 055 Gallup High School 0073 Hiroshi Miyamura High School 0075 Navajo Pine High School 4 4 4 34 1 NHA single family units south and west of the school site130 Ramah High School 2 2 2 Storage: 2=single plus 1=half size145 Thoreau High School 13 8 1 12 44 15 One portable has no heat but is used for testing. 5 portables stored on site.064 Tohatchi High School 4 4 2 2 22 10 Portables: All singles, two on campus, two off. Teacherages: 4 old units are occupied (#4, 5, 6, 8)089 Tse'Yi'Gai High School 0 20016 Gallup Central Alternative High School 5 5 0 5 1 Also, preschool portables include a single and a double connected. Not included in portable count. Police home007 Bus Barn - Crownpoint 0008 Bus Barn - Thoreau 0009 Bus Barn - Tohatchi 0010 Bus Barn - Tsi Yi Gai 0004 Bus Transportation Center (Gallup) 0056 District Stadium 0177 Education Development Center 0000 Central Office Building 0002 700 S, Boardman Ave. 13 9 4 6 7178 Student Support Center / Technology 0
Totals 122 92 10 78 44 184 56
Gallup-McKinley County Schools 2-10 May 2017 Facilities Master Plan 2017-2022 Draft FinalARC 21606.000
Exhibit 2-9 School LocationsExhibit 2-8 District Boundaries
0 10 20
milesArchitectural ResearchConsultants, Incorporated
NavajoPine
Tohatchi
MiyamuraGallupCentral High
Ramah
Gallup
Crownpoint
Thoreau
Tse'yi'gai
NM60
5
US
49 1
NM53
I 40
NM400
NM 264
NM
602
NM371
NM 57
I 40
Gallup McKinleyCounty Schools
High School
DistrictBoundary
Middle SchoolElementary School
Interstate
US Highway
State Highway
Railroad
Cimarron
Mosquero
DemingGasden
Las Cruces
Socorro
Grants-Cibola
Farm
ing
ton
Hatch Valley
Truth orConsequences
Gallup-McKinleyGallup-McKinley
Gallup-McKinley
Zuni
Silver Cobre
Lordsburg
Moriarty-Edgewood
Albuquerque
Los Lunas
Belen
Roswell
Lovington
Tatum
Clovis
Tucumcari
Loving
Carlsbad
Tularosa
Cloudcroft
Capitan
Eunice
Hobbs
PeñascoEspañola
JemezMountain
Cuba
JemezValley Bernalillo
Los Alamos
Sandoval
Santa Fe
Pojoaque
Taos
Questa
Springer
DulceChamaValley
MesaVista
Des Moines
Las Vegas City
Animas
May 2017
Magdalena
Quemado
Reserve
DexterHagermanLake Arthur
Artesia
Alamogordo
Central
Aztec
Bloomfield
Raton
WagonMoundMora
Mountainair Fort Sumner
Vaughn
Estancia
DoraElida
Melrose
Santa Rosa
Pecos
West Las Vegas
Grady
Texico
FloydPortales
Ruidoso
Carrizozo
Corona
HondoValley
Jal
Clayton
Logan
San Jon
Roy
Maxwell
RioRancho
House
Architectural Research Consultants, IncorporatedNORTH

Gallup-McKinley County Schools 2-11 May 2017 Facilities Master Plan 2017-2022 Draft FinalARC 21606.000
2.3 District GrowthThis section discusses growth trends in the district, including demographic, economic, and development factors that may impact district educational programs and student enrollment.
2.3.1 IntroductionThis section provides an analysis of historic
and projected enrollment.We use enrollment projections, along with
classroom utilization patterns, to identify:• Future classroom needs• Future site capacities
Please see the Appendix for supporting demographic information including overall population trends, birth rates, age composition, household size, development activity, and economic trends that may impact district educational programs and student enrollment.
2.3.2 GMCS Area Growth TrendsGallup-McKinley County Schools is the largest school district in land area, with 4,957 square
miles and the sixth largest district in enrollment out of the 89 districts in New Mexico. Total enrollment has declined gradually over the past 15 years. Over 75% of the students in the district attend schools in Gallup, and the rest are distributed in Crownpoint, Navajo, Ramah, Thoreau and Tohatchi subareas. All subareas have experienced enrollment decline. With Navajo-Gallup Water Supply Project providing San Juan River water to many of the communities in the district around 2023 and with proposed economic development, the district has some enrollment growth potential in the long run. However, current demographic factors, the state of the economy, slow housing starts, and enrollment trends lead us to expect enrollment will continue to decline slowly over the next ten years.
DemographicsPopulation in the city of Gallup has grown each decade for 100 years. It grew by nearly 1,500 persons from 2000 to 2010.McKinley County’s population grew each decade for 90 years. It reportedly declined between 2000 and 2010.The school district had a comparatively young population in 2010, with median age of 31.9 years compared to 36.7 years for the state as a whole.The increase in Native American population in Gallup indicates in-migration, particularly from the Navajo Nation.Births and birth rates in the area have declined sharply since 1990, and are approaching state and national rates.

Gallup-McKinley County Schools 2-12 May 2017 Facilities Master Plan 2017-2022 Draft FinalARC 21606.000
EconomicsSome major employers added jobs in recent years, including Gallup Indian Medical Center and Fire Rock Casino. Gallup is the employment hub of county, strong in travel, trade and tourism, including retail, medical services, and lodging (new hotels, restaurants and Indian jewelry outlets).Gallup had substantial new building in 1990s and much of 2000s; the number of issued residential permits has not recovered since 2009; additional phases of existing subdivisions can build and proposed residential projects may develop.County employment declined from 2008 to 2014, with a slight recovery in 2015.
The wages paid for new jobs do not equal the wages for lost jobs.The number of jobs declined at Rehoboth McKinley Christian Health Care Services, City of Gallup, McKinley County, and P&M Coal Mining Company (closed).The county has a high unemployment rate.
Economic DevelopmentThe Navajo-Gallup Water Supply Project proceeding and should reach Gallup in 2023, enabling growth and development.The widening of U.S. 491 improves accessibility in the district.
Gallup Land Partners’ Energy Logistics Park is beginning to develop.Greater Gallup Economic Development Corporation is promoting and coordinating target industries.The area’s 135 miles of hiking/biking trails spurs some tourism spending and plans are to expand them further.
EnrollmentSince 2000, the district has experienced a slow long-term decline in total school enrollment at an average annual rate of -1.2%.
Gallup, Ramah and Crownpoint area school enrollment has slowly declined.
Thoreau, Tohatchi and Navajo school enrollment has declined significantly.Pre-K enrollment has grown, but in 2016-17 is smaller than in the prior seven years due to a change from half-day to a full-day program.Kindergarten enrollment has been generally steady, while births five years prior declined.Bureau of Indian Education and private school enrollment within the district has declined.

Gallup-McKinley County Schools 2-13 May 2017 Facilities Master Plan 2017-2022 Draft FinalARC 21606.000
2.4 EnrollmentWhile the district remains one of the largest in New Mexico, its enrollment has generally
declined.
2.4.1 Historic EnrollmentThe district lost 2,185 students, or -1.1% per
year on average from 2000 to 2016.
Gallup-McKinley County School District Enrollment:1993-2016
0
1,600
3,200
4,800
6,400
8,000
9,600
11,200
12,800
14,400
16,000
1993-94 1995-96 1997-98 1999-00 2001-02 2003-04 2005-06 2007-08 2009-10 2011-12 2013-14 2015-16
14,33414,685
15,083 15,031 14,959 15,042 14,859
13,872 13,706 13,468 13,49713,055 12,962
12,618 12,492 12,351 12,508 12,287 12,173 12,054 11,971 11,767 11,905 11,687
Gallup-McKinley County School District
Exhibit 2-10 GMCS Historic Enrollment
Since 2001, total education enrollment declined by an average of 114 students per year, and basic education enrollment declined by an average of 60 students per year. Pre-Kindergarten enrollment declined between the 2015-16 and 2016-17 school years to less than 400 with the change from a half-day to a full-day program.

Gallup-McKinley County Schools 2-14 May 2017 Facilities Master Plan 2017-2022 Draft FinalARC 21606.000
Gallup/McKinley County Schools District Enrollment by Grade, Including All Programs
3Y4YPreKKindergartenGrade 1Grade 2Grade 3Grade 4Grade 5Grade 6Grade 7Grade 8Grade 9Grade 10Grade 11Grade 12Sp-CSp-DTotal% ChangeBasicNote: 2011-12 PreK counts include 3Y and 4Y students
Gallup/McKinley County Schools District Enrollment by Grade, Including All Programs 2005-06 2006-07 2007-08 2008-09 2009-10 2010-11 2011-12 2012-13 2013-14 2014-15 2015-16 2016-17
41 74 37 40 47 46 38 54 32 39 3247 103 88 66 72 72 76 56 57 52 7864 223 217 203 598 508 586 530 594 528 513 336847 836 810 869 874 852 907 938 930 868 800 808861 847 814 866 856 866 875 846 855 828 848 798821 797 823 824 852 821 837 849 824 832 846 805738 783 782 778 787 824 818 790 809 805 845 847764 734 815 790 797 776 822 788 798 778 801 829831 770 733 814 825 761 781 831 773 770 800 832850 810 760 721 759 763 735 716 767 739 713 763
1,010 904 884 819 761 808 784 788 775 828 761 7401,066 942 944 875 789 737 802 788 807 753 815 7461,393 1,194 1,255 1,217 1,101 964 925 967 895 895 872 8911,247 1,123 1,110 1,070 1,049 1,015 848 832 879 859 872 854976 959 920 968 966 909 849 761 765 850 828 820806 931 931 918 913 967 955 848 798 768 800 752431 414 376 258 220 358 318 301 267 266 314 369169 174 193 255 242 240 331 367 325 311 386 387
12,962 12,618 12,492 12,351 12,508 12,287 12,173 12,054 11,971 11,767 11,905 11,687-0.7% -2.7% -1.0% -1.1% 1.3% -1.8% -0.9% -1.0% -0.7% -1.7% 1.2% -1.8%12,274 11,853 11,798 11,732 11,927 11,571 11,524 11,272 11,269 11,101 11,114 10,821
Note: 2011-12 PreK counts include 3Y and 4Y students
Exhibit 2-11 GMCS Historic Enrollment by Grade
Note: ES, MS and HS counts of basic students, not including 3Y, 4Y, PreK or Special Education Levels C and D students
District Schools Enrollment By School Level: 2000-2016
0
1,200
2,400
3,600
4,800
6,000
2000-01 2002-03 2004-05 2006-07 2008-09 2010-11 2012-13 2014-15 2016-17
4,045 4,0504,178
4,311 4,335 4,4224,188 4,206 4,157
4,0193,837
3,5773,404 3,330 3,365 3,359 3,284
3,066 3,016 3,0593,163 3,082
2,926
2,653 2,5842,413
2,306 2,305 2,321 2,291 2,345 2,319 2,267 2,194
5,920
5,5845,381
5,247
4,952 4,8624,766 4,775
4,938 4,9904,897
5,040 5,027 4,971 4,881 4,855 4,848
Elementary Schools Middle Schools High Schools
-1,072 -1.2%
-761, -1.3%
-872, 2.1%
Exhibit 2-12 GMCS Historic Enrollment by School Level
The district experienced decline in the number of students and the average annual rate in all school levels between 2000 and 2016.
The number of students decreased in the Gallup Subarea by 1,015 or -0.7% per year on average, from 2000 to 2016.

Gallup-McKinley County Schools 2-15 May 2017 Facilities Master Plan 2017-2022 Draft FinalARC 21606.000
Exhibit 2-13 GMCS HS Assignment Areas
LUPTON
HOUCK
SAGEBRUSH
HUNTERSPOINT
ST MICHAELS
WINDOWROCK
FORTDEFIANCE
NAVAJO
WhiteClay
OAKSPRINGSMANUELITO
SAWMILL
CRYSTAL
TSEBONITO
COAL MINE
REDDOG RD
BLACKHAT
TIMBER LAKERANCH
RAMAH
WHITERIVER
SANDERS
WILLIAMSACRES
LONGSARENA
SPENCERVALLEY
TSAYATOH
CRESTVIEW
VANDERWAGENCHICHILTAH
JONES RANCH
PIGEONSPRINGS
COUSINS
ROCKSPRINGS
BLACKROCK
ZUNI
MENTMORE
RED ROCK
TOHLAKAI
YAHTAHEY
NAVAJOESTATES
CHUSKATOHATCHI
MEXICOSPRINGS
CHINASPRINGS
BUFFALOSPRINGS
EL PASOPLANT
PINEHAVEN
BREADSPRINGS
WHITECLIFFS
HIDDENVALLEY
TWINBUTTES
SUNDANCE
REHOBETH
ALLISON
GAMERCO
FORTWINGATE
CHURCHROCK
BRIMHALLCOYOTECANYON
MULHOLLANDWELLS
TWINLAKES
SPRINGSTEAD
JAMESTOWN
IYANBITO
CANDYKITCHEN
COOLIDGE
PINEDALE
CONTINENTALDIVIDE
THOREAU
MARIANOLAKE
MOUNTPOWELL
STANDINGROCK
BECENTI
PREWITT
BACA
SMITHLAKE
BLUEWATERLAKE
BLUEWATERACRES
GRANTS
MILAN
CROWNPOINT
NAHODISHGISH
DALTONPASS
BORREGOPASS
CASAMEROLAKE
AMBROSIALAKE
HAYSTACK
SANRAFAEL
BLUEWATERVILLAGE
PUEBLOPINTADO
WHITEHORSELAKE
HOSPAH
COUNSELOR
TORR
OJOENCINO
NavajoPine
Tohatchi
GallupCentral High
Miyamura
Ramah
Gallup
Crownpoint
Thoreau
Tse'yi'gai
0 10 20
miles
NM
605
US
491
NM
400
NM
60
2
I 40
NM 264
I 40
NM 53
NM
37
1
NM 57
Gallup McKinleyCounty Schools
High Schools
SchoolLocation
AssignmentAreas
Community
Architectural ResearchConsultants, Incorporated
(All Shades)

Gallup-McKinley County Schools 2-16 May 2017 Facilities Master Plan 2017-2022 Draft FinalARC 21606.000
34
E l e m e n t a r y S c h o o l s A s s i g n m e n t A r e a s i n G a l l u p
US Hwy 66
Valle
y R
d
Hasler
ChurchRock St
Vanden Bosch
Parkway
Old
Zu
ni
Cinza Dr
Tolte
c D
r
Coyote C
anyon Dr
Drive
-In rd
Ba
sili
o D
r
ClayAve
Ave
Pa
tto
n D
r
ChamisalAve
Boyd
Aztec Av
Will
iam
St
MossmanAve
Man
or D
r
I-40
Mark
Ave
Va
len
tin
a D
r
Plate
au
Dr
Blvd
S Boardman
Ver
di D
r
He
nria
ttaD
r
Bu
r ke
Dr
Re
d
SusanAve
Dr
GurleyAve P
eg
gy A
nn
Dr
Ma
riya
na
St
He
len
a D
r
Ro
ck D
r
CanoncitoAve
Me
sq
uite
Dr
Co
lleg
e
Joseph M Montoya Blvd
1st S
t
Coal Ave
Puerco
Dr
Country C
lub D
r
Gra
ndvie
w D
r
Fo
rd D
r
Philipin AveKit C
ars
on
Dr
Dee Ann St
Nizhoni
NM
Hw
y 602
Park Ave
Se
cond S
t
Wilson Ave
2nd S
t
3rd
St
Jefferson Ave
Green Ave
4th
St
8th
St
6th
St
Victoria
Ave
NM
Hw
y 602
Cip
riano
St
Nin
th S
t
US
Hw
y 491
Ka
chin
a S
t
Metro Ave
11
th S
tA
rno
ld S
t
Aztec
Av
Cla
rk S
t
Da
ni D
r
Mendoza Rd
Sta
ge
co
ach
Rd
Maloney Ave
Marq
ue
riteSt
US Hwy 66
I-40
Mentm
ore
Rd
Weste
rn
Skie
s Rd
Kla
geto
h St
Lincoln
Washington
Stagecoach
Turpen
Jefferson
Juan de Onate
RooseveltRockyView
RedRock
Indian Hills
WHITEWHITEWHITEWHITEWHITEWHITEWHITEWHITEWHITECLIFFSCLIFFSCLIFFSCLIFFSCLIFFSCLIFFSCLIFFSCLIFFSCLIFFS
HIDDENHIDDENHIDDENHIDDENHIDDENHIDDENHIDDENHIDDENHIDDENVALLEYVALLEYVALLEYVALLEYVALLEYVALLEYVALLEYVALLEYVALLEY
MENTMOREMENTMOREMENTMOREMENTMOREMENTMOREMENTMOREMENTMOREMENTMOREMENTMORE
ALLISONALLISONALLISONALLISONALLISONALLISONALLISONALLISONALLISON
RED ROCKRED ROCKRED ROCKRED ROCKRED ROCKRED ROCKRED ROCKRED ROCKRED ROCK
REHOBOTHREHOBOTHREHOBOTHREHOBOTHREHOBOTHREHOBOTHREHOBOTHREHOBOTHREHOBOTH
TWIN BUTTESTWIN BUTTESTWIN BUTTESTWIN BUTTESTWIN BUTTESTWIN BUTTESTWIN BUTTESTWIN BUTTESTWIN BUTTES
WILLIAMS ACRESWILLIAMS ACRESWILLIAMS ACRESWILLIAMS ACRESWILLIAMS ACRESWILLIAMS ACRESWILLIAMS ACRESWILLIAMS ACRESWILLIAMS ACRES
SPENCER VALLEYSPENCER VALLEYSPENCER VALLEYSPENCER VALLEYSPENCER VALLEYSPENCER VALLEYSPENCER VALLEYSPENCER VALLEYSPENCER VALLEY
GAMERCOGAMERCOGAMERCOGAMERCOGAMERCOGAMERCOGAMERCOGAMERCOGAMERCO
CRESTVIEWCRESTVIEWCRESTVIEWCRESTVIEWCRESTVIEWCRESTVIEWCRESTVIEWCRESTVIEWCRESTVIEW
SUNDANSUNDANSUNDANSUNDANSUNDANSUNDANSUNDANSUNDANSUNDAN
Gallup McKinleyCounty Schools
Elementary SchoolAssignment Area andLocation
Architectural ResearchConsultants, Incorporated
(GallupAreaEScity.wor)
(All Shades)
Chee Dodge
David Skeet
LUPTON
HOUCK
SAGEBRUSH
HUNTERSPOINT
ST MICHAELS
WINDOWROCK
FORTDEFIANCE
NAVAJO
WhiteClay
OAKSPRINGSMANUELITO
SAWMILL
CRYSTAL
TSEBONITO
COAL MINE
REDDOG RD
BLACKHAT
TIMBER LAKERANCH
RAMAH
WHITERIVER
SANDERS
WILLIAMSACRES
LONGSARENA
SPENCERVALLEY
TSAYATOH
CRESTVIEW
VANDERWAGENCHICHILTAH
JONES RANCH
PIGEONSPRINGS
COUSINS
ROCKSPRINGS
BLACKROCK
ZUNI
MENTMORE
RED ROCK
TOHLAKAI
YAHTAHEY
NAVAJOESTATES
CHUSKATOHATCHI
MEXICOSPRINGS
CHINASPRINGS
BUFFALOSPRINGS
EL PASOPLANT
PINEHAVEN
BREADSPRINGS
WHITECLIFFS
HIDDENVALLEY
TWINBUTTES
SUNDANCE
REHOBETH
ALLISON
GAMERCO
FORTWINGATE
CHURCHROCK
BRIMHALLCOYOTECANYON
MULHOLLANDWELLS
TWINLAKES
SPRINGSTEAD
JAMESTOWN
IYANBITO
CANDYKITCHEN
COOLIDGE
PINEDALE
CONTINENTALDIVIDE
THOREAU
MARIANOLAKE
MOUNTPOWELL
STANDINGROCK
BECENTI
PREWITT
BACA
SMITHLAKE
BLUEWATERLAKE
BLUEWATERACRES
GRANTS
MILAN
CROWNPOINT
NAHODISHGISH
DALTONPASS
BORREGOPASS
CASAMEROLAKE
AMBROSIALAKE
HAYSTACK
SANRAFAEL
BLUEWATERVILLAGE
PUEBLOPINTADO
WHITEHORSELAKE
HOSPAH
COUNSELOR
TORR
OJOENCINO
Chee Dodge
RedRock
RooseveltTurpin
Tohatchi
Navajo
Lincoln
Stagecoach
Turpen
Del Norte
Chee Dodge
Jefferson
RockyView Indian Hills
TwinLakes
Juan de Onate
DavidSkeet
Ramah
ChurchRock
Catherine A Miller
Crownpoint
Thoreau
0 10 20
miles
I 40
US
491
NM 264
NM
400
NM
605
NM 53
NM
60
2
NM
37
1
NM 57
I 40
Gallup McKinleyCounty Schools
Elementary Schools
SchoolLocation
AssignmentAreas(All Shades)
Community
Architectural ResearchConsultants, Incorporated
Exhibit 2-15 ES Assignment Areas in
Gallup
Exhibit 2-14 ES Assignment
Areas

Gallup-McKinley County Schools 2-17 May 2017 Facilities Master Plan 2017-2022 Draft FinalARC 21606.000
35
M i d d l e a n d H i g h S c h o o l A s s i g n m e n t A r e a s i n G a l l u p
State
Hwy 1
18
I-40
County
Rd
1
Cou
nty
Rd
32
State Hwy 264
County R
d 55
ISR
701
1
I-40
US Hwy 66
49
1U
S H
wy
NSR 7047
Sta
te H
wy 3
2
County Rd 2
Cresto Bridge
Boardman Rd
State Hw
y 602
Cou
nty
Rd
43
Sta
te H
wy
566
0 4 8
miles
GALLUPHIGH
MIYAMURAHIGH
Thoreau
Chief ManuelitoMiddle
JFKMiddle
GallupMiddle
Crown-point
Tohatchi
Ramah
Navajo Gallup McKinley County Schools
OutsideDistrict
OutsideDistrict
Arizo
na
GALLUP
MIYAMURA
MiddleSchools
Architectural ResearchConsultants, Incorporated
(GallupAreaMSHS.wor)
36
H i g h S c h o o l A s s i g n m e n t A r e a s i n G a l l u p
US Hwy 66
Hasler
Basi
lio D
r
ClayAve
Ave
Patt
on D
r
ChamisalAve
Boyd
Aztec Av
Will
iam
St
MossmanAve
Man
or D
r
I-40
Mark
Ave
Vale
ntin
a D
r
Plate
au
Dr
Blvd
S Boardman
Ver
di D
r
Henria
ttaD
r
Burk
e D
r
Red
SusanAve
Dr
GurleyAve P
eggy A
nn
Dr
Mariya
na S
t
Hele
na D
r
Rock D
r
CanoncitoAve
Mesq
uite
Dr
Colle
ge
Joseph M Montoya Blvd
1st S
t
Coal Ave
Puerco
Dr
Country C
lub D
r
Gra
ndvie
w D
r
Ford
Dr
Philipin Ave
Kit C
arso
nD
r
Dee Ann St
Nizhoni
NM
Hw
y 602
Park Ave
Seco
nd
St
Wilson Ave
2nd S
t
3rd
St
Jefferson Ave
Green Ave
4th
St
8th
St
6th
St
Victoria
Ave
NM
Hw
y 602
Cip
riano
St
Nin
th S
t
US
Hw
y 49
1
Kach
ina S
t
Metro Ave
11th
St
Arn
old
St
Aztec
Av
Cla
rk St
Dani D
r
Mendoza Rd
Sta
geco
ach
Rd
Maloney Ave
Ma
rqu
eriteS
t
US Hwy 66
I-40
Weste
rn
Skie
s Rd
GALLUPHIGH
MIYAMURAHIGH
Chief ManuelitoMiddle
GallupMiddle
JFKMiddle
Gallup McKinleyCounty SchoolsGALLUP HIGH
MIYAMURA HIGH
MiddleSchools
Architectural ResearchConsultants, Incorporated
(GallupAreaMSHScity.wor)
GallupCentral
Exhibit 2-16 MS and HS Assignment
Areas in Gallup
Exhibit 2-17 Detailed Map of HS Assignment Areas in Gallup

Gallup-McKinley County Schools 2-18 May 2017 Facilities Master Plan 2017-2022 Draft FinalARC 21606.000
Elementary School Enrollment in the Gallup SubareaElementary school enrollment in the
Gallup subarea declined at an average annual rate of -0.2%. East Gallup Subarea school enrollments were flat, while West Gallup Subarea schools decreased by -0.7% on average. Outlying schools gained at an annual average of 0.1%
Exhibit 2-18 GMCS Historic Gallup Subarea Enrollment
School Enrollment in the Gallup Subarea: 2000-2016

Gallup-McKinley County Schools 2-19 May 2017 Facilities Master Plan 2017-2022 Draft FinalARC 21606.000
Gallup Subarea: East, West and Outlying Total Enrollment
East GallupIndian HillsJeffersonRed RockRocky ViewRooseveltSub-TotalChange
West GallupJuan de OnateStagecoachTurpenWashingtonLincolnSub-TotalChange
Outlying GallupChee DodgeCatherine A. Miller (formerly Church Rock)
David SkeetSub-TotalChange
TotalChange
Gallup Subarea: East, West and Outlying Total Enrollment
2006-07 2007-08 2008-09 2009-10 2010-11 2011-12 2012-13 2013-14 2014-15 2015-16 2016-17353 342 327 349 324 316 330 342 306 287 291237 243 248 261 305 295 296 291 304 310 338336 376 379 392 395 389 399 383 364 344 386331 317 332 382 391 390 388 376 350 325 320215 218 233 261 289 288 274 265 261 265 202
1,472 1,496 1,519 1,645 1,704 1,678 1,687 1,657 1,585 1,531 1,537-4.8% 1.6% 1.5% 8.3% 3.6% -1.5% 0.5% -1.8% -4.3% -3.4% 0.4%
272 307 328 336 374 403 372 370 336 325 236272 307 336 362 361 331 330 336 326 304 308369 316 336 375 321 346 373 379 363 394 415283 278 238 286 229 245 242 238 227 217 217250 238 265 306 293 294 275 266 252 253 233
1,446 1,446 1,503 1,665 1,578 1,619 1,592 1,589 1,504 1,493 1,4091.9% 0.0% 3.9% 10.8% -5.2% 2.6% -1.7% -0.2% -5.3% -0.7% -5.6%
353 393 386 409 361 373 359 394 369 355 317
259 236 263 286 296 292 332 344 345 359 386
209 228 230 258 234 219 223 218 203 208 185821 857 879 953 891 884 914 956 917 922 8885.8% 4.4% 2.6% 8.4% -6.5% -0.8% 3.4% 4.6% -4.1% 0.5% -3.7%
3,739 3,799 3,901 4,263 4,173 4,181 4,193 4,202 4,006 3,946 3,834-0.1% 1.6% 2.7% 9.3% -2.1% 0.2% 0.3% 0.2% -4.7% -1.5% -2.8%
Exhibit 2-19 Elementary School Enrollment in Gallup Subarea
East Gallup Elementary Schools Enrollment: 2006-2016
0
50
100
150
200
250
300
350
400
2006-07 2007-08 2008-09 2009-10 2010-11 2011-12 2012-13 2013-14 2014-15 2015-16 2016-17
215 218233
261
289 288274
265 261 265
202
331317
332
382391 390 388
376
350
325 320
336
376 379392 395 389
399383
364
344
386
237 243 248261
305295 296 291
304 310
338353342
327
349
324316
330342
306
287 291
Indian Hills Jefferson Red Rock Rocky View Roosevelt
Exhibit 2-20 East Gallup ES Enrollment Chart

Gallup-McKinley County Schools 2-20 May 2017 Facilities Master Plan 2017-2022 Draft FinalARC 21606.000
West Gallup Elementary Schools Enrollment: 2006-2016
0
70
140
210
280
350
420
2006-07 2007-08 2008-09 2009-10 2010-11 2011-12 2012-13 2013-14 2014-15 2015-16 2016-17
250238
265
306293 294
275 266252 253
233
283 278
238
286
229245 242 238
227217 217
369
316
336
375
321
346
373379
363
394
415
272
307
336
362 361
331 330 336326
304 308
272
307
328336
374
403
372 370
336325
236
Juan de Onate Stagecoach Turpen Washington Lincoln
Exhibit 2-21 West Gallup ES Enrollment Chart
Outlying Gallup Elementary Schools Enrollment: 2006-2016
0
100
200
300
400
500
2006-07 2007-08 2008-09 2009-10 2010-11 2011-12 2012-13 2013-14 2014-15 2015-16 2016-17
209228 230
258
234219 223 218
203 208
185
259
236
263
286296 292
332344 345
359
386
353
393 386
409
361373
359
394
369355
317
Chee Dodge Catherine A. Miller David Skeet
Exhibit 2-22 Outlying Gallup ES Enrollment Chart

Gallup-McKinley County Schools 2-21 May 2017 Facilities Master Plan 2017-2022 Draft FinalARC 21606.000
Middle School Enrollment in Gallup SubareaMiddle school enrollment in the Gallup
subarea declined by an annual average of -3.5%.
Gallup Subarea: Middle Schools Enrollment
Chief Manuelito MiddleGallup MiddleJohn F. Kennedy MiddleGallup Jr. High(Grades 8-10)
TotalChange
Gallup Subarea: Middle Schools Enrollment2006-07 2007-08 2008-09 2009-10 2010-11 2011-12 2012-13 2013-14 2014-15 2015-16 2016-17
641 636 642 627 638 633 600 609 608694 641 399 412 406 429 437 439 421 429 415508 485 607 589 606 676 676 668 684 680 663
1,211 1,254
2,413 2,380 1,647 1,637 1,654 1,732 1,751 1,740 1,705 1,718 1,686-10.3% -1.4% -30.8% -0.6% 1.0% 4.7% 1.1% -0.6% -2.0% 0.8% -1.9%
Exhibit 2-23 Middle School Enrollment in Gallup Subarea
Gallup Middle Schools Enrollment: 2006-2016
0
260
520
780
1,040
1,300
2006-07 2007-08 2008-09 2009-10 2010-11 2011-12 2012-13 2013-14 2014-15 2015-16 2016-17
1,2111,254
508485
607589 606
676 676 668 684 680 663694
641
399 412 406429 437 439 421 429 415
641 636 642 627 638 633600 609 608
Chief Manuelito Middle Gallup Middle John F. Kennedy Middle "Gallup Jr. High
Exhibit 2-24 GMCS MS Enrollment Chart

Gallup-McKinley County Schools 2-22 May 2017 Facilities Master Plan 2017-2022 Draft FinalARC 21606.000
High School Enrollment in Gallup SubareaHigh school enrollment in the Gallup
subarea increased at an average annual rate of 2.8%.
Gallup Subarea: High Schools Enrollment
Gallup HighGallup Central AltMiddle College HighMiyamura HighTotalChange
Gallup Subarea: High Schools Enrollment2006-07 2007-08 2008-09 2009-10 2010-11 2011-12 2012-13 2013-14 2014-15 2015-16 2016-17
1,530 1,621 1,632 1,430 1,161 1,062 1,003 972 935 943 925276 237 262 230 243 249 208 201 281 259 23745 50 59 64 62 63 63 67 70 71 980 0 588 826 1,091 1,141 1,112 1,127 1,152 1,192 1,170
1,851 1,908 2,541 2,550 2,557 2,515 2,386 2,367 2,438 2,465 2,430-4.3% 3.1% 33.2% 0.4% 0.3% -1.6% -5.1% -0.8% 3.0% 1.1% -1.4%
Exhibit 2-25 High School Enrollment in Gallup Subarea
Gallup High Schools Enrollment: 2006-2016
0
200
400
600
800
1,000
1,200
1,400
1,600
1,800
2006-07 2007-08 2008-09 2009-10 2010-11 2011-12 2012-13 2013-14 2014-15 2015-16 2016-17
588
826
1,0911,141
1,112 1,127 1,1521,192 1,170
45 50 59 64 62 63 63 67 70 7198
276237 262
230 243 249208 201
281 259 237
1,530
1,621 1,632
1,430
1,161
1,0621,003
972935 943 925
Gallup High Gallup Central Alt Middle College High Miyamura High
Exhibit 2-26 High School Enrollment in Gallup Subarea

Gallup-McKinley County Schools 2-23 May 2017 Facilities Master Plan 2017-2022 Draft FinalARC 21606.000
Enrollment in Other GMCS Subareas
The schools in the subareas outside of Gallup experienced a loss of 873 students at an annual average rate of -2.2% from 2006 to 2016.
29
Crownpoint Subarea Schools Enrollment
Crownpoint ElementaryCrownpoint MiddleCrownpoint HighTse'Yi'Gai HighTotalChange
Crownpoint Subarea Schools Enrollment2006-07 2007-08 2008-09 2009-10 2010-11 2011-12 2012-13 2013-14 2014-15 2015-16 2016-17
260 240 239 284 265 288 299 324 374 367 348220 194 176 169 153 129 127 142 137 143 144454 491 440 397 393 346 324 296 270 264 254146 150 118 109 95 97 103 112 128 116 113
1,080 1,075 973 959 906 860 853 874 909 890 859-6.6% -0.5% -9.5% -1.4% -5.5% -5.1% -0.8% 2.5% 4.0% -2.1% -3.5%
Navajo, NM Subarea Schools Enrollment
Navajo ElementaryNavajo MiddleNavajo Pine HighTotalChange
Navajo, NM Subarea Schools Enrollment2006-07 2007-08 2008-09 2009-10 2010-11 2011-12 2012-13 2013-14 2014-15 2015-16 2016-17
289 304 309 280 250 273 279 275 269 306 268161 132 142 108 127 130 131 114 111 121 128207 222 221 179 182 129 124 124 146 152 140657 658 672 567 559 532 534 513 526 579 536
7.5% 0.2% 2.1% -15.6% -1.4% -4.8% 0.4% -3.9% 2.5% 10.1% -7.4%
30
Ramah Subarea Schools Enrollment
Ramah ElementaryRamah HighTotalChange
Ramah Subarea Schools Enrollment2006-07 2007-08 2008-09 2009-10 2010-11 2011-12 2012-13 2013-14 2014-15 2015-16 2016-17
179 173 176 183 191 202 193 184 182 190 183236 212 257 207 222 224 215 186 191 198 192415 385 433 390 413 426 408 370 373 388 375
7.5% -7.2% 12.5% -9.9% 5.9% 3.1% -4.2% -9.3% 0.8% 4.0% -3.4%
Thoreau Subarea Schools Enrollment
Thoreau Elem.Thoreau MiddleThoreau HighTotal% Change
Thoreau Subarea Schools Enrollment2006-07 2007-08 2008-09 2009-10 2010-11 2011-12 2012-13 2013-14 2014-15 2015-16 2016-17
301 313 308 317 317 345 341 325 341 315 319343 307 282 243 240 221 259 256 257 250 232600 577 533 496 429 379 351 324 331 350 361
1,244 1,197 1,123 1,056 986 945 951 905 929 915 912-4.5% -3.8% -6.2% -6.0% -6.6% -4.2% 0.6% -4.8% 2.7% -1.5% -0.3%
Tohatchi Subarea Schools Enrollment
Tohatchi ElementaryTwin Lakes ElementaryTohatchi MiddleTohatchi HighTotal% Change
Tohatchi Subarea Schools Enrollment2006-07 2007-08 2008-09 2009-10 2010-11 2011-12 2012-13 2013-14 2014-15 2015-16 2016-17
224 204 216 252 265 262 243 226 199 209 209165 179 175 213 207 212 214 208 192 201 200215 210 189 195 193 204 165 197 192 195 189430 421 414 383 319 304 313 310 270 256 277
1,034 1,014 994 1,043 984 982 935 941 853 861 875-9.4% -1.9% -2.0% 4.9% -5.7% -0.2% -4.8% 0.6% -9.4% 0.9% 1.6%
Exhibit 2-27 GMCS Enrollment in Other District Subareas

Gallup-McKinley County Schools 2-24 May 2017 Facilities Master Plan 2017-2022 Draft FinalARC 21606.000
*Not including Special Education C and D level students
School Enrollment by Area: 2000-2016
0
200
400
600
800
1,000
1,200
1,400
1,600
2000-01 2002-03 2004-05 2006-07 2008-09 2010-11 2012-13 2014-15 2016-17
1,231
1,1021,138
1,179 1,163 1,141
1,034 1,014 9941,043
984 982
889 891853 861 875
1,5031,539
1,4771,419
1,306 1,3021,244
1,197
1,123
1,056
986945
913876
929 915 912
398 421 414 419 403 386415
385433
390 413 426395
357 373 388 375
818
696658 649
590 611657 658 672
567 559532
501 486526
579536
9571,005 1,017
1,0711,125
1,156
1,080 1,075
973 959906
860830 849
909 890859
Crownpoint Navajo Ramah Thoreau Tohatchi
-591, -3.1%
-98, -0.7%
-356, -2.1%
-282, -2.6%
-23 -0.6%
Exhibit 2-28 GMCS Enrollment by Other District Subarea Chart
Crownpoint Schools Enrollment: 2006-2016
0
50
100
150
200
250
300
350
400
450
500
2006-07 2007-08 2008-09 2009-10 2010-11 2011-12 2012-13 2013-14 2014-15 2015-16 2016-17
146 150
118109
95 97 103112
128116 113
454
491
440
397 393
346
324
296
270 264254
220
194176 169
153
129 127142 137 143 144
260
240 239
284265
288299
324
374 367348
Crownpoint Elementary Crownpoint Middle Crownpoint High Tse'Yi'Gai High
Exhibit 2-29 Crownpoint Schools Enrollment Chart

Gallup-McKinley County Schools 2-25 May 2017 Facilities Master Plan 2017-2022 Draft FinalARC 21606.000
Navajo Schools Enrollment: 2006-2016
0
50
100
150
200
250
300
350
400
2006-07 2007-08 2008-09 2009-10 2010-11 2011-12 2012-13 2013-14 2014-15 2015-16 2016-17
207222 221
179 182
129 124 124
146152
140
161
132142
108
127 130 131
114 111121
128
289304 309
280
250
273 279 275269
306
268
Navajo Elementary Navajo Middle Navajo Pine High
Exhibit 2-30 Navajo Schools Enrollment Chart
Ramah Schools Enrollment: 2006-2016
0
20
40
60
80
100
120
140
160
180
200
220
240
260
2006-07 2007-08 2008-09 2009-10 2010-11 2011-12 2012-13 2013-14 2014-15 2015-16 2016-17
236
212
257
207
222 224215
186191
198192
179173 176
183191
202193
184 182190
183
Ramah Elementary Ramah High
Exhibit 2-31 Ramah Schools Enrollment Chart

Gallup-McKinley County Schools 2-26 May 2017 Facilities Master Plan 2017-2022 Draft FinalARC 21606.000
Thoreau Schools Enrollment: 2006-2016
0
60
120
180
240
300
360
420
480
540
600
2006-07 2007-08 2008-09 2009-10 2010-11 2011-12 2012-13 2013-14 2014-15 2015-16 2016-17
600577
533
496
429
379
351
324 331350
361343
307
282
243 240221
259 256 257 250232
301313 308
317 317
345 341325
341
315 319
Thoreau Elementary Thoreau Middle Thoreau High
Exhibit 2-32 Thoreau Schools Enrollment Chart
Tohatchi Schools Enrollment: 2006-2016
0
50
100
150
200
250
300
350
400
450
500
2006-07 2007-08 2008-09 2009-10 2010-11 2011-12 2012-13 2013-14 2014-15 2015-16 2016-17
430421 414
383
319304
313 310
270256
277
215 210
189 195 193204
165
197 192 195 189
165179 175
213 207 212 214 208192
201 200224
204216
252265 262
243226
199209 209
Tohatchi Elementary Twin Lakes Elementary Tohatchi Middle Tohatchi High
Exhibit 2-33 Tohatchi Schools Enrollment Chart

Gallup-McKinley County Schools 2-27 May 2017 Facilities Master Plan 2017-2022 Draft FinalARC 21606.000
Charter Schools EnrollmentEnrollment in state charter schools located
in the district more than doubled from 2012 to 2016, although those schools represent a small share of the total enrollment. Uplift Community Schools is closing in 2017-18.
Exhibit 2-34 GMCS Other Schools and Programs Enrollment by Grade
Other Schools and Programs in Gallup / McKinley School District
3Y4YPreKKindergarten123456789101112CDTotal
Other Schools and Programs in Gallup / McKinley School District2005-06 2006-07 2007-08 2008-09 2009-10 2010-11 2011-12 2012-13 2013-14 2014-15 2015-16 2016-17
17 20 9 3 11 14 0 5 17 9 8 255 36 28 21 17 17 0 16 13 11 14 1285 103 23 22 0 0 0 1 0 0 0 30 1 1 3 0 1 0 14 16 0 16 00 0 0 0 1 1 0 0 0 0 16 150 0 1 0 0 1 0 0 0 0 15 00 0 0 0 0 0 0 0 1 0 14 200 0 0 0 0 0 0 1 0 0 15 150 0 0 0 0 0 0 0 1 0 9 211 0 0 0 0 1 0 1 1 0 9 254 3 4 0 1 2 0 0 0 1 5 192 0 0 2 2 0 0 0 3 0 8 116 3 4 5 6 8 0 1 2 3 7 124 9 1 5 2 5 0 3 2 3 3 91 3 4 5 0 4 0 0 2 1 1 80 4 1 1 2 1 0 0 1 0 2 40 3 0 0 1 0 0 1 0 0 0 36 0 0 0 0 0 0 0 0 0 1 1
181 185 76 67 42 54 0 42 59 28 143 180
State Charter Schools In Gallup / McKinley School District2012-13 2013-14 2014-15 2015-16 2016-17
Six Directions Indigenous School 49Uplift Community School (Grades K-6) 103 156 153 172 189DEAP (Grades 6 and 7) 23 21Total 103 156 153 195 259Source: NM Public Education Department
Exhibit 2-35 State Charter Schools in GMCS
Other Schools EnrollmentEnrollment in the various other schools and
programs of the district, including Head Start and Family and Child Education (FACE) programs, and juvenile detention, has varied by year, but not exceeding 200 students.

Gallup-McKinley County Schools 2-28 May 2017 Facilities Master Plan 2017-2022 Draft FinalARC 21606.000
Grade Change RatiosCohort survival ratios show the relation
between students succeeding from one grade to the next grade in the following year.
“100%” means the same number of students in a class one year succeeds to the next grade the following year. All ratios for GMCS were over 91% in last five years, and only grades
5, 7, and 9 averaged over 100% in that time period
Students entering grade 6 averaged the lowest, at 93%, indicating loss to non-public schools.
ARC uses cohort survival ratios to project enrollment, as described in the following section.
26
Grade Change Ratios in District Schools
• “100%” means the same number of students in a class one year succeeds to the next grade the following year. • All ratios were over 91% in last 5 years, but only Grades 5, 7, and 9 averaged over 100% in that time period • Students entering Grade 6 averaged the lowest, at 93%, indicating loss to non-public schools
Gallup/McKinley County School District Cohort Survival Ratios: 2006-2016Gallup/McKinley County School District Cohort Survival Ratios: 2006-20162006-07 2007-08 2008-09 2009-10 2010-11 2011-12 2012-13 2013-14 2014-15 2015-16 2016-17
Grade 1Grade 2Grade 3Grade 4Grade 5Grade 6Grade 7Grade 8Grade 9Grade 10Grade 11Grade 12
100.0% 97.5% 107.0% 98.7% 99.0% 102.8% 93.3% 92.5% 90.6% 95.9% 99.9%92.6% 97.0% 101.2% 98.4% 95.9% 96.8% 97.0% 97.4% 97.3% 100.4% 96.8%95.4% 98.1% 94.6% 95.5% 96.7% 99.8% 94.4% 95.2% 97.7% 99.9% 99.5%99.5% 104.1% 101.0% 102.4% 98.6% 99.8% 96.2% 101.0% 96.3% 97.6% 98.0%100.8% 99.9% 99.9% 104.4% 95.5% 100.6% 101.1% 98.1% 96.5% 101.7% 103.2%97.5% 98.7% 98.4% 93.2% 92.4% 96.6% 91.5% 92.2% 95.7% 91.4% 93.3%106.0% 108.6% 107.8% 105.4% 106.2% 102.9% 107.2% 108.4% 108.0% 102.3% 102.4%93.3% 104.8% 99.2% 96.1% 97.0% 99.5% 100.5% 102.0% 97.2% 97.6% 97.2%111.7% 132.8% 128.4% 125.4% 121.5% 125.5% 120.4% 113.3% 110.9% 114.9% 108.9%80.0% 93.1% 85.1% 86.4% 92.2% 88.7% 89.6% 90.8% 95.9% 97.4% 97.7%76.7% 82.2% 86.8% 90.7% 86.4% 84.1% 89.7% 92.0% 96.8% 96.6% 93.4%95.0% 97.3% 100.1% 94.6% 100.0% 105.5% 99.9% 104.7% 100.7% 94.0% 90.4%
Average 95.7% 101.2% 100.8% 99.3% 98.4% 100.2% 98.4% 99.0% 98.6% 99.1% 98.4%
Exhibit 2-36 GMCS Cohort Survival Ratios

Gallup-McKinley County Schools 2-29 May 2017 Facilities Master Plan 2017-2022 Draft FinalARC 21606.000
Gallup-McKinley County Schools Enrollment Projections 2001–2026
9,000
10,000
11,000
12,000
13,000
14,000
2001-02 2003-04 2005-06 2007-08 2009-10 2011-12 2013-14 2015-16 2017-18 2019-20 2021-22 2023-24 2025-26
11,507 11,500 11,511 11,570 11,574 11,615 11,669 11,63311,540
11,43711,32611,507
11,159
10,865
10,649
10,40910,293
10,19710,050
9,874
9,6829,505
13,706
13,468 13,497
13,05512,962
12,433 12,41612,284
12,465
12,232 12,17312,011
11,91211,739 11,762
11,50711,321
11,168 11,08810,941 10,938 10,936 10,894 10,825
10,72710,640
Mid Range Low Range High Range
Exhibit 2-37 Enrollment Projections by Range
2.4.2 District Enrollment ProjectionsDistrict enrollment projections use the
cohort survival method. This method tracks the number of students in a cohort (a group of students of a certain age who move together through one grade level to the next) through past grades. Calculation of survival rates (ratios of the number of students who remain from one year to the next) is based on historical enrollments. Calculation of future enrollment uses prevailing birth rates (for kindergarten) and average survival rates (for other grades). We adjusted ratios to reflect major factors identified during the growth analysis.
We prepared three enrollment projection scenarios, based on historical trends and expectations for future growth.
Low Range — uses the averages of survival ratios for the district from 2014-15 to 2016-17 (two years), assuming slower births, net
out-migration and a poor economy during the projection period. The average annual rate would be -1.9% over ten years.
Mid-Range — (most likely) uses the averages of survival ratios for each school from 2011-12 to 2016-17 (six years), assuming that births continue to decline somewhat, pre-K remains at approximately the 2016-17 level and trends stabilize in Gallup as some economic development measures succeed. The average annual rate would be -0.8% over ten years and -1.0% over 5 years.
High Range — uses the average of survival ratios for the district for the selected years of 2007-08, 2008-09 and 2015-16 (three years), and assumes some increase in pre-K over 2016-17, stabilization in births, and an improved economy that both stems out-migration and brings in some additional families. The average annual rate would be -0.2% over ten years.

Gallup-McKinley County Schools 2-30 May 2017 Facilities Master Plan 2017-2022 Draft FinalARC 21606.000
Exhibit 2-39 GMCS Projected Enrollment by LevelProjected Enrollment by School Level 2001-2026
Stud
ents
0
1,000
2,000
3,000
4,000
5,000
6,000
7,000
8,000
9,000
10,000
School Year
2001-02 2003-04 2005-06 2007-08 2009-10 2011-12 2013-14 2015-16 2018-19 2020-21 2022-23 2024-25 2026-27
4,2124,051
3,927 3,967 4,0873,924 3,981
4,5244,321 4,197
3,9943,816 3,719 3,774 3,801 3,767
3,5713,443 3,396 3,425 3,484 3,576 3,568 3,524 3,479
3,4463,721
4,0923,891
3,682
3,352 3,223
2,436 2,352 2,367 2,416 2,433 2,449 2,402 2,427 2,379 2,376 2,447 2,519 2,497 2,444 2,389 2,406 2,385 2,356
6,048
5,6965,478
5,197 5,193 5,157 5,212 5,324
5,792 5,668 5,763 5,762 5,7445,563 5,534
5,361 5,360 5,261 5,1534,999 4,992 4,954 4,900 4,891 4,865
Elementary Schools Middle Schools High Schools
Gallup / McKinley County Schools District Enrollment by Grade
3Y4YPreKKindergartenGrade 1Grade 2Grade 3Grade 4Grade 5Grade 6Grade 7Grade 8Grade 9Grade 10Grade 11Grade 12Sp-CSp-D
Gallup / McKinley County Schools District Enrollment by Grade2012-13 2013-14 2014-15 2015-16 2016-17 2017-18 2018-19 2019-20 2020-21 2021-22 2022-23 2023-24 2024-25 2025-26 2026-27
33 37 23 31 30 26 26 25 25 25 24 24 24 24 2460 43 46 38 66 44 43 42 41 41 40 40 40 39 40529 594 528 513 333 374 366 358 346 347 344 341 340 339 342924 914 868 784 808 803 741 739 675 740 732 724 716 709 708846 855 828 832 783 795 798 736 735 674 740 732 725 717 706849 824 832 831 805 773 789 790 731 736 677 744 736 728 721790 808 805 831 827 793 765 782 782 732 739 680 747 740 732787 798 778 786 814 821 796 766 785 792 744 751 692 760 753831 772 770 791 811 829 839 816 784 811 818 769 776 715 786715 766 739 704 738 766 767 792 748 736 745 759 712 718 661788 775 827 756 721 770 797 803 821 771 764 776 789 741 748788 804 753 807 735 710 753 781 786 804 755 746 756 769 721966 893 892 865 879 840 819 873 896 901 918 871 864 864 884829 877 856 869 845 813 778 759 806 828 830 850 802 792 801761 763 849 827 812 791 746 712 698 737 759 760 781 734 725848 797 768 798 748 757 734 695 665 648 685 705 706 725 685300 267 266 314 366 293 290 290 289 289 291 291 288 284 281367 325 311 385 386 323 322 328 328 329 330 331 331 329 323
Total% ChangeBasic
12,011 11,912 11,739 11,762 11,507 11,321 11,168 11,088 10,941 10,938 10,936 10,894 10,825 10,727 10,640-1.3% -0.8% -1.5% 0.2% -2.2% -1.6% -1.4% -0.7% -1.3% 0.0% 0.0% -0.4% -0.6% -0.9% -0.8%10,722 10,646 10,565 10,481 10,326 10,260 10,120 10,045 9,912 9,909 9,907 9,868 9,802 9,711 9,630
Exhibit 2-38 Enrollment Projections by Grade
Enrollment Projections by School Level ARC expects these average annual rates of
decline in enrollment over the next 10 years: elementary schools, -0.9%; middle schools,
-0.5%; and high schools, -0.8%. By school level, ES’s are expected to have 222 fewer students in 2026-27 compared to 2016-17; MS’s will have 127 fewer students, and HS’s, 294 fewer students.

Gallup-McKinley County Schools 2-31 May 2017 Facilities Master Plan 2017-2022 Draft FinalARC 21606.000
Elementary SchoolsARC projects in our mid-range series that
elementary school enrollment will decline at an average annual rate of -0.6% in Gallup and -0.9% across the district.
Exhibit 2-41 GMCS Middle School Enrollment ProjectionsMiddle Schools
Chief Manuelito MiddleGallup MiddleJohn F. Kennedy Middle
2013-14 2014-15 2015-16 2016-17 2017-18 2018-19 2019-20 2020-21 2021-22 2022-23 2023-24 2024-25 2025-26 2026-27633 600 609 608 600 597 655 636 635 593 603 597 596 573439 421 429 415 402 405 407 407 414 406 415 411 411 388668 684 680 663 668 685 701 722 698 708 699 721 710 687
Crownpoint MiddleNavajo MiddleThoreau MiddleTohatchi Middle
Total - All MS's
142 137 143 144 166 167 170 169 180 175 177 164 163 154114 111 121 128 129 146 140 141 132 126 119 114 116 110256 257 250 232 239 259 260 236 209 203 217 207 198 188197 192 195 189 172 187 186 186 176 179 175 172 161 152
2,449 2,402 2,427 2,379 2,376 2,447 2,519 2,497 2,444 2,389 2,406 2,385 2,356 2,252
Gallup Area Elementary Schools (Pre-K to 5)
Chee Dodge Catherine A. MillerDavid SkeetIndian HillsJeffersonJuan de Oñate LincolnRed RockRocky ViewRooseveltStage CoachTobe TurpenWashingtonTotal (Pre-K to 5)
Gallup Area Elementary Schools (Pre-K to 5)2013-14 2014-15 2015-16 2016-17 2017-18 2018-19 2019-20 2020-21 2021-22 2022-23 2023-24 2024-25 2025-26 2026-27
394 369 355 317 314 305 290 285 280 285 281 279 277 278344 345 359 386 401 397 404 377 376 363 366 371 373 379218 203 208 185 188 190 191 182 178 173 169 168 167 168342 306 287 291 290 283 287 271 277 263 258 256 254 256291 304 310 338 344 327 313 287 298 307 310 311 311 318370 336 325 236 243 241 241 235 234 238 235 233 232 233266 252 253 233 233 231 222 218 212 217 213 212 211 212383 364 344 386 374 380 384 384 393 386 378 375 372 376376 350 325 320 319 312 303 304 315 323 324 325 322 321265 261 265 202 201 199 194 191 187 192 189 188 186 187336 326 304 308 297 289 272 264 267 257 253 252 250 251379 363 394 415 427 424 415 397 407 405 410 416 417 421238 227 217 217 213 220 207 207 207 206 202 201 199 200
4,202 4,006 3,946 3,834 3,844 3,799 3,720 3,603 3,631 3,615 3,586 3,585 3,570 3,600
Elementary Schools in Other Parts of McKinley CountyCrownpointNavajoRamahThoreau
Elementary Schools in Other Parts of McKinley County324 374 367 348 346 344 339 333 318 318 311 310 306 309275 269 306 268 264 249 245 232 226 229 224 223 221 223184 182 190 183 184 183 183 179 174 170 167 166 164 165325 341 315 319 314 293 282 283 276 270 265 263 261 263
TohatchiTwin LakesTotal (Pre-K to 5)
Total - All ES's
226 199 209 209 207 199 193 183 187 184 181 180 179 180208 192 201 200 202 194 191 186 180 169 166 165 164 165
1,542 1,557 1,588 1,527 1,516 1,462 1,434 1,396 1,361 1,339 1,314 1,306 1,295 1,3055,744 5,563 5,534 5,361 5,360 5,261 5,153 4,999 4,992 4,954 4,900 4,891 4,865 4,905
Exhibit 2-40 GMCS Elementary School Enrollment Projections
Middle SchoolsWe project that middle school enrollment
will decline by -0.5% per year on average.

Gallup-McKinley County Schools 2-32 May 2017 Facilities Master Plan 2017-2022 Draft FinalARC 21606.000
Exhibit 2-42 GMCS High School Enrollment ProjectionsHigh Schools
Gallup HighGallup Central AlternativeMiddle College HighMiyamura HighCrownpoint HighTse'Yi'Gai HighNavajo Pine HighRamah High (7-12)Thoreau HighTohachi High
Total - All HS'sTotal
2013-14 2014-15 2015-16 2016-17 2017-18 2018-19 2019-20 2020-21 2021-22 2022-23 2023-24 2024-25 2025-26 2026-27972 935 943 925 853 837 845 845 849 886 888 877 876 861201 281 259 237 241 223 195 195 199 204 209 209 209 20467 70 71 98 88 69 53 54 56 57 60 61 62 62
1,127 1,152 1,192 1,170 1,123 1,105 1,089 1,111 1,127 1,149 1,172 1,153 1,164 1,176296 270 264 254 223 224 227 227 243 246 248 245 228 224112 128 116 113 103 108 108 112 117 116 115 121 119 119124 146 152 140 129 110 114 118 126 128 127 124 113 112186 191 198 192 178 175 176 184 187 195 192 190 188 184324 331 350 361 338 326 321 323 337 340 308 303 283 279310 270 256 277 304 278 283 272 257 265 263 258 257 253
3,719 3,774 3,801 3,767 3,580 3,456 3,412 3,441 3,498 3,587 3,582 3,541 3,498 3,47311,912 11,739 11,762 11,507 11,317 11,164 11,084 10,937 10,933 10,930 10,887 10,817 10,718 10,630
High SchoolsWe expect high school enrollment will decline by -0.8% per year on average.
ConclusionARC anticipates that GMCS enrollment will continue to decline at approximately the same
rate in the next 10 years as during the past 10 years (-0.8% per year). This rate of loss is slow, consistent with births, general population and employment trends.

Gallup-McKinley County Schools 2-33 May 2017 Facilities Master Plan 2017-2022 Draft FinalARC 21606.000
Detailed Enrollment ProjectionsThe following tables present detailed enrollment projection data.
Gallup-McKinley County Schools
Gallup4/17/17 Page 1 of 4
Chee Dodge Elem 2013-14 2014-15 2015-16 2016-17 2017-18 2018-19 2019-20 2020-21 2021-22 2022-23 2023-24 2024-25 2025-26 2026-273Y 2 1 2 3 2 2 2 2 2 2 2 2 2 24Y 3 2 3 3 3 3 2 2 2 2 2 2 2 2Title 1: 3-4 years old 54 41 34 27 31 30 29 28 28 28 28 28 28 28Kindergarten 64 50 48 39 49 46 45 42 45 45 44 44 43 43Grade 1 60 63 46 49 37 47 43 43 39 43 43 42 42 41Grade 2 51 56 58 42 49 37 47 43 43 39 43 42 42 41Grade 3 65 50 51 54 39 45 34 43 40 40 36 40 39 39Grade 4 38 65 49 48 55 40 46 35 44 41 41 37 41 40Grade 5 57 38 60 47 47 54 39 45 34 43 40 40 36 40Sp-C 0 3 1 2 1 1 1 1 1 1 1 1 1 1Sp-D 0 0 3 3 1 1 1 1 1 1 1 1 1 1Sp-DDTotal 394 369 355 317 314 305 290 285 280 285 281 279 277 278% Change 9.9% -6.4% -3.6% -9.3% -0.8% -2.4% -4.3% -1.1% -1.6% 1.6% -1.5% -0.6% -0.7% 0.6%
Catherine A. Miller 2013-14 2014-15 2015-16 2016-17 2017-18 2018-19 2019-20 2020-21 2021-22 2022-23 2023-24 2024-25 2025-26 2026-273Y 5 0 0 3 2 1 2 1 1 1 1 1 1 14Y 3 7 1 5 4 4 4 3 3 3 3 3 3 3Title 1: 3-4 years old 37 34 31 27 38 38 38 36 36 34 35 35 35 36Kindergarten 61 56 57 68 52 48 48 44 48 47 47 46 46 46Grade 1 48 56 65 53 74 57 52 52 48 54 53 53 52 52Grade 2 51 47 54 71 53 73 56 52 52 49 56 56 55 54Grade 3 42 48 47 44 67 50 70 54 49 51 49 55 55 54Grade 4 48 38 48 52 44 67 50 69 53 51 53 50 57 57Grade 5 36 49 42 55 55 46 71 53 73 58 56 58 55 63Sp-C 5 5 8 4 7 7 7 7 7 7 7 7 7 7Sp-D 8 5 6 4 6 6 6 5 5 5 5 5 5 5Sp-DDTotal 344 345 359 386 401 397 404 377 376 363 366 371 373 379% Change 4.6% 0.4% 5.3% 9.4% 5.1% -1.2% 1.9% -7.9% -0.1% -3.8% 0.8% 1.3% 0.5% 1.5%
David Skeet Elem 2013-14 2014-15 2015-16 2016-17 2017-18 2018-19 2019-20 2020-21 2021-22 2022-23 2023-24 2024-25 2025-26 2026-273Y 4 0 0 1 1 1 1 1 1 1 1 1 1 14Y 2 5 1 4 2 2 2 2 2 2 2 2 2 2Title 1: 3-4 years old 24 10 16 10 13 13 13 13 12 12 12 12 12 12Kindergarten 26 30 25 26 25 23 23 21 23 23 22 22 22 22Grade 1 24 25 27 25 25 24 22 22 20 22 22 22 21 21Grade 2 26 31 25 29 27 27 26 24 24 22 23 23 23 23Grade 3 29 22 29 24 29 27 27 26 24 24 22 24 23 23Grade 4 42 43 37 33 33 40 37 37 35 33 33 30 33 32Grade 5 41 36 42 32 31 31 37 34 35 33 30 30 28 30Sp-C 0 1 4 1 1 1 1 1 1 1 1 1 1 1Sp-D 0 0 2 0 1 1 1 1 1 1 1 1 1 1Sp-DDTotal 218 203 208 185 188 190 191 182 178 173 169 168 167 168% Change -2.4% -6.6% 2.2% -11.1% 1.8% 1.1% 0.3% -4.7% -2.1% -3.0% -2.0% -1.1% -0.6% 1.0%
Indian Hills Elem 2013-14 2014-15 2015-16 2016-17 2017-18 2018-19 2019-20 2020-21 2021-22 2022-23 2023-24 2024-25 2025-26 2026-273Y 2 1 1 5 2 2 2 2 2 2 2 2 2 24Y 4 2 4 4 2 2 2 2 2 2 2 2 2 2Title 1: 3-4 years old 55 48 38 21 23 22 22 21 22 20 20 20 20 20Kindergarten 43 45 38 48 39 36 36 33 36 36 35 35 35 35Grade 1 41 34 49 35 52 43 40 40 36 40 39 39 38 38Grade 2 50 37 32 48 33 49 41 38 38 34 38 37 37 36Grade 3 38 46 41 37 49 34 51 42 39 39 36 39 38 38Grade 4 54 39 39 45 37 50 34 52 43 39 39 36 39 39Grade 5 50 50 42 43 46 39 52 36 54 45 41 41 37 41Sp-C 0 1 1 1 2 2 2 2 2 2 2 2 2 2Sp-D 5 3 2 4 4 4 4 3 4 3 3 3 3 3Sp-DDTotal 342 306 287 291 290 283 287 271 277 263 258 256 254 256% Change 3.4% -10.5% -5.8% 1.4% -0.5% -2.2% 1.2% -5.4% 2.3% -5.2% -1.9% -0.6% -0.8% 0.8%
Exhibit 2-43 GMCS Detailed ES Enrollment Projections by School and by Grade

Gallup-McKinley County Schools 2-34 May 2017 Facilities Master Plan 2017-2022 Draft FinalARC 21606.000
Gallup-McKinley County Schools
Gallup4/17/17 Page 2 of 4
Jefferson Elem 2013-14 2014-15 2015-16 2016-17 2017-18 2018-19 2019-20 2020-21 2021-22 2022-23 2023-24 2024-25 2025-26 2026-273Y 1 3 6 2 2 2 2 2 2 2 2 2 2 24Y 1 0 3 5 2 2 2 2 2 2 2 2 2 2Title 1: 3-4 years old 23 40 34 22 32 30 29 27 28 28 29 29 29 29Kindergarten 51 53 45 48 46 43 43 39 45 45 44 44 43 43Grade 1 56 41 50 45 45 46 42 42 39 45 44 44 43 43Grade 2 35 50 44 59 41 41 42 41 41 38 44 43 43 42Grade 3 35 34 48 50 57 40 40 41 43 42 39 45 44 44Grade 4 42 31 40 54 52 59 41 41 45 46 46 42 49 48Grade 5 40 41 34 46 56 53 61 43 45 49 51 51 47 54Sp-C 3 6 3 1 6 5 5 5 5 5 5 5 5 5Sp-D 4 5 3 6 5 4 4 4 4 4 4 4 4 4Sp-DDTotal 291 304 310 338 344 327 313 287 298 307 310 311 311 318% Change -2.1% 5.3% 2.4% 9.0% 1.8% -5.0% -4.4% -8.2% 4.0% 2.9% 1.1% 0.2% 0.1% 2.0%
Juan de Oñate 2013-14 2014-15 2015-16 2016-17 2017-18 2018-19 2019-20 2020-21 2021-22 2022-23 2023-24 2024-25 2025-26 2026-273Y 1 1 2 0 1 1 1 1 1 1 1 1 1 14Y 2 2 4 4 3 3 3 3 2 3 3 2 2 2Title 1: 3-4 years old 51 36 29 13 18 18 18 17 17 18 17 17 17 17Kindergarten 59 51 44 36 46 42 42 39 42 42 41 41 40 40Grade 1 52 48 50 41 33 43 39 39 36 39 39 38 38 38Grade 2 51 48 48 39 39 32 41 38 38 34 37 37 37 36Grade 3 53 42 43 34 35 35 28 36 33 33 31 33 33 33Grade 4 53 53 41 33 31 32 32 26 34 31 31 28 31 30Grade 5 43 48 56 23 31 29 30 30 25 31 29 29 26 29Sp-C 3 4 1 3 2 2 2 2 2 2 2 2 2 2Sp-D 2 3 7 10 4 4 4 4 4 4 4 4 4 4Total 370 336 325 236 243 241 241 235 234 238 235 233 232 233% Change -0.7% -11.1% -3.4% -27.4% 3.1% -1.0% -0.1% -2.3% -0.5% 1.8% -1.5% -0.6% -0.7% 0.5%
Lincoln Elem 2013-14 2014-15 2015-16 2016-17 2017-18 2018-19 2019-20 2020-21 2021-22 2022-23 2023-24 2024-25 2025-26 2026-273Y 3 3 1 0 2 2 2 2 2 2 2 2 2 24Y 1 2 4 3 3 3 3 2 2 2 2 2 2 2Title 1: 3-4 years old 24 23 26 11 11 11 10 10 10 10 10 10 10 10Kindergarten 39 39 41 29 39 36 35 32 35 35 35 34 34 34Grade 1 38 34 36 40 27 36 33 33 30 33 33 33 32 32Grade 2 44 36 40 32 38 26 35 32 32 29 32 32 31 31Grade 3 41 42 32 41 32 39 27 35 33 32 30 32 32 32Grade 4 35 30 38 34 41 32 39 27 35 33 32 30 32 32Grade 5 27 36 29 37 32 38 30 36 25 33 30 30 28 30Sp-C 9 4 3 5 5 5 5 5 5 5 5 5 5 5Sp-D 5 3 3 1 3 3 3 3 3 3 3 3 3 3Sp-DDTotal 266 252 253 233 233 231 222 218 212 217 213 212 211 212% Change -3.6% -5.9% 0.4% -7.9% 0.0% -0.9% -3.9% -1.8% -2.8% 2.6% -1.8% -0.6% -0.7% 0.6%
Red Rock Elem 2013-14 2014-15 2015-16 2016-17 2017-18 2018-19 2019-20 2020-21 2021-22 2022-23 2023-24 2024-25 2025-26 2026-273Y 1 4 2 0 2 2 2 2 2 2 2 2 2 24Y 5 0 2 9 3 3 3 3 3 3 3 3 3 3Title 1: 3-4 years old 24 21 23 26 14 15 15 15 15 15 14 14 14 14Kindergarten 58 55 42 54 51 47 47 43 47 46 46 45 45 45Grade 1 62 54 51 51 58 59 54 54 49 54 53 53 52 51Grade 2 50 61 57 57 51 62 62 57 57 52 57 57 56 55Grade 3 56 52 58 61 57 54 66 66 61 61 55 60 60 59Grade 4 58 54 53 64 63 62 59 71 72 66 66 60 66 65Grade 5 62 59 49 58 66 69 68 65 78 79 72 72 66 72Sp-C 2 1 3 2 4 4 4 4 4 4 4 4 4 4Sp-D 5 3 4 4 5 5 5 5 5 5 5 5 5 5Sp-DDTotal 383 364 344 386 374 380 384 384 393 386 378 375 372 376% Change -4.8% -5.1% -5.3% 12.2% -3.1% 1.7% 0.9% 0.1% 2.3% -1.8% -2.2% -0.7% -0.9% 1.0%
Exhibit 2-43 GMCS Detailed ES Enrollment Projections by School and by Grade Continued

Gallup-McKinley County Schools 2-35 May 2017 Facilities Master Plan 2017-2022 Draft FinalARC 21606.000
Gallup-McKinley County Schools
Gallup4/17/17 Page 3 of 4
Rocky View Elem 2013-14 2014-15 2015-16 2016-17 2017-18 2018-19 2019-20 2020-21 2021-22 2022-23 2023-24 2024-25 2025-26 2026-273Y 0 0 1 1 1 1 1 1 1 1 1 1 1 14Y 4 3 1 2 2 2 2 2 2 2 2 2 2 2Title 1: 3-4 years old 54 48 43 26 25 25 24 24 25 26 26 26 26 26Kindergarten 56 48 49 51 52 48 48 44 48 47 47 46 46 46Grade 1 60 57 45 52 52 56 52 52 47 52 51 51 50 47Grade 2 52 53 49 40 47 47 51 47 50 46 50 49 49 48Grade 3 62 47 47 54 38 44 44 48 47 50 45 50 49 49Grade 4 42 48 38 47 49 34 40 40 46 45 48 44 48 47Grade 5 39 34 43 45 44 46 32 38 40 46 45 48 44 48Sp-C 6 10 7 0 5 5 4 4 5 5 5 5 5 5Sp-D 1 2 2 2 3 3 3 3 3 3 3 3 3 3Total 376 350 325 320 319 312 303 304 315 323 324 325 322 321% Change -3.6% -8.2% -7.5% -1.5% -0.4% -2.0% -3.1% 0.5% 3.5% 2.6% 0.2% 0.4% -0.8% -0.3%
Roosevelt Elem 2013-14 2014-15 2015-16 2016-17 2017-18 2018-19 2019-20 2020-21 2021-22 2022-23 2023-24 2024-25 2025-26 2026-273Y 0 1 1 0 1 0 0 0 0 0 0 0 0 04Y 0 2 1 2 1 1 1 1 1 1 1 1 1 1Title 1: 3-4 years old 26 24 23 11 17 17 17 16 16 16 16 16 16 16Kindergarten 41 36 40 24 32 30 30 27 29 29 29 29 28 28Grade 1 35 37 37 35 25 34 31 31 28 31 31 30 30 30Grade 2 46 37 45 32 35 25 34 31 31 29 31 31 31 30Grade 3 43 47 39 35 30 34 24 32 30 30 27 30 29 29Grade 4 43 40 39 28 31 27 30 22 29 27 27 25 27 26Grade 5 29 37 40 35 27 31 27 29 21 28 26 26 24 26Sp-C 2 0 0 0 1 0 0 0 0 0 0 0 0 0Sp-D 0 0 0 0 0 0 0 0 0 0 0 0 0 0Total 265 261 265 202 201 199 194 191 187 192 189 188 186 187% Change -4.2% -1.8% 1.7% -23.8% -0.7% -0.8% -2.5% -1.6% -2.1% 2.6% -1.6% -0.5% -0.8% 0.5%
Stage Coach Elem 2013-14 2014-15 2015-16 2016-17 2017-18 2018-19 2019-20 2020-21 2021-22 2022-23 2023-24 2024-25 2025-26 2026-273Y 2 1 3 4 2 2 2 2 2 1 1 1 1 14Y 3 2 2 4 2 2 2 2 2 2 2 2 2 2Title 1: 3-4 years old 26 22 30 25 25 24 23 22 22 21 21 21 21 21Kindergarten 55 52 45 53 47 43 43 39 43 42 42 41 41 41Grade 1 48 51 42 35 48 42 39 39 36 39 38 38 38 37Grade 2 52 48 47 42 35 48 42 39 39 36 39 38 38 38Grade 3 52 53 45 56 42 35 48 42 39 39 35 38 38 38Grade 4 45 46 49 42 52 38 32 44 39 36 36 32 35 35Grade 5 51 48 39 45 41 50 37 31 42 37 34 34 31 34Sp-C 1 2 1 0 3 3 3 3 3 3 3 3 3 3Sp-D 1 1 1 2 2 1 1 1 1 1 1 1 1 1Total 336 326 304 308 297 289 272 264 267 257 253 252 250 251% Change 2.2% -3.3% -6.5% 1.3% -3.5% -2.8% -6.0% -2.9% 1.3% -3.7% -1.7% -0.5% -0.8% 0.6%
Tobe Turpen Elem 2013-14 2014-15 2015-16 2016-17 2017-18 2018-19 2019-20 2020-21 2021-22 2022-23 2023-24 2024-25 2025-26 2026-273Y 5 3 1 3 3 3 3 2 3 3 3 3 3 34Y 2 4 3 4 3 3 3 3 3 3 3 3 3 3Title 1: 3-4 years old 27 34 41 22 27 26 26 25 25 25 26 26 26 26Kindergarten 72 67 59 73 63 58 58 53 58 58 57 56 56 56Grade 1 60 57 64 58 66 58 53 53 51 56 56 55 54 54Grade 2 57 54 58 65 59 68 59 54 58 56 61 60 60 59Grade 3 47 52 61 66 69 62 72 62 61 64 62 68 67 67Grade 4 46 47 55 64 69 72 65 75 69 67 71 69 75 75Grade 5 58 41 51 57 64 69 72 65 75 69 67 71 69 75Sp-C 1 1 0 0 1 1 1 1 1 1 1 1 1 1Sp-D 4 3 1 3 3 3 3 3 3 3 3 3 3 3Total 379 363 394 415 427 424 415 397 407 405 410 416 417 421% Change 1.6% -4.2% 8.5% 5.3% 3.0% -0.9% -2.1% -4.2% 2.4% -0.4% 1.1% 1.5% 0.4% 0.9%
Exhibit 2-43 GMCS Detailed ES Enrollment Projections by School and by Grade Continued

Gallup-McKinley County Schools 2-36 May 2017 Facilities Master Plan 2017-2022 Draft FinalARC 21606.000
Gallup-McKinley County Schools
Gallup4/17/17 Page 1 of 1
Chief Manuelito Middle 2013-14 2014-15 2015-16 2016-17 2017-18 2018-19 2019-20 2020-21 2021-22 2022-23 2023-24 2024-25 2025-26 2026-27Grade 6 214 191 181 172 200 185 225 183 185 185 192 180 184 171Grade 7 192 197 173 180 165 191 178 216 175 178 177 184 173 176Grade 8 197 184 179 161 177 162 188 175 212 173 175 174 181 170Sp-C 20 14 19 11 20 20 22 21 21 19 20 20 20 19Sp-D 10 14 57 84 39 39 43 41 41 38 39 39 39 37Total 633 600 609 608 600 597 655 636 635 593 603 597 596 573% Change -0.8% -5.2% 1.5% -0.2% -1.3% -0.5% 9.7% -3.0% -0.1% -6.7% 1.7% -1.0% -0.2% -3.8%
Gallup Middle 2013-14 2014-15 2015-16 2016-17 2017-18 2018-19 2019-20 2020-21 2021-22 2022-23 2023-24 2024-25 2025-26 2026-27Grade 6 122 132 122 124 121 117 126 121 123 119 129 119 119 109Grade 7 140 124 130 114 124 121 116 126 121 123 119 129 119 119Grade 8 128 120 128 121 112 121 119 114 123 119 120 116 126 117Sp-C 6 15 11 8 9 9 9 9 9 9 9 9 9 9Sp-D 43 30 38 48 37 37 37 37 38 37 38 37 37 35Total 439 421 429 415 402 405 407 407 414 406 415 411 411 388% Change 0.5% -4.1% 1.9% -3.3% -3.1% 0.6% 0.5% 0.0% 1.8% -1.9% 2.2% -1.1% 0.0% -5.6%
John F Kennedy Mid 2013-14 2014-15 2015-16 2016-17 2017-18 2018-19 2019-20 2020-21 2021-22 2022-23 2023-24 2024-25 2025-26 2026-27Grade 6 196 196 190 190 198 204 203 217 183 213 209 201 204 188Grade 7 202 211 201 198 199 208 214 213 227 191 223 219 210 214Grade 8 199 206 208 186 196 197 206 211 211 224 189 221 216 208Sp-C 9 8 14 21 11 11 11 11 11 11 11 11 11 11Sp-D 62 63 67 68 64 66 67 69 67 68 67 69 68 66Total 668 684 680 663 668 685 701 722 698 708 699 721 710 687% Change -1.6% 3.3% -0.7% -2.5% 0.8% 2.6% 2.3% 2.9% -3.2% 1.4% -1.2% 3.1% -1.4% -3.3%
Exhibit 2-44 GMCS Detailed MS Enrollment Projections by School and by Grade
Gallup-McKinley County Schools
Gallup4/17/17 Page 1 of 1
Gallup High 2013-14 2014-15 2015-16 2016-17 2017-18 2018-19 2019-20 2020-21 2021-22 2022-23 2023-24 2024-25 2025-26 2026-27Grade 9 257 224 203 234 211 216 212 230 216 251 218 221 217 230Grade 10 243 226 211 186 216 195 199 196 212 199 231 201 204 200Grade 11 201 229 214 192 166 192 173 178 174 189 178 206 179 182Grade 12 194 180 206 194 181 156 181 164 168 165 178 168 195 169Sp-C 18 14 34 88 29 29 29 29 29 30 30 30 30 29Sp-D 59 62 75 31 50 49 50 50 50 52 52 52 52 51Total 972 935 943 925 853 837 845 845 849 886 888 877 876 861% Change -2.0% -2.3% 0.5% -1.9% -7.8% -1.9% 0.9% 0.0% 0.4% 4.4% 0.2% -1.2% -0.1% -1.8%
Gallup Central Alt 2013-14 2014-15 2015-16 2016-17 2017-18 2018-19 2019-20 2020-21 2021-22 2022-23 2023-24 2024-25 2025-26 2026-27Grade 6 0 0 0Grade 7 4 3 1Grade 8 7 5 0 0 0 0 0 0 0 0 0 0 0Grade 9 25 29 34 26 24 25 25 27 26 29 27 25 27 27Grade 10 30 61 54 65 45 42 44 43 46 45 49 47 44 46Grade 11 37 83 73 80 98 68 64 66 65 70 68 74 70 66Grade 12 96 89 74 52 64 78 54 51 53 52 56 55 60 56Sp-C 2 4 8 10 5 4 4 4 4 4 4 4 4 4Sp-D 0 7 15 4 5 5 4 4 4 4 4 4 4 4Total 201 281 259 237 241 223 195 195 199 204 209 209 209 204% Change -2.5% 33.8% -8.4% -8.5% 1.7% -7.6% -12.6% 0.2% 1.9% 2.7% 2.2% 0.3% -0.3% -2.3%
Middle College High 2013-14 2014-15 2015-16 2016-17 2017-18 2018-19 2019-20 2020-21 2021-22 2022-23 2023-24 2024-25 2025-26 2026-27Grade 9 0 0 0 0 0 0 0 0 0 0 0 0 0Grade 10 14 14 7 25 13 12 13 13 13 13 14 13 13 13Grade 11 17 38 25 34 30 15 15 15 15 16 16 17 16 15Grade 12 36 18 39 39 39 34 18 17 17 17 18 18 19 18Sp-C 0 0 0 0 0 0 0 0 0 0 0 0 0Sp-D 0 0 0 6 7 8 9 10 11 12 13 14 15Total 67 70 71 98 88 69 53 54 56 57 60 61 62 62% Change 6.3% 4.5% 1.4% 38.0% -10.3% -21.2% -23.3% 1.4% 3.6% 2.8% 4.4% 2.1% 1.7% -0.2%
Miyamura High 2013-14 2014-15 2015-16 2016-17 2017-18 2018-19 2019-20 2020-21 2021-22 2022-23 2023-24 2024-25 2025-26 2026-27Grade 9 294 315 316 287 294 295 305 310 311 319 328 296 322 328Grade 10 296 268 295 295 256 262 263 272 277 278 285 293 265 288Grade 11 237 245 239 242 252 219 225 225 233 237 238 244 251 226Grade 12 199 219 226 212 221 231 201 206 206 213 217 218 223 230Sp-C 75 69 90 113 73 72 70 72 73 74 76 75 75 76Sp-D 26 36 26 21 26 26 26 26 26 27 27 27 27 28Total 1,127 1,152 1,192 1,170 1,123 1,105 1,089 1,111 1,127 1,149 1,172 1,153 1,164 1,176% Change 1.3% 2.2% 3.5% -1.8% -4.0% -1.6% -1.4% 2.0% 1.4% 2.0% 2.0% -1.6% 0.9% 1.0%
Exhibit 2-45 GMCS Detailed HS Enrollment Projections by School and by Grade

Gallup-McKinley County Schools 2-37 May 2017 Facilities Master Plan 2017-2022 Draft FinalARC 21606.000
Gallup-McKinley County Schools
Crownpoint4/17/17
Crownpoint Elem. 2013-14 2014-15 2015-16 2016-17 2017-18 2018-19 2019-20 2020-21 2021-22 2022-23 2023-24 2024-25 2025-26 2026-273Y 2 4 5 2 3 3 3 3 3 3 3 3 3 34Y 7 3 6 6 6 6 6 5 5 5 5 5 5 5Title 1: 3-4 years old 25 24 22 6 6 6 6 6 6 6 5 5 5 5Kindergarten 58 67 53 50 54 50 49 45 49 49 48 48 47 47Grade 1 50 55 59 61 50 53 49 49 45 49 48 48 47 47Grade 2 52 57 53 52 61 49 53 49 49 45 49 48 48 47Grade 3 43 51 56 53 53 61 50 53 49 49 45 49 49 48Grade 4 45 54 51 49 50 50 58 47 51 47 47 43 46 46Grade 5 38 55 53 59 57 59 58 68 55 59 55 55 50 54Grade 6Sp-C 4 1 3 5 3 3 3 3 3 3 3 3 3 3Sp-D 0 3 6 5 3 3 3 3 3 3 3 3 3 3Sp-DDTotal 324 374 367 348 346 344 339 333 318 318 311 310 306 309% Change 8.4% 15.4% -1.9% -5.2% -0.6% -0.7% -1.3% -1.9% -4.3% -0.2% -2.0% -0.5% -1.0% 0.9%
Crownpoint Middle 2013-14 2014-15 2015-16 2016-17 2017-18 2018-19 2019-20 2020-21 2021-22 2022-23 2023-24 2024-25 2025-26 2026-27Grade 6 48 33 52 53 56 54 55 55 64 52 56 52 52 47Grade 7 39 52 31 49 49 52 50 52 51 60 49 52 48 48Grade 8 44 43 56 35 50 50 53 51 53 52 61 49 53 49Sp-C 4 6 4 0 4 4 4 4 4 4 4 4 4 4Sp-D 7 3 0 7 7 7 7 7 7 7 7 7 7 6Total 142 137 143 144 166 167 170 169 180 175 177 164 163 154% Change 11.8% -3.5% 4.4% 0.7% 15.1% 0.9% 1.5% -0.5% 6.2% -2.3% 0.8% -7.3% -0.3% -5.7%
Crownpoint High 2013-14 2014-15 2015-16 2016-17 2017-18 2018-19 2019-20 2020-21 2021-22 2022-23 2023-24 2024-25 2025-26 2026-27Grade 7Grade 8Grade 9 75 60 71 75 47 67 68 71 69 71 70 74 60 64Grade 10 66 60 51 53 60 38 54 54 57 55 57 51 53 48Grade 11 69 57 60 50 47 53 33 48 48 50 49 50 45 47Grade 12 55 61 59 51 47 44 49 31 44 45 47 46 47 42Sp-C 21 24 12 15 14 14 15 15 16 16 16 16 15 14Sp-D 10 8 11 10 8 8 8 8 9 9 9 9 8 8Total 296 270 264 254 223 224 227 227 243 246 248 245 228 224% Change -8.6% -8.8% -2.2% -3.8% -12.2% 0.5% 1.4% -0.1% 7.0% 1.3% 0.7% -1.3% -7.1% -1.7%
Tse'Yi'Gai High 2013-14 2014-15 2015-16 2016-17 2017-18 2018-19 2019-20 2020-21 2021-22 2022-23 2023-24 2024-25 2025-26 2026-27Grade 8 5Grade 9 32 32 26 28 21 30 31 32 31 32 32 37 30 32Grade 10 24 36 27 29 26 20 28 28 28 27 28 28 32 26Grade 11 18 27 27 22 27 24 18 26 25 25 24 25 25 29Grade 12 26 22 25 25 22 27 24 18 25 24 24 23 23 23Sp-C 4 8 9 4 5 6 6 6 6 6 6 6 6 6Sp-D 8 3 2 0 1 2 2 2 2 2 2 2 2 2Total 112 128 116 113 103 108 108 112 117 116 115 121 119 119% Change 8.7% 14.3% -9.4% -2.6% -8.9% 5.2% -0.1% 3.8% 4.2% -1.0% -0.3% 4.6% -1.7% 0.1%
Exhibit 2-46 Crownpoint Detailed Enrollment Projections by School and by Grade

Gallup-McKinley County Schools 2-38 May 2017 Facilities Master Plan 2017-2022 Draft FinalARC 21606.000
Gallup-McKinley County Schools
Navajo4/17/17 Page 1 of 1
Navajo Elementary 2013-14 2014-15 2015-16 2016-17 2017-18 2018-19 2019-20 2020-21 2021-22 2022-23 2023-24 2024-25 2025-26 2026-273Y 2 1 1 0 1 1 1 1 1 1 1 1 1 14Y 1 3 1 2 2 2 2 2 2 2 2 2 2 2Title 1: 3-4 years old 27 22 23 14 14 13 13 12 12 12 12 12 12 12Kindergarten 50 45 42 35 41 38 38 34 37 37 37 36 36 36Grade 1 44 45 49 39 32 37 34 34 31 34 34 33 33 33Grade 2 40 40 49 44 40 33 38 35 35 32 35 35 35 34Grade 3 38 43 51 39 43 40 32 38 35 35 32 34 34 34Grade 4 38 35 44 47 39 43 40 32 38 35 35 32 34 34Grade 5 32 34 40 45 50 41 45 42 34 40 37 36 33 36Grade 6Sp-C 1 0 5 2 1 1 1 1 1 1 1 1 1 1Sp-D 2 1 1 1 1 1 1 1 1 1 1 1 1 1Sp-DDTotal 275 269 306 268 264 249 245 232 226 229 224 223 221 223% Change -1.4% -2.2% 13.8% -12.4% -1.7% -5.5% -1.7% -5.2% -2.4% 1.0% -1.8% -0.6% -0.9% 0.8%
Navajo Middle 2013-14 2014-15 2015-16 2016-17 2017-18 2018-19 2019-20 2020-21 2021-22 2022-23 2023-24 2024-25 2025-26 2026-27Grade 6 29 35 35 44 42 47 39 43 39 32 37 34 34 31Grade 7 29 40 41 33 46 45 49 41 45 41 34 39 36 36Grade 8 50 36 40 42 34 48 46 51 42 46 43 35 40 37Sp-C 5 0 5 8 5 6 5 5 5 5 5 4 4 4Sp-D 1 0 0 1 1 1 1 1 1 1 1 1 1 1Total 114 111 121 128 129 146 140 141 132 126 119 114 116 110% Change -13.0% -2.6% 9.0% 5.8% 0.5% 13.3% -3.7% 0.2% -5.9% -5.2% -5.1% -4.6% 2.4% -5.6%
Navajo Pine High 2013-14 2014-15 2015-16 2016-17 2017-18 2018-19 2019-20 2020-21 2021-22 2022-23 2023-24 2024-25 2025-26 2026-27Grade 7 0 0 0Grade 8 0 0 0Grade 9 34 45 35 34 35 28 40 38 42 35 38 35 29 34Grade 10 41 35 40 33 29 30 24 34 33 36 30 33 30 25Grade 11 24 36 33 40 29 25 26 21 30 29 31 26 29 26Grade 12 21 26 37 23 30 22 19 20 16 22 22 24 20 22Sp-C 2 1 4 5 3 3 3 3 3 3 3 3 3 3Sp-D 2 3 3 5 3 2 2 2 2 2 2 2 2 2Total 124 146 152 140 129 110 114 118 126 128 127 124 113 112% Change 0.0% 17.7% 4.1% -7.9% -8.0% -14.4% 3.6% 3.6% 6.6% 1.3% -0.4% -2.6% -8.9% -1.1%
Exhibit 2-47 Navajo Detailed Enrollment Projections by School and by Grade
Gallup-McKinley County Schools
Ramah4/17/17 Page 1 of 1
Ramah Elementary 2013-14 2014-15 2015-16 2016-17 2017-18 2018-19 2019-20 2020-21 2021-22 2022-23 2023-24 2024-25 2025-26 2026-273Y 0 0 0 1 0 0 0 0 0 0 0 0 0 04Y 2 0 0 1 1 1 1 0 0 0 0 0 0 0Title 1: 3-4 years old 13 10 12 12 12 12 12 11 11 11 11 11 11 11Kindergarten 23 28 28 27 26 24 24 22 24 24 24 23 23 23Grade 1 30 28 28 30 29 28 26 26 23 26 25 25 25 25Grade 2 25 29 29 29 31 30 29 27 27 25 27 27 26 26Grade 3 38 25 31 27 29 32 30 29 27 27 25 27 27 26Grade 4 23 37 27 28 27 29 31 30 29 27 27 24 27 26Grade 5 27 24 34 28 27 26 28 31 29 29 26 26 24 26Sp-C 1 0 0 0 0 0 0 0 0 0 0 0 0 0Sp-D 2 1 1 0 1 1 1 1 1 1 1 1 1 1Sp-DDTotal 184 182 190 183 184 183 183 179 174 170 167 166 164 165% Change -4.7% -1.1% 4.4% -3.7% 0.6% -0.5% 0.0% -2.5% -2.8% -2.2% -1.8% -0.6% -0.7% 0.7%
Ramah High 2013-14 2014-15 2015-16 2016-17 2017-18 2018-19 2019-20 2020-21 2021-22 2022-23 2023-24 2024-25 2025-26 2026-27Grade 6 22 28 27 38 32 32 30 33 35 34 33 30 30 28Grade 7 35 24 27 22 36 30 30 29 31 33 32 31 29 29Grade 8 30 29 22 25 19 31 27 26 25 27 29 28 27 25Grade 9 34 27 28 19 25 19 31 26 26 25 27 29 28 27Grade 10 15 34 32 21 17 22 17 28 24 23 22 24 26 25Grade 11 17 16 34 22 17 14 18 14 22 19 19 18 19 21Grade 12 26 21 18 30 24 18 15 20 15 25 21 21 20 21Sp-C 6 7 5 9 5 5 5 5 5 6 5 6 5 5Sp-D 1 5 5 6 3 3 3 3 3 3 3 3 3 3Total 186 191 198 192 178 175 176 184 187 195 192 190 188 184% Change -13.5% 2.7% 3.7% -3.0% -7.1% -1.8% 0.6% 4.2% 1.8% 4.4% -1.7% -1.0% -1.1% -1.9%
Exhibit 2-48 Ramah Detailed Enrollment Projections by School and by Grade

Gallup-McKinley County Schools 2-39 May 2017 Facilities Master Plan 2017-2022 Draft FinalARC 21606.000
Gallup-McKinley County Schools
Thoreau4/17/17 Page 1 of 1
Thoreau Elem. 2013-14 2014-15 2015-16 2016-17 2017-18 2018-19 2019-20 2020-21 2021-22 2022-23 2023-24 2024-25 2025-26 2026-273Y 4 0 2 2 2 2 1 1 1 1 1 1 1 14Y 2 5 1 5 2 2 2 2 2 2 2 2 2 2Title 1: 3-4 years old 29 29 26 21 28 26 25 25 25 24 24 23 23 23Kindergarten 58 47 45 48 46 43 43 39 43 42 42 41 41 41Grade 1 46 51 37 46 44 42 39 39 36 39 38 38 38 37Grade 2 46 53 46 34 45 43 42 39 38 35 38 38 38 37Grade 3 46 53 54 48 34 46 43 42 39 39 35 38 38 38Grade 4 47 46 50 56 48 34 45 43 42 38 38 35 38 38Grade 5 36 51 50 52 57 49 35 46 44 43 39 39 36 39Sp-C 4 3 2 3 1 1 1 1 1 1 1 1 1 1Sp-D 7 3 2 4 7 6 6 6 6 6 6 6 6 6Sp-DDTotal 325 341 315 319 314 293 282 283 276 270 265 263 261 263% Change -4.7% 4.9% -7.6% 1.3% -1.5% -6.6% -3.8% 0.4% -2.7% -2.2% -1.8% -0.6% -0.8% 0.7%
Thoreau Middle 2013-14 2014-15 2015-16 2016-17 2017-18 2018-19 2019-20 2020-21 2021-22 2022-23 2023-24 2024-25 2025-26 2026-27Grade 6 57 55 54 59 60 66 56 40 53 50 49 45 45 41Grade 7 89 105 84 78 91 92 101 86 61 82 78 75 69 69Grade 8 91 86 98 84 75 87 87 97 82 58 78 74 72 66Sp-C 14 4 7 6 10 11 11 10 9 8 9 9 8 8Sp-D 5 7 7 5 4 5 5 4 4 4 4 4 4 3Total 256 257 250 232 239 259 260 236 209 203 217 207 198 188% Change -1.2% 0.4% -2.7% -7.2% 3.1% 8.5% 0.2% -9.1% -11.7% -3.0% 7.3% -5.0% -4.3% -5.2%Basic 237 246 236 221 225 244 244 222 196 190 204 194 186 176
Thoreau High 2013-14 2014-15 2015-16 2016-17 2017-18 2018-19 2019-20 2020-21 2021-22 2022-23 2023-24 2024-25 2025-26 2026-27Grade 9 79 88 94 93 90 80 93 94 104 88 63 84 80 77Grade 10 67 66 89 84 76 74 66 77 77 85 73 52 69 65Grade 11 78 64 77 71 80 72 70 63 73 73 81 69 49 65Grade 12 65 75 56 70 67 76 69 67 59 69 69 77 65 51Sp-C 9 14 11 8 18 17 17 17 18 18 16 16 15 14Sp-D 26 24 23 35 7 7 6 6 7 7 6 6 6 6Total 324 331 350 361 338 326 321 323 337 340 308 303 283 279% Change -7.7% 2.2% 5.7% 3.1% -6.4% -3.6% -1.4% 0.6% 4.4% 0.9% -9.5% -1.7% -6.5% -1.4%
Exhibit 2-49 Thoreau Detailed Enrollment Projections by School and by Grade
Gallup-McKinley County Schools
Tohatchi4/17/17 Page 1 of 1
Tohatchi Elementary 2013-14 2014-15 2015-16 2016-17 2017-18 2018-19 2019-20 2020-21 2021-22 2022-23 2023-24 2024-25 2025-26 2026-273Y 1 0 2 1 1 1 1 1 1 1 1 1 1 14Y 0 1 0 1 1 1 1 1 1 1 1 1 1 1
Title 1: 3-4 years old 21 17 20 16 18 17 17 16 16 16 16 16 16 16Kindergarten 30 30 22 30 30 28 28 25 28 27 27 27 26 26Grade 1 41 29 32 25 31 31 29 29 26 29 28 28 28 28Grade 2 30 37 34 34 24 31 31 28 28 26 28 28 27 27Grade 3 31 32 31 33 33 24 30 30 27 27 25 27 27 27Grade 4 28 25 29 32 31 31 22 28 28 26 26 23 25 25Grade 5 39 24 34 33 34 33 33 24 30 30 28 27 25 27Sp-C 3 2 2 3 3 3 3 2 2 2 2 2 2 2Sp-D 2 2 3 1 0 0 0 0 0 0 0 0 0 0Sp-DDTotal 226 199 209 209 207 199 193 183 187 184 181 180 179 180% Change -7.0% -11.9% 5.0% 0.0% -1.2% -3.7% -3.0% -5.0% 2.1% -1.5% -1.8% -0.5% -0.9% 0.7%
Twin Lakes Elementary 2013-14 2014-15 2015-16 2016-17 2017-18 2018-19 2019-20 2020-21 2021-22 2022-23 2023-24 2024-25 2025-26 2026-273Y 0 0 0 0 0 0 0 0 0 0 0 0 0 04Y 1 0 1 2 1 1 1 1 1 1 1 1 1 1
Title 1: 3-4 years old 29 30 25 12 12 12 11 11 11 10 10 10 10 10Kindergarten 29 30 32 37 30 28 28 25 28 27 27 27 26 26Grade 1 27 23 28 31 33 27 25 25 23 25 24 24 24 24Grade 2 32 27 29 28 32 34 28 26 25 23 25 25 25 25Grade 3 22 31 32 28 28 32 34 28 26 26 23 26 25 25Grade 4 34 20 26 32 27 27 31 34 27 25 25 23 25 25Grade 5 34 31 26 30 35 30 30 34 37 30 28 28 25 27Sp-C 0 0 2 0 2 2 2 2 2 2 2 2 2 2Sp-D 0 0 0 0 1 1 1 1 1 1 1 1 1 1Sp-DDTotal 208 192 201 200 202 194 191 186 180 169 166 165 164 165% Change -2.8% -7.7% 4.7% -0.5% 1.0% -4.0% -1.3% -2.7% -3.5% -5.8% -1.9% -0.6% -0.9% 0.8%
Tohatchi Middle 2013-14 2014-15 2015-16 2016-17 2017-18 2018-19 2019-20 2020-21 2021-22 2022-23 2023-24 2024-25 2025-26 2026-27Grade 6 78 69 43 58 57 63 57 57 53 60 54 50 50 45Grade 7 45 71 68 47 56 55 61 55 55 51 58 52 48 48Grade 8 58 44 76 76 47 56 55 61 56 56 51 59 53 48Sp-C 8 8 8 8 9 10 9 10 9 9 9 9 8 8Sp-D 8 0 0 0 3 3 3 3 3 3 3 3 3 3Total 197 192 195 189 172 187 186 186 176 179 175 172 161 152% Change 19.4% -2.5% 1.6% -3.1% -9.0% 8.7% -0.6% 0.3% -5.9% 2.0% -2.1% -1.7% -6.4% -5.6%
Tohatchi High 2013-14 2014-15 2015-16 2016-17 2017-18 2018-19 2019-20 2020-21 2021-22 2022-23 2023-24 2024-25 2025-26 2026-27Grade 9 63 72 58 83 93 58 69 67 75 68 68 62 71 64Grade 10 81 56 63 54 74 83 52 61 60 67 60 61 56 64Grade 11 65 54 45 59 45 62 70 43 52 51 56 51 51 47Grade 12 79 57 58 52 61 47 65 72 45 54 53 58 53 53Sp-C 18 23 23 18 22 20 21 20 19 19 19 19 19 18Sp-D 4 8 9 11 8 7 8 7 7 7 7 7 7 7Total 310 270 256 277 304 278 283 272 257 265 263 258 257 253% Change -1.0% -12.9% -5.2% 8.2% 9.6% -8.6% 1.9% -4.0% -5.3% 3.1% -0.7% -2.1% -0.5% -1.5%
Exhibit 2-50 Tohatchi Detailed Enrollment Projections by School and by Grade

Gallup-McKinley County Schools 2-40 May 2017 Facilities Master Plan 2017-2022 Draft FinalARC 21606.000
2.5 Utilization and CapacityThis section identifies:• Existing and projected classroom needs to
accommodate projected enrollment• Student capacity of each school site• Special factors influencing classroom use• Strategies to accommodate district needs
2.5.1 Existing and Projected Utilization and Classroom Needs Analysis
We analyzed school facilities to determine existing classroom use and the number of classrooms needed to accommodate a current and projected student enrollment. The analysis considered the supply of and demand for classrooms.• The basis for the supply of classrooms was
identified use and a detailed inventory of all net instructional spaces available at each school (permanent and portables) housing general education, special education (C&D levels) and special programs (A&B special education, federal and categorical).
• Analysis of the demand for classrooms calculated the need for general and special education classrooms. The basis for calculation was state-mandated pupil/teacher ratios and the special programs mix at each school, and use of existing and projected enrollments. We assumed that future special program need reflects the enrollment ratios that exist at each school.
• The analysis then compared the number of classrooms needed to meet current and
projected enrollments to the number of available classrooms (considering total classrooms, including permanent and portable units, and permanent classrooms only, excluding portable units).
PSFA has set in its guidelines that all spaces should be used during normal hours a minimum of 95% for grades K-6, and 80% for grades 7-12.
Facility planners can estimate capital requirements based on utilization information, district policies regarding the desirable size of schools and the condition of existing facilities. These requirements address classroom deficits or surpluses anticipated districtwide for each school facility, or collectively for schools in a subarea. Various strategies can then be considered to meet classroom need projections, including new schools, classroom additions, portable classrooms, boundary adjustments, school consolidations, grade reconfiguration or schedule variations.
Elementary School Utilization / Classroom Needs
This study coincides with the transition of several Gallup elementary schools into new facilities and consolidation of programs. The data captures enrollments prior to approved boundary changes. Overall, the Gallup area elementary schools have the right number of seats, but school boundaries and student assignments need adjustment to improve utilization. (See Exhibit 2-51.)
ARC used capacities and floor plans for the new elementary schools and schools under construction to guide five-year planning needs.
See Appendix 4.2 for detailed utilization and classroom needs analysis data.

Gallup-McKinley County Schools 2-41 May 2017 Facilities Master Plan 2017-2022 Draft FinalARC 21606.000
Exhibit 2-51 GMCS Capacity and Classroom Needs
School
Enrollment Data Capacity Classroom Needs Analysis**
PED Enrollment Projections Functional 5 Years 2021-22 10 Years 2026-27
2016-17 40-Day Enrollment*
5 Years 2021-22
10 Years2026-27
with Portables without PortablesSeats Available with Porables
Open Seat Utilization
Percentage
May Need Classroom
with Portables
May Need Classroom
without Portables
Seats Available with
Porables
Open Seat Utilization
Percentage
May Need Classroom
with Portables
May Need Classroom
without Portables
Gallup Elementary Schools
Catherine A. Miller ES 386 376 379 407 407 31 92% 2 2 28 93% 2 2
Chee Dodge ES 317 280 278 502 436 222 56% (8) (2) 224 55% (9) (3)
David Skeet ES 185 178 168 258 242 80 69% (1) 2 90 65% (2) 1
Del Norte ES 453 441 433 501 501 60 88% (3) (3) 68 86% (3) (3)
Indian Hills ES 291 277 256 416 416 139 67% (4) (4) 160 62% (4) (4)
Jefferson ES 338 298 318 593 593 295 50% (12) (12) 275 54% (12) (12)
Lincoln ES 233 212 212 413 413 201 51% (7) (7) 201 51% (6) (6)
Red Rock ES 386 393 376 447 343 54 88% 0 9 71 84% 1 9
Rocky View ES 320 315 321 496 332 181 63% (2) 8 175 65% (1) 9
Roosevelt ES 202 185 187 348 300 163 53% (3) 2 161 54% (4) 1
Stagecoch ES 308 267 251 361 361 94 74% (1) (1) 110 70% (2) (2)
Tobe Turpen ES 415 407 421 442 393 35 92% (1) 4 21 95% (1) 4
Subtotal Gallup Elementary Schools 3834 3629 3600 5184 4737 1555 70.25% -40 -2 1584 69.5% -41 -4
Gallup Middle Schools
Chief Manuelito MS 608 635 573 811 811 176 78% (7) (7) 238 71% (10) (10)
Gallup MS 415 414 388 503 503 89 82% (7) (7) 115 77% (7) (7)
John F Kennedy MS 663 698 687 863 863 165 81% (3) (3) 176 80% (3) (3)
Subtotal Gallup Middle Schools 1686 1747 1648 2177 2177 430 80.3% (17) (17) 529 76.0% (20) (20)
Gallup Area High Schools
Gallup Central Alt HS 237 195 194 515 398 320 38% (12) (7) 321 38% (12) (7)
Gallup HS 925 849 861 1,439 1,439 590 59% (19) (19) 578 60% (19) (19)
Hioshi Miyamura HS 1,170 1,127 1,176 1,399 1,399 272 81% (7) (7) 223 84% (3) (3)
Subtotal Gallup Area High Schools 2332 2171 2231 3353 3236 1182 59.3% (38) (33) 1122 60.7% (34) (29)
School

Gallup-McKinley County Schools 2-42 May 2017 Facilities Master Plan 2017-2022 Draft FinalARC 21606.000
2.6 Technology� Overview of Educational Technology plan funded by capital program� Technology requirements/need at each school site2.7 Energy Management Program� Provide an overview of the districts energy management program
2.8 Capital Funding� 2.8.1 Provide a brief history of how the district has met its previous capital
funding obligations� 2.8.2 Identify the district’s current and anticipated future financial resources
available (indicating by year(s) available to meet capital needs)�� 2.8.3 Identify if the scope and estimated cost of the district’s developing,
current, or approved facilities master plan (FMP) realistic in terms of what the district can reasonably expect to accomplish considering its resources (staff time, available funding, bonding capacity, expectation of a successful bond election, community will).
Crownpoint Classrm Needs
Crownpoint ES 348 318 308 389 389 71 82% 0 0 81 79% (2) (2)
Crownpoint MS 144 180 154 310 310 130 58% (5) (5) 156 50% (5) (5)
Crownpoint HS 254 243 224 764 624 521 32% (6) (3) 540 29% (8) (5)
Subtotal Crownpoint 746 741 686 1463 1323 722 57.3% -11 -8 777 52.7% (15) (12)
Navajo Classroom Needs
Navajo ES 268 227 224 418 418 191 54% (5) (5) 194 54% (5) (5)
Navajo MS 128 132 110 317 317 185 42% (6) (6) 207 35% (6) (6)
Navajo Pine HS 140 126 112 352 352 226 36% (5) (5) 240 32% (5) (5)
Subtotal Navajo 536 485 446 1087 1087 602 44% (16) (16) 641 40.3% (16) (16)
Ramah Classroom Needs
Ramah ES 183 171 164 264 264 93 65% (1) (1) 100 62% (3) (3)
Ramah HS 192 187 184 414 414 227 45% (4) (4) 230 44% (4) (4)
Subtotal Ramah 375 358 348 678 678 320 55% (5) (5) 330 53% (7) (7)
Thoreau Classroom Needs
Thoreau ES 319 276 263 411 299 135 67% (5) 6 148 64% (6) 5
Thoreau MS 232 209 188 452 390 243 46% (6) (3) 264 42% (7) (4)
Thoreau HS 361 337 279 623 575 286 54% (6) (4) 344 45% (9) (7)
Subtotal Thoreau 912 822 730 1486 1264 664 55.7% (17) (1) 756 50.3% (22) -6
Tohatchi Classroom Needs
Tohatchi ES 209 187 180 341 341 154 55% (4) (4) 161 53% (4) (4)
Twin Lakes ES 200 181 166 282 282 101 64% 0 (1) 116 59% (1) (2)
Tohatchi MS 189 176 152 306 306 130 58% (4) (4) 154 50% (4) (4)
Tohatchi HS 277 257 253 596 550 339 43% (10) (10) 343 42% (10) (10)
Subtotal Tohatchi 875 801 751 1525 1479 724 55% -18 (19) 774 51% (19) (20)
Tse Yi Gai HS 113 117 119 350 350 233 33% (8) (8) 231 34% (8) (8)
Enrollment Data Capacity Classroom Needs Analysis**
PED Enrollment Projections Functional 5 Years 2021-22 10 Years 2026-27
2016-17 40-Day Enrollment*
5 Years 2021-22
10 Years2026-27
with Portables without PortablesSeats Available with Porables
Open Seat Utilization
Percentage
May Need Classroom
with Portables
May Need Classroom
without Portables
Seats Available with
Porables
Open Seat Utilization
Percentage
May Need Classroom
with Portables
May Need Classroom
without Portables
School
Exhibit 2-51 GMCS Capacity and Classroom Needs Continued
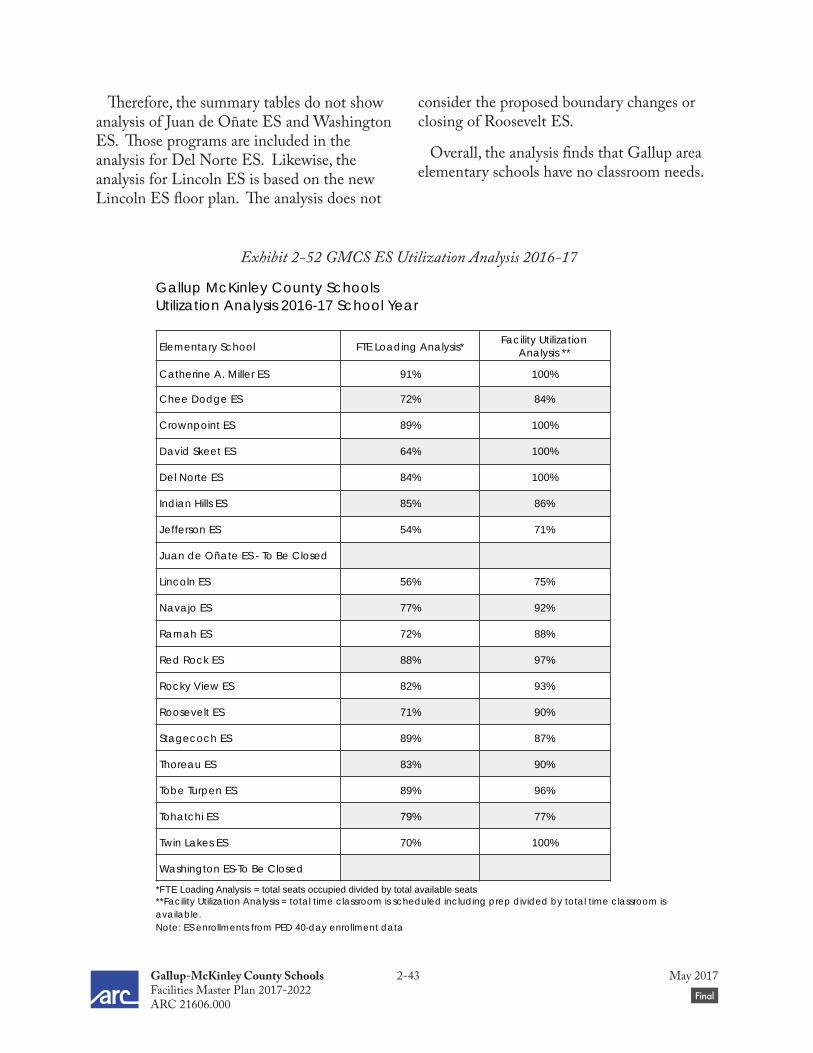
Gallup-McKinley County Schools 2-43 May 2017 Facilities Master Plan 2017-2022 Draft FinalARC 21606.000
Therefore, the summary tables do not show analysis of Juan de Oñate ES and Washington ES. Those programs are included in the analysis for Del Norte ES. Likewise, the analysis for Lincoln ES is based on the new Lincoln ES floor plan. The analysis does not
consider the proposed boundary changes or closing of Roosevelt ES.
Overall, the analysis finds that Gallup area elementary schools have no classroom needs.
Gallup McKinley County Schools Utilization Analysis 2016-17 School Year
*FTE Loading Analysis = total seats occupied divided by total available seats **Facility Utilization Analysis = total time classroom is scheduled including prep divided by total time classroom is available. Note: ES enrollments from PED 40-day enrollment data
Elementary School FTE Loading Analysis* Facility Utilization
Analysis **
Catherine A. Miller ES 91% 100%
Chee Dodge ES 72% 84%
Crownpoint ES 89% 100%
David Skeet ES 64% 100%
Del Norte ES 84% 100%
Indian Hills ES 85% 86%
Jefferson ES 54% 71%
Juan de Oñate ES - To Be Closed
Lincoln ES 56% 75%
Navajo ES 77% 92%
Ramah ES 72% 88%
Red Rock ES 88% 97%
Rocky View ES 82% 93%
Roosevelt ES 71% 90%
Stagecoch ES 89% 87%
Thoreau ES 83% 90%
Tobe Turpen ES 89% 96%
Tohatchi ES 79% 77%
Twin Lakes ES 70% 100%
Washington ES-To Be Closed
Exhibit 2-52 GMCS ES Utilization Analysis 2016-17

Gallup-McKinley County Schools 2-44 May 2017 Facilities Master Plan 2017-2022 Draft FinalARC 21606.000
Middle school utilization / classroom needsOverall, the district middle schools have low
utilization and many vacant seats. JFK MS has a 90% utilization rate, but other middle schools’ utilization rates range from 49% to 78%.
The middle schools have no classroom needs. Declining enrollments are causing under-utilized facilities.
High school utilization / classroom needsOverall, district high schools have low
utilization and many vacant seats. Utilization of spaces at Hiroshi Miyamura HS is very good at 91%, but other high schools’ utilization rates range from 35% to 76%.
The high schools have no classroom needs.
Gallup McKinley County Schools Utilization Analysis 2016-17 School Year
*FTE Loading Analysis = total seats occupied divided by total available seats **Facility Utilization Analysis = total time classroom is scheduled including prep divided by total time classroom is available. Note: MS/HS Enrollments from PowerSchool 40-day Master Schedule.
Middle and High Schools FTE Loading Analysis* Facility Utilization
Analysis **
Chief Manuelito MS 63% 84%
Crownpoint MS 41% 52%
Gallup MS 58% 72%
John F Kennedy MS 72% 90%
Navajo MS 36% 49%
Thoreau MS 36% 67%
Tohatchi MS 40% 78%
Crownpoint HS 52% 77%
Gallup Central Alt HS 30% 47%
Gallup HS 56% 75%
Hiroshi Miyamura HS 77% 91%
Navajo Pine HS 40% 65%
Ramah MS/HS 59% 76%
Thoreau HS 62% 71%
Tohatchi HS 41% 51%
Tse Yi Gai HS 27% 36%
Exhibit 2-53 GMCS MS and HS Utilization Analysis 2016-17

Gallup-McKinley County Schools 2-45 May 2017 Facilities Master Plan 2017-2022 Draft FinalARC 21606.000
School Data Capacity Analysis
School Name Classrooms/Program Spaces1 Portables (Usable) Maximum Functional Program* Enrollment
Total Perm/Port/Prgm on
Site
Perm/Port in Cap Calc.
% CR Not used in Capacity
Total Prgm Sp on Site
Total Prgm Sp In Cap Calc.
% Pgrm Sp Not used in
Capacity
Port- Single
Port- Dble
with Port without Port with Port without Port with Port without Port 2016-17
Catherine A. Miller ES 25 20 20% 3 1 67% 461 461 407 407 387 387 386
Chee Dodge ES 32 20 38% 2 0 0% 6 635 518 502 436 403 382 317
Crownpoint ES 20 18 10% 0 0 0% 404 404 389 389 370 370 348
David Skeet ES 18 12 33% 0 0 0% 2 1 334 288 258 242 245 230 185
Del Norte ES (new FP) 31 25 19% 0 0 0% 573 573 501 501 476 476 453
Indian Hills ES 28 20 29% 0 0 0% 515 515 416 416 325 325 291
Jefferson ES 34 28 18% 2 0 0% 663 663 593 593 563 563 338
Lincoln ES (new FP) 28 19 32% 4 0 0% 535 535 413 413 392 392 233
Navajo ES 25 19 24% 3 0 0% 497 497 418 418 355 355 268
Ramah ES (new FP) 16 13 19% 2 0 0% 312 312 264 264 251 251 183
Red Rock ES 29 21 28% 0 0 0% 8 567 419 447 343 405 306 386
Rocky View ES 28 18 36% 0 0 0% 10 730 404 496 332 450 315 320
Roosevelt ES 20 14 30% 0 0 0% 5 440 322 348 300 262 262 202
Stagecoch ES 33 20 39% 0 0 0% 505 505 361 361 323 323 308
Thoreau ES 29 19 34% 1 0 0% 11 525 331 411 299 358 252 319
Tobe Turpen ES 25 22 12% 0 0 0% 4 1 484 405 442 393 420 373 415
Tohatchi ES 22 15 32% 2 0 0% 416 416 341 341 291 291 209
Twin Lakes ES 17 13 24% 0 0 0% 1 316 316 282 282 268 268 200
Washington ES-To be Closed 0 0 0% 0 0 0% 0 0 0 0 0 0 Included in
Del Norte
Chief Manuelito MS 49 44 10% 1 1 0% 1,309 1,309 811 811 797 797 608
Crownpoint MS 19 16 16% 0 0 0% 493 493 310 310 251 251 144
Gallup MS 39 27 31% 3 0 0% 786 786 503 503 503 503 415
John F Kennedy MS 48 45 6% 3 1 67% 1,277 1,277 863 863 840 840 663
Navajo MS 22 15 32% 3 0 0% 543 543 317 317 254 254 128
Thoreau MS 26 21 19% 0 0 0% 2 1 693 579 452 390 368 368 232
Tohatchi MS 19 16 16% 2 0 0% 508 508 306 306 248 248 189
Crownpoint HS 46 41 11% 3 3 0% 3 1,141 949 764 624 764 624 254
Gallup Central Alt HS 24 23 4% 0 0 0% 5 737 577 515 398 427 310 237
Gallup HS 87 70 20% 5 2 60% 2,470 2,470 1,439 1,439 1,439 1,439 925
Hioshi Miyamura HS 73 65 11% 0 0 0% 2,160 2,160 1,399 1,399 1,399 1,399 1,170
Navajo Pine HS 24 16 33% 0 0 0% 608 608 352 352 352 352 140
Ramah MS/HS 25 22 12% 1 1 0% 649 649 414 414 414 414 192
Thoreau HS 38 32 16% 1 1 0% 1 894 830 623 575 560 560 361
Tohatchi HS 44 33 25% 2 2 0% 2 1,327 1,265 596 550 545 545 277
Tse Yi Gai HS 21 17 19% 3 1 67% 575 575 350 350 327 327 113
Totals 1,064 839 21% 46 13 72% 59 4 25,082 23,462 17,303 16,331 16,029 15,349 11,409
Exhibit 2-54 GMCS School Capacities

Gallup-McKinley County Schools 2-46 May 2017 Facilities Master Plan 2017-2022 Draft FinalARC 21606.000
Exhibit 2-55 GMCS ES Transfers 2016-17
12/19/16 CatherineA.
Miller
Elem
entary
Chee
DodgeElem
entary
Scho
ol
Crow
npoint
Elem
entary
Scho
ol
DavidSkeetE
lemen
tary
Scho
ol
Indian
Hills
Elem
entary
Scho
ol
Juan
deOnate
Elem
entary
Scho
ol
Jeffe
rson
Ele
men
tary
Sch
ool
LincolnElem
entary
Scho
ol
NavajoElem
entary
Scho
ol
Ramah
Elem
entary
Scho
ol
RedRo
ckElem
entary
Scho
ol
RockyView
Elem
entary
Scho
ol
RooseveltE
lemen
tary
Scho
ol
Stagecoach
Elem
entary
Scho
ol
ThoreauElem
entary
Scho
ol
TohatchiElem
entary
Scho
ol
Turpen
Elem
entary
Scho
ol
TwinLakesE
lemen
tary
Scho
ol
WashingtonElem
entary
Scho
ol
#of
stud
entslivinginarea
TransfersO
ut
%of
stud
entslivinginarea
atten
ding
thescho
ol
Grades K-5
Catherine A Miller 369 1 16 5 2 1 2 1 1 2 400 31 92%Chee Dodge 266 4 2 3 3 4 4 2 1 6 295 29 90%Crownpoint 361 1 1 4 1 368 7 98%David Skeet 2 190 2 6 14 1 32 1 8 5 1 2 264 74 72%Indian HillsJefferson
2 225 2 4 2 1 1 237 12 95%4 4 212 1 12 10 2 1 2 248 36 85%
Juan de Onate 5 2 2 10 219 8 1 3 3 2 34 289 70 76%Lincoln 1 11 3 165 10 1 10 9 5 2 217 52 76%Navajo 258 1 259 1 100%Navajo (transport) 8 8 0 100%Ramah 100 100 0 100%Ramah (transport) 58 58 0 100%Red Rock 2 5 12 1 267 22 1 1 5 316 49 84%Rocky View 3 10 30 1 5 281 2 3 2 337 56 83%Roosevelt 1 1 17 14 13 5 135 1 187 52 72%Stagecoach 1 1 10 4 16 6 2 8 265 13 2 1 329 64 81%Thoreau 1 1 1 334 337 3 99%Thoreau (transport) 5 5 0 100%Tohatchi 1 2 1 1 2 1 1 2 146 7 164 18 89%Turpen 10 2 15 2 7 5 3 6 11 384 4 449 65 86%Twin Lakes 11 2 2 2 1 60 190 268 78 71%Washington 1 6 2 1 11 7 4 10 3 162 207 45 78%OUTSIDE - ARIZONA 15 1 33 1 9 1 60OUTSIDE - NEWMEXICO 44 3 25 6 4 82Not Located 1 1 1 3
Enrollment 389 314 409 193 273 336 241 245 299 185 362 319 216 301 350 211 420 201 223 5,487 742Transfers In 20 48 48 3 48 124 22 80 33 27 95 37 81 35 16 65 36 11 60
%ofstudentsattendingschool living in the area 95% 85% 88% 98% 82% 63% 91% 67% 89% 85% 74% 88% 63% 88% 95% 69% 91% 95% 73%
Soource: Gallup/McKinley Schools Student Database, December 19, 2016
Read
ing
dow
n, fi
gure
s sh
ow n
umbe
r of
stu
dent
s at
tend
ing
scho
ol.
Reading across, figures show number of students living in assignment area.

Gallup-McKinley County Schools 2-47 May 2017 Facilities Master Plan 2017-2022 Draft FinalARC 21606.000
2.5.2 Special Factors that Influence Facility Use
Transfers and Boundary AreasGeography is a factor for GMCS that
influences facility use. Distances between facilities in the county areas limit transfers of students between assignment boundaries (see Exhibit 2-13) — 98% to 100% of students living in Crownpoint, Navajo, Ramah and Thoreau attend their assigned school.
Within Gallup, the rebuilding and closing of elementary schools has influenced transfers between assignment boundaries, with parents anticipating boundary changes and construction. Forty-day enrollment shows high transfers out of schools slated for closure or construction, and high transfers in at the newest school to open, Jefferson ES.
For Gallup area schools, the district has been implementing a program to consolidate and right-size schools while replacing older facilities. The district has the opportunity to continue to replace and right-size elementary schools at Rocky View ES and Red Rock ES, and to remove portable classrooms at these campuses.
Geography impacts the delivery of ancillary services at county schools. District ancillary staff are based at the Education Development Center in Gallup, and travel to each of the schools to deliver services. The district prefers that ancillary staff carpool to schools to save travel costs. A problem at some schools, especially at new schools such as Catherine A. Miller ES, is limited ancillary space to meet and work with students when delivering services at the same time. Storage for ancillary equipment at school sites is also limited.
Programs and PTRsProgram delivery follows the state-mandated
pupil / teacher ratios (PTRs) for general and special education programs.
The Educational Specifications for Gallup-McKinley County Schools Elementary Schools (revised October 2012) describe elementary school program sizes:
GMCS wants to preserve the small enrollments and closeness of community, staff, students and parents that is the product of such a school. GMCS elementary schools range in size from 204 to 326 students, and are comprised of about 50 to 60 students per grade level in three team levels.
GMCS requires the maximum number of students within kindergarten classrooms to be no more than 20 and grades 1 through 5 to be no more than 24 students.
All elementary schools include a preschool (3Y and 4Y IEP) program and nine elementary schools have a state grant for the 4Y pre-K program. The program schedule is a Monday through Thursday program, with Fridays off. PTR for the preschool program follows PED requirements, and limits enrollment to 16 students per classroom. The PTR for the state grant for pre-K allows a maximum of 20 students per classroom. State adequacy standards for kindergarten classrooms apply to preschool facilities, and Early Childhood Environment Rating Scale (ECERS) requirements for program evaluation apply to the state pre-K program facilities.
All elementary schools include a Navajo language and culture program. Some elementary schools require space to expand the program to serve grades 3, 4 and 5.

Gallup-McKinley County Schools 2-48 May 2017 Facilities Master Plan 2017-2022 Draft FinalARC 21606.000
Special education programs are a full-inclusion programs districtwide. The district has some “hubs” for services, which lowers the PTR for instructional spaces for these programs, as follows:• Indian Hills ES hosts a hearing program• Jefferson ES hosts a vision program• Del Norte ES and Catherine A. Miller
ES host a high needs and cognitive impairments program
• Red Rock ES hosts a cognitive impairments and autism program
• Stagecoach ES is a future hubYoung adults receive services at their local
high schools.
2.5.3 School Site CapacityExhibit 2-54 identifies the maximum and
functional student capacity at each school site.Site capacity identifies the number of
students each facility can accommodate. Capacity analysis is very similar to utilization analysis and uses the same data. However, while the intent of utilization analysis is to identify classroom use and needs, the focus of capacity analysis is to determine the student capacity of a facility, given existing facilities and program constraints. The capacity of the
school is based on the number of students that can be accommodated in regular and special education classrooms. It discounts spaces for federal and categorical programs.
ARC’s analysis includes the capacity of new elementary schools and schools under construction (based on the new floor plans) to guide the five-year planning needs. The capacity analysis includes Del Norte ES and does not include Juan de Oñate ES or Washington ES. The analysis includes the new Lincoln ES floor plan, but not the existing Lincoln ES floor plan.
All district schools, except for some Gallup area elementary schools, have capacity to accommodate current and future enrollment.
The cumulative functional capacity of Gallup area elementary schools is 5,184 with portables and 4,737 without portables. (See Exhibit 2-51.) Note that Roosevelt ES will close when the new Lincoln ES is built, and Gallup area functional capacity for the 11 elementary schools will reduce to 4,836 seats with portables and 4,437 seats without portables. The 2016/17 enrollment in Gallup area elementary schools is 3,834 students, which leaves about 600 seats available without portables.

Gallup-McKinley County Schools 2-49 May 2017 Facilities Master Plan 2017-2022 Draft FinalARC 21606.000
School Adjustment per new boundaries
5-Year adjusted enrollment
Program Capacity with portables
Program Capacity without portables
With portables - Available seats
Without portables - Available seats
Catherine A Miller 113.1% 425 387 387 -38 -38Chee Dodge ES 136.9% 383 403 382 20 -1David Skeet ES 100% 178 245 230 67 52Del Norte ES 134.1% 278 476 476 198 198Indian Hills ES 92.7% 257 325 325 68 68Jefferson ES 109.5% 326 563 563 237 237Lincoln ES 116.3% 247 392 392 145 145
Red Rock ES 110.5% 434 405 306 -29 -128Rocky View ES 100% 315 450 315 135 0Stagecoach ES 119.3% 319 323 323 4 4Twin Lakes ES 100% 181 268 268 87 87
Tobe Turpen ES 100% 407 420 373 13 -343750 4657 4340 907 590
Exhibit 2-56 Available Seats Analysis for Proposed Boundary Adjustment and Current Enrollment Projections
The district approved a boundary adjustment in 2014 for Gallup area elementary schools, as part of the program to replace and close schools. ARC compared the boundary adjustment impacts to the projected enrollment, and showed a need to revisit the boundary changes. Exhibit 2-56 shows that Catherine Miller ES and Red Rock ES will be over-enrolled, and that Del Norte ES, Jefferson ES and Lincoln ES, the new schools, are not filled.
Ramah schools are generally the right size for the community and have no classroom needs.
Other county area middle schools and high schools have excess capacity and no classroom needs.
2.5.4 Strategies to Meet NeedsThe FMP process considered questions
about replacement or renovation; system upgrades as capital projects or as maintenance; strategies for schools with excess GSF; and
closing and consolidating schools. Gallup middle schools and high schools
have excess capacity, but the facilities are not large enough to accommodate a consolidation. The facilities are not configured to close a building or wing. The steering committee discussed the option to relocate Gallup Central Alternative HS to a high school site to improve utilization, but the option is restrained by the building configurations, and is not ideal due for program mission.
The district plans replace Gallup HS due to structural failures of the current building. The district can rebalance enrollments for the three Gallup-area high school programs and size the new facility to meet projected enrollments at that time.
The high schools in Crownpoint, Navajo and Tohatchi have capital needs, and the district can address issues of excess GSF and capacity during renovations or rebuilding.

Gallup-McKinley County Schools 2-50 May 2017 Facilities Master Plan 2017-2022 Draft FinalARC 21606.000
2.5.5 Spaces Underutilized or To Be Demolished
The steering committee discussed opportunities to reconfigure existing programs and close facilities to improve school utilization throughout the district. Configuration of facilities limits opportunities to reduce GSF at most schools.
Tohatchi HS has a campus comprised of separate buildings and wings. Currently the school has closed the 300 wing to save operational costs and improve utilization.
Tse’Yi’Gai HS has expanded its program to accept 8th grade students. The school is far from other district schools, and the options to improve utilization are limited. To improve utilization, the district can add additional middle school grades, or close the school.
The district will work with the in-town and county communities to discuss opportunities to improve facility utilization. The high schools in Crownpoint, Navajo and Tohatchi each have new roofs, and renovations can prepare for and accommodate a grades 7-12 program in the future at each school. This strategy proposes that the district operate two rather than three schools, a pre-K-6 school and the grades 7-12 school, and offer the closed school to the community.
The vacated facilities, resulting from the replacement and consolidation of elementary schools, are as follows: • The district is considering options for Juan
de Oñate ES, including giving the facility away for reuse by others, or relocating a Gallup program to the facility to avoid renovation of a different facility.
• Lincoln ES will be demolished when the school is replaced.
• Ramah ES will be removed from the district inventory and given away or demolished.
• Red Rock ES will be demolished when the school is replaced. The project will require a PSCOC award.
• The district is considering options for Roosevelt ES, which will close when Lincoln ES is replaced. Options include demolishing the facility and expanding parking for the district stadium, or relocating a Gallup program to the facility to avoid renovation of a different facility.
• Thoreau ES will be demolished when the school is replaced. Demolition of all vacant structures on the campus will be included in the construction of the new school.
• Washington ES will be demolished to complete the new campus for Del Norte ES.
The Gallup MS campus has a vacant paint shop across the street which requires demolition.
The Crownpoint MS and HS campus has vacant buildings, an old auxiliary gym and a vocational building, which require demolition.
Districtwide, vacant buildings and teacher housing needs to be demolished. ARC did an inventory of unusable, vacant portables, and identified 44 units for removal or demolition at school and administrative sites. We did an inventory of unhabitable, vacant teacher housing and identified 56 units for demolition. (See Exhibit 2-7 on page 2-9.)

Gallup-McKinley County Schools 2-51 May 2017 Facilities Master Plan 2017-2022 Draft FinalARC 21606.000
2.6 TechnologyThis section is an overview of the district’s Technology Plan and the need for equipment funded by the capital program and any anticipated impacts on facilities.
The district does not have a current Technology Plan.
The district has a current project through the state’s Broadband Deficiencies Correction Program (BDCP) to bring fiber infrastructure south from Gallup to David Skeet and to Ramah schools. The $1.9 million project funding is at no capital cost to the district, using 90% from a federal grant, 5% from the state and 5% using E-rate funds. When the project is complete, all district schools except for Tse’Yi’Gai will be on fiber connection to the Internet. Tse’Yi’Gai has a 4-TI line connection through Century Link and due to remoteness, an upgrade to fiber will not be soon.
Technology receives about $2 million per year from SB-9 funds. The district funds technology in the schools through a “School-Improvement Funds” program, which allows the principals to meet the technology needs for programs at their schools. This allocation has been sufficient to maintain and replace technology equipment and devices in the schools.
2.7 Energy ManagementThe district does not have a current Energy
Management Plan. Energy consumption data was not available for analysis as part of the
FMP process, but the district tracks utility use through SchoolDude®.
Energy conservation is a goal for GMCS Facilities Master Planning, which states, Support sustainability in design and
operation of facilities. Furnish satisfying, productive, and quality indoor spaces that increase efficiencies in all systems to save energy and reduce operational and legacy costs.
The Educational Specifications for Gallup-McKinley County Schools Elementary Schools (Revised October 2012) identifies planning for energy and resource conservation as a top priority at GMCS (page 2-9) and provides the following guidelines:• Recycling. Recycling containers should
be provided as well as trash containers at various locations throughout the school. Permanent recycling structures (i.e., dumpsters) should be located for ease of custodial use.
• Water conservation. Waterless urinals, reclaimed water (condensate water), water harvesting and reuse of gray water are all concepts the district will consider.
• Energy conservation. Lighting controls for occupied spaces, T-8 light fixtures (T-5

Gallup-McKinley County Schools 2-52 May 2017 Facilities Master Plan 2017-2022 Draft FinalARC 21606.000
if possible), daylighting, appropriate siting of buildings for solar heat gain, shading divides to lower heat gain, and solar panels should all be considered in the design process.
AccomplishmentsMiyamura HS has a geothermal heating
system, and uses the least gas of district facilities.
The district plans to install a PV array partnering with Air NM at Miyamura HS to offset high electrical usage. The facilities department reported that Miyamura High School, the district’s largest facility, is currently the biggest electrical user.
The district will explore installation of additional PV arrays at Gallup HS and the rest of district schools after installation at Miyamura HS.
Most school HVAC systems are on direct digital control (DDC), a contracted service, which centralizes and improves performance of systems.
District standards now require LED lighting in new schools and renovations.
All high schools districtwide have a synthetic turf fields, reducing water use and maintenance costs of a grass field.
Landscaping at most schools does not require high water use. It is xeric, provides shade, and is designed for ease of maintenance. Elementary schools do not have grass fields.
Challenges and StrategiesIn a planning interview, M&O staff
discussed the maintenance struggle with HVAC systems. The district maintains the mechanical systems, and response to HVAC work orders requires coordination with the
DDC contractor for the controls, creating another loop to fix problems.
A retrocommissioning on HVAC systems will guide the district in finding efficiencies in the operation and maintenance of the systems. The purpose of an HVAC and Sustainability Study at selected GMCS schools is to:• Perform a level II investigation of aging
systems and guide strategic replacement and repairs
• Guide strategic replacement of HVAC systems which impact negatively the thermal comfort and educational environment of building users
• Guide strategic replacement of HVAC systems which burden the district maintenance program
• Perform cost / benefit and return-on-investment analysis of existing HVAC and water systems to guide strategic investments for operational cost savings
2.8 Capital FundingThis section summarizes total capital needs identified by the district, addressing growth, renewal of existing facilities, technology, and educational and programmatic requirements.
2.8.1 Capital Funding HistoryGallup-McKinley County Schools funds its
capital improvements program using several funding sources, including• General obligation bonds (GO Bonds) • SB-9 funds, or 2-mill levy (The Public
Schools Capital Improvement Act) – The state matches SB-9 local funds
each year for general maintenance and small projects
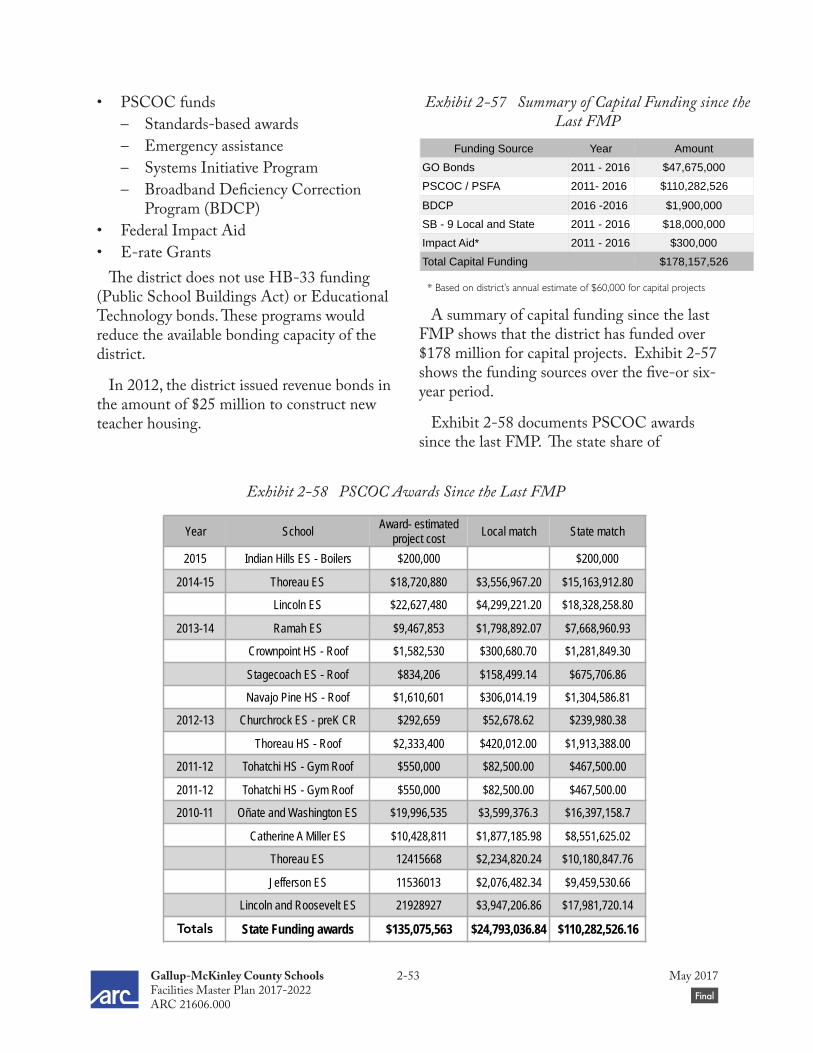
Gallup-McKinley County Schools 2-53 May 2017 Facilities Master Plan 2017-2022 Draft FinalARC 21606.000
• PSCOC funds – Standards-based awards – Emergency assistance – Systems Initiative Program – Broadband Deficiency Correction
Program (BDCP)• Federal Impact Aid• E-rate Grants
The district does not use HB-33 funding (Public School Buildings Act) or Educational Technology bonds. These programs would reduce the available bonding capacity of the district.
In 2012, the district issued revenue bonds in the amount of $25 million to construct new teacher housing.
A summary of capital funding since the last FMP shows that the district has funded over $178 million for capital projects. Exhibit 2-57 shows the funding sources over the five-or six-year period.
Exhibit 2-58 documents PSCOC awards since the last FMP. The state share of
Funding Source Year AmountGO Bonds 2011 - 2016 $47,675,000PSCOC / PSFA 2011- 2016 $110,282,526BDCP 2016 -2016 $1,900,000SB - 9 Local and State 2011 - 2016 $18,000,000Impact Aid* 2011 - 2016 $300,000Total Capital Funding $178,157,526
* Based on district’s annual estimate of $60,000 for capital projects
Exhibit 2-57 Summary of Capital Funding since the Last FMP
Year SchoolAward- estimated
project costLocal match State match
2015 Indian Hills ES - Boilers $200,000 $200,000
2014-15 Thoreau ES $18,720,880 $3,556,967.20 $15,163,912.80
Lincoln ES $22,627,480 $4,299,221.20 $18,328,258.80
2013-14 Ramah ES $9,467,853 $1,798,892.07 $7,668,960.93
Crownpoint HS - Roof $1,582,530 $300,680.70 $1,281,849.30
Stagecoach ES - Roof $834,206 $158,499.14 $675,706.86
Navajo Pine HS - Roof $1,610,601 $306,014.19 $1,304,586.81
2012-13 Churchrock ES - preK CR $292,659 $52,678.62 $239,980.38
Thoreau HS - Roof $2,333,400 $420,012.00 $1,913,388.00
2011-12 Tohatchi HS - Gym Roof $550,000 $82,500.00 $467,500.00
2011-12 Tohatchi HS - Gym Roof $550,000 $82,500.00 $467,500.00
2010-11 Oñate and Washington ES $19,996,535 $3,599,376.3 $16,397,158.7
Catherine A Miller ES $10,428,811 $1,877,185.98 $8,551,625.02
Thoreau ES 12415668 $2,234,820.24 $10,180,847.76
Jefferson ES 11536013 $2,076,482.34 $9,459,530.66
Lincoln and Roosevelt ES 21928927 $3,947,206.86 $17,981,720.14
Totals State Funding awards $135,075,563 $24,793,036.84 $110,282,526.16
Exhibit 2-58 PSCOC Awards Since the Last FMP
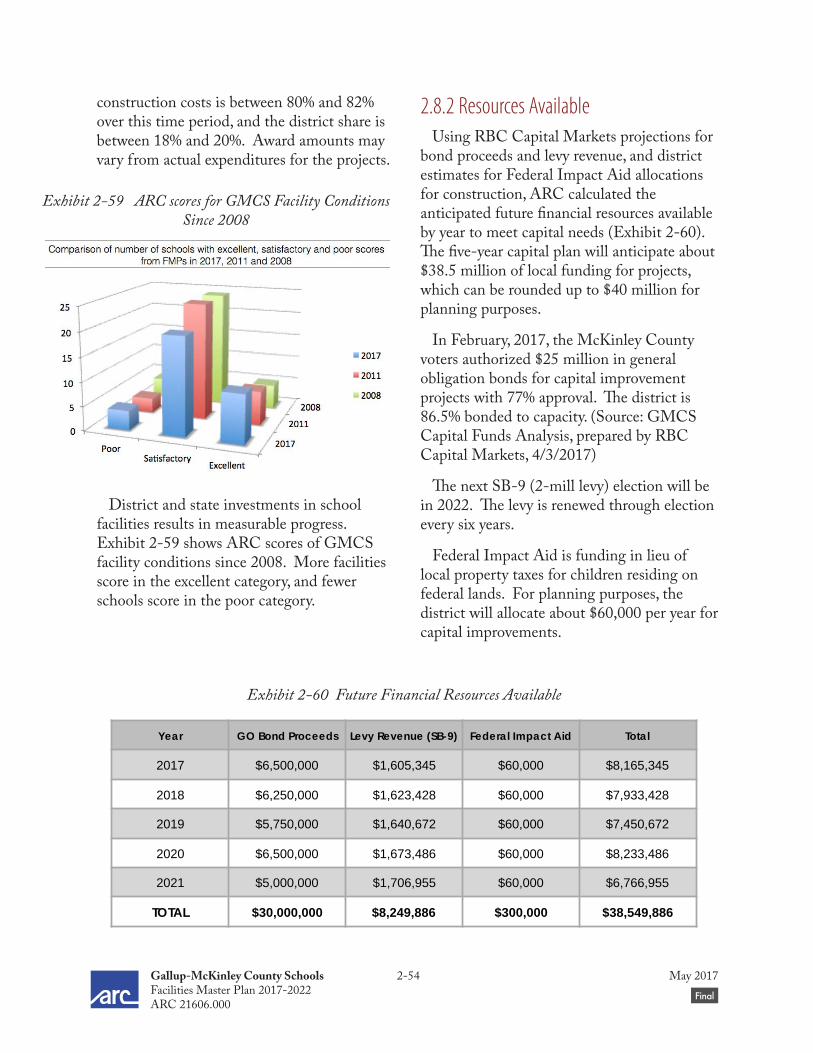
Gallup-McKinley County Schools 2-54 May 2017 Facilities Master Plan 2017-2022 Draft FinalARC 21606.000
construction costs is between 80% and 82% over this time period, and the district share is between 18% and 20%. Award amounts may vary from actual expenditures for the projects.
District and state investments in school facilities results in measurable progress. Exhibit 2-59 shows ARC scores of GMCS facility conditions since 2008. More facilities score in the excellent category, and fewer schools score in the poor category.
2.8.2 Resources AvailableUsing RBC Capital Markets projections for
bond proceeds and levy revenue, and district estimates for Federal Impact Aid allocations for construction, ARC calculated the anticipated future financial resources available by year to meet capital needs (Exhibit 2-60). The five-year capital plan will anticipate about $38.5 million of local funding for projects, which can be rounded up to $40 million for planning purposes.
In February, 2017, the McKinley County voters authorized $25 million in general obligation bonds for capital improvement projects with 77% approval. The district is 86.5% bonded to capacity. (Source: GMCS Capital Funds Analysis, prepared by RBC Capital Markets, 4/3/2017)
The next SB-9 (2-mill levy) election will be in 2022. The levy is renewed through election every six years.
Federal Impact Aid is funding in lieu of local property taxes for children residing on federal lands. For planning purposes, the district will allocate about $60,000 per year for capital improvements.
Year GO Bond Proceeds Levy Revenue (SB-9) Federal Impact Aid Total
2017 $6,500,000 $1,605,345 $60,000 $8,165,345
2018 $6,250,000 $1,623,428 $60,000 $7,933,428
2019 $5,750,000 $1,640,672 $60,000 $7,450,672
2020 $6,500,000 $1,673,486 $60,000 $8,233,486
2021 $5,000,000 $1,706,955 $60,000 $6,766,955
TOTAL $30,000,000 $8,249,886 $300,000 $38,549,886
Exhibit 2-60 Future Financial Resources Available
Exhibit 2-59 ARC scores for GMCS Facility Conditions Since 2008

Gallup-McKinley County Schools 2-55 May 2017 Facilities Master Plan 2017-2022 Draft FinalARC 21606.000
PSCOC funding is likely for some GMCS schools. PSFA ranks each school facility with respect to all other facilities in the state, and assigns a condition index value (wNMCI). Exhibit 2-61 shows the current (February 12, 2017) PSFA ranking and wNMCI values for the district’s school facilities. The school list starts with the greatest need (lowest ranking number) and continues to the least need (highest ranking number) according to the state system. Note that the PSFA does not rank administrative or support facilities, and the PSCOC does not fund capital projects for those facilities.
GMCS has four schools in the top 50 of the list, and an additional two schools in the top 100. PSFA currently requires the wNMCI to exceed 50% for eligibility for funding. Standards-based awards will fund projects at an 82% state share and 18% local share.
SchoolName Rank GrossArea(Sq.Ft.) wNMCI
RockyViewES 13 51,768 44.09%
RedRockES 14 51,788 43.62%
NavajoPineHS 25 76,553 38.78%
ThoreauHS 45 122,442 32.86%
GallupHS 68 259,311 30.37%
TohatchiHS 72 125,276 30.06%
GallupCentralAlternaTveHS 104 37,999 27.44%
CrownpointHS 123 81,218 26.01%
CheeDodgeES 137 57,628 25.36%
DavidSkeetES 141 45,454 24.99%
StagecoachES 228 64,834 20.80%
CrownpointMS 242 54,677 20.03%
TobeTurpenES 365 49,426 15.32%
MiddleCollegeCharterHighSchool 394 6,898 14.20%
TohatchiMS 414 46,597 13.44%
IndianHillsES 477 50,954 10.59%
NavajoES 501 60,879 9.60%
Tse'Yi'GaiHS 505 64,384 9.42%
GallupMS 522 83,395 8.65%
TwinLakesES 530 42,998 8.35%
RamahES(2018)-NEWATHIGHSCHOOLSIT 551 29,911 7.46%
HiroshiMiyamuraHS 589 227,530 5.97%
ChiefManuelitoMS 613 112,069 5.12%
JohnF.KennedyMS 623 142,129 4.91%
ThoreauMS 641 55,339 4.21%
RamahHS 646 61,251 4.10%
NavajoMS 655 52,761 3.47%
TohatchiES 668 55,338 2.99%
CrownpointES 694 48,592 1.09%
CatherineAMillerES(pka-ChurchrockAcad 714 50,833 0.00%
DelNorteES(New2017)(ReplacingbothJ.d. 730 60,352 0.00%
NewTOBENAMEDES(2018)(Replacingbot 731 h60,352 0.00%
JeffersonES(NEW) 732 60,234 0.00%
LincolnES(NEW-2019) 736 50,000 0.00%
Exhibit 2-61 Current Rankings with wNMCI Values

Gallup-McKinley County Schools 2-56 May 2017 Facilities Master Plan 2017-2022 Draft FinalARC 21606.000
2.8.3 Scope and Estimated Cost of the 2017-22 Capital Plan
The 2017-22 FMP has identified about $88 million in district prioritized needs. (See Exhibit 3-11.) The district’s resources are not capable of matching these needs.
The district resources of $40 million over five years relies on the partnership with PSCOC on capital projects to meet facility capital needs.
GMCS has raised concerns with PSCOC about a lack of state funding for facilities not included in adequacy standards. District resources are not capable of matching needs for facilities at full cost to the district. The district has expressed a desire for the State to participate in: 1. Constructing pre-kindergarten classrooms2. Constructing Title IX athletic amenities to
accommodate both sexes3. Extension of utilities off of site4. Constructing concession stands5. Constructing Navajo language classrooms6. Constructing cultural classrooms7. Constructing parent education spaces8. Constructing “response to intervention”
spaces9. Constructing OT/PT spaces10. Constructing computer-based testing
spaces11. Constructing improved campus security12. Minimal landscaping13. Constructing teacherages14. Constructing softball and baseball fields15. Payment of Navajo (Business Activity) Tax16. Providing additional funding for facility
maintenance17. Revising the state-district match
2.8.4 Maintenance Projects in Capital PlanARC reviewed PSFA FMAR data and
updated the data as part of the FMP process. Several maintenance issues at several school facilities may turn into capital projects and are addressed by Capital Improvement Projects (CIPs). The Detailed Capital Plan in Section 4, Supporting Materials identifies these projects.
The Detailed Capital Plan includes a column labeled, “FMAR Projects to Capital Plan,” and includes information about project timing and anticipated financial resources available.

Gallup-McKinley County Schools 3-1 May 2017 Facilities Master Plan 2017-2022 Draft FinalARC 21606.000
This section summarizes total capital needs identified by the district, addressing growth, renewal of existing facilities, technology, and educational and programmatic requirements.
3.1 Total Capital NeedsThe total capital needs for all school,
administrative and support facilities are $262 million.
Exhibit 3-1 summarizes the capital needs of district facilities. The Appendix includes a full facility description, summary of renewal requirements and detailed capital improvement needs.
3 Capital Improvement Plan
Catherine A. Miller Elementary SchoolBus Barn - Tse Yi Gai
Tohatchi Elementary SchoolBus Barn - Crownpoint
Twin Lakes Elementary SchoolThoreau Middle School
Chief Manuelito Middle SchoolBus Barn - ThoreauBus Barn - Tohatchi
Navajo Middle SchoolNavajo Elementary School
Indian Hills Elementary SchoolStudent Support Center / Technology
Crownpoint Elementary SchoolRamah High School
Thoreau Elementary SchoolExisting Bus Transportation Center (Gallup)
District StadiumChee Dodge Elementary SchoolStagecoach Elementary SchoolJohn F. Kennedy Middle SchoolEducation Development Center
Tse Yi Gai High SchoolHiroshi Miyamura High School
Crownpoint Middle SchoolGallup Middle School
David Skeet Elementary SchoolTohatchi Middle School
Tobe Turpen Elementary School700 S. Boardman Drive
Gallup Central Alternative High SchoolNavajo Pine High SchoolCrownpoint High School
Rocky View Elementary SchoolRoosevelt Elementary School
Thoreau High SchoolRed Rock Elementary School
Lincoln Elementary SchoolTohatchi High School
Gallup High School$0 $10,000,000 $20,000,000 $30,000,000 $40,000,000 $50,000,000
$40,915,468$22,674,950
$16,650,511$13,977,698
$12,697,634$11,534,503$11,413,550
$10,879,790$10,147,914
$9,190,035$8,712,317
$8,194,922$7,610,594
$6,868,128$6,170,112$5,809,123$5,568,777$5,389,902$5,157,269$4,795,283$4,625,763$4,524,208$4,029,512$3,597,906$3,331,422$3,190,255$2,971,667
$2,178,842$1,292,348$1,244,485$1,175,120$1,099,057$986,620$971,546
Total Project Budgets
Exhibit 3-1 Capital Needs by Facility

Gallup-McKinley County Schools 3-2 May 2017 Facilities Master Plan 2017-2022 Draft FinalARC 21606.000
Capital improvement projects (CIPs) are project estimates which address facility condition and adequacy deficiencies, programmatic and growth needs, and sustainability upgrades and opportunities. Each CIP includes a project description and budget which corrects the facility need.
Capital needs show the budgets to correct deficiencies. High capital needs typically reflect life cycle need(s) for systems renewal or replacement, such as HVAC or roofing systems. The high needs may also reflect larger facility size. Lincoln ES shows a cost for the replacement school facility.
Sources of Funding
The district uses sources of funding listed below for maintenance, capital projects, and for broadband (Exhibit 3-2).
Preventive Maintenance Needs and ResourcesThe district’s Preventive Maintenance
(PM) Plan 2016/2017 goals and procedures articulate how the district will identify and rectify preventive maintenance needs and how the district measures maintenance effectiveness. The district updates the PM plan annually.
The size of the district geographically impacts district costs for preventive maintenance. The district has 16 sites at a distance greater than 30 miles from the central maintenance office, adding time, wear on vehicles, and challenges to each effort. Exhibit 3-3 compares greatest facility distances from the maintenance central office for GMCS to other large New Mexico school districts.
The district’s capital funding strategy includes major planned maintenance and repair projects. The total anticipated preventive maintenance needs of prioritized projects is $29 million. The GO Bond program, exclusive of SB-9 funds for the maintenance program, provides $11.45 million in funding for maintenance capital improvements. PSCOC funding is anticipated for HVAC improvements through the Systems
Sources of Funding MaintenanceCapital Projects
Broadband
GO Bonds
SB-9
PSCOC
- Standards Based Awards
- Emergency Assistance
- Broadband Deficiency Correction Program
Federal Impact Aid
E-Rate Grants
�
�
�
�
�
�
�
��
�
�
�
Exhibit 3-2 Funding Sources for Maintenance, CIPs and Broadband
Exhibit 3-3 Comparative School District Facility Distances
# M
iles
Site
from
Mai
nten
ance
Cen
tral O
ffice
0
25
50
75
100
GMCS APS Gadsden Farmington Hobbs Santa Fe

Gallup-McKinley County Schools 3-3 May 2017 Facilities Master Plan 2017-2022 Draft FinalARC 21606.000
Initiative Program. The list of prioritized projects is included in the capital plan (Exhibit 3-1).
Decreasing Enrollments RequirementsAs discussed in previous sections, declining
enrollment has created a legacy of school facilities around the district with capacities larger than the current and projected enrollments.
In the county communities, the high school facilities generally show the highest needs for capital improvements and investments. The steering committee considered renovation and replacement of facilities, and found renovation to be more cost-effective to bring schools up to a state-of-the-art condition, while allowing the community to retain the larger gyms and classrooms. To improve utilization, the district will need to resize schools during this process, or work with the communities to reconfigure school programs into two rather than three facilities.
In the Gallup area, declining enrollments will require a new boundary area adjustment for elementary schools. The adjustments will establish the design enrollment to rebuild Red Rock ES and for the renovations at Rocky View ES. The addition to replace portable classrooms at Rocky View ES may not be necessary.
Facility Renewal RequirementsExhibit 3-4 shows capital needs by site and
by location (in town or in the county) as a cost per SF. Total capital needs per square foot districtwide are $102.22.
Capital needs by site align with expectations given facility ages. Capital needs by site also align with ARC scores and PSFA rankings. There are no noteworthy outliers.
Tohatchi Elementary SchoolThoreau Middle School
Twin Lakes Elementary SchoolNavajo Elementary School
Navajo Middle SchoolRamah High School
Crownpoint Elementary SchoolThoreau Elementary School
Tse'Yi'Gai High SchoolCrownpoint Middle School
Crownpoint High SchoolThoreau High School
Navajo Pine High SchoolTohatchi Middle School
Tohatchi High School $174$166
$146$138
$110$106
$84$72$62$50
$22$22$16$11$10
Capital Needs$ / GSF
Chief Manuelito Middle SchoolIndian Hills Elementary SchoolHiroshi Miyamura High SchoolJohn F. Kennedy Middle School
Chee Dodge Elementary SchoolGallup Middle School
Stagecoach Elementary SchoolGallup High School
David Skeet Elementary SchoolTobe Turben Elementary SchoolRocky View Elementary SchoolGallup Central Alt High School
Red Rock Elementary SchoolRoosevelt Elementary School
Lincoln Elementary School $406$353
$292$248
$188$166$158
$134$109
$83$78
$34$28$22$9
In To
wnCo
unty
Exhibit 3-4 Facility Needs by Site

Gallup-McKinley County Schools 3-4 May 2017 Facilities Master Plan 2017-2022 Draft FinalARC 21606.000
Facility Needs by SiteThe planning team evaluated each district
school site and facility in detail and scored them with respect to condition, New Mexico School Facility Adequacy Standards, and district standards as articulated in the recent educational specifications for elementary schools.
The evaluation score is a composite that takes into account the physical condition and functional adequacy of the site and facility.
Exhibit 3-5 shows an overview of the results of the evaluation with the total percentage score for each district facility.
Most of the district’s school facilities scored in the satisfactory and excellent categories.
The district’s transportation and maintenance facilities scored poorly.
Ramah Elementary SchoolCatherine A. Miller Elementary School
Thoreau Middle SchoolJefferson Elementary School
Crownpoint Elementary SchoolNavajo Middle School
Tse Yi Gai High SchoolTohatchi Elementary School
Chief Manuelito Middle SchoolStudent Support Center / Technology
Hiroshi Miyamura High SchoolTwin Lakes Elementary School
Navajo Elementary SchoolDavid Skeet Elementary SchoolJohn F. Kennedy Middle School
Ramah High SchoolStagecoach Elementary School
Tohatchi Middle SchoolIndian Hills Elementary School
Chee Dodge Elementary SchoolBus Barn - Tse Yi GaiGallup Middle School
Tobe Turpen Elementary SchoolTohatchi High School
District StadiumRoosevelt Elementary School
Thoreau High SchoolRocky View Elementary School
Crownpoint Middle SchoolGallup High School
Bus Barn - CrownpointCrownpoint High School
Thoreau Elementary SchoolGallup Central Alternative High School
Lincoln Elementary SchoolRed Rock Elementary School
Navajo Pine High SchoolEducation Development Center
700 S. Boardman DriveExisting Bus Transportation Center (Gallup)
Bus Barn - ThoreauBus Barn - Tohatchi
40 55 70 85 100
49.454.6
60.264.966.967.868.269.769.771.271.872.572.773.874.575.275.375.978.778.880.380.781.481.882.282.583.183.684.386.187.287.688.190.190.290.590.99393.494.395.397.4
Excellent
Satisfactory
Poor
Exhibit 3-5 Total Percentage Facility Score by School
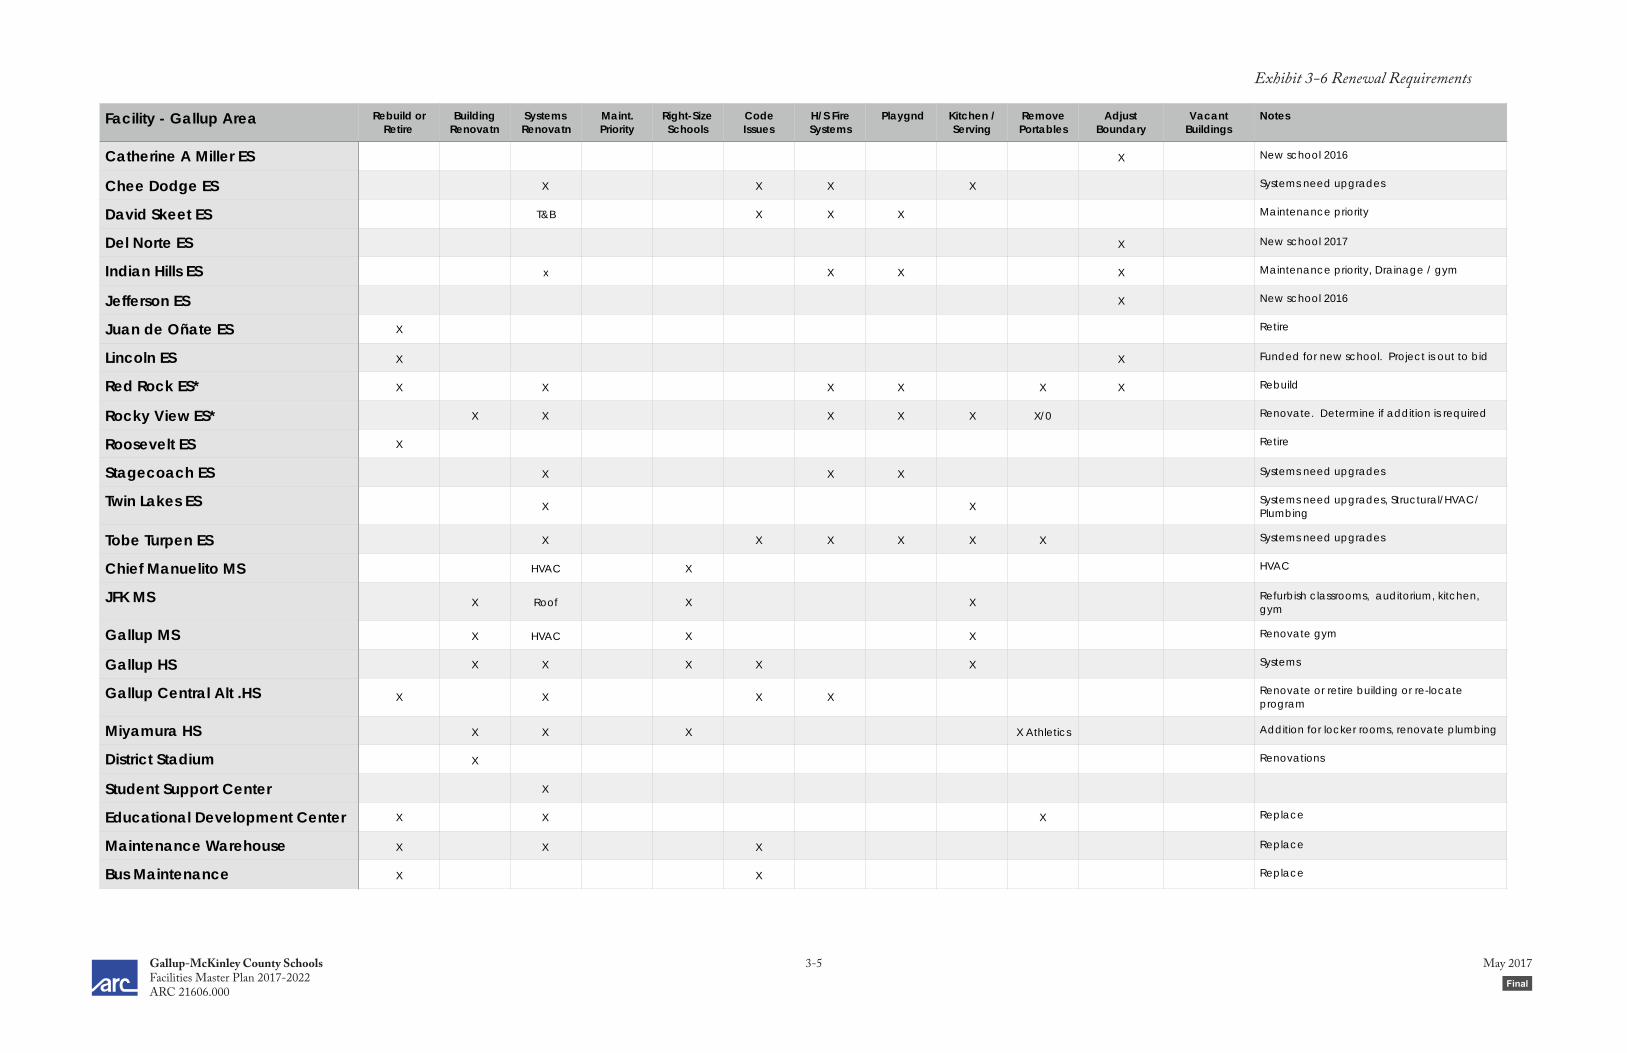
Gallup-McKinley County Schools 3-5 May 2017 Facilities Master Plan 2017-2022 Draft FinalARC 21606.000
Facility - Gallup Area Rebuild or Retire
Building Renovatn
Systems Renovatn
Maint. Priority
Right-Size Schools
Code Issues
H/S Fire Systems
Playgnd Kitchen / Serving
Remove Portables
Adjust Boundary
Vacant Buildings
Notes
Catherine A Miller ES X New school 2016
Chee Dodge ES X X X X Systems need upgrades
David Skeet ES T&B X X X Maintenance priority
Del Norte ES X New school 2017
Indian Hills ES x X X X Maintenance priority, Drainage / gym
Jefferson ES X New school 2016
Juan de Oñate ES X Retire
Lincoln ES X X Funded for new school. Project is out to bid
Red Rock ES* X X X X X X Rebuild
Rocky View ES* X X X X X X/0 Renovate. Determine if addition is required
Roosevelt ES X Retire
Stagecoach ES X X X Systems need upgrades
Twin Lakes ES X XSystems need upgrades, Structural/HVAC/Plumbing
Tobe Turpen ES X X X X X X Systems need upgrades
Chief Manuelito MS HVAC X HVAC
JFK MS X Roof X XRefurbish classrooms, auditorium, kitchen, gym
Gallup MS X HVAC X X Renovate gym
Gallup HS X X X X X Systems
Gallup Central Alt .HS X X X XRenovate or retire building or re-locate program
Miyamura HS X X X X Athletics Addition for locker rooms, renovate plumbing
District Stadium X Renovations
Student Support Center X
Educational Development Center X X X Replace
Maintenance Warehouse X X X Replace
Bus Maintenance X X Replace
Exhibit 3-6 Renewal Requirements

Gallup-McKinley County Schools 3-6 May 2017 Facilities Master Plan 2017-2022 Draft FinalARC 21606.000
* School ranked for possible PSCOC funding
Facility - County Area Rebuild or Retire
Building Renovatn
Systems Renovatn
Maint. Priority
Right-Size Schools
Code Issues
H/S Fire Systems
Playgnd Kitchen / Serving
Remove Portables
Adjust Boundary
Vacant Buildings
Notes
Crownpoint ES s New school 2012
Crownpoint MS X X X X 1967 old buildings, 2007 addition
Crownpoint HS X X X X X Consolidate?
Navajo ES X Drainage, 2002 school
Navajo MS T&B X New school 2006
Navajo Pine HS* X X X X X Consolidate?
Thoreau ES CRs and Gym
X XFunded for new school
Thoreau MS X New school 2011
Thoreau HS* X X X X X HVAC, Drainage
Ramah ES New school 2017
Ramah MS / HS X New school 2005
Tohatchi ES X New school 2009
Tohatchi MS X X X Phone / Electrical / Roof
Tohatchi HS X X X X X Renovate - can be done in phases
Tse’Yi’Gai HS T&B X Consolidate?
Bus Barn - Thoreau X X
Bus Barn - Tohatchi X X
Bus Barn - Tse’Y’Gai
Bus Barn - Crownpoint X Replace
Exhibit 3-6 Renewal Requirements Continued

Gallup-McKinley County Schools 3-7 May 2017 Facilities Master Plan 2017-2022 Draft FinalARC 21606.000
Facilities Recommended for Replacement
Lincoln Elementary School and Thoreau Elementary SchoolLincoln ES is funded for replacement as part of the 2011-2016 GMCS FMP capital plan
and through PSCOC project #15-007. The replacement school is designed, and the project is scheduled for completion in 2018.
Thoreau ES is funded for replacement as part of the 2011-2016 GMCS FMP capital plan and through PSCOC project #15-006. The replacement school is in the design phase, and the project is scheduled for completion in 2019.
Red Rock Elementary SchoolThe Red Rock ES facility is at the end of its useful life. Major
building systems, including plumbing, roofing and HVAC are in poor condition. The school’s hexagonal configuration limits flexible use of spaces, and corridors are narrow with poor sight lines. The kitchen has a small serving area, limiting function. The school has eight portables in use that serve preschool, upper grade classes and special education, and analysis shows a classroom need. Vehicular circulation is congested. The facility should be replaced rather than renovated.
Red Rock ES is ranked #14 on the state list, with a NMCI of 43.62%. State participation in funding for a replacement school is likely during this 5-Year FMP cycle.
Gallup High SchoolGallup HS was built in 1998 and 2009, and while not an
old facility, the building systems are failing, including the foundations, HVAC, plumbing and drainage. In 2016, the district was required to invest over $2 million in structural and
Red Rock ES Facility DataGrades PreK - 5
2016-17 40D Enrollment 386GSF 47,939
# Portables in use 8Date Opened 1966
Building Additions 1975Functional Capacity 447
Functional Capacity wo Portables 343Utilization 97%
FTE Loading Analysis Utilization
88%ARC Facility Score 68.2
FMP Total Capital Needs $13,977,698
* PSFA ranking is in top 50
Replacement
Gallup Central Alt. HS Gallup HS Red Rock ES*
Education Dev’t Center
Bus Maintenance
Maintenance and
Warehouse
Renovations
Crownpoint HS Navajo Pine HS* Rocky View ES* Thoreau HS* Tohatchi HS District Stadium
System Upgrades
Chee Dodge ES David Skeet ES Tobe Turpen ES Indian Hills ES Stagecoach ES
Exhibit 3-7 GMCS Facility Renewal Requirements by School
Gallup HS Facility Data
Grades 9-122016-17 40D Enrollment 925
GSF 305,830# Portables in use 0
Date Opened 1998Building Additions 2000, 2009
Functional Capacity 1,439Functional Capacity wo Portables 1,439
Utilization 72%FTE Loading Analysis
Utilization55%
ARC Facility Score 72.7FMP Total Capital Needs $40,915,468

Gallup-McKinley County Schools 3-8 May 2017 Facilities Master Plan 2017-2022 Draft FinalARC 21606.000
drainage repairs at the gym lobby, and hopes to avoid ongoing costly structural repairs to the failed facility. The HS has excess GSF and capacity, and with replacement of the facility, the district has the opportunity to “right-size” Gallup area HS facilities to align with projected enrollment.
Gallup HS is ranked #68 on the state list, with a wNMCI of 30.37%. State participation in funding for this program during this 5-Year FMP cycle is possible.
Gallup Central Alternative High SchoolHoused in a former elementary school, the Gallup Central
Alternative HS is a facility at the end of its useful life. Building systems are in poor condition, including the building envelope and roofing, HVAC, electrical, plumbing, and interior finishes. The building has no fire suppression system, and facilities are not ADA-compliant. The district will consider options to replace or relocate the program to another facility.
Gallup Central Alternative HS is ranked #104 on the state list, with a wNMCI of 27.44%. State participation in funding for this program during this 5-Year FMP cycle is possible.
Gallup Bus, Transportation, Maintenance and Warehouse FacilitiesGMCS bus transportation center, and maintenance and
warehouse facilities are in poor condition, require code upgrades, and do not meet the current needs of the district. The district recommends purchase of a new, larger site and colocation of the bus transportation complex with maintenance, warehouse and motor pool facilities.
Total capital needs for 700 Boardman Avenue is $8.7 million, and for the existing bus transportation center is $3.6 million. Replacement facilities, not including site acquisition, have a proposed project budget of $4 million.
Educational Development CenterAlso housed in a former elementary school,
the Educational Development Center (EDC) facilities are in poor condition and do not meet the needs of the users. EDC staff handle administration of the district’s specialized
Gallup Central Alternative HS Facility Data
Grades 9-122016-17 40D Enrollment 237
GSF 40,412# Portables in use 5
Date Opened 1954Building Additions 1968, 1985
Functional Capacity 515Functional Capacity wo Portables 398
Utilization 45%FTE Loading Analysis
Utilization28%
ARC Facility Score 69.7FMP Total Capital Needs $9,190,035

Gallup-McKinley County Schools 3-9 May 2017 Facilities Master Plan 2017-2022 Draft FinalARC 21606.000
education program. The general building condition makes it challenging for staff to perform their jobs. Work spaces are crowded and the encroaching stored items inhibit mobility. Ineffective HVAC systems and constant building maintenance take focus away from the staff assisting students and learning programs. The district will consider options to renovate or relocate the program to another facility.
Facilities Recommended for Major Renovations
Rocky View Elementary SchoolRocky View ES was built in 1994 and has capital needs for
general renovations and major building systems upgrades, including roofing, HVAC and a fire suppression system. The school uses ten portable classrooms. The boundary adjustment study will determine future enrollments and classroom needs, and whether a classroom wing addition to replace portable classrooms will be required.
Rocky View ES is ranked #13 on the state list, with a wNMCI of 44.09%. State participation in funding for a replacement school is likely during this 5-Year FMP cycle.
Navajo Pine High SchoolThe Navajo Pine HS facilities were built in 1985, and the roof
was replaced in 2014. The building requires general renovations and upgrades to HVAC and restrooms. The declining enrollment has created a legacy of excess GSF. The configuration of the building does not support demolition or closing of a portion of the facilities. Renovation of existing facilities is more cost effective than construction of a new replacement high school. The district will work with the community to address excess GSF and consider strategies to improve utilization.
Navajo Pine HS is ranked #25 on the state list, with a wNMCI of 38.78%. State participation in funding for renovations of the school is likely during this 5-Year FMP cycle.
Tohatchi High SchoolTohatchi HS facilities were constructed in 1978 and 1984,
and need major renovation and refurbishing. The gym received a new roof in 2011. The school is comprised of four separate buildings with separated wings, a configuration which allows
Rocky View ES Facility Data
Grades PreK - 52016-17 40D Enrollment 320
GSF 50,855# Portables in use 10
Date Opened 1994Building Additions 1998
Functional Capacity 496Functional Capacity wo Portables 332
Utilization 89%FTE Loading Analysis
Utilization82%
ARC Facility Score 74.5FMP Total Capital Needs $11,413,550
Navajo Pine HS Facility Data
Grades 9-122016-17 40D Enrollment 140
GSF 77,415# Portables in use 0
Date Opened 1985Building Additions 0
Functional Capacity 352Functional Capacity wo Portables 352
Utilization 47%FTE Loading Analysis
Utilization29%
ARC Facility Score 67.8FMP Total Capital Needs $11,848,355
Tohatchi HS Facility Data
Grades 9-122016-17 40D Enrollment 361
GSF 116,170# Portables in use 1
Date Opened 1980Building Additions 2005
Functional Capacity 623Functional Capacity wo Portables 575
Utilization 55%FTE Loading Analysis
Utilization49%
ARC Facility Score 75.2FMP Total Capital Needs $16,036,091

Gallup-McKinley County Schools 3-10 May 2017 Facilities Master Plan 2017-2022 Draft FinalARC 21606.000
phased renovations on an occupied campus. Renovation of existing facilities is more cost-effective than construction of a new replacement high school. The district will work with the community to address excess GSF and consider strategies to improve utilization.
Tohatchi HS is ranked #72 on the state list, with a wNMCI of 30.06%. State participation in funding for renovations of the school is possible during this 5-Year FMP cycle.
Thoreau High SchoolThoreau HS was built in 1980 and the roof was replaced in
2012. The building requires general renovations and upgrades to HVAC and site needs. The declining enrollment has created a legacy of excess GSF. The configuration of the building does not support demolition or closing of a portion of the facilities. Renovation of existing facilities is more cost-effective than construction of a new replacement high school. The district will work with the community to address excess GSF and consider strategies to improve utilization.
Vacant teacher housing at the campus requires abatement and demolition.
Thoreau HS is ranked #45 on the state list, with a wNMCI of 38.78%. State participation in funding for renovations of the school is likely during this 5-Year FMP cycle.
Crownpoint High SchoolCrownpoint HS opened in 1973, and the roof was replaced in
2013. The facility requires major renovations and replacement of HVAC systems and plumbing. The HS and MS campus includes several vacant buildings, including the old auxiliary gym, vocational building, and several vacant teacherages. The district will work with the community to address excess GSF and consider strategies to improve utilization.
The district needs a campus master plan to guide investments and demolition on the site.
Crownpoint HS is ranked #123 on the state list, with a wNMCI of 26.01%. State participation in funding for renovations of the school is possible during this 5-Year FMP cycle.
Thoreau HS Facility Data
Grades 9-122016-17 40D Enrollment 361
GSF 116,170# Portables in use 1
Date Opened 1980Building Additions 2005
Functional Capacity 623Functional Capacity wo Portables 575
Utilization 55%FTE Loading Analysis
Utilization49%
ARC Facility Score 75.2FMP Total Capital Needs $16,036,091
Crownpoint HS Facility Data
Grades 9-122016-17 40D Enrollment 254
GSF 90,361# Portables in use 3
Date Opened 1973Building Additions 1974, 1984
Functional Capacity 764Functional Capacity wo Portables 624
Utilization 68%FTE Loading Analysis
Utilization48%
ARC Facility Score 71.8FMP Total Capital Needs $10,879,790

Gallup-McKinley County Schools 3-11 May 2017 Facilities Master Plan 2017-2022 Draft FinalARC 21606.000
District StadiumThe restroom and press box facilities were
built about 1980 and are not ADA-compliant. Site improvements are needed at the track and field and parking facilities.
Total capital needs for district stadium facilities is about $4 million.
System UpgradesSeveral elementary schools have code issues
due to a conflict between the fire codes and the cooling system. Chee Dodge ES, David Skeet ES, Indian Hills ES, Stagecoach ES and Tobe Turpen ES were built prior to the requirement for a fire suppression system and are “grandfathered” to allow a one-hour rated corridor instead. However, the evaporative cooling system requires that classroom doors remain open, violating the one-hour corridor rating. The district can resolve the code issue by installing a fire suppression system or replacing the cooling system.
Facilities To Dispose OfThe district will have 92,000 GSF of closed
school facilities for disposal at Juan de Oñate ES, Ramah ES and Roosevelt ES. Options for disposal of facilities include• Give away facilities• Repurpose facilities to avoid renovation of
other older facilities • Demolish facilities.
Roosevelt ES could be demolished to provide additional parking for the district stadium in Gallup.
Crownpoint MS and HS has vacant buildings, comprised of closed school buildings, portables and teacher housing. The two schools have excess GSF.
Districtwide, ARC has inventoried about 56 units of vacant teacher housing, about 90,000 GSF, which requires demolition. The units are an attractive nuisance and eyesore.
Districtwide, ARC has inventoried 44 unusable portables, over 48,000 GSF, on school campuses. Some sites are storing portables, or are using the vacant portables for storage. Gallup MS, Crownpoint HS, Navajo Pine HS, and Thoreau HS have abandoned portables to be removed.
3.2 Prioritization Process3.2.1 Process and Criteria Used by the
District to Prioritize Capital NeedsThe Facility Master Plan Steering
Committee reviewed all findings and analysis of the planning process, including FMP goals, recent projects and improvements since the last FMP, facility scores and capital needs,
Exhibit 3-8 Prioritization Process

Gallup-McKinley County Schools 3-12 May 2017 Facilities Master Plan 2017-2022 Draft FinalARC 21606.000
historic and projected enrollments, facility capacities, utilization, and classroom needs, maintenance needs, technology needs, historic and available funding for capital projects and the prioritization process.
All capital improvement projects (CIPs)have codes to enable the district to better understand the needs of the facilities by sorting the project data. CIP codes for the GMCS FMP include category codes for:• Code issues (health and safety)• ADA compliance• Facility renewal• Maintenance• Sustainability• Programmatic (projects which address
program needs and adequacy, typically projects in instructional spaces)
• Educational support (projects which address program needs and adequacy deficiencies in noninstructional spaces)
• Transportation• Portable reduction
The total capital needs districtwide are
sorted by category codes in Exhibit 3-9. The steering committee prioritized code
compliance (health and safety) projects. The majority of project costs in this category are for installation of fire suppression systems at grandfathered elementary schools.
Exhibit 3-9 Prioritized Code ComplianceHealth and
SafetySchool Project TPC
School Projects District wide Priority one $107,801
Admin. Projects District wide Priority one $733,913
Fire SuppressionChee Dodge, David Skeet, Stagecoach, Tobe Turpen
Fire Suppression issue with swamp coolers
$2,389,793
Totals $3,231,507
Facility renewal needs comprise 74.1% of the capital needs districtwide. The steering committee prioritized projects which leverage state participation. It recommends Red Rock ES and Gallup HS for replacement and major renovation of six school facilities as PSCOC funding is available. The renovations are a less expensive option to replacement, and allow the district to possibly consolidate programs and close facilities for future operational savings.
Category CodeElementary
SchoolMiddle School High School
Alternative School
Administration/ Support
Total Budgets % of Total
Code Compliance (Health/Safety) $4,019,026 $370,969 $30,919 $420,270 $733,914 $5,575,098 2.1%
ADA Compliance $2,293,151 $376,697 $2,235,905 $396,708 $407,564 $5,710,025 2.2%
Facility Renewal $52,236,553 $21,941,761 $96,473,559 $2,927,555 $20,740,089 $194,319,517 74.1%
Maintenance $1,106,520 $879,012 $358,319 $40,789 $56,276 $2,440,916 0.9%
Sustainability $1,254,404 $767,615 $216,110 $12,278 $49,778 $2,300,184 0.9%
Programmatic $23,424,445 $493,258 $9,767,417 $660,444 $220,571 $34,566,135 13.2%
Educational Support $3,252,279 $2,153,147 $2,260,494 $4,731,990 $1,467,654 $13,865,564 5.3%
Transportation $0 $0 $0 $0 $2,758,264 $2,758,264 1.1%
Portable Reduction $349,725 $228,544 $121,969 $0 $0 $700,238 0.3%
Total $87,936,102 $27,211,002 $111,464,691 $9,190,035 $26,434,110 $262,235,940 100.0%
Exhibit 3-10 Capital Needs Sorted by Category Code

Gallup-McKinley County Schools 3-13 May 2017 Facilities Master Plan 2017-2022 Draft FinalARC 21606.000
The steering committee prioritized programmatic needs which impact classrooms, including projects which address facility needs in special education classrooms. The steering committee also prioritized projects which impact functionality of schools, including projects for PE/athletic facilities and for food services.
The district continues to make improvements towards ADA compliance with each facility renovation and replacement. The 2010 updates to the ADA standards changed requirements for play areas, impacting capital needs at district elementary schools. The steering committee prioritized playground projects. The district is committed to the
School Project TPC PSCOC Share82%
Gallup Share18%
Navajo Pine HS Renovation $10,147,914 $8,321,289 $1,826,625
Red Rock ES Replace school $21,583,585 $17,698,540 $3,885,045
Rocky View ES Renovate existing facilities $6,749,015 $5,534,192 $1,214,823
Rocky View ESAddition to replace portables CRs
$2,721,081 $2,231,286 $489,795
Thoreau HS Renovation $12,697,634 $10,412,060 $2,285,574
Gallup HS Replace school and resize $38,055,517 $31,205,524 $6,849,993
Tohatchi HSPhase 1 renovation - CR, Admin
$3,503,612 $2,872,962 $630,650
Tohatchi HSPhase 2 renovation - CR, VoAg
$7,008,807 $5,747,222 $1,261,585
Tohatchi HSPhase 3 renovation - Cafeteria, Kitchen
$514,006 $421,485 $92,521
Tohatchi HS Phase 4 renovation - Gym $5,018,117 $4,114,856 $903,261
Crownpoint HS Renovation $6,493,940 $5,325,031 $1,168,909
Gallup Central Alt. HS Renovation $9,190,035 $7,535,829 $1,654,206
Totals $123,683,263 $101,420,276 $22,262,987
Program School Project TPC Capital Program Recommendation
AthleticsCrownpoint HS, Tohatchi HS, Miyamura HS, JFK MS, Navajo MS, Indian Hills ES, Tobe Truppen ES,
Gym upgrades, locker room renovations, new aux. gym at Miya.
$6,795,304 $4,000,000
Food ServicesGallup HS, Thoreau HS, JFK MS, Ramah HS, Tohatchi MS, Gallup MS, Chee Dodge ES, Tobe Turpen ES,
Kitchen and serving line upgrades, equipment upgrades
$5,058,668 $2,500,000
Special Education Miyamura HS, JKF MS, Tobe Turpen ESSpEd classroom upgrades
$733,913 $400,000
Totals $12,587,885 $6,900,000
Exhibit 3-11 Prioritized Facility Renewal
Exhibit 3-12 Prioritized Programmatic

Gallup-McKinley County Schools 3-14 May 2017 Facilities Master Plan 2017-2022 Draft FinalARC 21606.000
rights of students, parents, employees and the community members with disabilities as set forth in state and federal regulations. The goal is to ultimately correct all “feasibly addressable” physical accessibility issues for school and administrative sites and buildings.
The steering committee prioritized projects for building systems upgrades (roofs, HVAC, plumbing, electrical, play areas, drainage, paving and sustainability) to elevate ongoing maintenance priorities to the capital program. Projects coded for maintenance are projects identified during evaluations and review of FMAR reports which are not capital projects; the general M&O program addresses these needs.
The steering committee intends that the capital plan address ongoing preventive maintenance and FMAR issues. A column in the detailed capital plan labeled “FMAR issues” identifies FMAR projects included in the plan.
The district’s Preventive Maintenance Plan states that: • The Facilities Director will maintain a detailed and prioritized list of capital
replacement items and system components related to the facilities.• On a monthly / quarterly basis, the maintenance coordinator will submit a report of
repair items exceeding the routine expenditure cap for repair and determined a capital cost for replacement.
Location System Total NeedCapital Program
Recommendation Annual Allocation
District wide Playgrounds $1,816,617 $1,500,000 $300,000
District wideHVACPSFA participation $32,682,243 $3,000,000 $600,000
District wideDrainage, priority one and two $3,645,430 $1,500,000 $300,000
District wide Plumbing $396,810 $400,000 $80,000
District wideRoofs - priority one, two and three, w PSFA $13,943,596 $5,000,000 $1,000,000
Totals $52,484,696 $11,400,000 $2,280,000
Exhibit 3-13 Prioritized Districtwide Funds
Location System Total Need Capital Program Recommendation
Annual Allocation
District widePaving - priorities one and two
$7,157,725 $6,250,000 $1,250,000
Crownpoint New bus barn $1,284,726 $1,200,000
GallupNew Bus Transportation Center
$3,597,906 $4,000,000
Totals $12,040,357 $11,450,000 $1,250,000
Exhibit 3-14 Prioritized Transportation

Gallup-McKinley County Schools 3-15 May 2017 Facilities Master Plan 2017-2022 Draft FinalARC 21606.000
• The district will review this capital list and integrate it into the Facility Master Plan.
The steering committee prioritized funding for new facilities for bus transportation, maintenance and warehouse facilities. This project has been prioritized in past FMP capital programs, but deferred. The district can save the capital needs associated with code issues at existing facilities and direct the funds towards new facilities.
3.3 Capital Plan3.3.1 Summary Table of
Priority Capital ProjectsExhibit 3-11 shows the proposed capital
plan summary. The full FMP capital plan tables are in the Appendices and include funding sources for projects.
PSFA FAD-ranked schoolsThe capital plan includes a strategy for all
top eligible FAD-ranked schools on the PSFA list.
FMP AdoptionThe Board of Education approved this
update to the Facilities Master Plan for 2017-2021 on May 15, 2017 at its regular school board meeting. The Appendix includes the agenda and minutes.
3.3.2 Financial Strategies and Alternatives Considered
The FMP Capital Plan is subject to review and revisions, depending on the success of the district in partnering with PSCOC on renewal projects and systems upgrades. There is no
guarantee that the district will generate the planned revenues. The district may modify the recommended project priorities to bundle similar projects to generate savings or respond to unforeseen construction conditions, material availability or costs.
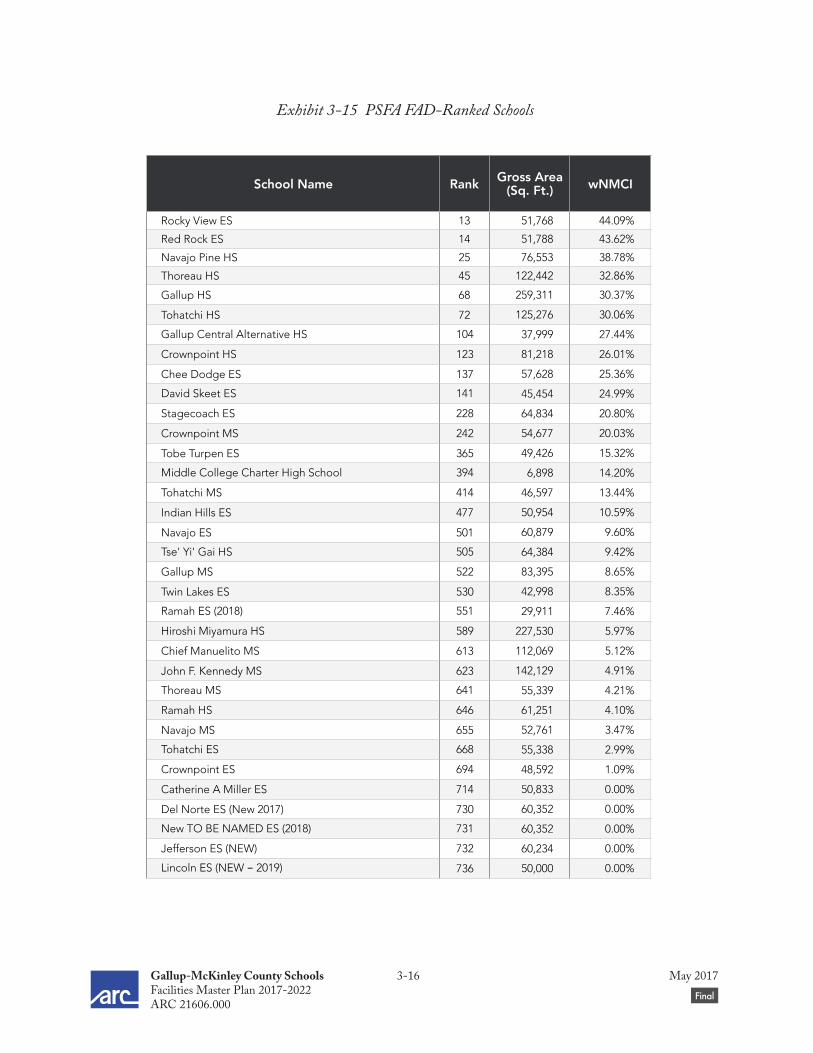
Gallup-McKinley County Schools 3-16 May 2017 Facilities Master Plan 2017-2022 Draft FinalARC 21606.000
Exhibit 3-15 PSFA FAD-Ranked Schools
School Name Rank Gross Area (Sq. Ft.) wNMCI
Rocky View ES 13 51,768 44.09%
Red Rock ES 14 51,788 43.62%
Navajo Pine HS 25 76,553 38.78%
Thoreau HS 45 122,442 32.86%
Gallup HS 68 259,311 30.37%
Tohatchi HS 72 125,276 30.06%
Gallup Central Alternative HS 104 37,999 27.44%
Crownpoint HS 123 81,218 26.01%
Chee Dodge ES 137 57,628 25.36%
David Skeet ES 141 45,454 24.99%
Stagecoach ES 228 64,834 20.80%
Crownpoint MS 242 54,677 20.03%
Tobe Turpen ES 365 49,426 15.32%
Middle College Charter High School 394 6,898 14.20%
Tohatchi MS 414 46,597 13.44%
Indian Hills ES 477 50,954 10.59%
Navajo ES 501 60,879 9.60%
Tse' Yi' Gai HS 505 64,384 9.42%
Gallup MS 522 83,395 8.65%
Twin Lakes ES 530 42,998 8.35%
Ramah ES (2018) 551 29,911 7.46%
Hiroshi Miyamura HS 589 227,530 5.97%
Chief Manuelito MS 613 112,069 5.12%
John F. Kennedy MS 623 142,129 4.91%
Thoreau MS 641 55,339 4.21%
Ramah HS 646 61,251 4.10%
Navajo MS 655 52,761 3.47%
Tohatchi ES 668 55,338 2.99%
Crownpoint ES 694 48,592 1.09%
Catherine A Miller ES 714 50,833 0.00%
Del Norte ES (New 2017) 730 60,352 0.00%
New TO BE NAMED ES (2018) 731 60,352 0.00%
Jefferson ES (NEW) 732 60,234 0.00%
Lincoln ES (NEW - 2019) 736 50,000 0.00%

Gallup-McKinley County Schools 3-17 May 2017 Facilities Master Plan 2017-2022 Draft FinalARC 21606.000
Prioritization - Capital Plan Option 1
FMP Goal School Projects Project Budget PSCOC Share District ShareTotal Project Costs District
Capital Plan Recommendation
(Rounded) FY 2017-18 FY2018-19 FY2019-20 FY2020-21 FY2021-22
Code Issues $1,740,000Code Issues - School Needs $107,801 $110,000 $110,000
Chee Dodge Elementary School Emergency Lighting Upgrade $13,869David Skeet Elementary School Emergency Power & Light $13,869Gallup Central Alternative High School Air Quality Study $29,875Gallup High School Kitchen Upgrades $5,467Tobe Turpen Elementary School Code Compliance: Gymnasium Egress $35,758Tobe Turpen Elementary School Air Quality Study $8,963
Code Issues - Fire suppression priorities $430,163 $430,000 $250,000 $180,000
Chee Dodge Elementary School Fire Suppression System Upgrade $750,000 $615,000 $135,000David Skeet Elementary School Fire Suppression System $467,672 $383,491 $84,181Stagecoach Elementary School Fire Suppression System Upgrade $676,131 $554,427 $121,704Tobe Turpen Elementary School Fire Suppression System Upgrade $495,990 $406,712 $89,278
Code Issues - Vacant buildings $448,957 $450,000 $450,000Thoreau High School Issue: Abandoned Teacher Housing Demolition$448,957
Code Issues - Admin $733,913 $750,000 $500,000 $250,000Existing Bus Transportation Center (Gallup) Building Safety Upgrades $130,953700 S. Boardman Drive Motor Pool Building Safety Upgrades $188,618700 S. Boardman Drive Maintenance Warehouse Building Safety $173,651700 S. Boardman Drive R&D Warehouse Building Safety $240,691
2017- 2022 FMP Period - District Cash Flow
Exhibit 3-16 Prioritization for Capital Plan Option 1

Gallup-McKinley County Schools 3-18 May 2017 Facilities Master Plan 2017-2022 Draft FinalARC 21606.000
Prioritization - Capital Plan Option 1
FMP Goal School Projects Project Budget PSCOC Share District ShareTotal Project Costs District
Capital Plan Recommendation
(Rounded) FY 2017-18 FY2018-19 FY2019-20 FY2020-21 FY2021-22
2017- 2022 FMP Period - District Cash Flow
School Renewal $23,950,000PSCOC Funding Available $7,856,188 $7,850,000 $2,616,667 $2,616,667 $2,616,667
Lincoln ES PSFA award $22,627,480 Current award $4,299,221Thoreau ES PSFA award $18,720,880 Current award $3,556,967
PSCOC Funding Eligible $9,701,861 $9,000,000 $1,000,000 $1,000,000 $3,000,000 $4,000,000Navajo Pine HS Renovation $10,147,914 $8,321,289 $1,826,625Red Rock ES Replace school $21,583,585 $17,698,540 $3,885,045Rocky View ES Renovate existing facilities $6,749,015 $5,534,192 $1,214,823Rocky View ES Addition to replace portables CRs $2,721,081 $2,231,286 $489,795Thoreau HS Renovation $12,697,634 $10,412,060 $2,285,574
Future PSCOC Funding $12,561,126 $1,200,000 $200,000 $1,000,000Crownpoint HS Renovation $6,493,940 $5,325,031 $1,168,909Gallup Central Alt. HS Renovation $9,190,035 $7,535,829 $1,654,206Gallup HS Replace school and resize $38,055,517 $31,205,524 $6,849,993Tohatchi HS phase 1 Phase 1 renovation $3,503,612 $2,872,962 $630,650Tohatchi HS phase 2 Phase 2 renovation $7,008,807 $5,747,222 $1,261,585Tohatchi HS phase 3 Phase 3 renovation $514,006 $421,485 $92,521Tohatchi HS phase 4 Phase 4 renovation $5,018,117 $4,114,856 $903,261
Athletics $6,795,304 $3,500,000 $500,000 $1,000,000 $1,000,000 $1,000,000Crownpoint High School Locker Room Renovations $453,710Hiroshi Miyamura High School Main Gym Renovation $995,500Hiroshi Miyamura High School Secondary Gym / Assembly Renovation $2,075,225Indian Hills ES Gymnasium and Electrical Upgrades $109,697John F. Kennedy Middle School Gymnasium Renovation $784,216John F. Kennedy Middle School Locker Room Renovations $461,346Navajo Middle School Interior Upgrades $15,386Tobe Turpen Elementary School Gymnasium Upgrades $355,304Tohatchi High School ADA Upgrades and Field House Addition $1,544,920
Food Services $5,058,668 $2,000,000 $500,000 $500,000 $500,000 $500,000Chee Dodge Elementary School Kitchen Upgrades $287,823Chee Dodge Elementary School Flooring Upgrade $121,001Gallup High School Kitchen Upgrades $5,467Gallup Middle School Kitchen Improvements $42,997John F. Kennedy Middle School Kitchen Renovation $909,134Ramah High School Kitchen Upgrades $6,864Thoreau High School Kitchen Renovation $1,427,958Tobe Turpen Elementary School Flooring Upgrades $139,338Tobe Turpen Elementary School Kitchen Expansion $913,065Tohatchi Middle School Kitchen Expansion $1,201,016Twin Lakes Elementary School Kitchen Improvements $4,005
Special Education Renovations $847,324 $400,000 $400,000Tobe Turpen Elementary School Special Education Improvements $292,414Hiroshi Miyamura High School SpEd Classrooms Renovation $151,581John F. Kennedy Middle School SpEd Classrooms Renovation $403,329
Exhibit 3-16 Prioritization for Capital Plan Option 1 Continued

Gallup-McKinley County Schools 3-19 May 2017 Facilities Master Plan 2017-2022 Draft FinalARC 21606.000
Prioritization - Capital Plan Option 1
FMP Goal School Projects Project Budget PSCOC Share District ShareTotal Project Costs District
Capital Plan Recommendation
(Rounded) FY 2017-18 FY2018-19 FY2019-20 FY2020-21 FY2021-22
2017- 2022 FMP Period - District Cash Flow
Maintenance $11,450,000Maintenance - Play Areas $1,816,671 $1,500,000 $300,000 $300,000 $300,000 $300,000 $300,000
Indian Hills Elementary School $236,289Tobe Turpen Elementary School $119,488Rocky View Elementary School $355,986Red Rock Elementary School $267,277Tohatchi Elementary School $179,393Stagecoach Elementary School $225,779David Skeet Elementary School $432,459
Matinenance - Sustainability $50,000 $50,000 $50,000Retrocommissioning, Energy and Water Sustainability Studies $50,000
Maintenance - Plumbing Systems $396,810 $400,000 $100,000 $100,000 $100,000 $50,000 $50,000Gallup HS $125,881Gallup Central Alternative HS $38,162Crownpoint MS $5,309Tohatchi MS $17,205Red Rock ES $17,000Chee Dodge ES $25,141Indian Hills ES $17,000Thoreau ES $151,112
Maintenance - HVAC $4,328,286 $3,000,000 $200,000 $700,000 $700,000 $700,000 $700,000PSFA participation Tohatchi Elementary HVAC - T+B $53,437
Chief Manuelito Middle HVAC - T+B $20,100Navajo Middle HVAC - T+B $37,858Thoreau Middle HVAC - T+B $19,439Tohatchi Middle HVAC - T+B $156,193Twin Lakes Elementary School HVAC - T+B $45,000Ramah High HVAC - T+B $93,500Chee Dodge Elementary HVAC Install refrigerated air system $647,087Tobe Turpen ES HVAC Install refrigerated air system $974,786Stagecoach ES HVAC Install refrigerated air system $463,556David Skeet HVAC Install refrigerated air system $137,243Tse'Yi'Gai High HVAC -Replace $445,348Indian Hills Elementary HVAC -Replace $166,122Tohatchi High HVAC -Replace $5,936,763 $4,868,146 $1,068,617
Maintenance - Drainage $3,645,430 $1,500,000 $300,000 $300,000 $300,000 $300,000 $300,000District wide Priority 1 drainage $393,140District wide Priority 2 drainage $3,252,290
Maintenance - Roofs $13,943,596 $5,000,000 $1,000,000 $1,000,000 $1,000,000 $1,000,000 $1,000,000PSFA participation (half) District wide Priority 1, 2 and 3 $13,943,596 $5,716,874 $1,254,924
Exhibit 3-16 Prioritization for Capital Plan Option 1 Continued
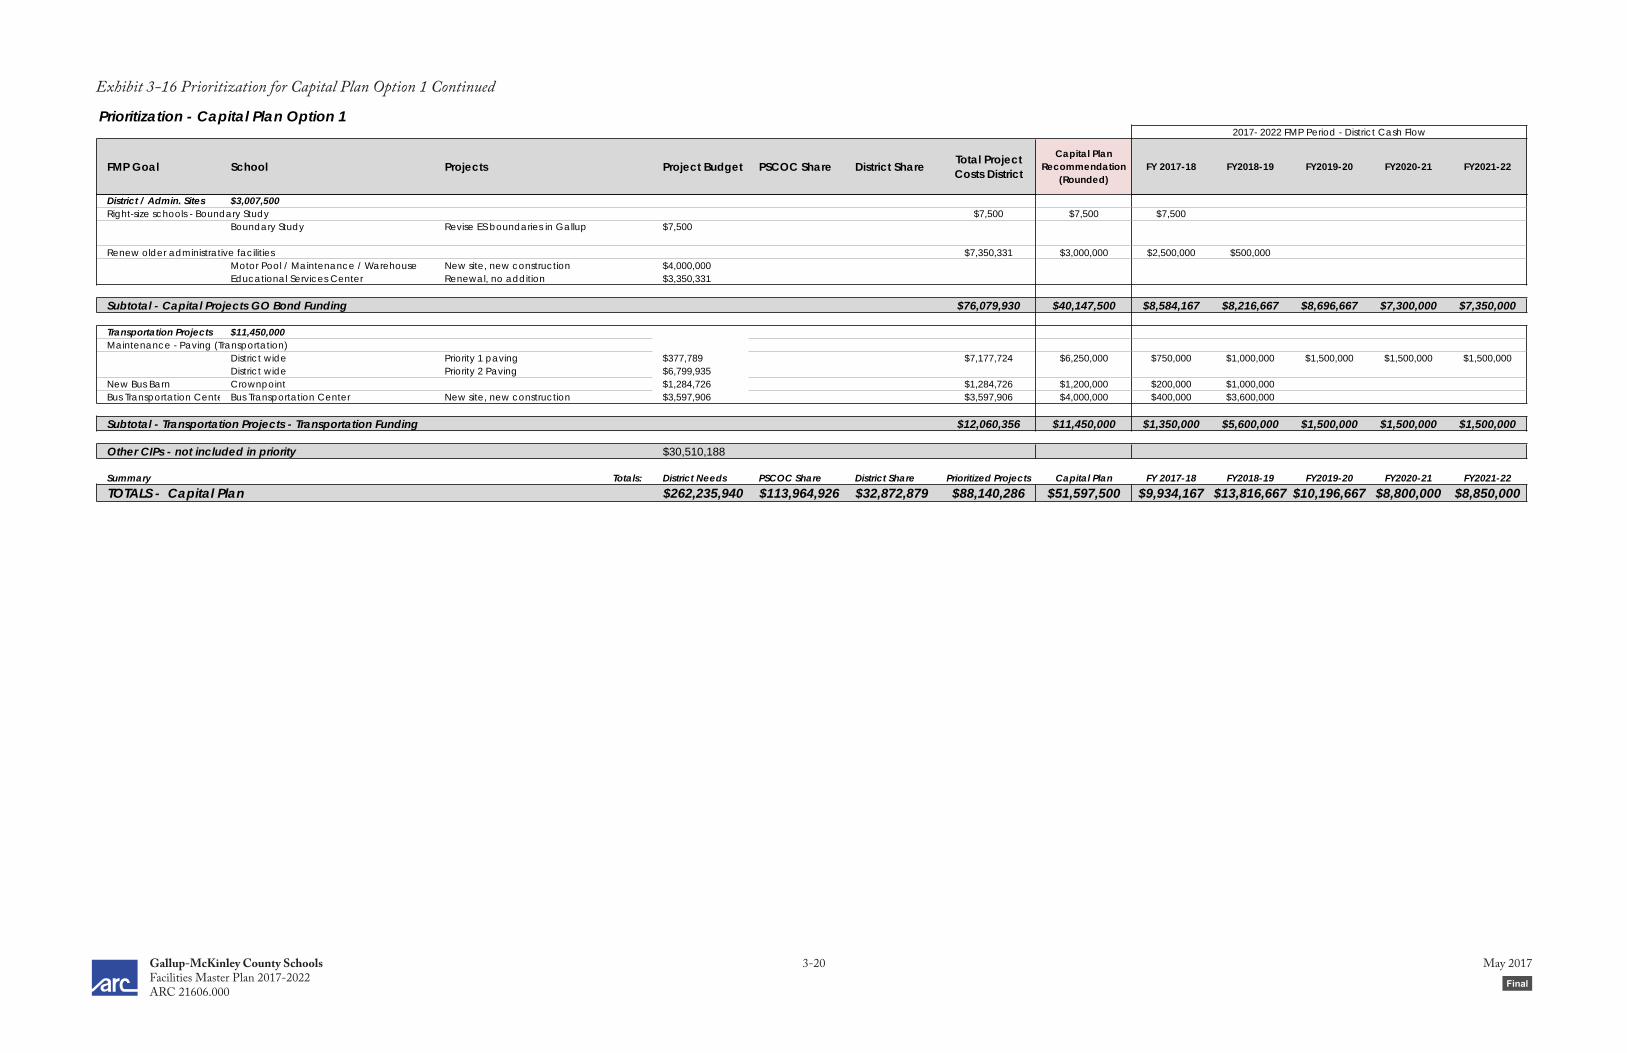
Gallup-McKinley County Schools 3-20 May 2017 Facilities Master Plan 2017-2022 Draft FinalARC 21606.000
Prioritization - Capital Plan Option 1
FMP Goal School Projects Project Budget PSCOC Share District ShareTotal Project Costs District
Capital Plan Recommendation
(Rounded) FY 2017-18 FY2018-19 FY2019-20 FY2020-21 FY2021-22
2017- 2022 FMP Period - District Cash Flow
District / Admin. Sites $3,007,500Right-size schools - Boundary Study $7,500 $7,500 $7,500
Boundary Study Revise ES boundaries in Gallup $7,500
Renew older administrative facilities $7,350,331 $3,000,000 $2,500,000 $500,000Motor Pool / Maintenance / Warehouse New site, new construction $4,000,000Educational Services Center Renewal, no addition $3,350,331
Subtotal - Capital Projects GO Bond Funding $76,079,930 $40,147,500 $8,584,167 $8,216,667 $8,696,667 $7,300,000 $7,350,000
Transportation Projects $11,450,000Maintenance - Paving (Transportation)
District wide Priority 1 paving $377,789 $7,177,724 $6,250,000 $750,000 $1,000,000 $1,500,000 $1,500,000 $1,500,000District wide Priority 2 Paving $6,799,935
New Bus Barn Crownpoint $1,284,726 $1,284,726 $1,200,000 $200,000 $1,000,000Bus Transportation Center Bus Transportation Center New site, new construction $3,597,906 $3,597,906 $4,000,000 $400,000 $3,600,000
Subtotal - Transportation Projects - Transportation Funding $12,060,356 $11,450,000 $1,350,000 $5,600,000 $1,500,000 $1,500,000 $1,500,000
Other CIPs - not included in priority $30,510,188
Summary Totals: District Needs PSCOC Share District Share Prioritized Projects Capital Plan FY 2017-18 FY2018-19 FY2019-20 FY2020-21 FY2021-22
TOTALS - Capital Plan $262,235,940 $113,964,926 $32,872,879 $88,140,286 $51,597,500 $9,934,167 $13,816,667 $10,196,667 $8,800,000 $8,850,000
Exhibit 3-16 Prioritization for Capital Plan Option 1 Continued

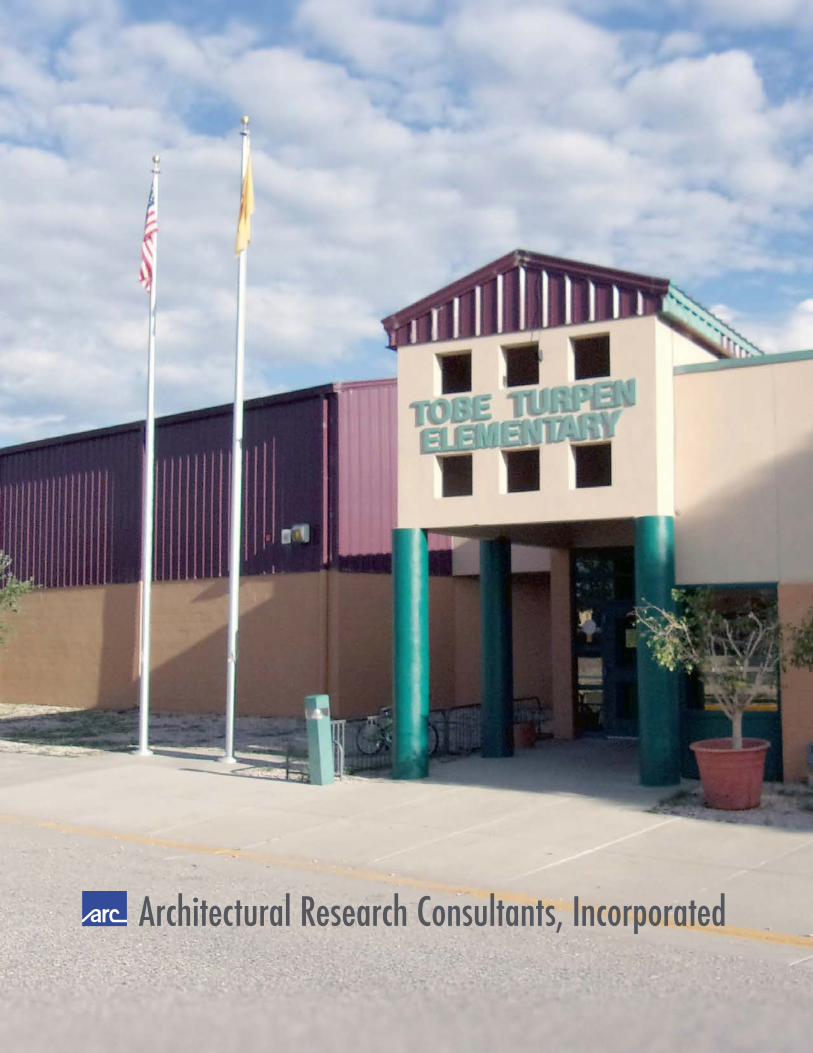
Architectural Research Consultants, Incorporated