galileo lofts: a real estate development feasibility study
TRANSCRIPT

Galileo Lofts: A Real Estate Development Feasibility Study
By
Lea J. Ledohowski Bachelors of Arts-Honours, University of Manitoba, 1996
Masters in Architecture, University of British Columbia 2002
And
James J. Perrine Bachelor of Arts cum laude, Harvard University, 1977
Submitted to the Department of Urban Studies and Planning
In partial fulfillment of the requirements for the Degree of Master of Science in Real Estate Development
at the Massachusetts Institute of Technology
September 2005
© 2005 Lea J. Ledohowski and James J. Perrine All rights reserved
The authors hereby grant to MIT the permission to reproduce and to distribute publicly electronic
copies of this thesis document in whole or in part.
Signature of Author _____________________________________________________________ Lea J. Ledohowski
Department of Urban Studies and Planning August 5th, 2005
Signature of Author _____________________________________________________________ James J. Perrine
Department of Urban Studies and Planning August 5th, 2005
Certified by ___________________________________________________________________
Brian Anthony Ciochetti Professor of the Practice of Real Estate
Thesis Supervisor
Accepted by ___________________________________________________________________ David M. Geltner
Chairman, Interdepartmental Degree Program in Real Estate Development
Galileo Lofts: A Real Estate Development Feasibility Study by
Lea J. Ledohowski and James J. Perrine Submitted to the Department of Urban Studies and Planning
on August 5, 2005, in Partial Fulfillment of the Requirements for the Degree of Master of Science in
Real Estate Development
ABSTRACT
In August 2004, a development proposal titled “Galileo Lofts at MIT: Housing and Urban Park” was submitted to the Cambridge Redevelopment Authority for the provision of new housing and a public park on Parcel 7, in Kendall Square, Cambridge, MA. This study is a feasibility analysis of the development proposal. A market analysis and a marketability study were conducted to determine the appropriateness of the proposal for the East Cambridge, Kendall Square market. Demographic analysis identified two primary submarkets: 1) Cambridge Condo Submarket (i.e. demand for the location); 2) Loft Product Submarket (i.e. demand for the product type). To analyze supply and pricing, transaction data for the sale of condominiums within a one-mile radius of the proposed site, and data for the sale of comparable loft condominiums in the Greater Boston Area, were downloaded. Tests performed include descriptive statistics, regression analysis, and attribution analysis. A capital budget was estimated and a development model created to determine the financial feasibility of the proposal. Results indicated that the demand for residential products in the East Cambridge neighborhood priced for the “entry-level buyer” (i.e. up to $550,000) was not being met by current levels of supply, and it was predicted that demand for products priced at the entry-level would continue. It was also illustrated that demand for “luxury” products does exist in East Cambridge, but that the luxury consumer has demonstrated a preference for properties with high-end amenities and water adjacency. The Feasibility Analysis concluded that the proposed project is not viable in financial terms. It was suggested that the original proposal is not ideally suited to capture the demand in either the entry-level or luxury markets. The primary observations were that the planned residential units are too large to target the entry level buyer, and that the location, lack of amenities and rental townhouses at the ground level are expected to be problematic in the pursuit of the “luxury” buyer. It was recommended that the developers reduce the unit sizes in order to satisfy the requirements of the primary target market and redistribute the affordable rental units within the building to avoid a potential problem with marketability and management. These changes, however, would not be sufficient to turn the proposed Galileo Lofts at MIT into a financially viable project because 40% of the units are required to be affordable, and these units cost $180,000 more to produce than they would generate in sales revenue. Other relief would be needed: some suggestions are given.
Thesis Supervisor: Brian Anthony Ciochetti Title: Professor of the Practice of Real Estate
2

Table of Contents
Prologue ....................................................................................................................................................... 6
Section 1: Introduction and Project Description...................................................................................... 7
1.1 Introduction ................................................................................................................................. 7
1.2 Overview of the Proposal: “Galileo Lofts at MIT: Housing and Urban Park”............................ 8
Section 2: Entitlement Process................................................................................................................. 12
2.1 Pertinent Zoning Considerations................................................................................................... 12
2.2 Entitlement Process ................................................................................................................... 13
Section 3: Regional Market Context ....................................................................................................... 17
3.1 Economy.................................................................................................................................... 17
3.2 Population.................................................................................................................................. 22
3.3 Households ................................................................................................................................ 25
3.4 Residential Real Estate Market.................................................................................................. 28
Section 4: East Cambridge Market Context........................................................................................... 41
4.1 Historic Context of Eastern Cambridge Development .............................................................. 41
4.2 Eastern Cambridge Planning Initiatives .................................................................................... 45
4.3 Kendall Square Context: Biotech, Office & MIT...................................................................... 48
3

4.4 The East Cambridge Housing Market ....................................................................................... 52
Section 5: Demand / Demographic Analysis........................................................................................... 54
5.1 City of Cambridge Housing Stock............................................................................................. 54
5.2 Demographic Trends in East Cambridge................................................................................... 59
Section 6: Supply Analysis ....................................................................................................................... 63
6.1 Geographic Submarket: East Cambridge Condominiums..................................................... 65
6.2 Geographic Submarket: Comparable Cambridge Condominium Units................................ 74
6.3 Loft Product Submarket............................................................................................................. 83
6.4 Loft Product Sub-Market: Comparable Units............................................................................ 90
6.5 Analysis of the Development Pipeline ...................................................................................... 99
6.6 The Rental Market in Kendall Square................................................................................. 112
Section 7: Marketability and Pricing of Galileo Lofts......................................................................... 113
7.1 Overview of Galileo Lofts Proposal ........................................................................................ 113
7.2 Market Segmentation.............................................................................................................. 115
7.3 Analysis and Critique: Positioning of the Galileo Lofts ..................................................... 122
7.4 Delineation of Pricing Strategy ............................................................................................... 129
7.5 Absorption................................................................................................................................... 143
4

Section 8: Financial Analysis ................................................................................................................. 148
8.1: Option 1 (the Base Case) ........................................................................................................... 148
8.2 Option 2: A Revised Scenario..................................................................................................... 160
Section 9: Conclusion and Recommendations...................................................................................... 171
Epilogue ................................................................................................................................................... 175
Bibliography ............................................................................................................................................ 176
Appendix A: Proposal -- Galileo Lofts at MIT..................................................................................... 180
Appendix B: Drawings -- Option 1........................................................................................................ 210
Appendix B: Drawings -- Option 2........................................................................................................ 217
Appendix C: Financial Projections -- Option 1.................................................................................... 224
Appendix D: Financial Projections -- Option 2.................................................................................... 237
5
PROLOGUE
The Demand for Housing Features
Range of Housing Configurations
Pote
ntia
l Pur
chas
ers
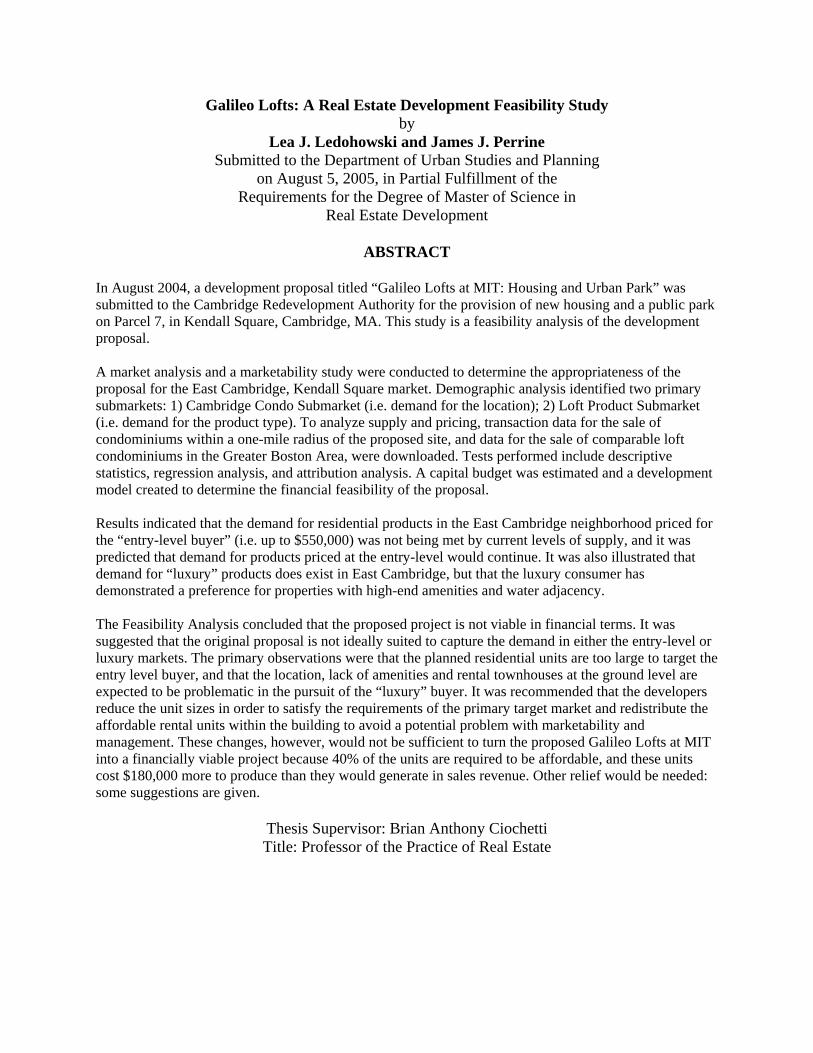
The students huddled intently around the table. Kent Larson, Director and Principal Investigator for MIT’s House_n Research Consortium, had just sketched a bell curve on a scrap of paper. You could see the passion in his eyes as he explained, “Most real estate developers can deliver housing units in just a very narrow range of configurations. Given this narrow range, they all aim for the largest number of buyers, which means building for the middle of the market, but ignore the rest. Imagine the response if developers had the flexibility in design and construction to create units at a single development that could appeal to many more people! That’s what our Open Source Building Alliance will make possible.” He continued, “Borrowing from innovations in the automobile and electronics industries, our researchers are developing concepts for creating buildings from an integrated ‘chassis’ that can be rapidly installed with minimal field labor. One integrated assembly provides structure, ductwork, power, signal, plumbing connections, mechanical attachments for infill, HVAC systems, floor finishes, and ceiling finishes. At the point of sale, demising walls are added to create the size unit required, and the buyer engages in a design process to define the interior design, systems, and services. The chassis provides the necessary physical, power, and signal connections for mass-customized infill components to be quickly installed.” In the back of his mind, Larson had been thinking that now was the time to put some of his research into practice by actually developing a building incorporating the new techniques. But where? Meanwhile, an official of a municipal agency had been wondering how to actualize his Board’s directive to create affordable housing. He had in mind a small parcel owned by the agency: it wasn’t good for much else, but it would be great for housing. A chance ride in an elevator brought the two men together. Thus began the story of the Galileo Lofts.
6

SECTION 1: INTRODUCTION AND PROJECT DESCRIPTION
1.1 Introduction
In August 2004, a development proposal titled “Galileo Lofts at MIT: Housing and Urban Park” was
submitted in response to a Request for Proposals (“RFP”) issued by the Cambridge Redevelopment
Authority (“CRA”) for the provision New Housing and a Public Park on Parcel 7 in the Kendall Square
Urban Renewal Area, East Cambridge, MA.1 The study included herein is a feasibility analysis of that
development proposal.
As the gap between the median income and single-family housing prices in the Greater Boston area
continues to widen, the demand for “affordable”2 residential space continues to grow. With accessibility
to and from downtown Boston, and favorable residential tax rates,3 the popularity of East Cambridge as a
desirable residential location has dramatically increased over the last decade. In keeping with the surge in
demand for “affordable” products, multi-unit residential development in East Cambridge has also
substantially increased in recent years, with even greater numbers of product in the pipeline. This
feasibility analysis is intended to be a formal demonstration of whether the Galileo Lofts proposal is or is
not viable. This will be accomplished by first conducting a Market Study intended to ascertain the market
characteristics (i.e. the intersection of supply and demand) in the defined location for the defined product.
1 The RFP was issued by the CRA in the summer of 2004 and a notice was published in a local business journal. The Proposal was submitted on August 27, 2004. It was authored by Kent Larson of the MIT School of Architecture and Planning, Ling Yi Liu of HomePrime and Oaktree Green, development and design-build companies, and Barbara Shaw of Just-A-Start Corporation, a non-profit community development corporation.
2 In this case, the term “affordable” is meant to illustrate a consumer’s purchasing power, and is not a reference to “affordable housing” as defined by the City of Cambridge.
3 The current (fiscal year 2005) residential tax rate in Cambridge is roughly 2/3s that of Boston, with a residential exemption that is approximately 1/3 greater than Boston’s.
7

Second, the project’s capital budget and development pro forma financial analysis will be prepared and
analyzed in order to determine the financial feasibility of the proposal.
1.2 Overview of the Proposal: “Galileo Lofts at MIT: Housing and Urban
Map 1: Ga
Park”
lileo Lofts Proposed Site: Parcel 7 Kendall Square Redevelopment Plan
quare feet in size with
n
THE SITE
The proposal is to provide a nine-story residential development, roughly 75,000 s
underground parking and a public urban park, on Parcel 7 of the Kendall Square Urban Renewal Area.
The site is located on the corner of Binney Street and Galileo Galilei Way (formerly Fulkerson Street), i
Kendall Square. The project is intended to be situated at the northern most limits of the site, relating to the
massing and orientation of the Genzyme Building along Binney Street.
At the time of writing, the site is vacant land with some at-grade parking. The site is relatively isolated,
with railroad tracks creating the west boundary and the busy Galileo Galilei Way constituting the eastern
8

edge. It is a high traffic area, and at the present time is predominantly surrounded by large-scale R&D
pace
buildings.4 The parcel was once home to a small children’s play area (i.e. a “tot lot”) which was
underutilized and closed. The community organization has voiced a strong preference for the site to house
a “park” component. In keeping with this desire, the proposal outlines the provisions of a “Master Plan”
for a park on the site. It should be made clear that the proposal involves the provision of a green s
only as it relates to the housing component (basic landscaping) and the planning for the development of a
larger urban park encompassing the remainder of the sight, and potentially Parcel 5 to the south, but not
the actual construction of the park. The orientation of the proposed building on the site enables southern
exposure, and the narrow site dimension makes it probable that the rest of the site will not be built up.
THE BUILDING
The building proposal (hereafter referred to as “Option 1”) outlined a 44 unit development with a mix of
12 affordable rental townhouses on the ground floor, 6 inclusionary condominiums and 26 market rate
a total of 41% of the units being affordable. The 12 townhouse units designed for the
is a
condominiums, for
ground floor were intended to be sold as one condominium and operated as rental units for families of low
income. The townhouses are designed to be two-story units with individual street access onto Binney
Street. An estimated 50% (or more) of the affordable units were intended to have 3 bedrooms. The
remaining condominium units range in size from 1,485 sq. ft. to 2,310 sq. ft. There are two floor layouts
which alternate between odd and even floors, with units located along a single-loaded corridor. There
public common room on the roof level with amenity space and roof terrace. The units are based on a
4 The neighborhood is in transition, and is currently evolving from what is largely a commercial area into one with a significant residential component. The development of rental loft units at 321 Binney Street, across the street from the project site, and developed by Lyme Properties was the first in a series of residential developments in the pipeline for the area. The evolving residential nature of the site is demonstrated at length in Section 6 of this document.
9

module of 10’0” high, 13’9” wide and 42’0” deep.5 The proposal does not include any other amenity
spaces or facilities.
The Proposal specifies concrete spread footing
foundations that would limit disruption to
existing underground telephone services. The
dding
pe
h will enable the buy
that the Open Source Buildin ment,
for the purposes of this feasibility analysis, it is assumed
building superstructure is specified to be
structural steel framework. The exterior cla
is to be of curtain wall type. The units are
intended to be based on a building prototy
currently in development by the House_n
Research Consortium and Open Source Building
er to customize the interior
g typology is in the early stages of develop
that the project would be delivered by
conventional construction techniques. As outlined in the proposal, it is assumed that the units will be
delivered complete with demising walls, wet facilities (bathrooms, and kitchens) and interior finishes.
Alliance at MIT’s Department of Architecture, whic
layout of their suite.6 Given
Type No Units Unit SF Total SFOption 1: Original Scheme, Single Loaded CorridorLive/Work 11 1,155.0 12,705 Live/Work 1 1,055.0 1,055 Condo 8 1,732.5 13,860 Condo 8 1,485.0 11,880 Condo 8 2,310.0 18,480 Condo 8 1,620.0 12,960 Penthouse spaces 2 810.0 1,620 Penthouse spaces 1 1,155.0 1,155 CorridorsLobbyTotal 47 73,715 less Common Area (3) (2,775) Net Units 44 70,940
Table 1: Unit Mix, Option 1
5 The module was derived from the dimension of 27’6” that would best fit 3 cars across between columns, with a double loaded drive isle.
6 Led by Kent Larson at the MIT School of Architecture and Planning, the House_n Research Group and the affiliated Open Source Building Alliance are developing a new residential prototype wherein multi-unit products are delivered in an unfinished shell condition that serves as the building “chassis”; the interior of the units would then be designed by the buyer with the aid of a computer program that will allow one to customize his or her suite according to a series of options (similar to the way in which one can order a Dell computer or customize a car). Market research suggests that a significant proportion of consumers would like to customize their condominium; however, to date there has been no research done to quantify the premium consumers would be willing to pay for the option.
10

PARKING
The proposal outlines provisions for one level of underground parking that would accommodate 37 ca
The parking is to be accessed from Binney Street, and is only 5’ below grade (accordingly, the
rs.
townhouses are about 4’ above street level). The City of Cambridge Zoning Ordinance requires that one
lling unit be provided.7
t provide
adequate parking for 44 units, and it is reasonable to presume there would be community opposition
voiced against surface parking.8 There are existing telephone cables that run through the site, which make
multiple levels of underground parking problematic. If the proposal is to be approved by the City, it will
Further analysis and recommendations regarding the provision of adequate parking are addressed in later
sections of the feasibility analysis.
stall per dwe
Parking provisions for this proposal require careful consideration. The Option 1 design does no
have to more effectively address the need for adequate parking. (See Appendix B: Option 1 Drawings).
7 City of Cambridge zoning often allows a ratio of 0.7:1 parking stalls per dwelling unit for the affordable component of the development. Because parcel 7 is currently undergoing zoning revisions, it is not possible to make an affirmative statement regarding this provision, but it should be confirmed once zoning is in place.
8 The neighborhood association of East Cambridge has consistently voiced opposition to surface parking lots as well as visible structured above ground parking. Current zoning reflects this attitude and strongly encourages underground parking for all new development.
11

SECTION 2: ENTITLEMENT PROCESS
2.1 Pertinent Zoning Considerations
Parcel 7 is currently zoned Cambridge Center Mixed Use Development (MXD) and is zoned in
conjunction with the remaining parcels of the Kendall Square Urban Renewal Area. As part of the MXD
area, parcel 7 is subject to an aggregate district cap for gross floor area of 2,773,000 square feet for non-
residential uses and an additional 200,000 square feet for residential uses (exclusive of parking).9 This
total of 2,973,000 has either been built, permitted for building or contractually committed by the CRA for
other sites in the district. The Cambridge Redevelopment Authority is in the process of seeking a zoning
amendment which would enable an additional 75,000 gross square feet of residential development.
The provisions of the MXD zoning district also require a minimum of 100,000 square feet of permanent
public open space in the district. Given the open space already developed or proposed for the district, the
amount of open space will considerably exceed the required minimum. This development proposes that a
minimum of 15,000 square feet, or approximately 33% of the site, be permanently designated as public
open space.
Category MXD Zoning Galileo Lofts Proposal
Permitted Use: Mixed Use including Residential Residential
Height: 250’ 0” Max Height 90’0” Height
FAR: Max FAR = 8.0 1.5 FAR (Site 49,500SF)
Parking: 1 Stall per 1 Residential Unit 37 Stalls for 44 Units
9 Galileo Lofts Proposal, p. 21.
12

2.2 Entitlement Process
The Cambridge Redevelopment Authority started the process by issuing its RFP in the summer of 2004,
receiving proposals in August. It voted on October 20, 2004 to amend the Urban Renewal Plan to allow
an additional 75,000 sq. ft. of residential space to be constructed within the Urban Renewal Area, which
was intended to be on Parcel 7. It sought and obtained a ruling on March 1, 2005 from the
Commonwealth of Massachusetts Department of Housing and Community Development (“DHCD”) that
the “proposed amendment changes to section 402(a) of the plan to allow for an additional 75,000 sq. ft. of
multi-family residential use in the urban renewal area” constituted a “Minor Plan Change.10” The
Authority also sought a determination from the Commonwealth’s Executive Office of Environmental
Affairs that the Amendment “is insignificant in terms of its environmental impact” (including traffic
issues) and that additional environmental review is not required under the Massachusetts Environmental
Policy Act.11 The CRA tentatively designated the team of HomePrime Corporation and Oaktree
Development (with Just-A-Start Corporation as purchaser of the affordable rental units) as the developers
for the parcel.
10 Letter from Commonwealth of Massachusetts Department of Community Development, to: Ms. Jacqueline S. Sullivan, Chair of Cambridge Redevelopment Authority, Regarding: Kendall Square Urban Renewal Plan Amendment #7 – Approved, March 1, 2005. The letter confirmed that the documentation submitted in support of the amendment satisfies the requirements of the Departments regulations under 760 CMR 12.03 “Plan Changes”.
11 Letter from Douglas M. McGarrah of Foley Hoag, LLP, counsel to the CRA, to James Hunt, Assistant Secretary and MEPA Director, Commonwealth of Massachusetts Executive Office of Environmental Affairs, dated January 31, 2005.
13

The CRA introduced the necessary petition for a zoning amendment to City Hall. The City Manager
submitted it to the City Council, which appropriately referred it to its Committee on Ordinances and to
the Planning Board. The CRA set up the necessary community meeting with the East Cambridge
Planning Team, the local neighborhood organization. In a reversal of the usual procedure, the Committee
on Ordinances held its hearing in early July, before the community meeting was held. Unexpectedly, the
amendment met with considerable public opposition from community members who did not want to see
the parcel developed as anything other than green space. The community had little interest in the creation
of housing, or specifically of affordable housing. The City Councilors present at the hearing echoed these
concerns. (Nonetheless, the Committee did vote to pass the amendment along to the full City Council for
the final two votes). Results were no better at the community meeting on July 13, where virtually every
resident present opposed the plan.
It appears that the CRA and the developers misjudged the level of community interest and opposition.
They did not undertake enough informal contacts with city councilors and community leaders ahead of
the public meetings, to try to promote the proposal, gauge the level of potential support for the proposal
and determine what the issues were apt to be (so they could make changes to address them). The public
presentations by the CRA and developers did not seem to put enough emphasis on how this project would
benefit the community by enabling the creation of significant park space comprising over a third of the
site. In fact, based on the placement of the building on the site, the developers could have doubled the
proposed parkland to 35,000 sq. ft., or 70% of the site, with no effect on the project.
The Planning Board is set to hold a public hearing on the proposal on August 16, 2005. The Planning
Board has traditionally been heavily in favor of developing housing with significant affordable
components, and thus might be expected to give the project a better reception. Even if the Planning Board
endorses the zoning change, however, it is difficult to foresee the City Council approving it after such
community opposition and statements of opposition from many of the Councilors themselves. If the
Councilors had had a different response to the proposal, the normal procedure would be for the Council to
14

approve the zoning amendment, and approve a curb cut at the time of the final vote. The zoning
amendment would then need to be submitted to DHCD for a final imprimatur.
At the time of writing, it is not certain whether the developers will be able to continue to pursue the
development of Galileo Lofts on Parcel 7. Other sites within the Kendall Square Redevelopment Area
have been cited as possibilities, but no formal agreements have been made. However, it is the opinion of
these authors that the proposal discussed herein is not specifically grounded on the proposed site, but
would work as well on other nearby sites in the Kendall Square Urban Renewal Area. For this reason the
feasibility analysis included herein is applicable to both the current proposed site, and other sites under
consideration within the Urban Renewal Area.
15

Map 2: Metropolitan Boston: The Boston-Cambridge-Quincy, MA-NH Metropolitan NECTA
Source: Cartographic Products Management Branch, U.S. Census Bureau.
16

SECTION 3: REGIONAL MARKET CONTEXT
Cambridge is located across the Charles River from Boston, the core city of the Boston metropolitan area.
Boston itself, with a population of 589,000, is not among the very largest cities (it ranks twentieth in the
U.S.), but the Boston metropolitan area, with a population of 4,540,000 (2000), is the tenth largest in the
United States.12 It consists of over 100 cities and towns in a radius of approximately 30 miles13. The
metropolitan area contains well over half the population and generates over half the personal income of
the Commonwealth of Massachusetts.
3.1 Economy
Greater Boston, with its diverse economic base, is widely recognized as a vibrant center of innovation and
as the economic engine of New England. The region is home to scores of institutions of higher
education,14 which have spawned many scientific and technical centers of research and development.
Most of the region’s key industry clusters—healthcare, financial services, information technology,
business and professional services, and tourism and hospitality—are knowledge-intensive.15 As a result,
12Population figures for the City of Boston and the Boston-Cambridge-Quincy, MA-NH Metropolitan NECTA. U.S. Department of Commerce, Census Bureau, Population Division. Census 2000 Summary File 1 (SF 1).
13 U.S. Department of Commerce, Census Bureau, Cartographic Products Management Branch. “New England City and Town Areas, December 2003.” April 13, 2005. <http://www.census.gov/geo/www/maps/msa_map2003/main_necta_2003.htm>. July 10, 2005.
14 The website of the New England Association of Schools and Colleges lists 65 accredited institutions of post-secondary education in the metropolitan area. <http://www.neasc.org/roster/pssma.htm>.
15 The Boston Foundation. “Economy Overview,” Boston Indicators Report 2002. <http://www.tbf.org/indicators/economy/overview.asp?id=240>; U.S. Department of Commerce, Bureau of Economic Analysis.
17

Massachusetts has the highest number of patents per capita (a key measure of innovation) among the
leading technology states.16 As the home of the Massachusetts Institute of Technology and Harvard
University, Cambridge is at the center of the area’s innovation economy.
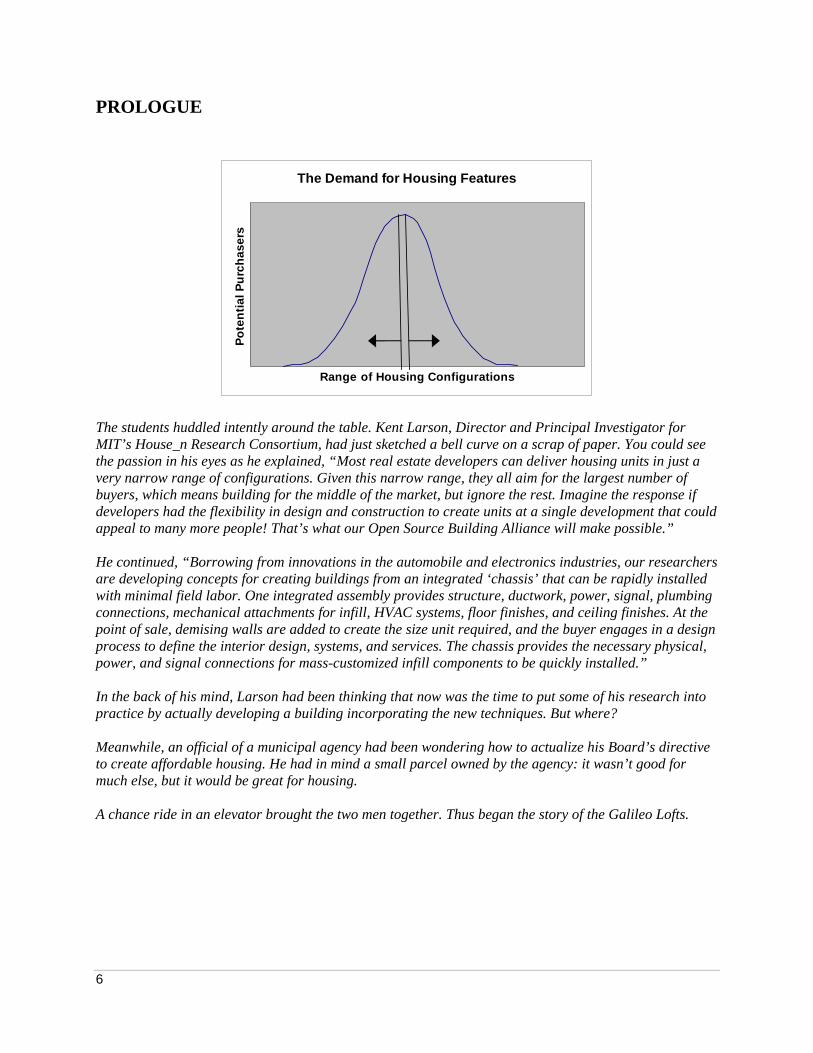
Greater Boston had one of the strongest regional economies in the country when it reached a peak in early
2001. All major sectors were on the upswing. Unemployment was low (2% in October and November,
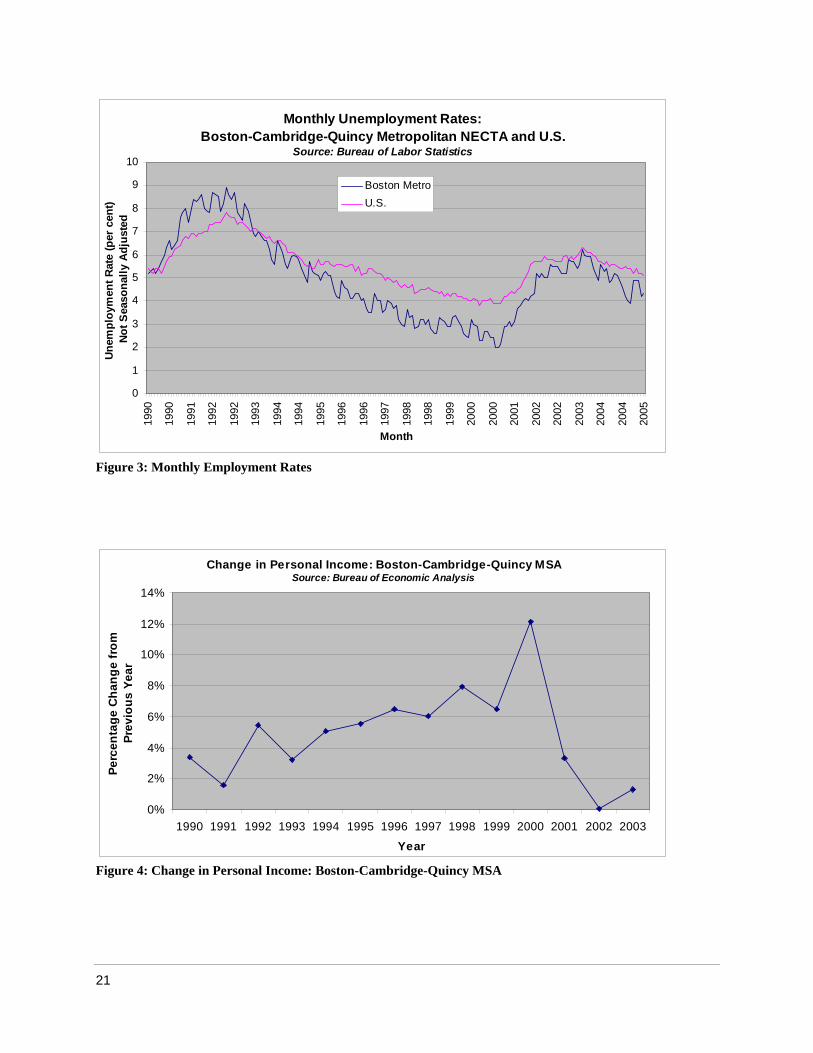
2000) and had been consistently lower than the national unemployment rate since 1993.17 Personal
income was rising rapidly (at an exceptional annual rate of 12.1% in 2000).18 The real estate market was
exceptionally strong; commercial real estate vacancies were historically low (2% in 2000 and 4% in
2001);19 and newer industries such as biotechnology were showing enormous promise. Construction was
also booming, as a result of extensive real estate development and the Central Artery Tunnel project (the
“Big Dig”).
Following the collapse of the high tech “bubble” and the severe decline in the stock market that ensued,
the nation entered a recession. It hit Boston particularly hard. By 2002 several key sectors of Boston’s
economy, particularly information technology, financial and business services, had experienced
16 Massachusetts Technology Collaborative. 2004 Index of the Massachusetts Innovation Economy. Westborough, MA: November 23, 2004. <http://www.mtpc.org/institute/the_index/index_11_23_04final.pdf>. July 5, 2005.
17 U.S. Department of Labor, Bureau of Labor Statistics. “Unemployment Rate, Boston-Cambridge-Quincy Metropolitan NECTA,” Data Series LAUMT25716503, LAUMT25716504, LAUMT25716505, LAUMT25716506. < >. July 6, 2005. http://data.bls.gov/PDQ/outside.jsp?survey=la
18 U.S. Department of Commerce, Bureau of Economic Analysis. “CA1-3 Personal Income, Metropolitan and Micropolitan Statistical Areas.” April, 2005. < >. http://www.bea.doc.gov/bea/regional/reis/drill.cfm
19 The Boston Foundation. Op. cit.
18

significant job losses. For the past several years the Boston market has suffered from considerable
consolidation and restructuring in the above-cited industries, and most recently with Proctor & Gamble’s
acquisition of Gillette. Economic activity in the state fell by 4.8% between the peak in January, 2001 and
the trough in April, 2003, as measured by the Philadelphia Fed’s Index of Economic Activity.20 It has
only recently returned to pre-recession levels.
Index of Economic Activity: Massachusetts
(July, 2000 = 100)Source: Federal Reserve Bank of Philadelphia
60
80
100
120
140
160
180
Jan-
79
Jan-
81
Jan-
83
Jan-
85
Jan-
87
Jan-
89
Jan-
91
Jan-
93
Jan-
95
Jan-
97
Jan-
99
Jan-
01
Jan-
03
Jan-
05
Date
Inde
x V
alue
Figure 1: Index of Economic Activity: Massachusetts
During the recession, total (seasonally-adjusted) employment in metropolitan Boston plunged by 7.1%,
representing the loss of 183,000 jobs.21 After its historic low in 2000, the unemployment rate tripled to
20 Federal Reserve Bank of Philadelphia. “Economic Activity Index: Massachusetts.” < 28, 2005http://www.phil.frb.org/econ/stateindexes/index.html>. June .
21 U.S. Department of Labor, Bureau of Labor Statistics. “Total Nonagricultural Employment, Massachusetts Metropolitan NECTAs.” Data Series LAUMT25716503, LAUMT25716504, LAUMT25716505, LAUMT25716506. <http://data.bls.gov/PDQ/outside.jsp?survey=la>. June 28, 2005.
19

6.2% by June, 2003.22 The rate of increase in personal income fell to near zero in 2002.23 These
indicators started to improve toward the end of the recession in 2003, but have not yet reached their pre-
recession peaks. Regional unemployment was down to 4.3% as of May, 2005 (below the national rate of
5.1%), but total employment had barely started to increase (32,000 jobs regained since the bottom).
Statewide, personal income started increasing at a healthy pace (6% annually and trending upward by
2004, compared with an average of 7.3% in the four years prior to the pre-recession peak.24
N on-Agricultural Employment:
B oston-C ambridge-Quincy N EC TASource: U.S . Bureau of Labor S tatistics
2000
2200
2400
2600
Jan-
90
Jan-
91
Jan-
92
Jan-
93
Jan-
94
Jan-
95
Jan-
96
Jan-
97
Jan-
98
Jan-
99
Jan-
00
Jan-
01
Jan-
02
Jan-
03
Jan-
04
Jan-
05M onth
Empl
oym
ent (
thou
sand
s)
Figure 2: Non-Agricultural Employment
22 U.S. Department of Labor, Bureau of Labor Statistics. “Unemployment Rate, Boston-Cambridge-Quincy Metropolitan NECTA,” op. cit.
23 U.S. Department of Commerce, Bureau of Economic Analysis. Op. cit.
24 Personal income for metropolitan areas is available only through 2003, so we use state figures for this part of the analysis. U.S. Department of Commerce, Bureau of Economic Analysis. “SQ4 State Quarterly Personal Income Tables.” June 22, 2005. <http://www.bea.doc.gov/bea/regional/sqpi/sqpi_download.csv?table_id=259877>.
20
Monthly Unemployment Rates:
Boston-Cambridge-Quincy Metropolitan NECTA and U.S.Source: Bureau of Labor Statistics
0
1
2
3
4
5
6
7
8
9
1019
90
1990
1991
1992
1992
1993
1994
1994
1995
1996
1996
1997
1998
1998
1999
2000
2000
2001
2002
2002
2003
2004
2004
2005
Month
Unem
ploy
men
t Rat
e (p
er c
ent)
Not S
easo
nally
Adj
uste
d
Boston MetroU.S.
Figure 3: Monthly Employment Rates
igure 4: Change in Personal Income: Boston-Cambridge-Quincy MSA
Change in Personal Income: Boston-Cambridge-Quincy MSA
Source: Bureau of Economic Analysis
0%
2%
4%
6%
8%
10%
12%
14%
1990 1991 1992 1993 1994 1995 1996 1997 1998 1999 2000 2001 2002 2003
Year
Perc
enta
ge C
hang
e fr
om
Prev
ious
Yea
r
F
21

Figure 5: Total Personal Income: Massachusetts
3.2 Population
creasing during the 1990s, but spiked up in 2000 as
a in response to the growth in available jobs.25 The recession-era reduction in
tes
Metropolitan area population had been slowly in
people moved to the are
employment ended this brief population spurt, however, as people instead started moving to other sta
in search of work and a lower cost of living. The impact was more dramatic in Boston and Cambridge,
Total Personal Income: Massachusetts
Source: Bureau of Economic Analysis
120
140
160
180
200
220
240
260
280
300M
ar-9
0
Mar
-91
Mar
-92
Mar
-93
Mar
-94
Mar
-95
Mar
-96
Mar
-97
Mar
-98
Mar
-99
Mar
-00
Mar
-01
Mar
-02
Mar
-03
Mar
-04
Mar
-05
Quarter
$ (m
illio
ns)
25 U.S. Department of Commerce, Census Bureau, Population Division. ‘‘Ranking Tables for Population of Metropolitan Statistical Areas, Micropolitan Statistical Areas, Combined Statistical Areas, New England City and Town Areas, and Combined New England City and Town Areas: 1990 and 2000 (Areas defined by the Office of Management and Budget as of June 6, 2003.) (PHC-T-29).’’ December 30, 2003. http://www.census.gov/population/www/cen2000/phc-t29.html; and unpublished data; U.S. Department of Commerce, Census Bureau, Population Division, Population Estimates Program. “(MA-99-9b) Population Estimates for New England County Metropolitan Areas (NECMAs) and Components, Annual Time Series April 1, 1990 to July 1, 1999 (includes April 1, 1990 Population Estimates Base).” October 20, 2000. Data interpolated by the authors to yield consistent time of year (April 1).
22

which had been slowly losing population until the spike in 2000. They have been losing population sinc
then (see Figure 6).
e
igure 6: Annual Change in Population: Metropolitan Boston
Annual Change in Population: Metropolitan BostonSource: U.S. Census Bureau
-4%
-3%
-2%
-1%
0%
1%
2%
3%
4%
5%
6%
1990 1991 1992 1993 1994 1995 1996 1997 1998 1999 2000 2001 2002 2003
Year
Perc
enta
ge C
hang
e in
Pop
ulat
ion
from
Pr
evio
us Y
ear
F
Figure 7: Rate of Change in Population: Boston & Cambridge
Rate of Change in Population: Boston and CambridgeSource: U.S. Census Bureau
-4%
-2%
0%
2%
4%
6%
8%
10%
1990
1991
1992
1993
1994
1995
1996
1997
1998
1999
2000
2001
2002
2003
2004
Year
Perc
enta
ge C
hang
e in
Pop
ulat
ion
from
Pr
evio
us Y
ear
Boston
Cambridge
23

The changes in the preceding figures explain how the unemployment rate could be declining with very
little improvement in total employment: people were leaving the area.26 Figure 8 presents the nature of
migration into and out of Massachusetts. Immigration from abroad has been a constant in the recent years.
Net inter-state out-migration fluctuates with the relative strength of the economy and the cost of living.
y the
Massachusetts Legislature, projected future population for the 101 communities in its membership area,
which encompasses approximately two-thirds of the Boston-Cambridge-Quincy Metropolitan NECTA.
Table 1 shows MAPC’s population projections for 2005 through 2025. 27
Figure 8: International and Inter-State Migration
The Metropolitan Area Planning Council (MAPC), a regional planning organization created b
International and Inter-State Migration: MassachusettsSource: U.S. Census Bureau
-60000
-50000
-40000
-30000
-20000
-10000
0
10000
20000
30000
40000
2000 2001 2002 2003 2004
Year
Num
ber o
f Peo
ple
DomesticInternational
26 U.S. Department of Commerce, Census Bureau, Population Division, Population Estimates Program. “Estimates of Population, Population Change and Estimated Components of Population Change: April 1, 2000 to July 1, 2004 (NST-EST2004-ALLDATA.csv).”
27 Metropolitan Area Planning Council. Community Population Forecasts, 2005-2025. Boston: March 17, 2003.
24
City of BostonMetropolitan Boston
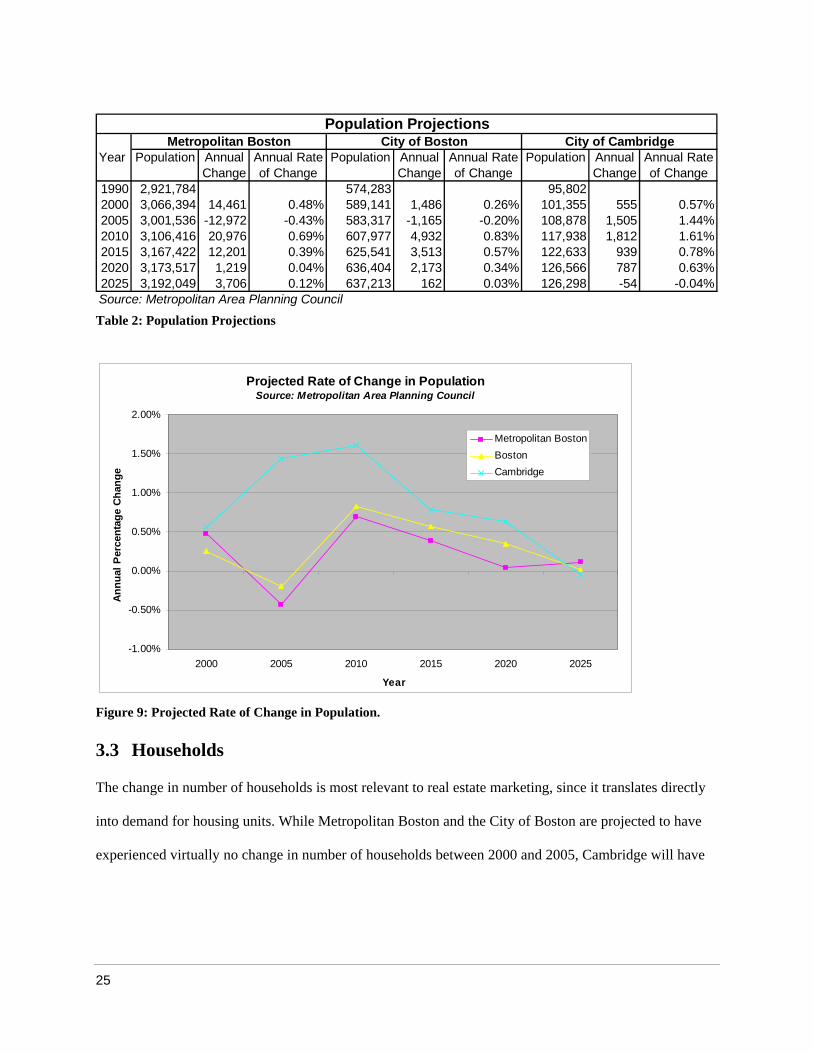
igure 9: Projected Rate of Change in Population.
.3 Households
he change in number of households is most relevant to real estate marketing, since it translates directly
into demand for housing units. While Metropolitan Boston and the City of Boston are projected to have
experienced virtually no change in number of households between 2000 and 2005, Cambridge will have
Year Population Annual Annual Rate Population Annual Annual Rate Population Annual Annual RateChange of Change Change of Change Change of Change
1990 2,921,784 574,283 95,8022000 3,066,394 14,461 0.48% 589,141 1,486 0.26% 101,355 555 0.57%2005 3,001,536 -12,972 -0.43% 583,317 -1,165 -0.20% 108,878 1,505 1.44%
3,106,416 20,976 0.69% 607,977 4,932 0.83% 117,938 1,812 1.61%3,167,422 12,201 0.39% 625,541 3,513 0.57% 122,633 939 0.78%
2020 3,173,517 1,219 0.04% 636,404 2,173 0.34% 126,566 787 0.63%3,192,049 3,706 0.12% 637,213 162 0.03% 126,298 -54 -0.04%
Source: Metropolitan Area Planning Council
City of CambridgePopulation Projections
20102015
2025
Table 2: Population Projections
Projected Rate of Change in PopulationSource: Metropolitan Area Planning Council
-1.00%
-0.50%
0.00%
0.50%
1.00%
2.00%
2000 2005 2010 2015 2020 2025
Year
Ann
ual P
erce
ntag
e C
hang
e
Metropolitan Boston1.50% Boston
Cambridge
F
3
T
25
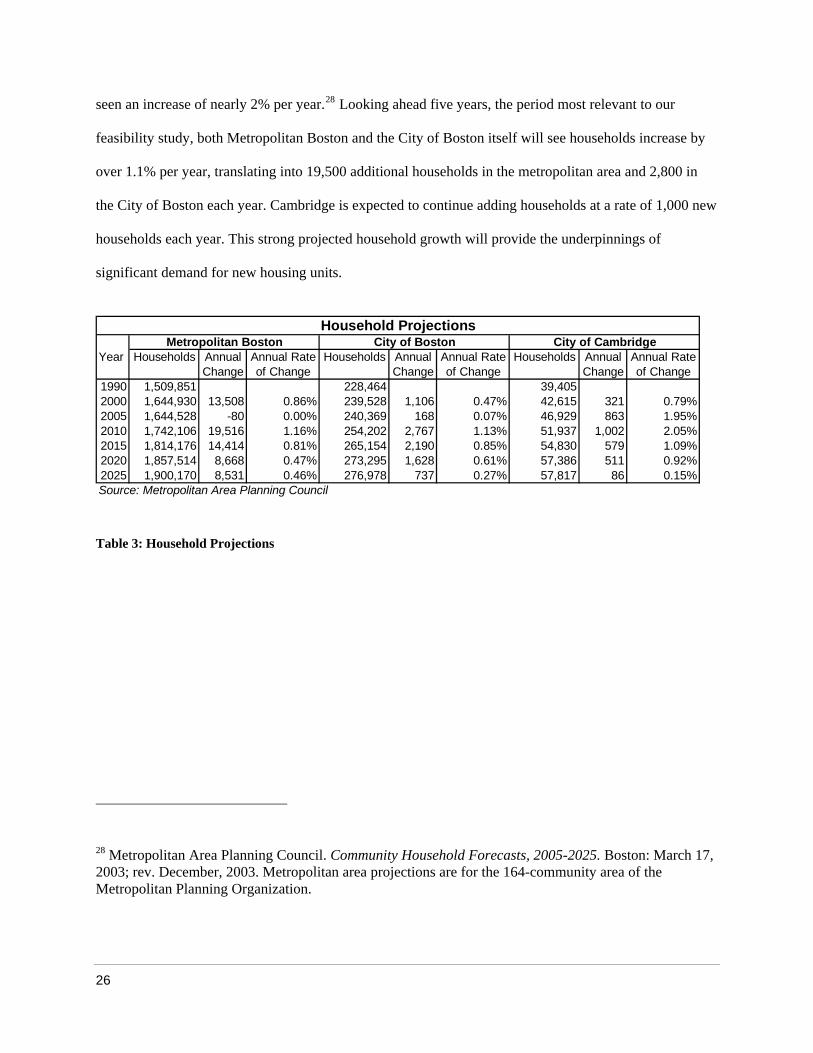
seen an increase of nearly 2% per year.28 Looking ahead five years, the period most relevant to our
e City of Boston itself will see households increase by
lating into 19,500 additional households in the metropolitan area and 2,800 in
2010 1,742,106 19,516 1.16% 254,202 2,767 1.13% 51,937 1,002 2.05%.09%.92%
978 737 0.27% 57,817 86 0.15%
o
feasibility study, both Metropolitan Boston and th
over 1.1% per year, trans
the City of Boston each year. Cambridge is expected to continue adding households at a rate of 1,000 new
households each year. This strong projected household growth will provide the underpinnings of
significant demand for new housing units.
Year Households Annual Annual Rate Households Annual Annual Rate Households Annual Annual RateChange of Change Change of Change Change of Change
1990 1,509,851 228,464 39,405
2005 1,644,528 -80 0.00% 240,369 168 0.07% 46,929 863 1.95%
2015 1,814,176 14,414 0.81% 265,154 2,190 0.85% 54,830 579 12020 1,857,514 8,668 0.47% 273,295 1,628 0.61% 57,386 511 02025 1,900,170 8,531 0.46% 276,Source: Metropolitan Area Planning Council
Metropolitan Boston City of Boston City of CambridgeH usehold Projections
2000 1,644,930 13,508 0.86% 239,528 1,106 0.47% 42,615 321 0.79%
Table 3: Household Projections
28 Metropolitan Area Planning Council. Community Household Forecasts, 2005-2025. Boston: March 17, 2003; rev. December, 2003. Metropolitan area projections are for the 164-community area of the Metropolitan Planning Organization.
26
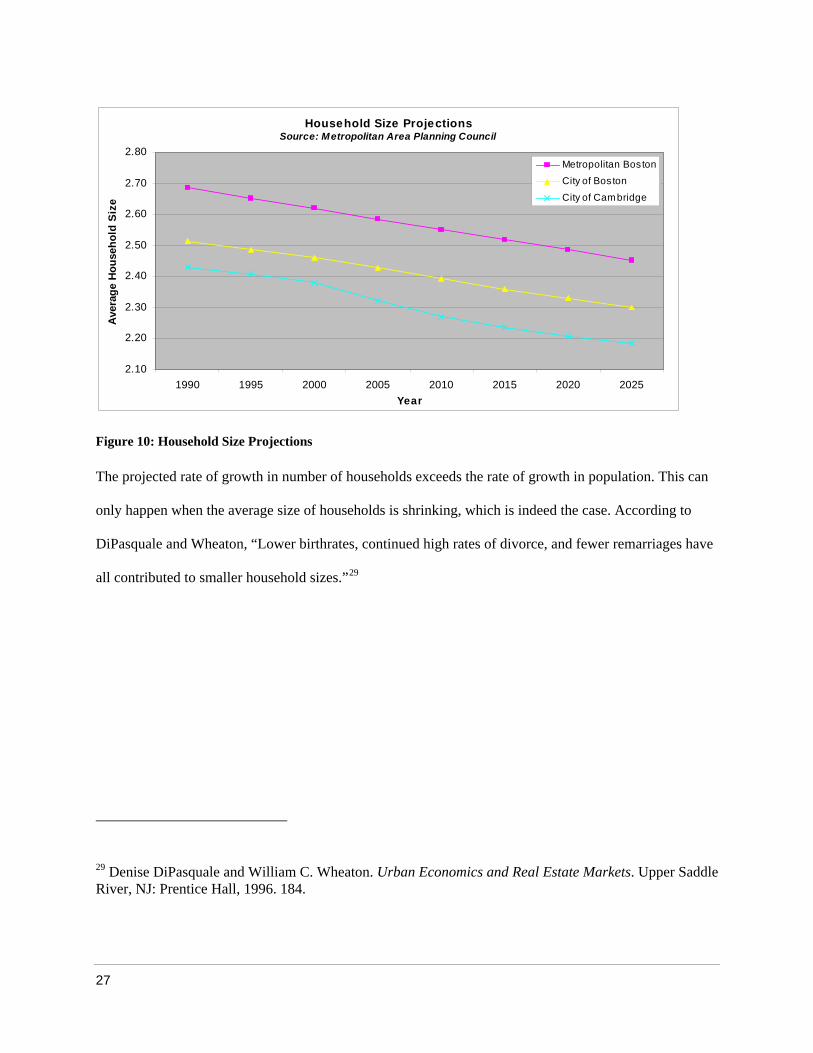
igure 10: Household Size Projections
The projected rate of growth in number of households exceeds the rate of growth in population. This can
only happen when the average size of households is shrinking, which is indeed the case. According to
iPasquale and Wheaton, “Lower birthrates, continued high rates of divorce, and fewer remarriages have
ll contributed to smaller household sizes.”29
Household Size ProjectionsSource: Metropolitan Area Planning Council
2.10
2.20
2.30
2.40
2.50
2.60
2.70
2.80
1990 1995 2000 2005 2010 2015 2020 2025Year
Aver
age
Hou
seho
ld S
ize
Metropolitan BostonCity of Boston
City of Cambridge
F
D
a
29 Denise DiPasquale and William C. Wheaton. Urban Economics and Real Estate Markets. Upper Saddle River, NJ: Prentice Hall, 1996. 184.
27

Residential Real Estate Market
ALE PRICES AND VOLUME
Figure 11: Rate of Change in Number of Households
Rate of Change in NSource: Metropoli an
umber of Householdst Area Planning Council
-0.50%
0.00%
0.50%
1.00%
1.50%
2.00%
2.50%
2000 2005 2010 2015 2020 2025Year
Perc
enta
ge R
ate
of C
hang
e
Metropolitan BostonCity of BostonCity of Cambridge
3.4
S
he residential real estate market did not follow the recessionary trends of the general regional economy.
ome prices and sales volume kept increasing throughout this period, which in fact helped sustain the
conomy. On a statewide basis, median prices have increased every year since 1993.30 The average
nnual increase in the median price over the past five years has been an astonishing 11.6%. Sales volume
0 and 2001 after attaining a record in 1999, but started
recovering ahead of some of the other economic indicators in 2002.
T
H
e
a
(i.e., number of units sold annually) declined in 200
30 Statewide figures from National Association of Realtors. “Statistical Review of Massachusetts Single-Family Housing Market (Detached Single-Family Homes and Condominiums)” Chicago: NAR, 2005. http://www.marealtor.com/content/AssetMgmt/Documents/Member%20Resources/Research/ResidentialMarketOverview.pdf.
28

Figure 12: Median Sales Price
Figure 13: Sales Volume
Sales Volume:Massachusetts Single Family Homes and Condominiums
Source: National Association of Realtors
0
10,000
20,000
30,000
40,000
50,000
60,000
70,000
80,000
1968
1970
1972
1974
1976
1978
1980
1982
1984
1986
1988
1990
1992
1994
1996
1998
2000
2002
2004
Year
Num
ber o
f Sal
es
Median Sale Price:le Family Homes and Condominiums
Source: National Association of Realtors
$0
$100,000
$250,000
$400,000
1968
1970
1972
1974
1976
1978
1980
1982
1984
1986
1988
1990
1992
1994
1996
1998
2000
2002
2004
Year
P$)
Massachusetts Sing
$50,000
$150,000
$200,000
$300,000
$350,000
$450,000
rice
(
29

Figure 14 shows median single family home sale prices for the Boston metropolitan area (condominium
31 not
warmer
metimes
xtends into the first quarter). Keep in mind, however, that sales volume is typically lower during the first
and fourth quarters of each year, so these declines have less impact on the annual median than one might
xpect. There was a more significant decline of 20.7% in the winter of 2002-2003, following a record
edian price of $415,800 in the third quarter of 2002.
median prices were not available for this period). Quarterly prices are quite volatile: the data are
seasonally adjusted. The chart shows that prices typically rise by varying amounts during the
months and decline by an average of 4.7% during the fourth quarter (this seasonal decline so
e
e
m
Median Sale Price: Existing Single Family HomesSource: National Association of Realtors
100000
150000
400000
200000
250000
300000
350000
1992 1993 1994 1995 1996 1997 1998 1999 2000 2001 2002 2003 2004 20
Pri
450000
Q1 Q1 Q1 Q1 Q1 Q1 Q1 Q1 Q1 Q1 Q1 Q1 Q105
Q1
Quarter
ce ($
)
Boston PMSA U.S.
Figure 14: Median sales Prices of Existing Single Family Homes
31 National Association of Realtors. “Median Price: Existing Single Family Homes: Boston PMSA.” Chicago: NAR, 2005. <http://www.marealtor.com/content/AssetMgmt/Documents/Member%20Resources/Research/BostonMSA2005.xls>
30

The Freddie Mac Conventional Mortgage Home Price Index (the “CMHPI”) is based on changes in the
prices of repeat sales of the same properties over time. The index for metropolitan Boston over the past
thirty years is attached Figure 15.32 While the repeat-sales methodology cannot make allowance for price
increases based on improvements to individual properties or externalities such as changing neighborhood
characteristics, it does at least control for overall changes in the housing stock over time, such as, for
example, a trend toward the construction of larger, more expensive homes. This enables one to get a truer
picture of house price appreciation. There isn’t even a blip in the index for metro Boston after 1995, let
alone during the recession of 2001-2003. The CMHI increased an astonishing 71.1% from the first quarter
of 2000 to the first quarter of 2005. The curve is very similar to the statewide median price curve.
Figure 15: Repeat-Sales Home Price Index
Repeat-Sales Home Price Index: Boston PMSA Source: Freddie Mac
0
50
100
150
200
300
ex (
250
Mar
-76
Mar
-78
Mar
-80
Mar
-82
Mar
-84
Mar
-86
Mar
-88
Mar
-90
Mar
-92
Mar
-94
Mar
-96
Mar
-98
Mar
-00
Mar
-02
Mar
-04
Quarter
Ind
Q1
1987
= 1
00)
32 Federal Home Loan Mortgage Corporation, Office of the Chief Economist. “Conventional Mortgage Home Price Index: MSA Indices, Q1 2005 Release.” <http://www.freddiemac.com/finance/cmhpi/current/excel/msas.xls>.
31

Figures 14 & 15 are based on single family home sales and exclude condominiums and multi-family
homes, which make up a large portion of the housing stock in Greater Boston. Nonetheless, it seems
reasonable to assume that price trends in one type of property correlate somewhat with those of a
substitutable type of property.
he market was not totally free of any effects from the recession. The rate of growth in home prices
ached a peak of 16.2% per year in the first half of 2000, immediately prior to the start of the recession,
nd then declined to “only” 7.3% at the trough in the third quarter of 2003 (Figure 16).33 Then it resumed
bing again.
T
re
a
clim
Annual Rate of Growth in Home Sale PricesSource: Freddie Mac
-10
-5
0
5
10
15
rce
tage
ha fr
Y
20
30
35
M6
M8
M0
M2
M4
M6
M8
M0
M2
M4
M6
M8
M0
M2
M4
Pen
Cng
eom
viou
s ea
r
25
Pre
ar-7
ar-7
ar-8
ar-8
ar-8
ar-8
ar-8
ar-9
ar-9
ar-9
ar-9
ar-9
ar-0
ar-0
ar-0
Quarter
Figure 16: Annual Rate of Growth in Home Sale Price
33 Office of the Chief Economist, Federal Home Loan Mortgage Corporation. “Conventional Mortgage Home Price Index: MSA Annual Growth Rates, Q1 2005 Release.” <http://www.freddiemac.com/finance/cmhpi/current/excel/msas.xls>.
32
DEMAND DRIVERS
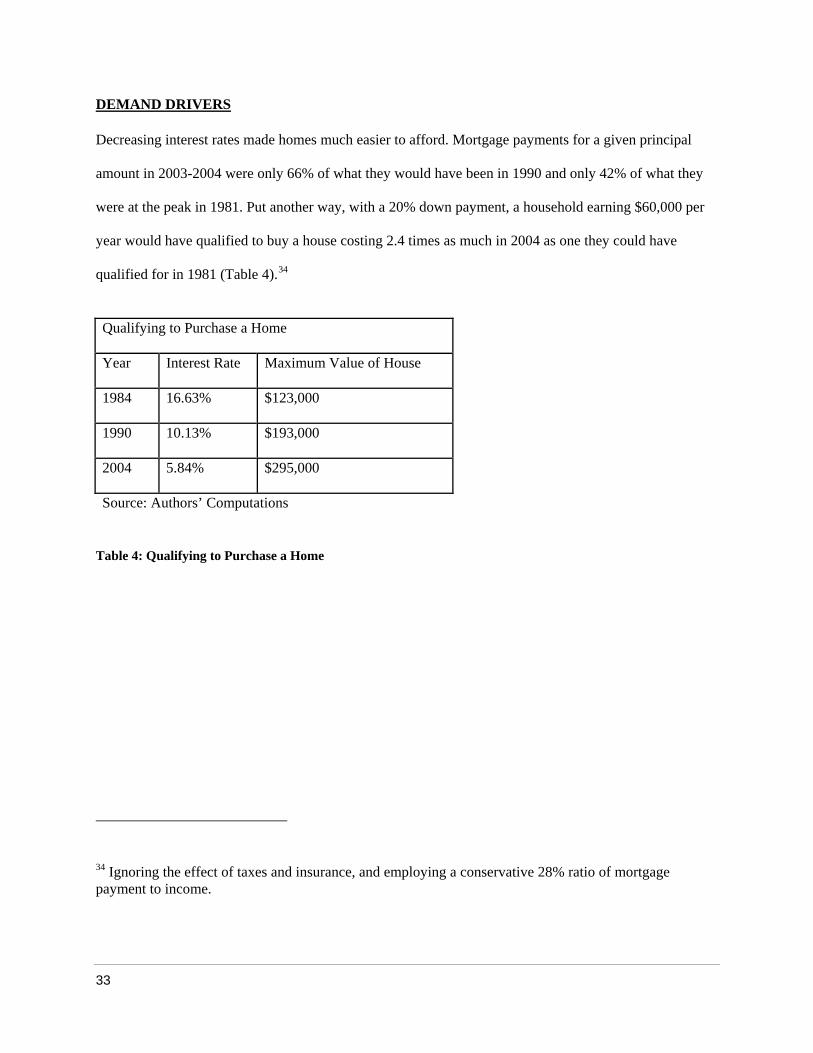
Decreasing interest rates made homes much easier to afford. Mortgage payments for a given principal
amount in 2003-2004 were only 66% of what they would have been in 1990 and only 42% of what they
were at the peak in 1981. Put another way, with a 20% down payment, a household earning $60,000 per
year would have qualified to buy a house costing 2.4 times as much in 2004 as one they could have
qualified for in 1981 (Table 4).34
Qualifying to Purchase a Home
Year Interest Rate Maximum Value of House
1984 16.63% $123,000
1990 10.13% $193,000
2004 5.84% $295,000
Source: Authors’ Computations
Table 4: Qualifying to Purchase a Home
vative 28% ratio of mortgage 34 Ignoring the effect of taxes and insurance, and employing a conserpayment to income.
33

igure 17: Mortgage Rates
nother part of the reason for the robust residential market was the increase in personal income reported
above. Until 2002, increases in personal income were actually running ahead of median sale prices
).35 Even though prices have since run ahead, the current low interest rates as compared to prior
ears helps make current home prices affordable to more people than in 1990. As long as interest rates
main low, there is still room for prices to rise further without hitting the limits of affordability.
F
A
in
(Figure 18
y
re
All numbers adjusted as ratio of 1990 level. Personal income data from U.S. Department of Commerce, Bureau of Economic Analysis. Op. cit. Personal income for 2004 projected by applying the statewide rate of increase in personal income to the 2003 metropolitan personal income figure. Repeat sales home price data from Federal Home Loan Mortgage Corporation, op. cit. Interest rates for 30-year fixed-rate mortgages from Federal Home Loan Mortgage Corporation. “Primary Mortgage Market Survey:
ac.com/pmms/docs/30yr_pmmsmnth.xls
35
Conventional, Conforming Fixed-Rate Mortgage Series since 1971.” <http://www.freddiem >. July 16, 2005.
Mortgage Rates: 30-Year Fixed (APR)
Source: Freddie Mac
8%
%
%
4%
18%
1972
1974
1976
1978
1980
1982
1984
1986
1988
1990
1992
1994
1996
1998
2000
2002
2004
Year
Ies
t R
4%
6%
10
nter
12ate
(
1
%)
16%
34

Personal Income, Median Home Prices and Interest Rates:Greater Boston (1990 = 100)
Source: Freddie Mac and U.S. Bureau of Economic Analysis
50
70
110
Year
90
150
170
190
210
230
250
1990 1991 1992 1993 1994 1995 1996 1997 1998 1999 2000 2001 2002 2003 2004
Iex
Val
ue
Personal IncomeHome Prices30-Year Mortgage Rates
130nd
Figure 18: Personal Income, Home Prices and Interest Rates
Another reason why prices have increased so much is the difficulty of constructing new housing in many
localities. First, in this urbanized area most of the more desirable sites for development have been built
upon. Second, there are strong local regulatory constraints on development through local conservation
commissions, planning boards and zoning boards. Chapter 40A of the Massachusetts General Laws gives
enormous power to cities and towns to regulate development through the zoning process. There are no
significant regional or statewide planning or zoning authorities to limit local control,36 other than a much-
maligned statewide anti-snob zoning law (Chapter 40B). This law allows developers of affordable
36 There is an appeal process but its scope is limited.
35

housing to override local zoning in communities in which less than 10% of the housing is deemed
affordable. It has been credited with much of the housing that has gotten built.
Residents of many cities and towns have been fighting the construction of housing for any of several
reasons:
• it will increase the cost of governmental services (especially schools) in excess of any property taxes
that it will bring in;
• to the extent it includes subsidized housing, it will lower the value of nearby homes;
• it will increase traffic and congestion; and
• it will eliminate open space.
Regardless of the validity of these arguments, the pressure generated has been effective at limiting new
construction. The governor and other public officials, as well as local housing advocates, have been trying
to promote the construction of more housing, particularly housing located near mass transit. They argue
that the run-up in housing prices caused by the imbalance between supply and demand is hurting the
commonwealth’s competitive position in attracting and retaining business. As a result of these efforts, as
well as a more profitable market for development, building permits issued for housing units in
metropolitan Boston have increased in 27% in 2003 and an additional 10% in 2004
37
37 Since the boundaries of the Boston metropolitan area were changed after 2002, data prior to that date were estimated by multiplying total state permits for each size of building by the metropolitan area’s average share of statewide permits in 2003-2004. “Table 2au: New Privately Owned Housing Units Authorized – Unadjusted Units for Regions, Divisions and States.” and “Table 3au: New Privately Owned Housing Units Authorized – Unadjusted Units by Metropolitan Area.” Census 2000. U.S. Department of Commerce, Census Bureau.
> July 16, 2005. <http://www.census.gov/const/www/C40/table2.html#annual
36
Housing PermitsSource: U.S. Census Bureau
6000
8000
10000
16000
000
20000
24000
0 1 92 319
9419
9519
9619
9719
9819
9920
0020
0120
0220
0320
04
Year
Hou
sing
Uni
ts P
t
Massachusetts
18
22000
erm
ited Metro Boston (est.)
12000
14000
199
199
19 199
absorbed
move into a new
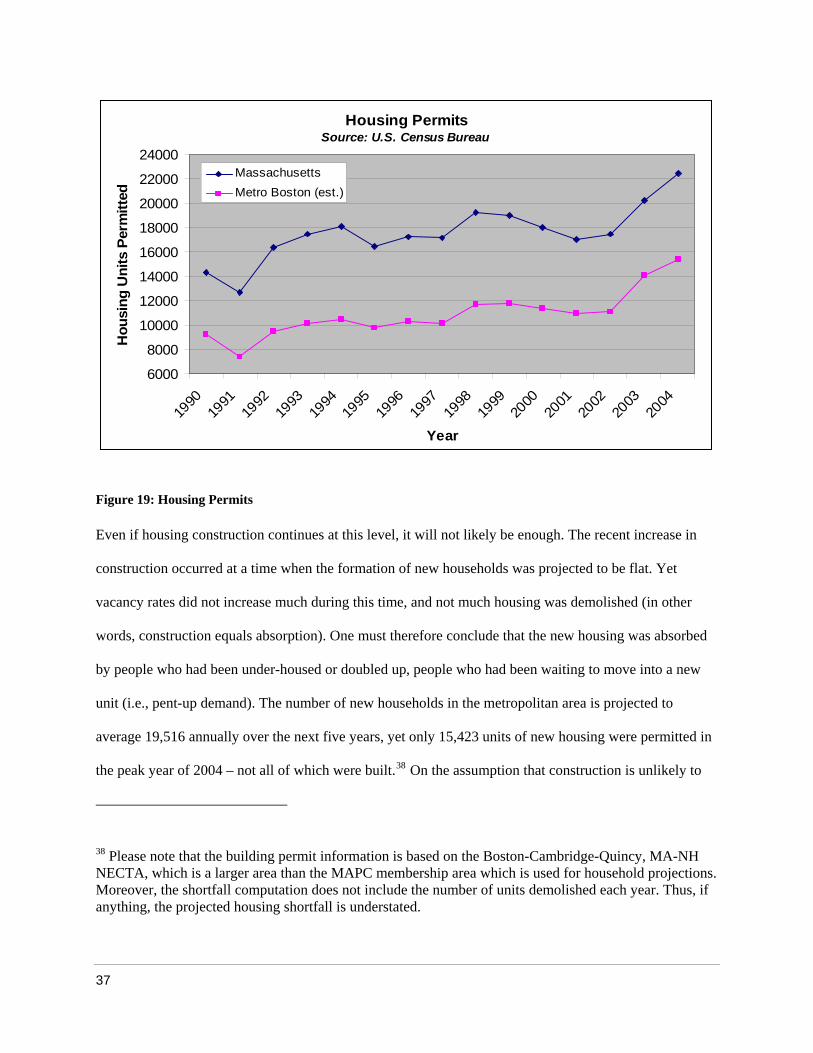
unit (i.e., pent-up demand). The number of new households in the metropolitan area is projected to
average 19,516 annually over the next five years, yet only 15,423 units of new housing were permitted in
the peak year of 2004 – not all of which were built.38 On the assumption that construction is unlikely to
Figure 19: Housing Permits
Even if housing construction continues at this level, it will not likely be enough. The recent increase in
construction occurred at a time when the formation of new households was projected to be flat. Yet
vacancy rates did not increase much during this time, and not much housing was demolished (in other
words, construction equals absorption). One must therefore conclude that the new housing was
by people who had been under-housed or doubled up, people who had been waiting to
38 Please note that the building permit information is based on the Boston-Cambridge-Quincy, MANECTA, which is a larger area than the MAMoreover, the shortfall computation does not include the number of units demo
-NH PC membership area which is used for household projections.
lished each year. Thus, if anything, the projected housing shortfall is understated.
37
grow much faster, there is likely to be a shortfall of over 4,000 units per year.
IS THERE A HOUSING BUBBLE?
Looking at the seemingly relentless upward climb of housing prices, one has to ask, Has Boston’s
housing market become immune to the effects of the larger economy? How could this have happened?
Will nothing impede the relentless run-up in real estate prices? Or is Boston in the midst of a housing
bubble? The latter is what many in the media profess to be concerned about, and it is certainly in the
backs of the minds of many home buyers at this time. While this paper is not an economic treatise, it is
appropriate to address the question here since all developers must make some assumptions about the
future direction of the local economy and real estate market. And there is an obvious concern: real estate
prices simply cannot indefinitely increase faster than personal incomes. People will eventually run out of
money. Following is a summary of the significant points on the issue:
Declining interest rates made it easier to purchase more expensive homes and made it relatively more
• Local regulatory constraints on new construction made it more difficult – and more expensive – to
increase the supply.
• Interest rates are rising, increasing mortgage payments for current and future buyers (as well as those
• Rents have come down.
Reasons for high price appreciation to date:
• The booming economy and stock market of the late 1990s gave people higher incomes.
•
attractive to own than to rent.
Concerns:
owners who have adjustable mortgages).
• Incomes have not been keeping up with the latest increase in prices.
38

• The high price of housing is making Greater Boston less competitive in attracting and retaining
workers for area businesses, which may become a drag on the economy.
Why a sudden price decline is unlikely:
y of housing; in
• Regulatory constraints on construction of additional housing supply are not likely to ease much.
7.5% due to
• ncing and as a result there is plenty of liquidity in the system (unlike
This analysis has shown that the Boston area is not experiencing a housing bubble. Home prices have
onse to market fundamentals, notably the increase in personal income, the decline in
ortgage rates and the con
Exp t appear to be a major factor behind the strong housing
lunge in response to
the extent envisioned by some analysts. Furthermore, our state-level
• The metropolitan economy is strong and diversified and the job-creating economic expansion is
expected to continue.
• Unemployment is low and declining; total personal income is rising.
• Strong household growth is projected.
• The Baby Boomers are entering their key earning years and the Echo Boomers are ready to form new
households.
• Immigration over the past 20 years will result in more home purchasers.
• Unlike the case in previous downturns, the region does not now have an oversuppl
fact, quite the opposite.
• Interest rate increases have been moderate and are predicted to remain between 5.5% and
low inflation expectations.
There are many sources of fina
the late 80’s and early 90’s).
risen in resp
m strained supply of new homes.
ectations of rapid price appreciation do no
market. Our observations also suggest that home prices are not likely to p
deteriorating fundamentals to
39
analysis of home prices finds that while prices have risen much faster recently for some states than fo
on, the supply of housing in those states appears to be inelastic, making pr
r the
nati ices there more volatile. We
therefore conclude that much of the volatility at the state level is the result of changing fundamentals
rather than regional bubbles.
We have projected that population and personal income will increase in the next five years (and beyond).
New households will demand additional units of housing. Freddie Mac is predicting that the average rate
for a fixed rate 5.7% at present.40 Interest
oderate pace thereafter. While this will eliminate some
of desirable parcels of land plus governmental constraints on construction will keep new supply restricted
t rease the cost of
e
mo own in the rate of price appreciation in response to a gradual increase in
e
39
mortgage will be 6.3% at the end of 2006, up just a bit from
rates are likely to continue to increase at a m
buyers at the margins, it will not dampen the overall affordability of for sale housing. Limited availability
in he near future so that demand is not met. Higher interest costs will also inc
construction. The consequence is continued upward pressure on prices. It therefore appears to us that th
st likely course is a slowd
interest rates. We will assume a rate of price increase of 5% per year from now until the sell-out of th
project in approximately two years.
39 Jonathan McCarthy and Richard W. Peach. “Are Home PPolicy Review. X, 3. December, 2004. Federal Reserve Ban
rices the Next ‘Bubble?’” FRBNY Economic k of New York.
<http://www.newyorkfed.org/research/epr/forthcoming/mccarthy.pdf>. July 16, 2005.
40 Federal Home Loan Mortgage Corporation, Office of the Chief Economist. “Economic and HousingMarket Outlook.” July, 2005. <http://www.freddiemac.com/news/finance/docs/outlook.xls>.
40

SECTION 4: EAST CAMBRIDGE MARKET CONTEXT
The Cambridge Community Development Department regards the city of Cambridge Massachusetts a
being composed of 13 unique ne
s
ighborhoods. The area referred to as East Cambridge, is located on the
southeast tip of the city of Cambridge, flanked by the Charles River to the East and Charlestown and
uired
elopment
the
irst parcel for industrial purposes to the Boston Porcelain & Glass
Company, and so began an era of intense industrialization in Eastern Cambridge.41
Somerville to the North.
4.1 Historic Context of Eastern Cambridge Development
The development of Eastern Cambridge began in 1795 when local businessman Andrew Craigie acq
the farmland, fields and marshland that then made up the area. Craigie and partner Harrison Grey Otis
formed the Lechmere Point Corporation in 1809 and built the Canal Bridge across the Charles River
(adjacent to what is now the Museum of Science). The construction of the bridge lead to the dev
of the first two streets in the area: Cambridge Street and Monsignor O’Brien Highway (then Bridge
Street). By 1811 the corporation laid out a street grid that aligned with Cambridge Street that covered
peninsula, and extended into the surrounding marshlands of the Charles River. Then in 1813 the
Lechmere Point Corporation sold its f
41 Cambridge Community Development Department, Eastern Cambridge Planning Study Committee, ThEastern Cambridge Planning Study (City of Cambridge, 2001), Section 2.1.
e
41
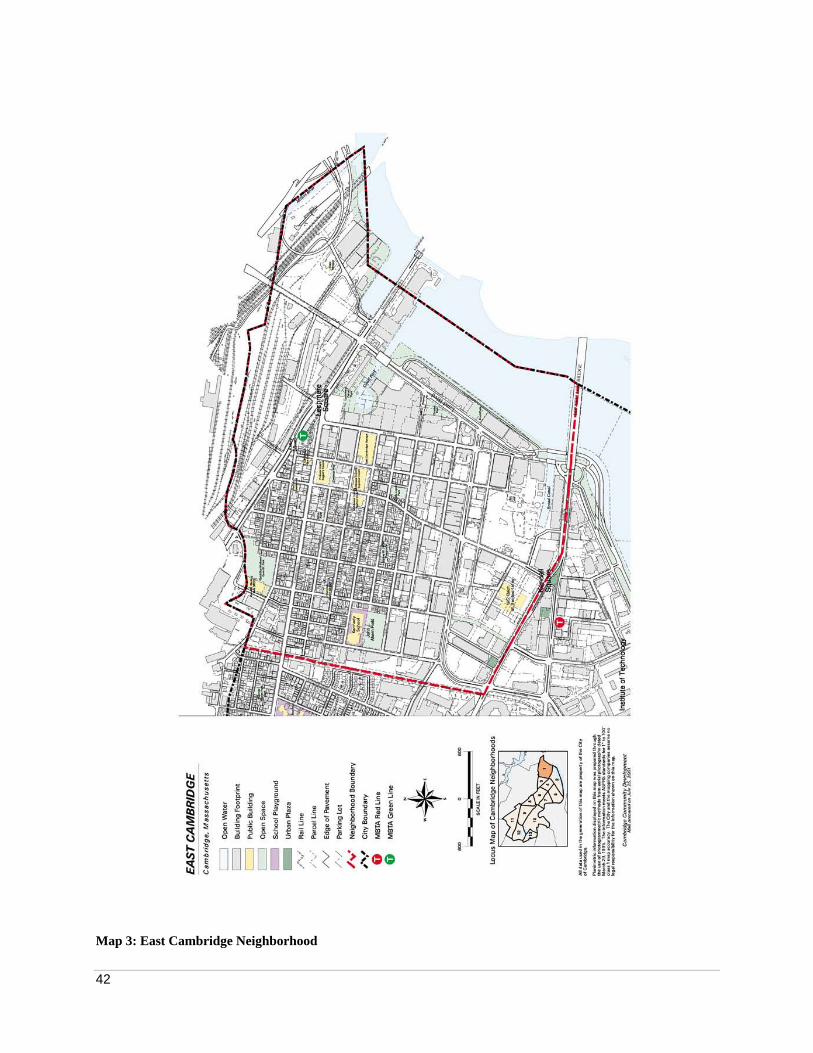
Map 3: East Cambridge Neighborhood
42

Map 4: East Cambridge Aerial View
43

After the civil war, demand for industrial sites close to water increased, and much of the marshlands
along the Charles River were filled in to meet the demand. At this time most of the land south of Charles
Street and Monsignor O’Brien Highway, including Kendall Square, North Point and Lechmere Square
was either marshland or water.42 One of the critical historic moments that were to shape the development
of Cambridge was decision to relocate the Massachusetts Institute of Technology from Back Bay to its
current site along the Charles River in 1916.
Eastern Cambridge experienced a major decline in manufacturing between 1950 and 1980. The increasing
popularity of truck transportation refocused much of area’s industrial energies around the new interstate
highway system. By the end of the Second World War in 1944, many of East Cambridge’s industrial
buildings sat vacant and scheduled for demolition. The decline in land values resulted in the area being
overtaken by light industrial uses including parking lots, service centers and auto repair shops. In the late
1960’s and the advent of urban renewal, approximately 14 acres in the heart of Kendall Square were
designated an “Urban Renewal Area”. Over the next 20 years, Kendall Square was gradually rebuilt as a
mix of commercial uses, including a major research center for the U.S. Department of Transportation.
In the late 1980’s, fueled by its proximity to MIT, the Kendall Square Area experienced a dramatic
increase in development of research-based facilities. Following a brief interruption by the recession of the
early 1990’s, office and research development was stimulated by a biotechnology boom in the mid and
late 1990’s. The surge of development in Eastern Cambridge, particularly that spurned by the significant
influx of research and development firms, and their large employee base, has resulted in a series of
42 Ibid. Section 2.2.
44

planning studies and initiatives over the last few decades, the most recent being the East Cambridge
Planning Study published by the City of Cambridge in October 2001.
KENDALL SQUARE URBAN RENEWAL AREA
4.2 Eastern Cambridge Planning Initiatives
ablished an Urban Renewal Plan for the Kendall
Square area in the 1960’s; included in this plan were the expectations that NASA (the National
ses.
recommendations were not adopted by city council, but did serve to influence the development of a series
wth
itted
by the Planning Board to the City Council in September 2000. The Petition was approved by the City
The Cambridge Redevelopment Authority (CRA) est
Aeronautics and Space Administration) would establish a center in Kendall Square. In 1969 NASA closed
operations in Cambridge and the complex was occupied by the Department of Transportation in 1970. In
the 1970s and early 1980s, much of the Kendall Square area consisted of vacant factories and warehou
Planning and investment in this area focused on the availability of uniquely large parcels of land in close
proximity to MIT and an MBTA Red Line station.
The development of the Riverfront area and Kendall Square progressed, a committee led by the City met
for over a year in 1990 – 1991 to produce a series of zoning recommendations. Ultimately these zoning
of guidelines and planning documents published between 1993 and 2000. In 1997, the Citywide Gro
Management Advisory Committee (CGMAC) was formed in response to growing community concerns
over the quality and density of new development, traffic growth, and housing affordability. The CGMAC
committee included broad representation from Cambridge neighborhoods, businesses, and institutions, as
well as City staff. This three-year planning effort culminated in a Citywide Rezoning Petition, subm
45

Council in February 2001 after a five month public review process.43 A critical outcome of the rezon
petition was the result of 17 commercial districts being rezoned to resid
ing
ential, and housing became
allowed in all parts of the city.
In the late 1990s, many residents felt that the pace and scale of development in the City needed to be
checked. In 1999, several East Cambridge residents, seeking a moratorium on development in East
units.
Cambridge, filed the Larkin Petition requesting that the city council impose an 18 month moratorium on
all new commercial development over 20,000 square feet and new residential development over 20
The primary concern expressed in the document was the encroachment of commercial development into
residential neighborhoods. The City Council approved the moratorium from January 2000 to July 2001,
and the City Manager established the Eastern Cambridge Planning Study Committee to consider the
appropriate zoning measures and policies for the moratorium area.
EASTERN CAMBRIDGE PLANNING STUDY
The Eastern Cambridge Planning Committee identified six primary areas in their planning study: East
Cambridge; Wellington/Harrington; Area IV; Transition Areas (1 and 2); Kendall Square; North Point.
The East Cambridge neighborhood is one of the oldest residential areas in this part of the city, and is
bounded by the Cambridge/Somerville line to the north, the Charles River to the east, Broadway to the
south, and the rail right-of-way to the west. The Wellington-Harrington neighborhood is bounded by the
Cambridge/Somerville line to the north, the railroad tracks to the east, and Hampshire Street to the south
and west. The Area IV neighborhood is bounded by Hampshire Street to the north, the railroad tracks to
the east, Massachusetts Avenue to the south, and Prospect Street to the west. The Transition Areas
43 Ibid. Section 2.5.
46
include a broad swath of commercial and industrial development separating the residential neighborhoods
from Kendall Square and the Lechmere Canal. Kendall Square is the office/R&D core of Eastern
Cambridge, centered on the tran
sit station, Marriott Hotel, and the shops and restaurants along Main
Street. North Point is a triangular area approximately sixty acres in size, bounded by the Somerville and
Boston City lines to the north, the Charles River Basin to the east, and Monsignor O’Brien Highway to
the south and west.
The proposed site for the Galileo Lofts (parcel 7) is located on the periphery of an area defined by the
CRA as a “transition area”, and is currently zoned MXD – Mixed Use Development. It is interesting to
note that this particular parcel is neither clearly articulated nor considered within the context of the
planning study, it seems really to be a leftover or afterthought parcel that is lost in the planning and
projections for the rest of the area.
ECAPS RECOMMENDATIONS / PROPOSALS
t,
at
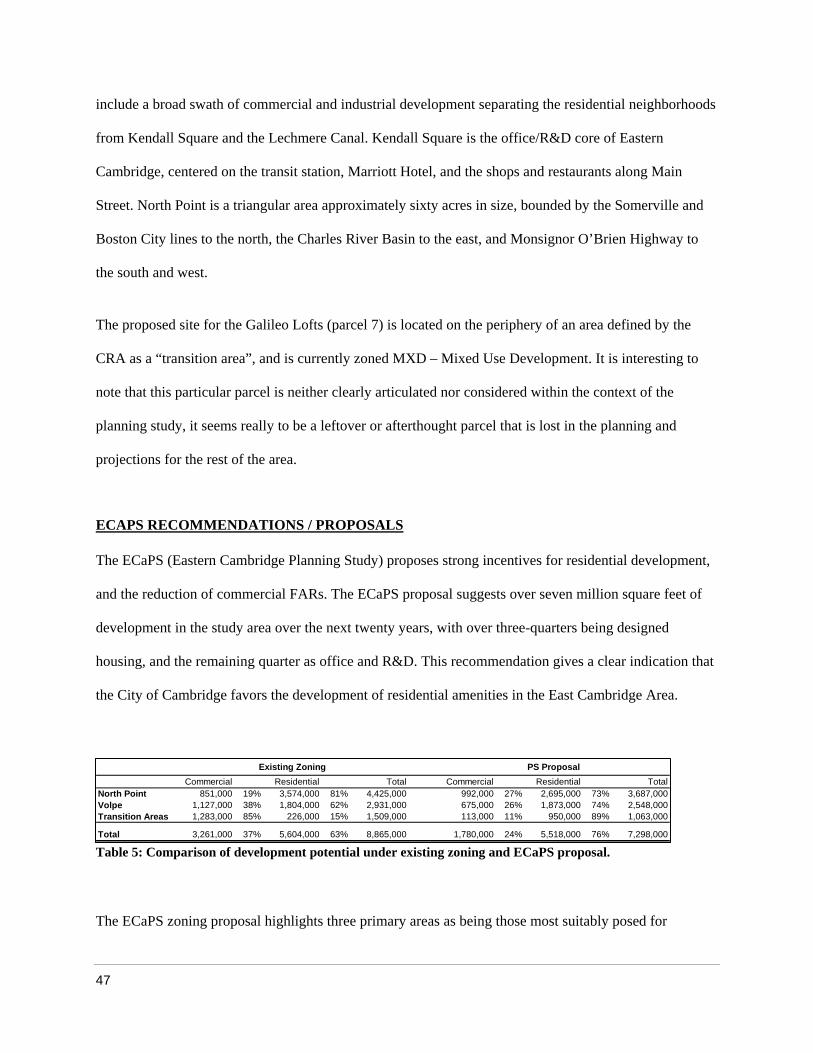
The ECaPS zoning proposal highlights three primary areas as being those most suitably posed for
Commercial Residential Total Commercial Residential Total
Transition Areas 1,283,000 85% 226,000 15% 1,509,000 113,000 11% 950,000 89% 1,063,000
Total 3,261,000 37% 5,604,000 63% 8,865,000 1,780,000 24% 5,518,000 76% 7,298,000
The ECaPS (Eastern Cambridge Planning Study) proposes strong incentives for residential developmen
and the reduction of commercial FARs. The ECaPS proposal suggests over seven million square feet of
development in the study area over the next twenty years, with over three-quarters being designed
housing, and the remaining quarter as office and R&D. This recommendation gives a clear indication th
the City of Cambridge favors the development of residential amenities in the East Cambridge Area.
North Point 851,000 19% 3,574,000 81% 4,425,000 992,000 27% 2,695,000 73% 3,687,000Volpe 1,127,000 38% 1,804,000 62% 2,931,000 675,000 26% 1,873,000 74% 2,548,000
Existing Zoning PS Proposal
Table 5: Comparison of development potential under existing zoning and ECaPS proposal.
47

development: North Point, the site of the Volpe Transportation Center and the Transition Areas. Table 3.1
illustrates the projected development over the next two decades utilizing existing zoning and the ECaPS
zoning proposals. The most obvious observation is the shift towards residential zoning, particularly in the
Transition Areas (including the project site). It seems reasonable to comment that the Planning Board
seems to strongly encourage the development of residential neighborhoods in this area.
Section 3.2 of the ECaPS outlines the proposal for the Eastern Cambridge area, including the proposed
project site. In accordance with Figure 2, the ECaPS suggests that Parcel 7 be developed as green space
adjacent to a proposed bike path, with new and existing residential neighborhoods to the north, and
flanked by existing R&D uses on the east and west. Other recommendations include high density mixed
use zoning for North Point, as well as mixed uses with a strong emphasis on residential development for
the Volpe site. There is a recommendation of a 7.5 acre public park in conjunction with the development
of the Volpe site.
4.3 Kendall Square Context: Biotech, Office and MIT
Kendall Square is the epicenter of Cambridge’s high technology and biotechnology industries. This
world-renowned area of commercial and industrial activity is home to firms such as Genzyme, Biogen,
Draper Laboratory and Akamai, as well as MIT.44
BIOTECHNOLOGY
In their 2004 Biotechnology Issue, NAI Hunneman Commercial Real Estate Services reports that “the
region’s biotech sector is creeping back up to normal, especially compared to 2003.”45 The issue reports
44 James Daniel. Wikipedia Online Encyclopedia.
48

that due in part to the increasing rental rates in the Cambridge area, the biotech industry is demonstrating
expansion, and Lexington and Watertown are both becoming hot biotech areas. The expansion has had
the effect of flattening the Cambridge market, and that as with the office market, biotech sublets are
renting at a discount.
CURRENT IMPACTS ON THE CAMBRIDGE R&D MARKET
• Lyme Properties has sold a 3.7 million square foot portfolio, most of which is located in East
Cambridge and Boston.
• The Whitehead Institute for Biomedical Research, a nonprofit research and educational
institution with close ties to MIT, recently signed a 23, 987 sq. ft. lease at 5 Cambridge
Center in the heart of Kendall Square.
• The Broad Institute, an alliance of MIT, Harvard and the Whitehead Institute, has chosen the
7 Cambridge Center site for its proposed 7-story, 231,000 square foot headquarters, which is
now before the City for zoning approval (developed by Boston Properties).
• Schlumberger, a large international oilfield services company, is setting up an initial 15,000
square foot facility at Lyme Properties’ 320 Bent Street, and is reportedly planning a 200,000
square foot research center in Cambridge.
• Demand for biotech in the state remains “spotty,”46 although it does appear to be moving
towards recovery; it is anticipated that as the economy strengthens, smaller startups will
45 NAI Hunneman Commercial Real Estate Services Worldwide. “The Biotechnology Issue.” Fall, 2004. p. 1
46 Ibid., p. 4.
49
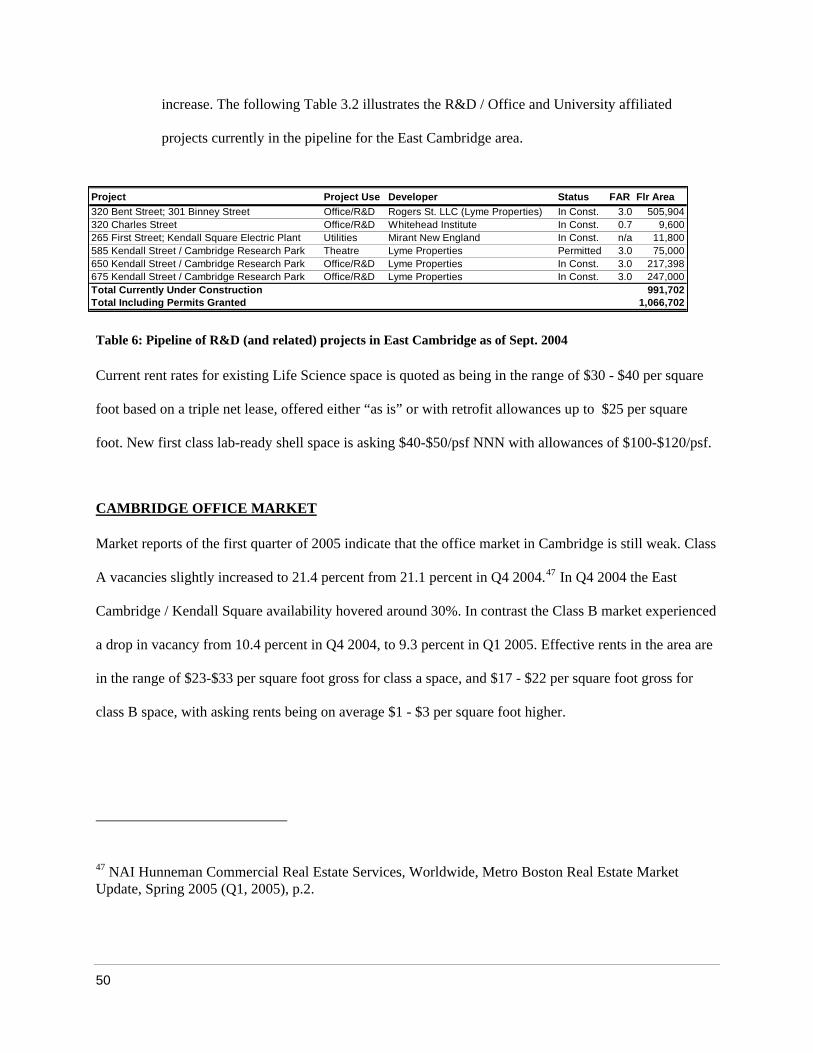
increase. The following Table 3.2 illustrates the R&D / Office and University affiliated
projects currently in the pipeline for the East Cambridge area.
Table 6: Pi
Curren n
foot based
foot. New ng $40-$50/psf NNN with allowances of $100-$120/psf.
CAMBRID
peline of R&D (and related) projects in East Cambridge as of Sept. 2004
t re t rates for existing Life Science space is quoted as being in the range of $30 - $40 per square
on a triple net lease, offered either “as is” or with retrofit allowances up to $25 per square
first class lab-ready shell space is aski
GE OFFICE MARKET
orts of the first quarter of 2005 indicate that the office market in Cambridge is still weMarket rep ak. Class
A vaca ie
Cambridge ed
a drop in v , to 9.3 percent in Q1 2005. Effective rents in the area are
in the r g
class B spa
nc s slightly increased to 21.4 percent from 21.1 percent in Q4 2004.47 In Q4 2004 the East
/ Kendall Square availability hovered around 30%. In contrast the Class B market experienc
acancy from 10.4 percent in Q4 2004
an e of $23-$33 per square foot gross for class a space, and $17 - $22 per square foot gross for
ce, with asking rents being on average $1 - $3 per square foot higher.
47 NAI Hunneman Commercial Real Estate Services, Worldwide, Metro Boston Real Estate Market ng 2005 (Q1, 2005), p.2.
P Project Use Developer Status FAR Flr Area3 treet Office/R&D Rogers St. LLC (Lyme Properties) In Const. 3.0 505,904320 Charles Street Office/R&D Whitehead Institute In Const. 0.7 9,600265 First Street; Kendall Square Electric Plant Utilities Mirant New England In Const. n/a 11,800585 Kendall Street / Cambridge Research Park Theatre Lyme Properties Permitted 3.0 75,0006 In Const. 3.0 217,3986 In Const. 3.0 247,000Total Currently Under Construction 991,702Total Incl n
roject 20 Bent Street; 301 Binney S
50 Kendall Street / Cambridge Research Park Office/R&D Lyme Properties75 Kendall Street / Cambridge Research Park Office/R&D Lyme Properties
udi g Permits Granted 1,066,702
Update, Spri
50

Developers
market is n so far the recovery has not
been dramatic.
have been awaiting a turn around in the office market since 2000, and it appears that the
ow beginning to stabilize; however, vacancies are still high, and
Table 7: Summary of Q1 2005 Cambridge Office & Lab Market48
Total (1,000 SF)
Vac. (%)
Abs. (1,000SF)
Rent Class A
Rent Class B
Cambridge Office 10,634 21.2% 67 $29.02 $18.75Cambridge Lab 6,236 20.1% 12 $27.95 $23.63Total 16,870 20.65% 79 $28.49 $21.19
MIT
According to the Cambridge Chamber of Commerce, MIT is ranked second (after Harvard University) as
the largest employer in Cambridge Massachusetts with 7,114 employees. The top ten employers are
rounded out by a list of biotechnology and research laboratories that constitute a significant percentage of
Cambridge’s 120,000 employment force. Much of the MIT research laboratories and institutes are located
in Neighborhood 2 – MIT, just to the west of East Cambridge, and adjacent to Kendall Square. The high
volume of employees in related to MIT will have an impact on the population of the area.
00
The Cambridge Innovation Center has recently expanded 29,549 SF of office space at One Broadway in
Kendall Square, which is owned by MIT. One Broadway has also benefited from the relocation of 30,0
SF of Patni Computer Systems.
er Report (Q1, 2005), p.1. 48 Grubb & Ellis Company, First Quart
51
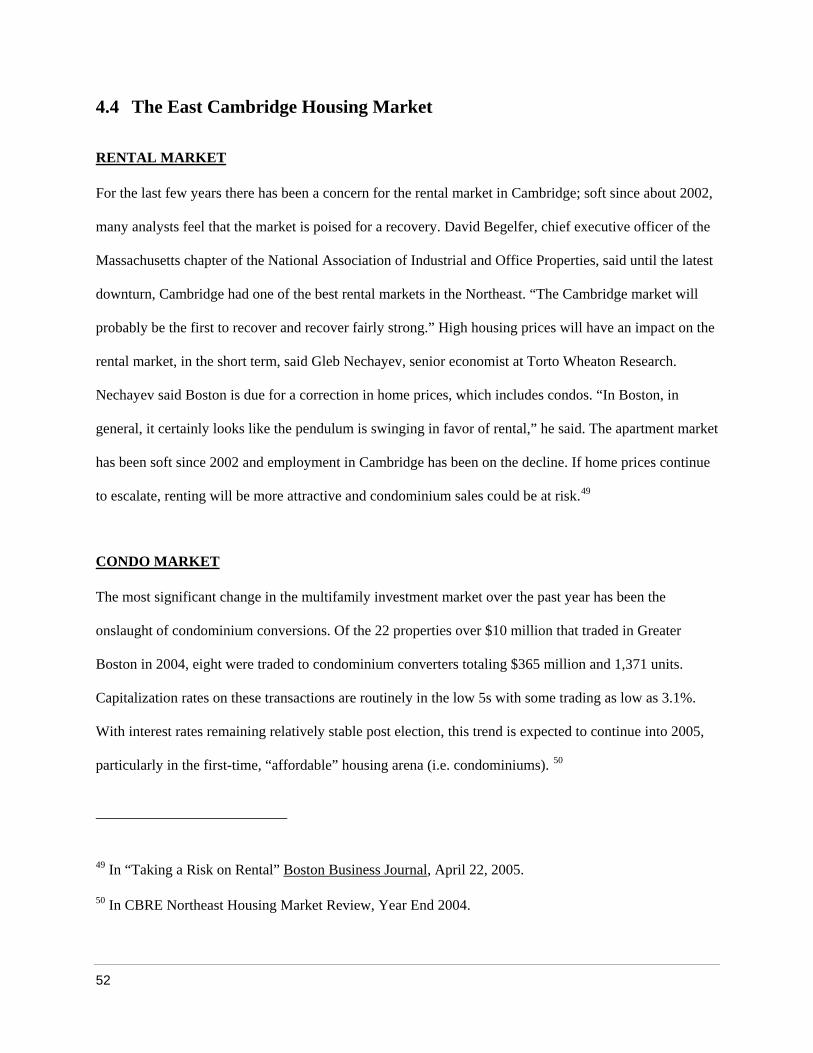
4.4 The East Cambridge Housing Market
RENTAL MARKET
For the last few years there has been a concern for the rental market in Cambridge; soft since about 2002,
many analysts feel that the market is poised for a recovery. David Begelfer, chief executive officer of the
Massachusetts chapter of the National Association of Industrial and Office Properties, said until the latest
downturn, Cambridge had one of the best rental markets in the Northeast. “The Cambridge market will
pact on the
rental market, in the short term, said Gleb Nechayev, senior economist at Torto Wheaton Research.
yev said Boston is due for a correction in home prices, which includes condos. “In Boston, in
nue
probably be the first to recover and recover fairly strong.” High housing prices will have an im
Necha
general, it certainly looks like the pendulum is swinging in favor of rental,” he said. The apartment market
has been soft since 2002 and employment in Cambridge has been on the decline. If home prices conti
to escalate, renting will be more attractive and condominium sales could be at risk.49
CONDO MARKET
The most significant change in the multifamily investment market over the past year has been the
onslaught of condominium conversions. Of the 22 properties over $10 million that traded in Greater
ctions are routinely in the low 5s with some trading as low as 3.1%.
With interest rates remaining relatively stable post election, this trend is expected to continue into 2005,
particularly in the first-time, “affordable” housing arena (i.e. condominiums). 50
Boston in 2004, eight were traded to condominium converters totaling $365 million and 1,371 units.
Capitalization rates on these transa
49 In “Taking a Risk on Rental” Boston Business Journal, April 22, 2005.
50 In CBRE Northeast Housing Market Review, Year End 2004.
52

CB Richard Ellis Northeast Multi-housing group made the following comments regarding the onslaught
of potential condominium development in the Greater Boston Area:
to
We expect the multi-family market to continue to improve in 2005. We expect gains in effective rents as
concessions burn off and the overall economy improves. We do not see the potential new supply as a
significant factor, as many developments will not break ground and the potential new supply is a small
fraction of the overall inventory. Additionally, condo conversions will continue to remove inventory from
the market. While there may be some re-pricing in the smaller private capital transactions as interest rates
rise, the pent-up capital in the institutional arena is likely to continue to drive the pricing on larger multi-
family assets. Additionally, we expect to see more condo conversions as investors look to satisfy the
demand of first-time home buyers and the lack of affordable housing.
With a total rental housing stock base of approximately 875,000 units for the greater Boston market
(includes four families to large garden complexes) and the condo conversion phenomena, we do not
believe that the potential supply will materially impact the market. The potential of 3,924 units in the
greater Boston market pales in comparison to the 40,000 units that are routinely delivered in the Atlanta
market each year. What has become evident as we have tracked developments throughout Boston in the
last five years is that the peak deliveries keep getting pushed out farther as developers have struggled
complete the permitting and as partnerships have not been able to capitalize the developments due to
busted construction budgets or poor site fundamentals.
51
51 Ibid. p. 3.
53

9%
14%
11%
9%31%
21%
3% 2%
Single FamilyTwo UnitsThree UnitsFour to Eight UnitsNine or more unitsAll CondominiumMixed Use (Res & Comm.Rooming Houses
n
ent
%
onally a community of single-family and duplex
residences. In the last few years the community has demonstrated a dramatic shift towards multi-unit
residential development, particularly in the Kendall Square area. If the popularity of East Cambridge as
an “affordable” option for urban workers continues (as expected), it is predicted the proportion of housing
stock will gradually shift towards for multi-unit development.
Table 8: City of Cambridge 2002 Housing Stock52
SECTION 5: DEMAND / DEMOGRAPHIC ANALYSIS
Much of the analysis included in Section 5 draws upon the regional market context evaluated in depth i
Section 3. The following section attempts to “zoom in” on the East Cambridge neighborhood and
summarize trends in the micro-context that are pertinent for the discussion of multi-housing developm
in the area.
5.1 City of Cambridge Housing Stock
The City of Cambridge is currently dominated by multi-family residential neighborhoods. Condominium
properties make up an aggregate of 21% of all dwelling units, and when taken in conjunction with multi-
family residential properties with nine or more units, the total percentage of multi-family housing is 52
of all Cambridge City Units. East Cambridge was traditi
City of Cambridge Massachusetts, Housing Marker Information”, published by the Cambridge Community Development Department, June 2003.
Four to Eight Units 726 3,808 8.8%
Mixed Use (Res & Comm.) 339 1,383 3.2%Rooming Houses 40 784 1.8%TOTAL 11,133 43,160 100.0%
Type of Housing # of Blgs # of Units% of Units
Single Family 3,718 3,718 8.6%Two UnitsThree Units 1,623 4,869 11.3%
Nine or more units 276 13,223 30.6%All Condominium 1,296 9,145 21.2%
3,115 6,230 14.4%
52 From the “
54

INCOME REQUIRED TO BUY MEDIAN PRICED HOME
The cost of housing in the City of Cambridge has demonstrated a steady increase over the last 15 y
and for about the last decade the income required to purchase housing (of all types) has been almost
consistently
ears,
higher that the HUD estimated median income for a family of four. As the gap between
widen, “affordable” options, such as
The housing data available from the City of Cambridge includes statistics up to the year end of 2002.
However, as discussed in Section 3 of this document, and supported by market reports by CB Richard
Ellis’s Housing Division, the trends represented in Table 7 and Figure 20 continued through 2004 (see
Income Required
Median Income for Family of 4
1990 $240,000 $61,740 $250,000 $38,220 $168,300 $48,660 $46,3001991 $253,500 $65,610 $230,000 $33,740 $160,000 $46,940 $50,2001992 $261,000 $69,290 $240,000 $36,400 $160,000 $48,050 $51,1001993 $277,000 $74,430 $242,000 $37,820 $160,000 $48,640 $51,2001994 $305,000 $82,180 $235,000 $36,360 $155,000 $48,580 $51,3001995 $275,250 $74,740 $263,000 $36,520 $159,000 $49,830 $53,1001996 $321,000 $85,870 $279,000 $39,940 $169,000 $51,980 $56,5001997 $347,500 $92,420 $301,000 $45,360 $217,000 $64,250 $59,6001998 $359,500 $96,020 $391,500 $57,360 $209,000 $63,470 $60,0001999 $425,000 $109,890 $412,000 $59,600 $252,000 $72,670 $62,7002000 $525,000 $132,690 $457,500 $68,950 $302,500 $84,010 $65,5002001 $540,000 $135,630 $575,000 $91,260 $335,000 $91,590 $70,0002002 $610,000 $149,000 $656,000 $109,600 $348,500 $92,600 $74,200
average incomes and the price of housing continues to
condominiums will continue to be popular alternatives.
YearMedian Price
Income Required
Median Price
Income Required
Median Price
HUD Est Single Family Duplex Condominium
Figure 12, page 29), and are expected to continue through 2005.
55

Table 9: City of Cambridge: Income required to purchase Median Priced Home53
Note the increasing gap between single family homes and HUD estimated Median Income; as this trend
continues the demand for “affordable” residential options will continue to increase (see Figure 20).
$160,000
Figure 20: City of Cambridge: Income Required to Purchase Median Priced Home
TENURE OF CAMBRIDGE HOUSING BY NEIGHBORHOOD
The City of Cambridge has demonstrated a positive shift in the proportion of homeowners versus renters.
East Cambridge has demonstrated the same trend, with a net increase in housing units of 608 (
double) the number in 1980. The split between renters and owners is relatively consistent with that
demonstrated in Cambridge in the city as a whole. Interestingly, the percentage of owners to r
higher in East Cambridge, than in the other three adjacent Neighborhoods, most notably
of five owner-occupied units in the year 2000. The phenomenon of home buying that has been
more than
enters is
MIT with a total
From the City of Cambridge Massachusetts: “Neighborhood Demographics Profile”, Cambridge Community Development Department, March 2004. 53
$0
$20,000
$120,000
$140,000
1990 1991 1992 1993 1994 1995 1996 1997 1998 1999 2000 2001 2002
$40,000
$60,000
$80,000
$100,000Single FamlyDuplexCondoHUD Est Median Income for Family of 4
56

demonstrated in recent years is typically linked (in part) to current low interest rates. Many forecasters
predict that when interest rates begin to rise the rental market will “perk up” again.
CITY OF CAMBRIDGE 1980 1990 2000 Net % 1980 1990 2000Owner Occupied 8,889 11,959 13,760 4,871 54.8% 21.5% 28.5% 30.8%Renter Occupied 29,947 27,446 28,855 -1,092 -3.6% 72.5% 65.4% 64.5%Vacant 2,464 2,574 2,110 -354 -14.4% 6.0% 6.1% 4.7%Total 41,300 41,979 44,725 3,425 8.3% 100% 100% 100%EAST CAMBRIDGE (Area 1)Owner Occupied 530 867 1,138 608 114.7% 21.9% 27.1% 28.0%Renter Occupied 1,769 1,866 2,550 781 44.1% 73.1% 58.4% 62.8%Vacant 120 464 374 254 211.7% 5.0% 14.5% 9.2%Total 2,419 3,197 4,062 1,643 67.9% 100% 100% 100%
Owner Occupied 1 0 5 4 400.0% 0.1% 0.0% 0.6%Renter Occupied 853 838 747 -106 -12.4% 98.4% 97.0% 92.1%
3.0% 7.3%
MIT (Area 2)
Vacant 13 26 59 46 353.8% 1.5%Total 867 864 811 -56 -6.5% 100% 100% 100%WELLINGTON-HARRINGTON (Area 3)Owner Occupied 514 719 735 221 43.0% 17.8% 24.6% 23.5%Renter Occupied 2,171 2,031 2,286 115 5.3% 75.1% 69.5% 73.2%Vacant 204 172 104 -100 -49.0% 7.1% 5.9% 3.3%Total 2,889 2,922 3,125 236 8.2% 100% 100% 100%Area 4Owner Occupied 364 476 618 254 69.8% 12.9% 17.7% 22.7%Renter Occupied 2,083 1,981 2,012 -71 -3.4% 73.7% 73.5% 74.0%
13.4% 8.8% 3.3%100
Vacant 379 237 90 -289 -76.3%Total 2,826 2,694 2,720 -106 -3.8% % 100% 100%
Housing Units Change 1980-2000 % of Neigborhood Units
Table 10: Tenure of East Cambridge Housing 1980 – 2000
Area 4
0 500 1,000 1,500 2,000 2,500 3,000 3,500 4,000 4,500
Area 1
Area 3
Owner OccupiedRenter OccupiedVacant
Area 2
57

Figure 21: Tenure of East Cambridge Housing in 2000
CAMBRIDGE CITY SALES BY NEIGHBORHOOD
The following Table 11 illustrates the sales pattern for Cambridge citywide statistics as well as by
neighborhoods. The data set available includes the five years from 1997 – 2002. The city wide statistics
demonstrate roughly a 20% price increase between the years 1997 – 2000, with only a 10% and 4%
increase in the years 2001, and 2002 respectively. The lack of price increase in these years is assumedly
correlated with the increase in the number of units sold in 2001 (20% increase) and 2002 (7.5% increase)
interesting to observe that the median sales price in Area 1 (East Cambridge) has been on average 19.7%
higher than the citywide median price.
Table 11: Number of Sales & Median Prices by Neighborho
SalesMedian Price Sales
Median Price Sales
Median Price Sa
Median Price Sales
Median Price Sales
Median Price
Area 1 90 $391,000 71 $408,000 71 $410,000 68 $272,000 76 $253,000 76 $276,000Area 3 29 $325,000 10 $299,450 10 $232,000 $210,000 7 $137,000 5 $123,000Area 4 29 $320,000 42 $308,500 20 $198,000 $238,000 20 $168,000 19 $120,000Area 5 83 $354,000 85 $350,000 44 $307,500 40 $278,000 39 $199,000 43 $167,500City Wide 733 $348,000 682 $335,000 571 $302,500 615 $252,000 614 $209,000 638 $177,500
1999
as compared to the relatively stable number of sales in the previous three years (average of -3.6%). It is
2002 2001 2000 1998 1997
od
les
1016
58
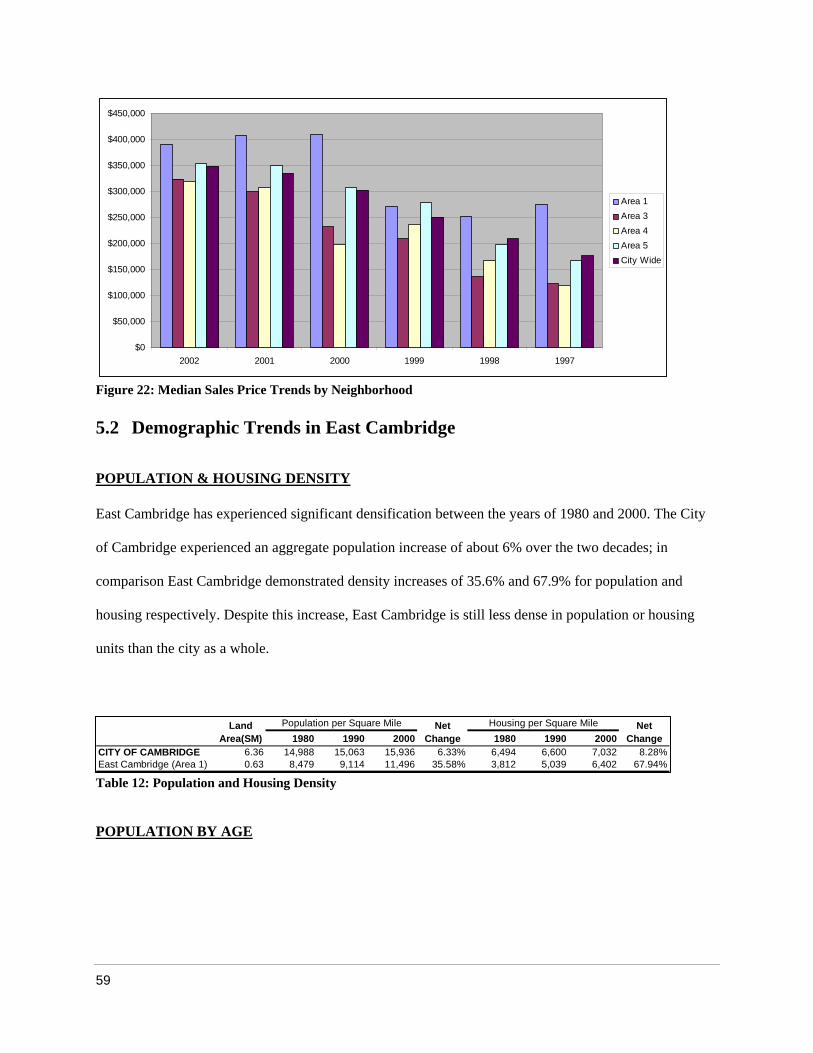
Figure 22: Median Sales Price Trends by Neighborhood
5.2 Demographic Trends in East Cambridge
POPULATION & HOUSING DENSITY
East Cambridge has experienced significant densification between the years of 1980 and 2000. The C
of Cambridge experienced an aggregate population increase of about 6% over the two decades; in
comparison East Cambridge demonstrated density increases of 35.6% and 67.9% for population and
housing respectively. Despite this increase, East Cambridge is still less dense in population or housing
Table 12: Population and Housing Densit
ity
units than the city as a whole.
y
POPULATION BY AGE
$02002 2001 2000 19
$50,000
$100,000
$150,000
$200,000
$250,000
$300,000
$350,000
$400,000
$450,000
99 1998 1997
Area 1Area 3Area 4Area 5City Wide
1980 1990 2000 1980 1990 2000Net
ChangePopulation per Square Mile Housing per Square MileLand
Area(SM)Net
ChangeCITY OF CAMBRIDGE 6.36 14,988 15,063 15,936 6.33% 6,494 6,600 7,032 8.28%East Cambridge (Area 1) 0.63 8,479 9,114 11,496 35.58% 3,812 5,039 6,402 67.94%
59

The age mix of the East Cambridge has also changed in the last two decades. The most noteworthy
observation is the net change in the 25 – 44 age groups representing an increase of 132% from 1980. This
group includes individuals in the prime home buying years. As discussed earlier in this analysis, East
Cambridge has enjoyed a significant increase in its popularity as an alternative location for young
urbanites. The favorable tax rates and proximity to downtown have made it a suitable location for
densification.
Figure 23: City of Cambridge: Population by Age
5.0% 4.1% 5.0% 4.1%5 - 17 11,049 8,853 9,322 -1,727 -15.6% 11.6% 9.2% 9.2%
2 % 23.5% 19.8% 21.2%2 14.9% 13.4% 14.5%
30 - 34 10,098 11,013 10,481 383 3.8% 10.6% 11.5% 10.3%4,856 53.4% 9.5% 16.1% 13.8%4,402 32.3% 14.3% 14.4% 17.8%
Population Change 1980-2000 % of Neigborhood Population1980 1990 2000 Net
0 - 4 3,928 4,759 4,125 197% 1980 1990 2000
18 - 4 22,445 18,997 21,472 -973 -4.325 - 9 14,237 12,852 14,721 484 3.4%
Table 13: CITY OF CAMBRIDGE: Population by Age
65 + 10,871 10,071 9,282 -1,589 -14.6% 11.4% 10.5% 9.2%
Total 95,322 95,802 101,355 6,033 6.3% 100% 100% 100%
35 - 44 9,086 15,430 13,94245 - 64 13,608 13,827 18,010
25,000
00 - 4 5 - 17
5,000
10,000
15,000
20,000
18 - 24 25 - 29 30 - 34 35 - 44 45 - 64 65 +
198019902000
60

Figure 24: East Cambridge (Area 1): Population by Age
Note the different profiles observable in Figure 2 Figure 24. East Cambridge has seen a sharp
increase in the numbers of 25 – 44 years olds, while the population existing mature age groups (45+) has
remained relatively stable. That is, the numbers are ature resident, nor are they
.
arket.
44 age group, many of whom work in the
using options in the downtown Boston area continuing
to dwindle, this trend of “young urbanites” flocking to the area is expected to continue. The secondary
1980 1990 2000 Net % 1980 1990 20000 - 4 270 282 248 -22 -8.1% 5.0% 4.9% 3.4%5 - 17 759 495 532 -227 -29.9% 14.1% 8.6% 7.3%18 - 24 810 660 1,089 279 34.4% 15.1% 11.4% 14.9%25 - 29 497 797 1,166 669 134.6% 9.2% 13.8% 16.0%30 - 34 348 662 793 445 127.9% 6.5% 11.5% 10.9%35 - 44 488 798 1,139 651 133.4% 9.1% 13.8% 15.6%45 - 64 1,231 1,117 1,307 76 6.2% 22.9% 19.3% 17.9%65 + 977 969 1,020 43 4.4% 18.2% 16.8% 14.0%Total 5,380 5,780 7,294 1,914 35.6% 100% 100% 100%
Population Change 1980-2000 % of Neigborhood Population
3 and
not increasing for the m
diminishing. This suggests that this age bracket prefers to stay in the East Cambridge neighborhood
Table 14: East Cambridge (Area 1): Population by Age
In general there appear to be two primary target demographics in the East Cambridge residential m
0
200
0 - 4 5 - 17 18 - 24 25 - 29 30 - 34 35 - 44 45 - 64 65 +
400
600
800
1,000
1,200
1,400
198019902000
The primary demographic consists of individuals in the 25 –
downtown or Cambridge area. With affordable ho
61

demographic profile is of mature persons age 45+. While the numbers of this demographic are not
increasing, they are stable, and still represent the largest proportion of East Cambridge residents in ter
of total numbers.
ms
62

SECTION 6: SUPPLY ANALYSIS
Supply analysis was conducted using resources from Multiple Listing Service – Property Information
Network (MLS-PIN and The Warren Group listing services), and takes into consideration the following
factors:
• Inventory & quality of existing space
• Construction of New Space
• Features functions and benefits of existing and proposed space
• Overall vacancies and characterization of vacant stock
• Recent absorption of space
• Market Rents / Sales price
• Lease terms and concessions
The supply analysis in this report is organized into three broad categories: 1) Analysis of Geographic
Submarket, 2) Analysis of Loft Product Submarket, and 3) Analysis of the development pipeline.
DATA COLLECTION AND METHODOLOGY
For the purposes of the present supply analysis, sales data was collected via MLS-PIN and Warren Group
listings. Neither data set is ideal. MLS-PIN includes only those sales handled by real estate brokers who
are subscribers of the service, amounting to approximately 85% of all sales. Sales handled by an owner
directly, or by non-member real estate brokers, are not represented. The listing information is collected
and provided by the listing brokers: while generally accurate, there is no independent verification of the
information provided. The Warren Group obtains independent information on all sales from the Registries
of Deeds and municipal tax assessors, but the records have less detail than that in MLS-PIN. Information
on newer projects is incomplete, often excluding number of rooms, floor area, parking (etc.), because that
63

data has not yet been collected by the local assessors. The information listed with the Warren Group is
subject to both transcription error, and errors in the assessor’s database. Since this supply analysis relies
set was sub-categorized into two relevant data series: 1) Cambridge Condo Data, 2) “Loft”
Product Data. Data was collected for the dates 6/1/04 – 5/31/05.
CAMB ID T
heavily on newer projects, we have placed primary reliance on MLS-PIN data.
The data
R GE CONDO SUBMARKE
The fir e ominium units within a radius
of appr im adius surrounding the proposed project
site wa o was defined as those properties with zip codes 02139, 02141, and
02142. e geographic data was intended to reflect the neighborhood defined
as East m dge, together with any adjacent neighborhoods that a purchaser
interested in East Cambridge would likely consider. As demonstrated in Section 5, each of the defined
neighborhoods is considered to have enough similarity to constitute a “community” within the City of
Cambridge. The intention of defining this subcategory was to be consistent with the geographic
definitions as outlined by the city of Cambridge, and to assess housing transactions for this community.
As with any real estate transaction, “location” (in this case the East Cambridge neighborhood) is assumed
to be a significant factor relating to supply and demand for product in the area.
st s ries, “Cambridge Condo Data,” included data pertaining to cond
ox ately one mile from 322 Binney Street. The one-mile r
s c ined the “Primary Area” and
Th intention of collecting this
Ca bridge by the City of Cambri
LOFT PRODUCT SUBMARKET
The second series reflected “’Loft” Product Data” and was defined as loft condominiums within a 5 mile
radius of 322 Binney Street. It was hypothesized that analysis of East Cambridge data would only
provide “part of the picture” with respect to the supply and demand forces affecting the Galileo Lofts
Proposal. It was felt that in addition to demand for housing in the defined East Cambridge area, there is
also a submarket that is less geographically constrained, and primarily motivated by preference for
64

specific housing typologies; in this case, “Loft Condominiums”. For the purposes of this analysis a “Lof
product was defined as a residential unit with an open floor plan (most commonly a simple rectangular
plan, with or without enclosed bedrooms), and high ceilings (11’ – 16’ on avera
t”
ge) and typically with
large windows. The five mile radius was defined as an effort to capture transactions with relative
proximity to the city center. It was felt that the urban “loft” buyer would still want access to the city, but
that the specific community may be less important. Condominium sales data was sorted by zip code and
all transactions occurring within the defined 5-mile radius for the one year period from June 1, 2004 to
May 31, 2005 was compiled. The data set was then searched by the keyword “loft”, appropriate
transactions were then reviewed line by line to ensure the product was consistent with the above
definition of a “loft”. Any properties that did not meet the above criteria, or were incomplete were
removed from the data set. Analysis was conducted on those condominium units that were listed as: 1)
Sold, 2) Under Agreement (UAG), and 3) On the Market (On Mkt).
HISTORIC SALES ANALYSIS
6.1 Geographic Submarket: East Cambridge Condominiums
st st
onship
between sales price ($) and unit floor areas (SF). It should be noted that the correlation between Sale
actions was 99.6%; as such it was decided that List Price would
Analysis was conducted on the sales data collected for the zip codes 02139, 02141, and 02142 from June
1 , 2004 to May 31 , 2005. A set of 516 sales, 183 under agreement, and 134 on the market listings were
assessed. The data sample for the sales transitions was plotted in an effort to illustrate the relati
Price and List Price within the 516 trans
be used as a proxy for Sold Price. The decision to use List Price was based on a desire to be able to
65
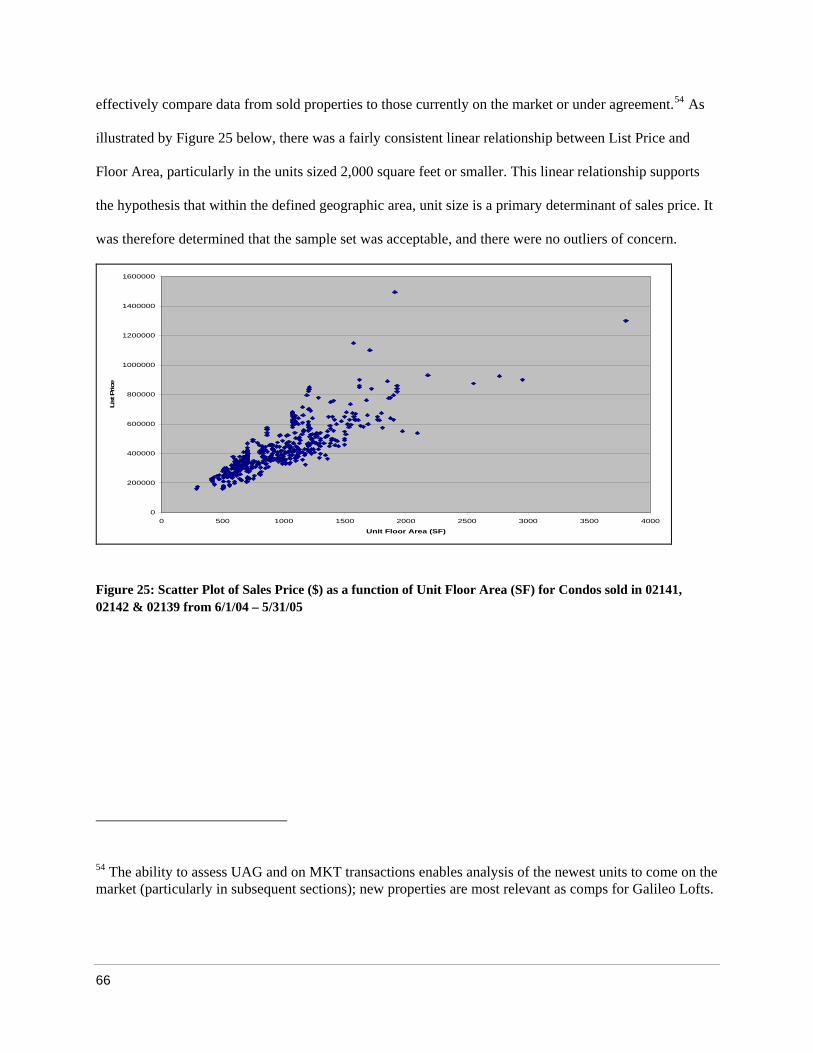
effectively compare data from sold properties to those currently on the market or under agreement.54 As
illustrated by Figure 25 below, there was a fairly consistent linear relationship between List Price and
Floor Area, particularly in the units sized 2,000 square feet or smaller. This linear relationship supports
the hypothesis that within the defined geographic area, unit size is a primary determinant of sales p
was therefore determined that the sample set was acceptable, and there were no outliers of concern.
rice. It
0
200000
800000
1000000
1200000
1400000
1600000
List
Pe
400000
600000
0 4000
ric
0 500 1000 1500 2000 2500 3000 350
Unit Floor Area (SF)
($) as a function of Unit Floor Area (SF) for Condos sold in 02141,
Figure 25: Scatter Plot of Sales Price02142 & 02139 from 6/1/04 – 5/31/05
54 The ability to assess UAG and on MKT transactions enables analysis of the newest units to come on the market (particularly in subsequent sections); new properties are most relevant as comps for Galileo Lofts.
66

SOLD # Med Mean Med Mean Mean Mean SoldPrice / Mean Mean Med. Mean Med. Mean
0 13 258,166 266,450 258,166 264,466 21 99.3% 1.0 531 544 486 4881 166 328,482 333,697 324,576 331,540 32 99.4% 1.1 665 672 513 496
3 68 534,500 545,813 520,500 538,143 43 98.6% 1.8 1,404 1,410 375 384 10 787,500 711,280 788,700 694,390 63 97.6% 2.8 1,900 2,003 327 34
6 1 1,300,000 1,300,000 1,300,000 1,300,000 52 100.0% 2.5 3,800 3,800 342 342 0 0
All 516 389,000 430,350 390,000 425,806 37 98.9% 1.8 1.4 906 970 441
BRs Units ListPrice ListPrice SoldPrice SoldPrice DOM Mean ListPrice BR Baths SF SF $/SF $/SF
2 258 429,000 456,105 425,000 451,181 38 98.9% 1.5 1,049 1,017 428 44408
5 0 0 0
452
Table 15: Summary of Condos Sold in 02141, 02142, 02139 from 6/1/04 – 5/31/05
UAG # Med Mean Med Mean Mean Med. Mean Med. MeanBRs Units ListPrice ListPrice DOM BRs Baths SF SF $/SF $/SF
0 1 312,500 312,500 64 1.0 433 446 589 6181 51 351,000 381,769 12 1.0 655 719 557 5352 95 469,000 498,903 13 1.5 1,072 1,088 476 4763 34 585,000 610,647 29 1.8 1,460 1,544 424 4324 2 840,000 840,000 73 2.3 2,335 2,311 370 3535 06 0
All 183 449,000 489,730 14 1.9 1.5 958 1,095 481 483
Table 16: Summary of Condos Under Agreement (UAAG) in 02141, 02142, 02139 from 6/1/04 – 5/31/05
Data was sorted by number of bedrooms (BRs) and descriptive statistics were calculated. As evidenced by
Table 15 & Table 16 above, the majority of sales transactions were for one and two-bedroom units. As
one would expect, the mean statistics are on average slightly higher than median stats as the result of the
few high prices transactions. However, for the studio to three-bedroom units the mean and median values
re
ot of floor area appears to be inversely related to number of bedrooms. In an effort to get a sense of
where the highest price per square foot of floor area fell, a graph was created to observe the relationship
between price per unit area ($/SF).
are not significantly different. It is interesting to note that for this sample set, the mean price per squa
fo
67

ce
monly associated with variance in condominium sales pricing.55
Figure 26: Relationship between Floor Area and Price per Square Foot Condos Sold in 02141, 02142, and 02139 from 6/1/04 – 5/31/05
As illustrated in Figure 26 above, the relationship between $/SF and floor area is not a simple inverse
relationship, indicating that unit area and price do not tell the “whole story”. To estimate the significan
of “Major Value Drivers” on list price, it was decided that further analysis was required to assess the
relative importance of variables com
55 “Major Value Drivers” are variables consistently associated with variation in condominium sales ricing and are often used by assessors in property valuation. These variables commonly include: Floor
Area (SF), # of Bedrooms (Beds), # of Bathrooms (Baths), # Parking Stalls (Pkg), Building Type (i.e. w-rise, mid-rise & hi-rise), Year Built (Age), and Neighborhood Characteristics. “Minor Value Drivers”
are variables such as heating type, air conditioning, finishes, plumbing, deck, pool, fireplaces and exterior ladding.
p
lo
c
0500-750 750-1000 1000-1250 1250-1500 1500-1750 1750-2000 2000+
100
200
300
500
600
Floor Area (SF)
$/SF
400
Mean Median
68
LINEAR REGRESSION ANALYSIS
rter) was
ables
related
ze
Q1/04 = 1;
• BlgType: Building types were assigned the following values: Townhouse/Duplex = 1; Low-
• Pkg: The real number of parking spaces included with unit price.
A simple linear regression was conducted to assess the statistical significance of the relationship between
List Price and a number of variables defined as “Major Value Drivers”. A “time” variable (Qua
also included as it is presumed prices appreciate over time.56 It is worth comment that other vari
such as vertical location (i.e. floor level), views, and proximity to water would be expected to be
to List Prices; however, given the limitations of the data sample, it was not possible to assess these
characteristics. We attempt to address the relative value of some of these characteristics when we analy
comparable properties in subsequent sections. The independent variables were defined as follows:
• Quarter: The List Date was organized into 6 quarters from Q1 2004 to Q2 2005:
Q2/04 = 2; Q3/04 = 3; Q4/04 = 4, Q1/05 = 5; Q2/05 = 6.
• FlrArea: The unit floor area is measured as the square feet of the unit.
• Beds: The real number of bedrooms in the unit.
• Baths: The real number of bathrooms in the unit.
rise = 2; Mid-rise = 3; Hi-rise = 4.
56 The extremely high demand for condominiums in East Cambridge during the time the data set was taken (June 1, 2004 – May 31, 2005) meant that a difference of even a few months could result in significant appreciation in condo pricing.
69

Regression Statistics
Table 1 Spredictors of ListPrice.
The results of the linear regression analysis elicited an R of 0.811, demonstrating that roughly 81.16% of
the variation in ListPrice was attributable to the identified variables. This is a reasonable finding given the
limitations of the data set. Each of the independent variables (with the exception of number of bedrooms)
was found to be significantly related to ListPrice. In this regression, t-stats above (or below) +2 and -2 are
considered to be statisticall as
demonstrated monstrative of a positive relationship with sales price.
The results w ,
floor area was demonstrated to be most strongly correlated with ListPrice. Interestingly, the number of
bedrooms was found to have a negative correlation with list price (although this correlation was not
statistically significant; t-stat: -1.07).
Using the above linear regression, the following basic model was created:
7: ummary Output of Linear Regression Using Quarter, FlrArea, Beds, Baths, BlgType, & Pkg as 57
2
y significant. At a 95% confidence level, each variable (excluding “Beds”) w
to be statistically significant and de
ere consistent when the regression was re-run using a 99% confidence level. Expectedly
-stat = 10.1 – 20.0; ***t-stat = 20.1
S
5.0%Intercept -16946.88 14006.05 -1.21 0.226863 -44464.85 10571.08 -44464.85 10571.08
66.81262.76
BlgType** 22125.07 3321.03 6.66 0.000000 15600.17 28649.96 15600.17 28649.96Pkg** 55190.09 7379.70 7.48 0.000000 40691.05 69689.13 40691.05 69689.13
Multiple R 90.09%R Square 81.16%Adjusted R Square 80.93%Standard Error 69610.47Observations 507
ANOVAdf SS MS F ignificance F
Regression 6 1.04344E+13 1.7E+12 358.8933996 1.297E-177Residual 500 2.42281E+12 4.8E+09Total 506 1.28572E+13
Variables Coefficients Standard Error t Stat P-value Lower 95% Upper 95% Lower 95.0% Upper 9
Quarter* 8890.56 2379.77 3.74 0.000209 4214.98 13566.13 4214.98 13566.13FlrArea**** 332.80 14.14 23.54 0.000000 305.03 360.58 305.03 360.58Beds -6777.09 6333.68 -1.07 0.285132 -19220.99 5666.81 -19220.99 56Baths* 27026.37 5719.08 4.73 0.000003 15789.98 38262.76 15789.98 38
57 The independent variables are rated according to the magnitude of the statistical relationship: * t2.0 - 5.0; ** t-stat = 5.1 – 10.0; ***t-stat = +
70

The model above is a method of understanding the magnitude of the relationship between variables in the
sample set. A linear model is however limited with respect to its appropriateness as a forecasting tool as it
flects a presumed linear relationship between variables, and does not account for diminishing marginal
ber of bathrooms) is not a linear one; for instance a buyer may be willing to pay
re
utility. The concept of diminishing marginal utility reflects the fact that the value placed on a variable
(say floor area, or num
more for the first 700 SF or bathroom, and less for additional area or bathrooms. The linear model in this
case was developed to be used as the base case from which to develop and measure more elaborate
forecasting models.
LOG PRICE REGRESSION ANALYSIS
In an effort to get a better understanding of how the independent variables relate to List Price, a second
“one-sided” log regression was conducted. To produce the analysis, the natural log of the dependent
variable (ListPrice) was calculated and constituted the “left side” of the regression equation. The
independent variables (the “right side” of the equation) were then converted to dummy variables. For 58
58 The “dummy variables” are a binary series containing only “1” and “0” values. For example a variable
( ) ( ) ( ) ( ) ( ) ( )
StallsParking of Number P4)-(1 Type Building
Bathrooms of Number BaBedrooms of umberNB(SF) Area FloorF6)(1 QuarterQ
PTBaBFQiceList
PTBaBFQice PTBaBFQ
=====
−=
+++−+++−=
++++++=
:09.5519007.2212537.2702609.677780.33256.889088.16946Pr
Pr ββββββαList
Where
T
Q2 indicating the second quarter of 2004 was created and all listing occurring in Q2 were assigned values of “1” and all other listings were assigned values of “0”.
71
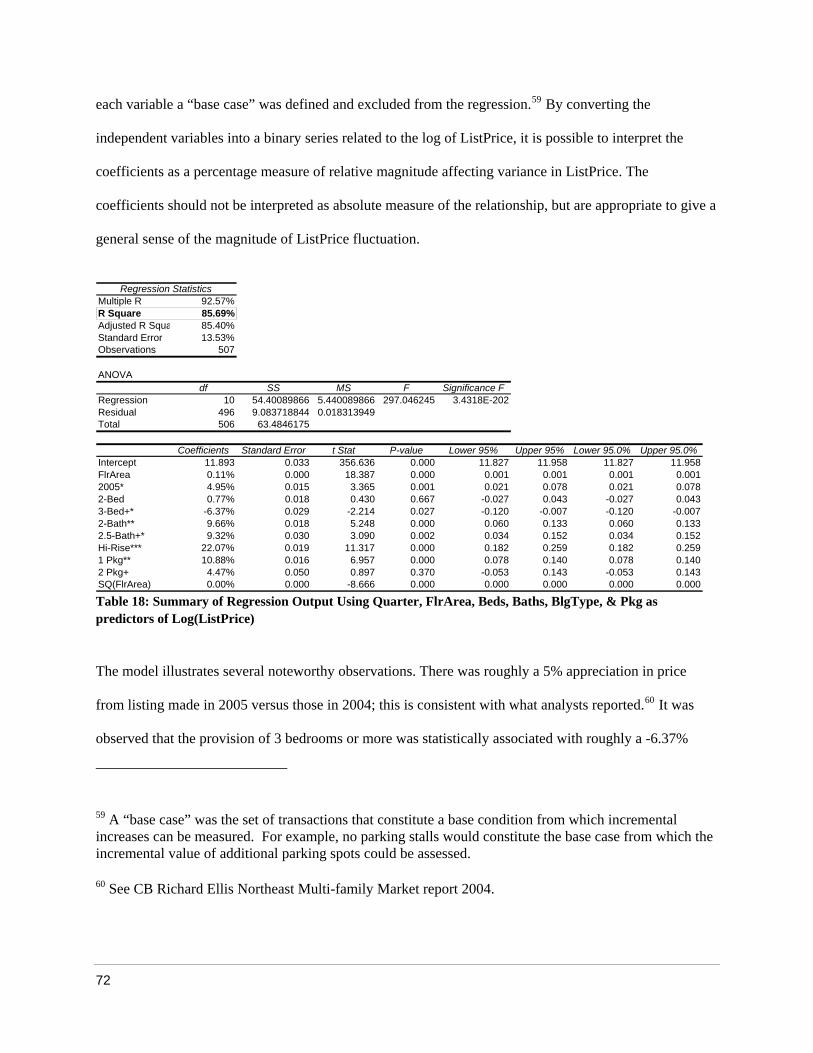
each variable a “base case” was defined and excluded from the regression.59 By converting the
independent variables into a binary series related to the log of ListPrice, it is possible to interpret the
coefficients as a percentage measure of relative magnitude affecting variance in ListPrice. The
coefficients should not be interpreted as absolute measure of the relationship, but are appropriate to give a
general sense of the magnitude of ListPrice fluctuation.
Table 18: Summary of Regression Output Using Quarter, FlrArea, Beds, Baths, BlgType, & Pkg as
The model illustrates several noteworthy observations. There was roughly a 5% appreciation in price
from listing made in 2005 versus those in 2004; this is consistent with what analysts reported. It was
observed that the provision of 3 bedrooms or more was statistically associated with roughly a -6.37%
predictors of Log(ListPrice)
60
59 A “base case” was the set of transactions that constitute a base condition from which incremental increases can be measured. For example, no parking stalls would constitute the base case from which the
port 2004.
Multiple R 92.57%Regression Statistics
R Square 85.69%Adjusted R Squa 85.40%
Observations 507
df SS MS F Significance FRegression 10 54.40089866 5.440089866 297.046245 3.4318E-202Residual 496 9.083718844 0.018313949Total 506 63.4846175
Coefficients Standard Error t Stat P-value Lower 95% Upper 95% Lower 95.0% Upper 95.0%Intercept 11.893 0.033 356.636 0.000 11.827 11.958 11.827 11.958
2005* 4.95% 0.015 3.365 0.001 0.021 0.078 0.021 02-Bed 0.77% 0.018 0.430 0.667 -0.027 0.043 -0.027 03-Bed+* -6.37%2-Bath** 9.662.5-Bath+* 9.32%
Standard Error 13.53%
ANOVA
FlrArea 0.11% 0.000 18.387 0.000 0.001 0.001 0.001 0.001.078.043
0.029 -2.214 0.027 -0.120 -0.007 -0.120 -0.007% 0.018 5.248 0.000 0.060 0.133 0.060 0.133
0.030 3.090 0.002 0.034 0.152 0.034 0.152Hi-Rise*** 22.07% 0.019 11.317 0.000 0.182 0.259 0.182 0.2591 Pkg** 10.88% 0.016 6.957 0.000 0.078 0.140 0.078 0.1402 Pkg+ 4.47% 0.050 0.897 0.370 -0.053 0.143 -0.053 0.143
66 0.000 0.000 0.000 0.000 0.000SQ(FlrArea) 0.00% 0.000 -8.6
incremental value of additional parking spots could be assessed.
60 See CB Richard Ellis Northeast Multi-family Market re
72
decrease in price. This observation is likely capturing the effects of other factors associated with
multi-bed units rather than just the effect of multiple bedrooms;
the
ant
ket). The
of additional bathrooms (or ½ baths) was associated with an additional 9.32% increase. One of the most
noteworthy observations is that there was approximately a 22.07% premium associated with high-rise
61 however, it is a statistically signific
correlation and should be balanced against the analysis in subsequent sections (i.e. Loft Submar
provision of a second bathroom was associated with roughly a 9.66% increase in price, and the provision
units; it is likely this observation is capturing some of the “Major Value Drivers” that could not be
independently identified (i.e. views, amenities, etc.). Finally, one parking stall was associated with a
10.88% increase in price, and an additional stall with another 4.47% increase. Table 19 below illustrates
the descriptive statistics for the historical sales data sorted by number of bedrooms, bathrooms, and
parking. The highest price/SF values were for one-bed, one-bath, and two-bed, two-bath units with
parking at an average of about $510 - $550/SF.
61 For instance, the multi-bedded units are typically in older buildings, and are not necessarily associated with a relative increase in unit floor area.
73
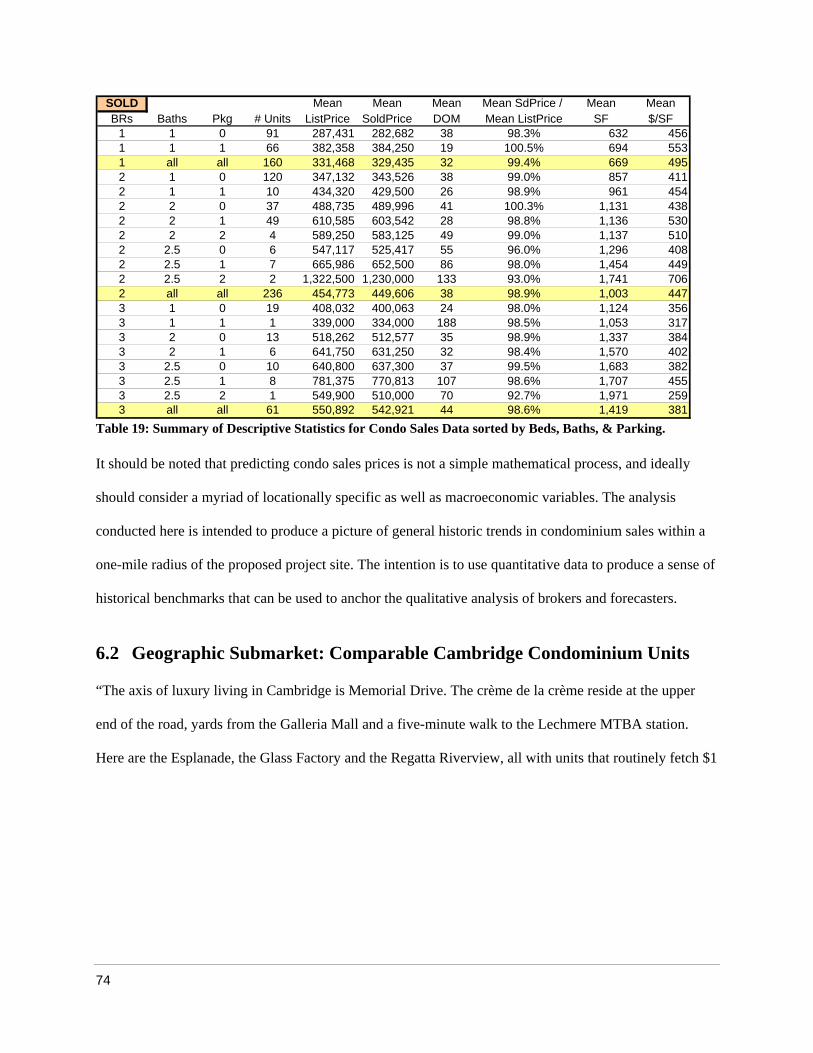
Table 19: Summary of Descriptive Statistics for Condo Sales Data sorted by Beds, Baths, & Parking.
It should be noted that predicting condo sales prices is not a simple mathematical process, and ideally
should consider a myriad of locationally specific as well as macroeconomic variables. The analysis
conducted here is intended to produce a picture of general historic trends in condominium sales with
one-mile radius of the proposed project site. The intent
in a
ion is to use quantitative data to produce a sense of
historical benchmarks that can be used to anchor the qualitative analysis of brokers and forecasters.
6.2 Geographic Submarket: Comparable Cambridge Condominium Units
“The axis of luxury living in Cambridge is Memorial Drive. The crème de la crème reside at the upper
end of the road, yards from the Galleria Mall and a five-minute walk to the Lechmere MTBA station.
Here are the Esplanade, the Glass Factory and the Regatta Riverview, all with units that routinely fetch $1
SOLD Mean Mean Mean Mean SdPrice / Mean Mean
1 1 0 91 287,431 282,682 38 98.3% 632 4561 1 1 66 382,358 384,250 19 100.5% 694 5531 all all 160 331,468 329,435 32 99.4% 669 4952 1 0 120 347,132 343,526 38 99.0% 857 4112 1 1 10 434,320 429,500 26 98.9% 961 4542 2 0 37 488,735 489,996 41 100.3% 1,131 438
2 2 2 4 589,250 583,125 49 99.0% 1,137 5102 2.5 0 6 547,117 525,417 55 96.0% 1,296 4082 2.5 1 7 665,986 652,500 86 98.0% 1,454 4492 2.5 2 2 1,322,500 1,230,000 133 93.0% 1,741 7062 all all 236 454,773 449,606 38 98.9% 1,003 4473 1 0 19 408,032 400,063 24 98.0% 1,124 356
3 2 0 13 518,262 512,577 35 98.9% 1,337 3843 2 1 6 641,750 631,250 32 98.4% 1,570 4023 2.5 0 10 640,800 637,300 37 99.5% 1,683 3823 2.5 1 8 781,375 770,813 107 98.6% 1,707 4553 2.5 2 1 549,900 510,000 70 92.7% 1,971 23 all all 61 550,892 542,921 44 98.6% 1,419 381
BRs Baths Pkg # Units ListPrice SoldPrice DOM Mean ListPrice SF $/SF
2 2 1 49 610,585 603,542 28 98.8% 1,136 530
3 1 1 1 339,000 334,000 188 98.5% 1,053 317
59
74

million or more. “All luxury condos in Cambridge have two requirements,” says Ellen Brockman, a real
estate agent with Coldwell Banker. “It has to be near the river, and it has to be pretty.” 62
The analysis of locational comparable properties was intended to illicit information regarding the nature
of sales of condos within a one mile radius of the proposed project site. Five appropriate comparable were
identified through market research, and were confirmed by the Boston real estate analyst and appraiser,
Pamela McKinney and MLS market data for the dates of August 2004 thru June 1st, 2005 were comp
for analysis. The individual property statistics are included with each property summary. Particular
attention should be paid to The Cambridge Glass Factory and the Regatta River View Projects, as they
the most recent to come on the market.
iled
are
Table 20: Summary of Locational Condominium Comparable Properties.
New/ Year Year # #Project Name Address Cnv Blt Cnv Units Sales
2 Regatta River View 12 Museum Way, Cambridge, MA 02141 Cnv 1998 2005 187 623 The Esplanade 75-83 Cambridge Parkway, Cambridge, MA 02142 New 1989 n/a 206 84 The River Court Condos 10 Rogers Street, Cambridge, MA 02142 New 1989 n/a 160 115 Thomas Graves Landing 4-6 Canal Park, Cambridge, MA 02141 New 1986 n/a 175 8
1 Cambridge Glass Factory 169 Monsignor O'Brien Highway, Cambridge, MA 02141 Cnv 1925 2005 199 60
62 Matt Kelly, “Executive Domains”, The Boston Business Journal, November 12 – 18, 2004.
75

Map 5: Comparable East Cambridge Condominiums
76

1. CAMBRIDGE GLASS FACTORY
Brien
Hwy. in Cambridge. The project offers homes of one or two bedrooms ranging from the low $300’s -
$559,000. Building amenities include a fitness center, media room with flat screen TV and business
center with conference room that are included in the condo fee.
Cambridge’s real estate tax rate is approximately two thirds that of Boston with a residential exemption
that is approximately one third greater than Boston’s.63 In addition to the low property tax environment,
the developer, Crescent Heights a national developer of luxury condominiums is offering to buy down 1
point of the buyer’s mortgage, paying ½ the condo fees for 1 year and the buyer receiving a $1,000
savings at closing. Hypothetically then, one “can own a $308,000 one bedroom with 5% down for about
$1700 a month including principal, interest, taxes and condo fees” according to Richard Drinkwater of
Otis & Ahearn Residential Brokers.
The project is currently approximately 70% sold out, with the larger two-bed, two-bath units still
available for list prices starting at about $460,000 and ranging to the high $500,000. The condos are
renovated at the time of purchase, providing buyers with a selection of finishes with which to customize
their homes. According to the developer, it takes about 45 days to build each condo to the buyer’s
specifications. Standard features include hardwood floors in the living room, new carpeting in the
The Cambridge Glass Factory is an 8-story 104 Unit Condominium located at 169 Monsignor O’
63 In “Crescent Heights Names Local Marketing Team for The Cambridge Glass Factory Condominiums”, Nickerson’s Newsletter, February 18th, 2005.
Project Name Address New/Cnv Year Blt Year Cnv UnitsCambridge Glass Factory 169 Monseignor O'Brien Hwy. Cnv 1925 2005 199
77

bedrooms, and kitchens with granite counters and floors, stainless steel appliances, new cabinets, and
from $35,000 and outdoor parking for $21,000.
2. THE REGATTA RIVER VIEW
marble baths. Garage parking is available
SOLD Mean Mean Mean Mean SdPrice / Mean MeanBRs Baths # Units ListPrice SoldPrice DOM Mean ListPrice SF $/SF
0 1 9 261,017 259,906 16 99.6% 552 4731 1 35 323,694 324,425 25 100.2% 617 5262 2 16 492,800 499,359 40 101.3% 1,026 488
Table 21: Summary of Condos Sold at 169 Monsignor O’Brien Hwy 09/08/2004 – 31/05/2005 All 60 359,388 361,396 28 100.6% 716 508
onvert
to
condos in stages as not to flood the market. The first 187 went on sale in fall of 2004, and the second
phase is set to start late summer 2005. The condominiums in the north tower are 70 percent sold, and the
The Regatta River View Condominiums is the project originally named “Museum Tower Apartments”, a
435 unit complex with a mix of four studio units, 180 one-bedrooms, and 251 two-bedroom units. The
complex is composed of two towers (north & south) that are situated at 12 Museum Way adjacent to
North Point on the Charles River. The total lot size is 90,169 square feet (2.07 acres), a gross building
area of 618,710 and rentable area of 410,444 square feet. There is a 103,200 square foot underground
parking garage with 490 spaces.
Project Name Address New/Cnv Year Blt Year Cnv UnitsRegatta River View 12 Museum Way Cnv 1998 2005 187
The project was purchased by Crescent Heights, residential developers who spent $10,000,000 to c
the North Tower to condominium units that were opened in April 2005. The amenities include a new
Fitness Center, lap pool, private screening theater, business center and club suite. The south tower
currently remains rental units that are currently 90% occupied, with monthly rents ranging from $1,300
for a studio to $5,000 for a two-bedroom penthouse. The intention is to convert the 425 apartments
prices range from $380,000 to $675,000 with an average sale price of $530,000.
78

The developers have reportedly chosen to leave the old apartment kitchens in place and allow buyers to
customize their suites on an individual basis. “Kitchens are very important,” sales associate Tony Zarbano
says, even to people who don’t cook. “They still enjoy a beautiful kitchen and a nice lifestyle that goes
want to
2 Museum Way 09/08/2004 – 31/05/2005
with it.” Buyers can pick their own appliances, faucets, and cabinets - and decide how much they
spend.64
SOLD Mean Mean Mean Mean SdPrice / Mean MeanBRs Baths # Units ListPrice SoldPrice DOM Mean ListPrice SF $/SF
1 1 35 413,098 420,755 8 101.9% 716 586628
2 2 25 664,407 667,510 12 100.5% 1,101 605All 62 518,309 524,193 10 101.1% 876 595
2 1 2 533,250 542,900 2 101.8% 864
Table 22: Summary of Condos Sold at 1
3. THE ESPLANADE
Project Name Address New/Cnv Year Blt Year Cnv Units
The Esplanade is a very high-end condominium development o
The Cohen Companies, a Boston-based developer, owner and
manager of commercial and residential real estate. The project w
f
as
designed by world-renowned architect Moshe Safdie. The design of
two L-shaped towers steps back from the river from a three story base, creating landscaped 12’ x 18’
canopied terraces. The Esplanade features bays, balconies and floor-to-ceiling windows. Residents at The
Esplanade have the exclusive use of a health club with an indoor lap and wading pool, fully equipped
exercise room, his and hers saunas and a function/conference room. The condo fee is approximately $0.44
per square foot. Some of the notable features include:
The Esplanade 83 Cambridge Parkway New 1989 n/a 206
64 “A Good Investment” The Boston Globe, June 12, 2005.
79

• Terrace and/or balcony with wood decking at each residence.
• A Gathering Room for residents’ private parties and meetings.
• Four levels of secured resident parking, as well as guest parking.
• Double-glazed, floor-to-ceiling windows in each residence.
• An assigned storage locker for each residence.
• Fireplaces in 12th- and 13th-floor residences.
ndos Sold at 83 Cambridge Parkway 09/08/2004 – 31/05/2005 Table 23: Summary of Co
4. THE RIVER COURT CONDOMINIUMS
The River Court Condominiums built in 1989 at 10 Rogers Street is a high-
rise residential development with a total of 160 one, two, and three-
units. Developed by H.J. Davis Co., it is a luxury property
club, lap pool, sauna/steam rooms a common rooftop terrace. River
ace, three levels of underground parking. Steffian
ding, included three courtyards to resolve the constraints of the
site, drawing upon European tradition to create environmental niches within the building. The units enjoy
views of the Charles River, Front Park and the Boston skyline. The association fee is about $0.44 per sq.
ft. The fee includes heat, water, sewer, master insurance, security, elevator, exterior maintenance,
a l, swimming pool, exercise room,
sauna/steam rooms.
bedroom
featuring 24-hour concierge, health
Court also incorporates 12,600 square feet of retail sp
Bradley Architects, designers of the buil
l ndscaping, snow removal, laundry facilities, refuse remova
Project Name Address New/Cnv Year Blt Year Cnv Unitstreet New 1989 n/a 160The River Court Condos 10 Rogers S
SOLD Mean Mean Mean Mean Mean SdPrice / Mean MeanBRs Baths # Units ListPrice SoldPrice DOM Mean ListPrice SF $/SF
1 1.75 2 615,500 605,000 97 98.3% 1,098 5591,473 601
All 2.06 8 864,750 822,516 128 95.1% 1,379 5902 2.17 6 947,833 895,021 139 94.4%
80
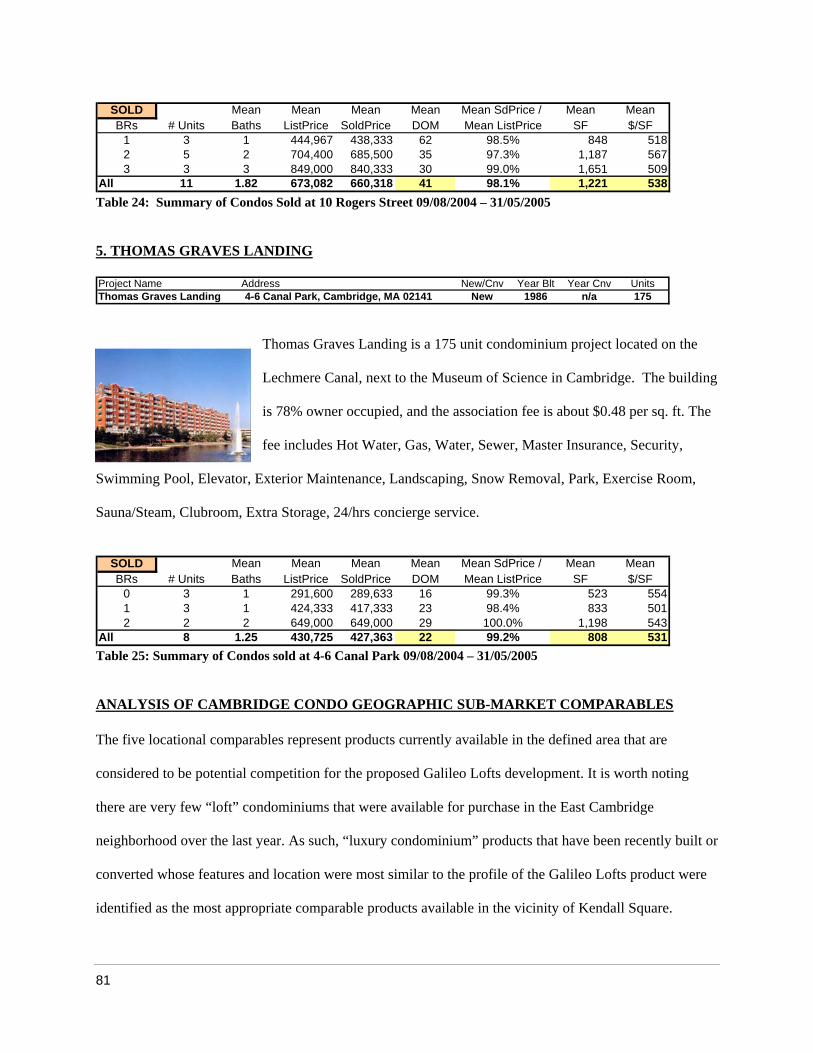
Table 2 S /2005
5. THO A
4: ummary of Condos Sold at 10 Rogers Street 09/08/2004 – 31/05
M S GRAVES LANDING
Thomas Graves Landing is a 175 unit condominium project located on the
Lechmere Canal, next to the Museum of Science in Cambridge. The building
is 78% owner occupied, and the association fee is about $0.48 per sq. ft. The
ance, Security,
, Landscaping, Snow Removal, Park, Exercise Room,
, Extra Storage, 24/hrs concierge service.
fee includes Hot Water, Gas, Water, Sewer, Master Insur
Swimming Pool, Elevator, Exterior Maintenance
Sauna/Steam, Clubroom
Table 25: Summary of Condos sold at 4-6 Canal Park 09/08/2004 – 31/05/2005
ANALYSIS OF CAMBRIDGE CONDO GEOGRAPHIC SUB-MARKET COMPARABLES
The five locational comparables represent products currently available in the defined area that are
considered to be potential competition for the proposed Galileo Lofts development. It is worth noting
there are very few “loft” condominiums that were available for purchase in the East Cambridge
neighborhood over the last year. As such, “luxury condominium” products that have been recently built or
converted whose features and location were most similar to the profile of the Galileo Lofts product were
identified as the most appropriate comparable products available in the vicinity of Kendall Square.
Project New/Cnv Year Blt Year Cnv UnitsThomas Graves Landing 4-6 Canal Park, Cambridge, MA 02141 New 1986 n/a 175
Name Address
SOLD Mean Mean Mean Mean Mean SdPrice / Mean MeanBRs # Units Baths ListPrice SoldPrice DOM Mean ListPrice SF $/SF
0 3 11 3 1 424,333 417,333 23 98.4% 833 5012 2 2
All 8 1.25
291,600 289,633 16 99.3% 523 554
649,000 649,000 29 100.0% 1,198 543430,725 427,363 22 99.2% 808 531
SOL / Mean MeanBRs # Units Baths ListPrice SoldPrice DOM Mean ListPrice SF $/SF
1 848 5182 5 2 704,400 685,500 35 97.3% 1,187 5673 1,651 509
All 1,221 538
D Mean Mean Mean Mean Mean SdPrice
3 1 444,967 438,333 62 98.5%
3 3 849,000 840,333 30 99.0%11 1.82 673,082 660,318 41 98.1%
81

It is important to recognize a key variable that is consistent in the identified properties that is lacking at
the proposed Galileo Lofts site: that being the proximity to water, in this case the Charles River. As
repeatedly confirmed by residential brokers, and common sense, one of the key historic factors drawing
nd views. It should be
y continue to demonstrate an affinity to waterfront
properties. Given that the majority of luxury condos in Cambridge are water adjacent it is difficult to
statistically hypothesize a premium for water frontage, suffice to say it is implied.
An analysis of the sales data for the five
$552, with an average sales price of $47
market increases with sales price, which is strongl
units (studio and one-bedroom the
In an effort to identify the relative value of underground parking analysis was conducted using the 5
comparable properties. Sales data was sorted according to number of bedrooms, bathrooms, and number
the luxury buyer to Cambridge was the opportunity to have water front access a
noted that the “top of the line” buyer will likel
comparables illustrates a mean sales price per square foot of
9,505. Noteworthy observations include the average time on the
y correlated with unit size. Simply speaking, the smaller
s) with lower sales price tend to have been purchased more quickly than
larger units (2+ bedrooms).
Table 26: Sales Summary of Locational Comps 09/08/2004 – 31/05/2005
of indoor parking stalls. Sales data illustrates parking stalls were on average $30,000 - $55,000 (approx
$50/SF premium).
SOLD Min Max Mean Min Max Mean Mean Mean SdPrice / Mean Mean$/SF
5 493552
5 586532
4 6280 5291 559
92 94.4% 1,701 65249 99.2% 1,720 484
3 2.5 2 849,000 859,000 854,000 830,000 859,000 844,500 21 98.9% 1,617 522All 479,638 479,505 861 552
BRs Baths # Units ListPrice ListPrice ListPrice SoldPrice SoldPrice SoldPrice DOM Mean ListPrice SF0 1 12 240,399 299,900 268,663 240,399 299,900 267,338 16 99.5% 541 1 76 266,987 575,694 373,627 266,987 575,694 376,951 19 100.9% 6801 1.5 1 472,000 472,000 472,000 460,000 460,000 460,000 69 97.5% 781 2 1 759,000 759,000 759,000 750,000 750,000 750,000 124 98.8% 1,4102 1 2 525,400 541,100 533,250 529,100 556,699 542,900 2 101.8% 862 1.5 1 525,000 525,000 525,000 513,000 513,000 513,000 77 97.7% 972 2 50 412,000 1,100,000 618,660 430,000 1,045,000 618,322 33 99.9% 1,102 2.5 3 899,000 1,495,000 1,181,333 883,999 1,360,000 1,114,6663 2 1 839,000 839,000 839,000 832,000 832,000 832,000
82

SOLD Garage Mean Mean Mean Mean SdPrice / Mean MeanBRs Baths Pkg # Units ListPrice SoldPrice DOM Mean ListPrice SF $/SF
0 1 0 8 256,932 255,683 18 99.5% 555 4630 1 1 1 293,692 293,692 1 100.0% 531 5531 1 0 18 328,223 332,494 22 101.3% 635 5231 1 1 55 385,720 389,298 17 100.9% 687 5652 2 0 11 536,509 554,868 39 103.4% 1,036 5342 2 1 34 640,776 635,002 29 99.1% 1,111 569
All 0 5131 566
Table 27: Summary of Parking Premium Price/SF of Comparable Units
6.3 Loft Product Submarket
HISTORIC SALES ANALYSIS
In an effort to complement the findings of the geographic submarket historic sales analysis, further
ect
e) and typically large windows. Condominium sales data was sorted by zip
code and all transactions occurring within the defined 5-mile radius for the one year period from June
analysis was conducted using the “loft” product submarket within a 5 mile radius of the proposed proj
site. It was determined and generally agreed that the loft market represented the closest comparable
product type to the units being developed in conjunction with the Galileo Lofts proposal. For the purposes
of this analysis a “Loft” product was defined as being a residential unit with an open floor plan, and high
ceilings (11’ – 16’ on averag
2004 to June 2005 was compiled. The data set was then searched by the keyword “loft”, appropriate
transactions were then reviewed line by line to ensure the product was consistent with the above
definition of a “loft”. Any properties that did not meet the above criteria, or were incomplete were
removed from the data set.
SOLD 0 Med Mean Med Mean Med Mean Sold Price/ Mean Mean Med. Mean Med. MeanBRs # Units ListPrice ListPrice SoldPrice SoldPrice DOM Mean List Price BRs Baths SF SF $/SF $/SF
1.03 899 930 354 3761.17 890 969 383 405
2 112 509,000 579,793 510,000 568,665 41 98.08% 1.67 1,269 2189 417 429362
All 278 439,000 482,931 431,000 475,357 30 98.4% 1.6 1.4 1,136 1,521 384 406
0 31 284,900 350,429 279,000 349,918 36 99.85%1 107 359,000 393,718 346,000 387,840 26 98.51%
3 26 469,000 579,723 469,000 571,635 21 98.60% 1.94 1,513 1556 3614 2 627,000 627,000 625,000 625,000 18 99.68% 2.00 2,370 2370 261 261
Table 28: Summary of Loft Condominiums Sold in 5 Mile Radius 6/1/04 – 5/31/05
83

A noteworthy observation is that the Average Sold Price in the loft submarket was higher than that in the
locational condo submarket, $475,593 (lofts) and $42,806 (condos) the average sold price per square foot
is higher in the condo submarket ($452/sf and $406/sf).
– 5/31/05
NALYSIS
1,400,000
1,200,000
0
200,000
400,000
600,000
800,000
1,000,000
0 500 1000 1500 2000 2500 3000
Unit Floor Area (SF)
List
Pric
e ($
)
1,600,000
1,800,000
Figure 27: Scatter Plot of List Price ($) as a function of Unit Floor Area (SF) for Lofts sold from 6/1/04
LINEAR REGRESSION A
The methodology described in section 6.1 was repeated using the historic sales data for Loft Products
located within a 5-mile radius of the proposed project site. The data was first graphed, one outlier was
oved and a linear regression was conducted. rem
84

Table 29: Summary Output of Linear Regression Analysis for Loft Sales.
As expected, year, baths, floor area, and building style were significantly correlated with variation in
price; however, somewhat unexpectedly parking did not demonstrate a statistically significant
relationship. Further, the R2 in this regression was only 59.83% suggesting that only
variance in list price can be attributed to the defined variables. It was hypothesized that due to the
geographic heterogeneity of the sample, locational effects (and others) were not being account
the regression analysis.
In order to define a data set wherein some of the other “Major Value Drivers” could be quantifi
list
about half of the
ed for in
ed
ansactions data for comparable loft properties was collected. The loft transaction data was sorted by
ties
was then researched and quantified with respect to its location, age, and amenities. The properties were all
each advertises a comparable high level of finish and
Figure 28 below.
R Square 59.83%
Regression StatisticsMultiple R 77.35%
Adjusted R Squar 58.94%Standard Error 144398.4159
ANOV
Observations 277
Adf SS MS F Significance F
Regression 6 8.38654E+12 1.39776E+12 67.03575393 1.11676E-50Residual 270 5.62974E+12 20850902502Total 276 1.40163E+13
Coefficients Standard Error t Stat P-value Lower 95% Upper 95% Lower 95.0% Upper 95.0%Intercept -184105.788 43306.214 -4.251 0.000 -269366.583 -98844.992 -269366.583 -98844.992Year* 47760.060 14008.630 3.409 0.001 20180.023 75340.097 20180.023 75340.097Beds 6999.752 13705.570 0.511 0.610 -19983.622 33983.127 -19983.622 33983.127Baths* 55186.160 22805.144 2.420 0.016 10287.645 100084.675 10287.645 100084.675FlrArea*** 359.929 28.577 12.595 0.000 303.667 416.191 303.667 416.191BlgStyle** 52779.671 9076.571 5.815 0.000 34909.819 70649.523 34909.819 70649.523Pkg 17735.357 18895.474 0.939 0.349 -19465.844 54936.558 -19465.844 54936.558
tr
address, and properties with a minimum number of 10 transactions were extracted. Each of the proper
constructed (or converted) in the last 2 years, and
amenities. Data for nine properties were collected, and the sales transactions are illustrated in
85

0
500
0 200,000 400,000 600,000 800,000 1,000,000 1,200,000 1,400,000 1,600,000
Sales Price
U
1000
2000
2500
3000
nit 1500 A
rea
Figure 28: Scatter Plot of Loft Comps Sales Price related to Unit Area
8 335 West 2nd Street, South Boston, MA 02127
Project Name Address1 Court Square Press 9 West Broadway, South Boston, MA 022102 Paris Landing 42 Eighth Street, Charlestown, MA
4 The Foundry 320 W. 2nd St, South Boston, MA 021275 Strada 234 226-234 Causeway Street, Boston, MA 021146 Charleston Lofts 210 Broadway, Everett, MA 021497 316 Ringe Ave., Cambridge MA, 02140
9 80 A Street, South Boston, MA 02127
3 MacCallen Building 140 Dorchester Avenue, South Boston, MA 02127
Table 30: Comparable Loft Properties
The two “outliers” (sales over $1.3 million) were removed from the sample and regression analysis was
onducted. The following previously defined variables were used:
• ListMos: The Month the property was listed was assigned a numerical value from Jan. 1, 2003
to June 31, 2005.
• FlrArea: The unit floor area is measured as the square feet of the unit.
c
86

• Beds: The real number of bedrooms in the unit.
• Baths: The real number of bathrooms in the unit.
• Pkg: The real number of parking spaces included with unit price.
• Style: Building types were assigned the following values: Townhouse/Duplex = 1; Low-rise =
2; Mid-rise = 3; Hi-rise = 4.
To further investigate the loft submarket, new variables were created. Given the data sample targets a
fairly broad geographical area, a variable to account for the effects of location was created (Location).
The comparable properties constitute five different geographical locations, which were coded on the
following numerical scale: 1) North End, 2) South Boston, 3) Charlestown, 4) North Cambridge, and 5)
Everett. The scale demonstrates a movement away from the central business district of downtown Boston.
Many loft products currently on the market in Boston are conversions of old warehouse or industrial
buildings, to capture the possible effects of new construction versus historic conversion, a variable
NewConst was created to reflect those properties that are “new”. Finally, one of the most obvious factors
in hi-end residential development in Boston is the proximity to water. To reflect this dimension, a scale
was created to reflect the project’s proximity to water: 0) not close to water, 1) within 2 blocks of water
(i.e. potential views and/or access), 3) waterfront. The results of the analysis are illustrated below.
Regression StatisticsMultiple R 90.29%R Square 81.53%Adjusted R Square 80.77%Standard Error 121424.434Observations 227
df SS MS F Significance F
Total 226 1.7324E+13
% Upper 95% Lower 95.0% Upper 95.0%Intercept -264135.792 73995.539 -3.570 0.000 -409977.762 -118293.823 -409977.762 -118293.823FlrArea*** 570.466 35.820 15.926 0.000 499.866 641.065 499.866 641.065ListMos*Location*Beds**Baths 30950.510 0.660 0.510 -40583.537 81420.667 -40583.537 81420.667Style* 13955.959 2.720 0.007 10460.492 65473.661 10460.492 65473.661Pkg 19422.129 0.059 0.953 -37137.052 39423.281 -37137.052 39423.281NewCon -61954.813 34437.504Water** 62949.329 141041.316
ANOVA
Regression 9 1.41245E+13 1.56939E+12 106.4436791 1.54648E-74Residual 217 3.19942E+12 14743893181
Coefficients Standard Error t Stat P-value Lower 95
5317.625 1514.633 3.511 0.001 2332.349 8302.901 2332.349 8302.901* -50603.116 8454.486 -5.985 0.000 -67266.539 -33939.693 -67266.539 -33939.693
-79393.391 19807.871 -4.008 0.000 -118433.837 -40352.945 -118433.837 -40352.94520418.56537967.0761143.114
st -13758.655 24453.185 -0.563 0.574 -61954.813 34437.504101995.323 19810.685 5.149 0.000 62949.329 141041.316
87

Table 3 S of Loft Comparables
The R2 portion of variance in list price was captured
by the l vertical location) would be
expect to
consistentl level, as such there is no way to determine the vertical location
of the units in question.
1: ummary Output of Linear Regression of ListPrice
in this case was 81.53%, illustrating that a significant
inc usion of additional variables. It should be noted that unit floor (i.e.
ed be associated with variance in ListPrice; unfortunately, MLS transaction listings do not
y list unit numbers or building
LOG PRICE REGRESSION ANALYSIS
conducted.65 To produce the analysis, the natural log of the dependent variable (ListPrice) was calculated
affecting variance in ListPrice.
In keeping with the methodology used for the condo data, a second “one-sided” log regression was
and constituted the “left side” of the regression equation. The independent variables were then converted
to dummy variables. For each variable a “base case” was defined and excluded from the regression. The
analysis enables the interpretation of the coefficients as a percentage measure of relative magnitude
65 See Section 6.1 for detailed explanation.
88

Table 32: Summary Output of Regression: Variables Related to Log (ListPrice)
By converting the independent variables into a binary series related to the log of ListPrice, it is possible to
interpret the coefficients as a percentage measure of relative magnitude affecting variance in ListPrice. In
each case a “base condition” is used as the benchmark; for example, in the case of Style, low-rise is t
base case, this enables the interp
he
retation of coefficients from the base case. The coefficients should not be
interpreted as absolute measure of the relationship, but are appropriate to give a general sense of the
magnitude of ListPrice fluctuation. It should be noted the variable “water” was removed as it was found
to be linearly related to “location” in this set (i.e. the information was “doubled”); however, it should be
acknowledged that proximity to water is consistently associated with higher condominium prices.
Based on the output of the regression, it appears that for the given sample data, there was roughly a 14%
price appreciation from listing made in 2004 and those in 2005. This value is much higher than that in the
geographic analysis (recall 5%); while it is presumed a 14% appreciation is exaggerated, it is consistent
with the increased popularity of loft units in the last few years. As one would expect, there is a negative
correlation between location (as one moves away from the CBD) and ListPrice. Because the
neighbor y one or two properties, it is not reasonable to presume the
coefficients are definitive percentages, but it is noteworthy to recognize the decrease in price. Building
R Square 92.18%
Regression StatisticsMultiple R 0.960117347
Adjusted R Square 91.67%Standard Error 12.76%Observations 227
ANOVAdf SS MS F Significance F
Regression 14 40.68127835 2.905805596 178.5625361 6.8203E-109Residual 212 3.449944204 0.016273322Total 226 44.13122255
Coefficients Standard Error t Stat P-value Lower 95% Upper 95% Lower 95.0% Upper 95.0%Intercept 12.073 0.095 126.688 0.000 11.885 12.260 11.885 12.260
SQ(FlrArea) 0.000%Year(2004) -2.710%
FlrArea** 0.112% 0.000 10.282 0.000 0.001 0.001 0.001 0.0010.000 -3.740 0.000 0.000 0.000 0.000 0.0000.043 -0.626 0.532 -0.112 0.058 -0.112 0.058
Year(2005)* 13.954% 0.042 3.330 0.001 0.057 0.222 0.057 0.222SouthBoston* -14.528% 0.042 -3.480 0.001 -0.228 -0.063 -0.228 -0.063Charlestown* -29.773% 0.055 -5.412 0.000 -0.406 -0.189 -0.406 -0.189N. Cambridge*** -72.909% 0.053 -13.630 0.000 -0.835 -0.624 -0.835 -0.624
0.000 -0.557 -0.365 -0.557 -0.3650.012 0.018 0.148 0.018 0.1480.007 0.028 0.176 0.028 0.176
1 Pkg** 19.926% 0.033 6.042 0.000 0.134 0.264 0.134 0.264
2+ Baths 9.247% 0.047 1.955 0.052 -0.001 0.186 -0.001 0.186
Everett** -46.091% 0.049 -9.468Mid-Rise* 8.320% 0.033 2.520Hi-Rise* 10.164% 0.038 2.710
2 Pkg* 10.721% 0.038 2.792 0.006 0.032 0.183 0.032 0.1832+ Beds 4.278% 0.080 0.532 0.596 -0.116 0.201 -0.116 0.201
hoods are often represented by onl
89

type was demonstrated to have a positive relationship with ListPrice, with units in Mid-Rise buildings
being roughly 8% higher than low-rises, and hi-rises 10% higher than mid-rise buildings. It is
to interpret this finding is at least partially impacted by the buyer’s access to views, light and
buildings. There was roughly a 20% premium on transactions including one parking stall (over a base
case of no parking) and an 11% premium for an additional stall (2 total).
6.4 Loft Product Sub-Market: Comparable Units
Given the lack of “loft” products that have been historically available in the East Cambridge area, it was
considered appropriate to do an investigation of product comparables, focusing specifically on those
reasonable
air in higher
ity to the Red Line.
Five appropriate comparable properties were identified through market research, and were confirmed by
local Residential Broker Pam McKinney66 and MLS market data for the dates of August 2004 thru June
1st, 2005 were compiled for analysis. The individual property statistics are included with each property
summary. The comparables represent the newest products currently available in the defined area.
$475$505$562
9 Charleston Lofts 210 Broadway, Everett, MA 02149 New 2004 n/a 200 684 - 1,850 250 - 626 $378
projects which share characteristics of the Galileo Lofts product, as well as proxim
New/ Year Year # Unit Unit
1 Court Square Press 9 West Broadway, South Boston, MA 02210 Cnv 1906 2004 119 750 - 2770 399 - 1,500 $5102 Channel Center 35 Channel Center Street, South Boston, MA 02210 Cnv 1912 2004 44 n/a 141 - 1,050 n/a2 Channel Center 25 Channel Center Street, South Boston, MA 02210 New 2004 n/a 76 n/a 504 - 2,315 n/a3 Aberdeen Lofts 1 Aberdeen Way, Cambridge, MA 02138 Cnv 1914 2005 55 682 - 1,567 360k - 690k $4904 Paris Landing 42 Eighth Street, Charlestown, MA Cnv 1800 2004 367 579 - 1400 250 - 650 $4965 MacCallen Building 140 Dorchester Avenue, South Boston, MA 02127 New 2005-06 n/a 144 663 - 2,755 520 - 2,100 $6826 323 at Cypress Lofts 323 Boylston Street, Brookline, MA 02445 New 2005 n/a 29 499 - 880 1,082 - 1,7097 Building Five Lofts 80 Elmwood Street, Somerville, MA 02144 Cnv 1900 2003 n/a 992 - 1,94 485 - 9958 Strada 234 226-234 Causeway Street, Boston, MA 02114 Cnv 1910 2002 108 940 - 1,460 529 - 995
UnitProject Name Address Cnv Blt Cnv Units Sizes (SF) Prices (K) $/SF
Table 33: Summary of Comparable Loft Products
From interview with Pamela McKinney, op. cit. July 18 , 2005. 66 th
90

1. COURT SQUARE PRESS CONDOMINIUMS
The Court Square Press Building stands at the head of the Fort Point Channel in South Boston, across the
street from the Broadway Red Line “T” Station. Originally constructed in 1906, the building contains
over 210,000 square feet arranged in a six-story rectangle surrounding an open central courtyard. The
building initially housed the factory and offices of the Macallen Manufacturing Company; by mid-century
the building was taken over by its current namesake - the Court Square Press Company. Court Square
enjoys recognition as a Significant Structure by the Boston Landmarks Commission, and is an example of
20th Century brick-and-beam construction.
The majority of the loft-style units feature exposed brick and 11+ foot ceilings supported by the original
heavy wood timbers. Many of the new construction units include floor-to-ceiling glass in several living
zing staggered-stud acoustically
insulated construction were installed in an effort to minimize noise transfer between apartments. Each
Project Name Address New/Cnv Blt Cnv UnitsCourt Square Press 9 West Broadway, South Boston, MA 02210 Cnv 1906 2004 119
rooms. A thick concrete floor-topping and new demising walls utili
91

individual residence has its own forced-air unit for heating and cooling. The building is pre-wired for
telephone, cable, satellite television and high-speed Internet throughout. Open kitchens in every unit
a list price
2. CHANNEL CENTER
feature gas cooking and top of the line stainless steel appliances from brands such as JennAir and Bosch,
countertops are granite. Garage will be available in 20 months in phase II Macallen building at
of $40,000 - $60,000 per stall.
Table 34: Summary of Court Square Press Units SOLD and UAG 06/01/04 - 07/22/05
35 Channel Center is a $17 million dollar conversion of a five-story,
103,000 square foot warehouse building into 44 loft-style condominium
units which have sold-out since they were ready for occupancy in March
ows
Two buildings, 25 and 35 Channel Center, constitute the first phase (about 20%) of the Beacon Capital
Partner’s new mixed use development at Channel Center. Located in South Boston across the Summer
Street Bridge from South station (and Red Line T-stop), the project is composed of new, and converted
condominium “loft” units.
2004. The units were designed to “retain their historic ambiance” and
feature high ceilings, exposed brick and timber, and finish concrete
floors over acoustic underlayment. Other features include new energy-efficient industrial scale wind
(placed in existing openings), individual climate control, high-speed internet-ready wiring, and
SOLD Mean Mean Mean Mean Mean SdPrice / Mean MeanBRs # Units Baths ListPrice SoldPrice DOM Mean ListPrice SF $/SF
1 9 1.5 477,690 537,919 82 112.6% 980 5382 9 2.1 573,100 567,100 143 99.0% 1,179 4833 1 1.0 1,470,000 1,480,496 363 100.7% 2,766 535
All 20 1.80 566,355 591,283 120 104.4% 1,153 510
UAG Mean Mean Mean Mean Mean SdPrice / Mean MeanBRs # Units Baths ListPrice SoldPrice DOM Mean ListPrice SF $/SF
1 7 1.5 653,571 0 64 0.0% 1,175 5652 10 2.3 885,080 0 62 0.0% 1,490 583
All 17 1.94 789,753 0 63 0.0% 1,360 576
92

contemporary kitchens with custom cabinetry, granite counters, stainless steel appliances, and task and
ambient lighting.
25 Channel Center is a new $35 million dollar, 13 story, 184,000 square
foot property featuring 76 units on 12 floors. Completed in June 2004,
many different floor plans are available, including 2-story open plans,
ata; the Warren sales data do not include unit areas, or parking information. The average list price for
price for newly-
constructed units at 25 Channel Center is $854,000.
flats and penthouses. Several units have balconies, skylights and views of
the city. All residences feature Viking kitchen appliances, four-fixture bathrooms, wall-of-glass windows,
garage parking, and concierge services.
The Channel Center is not listed with MLS, therefore sales data was collected from the Warren Group
d
the converted units at 35 Channel center is $498,000 (sold out), and the average list
3. ABERDEEN LOFTS, 1 ABERDEEN WAY, CAMBRIDGE, MA 02138
Developed by Prospectus LLC a New England based developer, and designed by Bargmann Hendrie +
Archetype, Inc. (BH+A) a Boston-based architectural firm, the 55 unit project is targeted for occupancy
lding was used for lumin the fall of 2005. Built in 1914, the bui ber storage, then as a laundry supply, then
n r
book storage (by the Coop) and
10 minutes by public transportat
renovated into 55 condos, priced
internal staircase. There will be of
nd vel.
Every unit will have one deeded parking space in the outdoor lot. Additional parking will be available for
as a factory (first for uniforms a d coats and later for wooden boxes). More recently it has been used fo
as office space. The project is located two blocks from Brattle Street and
ion to Harvard Square. The existing 2-story brick building is being
from $360,000 to $690,000. Each unit will be on 2 levels with an
3 types of units: 1-bay, 1.5-bay, and 2-bay. “Bay” refers to the width
the unit and the windows. Unit sizes will range from 682 sf to 1,567 sf. All units will have a full
bathroom on the first level. The 1.5-bay and 2-bay units will have a 2 bath on the mezzanine le
93

purchase on a first-come, first-serve basis. The kitchen counters will be Black Raven granite. The kitche
cabinets will be wh
n
ite wood with raised panels. Kitchens will include Bosch gas cook-tops, electric wall
ovens, built-in microwaves and dishwashers; GE Profile refrigerators. All stainless steel appliances,
disposals and CAT-5 wiring throughout. 13 of the first floor units will have a small private
mmon outdoor area that will be landscaped with trees, benches and lighting.
e
een
t price per square foot which decreases
proportionately from smaller to larger units. In addition, for this to story building, when identical units are
compared (i.e. units 114 and 214) there is an average premium of $20,000 for the second floor unit.
InSinkErator
patio. There will be a large co
The product available at Aberd en Lofts is in many ways comparable to the product proposed for Galileo
Lofts. There are several pertinent observations to be drawn from the analysis of the listings at Aberd
Lofts. The smaller 1-bay units command the highes
Table 35: Current Listing for Aberdeen Lofts, July 2005-07-31
4. PARRIS LANDING, 42 EIGHTH STREET, CHARLESTOWN, MA
Located in the historic neighborhood of Charlestown Navy Yard, Parris Landing is an existing residen
being upgraded and converted to condominium units by celebrity designer and architect Philippe Stark
ce
1-Bay: 1-Bed, 1-Bath 1.5 Bay: 1-Bed, 2-Bath 2-Bay: 2-Bed, 2-BathUnit # Unit Area List Price Status $/SF Unit # Unit Area List Price Status $/SF Unit # Unit Area
105 765 $375,000 Available $490 107 993 $480,000 Available $483 101 1,392List Price Status $/SF
$670,000 Available $481106 765 ---- Reserved 108 898 $465,000 Available $518 102 1,506 $670,000 Available $445
126 730 $360,000 Available $493 119 993 $480,000 Available $483 203 1,259 $650,000 Available $516
211 765 ---- Reserved 122 980 $470,000 Available $480 227 1,424 $680,000 Available $478
218 765 $380,000 Available $497 209 993 ---- Reserved
222 980 $490,000 Available $5007
111 765 ---- Reserved 109 993 $480,000 Available $483 103 1,259 $620,000 Available $492112 748 ---- Reserved 110 920 $465,000 Available $505 104 1,248 $600,000 Available $481117 765 $375,000 Available $490 113 993 $480,000 Available $483 127 1,429 $650,000 Available $455118 765 $370,000 Available $484 114 993 $480,000 Available $483 128 1,312 ---- Reserved123 722 $370,000 Available $512 115 955 $480,000 Available $503 201 1,392 $690,000 Available $496124 765 $375,000 Available $490 116 955 $470,000 Available $492 202 1,567 $680,000 Available $434
205 765 $395,000 Available $516 120 993 ---- Reserved 204 1,248 $620,000 Available $497206 765 $380,000 Available $497 121 1,083 $480,000 Available $443 225 1,046 ---- Reserved
212 765 $380,000 Available $497 207 993 ---- Reserved 228 1,312 ---- Reserved217 765 $395,000 Available $516 208 993 ---- Reserved
219 682 ---- Reserved 210 993 $490,000 Available $493221 682 $365,000 Available $535 213 993 $495,000 Available $498223 682 ---- Reserved 214 993 $490,000 Available $493224 765 ---- Reserved 215 955 ---- Reserved226 730 $375,000 Available $514 216 955 ---- Reserved
220 993 $490,000 Available $493
Mean Values: $376,538 $502 $480,313 $490 $653,000 $47
94

and his design firm YOO. The project includes the renovation of 367 units of studios, one, and two-
bedrooms. The listing prices range from the mid $200,000 to mid $600,000. Each unit includes one
parking stall in structured above ground parking. Located in the Navy Yard, the project has waterfron
access and is adjacent to a water taxi system that runs to downtown Boston’s Financial District. The
purchase price include a number of upgrade options, including choice of new entry and bath flooring
t
choices of ceramic tile, marble tile, or hardwood, new stainless steel appliances & fixtures, granite
counters in kitchen, and new plush carpet in bedrooms. Amenities include a new business center, pool &
sundeck, courtyard & community spaces.
Table 36: Summary of MLS Listings for Parris Landing 42 Eighth Street, Charlestown, MA June 2004 – June 2005
7
1-Bed, 1-Bath 2-Bed, 2-BathUnit # Unit Area List Price Status $/SF Unit # Unit Area List Price Status $/SF
4302 782 425,900 ACT $545 1202 947 527,900 ACT $5575309 624 399,900 ACT $641 1503 1281 547,900 ACT $428
579 339,000 PCG $585 5514 1217 579,900 UAG $4761308 682 299,500 UAG $4394104 720 381,900 UAG $530
n Values: $360,800 $534 $506,140 $445
2318 681 301,500 SLD $443 1302 926 381,500 SLD $4125304 679 377,900 SLD $557 5306 1400 493,500 SLD $353
Mea
5. THE MACALLEN BUILDING, 140 DORCHESTER AVENUE, SOUTH BOSTON, MA 0212
Developed by local developers Pappas Enterprises (See Court Square Press Condos), the Macallen
Building Condominiums is an 11-story residential building which will be situated at the intersection of
South Boston, the South End, The Fort Point Channel Arts District, and the Financial District. The
project is scheduled to open in the fall of 2006. The Macallen Building will incorporate 144 units as well
as three-and-a-half levels of structured parking with a total capacity of 289 cars.67
67 http://www.bostonmagazine.com/citystyle_2005/index.php?text=macallen.txt
95

The Macallen is a modern design by Design Architects, Office dA, recipients of the 2002 Harleston
Parker Medal, and Architects of Record Burt Hill Kosar Rittleman and Associates. Macallen touts lu
amenities such as an elevated terrace garden, screening room, gym, pool, and spa. Additionally, the
building is across the street from the MBTA Red Line Broadway stop. There are eight different floor
plans per building level, many of which include roof decks, balconies, or gardens.
xury
This building will be the first of a series of green buildings to be developed by Pappas Enterprises, Inc.,”
says Tim Pappas, vice president. “We feel ecologically responsible real estate development is the only
way forward.”68 Macallen will serve as a model of innovative, sustainable green design for urban housing
Table 37: Summary of MLS Listings for Macallen Big, June 2004 – June 2005.
development. The building was designed to capture the most natural light, promote healthy living
conditions and reduce energy consumption. Macallen will also feature a sustainable, “green roof” that
will not only reduce storm water runoff volumes, but will also offer landscaped views to the surrounding
neighborhood. Pappas Enterprises intends to seek LEED (Leadership in Energy and Environmental
0-Bed, 1-Bath 1-Bed 2-BedUnit Area List Price Status $/SF Unit Area # Baths List Price Status $/SF Unit Area List Price # Baths Status $/SF
812 519,900 ACT $640 1006 1 578,090 ACT $575 1530 869,900 2 ACT $569792 519
Design) Certification from the U.S. Green Building Council.
,900 ACT $656 1324 1 764,900 ACT $578 1605 1,134,600 2 ACT $7071113 829,900 ACT $746 1100 1 636,900 ACT $579 1288 839,900 2 UAG $652792 599,900 ACT $757 1327 1 769,900 ACT $580 1701 944,255 2.5 ACT $555727 641,900 ACT $883 1109 1 671,900 ACT $606 1720 959,900 2.5 ACT $558
1700 1.5 1,209,900 ACT $712 1892 1,481,900 2.5 ACT $783
All: $620,200 $790 $790 $753,245 $639 $1,215,005 $657
663 610,000 ACT $920 977 1 679,900 ACT $696 1359 899,900 2.5 ACT $662667 619,900 ACT $929 1055 1 669,900 UAG $635 1855 1,409,900 2.5 ACT $760
1009 1.5 899,900 ACT $892 2315 1,424,900 2.5 UAG $6161195 2 675,500 ACT $565 2158 1,299,900 3 ACT $6021194 2 728,900 ACT $610 2755 2,100,000 3 ACT $762
68 Reported by: Michèle M. Meagher, Globe Magazine “Be It City, Country or In-Between Revel in the Lap of Luxury”, The Boston Globe, May 20, 2005.
96

6. 232 AT CYPRESS LOFTS, 323 BOYLSTON STREET, BROOKLINE, MA 02445
Cypress Lofts Phase I consists of 45 luxury loft-style condominiums, one unit of ground-floor retail, and
124 underground parking spaces. Demand for this project has been very strong, with all units under
agreement prior to completion of construction. Amenities include concierge service, hardwood floors,
granite countertops, stainless steel appliances, and full size washer/dryers in each unit. The project is
located steps from the Brookline Hills MBTA stop (“D” Green Line). The four-story project connects
new construction with a historic restoration of the Ritchie Building. The Ritchie Building is on the Area
Registry of Historic Places as the headquarters of the inventor of the liquid compass.
323 at Cypress Lofts (Phase II) will consist of 29 condominiums, 63 underground parking spaces, and
ground-floor retail space. Although it will be fully integrated and share concierge and other services with
Phase One, 323 will have its own distinct architectural identity. The design, by Spagnolo Gisness &
Associates, is a fresh, modern take on traditional urban living. All units will feature maple floors in the
living areas, premium Berber carpet in the bedrooms, and solid core doors with stainless steel hardware.
Kitchens will include solid wood kitchen cabinets, black granite countertops, stainless steel GE Energy
Star rated appliances, and recessed, under cabinet, and pendant lighting. Bathroom features will include
tumbled marble floor tiles, European-style vanities, granite counters, and “subway” tile tub and shower
surrounds accented with glass tile trim. And, many units will feature terraces, balconies and garden areas,
and exciting urban views.
97

Unit # List Price List Date SF #/SF Comments Unit # List Price List Date SF #/SF Comments101 UAG 02-Feb 1,616 Corner apartment
with yard401 UAG 02-Feb 1,453 Corner unit.
102 $499,000 01-Jan 1,082 $461 Apartment with yard 402 UAG 02-Feb 1,309 Corner unit.201 $639,999 02-Feb 1,533 $417 Corner unit. 403 $669,000 02-Feb 1,474 $454203 $639,000 02-Feb 1,474 $434 404 UAG 02-Feb 1,294205 $599,000 02-Feb 1,393 $430 Corner unit. 405 $649,000 02-Feb 1,393 $466 Corner unit.206 $665,000 02-Feb 1,592 $418 Corner unit. 406 UAG 02-Feb 1,560 Corner unit.301 UAG 02-Feb 1,533 Corner unit. 501 UAG 02-Feb 1,662 Dramatic view of Boston's s
private terrace.303 $639,000 02-Feb 1,474 $434 502 UAG 02-Feb 1,709 Dramatic view of Boston's s
private terrace.304 UAG 02-Feb 1,294 503 UAG 02-Feb 1,489 Spectacular with walk out
Table 38: Listings for 323 Boylston Street July 2005.
kyline with
kyline with
terrace.Spectacular with walk out terracePenthouse with walk out terrace. Dramatic views.
602 $695,000 2/1.5 1,231 $565 Penthouse with walk out terrace. .
0 s.f. terrace & noramic views.
604 $679,000 02-Feb 1,195 $568 Penthouse with 750 s.f. terrace &
305 $639,000 02-Feb 1,393 $459 Corner unit. 504 UAG 02-Feb 1,195306 UAG 02-Feb 1,560 Corner unit. 601 UAG 02-Feb 1,505
Dramatic views603 UAG 02-Feb 1,410 Penthouse with 75
spectacular pa
spectacular panoramic views.All: 617,143 $436 673,000 $513
98

6.5 Analysis of the Development Pipeline
In the years between 1970 and 2002, East Cambridge saw a supply of 754 newly constructed, and 175
converted condominium units come onto the market. This supply of roughly 1000 units over thirty years
lies in stark contrast to the 2,316 units currently in the pipeline, and scheduled for delivery in the next 36
– 48 months (4,467 units total including the remaining North Point Master Plan). The amount of new
stock scheduled for delivery by appears 2007 is startling; however, forecasters as CB Richard Ellis have
reported that the greater Boston area has demonstrated a history of pipeline schedules failing to
materialize. As written in their multi-housing 2004 overview “Our pipeline the schedule from two years
ago anticipated peak deliveries of in excess of 7,000 units for 2004, which obviously has not occurred.
Again, this is a result of delayed permits and poor market fundamentals. Despite the potential for in
excess of 10,000 units of deliveries in 2006, we do not expect that they will all get built, nor have a
material impact on the market.”69 The analysts at CB Richard Ellis further predict the amount of new
product scheduled for delivery in East Cambridge is a small fragment of the overall stock, as such it is
predicted the new stock will not have a significant impact on the demand for condominium housing,
particularly in the entry-level submarket.
Table 39: Summary of Residential Units in the Pipeline for East Cambridge
69 In CBRE Multi-Housing Year End Report 2004, page 4.
Project Address / Name Developer FAR Lot Area GFA Units Status350 Third Street Twinning Properties 3.00 0 357,000 321 In Construction1 First Street Leggat McCall Properties 4.10 72,418 291,006 199 In Construction303 Third Street Intell Cambridge LLC 3.90 148,693 579,779 526 Permitted450 Kendall Street Lyme Properties 3.00 0 46,293 8 Permitted1-25 East Street C.E. Smith / Archstone 2.90 247,431 935,215 767 PermittedNorth Point Building "S" Guildford/Spaulding Slye 2.66 19,500 113,955 99 PermittedNorth Point Building "T" Guildford/Spaulding Slye 2.66 32,000 236,223 230 PermittedRemaining NP Master Plan Guildford/Spaulding Slye 2.66 3,256,310 4,134,318 2,151 Permitted3 Cambridge Center Boston Properties 3.30 61,302 202,600 135 Permitting110 Second Street Jonathon Leavitt 1.95 19,995 39,000 31 PermittingTOTAL 3,857,649 6,935,389 4,467
99

Map 6: Projects in the Pipeline for East Cambridge
100

1. THE RESIDENCES AT KENDALL SQUARE
The residences at Kendall Square (350 Kendall
Street, adjacent to the Genzyme Building) are part of
a 1,300,000sqft mixed use development slated for
completion by fall 2005. Constructed on top of an
existing structured parking garage, the project
developed by Twinning Properties (with Lyme
properties) is a 24 story residential tower which will
contain 321 rental apartments, a 15,000 sq. ft. health
club, and 10,000 sq. ft. of retail space over an operational 4 story underground garage.
The residences will range from studio, one bedroom, one bedroom with den and two bedroom units with
walk-in closets/ dressing rooms, tiled bathroom with architectural faucets and designer lighting. Kitchens
will feature one-foot square porcelain tile floors and birch shaker style cabinets, individually controlled
heating and cooling, “green” washer/dryer, large windows, high-speed internet connectivity and telephone
service. The penthouse residences will have views of the Charles River, Cambridge, Back Bay, Beacon
Hill and the Harbor, deluxe carpeting and granite countertops and GE Profile appliances in the kitchen.
Project Address / Name Developer FAR Lot Area GFA Units Status350 Third Street Twinning Properties 3.00 0 357,000 321 In Construction
101
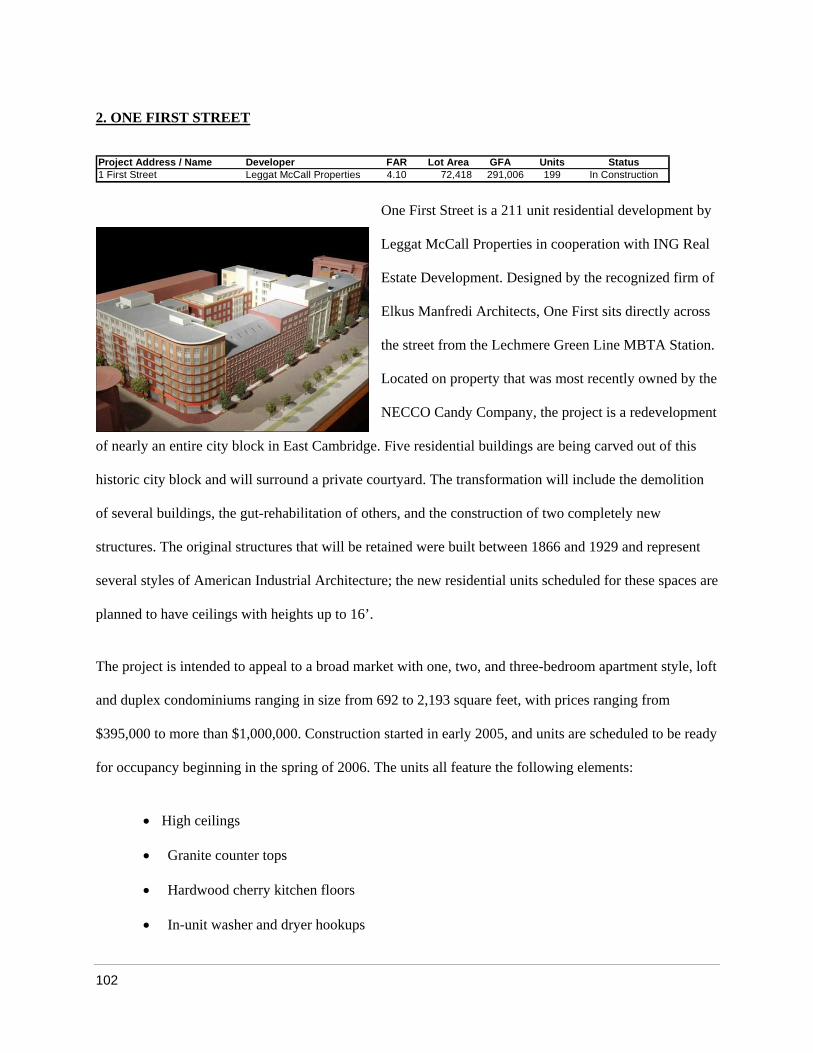
2. ONE FIRST STREET
One First Street is a 211 u y
Leggat McCall Properties in cooperation
Estate Development. Designed by the recognized firm of
Elkus Manfredi Architects, One First sits directly across
the street from ion.
Located on property that was most recently owned by the
NECCO Candy Company, the project is a redevelopment
ve residential
molition
of several buildings, the gut-rehabilitation of others, and the construction of two completely new
The project is intended to appeal to a broad market with one, two, and three-bedroom apartment style, loft
$395,000 to more than $1,000,000. Construction started in early 2005, and units are scheduled to be ready
for occupancy beginning in the spring of 2006. The units all feature the following elements:
• High ceilings
• Granite counter tops
• Hardwood cherry kitchen floors
• In-unit washer and dryer hookups
Project Address / Name Developer FAR Lot Area GFA Units Status1 First Street Leggat McCall Properties 4.10 72,418 291,006 199 In Construction
nit residential development b
with ING Real
the Lechmere Green Line MBTA Stat
buildings are being carved out of this
historic city block and will surround a private courtyard. The transformation will include the de
of nearly an entire city block in East Cambridge. Fi
structures. The original structures that will be retained were built between 1866 and 1929 and represent
several styles of American Industrial Architecture; the new residential units scheduled for these spaces are
planned to have ceilings with heights up to 16’.
and duplex condominiums ranging in size from 692 to 2,193 square feet, with prices ranging from
102

• Marble floor and vanity top in master bath
• Individually controlled heating and cooling
No customization is allowed, but the developers offer a choice of either standard or upgrade packages for
ving room, dining room and hall flooring.
t
of the 159 units in the first phase of the project h
the 23 units that are deemed affordable.70
kitchen appliances; cabinets and countertops; and li
According to John Soininen, project manager a Boston-based Leggat McCall, approximately 30 percent
ave been pre-sold, and there is already a waiting list for
70 Interv 5. iew with John Soininen. June 12, 200
103

3. 303 T IH RD STREET
303 Third Street is a 554,000 sq. ft. two-phase residential project that is planned to include both
condominium and rental units and is located in Kendall square, adjacent to the existing Volpe site. The
first phase is planned to begin in either the late 2005 or early 2006. The project incorporates a total of 527
units and 527 below grade parking stalls. Façade materials include pre-cast concrete, zinc “shingles”,
brick, and a terra cotta rain-screen system
4. 450 KENDALL STREET
Project Ad s t Area GFA Units Status303 Third e 148,693 579,779 526 Permitted
dre s / Name Developer FAR LoStre t Intell Cambridge LLC 3.90
Project Address / Name Developer FAR Lot Area GFA Units Status450 Kendall Street Lyme Properties 3.00 0 46,293 8 Permitted
104

450 Kendall Street is a residential component in Cambridge Research Park, which also includes proposals
me
t
es
ses. The ground and second floors are each approximately
12,000 gross square feet, and the second floor is planned to house Lyme Properties Corporate Head
450 Kendall Street and the adjacent landscaped park are the result of an international design competition
sponsored by Lyme Properties. The building architect is Architects Alliance of Toronto, and Landscape
design by Michael Von Valkenberg of New York and Cambridge. The project proposes eight “loft style”
residential condominiums delivered in a “luxury shell condition”. The building is intended to be of high
on the table for a hotel at 250 Kendall Street, and theater at 585 Kendall Street. Developed by Ly
Properties, and immediately adjacent to the Genzyme Building, 450 Kendall Street is a mixed-use projec
being developed as part of the Kendall Square development. The ground floor of the project is scheduled
for retail use, including at least one “fine dining” restaurant with outdoor seating. The other retail spac
are planned for a limited number of retail u
Office.
105

quality, and is planned to be constructed our of architectural grade concrete, with a curtain wall façade
system that incorporates clear anodized metal, vision glazing, and sandstone panels. The residential units
There are
In addition
es for
are going to be delivered completely unfinished, with only exhaust vents roughed into the ceiling. All
other layout, finishes and features, including all plumbing, are to be determined by the buyer.
two loft units per floor, each roughly 2,500 gross square feet. The top of the building features a
“penthouse suite” which takes up the whole floor, and includes a very large enclosed balcony.
to the private balconies on the upper two floors, there is a shared roof garden on level three for the
remainder of the residential units. It is worth noting that the original proposal includes private terrac
each of the loft units; these were subsequently deleted as a cost-savings measure.
4. NORTH POINT
“It’s a dreary patch of land: a 54-acre, underutilized rail and industrial facility in Cambridge, tucked
between Monsignor O’Brien Highway and the northern approaches to the Zakim-Bunker Hill Bridge.
And it is being hyped as the region’s “next great urban neighborhood.”
The North Point development includes a 5.5-acre “Central Park,” which will serve as the starting point for
a boulevard modeled on Boston’s Commonwealth Avenue, street-level retail, on-street parking and a
71 The vast majority of the site, 48
acres, is under the control of a joint venture between Guilford Transportation Industries of Portsmouth,
N.H., and Boston real estate firm Spaulding & Slye Colliers International. Guilford is a railroad and
airline concern owned largely by Timothy Mellon, son of the late philanthropist Paul Mellon.
71 th James McCown, “North Point Exposure”, Boston Business Journal, March 15 , 2002.
Project Address / Name Developer FAR Lot Area GFA Units StatusNorth Point Building "S" Guildford/Spaulding Slye 2.66 19,500 113,955 99 PermittedNorth Point Building "T" Guildford/Spaulding Slye 2.66 32,000 236,223 230 PermittedRemaining NP Master Plan Guildford/Spaulding Slye 2.66 3,256,310 4,134,318 2,151 Permitted
106

continuation of east Cambridge’s street grid. The plan, also calls for 2,300 to 2,700 units of residential
housing, 15 percent of which are required to be affordable housing; up to 2.2 million square feet of office
and industrial space; and 75,000 square feet of retail space.
Ground broke for phase 1 in March of 2005. This first phase is
reported to cost over $100 million72, and includes two
buildings, Building “S” and Building “T”, with 329
Condominium units. The architectural firms Childs Bertman
Tseckares (CBT) of Boston and architectsAlliance (aA) of
Toronto designed buildings “S” and “T” respectively. The
price range for most units is $300,000 to $500,000 with a few
as high as $700,000. Most one and two bedroom units will be
trapolation,
und
nits.
between 700 and 1,500 square feet, with the majority being 900 square feet. Based on pure ex
it appears these units will be priced at roughly $450 - 500 per square foot. The prices listed are
intentionally “on the low side”73 in an effort to lure first-time buyers to an unproven location. The gro
floor units on both S & T will be “town home-like”, with exterior doors and some with private stoops.
The current plan is to move Lechmere Station east, to the other side of Monsignor O’Brian Highway,
when NorthPoint is about half completed.
Building S is an 8-story loft-style residential building, which will contain 103 condominium u
Building S will feature one-bedroom units with 1.5 baths averaging approximately 900 square feet. The
72 Chris Reidy, “15-Year, 3-City NorthPoint Project Kicks Off Today”, The Boston Globe, March 21st, 2005.
ember 19, 2004. 73 Thomas Palmer Jr, “Phase 1 for a City within a City”, The Boston Globe, Sunday, Sept
107

units offer double height living spaces with a loft and floor-to-ceiling windows. Upper floor units will
feature views of the Central Park and adjacent courtyard.
Building T is a 12-story residential high-
units. Building T will be comprised of a b
rise that will contain 237 one and two bedroom condominium
l
ver
with
end of flat and duplex condominium units offering a variety of
unit types. Upper level units will feature roof terraces o
looking the Central Park, and corner penthouse units
views toward the Leonard Zakim Bridge.
5. CAMBRIDGE RESIDENCES: CHARLES E. SMITH HOUSING
Project Address / Name Developer FAR Lot Area GFA Units Status1-25 East Street C.E. Smith / Archstone 2.90 247,431 935,215 767 Permitted
108

The “hole in the donut”74 across the street from the Spaulding Slye Colliers North Point development is
6 acre site fronting O’Brien Highway. The parcel is being d
a
eveloped by local McKinnon Company, and
Charles E. Smith Residential, a unit of the publicly traded residential REIT Archstone-Smith of
Englewood Colorado. The public private venture is permitted to deliver 767 residential apartment units
housed in two buildings, with underground parking for 870 cars. Designed by the well-known
, the project is scheduled to progress in two phases. The first, scheduled to
is a rental residential high rise at the eastern edge of the site; the
buildings. The project will also contain a 2, 400
és, and a fitness centre. The project is slated to be the first
tion of the North Point area.
“Our parcel is not as big, but it’s much more visible
O’Brien Highway,” comments
ridge
Co. and now in a private architecture practice. Millman
says that a variety of mixes were considered before the
2 percent of the units have been set aside as affordable, said Dunlop. The average rent for the remaining
units will be $2,500 per month.
architectural firm ADD Inc.75
start in 2005 and be completed by 2006,
second phase will be comprised of low-rise residential
square-foot retail space, office space, caf
development in the transforma
because it fronts right on
Jeffrey Millman, a former principal of the Camb
venture decided on all rental housing.
1
74 David Vickery, Principle Spaulding and Slye Colliers, North Point Exposure. Boston Business Journal, March 15, 2002.
75 ADD Inc. has offices in Cambridge MA, and has done several residential projects in the Boston Area, including the prominent Atelier 505
109

6. THE RESIDENCES AT CAMBRIDGE CENTER
Located at the center of Kendall Square, Cambridge Center is a 2.7 million square foot mixed-use urban
parking for over 3,000 cars in the North, East and West Garages. Cambridge Center is directly across the
Currently under schematic design review by the Cambridge
center. The 24-acre site contains Class A office, research lab, retail, restaurants, hotel facilities, and public
parks and gardens with on-site rapid transit access at the Kendall Station of the MBTA Red Line and
Charles River from downtown Boston and immediately adjacent to Massachusetts Institute of
Technology.76
Redevelopment authority is a proposal for the
Residences at Cambridge Center proposed by Boston Properties in April of 2005. Part of the Cambridge
letion in 2007, the proposal is to develop a residential high
our (24) story building totaling approximately 200,000 SF
for 120 cars. The structured parking includes one level of below grade parking, and 8 levels above ground
(9 floors of parking at 9’11½” floor to floor).
The proposal illustrates 135 dwelling units incorporating 43 one-bedroom units of 719 sq. ft. average size,
78 two-bedroom units of 1,137 sq. ft. size, and 14 three-bedroom units of 1,410 sq. ft. size. The majority
of the one-bedroom units are on the lower floors, with two-bedrooms dominating floors 11 – 22 and
three-bedrooms on levels 23 & 24.
Center Site, and tentatively scheduled for comp
rise on Parcel 3. The proposal is for a twenty-f
of residential area and 2,600 SF of retail space. The proposal includes provisions for structured parking
ww.bostonproperties.com/site/boston/seven_cambridge_center.htm
3 Cambridge Center Boston Properties 3.30 61,302 202,600 135 In PermittingProject Address / Name Developer FAR Lot Area GFA Units Status
76 Boston Properties webpage: http://w
110

The project is proposed as a steel and concrete structure (conventional construction typology) with
ead footings
and mat foundation. The exterior cladding is a combination of the following: white/grey limestone toned
foundations of: i) pre-cast piles, ii) pressure injected footings, iii) combo of strip footings, spr
pre-cast panels; grey stone base at the residential, buff stone base at retail; bronze & cobalt grey metal
panels; champagne silver framed curtain wall glazing.
111

6.6 The Rental Market in Kendall Square
The existing rental Market in Kendall Square is integral in bringing multi-unit residential uses to the
neighborhood. Existing rental lofts have been very successful, and demonstrated a demand for such
housing in the area. An example is Worthington Place.
WORTHINGTON PLACE
Worthington Place, located at 195 Binney Street adjacent to Kendall Square, houses 186 “luxury” loft-
style apartments in a converted industrial building. The units are consistent with many of the features
associated with “loft” apartments, specifically the typically rectangular floor plans and the high ceilings
(13’4” – 14’0”). Converted to apartments in the late 1990’s, Worthington place has a history renting to
MIT students, in fact in 1998 (prior to the construction of new MIT graduate residences) MIT reserved 66
apartments to rent to MIT students at below market rates, and another 25 were reserved to rent to graduate
students (at market rates).
Current asking rents are as follows: studios range from $1300 to about $1700; one bedrooms range from
$1850 to about $2250; two bedrooms range from $2,250 to $2,600. Rents include one off street parking
space, hot water, and a portion of the heating and cooling cost.
112

SECTION 7: MARKETABILITY AND PRICING OF GALILEO LOFTS
lan to construct a nine story building that includes
approximately 75,000 square feet of housing and common space. The new building has been located at
e site. It is intended to relate to the massing and orientation of the Genzyme
p reet as viewed from the
movie theaters and the entry to One Kendall Square. esigned to be as narrow as
practical to maximize the area for a public park to inates the Galileo
Galilei Way axis that runs north from MIT’ 77
OPTION 1: PROPOSAL DATED AU
7.1 Overview of Galileo Lofts Proposal
The proposal for the Galileo Lofts at MIT puts forth a p
the extreme northern end of th
building along Binney Street, and would com lete the building line of Binney St
The proposed building is d
the south. This new building term
s Stata Center, creating a public open space.
GUST 27, 2004
ix of 21 market rate condomin
bridge’s zoning ordinanc
The original proposal (Option 1) outlined a unit m iums, 3 inclusionary
condominiums (i.e., units that are required under Cam e to be affordable to low
income persons, where low income is defined as less than 80% of the area median income) and 12
affordable rental units.78 Since the Cambridge Redevelopment Authority’s Request for Proposals
included a requirement that 40% of the units be affordable to low income households, the proposed
77 Development Proposal to the Cambridge Redevelopment Authority. “Galileo Lofts at MIT: Housing and Urban Park,” August 27, 2004.
78 Note that the proposal submitted on August 27th, 2004 outlines provisions for 36 units, however the drawings submitted to the authors for “in total. In fact, page a5 of
Case A” dated April 28th, 2004 illustrate the provision of 44 units the proposal designates condominiums on eight floors, which at 8 units per
floor plus 12 townhouses yields 44 units. It is assumed that when the proposal was submitted 36 units were intended to meet zoning requirements for parking, since the design incorporates 36 parking spaces on the lower level; the 36 unit scheme on nine levels is not however financially viable. The staff of the CRA has suggested that dedicated parking might be leased at a nearby garage, thereby satisfying the zoning requirement. Therefore, this analysis assumes the proposal (Option 1) is for 44 units.
113

percentage of inclusionary and affordable units in this proposal is 41%. The proposal further states that at
least half of the affordable rental units shall have three bedrooms to accommodate families. The original
alf story below grade, two-story townhouses on
One of the fundamental objectives of the proposal (from the perspective of the developers, HomePrime &
Oaktree Green) is to develop a project that will serve as a laboratory to test new design and delivery
methods currently in development by the MIT House_n Research Group and MIT’s Open Source
Building Alliance (hereafter, collectively the “Alliance”). The condominium units are intended to be
configurable lofts. Each unit will be constructed with bathrooms, demising walls, wood floors,
washer/dryer, individual HVAC system, and carefully located connections for kitchen plumbing, power,
and data. At the point of sale (during or before the construction process), a set of options will be offered
to the buyer, including a variety of kitchen layouts, cabinetry storage/organizing units, and special
e
on
proposal envisions a building with a level of parking a h
the ground level and condominiums above. The 12 townhouses are intended to comprise a single
condominium unit to be purchased and managed as rentals by Just-A-Start Corporation, a non-profit
community development corporation providing a range of services for low and moderate income people,
including expanding affordable housing opportunities. The townhouses are planned to be delivered
through traditional construction methods, and will have individual access to the street level. The
condominiums on the upper floors are all served by a central lobby at ground level. There are two floor
layouts with 4 units per floor that alternate on odd and even levels.
purpose components for work and entertainment. The Alliance is currently developing a software packag
that is intended to allow buyers to customize their suites by selecting a variety of options (much in the
same way a car purchaser can customize his car purchase). At the time of this analysis, the construction
and delivery methods hypothesized by the Alliance were at a very conceptual stage; as such, the market
and financial feasibility analysis included herein had to proceed based on the assumption that constructi
cost estimates will use conventional construction pricing.
114

Since the original proposal submitted in August, 2004, there have been several iterations of the proposed
building scheme. An alternate scheme (Option 2) is currently underway and seeks to locate parking in a
two-level above-ground structured garage. This scheme eliminates the townhouse component, and utilize
61 single-level units, of which 16 would be affordable rentals, 8 would be affordable condominium
affordable in total), and 37 would be market rate condominiums. Because at the time of this writing th
revised scheme is still in process, the majority of the analysis herein reflects Option 1, the original scheme
with 44 units.
7.2 Market Segmentation
The developers have chosen the site and the basic features of the pro
s
s (40%
e
duct type. These decisions have
narrowed the possible target market for the project. Some buyers will be primarily attracted by the
project’s location in Kendall Square: we will call them “Cambridge Condo Buyers.” Other buyers will
be attracted primarily by the product, i.e. project’s design and configuration as lofts: we will call them
“Loft Buyers.”
CAMBRIDGE CONDO BUYERS
The primary group of Cambridge Condo Buyers consists of people who work (as scientists, professors,
technicians, programmers, analysts, technical salespersons and staff) in Kendall Square’s labs and offices
They already know the area and would gain the ability to walk to work. The secondary group of
Cambridge Condo Buyers is expected to be people employed in Boston’s downtown. For these
.
79
As mentioned in the market analysis, Cambridge’s tax rate is approximately 2/3 Boston’s with a residential exemption that’s approximately 1/3 greater than Boston’s. This difference in tax rates, combined with locational proximity to downtown, has been cited as one of the factors influencing the increased residential development in Eastern Cambridge. “Crescent Heights Names Local Marketing Team for The Cambridge Glass Factory Condominiums.” Ni
79
ckerson’s Newsletter. February 18, 2005.
115

“locational commuters,” proximity to the Red Line T-Station at Kendall Square makes it easy to get to
work, and East Cambridge prices are not as high as locations right in downtown. The target demographic
for both groups falls in the young professional (25 – 44) group, which has demonstrated a dramatic influx
into the East Cambridge area in recent years, as shown in Section 5.2.
A third group consists of mature buyers looking for a retirement condo or second city home, who tend to
rate proximity to urban amenities very highly in their consideration of geographic relocation. In the
greater Boston area this demographic has traditionally favored downtown locations, and is not anticipated
al market for Galileo Lofts. However, there is a potential to attract
o
April, 2005, they had obtained deposits from 75 potential buyers.80 Galileo Lofts is not
suitable to serve as this group’s residence, because of its small scale; its features, which will not be
d its lack of extensive common rooms, which this particular group
ng.
ethnic identities. Typical neighborhood housing consists of one-, two- and three-family homes on small
aded,
to be a large component of the potenti
mature buyers who have affiliations with East Cambridge, and specifically MIT. These are people wh
have worked in the area for many years, who want to live in a familiar area and be close to former
colleagues and the activities of MIT. There is, in fact, a group of MIT-affiliated retirees who are seeking a
site near MIT on which to develop a condominium or cooperative with an MIT-centered community
orientation. As of
oriented to appeal to most retirees; an
desires. Nonetheless, the existence of this group demonstrates that there is a demand for housing in
Kendall Square among MIT retirees; accordingly, we expect a small portion of this segment to be
interested in a design concept a little different from what some of their contemporaries are pursui
Eastern Cambridge is a stable residential community, with particularly strong Portuguese and Italian
lots. The area has been gentrifying in recent years as older properties have been renovated and upgr
80 O. Robert Simha. Presentation to Class on Topics in Housing Finance. MIT. April, 2005.
116

and as newer properties have been built on the periphery of the neighborhood (Thomas Graves’ Landing
River Court, Esplanade, Glass Factory, One First, Museum Towers/Regatta Riverview, etc.) As a result
of this gentrification, the population of the area has been getting younger. We believe that Galileo Lofts
can appeal to both: the younger entry-level buyer in search of residentia
,
l options close to work or to
commuting lines, and the mature residents, particularly ones who have ties to the area through having
worked in Kendall Square or MIT and who are ready to leave their houses. We will discuss below how to
accommodate the differing design and amenity requirements of the younger and older groups.
LOFT MARKET
The “Loft Buyers” constitute the second potential target market group. This group is made up primarily of
younger singles and couples, typically first-time buyers, who are technologically savvy and “wired.”
Many work in design or technical fields throughout the metropolitan area. They are attracted by the
features of the loft product and its value and location compared to other lofts. Accordingly, they have less
connection to a specific neighborhood and tend to look over a wider geographic range than most
condominium buyers. There is also a small segment of loft buyers consisting of empty-nesters, people in
their 50s and 60s whose children (if any) are no longer living at home. These aging baby boomers are
seeking to sell their suburban home and make the transition to a smaller, urban residence offering
minimal upkeep responsibilities and access to cultural activities and urban vitality. It is anticipated that
the proportion of older buyers who would be interested in an East Cambridge address would be
and
East Cambridge / Kendall Square neighborhood. Given the small number of units proposed for the
significantly less than those looking in Boston areas such as the South End; however, both qualitative
quantitative demographic analysis support the hypothesis that there are a smaller number of older buyers
who through either historic geographic preference, or MIT affiliation would look to buy product in the
Galileo Lofts, it is reasonable to expect older loft buyers for a small percentage of target sales.
117

THE MARKET FOR GALILEO LOFTS
The most suitable buyers for the Galileo Lofts will be those who find appeal in both the Kendall Square
location (Cambridge Condo Buyers) and the loft product (Loft Buyers). Combining the two groups, the
project’s target market has two demographic segments:
savvy, edgy, willing to live in transitioning neighborhoods and willing to experiment with unconventional
Primary market segment: Younger (25-44), work in technical, scientific or design fields, are technically
living spaces. Many of them work in the area; others will take the subway. Some are attracted by the
bridge Condo Buyers); others will be attracted by the loft product (Loft
$125,000 (with some higher); they tend to be price-conscious (although there is a small percentage of this
segment with substantial income or equity who are drawn to a luxury product)81. At mortgage rates
projected to be in effect at the time Galileo Lofts come to market, in the range of 6.5%, and using
conservative underwriting guidelines (30% PITI to income), this segment will be able to afford $260,000
to $500,000 with a down payment of up to 5% to 20% of the price. This market segment may constitute
60% - 70% of buyers at Galileo Lofts.
retired,
where
Cambridge location (Cam
Buyers). Most of them are first time buyers; their household incomes are in the range of $75,000 to
Secondary market segment: Adult (45+) childless couples (“empty nesters”), some of whom are
many of whom work at MIT or in Kendall Square. Some of them are seeking to refute their previous
identification as suburbanites. Others are just moving to a condo at the edge of the neighborhood
81 Tim Pappas, (son of the developer James. Pappas) and his brother Andrew work for Pappas Enterprisout of Boston MA, and have developed many of the luxury loft products currently on the market (i.e. the Macallen Building, Court Square Press etc.). Interviewed in the Boston Globe on June 22, 2005 “Plato their Peers”, Tim Pappas articulated their strategy of targeting young artists and entrepreneurs, “mof whom take their work home in the evening and are drawn to a loft product”. The developers young, hip design conscious clients.
es
ying any
target
118
they have lived for most of their adult life. Many will have an MIT connection. Since they typically will
t
loft product, but may become intrigued by the
space and particularly by the Cambridge location.
be selling a home that gives them substantial equity, they are less price-conscious than the primary marke
group, but few of them are upper income. This market segment may constitute 10% - 15% of the buyers
at Galileo Lofts. Most will not be specifically seeking a
DESIGN FACTORS
exposed concrete floors rather than wood or carpet; stainless steel appliances and accents.
These are exactly the features that will appeal to the primary market segment. Although there have been
surveys conducted by the U.S. Departm
As discussed in Section 4.1, Kendall Square has a long industrial history. In recent decades, with the
proximity of MIT, it has become known for scientific and technical research, and now it is a center of the
high technology and biotech industries. This suggests a theme of technical innovation and a high tech
industrial look and feel. The project must be equipped with the latest in technological amenities: it must
be “wired.” Design should be edgy and industrial: open, flexible spaces; exposed structural elements;
ent of Housing and Urban Development (HUD) that demonstrate
a significant proportion of buyers express a desire to be able to customize their living space, the entry-
level buyer is unable to pay a premium for the opportunity. It is reasonable to extrapolate that the young
urban loft buyer likes the flexibility that a loft plan enables (often for future renovations), but affordability
limitations would minimize the number of buyers in this market able to pay for extensive customization at
the time of sale. The unit needs to be finished and livable, but perhaps in a “rougher” state than an older
or
square footage). They will expect large rooms in the living area, but will want most of the space
partitioned, rather than open; they are more concerned with high quality of finishes than with edgy
buyer would prefer.
The empty nesters have different requirements: they will be looking for conventional flats but will
appreciate the loft design’s exceptionally high ceilings and large windows (substituting cubic footage f
119

design.82 This suggests that interior partitions should be an available option (as planned), that all
construction work be of high quality and that there should be various grades of finishes available (lower
priced finishes to meet the purchase price concerns of the younger, first-time buyers, and premium
finishes to appeal to the older buyers). Most of these empty nesters have no design background, nor hav
they ever worked with architects or designers in co
e
nnection with their own homes (as wealthier persons
may have), so they will not want anything less than fully finished space.83
CUSTOMIZATION
Market research has demonstrated the luxury buyer is willing to pay to customize. For instance, 450
Kendall Square, currently in development by Lyme Properties, is targeting the very top of the market o
luxury products and is going to deliver the building as an unfinished shell (even bathrooms and kitchens
are not located). It will be up to the buyer to finish her or his suite (either with the aid of the developer
independently). The target market for this property will be upper income buyers who can af
84
f
or
ford to hire
design professionals to plan and finish the space.
Market research has demonstrated that many mature buyers who are “down-sizing” or purchasing a city home have a variety of house-scaled furniture in their possession that they do not want to part with. Therefore part of the appeal of the loft product to this demographic is the open plan that is spacious enough to accommodate such items.
82
ain Domain, for insights into the nature of loft buyers.
84 Many of the top of the market luxury condominium developments in recent years (such as One Charles, yers. a
83 The authors are indebted to Robert Salisbury, Vice President of Bonz and Company, and John Ranco, marketing agent with Gibson Dom
500 Atlantic Avenue, etc.) have found it necessary to provide the option of customization to their buMany developers have struggled to find a way to satisfy this demand, and still deliver the projects incost effective way. Evidence suggests there would be a strong demand for a product that both appealed to the needs of the luxury buyer, and offered a viable method of customization.
120

The Open Source Building Alliance’s design and construction process is intended to accommodat
requirements and preferences in a more cost-effective manner. Using special software (and perhaps a
design consultant) to assist consumers in designing their space based on a flexible “chassis,” the All
intends to make many of the benefits of custom design available to middle income homebuyers. It should
be possible to configure the same space to accommodate open live-work spaces, multiple bedrooms, or
libraries and dens. A wide range of customizable cabinetry (including closet
e varied
iance
-sized cabinetry serving as
room partitions), finishes and built-in electronic components will be available. We anticipate that if the
lop this system of configurable lofts that can be delivered cost-effectively, there
Once the Alliance solves this problem, the question that remains is whether these different groups spread
along the bell curve (see the Prologue) will want to live together. Will the thirty-something stockbroker
whose unit has premium finishes and customized electronics want to live next to the young family with
three children who could barely afford the cheapest finishes? Will the sixty-something couple selling a
home in Somerville want to live next to an artist or programmer who works at home day and night? The
final answer may require a sociologist, but we think the answer is generally likely to be yes, most of them
probably will. Part of the appeal of city living is the variety of individuals one meets and the interesting
communities that form. The most sought-after neighborhoods harbor an incredible diversity of uses and
poor, you
Alliance is able to deve
may be a strong market for the product.
residents. People buy lofts almost in anticipation of running into an artist or other “hip” person
occasionally. At the same time, there is an expectation of privacy in the city.85 People can live side by
side without necessarily intruding on each others’ lives. Neighbors don’t necessarily know each others’
circumstances – at least not at first. If you don’t know whether your neighbors are rich or
85 Jane Jacobs. The Death and Life of Great American Cities. New York: Vintage Books, 1961. Ch. 2 & 3.
121

assume they are like you. In the absence of specific knowledge to the contrary86, most buyers will assume
that people in the building are similar enough to themselves to be comfortable.
This assumption breaks down in two circumstances. The first of these is when the differences in incomes
and social situations are too extreme, when peoples’ lives are too different. The very affluent are able to
afford to live only with others like themselves should they so choose; the poorest may not be able to avoid
it. The second is if the residents impinge on each other’s quiet enjoyment of their homes. Children create
noise, messes and occasional other problems. Artists (not that Galileo Lofts is targeting artists) who work
in their lofts may make noise or use materials like paint that emit fumes. As long as the differences in
circumstances are not too great, and the units are well soundproofed, it should be possible to appeal to a
,
ss of the
o
loft-
broader range of purchasers than the conventional development could. But there will some buyers who
are sufficiently uncomfortable with this kind of diversity that they will buy elsewhere.
7.3 Analysis and Critique: Positioning of the Galileo Lofts
Considering the onslaught of new product coming on the market in East Cambridge in the next few years
the Galileo Lofts developers will have to be extraordinarily vigilant at ensuring the competitiveness of
their proposal in terms of pricing and features. Given the small scale of the project, it doesn’t need to
attract large numbers of buyers and thus is not particularly vulnerable; however, it is apparent the
developers should have a very clear strategy of product differentiation to help promote the succe
project. The immediate location in Kendall Square will give Galileo Lofts a certain uniqueness.
Positioning the project in the loft submarket will distinguish it from nearly all existing properties, but tw
new ones will be offering similar products: One First is developing units with high ceilings and other
ee below for a discussion of the anticipated effects of the very visible affordable rental townhouses. 86 S
122

like characteristics, and Building S at NorthPoint will consist entirely of lofts. (For the following reasons
we do not consider 450 Kendall Street, presently permitted but not yet under construction, to be a
competitive property, even though it will consist of lofts: it is aimed at the very high end, the unit interiors
will be delivered in essentially raw condition for the buyers to design and complete; and there will only be
eight units.)
UNIT SIZES AND AMENITIES
The Galileo Lofts project as proposed consists of units at an average size of 1,787 sq. ft., which are too
large, and therefore too expensive, for the target market. The average floor area of the sold units in the
East Cambridge locational data series was 969 sq. ft. The average floor area of sold units in the five
properties most directly comparable to the project was even lower: 861 sq. ft. Looking at the most
logical comparable properties that are presently in marketing, One First is in part targeting the same
ts that range in size from
early a
406 per
87
demographic to which Galileo Lofts would potentially appeal, and is offering uni
692 square feet and price from the $400,000s on up. The units at the lower end of the price range have
been the first to sell. Similar units at NorthPoint are advertised to start at $360,000 for units in the low
600 sq. ft. range. The loft building there is reported to consist primarily of units in the 900 sq. ft. range.
The floor areas of the 44 units in Galileo Lofts (Option 1) were set forth in Table 2, Section 1.2. Cl
major consideration is that there are no condominium units less than 1,485 square feet in size (assuming
the townhouses are all to be affordable rental units). This implies that even using a low price of $
square foot (which is the lowest price recorded in any sale at the five closest comparable properties in the
year ended May 31, 2005), the average unit price will be $727,300 (the range is $604,400 – $940,200):
87 Please see Tables 15 and 26 in Section 6.1 above.
123

this is nearly twice as expensive as the typical unit currently on the market targeting the entry level
demographic. It is fair to say that at this rate, the project will be priced out of its most appropriate t
market.
arget
On the other hand, the project lacks many of the characteristics that are expected by the luxury buyer. For
instance, the scale of the project dictates that there are no luxury amenities on site (i.e. fitness center,
pool, valet parking and concierge). A property of only 26 market rate units cannot reasonably support
such amenities. Furthermore, the location of the project site, situated away from water, away from
existing amenities, in an area that is not yet an established residential neighborhood, and on a relatively
busy vehicular thoroughfare, is an impediment in attracting the high-end consumer to the project.
(Younger loft buyers, on the other hand, are prepared to purchase in less than prime areas.)
l
n
which to base an entire development. The risk will be greater, the time to sell out longer and the profit (if
any) less than if the units were sized to match the needs and incomes of the primary market segment.
AFFORDABLE HOUSING COMPONENT
The inevitable conclusion is the project as initially proposed will have to be priced far above the leve
which the younger, primary market segment can afford, but will not have the amenities to support the
high income buyer. The only market left is the empty nester, secondary market segment. But as stated
above, the loft concept has less appeal to the older purchaser, as a result of which we were anticipating
only 10% to 15% of the buyers would fall into this demographic. This is too slim a market, we believe, o
Another potential impediment to the proposal’s marketability is the differentiation of the affordable
component. Locating the affordable rental units, which have been designed as three bedroom units to
appeal to families, in a distinguishable block on the base of the building, with individual street access, has
t would discourage the high-end consumer from
wanting to live there. People passing a building notice and interact with the lower floors: those are the
ones that dominate our impressions of the building. The obvious marketing concern is that people will
the potential for creating an image of the building tha
124

think that it is a low income rental property, not an expensive and desirable condominium. Although
may be a politically sensitive issue, the fact that a significant component of the market may be put off by
an impres
it
sion that the building is dominated by low income residents should not be ignored.
ay
e
This concern is supported by local residential brokers and appraisers who confirm they foresee significant
marketing difficulty and a major reduction in price associated with creating a visibly family-oriented low
e
n
anti-social behavior than when living in an environment of concentrated poverty. Mixed income
The proposal states that the affordable component will be operated as rental units. The differentiation
between the nature of the affordable buyer and renter is a cause for consideration. Ostensibly buyers m
be more inclined to participate in the upkeep of a property in which they have an equity share; the sam
cannot necessarily be said of tenants. To the extent this is true, it may affect the appearance and
management of the property.
income component at the entrance of the building.88 Lyme Properties demonstrated their concern for th
effects of a visible affordable component on the high-end loft buyer by choosing to limit their
development at 450 Kendall Street to eight residential units with the specific intention of avoiding the
affordability requirement.89 Public policy now generally encourages—and often requires—the integratio
of affordable units with market units in mixed income developments, in order to keep the affordable units
and their residents from being identified as such.90 Sociologists have observed that non-working adults
and their children, when living in a setting dominated by working families, are less likely to engage in
significant marketing impediment.
89
90
88 Pamela McKinney, for example, agreed that affordable rentals on the ground floor could be a
Andy Reinach, Lyme Properties LLC. Interviewed on June 27, 2005.
See Ian Colquhoun. Designing Out Crime: Creating Safe and Sustainable Communities. Boston: Architectural Press, 2004.
125
environments provide working adult role models for low income children and the potential for job
networking for low income adults.91 The concern within an individual building is that segregating the low
income residents may create an environment that does not discourage anti-social behavior or p
rovide the
other advantages of a mixed income community. That could create property management issues, which
may in turn make the project a less hospitable environment for the market rate buyers as well.
ace.
shed urban neighborhoods where the presence of a large and visible
proportion of low income rental housing in a building that also houses market rate condominiums does
not affect unit prices. The Fenway and South End neighborhoods of Boston come to mind. But those
locations appeal to a different demographic and they are more established areas. Many, though not all
brokers consulted have expressed the concern that getting people to a neighborhood like Kendall Square,
which is not an established residential area, will take some effort, but is certainly doable; however,
overcoming a potentially negative image of the building is another matter entirely.
All new residential developments larger than eight units in Cambridge are required to dedicate between
11% and 15% of the units as affordable, so mixed income housing is well known in the marketpl
There are indeed some establi
92
93
Commission Preservation and Production Task Forces: September, 2001. 91 Charles S. Wilkins, Jr. “Concept Paper: Mixed Income Rental Housing.” Millennial Housing
http://www.recapadvisors.com/pdf/mixedincome.pdf. August 10, 2005. For an in-depth discussion of the
Wilson. The Truly Disadvantaged: The Inner City, the Underclass and Public Policy. Chicago: University of Chicago Press, 1987.
dent, Bonz and Company. August 2, 2005.
income housing has not adversely affected the value of nearby single family homes: Henry A. Pollakowski, David Ritchay and
amily 05. MIT Center for Real Estate.
http://web.mit.edu/cre/research/hai/pdf/40B_report_HAI_0405.pdf
problems associated with concentrations of extreme poverty, see William Julius
92 Interview with Robert Salisbury, Vice Presi
93 On the other hand, an MIT study has shown that the presence of mixed
Zoe Weinrobe. “Effects of Mixed Income, Multi-Family Rental Housing Developments on Single-FHousing Values.” April, 20
. The study, however, focused on the
126

Townhouse units are often the most expensive units at a property that incorporates different unit types.
People are willing to pay for direct access to the outside, which often includes a private yard. They will
also pay for the additional interior space that usually comes with a townhouse (although in the present
scheme the townhouses are the smallest units). Such units can enliven the streetscape with variety and
activity at a human scale. The problem is not with the architecture, but rather with the segregation of the
low income tenants in these units. This can be mitigated in part – but only in part—by strong management
to keep the properties clean, well landscaped and well-maintained, and the behavior of the residents
within acceptable bounds. Alternatively, the townhouses could be allocated between market and
affordable units in the same ratio as the building as a whole: thus, 60% would be market condos. This
would enable the developers to realize the higher prices of townhouses while still providing some family
units, and it would protect the image of the building.
one
cedents that combine
for-sale and rental accommodations without problem; however, in the case of Galileo Lofts, the
percentage of affordable units is sufficiently high that one can foresee building maintenance and upkeep
he term
the project
Another consideration is the identification of the affordable component as rental rather than for-sale
housing. As outlined in the proposal, the intention is that the affordable component be organized as
condominium unit to be owned and managed by Just-A-Start. There are certainly pre
as being a concern. Dependent upon government subsidies (which have been decreasing during t
of the Bush administration), low income housing is often operated on a tight budget. Many properties
have had problems with inadequate budget allowances for the replacement of capital assets. If
ome e
that is beyond the scope of this paper.
presence of mixed income housing, not low income housing. Certainly there are persons of low incliving in mixed income housing, but they are presumably integrated with the other residents. Here we arconcerned about the effects of a segregated low income component. It would be interesting to expand the methodology of that study to the urban, mixed use building, but
127

were to go forward as designed, it would be advisable that expectations for building upkeep and
maintenance be clearly articulated and agreed upon with Just-A-Start.
The for-sale affordable condominiums may have similar problems meeting future capital needs. For-sale
units would be targeting a different demographic that may be better suited for the specific requirements of
the Galileo Lofts proposal, and may help moderate some of the concerns regarding day-to-day building
upkeep. Nonetheless, the low income buyers of those units might very well have greater difficulty paying
for future condominium capital needs assessments than would buyers at higher incomes.
SUMMARY
There are three primary criticisms of the original proposal (Option 1):
• The unit sizes are too large (and the units are therefore too expensive) to target the “entry-
level” buyer, and this demographic constitutes the majority of residential demand in East
Cambridge.
• The amenities, location, and building particulars are not consistent with the features that
It is reasonable to conclude that Option 1 has poor potential marketability.
However, the notion of customizable residential units, which is integral to the plan, is promising, and it is
that might differentiate their project from others on the market.
typically attract the “luxury” buyer, but the units are sized (and therefore priced) as if they
would.
• The differentiation of a family-oriented low-income rental block at the building entrance
could prove to be an impediment to the project’s marketability.
believed that if the developers can address the potential issues highlighted above, and identify a method
of delivering customizable units in a cost-effective way, they could have a very valuable marketing tool
128

7.4 Delineation of Pricing Strategy
The price of one property is determined by how it compares with other properties that are on the market
arket and sold.
Since there are few loft condominiums in Eastern Cambridge, we will need to review both conventional
bridge market and lofts in Greater Boston.
hose areas included in the
following zip codes: 02139 (Central Square), 02141 (
Section 6: Supply Analysis. These are the areas that Cambridge Condo Buyers interested in Kendall
Square are likely to consider. Loft Buyers, on the other hand, will have a much larger purview. We
determined that lofts within a five-mile radius of the project would constitute the secondary market.
Accordingly, we are looking at comparable sales in each of those two markets: condominium sales (not
necessarily lofts) in the primary Cambridge market, and loft condominiums within the secondary market.
The fol i ge
condominiu h has begun construction and
marketing, and which is one of the “properties in the pipeline” described in Section 6.5. We then use the
regression analyses from Section 6.1 and 6.3 to help us determine the property features most important to
or have recently sold. Buyers will weigh the various features and amenities of a property they are
interested in against those of other properties they have seen to determine if the price of the one they like
is reasonable. Appraisers will do the same, often assigning market-derived dollar values to specific
features of the properties they are analyzing. To properly position and price the condominiums at Galileo
Lofts, therefore, we need to compare them in detail with other similar units, both on the m
condominiums in the East Cam
We earlier delineated the relevant primary market in Cambridge to be t
East Cambridge) and 02142 (Kendall Square) – see
low ng is a qualitative discussion of how the project stacks up against the comparable Cambrid
m properties described in Section 6.2, along with One First, whic
marketability and price. We rank each comparable property and come up with an overall score. Those
scores help us determine the appropriate pricing of Galileo Lofts relative to the other properties.
129

COMPARISON OF GALILEO LOFTS WITH COMPARABLE CAMBRIDGE CONDOS
lar
down
ighborhood shops and the
nearest supermarket is in Somerville. Most of the surrounding properties are commercial, although there
the
With respect to building characteristics, the project is mixed. It will be brand new, and therefore enjoys
We assumed a very high level of unit finishes, incorporating quality construction throughout, superior
soundproofing, choice of wood cabinetry and granite countertops, premium appliances and high end
Galileo Lofts is considered to be in a low- to medium-desirable neighborhood. It is not on a noisy
highway like Cambridge Glass Factory, but neither is it on the river. The site is located on a vehicu
thoroughfare that is busy during rush hour and quiet at other times. It is isolated on two sides by streets
and on the third by the railroad tracks. The noise and vibration caused by the occasional train going
the tracks immediately adjacent to the building is apt to be more of an impediment to sales than an actual
bother to residents. (There are plans in discussion to remove the tracks at some point in the future and
create a linear park.) The building will, however, abut a new park on the balance of Parcel 7. The area is
not established as a residential neighborhood. At this time there are few ne
are a few apartment buildings on Binney Street and more in the pipeline (as discussed in Section 6.5). The
commercial properties are well maintained and landscaped, presenting a pleasant environment, if lacking
somewhat in night time urban activity. There are some restaurants, movie theaters and a cultural center
within walking distance; a performing arts center is planned nearby. Transit access is considered good;
the property is approximately an 8-minute walk to the Red line. Views are considered good owing to
proximity to the new park and to the height of the building, but there is no water access.
the maximum premium for age. Owing to its small size, it will not offer much in the way of common
building services, like health club, pool, concierge, etc., many of which are available at competitive
properties. Parking is limited at the property (37 spaces for 44 units). We assume that all condominium
units have one parking space and the shortfall is assigned to the affordable rental units; additional parking
may be available at nearby garages.
130
design accents. In other words, the lofts will not typically be delivered as shells. The recently constructed
ll come or converted properties (One First, Cambridge Glass Factory and Regatta Riverview Residences) a
with fairly high finishes and some choice of upgrades: it has become the market standard today. This
gives them an advantage in this characteristic over older properties, even luxurious ones such as the
Esplanade, where the initial finishes do not meet today’s higher expectations (although individual owners
may have upgraded their units).
SPECIFIC PROPERTY CRITERIA
We reviewed criteria that are expected to have an impact on marketability and pricing, in part as
determined by the regression analyses in Section 6.1 and 6.3. The criteria were divided into locational and
building characteristics. The locational criteria evaluated were: Desirability of the Neighborhood, Transit
Access, Highway Access, Proximity to Water, and Views. The building criteria evaluated were: Age,
Quality of Unit Finishes, Building Services and Amenities, Number of Bathrooms and Parking.
There are no specific quantitative measures for some of these criteria, such as Neighborhood Desirability.
In section 6.1 we found that the limitations on the data set prevented us from assessing variables such as
vertical location (i.e. floor level) of specific units, Views, and Proximity to Water that would be expected
t
sit
e was not a factor in distinguishing the properties (although the
Galileo Lofts has another couple of minutes’ drive to get to a highway than the others). Proximity to
Water refers to being on the waterfront, or a block away with a direct view, or a few blocks away with
to be related to Sales Price. Accordingly, the authors evaluated and scored each property and
neighborhood based on features that would appeal to the market (i.e. the primary and secondary marke
segments): proximity to other residential properties, parks, neighborhood shopping and the like. Tran
Access was compared based on the time to walk to the nearest transit station, and the Red line was
considered more desirable than the Green. Highway Access was deemed roughly equivalent for all
properties in this sample and therefor
131

some water views. The Lechmere Canal was considered less desirable than the Charles River. The
category of View is somewhat related to building height and Proximity to Water.
Age (or newness) reflects a premium placed upon new or recently renovated properties, which not only
have the latest amenities and a fresh appearance, but which will cost less to maintain than older
properties. Quality of Unit Finishes refers to the features of the units and has some relation to Age.
Recently built or renovated properties are increasingly featuring high-end finishes, such as quality wood
steel appliances, in-unit washer/dryers and the like.
Some of these features were not available or expected in the late 1980s when some of the older properties
were constructed. Also, the average condition of those units is somewhat more worn and depreciated than
the newer ones. Building Services and Amenities refer to the common amenities that distinguish high end
properties from less expensive ones. This category includes the presence of concierge, health club, pool,
community rooms, media and business centers and the like. Parking is evaluated based on the ratio of
parking spaces to units; the standard is one space per unit. Finally, Number of Bathrooms was not
per square
Each of the properties, including the subject property, was scored on a scale of one to ten for each
criterion, with ten being the most desirable. These scores were determined principally by reviewing the
sales data and information obtained from brokers and developers. In determining the appropriate scores
for some of the less quantitative criteria, the authors toured the buildings at various times and relied on
their knowledge of the Cambridge market. The scores are intended to be set in the context of the primary
cabinets, granite countertops, premium grade stainless
selected as a criterion for this comparison, because all of the listings, except the Esplanade, averaged one
bath for the one bedroom units and two baths for two bedroom units. One in three sales at the Esplanade
had an extra half bath; this is accounted for by a slight upward adjustment in Finishes for that building.
We did not consider floor area or number of bedrooms because we were attempting to derive a
foot price, rather than an average unit price. (We will discuss differences in price based on unit size later
in this section.) The method of comparison by aggregating sales by property did not permit us to adjust
out any price appreciation during the year.
132

East Cambridge market as a whole, rather than just confined to this data set. Thus there may not be
a 10 for each category. The scores, which appear below in
a 0 or
tion of how the
properties compare with each other in the various criteria.
Lofts
Cambridge
Factory One First
Thomas
Landing Court
Regatta
Viewe
Esplanade
Transit access 15% 6 7 8 7 2 5 2
Water 11% 0 3 0 6 8 6 10
Services 5% 0 5 5 7 8 7 10
Table 40, give an indica
WeightGalileo Glass Graves River River Th
Neighborhood 21% 4 3 5 6 7 3 7Age 12% 10 8 10 3 3 8 3Finishes 14% 7 6 8 4 6 7 6
Views 12% 6 5 3 6 8 10 9
Parking 10% 5 4 5 5 7 6 7
Weighted Score 6.6 6.4 7.3 6.7 7.3 7.7 7.8
Mean $/SF 519 508 561 531 538 595 590
Grid of Comparable Cambridge Condominium Sales
Table 40: Grid of Comparable Cambridge Condo Sales
PRICING
We wanted to determine how these relative rankings of property characteristics related to price, and
further to see if we could use these rankings to predict a reasonable price for the Galileo Lofts. The
criteria were given weights in relation to their expected impact on price per square foot. The regression
analyses in Section 6 yielded some coefficients that indicated the relative impact on price of the various
property characteristics. The log regression on the East Cambridge market data (Table 18), for example,
showed that high rise buildings enjoyed a premium of 22% (the high rises in the data set have better
Views, are generally closer to Water and have luxury Services); and Parking increased prices 10.9% for
the first space and 4.5% for the second. One regression run on the loft database yielded a negative
coefficient for New Construction, but the t-statistic was -0.563, indicating the result is not reliable (Table
30). We used coefficients these to inform the allocation of relative weightings to each of the building and
locational criteria. The weightings do not equal those coefficients because the MLS data did not contain
133

any way to rank many of the criteria, such as Neighborhood Desirability, that we judged important to
pricing. Certain items, such as Proximity to Water and Views, which have some overlap, were each
therefore given lower weights.
Each property’s individual scores were multiplied by the appropriate weighting percentage; then the total
was readjusted to a scale of one to ten. The weighted total scores were then compared to the prices per
square foot. (Asking prices were used for One First, since no sales have closed; as discussed in Section
6.1, List Prices are 99.6% correlated with Sales Prices. Actual Sale Prices were used for the others.) The
resulting weighted scores for each property are shown in Table 40. Their relative ranking gives a good
sense of the relative value (as expressed by price per square foot) of the comparable properties. Likewise,
they seem to fit with the qualitative discussion: Regatta Riverview, the full service, just-renovated high
rise with great water views, should be ranked among the highest; Galileo Lofts ranks higher than the
Cambridge Glass Factory, which is located right on a major artery; nearly equivalent to Thomas Graves
age, but which has views of the
anal; and a bit lower than One First, a new project adjacent to an established residential
unity
Landing, also located on a major artery, and beginning to show its
Lechmere C
neighborhood and therefore better located, and with some services such as 24-hour concierge, comm
room and fitness center.
The weighted scores for each property were plotted against price per square foot and a linear equation
was derived to relate the two variables (see Figure 29). Note that the high R2 value of .997 may be a bit
misleading given the factor of personal judgment involved in setting the individual rankings.
134

Comparable Cambridge Condominium Sales:Weighted Score v. Actual Price per Sq. Ft.
y = 62.598x + 105.1R2 = 0.9579
590
600
500
520
530
540
560
570
6.2 6.4 6.6 6.8 7.0 7.2 7.4 7.6 7.8 8.0
Weighted Score
Pri
e ($
) per
Sq
Ft.
510
550
580
c.
Figure 29: Weighted Score v. Price per Sq. Ft.
The weighted score of 7.0 for Galileo Lofts was inserted into the resulting equation:
y = 62.598 x + 105.1
where y represents price per square foot and x represents the weighted score. This yields an indicated
l
COMPARISON OF GALILEO LOFTS WITH COMPARABLE LOFTS
price of $519 per square foot, with a range based on of R2 of $497 to $542. This range aligns fairly wel
with our qualitative sense of how the building relates to its comparables.
We performed the same exercise using the comparable loft properties described in Section 6.4. We
utilized the same criteria and methodology. We relied on the regression analysis in Table 31 to give some
indication of the relative effect on value of the different cities, but this was only generally helpful in
assessing the relative Neighborhood Desirability. The greater variety of areas and property features in
135

these comparable properties made the result a less reliable (much lower value of R2 = 0.182). The grid
appears below.
WeightGalileo Lofts
Court Square Press
Aberdeen Lofts
Parris Landing
Macallen Blg
323 at Cypress Strada 234
Neighborhood 20% 6 4 7 5 4 3 4Transit access 15% 6 9 4 4 9 6 8Finishes 14% 7 8 7 7 9 6 8Age 13% 10 9 9 8 10 10 8Views 11% 6 6 5 8 6 4 6Water 11% 0 4 0 10 2 0 0Parking 11% 5 3 6 5 8 8 6Services 4% 0 5 2 5 7 2 6
Weighted Score 7.0 7.7 6.9 8.0 8.6 6.4 7.3
Mean $/SF 541 576 531 497 600 531 561
Grid of Comparable Loft Sales
Table 41: Grid of Comparable Loft Sales
Interestingly, Parris Landing has a high score, but a comparatively low price per sq. ft. It appears that the
gh (270 of 367
units sold in less than 12 months). 94 This may be one reason why for the low R2 value.
The specific data points are plotted in Figure 30 below.
units there are priced below market, which explains why the rate of absorption is so hi
94 According to Kevin Ahearn, president of Otis & Ahearn, which is marketing the property, as quoted by Jim Miara. “Converting form Rental to Condos Not Always as Easy as It Looks.” Banker & TradesmAugust 1, 2005. 31.
an.
136

Comparable Loft Sales:Weighted Score v. Average Price per Sq. Ft.
y = 19.898x + 400.71R2 = 0.182
450
500
550
600
650
6.0 6.5 7.0 7.5 8.0 8.5 9.0
Weighted Score
Pric
e ($
) per
Sq.
Ft.
Figure 30: Comparable Loft Sales
Parris Landing is the point at a weighted score of 8.0 and a price of just under $500 per square foot.
The resulting equation, y=19.898 x + 400.71, can be used to yield an estimated square foot selling price,
541 per square foot,
which is just within the top of the range determined by the equation for the Cambridge Condos.
Based on our qualitative comparison of the properties, and our analysis of the two grids, we have
determined that the indicated fair market price of the units at Galileo Lofts is $530 per square foot. This
indicated price is subject to property-specific adjustments below in order to come up with a final fair
market price.
as was done for the Cambridge Condo data above. It gives an indicated value of $
137

ADJUSTMENT FOR UNIT SIZE
The indicated prices need to be adjusted downward for two features unique to the building (unique, at
least, among the comparable properties): the large unit sizes and the visible affordable component. Nearly
all one bedroom units in the comparable properties are between 525 and 900 sq. ft. in area, with an
average of 687 sq. ft. Typical two bedrooms average 1,149 sq. ft. and most range between 850 sq. ft. and
1250 sq. ft. (There are a few larger two bedrooms in excess of 1,250 sq. ft. They are located in the two
high service buildings, The Esplanade and River Court, as well as One First, which has 86 different
layouts dictated in part by the constraints of the existing buildings.) Prices per square foot generally
decline as unit sizes increase, other factors being equal. This is illustrated in Figure 31 below, using sales
data for the primary Cambridge market. The low figure for R2, 0.1097, indicates that unit size accounts
for about 11% of the variation in price per square foot. Obviously there are many other locational and
building factors that affect price. One way to reduce the other variables is to look at a single project. We
are able to obtain an R2 of .0.3897 by considering the Aberdeen Lofts in West Cambridge (see Figure
10%) increase in floor area. Although this is a limited sample, it is typical of the market as a whole, since
the trend is the same. This concept makes sense, because the expensive components (kitchens and baths)
have to exist in even the smallest units. Kitchens may get larger and fancier in larger units, but there is
still only one. Larger units have more of the less expensive space in living rooms, bedrooms, closets and
use
32).95 In this example, price per square foot declines $5.14 (or about 1%) for every 100 sq. ft. (about
the like. Additionally, larger units are affected by the law of diminishing marginal utility, and beca
This chart uti95 lizes the data presented in
able 35: Current Listing for Aberdeen Lofts, July 2005-07-31, page 94, because it is a fairly complete data set, and is one of the most appropriate loft comparables for Galileo Lofts. T
138

they are more expensive, their potential market is smaller, which in the absence of severe price constraints
would tend to lower price per square foot.
Condominium Sales Price per Square Foot:
Data Source: MLS-PIN
y = -0.0832x + 531.932
200
400
500
600
700
800
0 500 1,000 1,500 2,000 2,500 3,000 3,500
Floor Area (sq. ft.)
Pic
e ) p
erq,
Ft
Cambridge 02139, 02141 and 02142
R = 0.1097
100
300r($
S
Figure 31: Price Per sq. Ft. v. Floor Area – Eastern Cambridge
139
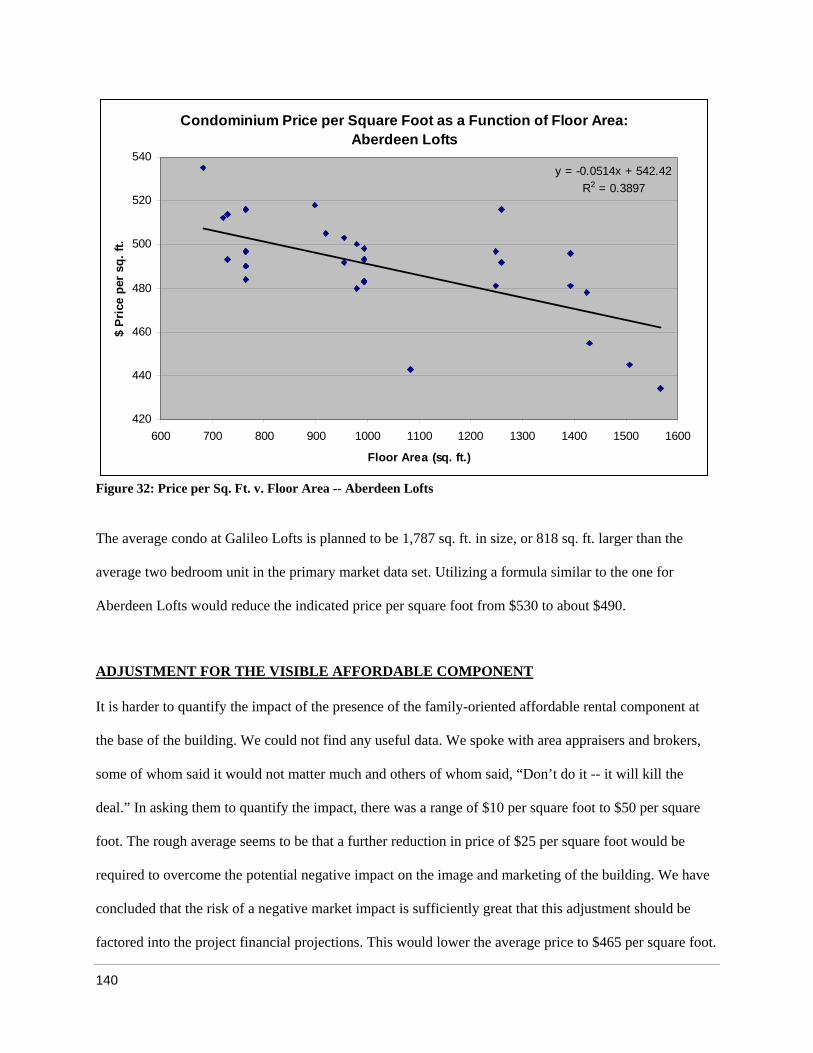
Condominium Price per Square Foot as a Function of Floor Area: Aberdeen Lofts
y = -0.0514x + 542.42R2 = 0.3897
420
440
460
480
500
520
540
600 700 800 900 1000 1100 1200 1300 1400 1500 1600
Floor Area (sq. ft.)
$ Pr
ice
per s
q. ft
.
Figure 32: Price per Sq. Ft. v. Floor Area -- Aberdeen Lofts
The average condo at Galileo Lofts is planned to be 1,787 sq. ft. in size, or 818 sq. ft. larger than the
zing a formula similar to the one for
Aberdeen Lofts would reduce the indicated price per square foot from $530 to about $490.
ADJUSTMENT FOR THE VISIBLE AFFORDABLE COMPONENT
average two bedroom unit in the primary market data set. Utili
It is harder to quantify the impact of the presence of the family-oriented affordable rental component at
the base of the building. We could not find any useful data. We spoke with area appraisers and brokers,
some of whom said it would not matter much and others of whom said, “Don’t do it -- it will kill the
deal.” In asking them to quantify the impact, there was a range of $10 per square foot to $50 per square
foot. The rough average seems to be that a further reduction in price of $25 per square foot would be
required to overcome the potential negative impact on the image and marketing of the building. We have
concluded that the risk of a negative market impact is sufficiently great that this adjustment should be
factored into the project financial projections. This would lower the average price to $465 per square foot.
140

Both of these issues, the large size of the units (which put them beyond the reach of the target market) and
the visible affordable rental component may have a more serious impact on the rate of absorption than on
the price, as we will discuss later.
ENHANCING MARKETABILITY
Most of the weightings in the grid above relate to features that are site specific or otherwise beyond the
developer’s ability to change: Neighborhood Desirability, Transit Access, Age, Views, Water and the
like. Perhaps Views can be improved by optimally situating the building on the site or by building higher,
and a shrewd developer may find a way to add bring some transportation service to the property. But the
major features a developer can change to affect price per square foot and differentiate a building from its
competitors are Unit Finishes, the amount of Parking made available, and Building Services. There may
be physical constraints or inadvisable financial trade-offs to adding Parking. Building Services, with the
lowest weighting, are not very important in determining selling price. Thus any attention has to be on
nces,
te their
property – except, of course, that now everyone is doing it. Talented, hip and celebrity architects are
in marketing message for
t
Unit Finishes (and the related overall quality of design). That is why there has been such an impetus
among developers to use more granite, marble and hardwood, to install premium cabinets and applia
to include wireless internet services, and the like. It may be the only way they can differentia
helping to differentiate their clients’ projects through design. Indeed, the ma
Parris Landing in Charlestown is that international design guru Philippe Starck is doing the project. It
seems to be working – 270 of the 367 units have been sold in less than a year. The prices at Parris
Landing may not be higher as a result (average prices are $497 per sq. ft., as compared with $526 for
resales at the nearby Flagship Wharf), but the rapid absorption must have a considerable positive impact
on the bottom line. We suspect that the high style design may increase development cost, but we do no
have access to the data. Of course, it is too early in the process to know if the Galileo Lofts will have an
exceptional design.
141

What the Galileo Lofts will have is the flexibility in layout and configuration arising from the Open
Source construction methods. These will probably not have much impact on the price at which the units
will sell. A buyer will purchase a layout that meets his or her needs and preferences, paying a market
price for it. If the layout does not meet those needs the buyer will seek another property. Buyers,
primary market segment, rarely envision in detail what their space
ut
fit
and
is
y in
particularly the first time buyers in the
needs might be in coming years, or if they do it is in terms of needing more space, not in needing a
different configuration. Thus flexibility in setting up the initial layout may help capture more buyers, b
it will not induce them to pay a higher price (beyond what is already captured in the Age criterion for all
new properties). Conventional lofts frequently offer considerable flexibility in layout and finish, and they
generally do not sell for higher prices. This point must not be underemphasized. Should a unit be
designed to incorporate enhanced finishes such as built-in media systems, it would increase the price (as
well as the developer’s cost) for such units. On the other hand, offering the option of lower-grade finishes
would lower the price and the cost, thereby expanding the market. While there is a small impact on pro
from such items, it is not significant at the scale of the overall project. In our discussions with brokers
appraisers, we have found no evidence that there is presently a significant demand in the target market
segments for units which provide for extensive customization. Part of the developer’s objective for th
project is to test and create a demand for such options. But this unique feature can be used successfull
marketing the project to prospective purchasers: if promoted correctly, it will likely get more people in
the door, but will not increase the price.
142

7.5 Absorption
Cambridge is expected to add about 1,000 households per year over the next five years.1 Most of these
new households will locate in Eastern Cambridge. There are presently 4,467 units in the pipeline for
Eastern Cambridge.2 This includes 2,151 units intended to be built over the next ten to fifteen years at
North Point, so not all will be built in the next five years. Some of these units may never be built at all.
On the other hand, there will be new residential properties constructed in other parts of town, including
the Aberdeen Lofts in West Cambridge, the Brickworks now under construction on Rindge Avenue,
Harvard and MIT-sponsored graduate student and faculty housing, and other projects. The City’s
Development Log lists 409 units under construction in other parts of town, 526 more permitted, and none
in permitting.3 If half of North Point’s additional units are built in the next five years (in addition to the
329 under construction), and if all other units are built, the situation over the next five years looks like:
Cambridge Housing Market: Demand and Supply
Demand: Additional households 5,000
Supply: Eastern Cambridge pipeline 3,392 Other neighborhoods 935 Total Supply 4,327
Shortfall 673
Table 1: Cambridge Housing Market Demand and Supply
Of course, there will likely be other projects built over the next five years, but again it is likely for various
1 See Section 3.3.
2 See Table 38 in Section 6.5.
3 The Development Log lists all new projects of 8 units and up. City of Cambridge, Community Development Department. “Development Log March/April 2005.” http://www.cambridgema.gov/~CDD/ed/realest/devlog/devlog_0305.pdf. August 2, 2005.
143

144
reasons that not all of these projects will be built. If it turns out that new supply exceeds 1,000 units per
year, then the likely consequence is that Cambridge will attract additional households from surrounding
areas. There are several reasons for this. The first is Cambridge’s perceived desirability as a place to live
and invest, which has been reflected in a real estate market that has historically been among the strongest
in the region. Cambridge real estate enjoys the stabilizing presence of Harvard and MIT. Cambridge is a
strong employment center. The second is the system of constraints on supply production in the region,
which has led to a backlog of demand for housing, and which is expected to continue. Then there is the
strong regional economy and the expectation of favorable (though climbing) interest rates for the
foreseeable future.4 Accordingly, we conclude that the Boston area, and Cambridge in particular, will not
experience an excess of supply in the next five years.
Therefore we can look to the experience of comparable properties for guidance on expected rates of
absorption for the project. This information was gathered from MLS-PIN, The Warren Group and
interviews with property developers and brokers.
Table 43 represents properties recently being marketed for sale. Note that the Cambridge properties had
the highest sales absorption rates. Looking at the grid in Table 40 above, we see that the Galileo Lofts are
closest in overall features to the Cambridge Glass Factory, which had an absorption rate of 6.3 units per
month. It therefore seems reasonable to assume that a similar absorption rate should apply to Galileo
Lofts, which is ranked as a superior property. However, this rate must be adjusted for the two special
factors that will affect the marketability of the units: the large unit size and the visible affordable
component.
4 Many of these points have been discussed in greater detail in Section 3.4.

Absorption Rates for Comparable PropertiesProperty City Start End Months Sold UAG Total Absorption
Cambridge Condominium CompsCambridge Glass Factory Cambridge 6/6/2004 5/31/2005 12 60 15 75 6.3One First Cambridge 1/1/2005 7/27/2005 7 0 46 46 6.6Regatta Riverview Cambridge 9/15/2004 5/31/2005 8.5 62 56 118 13.9 Mean 8.9
Boston Area Loft CompsAberdeen Lofts Cambridge 5/20/2005 7/20/2005 2 0 16 16 8.0Court Square Press South Boston 6/1/2004 7/20/2005 13.5 20 17 37 2.725 Channel Ctr South Boston 7/1/2004 7/1/2005 12 40 0 40 3.335 Channel Center South Boston 1/24/2004 6/14/2005 17 43 0 43 2.5323 at Cypress Lofts Brookline 4/20/2005 6/9/2005 1.5 0 9 9 6.0 Mean 4.5
Table 2: Absorption Rates for Comparable Properties
It was briefly noted in Section 5 that the time it takes to sell a property increases as a function of unit size
(and price). Using the MLS data set for the primary market Cambridge (02139, 02141 and 02142), this is
illustrated in Figure 33. To get a rough idea of how we need to modify the absorption rates, we can use
the equation that appears on the chart to predict the days on the market for each property based on their
respective mean unit sizes. We can then multiply the ratio of the two by the indicated absorption rate of
6.3 per month. The computation appears in Table 44 below. It yields an expected time on the market of 29
days for the Glass Factory. This is amazingly close to the actual time of 28 days, given the limitations on
the data and the low R2 value of .034 (indicating that unit size only contributed to 3.4% of the variability
in time on market). The procedure above suggests that in order to make allowance for the exceptionally
large unit sizes, we should reduce the expected absorption rate by nearly half to 3.3 units per month. This
makes intuitive sense, inasmuch as a unit the size of the mean unit at Galileo Lofts on average took nearly
twice as long to sell as one the size of the mean unit at Cambridge Glass Factory.
145

Time Required to Sell a Condominium as a Function of Unit Floor AreaSource: MLS-PIN
y = 0.0251x + 11.488R2 = 0.0342
0
50
100
150
200
250
400 900 1400 1900 2400 2900
Floor Area (sq. ft.)
Days
on
Mar
ket
Figure 1: Time on Market v. Floor Area
Absorption: Adjustment for Unit Size
Property Mean Floor Area (sq. ft.) Predicted DOM
Cambridge Glass Factory 716 29
Galileo Lofts 1787 56
Ratio 0.52
Preliminary Absorption Rate x 6.3
Adjusted Absorption Rate 3.3
Table 3: Absorption Adjustment for Unit Size
146

147
Unfortunately, there is no quantitative method for determining how much the absorption rate should be
reduced owing to the presence of the affordable housing at the base of the building. After speaking with
area real estate brokers and appraisers, it is our judgment that this is a significant factor, as discussed in
earlier in this chapter, and we believe a further reduction of 25% to the absorption rate will adequately
account for the risk involved. This indicates an expected absorption rate of 2.5 units per month. Even at
such a low rate (for Cambridge), with only 26 market rate units, sell-out would take approximately 10
months.
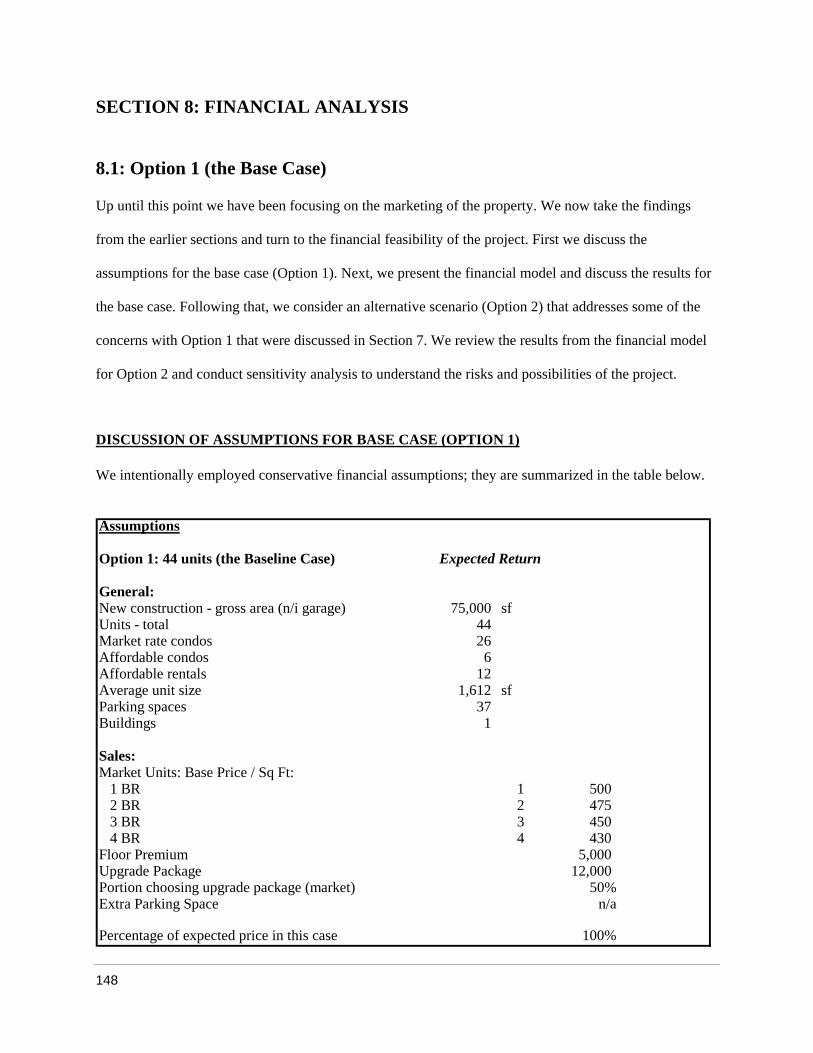
SECTION 8: FINANCIAL ANALYSIS
with Option 1 that were discussed in Section 7. We review the results from the financial model
for Option 2 and conduct sensitivity analysis to understand the risks and possibilities of the project.
DISCUSSION OF ASSUMPTIONS FOR BASE CASE (OPTION 1)
8.1: Option 1 (the Base Case)
Up until this point we have been focusing on the marketing of the property. We now take the findings
from the earlier sections and turn to the financial feasibility of the project. First we discuss the
assumptions for the base case (Option 1). Next, we present the financial model and discuss the results for
the base case. Following that, we consider an alternative scenario (Option 2) that addresses some of the
concerns
We intentionally employed conservative financial assumptions; they are summarized in the table below.
Assumptions
Option 1: 44 units (the Baseline Case) Expected Return
General:New construction - gross area (n/i garage) 75,000 sfUnits - total 44 Market rate condos 26 Affordable condos 6 Affordable rentals 12 Average unit size 1,612 sfParking spaces 37 Buildings 1
Sales:Market Units: Base Price / Sq Ft:
1 BR 1 500 2 BR 2 475 3 BR 3 450 4 BR 4 430
Floor Premium 5,000 Upgrade Package 12,000 Portion choosing upgrade package (market) 50%Extra Parking Space n/a
Percentage of expected price in this case 100%
148

Affordable rental unit sale price 325,000
Affordable condo unit sale price:1 BR 1 160,000 2 BR 2 185,000 3 BR 3 200,000
Sales price appreciation 5.0%Construction inflation 6.8%
Total Purchase Price 960,000 Profit Sharing 30% Maximum: 1,540,000 Maximum price 2,500,000
Expenses:Construction contingenc
4 BR 4 225,000
Absorption rate: market condos 2.5 units per month
Expense of Sales:Deed stamps 0.456%Closing costs & concessions 200Commission (market) 4.50%Legal 500Condo working capital 300
Projected future rates of inflation (annual):
Land Purchase Price:Affordable Units 18 10,000 180,000 Market Units 26 30,000 780,000
y 15.0%Soft cost contingency 8%
Developer's overhead 4%Developer Fee 3%
Project Schedule:Time to permit (months) 9Time to construct (months) 15
Month no.Date of construction estimate -13Start of permitting 0Receive approvals 5Close on land 8Start of construction (month #) 9Start of marketing (month #) 12Substantial completion (month #) 23CO and 100% completion (month #) 24Closings start 25
149

Financing:Construction loan:Loan limits: Total Costs 82.5% 26,267,545 21,670,725 Net Sellout 72.5% 31,140,261 22,576,689 Max Construction Loan 21,700,000 Points & fees 1.5% 325,500 Closing costs & lender's legal 50,000 Rate Libor + 2% 5.51%Term (years): 3
Equity:Developer capital deferred development fee 642,862 Investor capital required 5,900,000 Required total return to equity investors 25%Preferred return to equity 12%Residual to investor 80% until IRR of 18%, then 50%Residual to developer 20% , then 50%Investment banking fees 5% 295,000
Table 45: Base Case (Option 1) Assumptions
1. Unit mix: There are 36 three bedroom units and 8 four bedrooms (Number of bedrooms is based on
floor area: how many bedrooms would a typical unit in the primary market area have that had the same
floor area. The units may actually be configured differently by the buyers). A list of all units including
floor area and pricing appears in Appendix C.
2. Unit pricing:
Market unit base prices per square foot: The Marketability and Pricing Analysis, Section 7.4, produced
expected average per square foot prices for the different size classifications of units. These average prices
are adjusted downward to create a set of base prices. To reflect actual marketing practices, the base prices
are then increased for floor premiums and upgrade prices (see below for explanation) to come up with
individual unit asking prices. The net result is that the average sale price of all units (after including the
floor premiums and upgrade packages) equals the expected average price. We go through this exercise in
150

order to determine if the individual units will be affordable to the target market, something that the
average price alone will not tell us.
Floor premium: a per floor estimate for the average increase in price commanded by units on higher
floors, primarily for better views and light.
Upgrade package: upgraded unit finishes, including more expensive wood cabinetry, upgraded granite
countertop selections and hardwood floors. The portion of buyers choosing the upgrade package is based
on the authors’ experience in Cambridge and Brighton condominium conversions and interviews with
area brokers.
Appreciation: The average price for the market units is increased monthly at the projected rate of price
.4 above (also see paragraph 5 below).
Affordable rental townhouses
appreciation, 5% per year, as determined in Section 3
: The developers intend to sell these units to Just A Start Corporation, a
e
development of affordable housing. As outlined in
osal (Appendix A), these programs include the Massachusetts Affordable Housing
HOME funds and several small programs such as LeadSafe Cambridge. Each program has its own
well-respected local non-profit developer and operator of affordable housing, who is joining the venture
as a “development partner.” The price is determined by projecting the average unit’s net operating
income, determining the amount of a loan that would support, and adding the expected amounts from th
various municipal and state subsidies programs for the
the developer’s Prop
Trust, Massachusetts Housing Stabilization Funds, Cambridge Affordable Housing Trust, Cambridge
151

idiosyncratic requirements and funding limits. Barbara Shaw of Just A Start estimated the total price
would be able to pay at approximate
they
ly $325,000 per unit.100
Affordable condominium units: The price is based on what an individual or family earning 80% of th
area median income could afford to pay. For
e
computations, please turn to Appendix C, worksheet
entitled, “Buyer’s Underwriting: Affordable Condominiums.”
e
g the issuance of the Certificate of Occupancy (the “C.O. Date”) or two months after the
unit is put under agreement. The affordable condominiums are assumed to have no problem with
absorption since their price is so much below market. The public advertisement, application and lottery
process needs be started at least six months before the C.O. Date in order to ensure that those buyers will
ant
4. Expense of unit sales: These represent customary closing-related charges in area condominium sales.
The commission rate (4.5%) on the sale of the market rate condominiums is based on similar projects.
The deed stamps are based on the statutory tax rate of $4.56 per $1,000 of consideration. Other closing
costs are typical for conventional condominium unit sales.
3. Absorption and Unit Closings: The rate of sale of the market condominiums, 2.5 units per month, is
from the absorption analysis in section 7.5. Closings of each sale are projected to occur at the later of th
month followin
all be ready to close the month afterwards. The sale of the affordable rental units to Just A Start, pursu
to a contract to be executed prior to the start of construction, is likewise projected to occur a month after
the C.O. Date.
100 Interview with Barbara Shaw, Director of Housing Development, Just A Start Corporation. Cambridge, MA: July 12, 2005.
152

5. Construction Cost Inflation: In the absence of reliable projections for inflation in construction costs,
we used the most recent annual change in the Producer Price Index (the “PPI”) for multi-unit residential
construction as the Construction Inflation Rate. The PPI is not prepared for the construction industry in
general, but there are several special indices. We used the New Construction Index. For the year ended
June 30, 2005, that rate was at 6.8%. By comparison, the Multi-Family Construction Index was 6.7%,
but this may include renovation, so we selected the New Construction Index as the (slightly) more
6. Purchase price of land: This is based on the Developer’s proposal to the Cambridge Redevelopment
Authority, the Seller. It provides for a price of $10,000 per unit for affordable units and $30,000 per unit
for market units. In addition, the Developer proposed to pay the CRA 30% of the profit earned, up to a
maximum total price of $2,500,000. The base price (before the profit participation) represents a reduction
in what the price would be if there were no affordability requirements.
7. Construction expenses: See the “Construction Budget” worksheet in Appendix C. Most hard costs are
based on a detailed budget estimate from Suffolk Construction dated May, 2004. The unit finishes are at
the comparatively high level (i.e., granite countertops, marble bathrooms, whirlpool tubs, etc.) that we
assumed in Section 7. The estimate was based upon conventional construction methods. The MIT Open
101
conservative indicator. Either rate is considerably above the Consumer Price Index, which may relate to
shortages and increases in the price of steel, plywood, drywall and other construction materials in the face
of increasing demand from China.102
101 U.S. Department of Labor, Bureau of Labor Statistics. Producer Price Index – Industry Data. Series Id: PCUBRSM—BRSM. July, 2005. http://data.bls.gov/PDQ/servlet/SurveyOutputServlet;jsessionid=f0309fa08fec$5B$3F$3. July 30, 2005.
casts. Vol. 102 Jim Ostroff. “China’s Scramble for Raw Materials Will Broaden.” Kiplinger Business Fore6, week of May 6, 2005.
153

Source Building Alliance anticipates that their new construction methods, involving efficiencies of
factory fabrication and less on-site labor, will be less expensive than conventional construction. Since the
development of these new methods has not been completed, it is not possible to determine even
approximate pricing at this time. Moreover, prototypes are apt to be more costly to build than the final
product in mass production. Therefore, reliance on the price of conventional construction methods is the
more prudent course.
The prices based on the May 2004 estimate have been adjusted for inflation at the Construction Inflation
Rate from that date through the projected start of construction. (It is assumed that once a construction
contract is signed, there will be no interim increases for costs, although this is not always the case.) An
,
s
ther items have been estimated
using R.S. Means construction cost data.103
t
not to have been necessary, it will of course increase the returns on the project.
adjustment was made for the number of units (the original Suffolk Construction estimate was for 40 units
but the submitted proposal was for 44). This change does not involve increasing the total square footage
of the building, just breaking up the space into a few more units. From the estimate we extracted the item
specifically involved in adding a unit: kitchens, bathrooms, some extra interior partitions and doors, and
the like, and came up with a price of approximately $42,000 per unit. O
A customary construction cost contingency allowance is 10% of costs. We have increased it to 15%
because the estimate from Suffolk Construction was done without detailed specifications or plans and is
15 months old; furthermore, back-up information was unavailable. If this increased contingency turns ou
103 RS Means Building Construction Cost Data 2004. Kingston, MA: R.S. Means Co., 2005.
154

8. Project Schedule: The schedule was derived from the requirements of the permitting process, the
Developer’s project plan and the author’s experience in marketing condominiums. In the absence of a
schedule from the contractor, payments of hard costs were assumed to be made in equal monthly
installments as follows: two thirds of total hard costs were expected to be spent during the first six mon
of construction, the balance after that extending to shortly after the issuance of the Certificate of
Occupancy. Obviously
ths
, if construction is delayed for any reason, it may increase construction expenses as
well as interest expenses, other carrying costs and returns due to the investors. If unit closings are
postponed as a result, it could hurt marketing and postpone receipt of the sales proceeds necessary to
repay the debt and equity capital.
10. Other Soft Costs: These are generally derived from budgets for similar projects. There is no
11. Developer fee and overhead: These are based on what a conservative construction lender would
allow as a project expense in underwriting a construction loan: 3% of hard costs for the fee and 4% of
9. Architectural/Engineering/Inspections/Appraisal Expenses: The budget items for permitting and for
design, documents, plans, and construction administration were based on a proposal dated January 28,
2005 from Whitney Atwood Norcross Associates of Boston. The permitting expense is low because the
Cambridge Redevelopment Authority was responsible for obtaining all approvals short of the building
permit. Allowances for other items in this section were derived from budgets for similar projects.
allowance for a transportation study because one was completed for the Cambridge Redevelopment
Authority, and the environmental approval for which the study was required has been issued. A soft cost
contingency was included based on budgets for similar projects.
155

total costs toward overhead.104 A for-profit developer would likely charge a higher fee if the project
would warrant it.
FINANCING
antini &
%) or
ver
ojection for LIBOR through the end of 2005 prepared by the Financial
Forecast Center.106 LIBOR was thereafter projected to follow Freddie Mac’s projection of one-year
Treasury rates adjusted to a constant maturity.107
n any
part of Cambridge) and know that serious buyers will rarely commit to buying before construction starts.
Market interest rates, terms and underwriting guidelines were obtained from Tim O’Donnell of F
Gorga, a Boston real estate financing firm, as well as other finance professionals. The amount of the
construction loan was limited to the greater of 80% to 85% of total project costs (we assumed 82.5
the “low 70 percent’s” of net sales revenue (we assumed 72.5%). The rate was set at 200 basis points o
the 3-month LIBOR. We used a pr
105
It is anticipated that lenders will not seek any condo unit presale requirement as a condition of funding
any portion of the loan. According to Tim O’Donnell, who has arranged financing for many
condominium developments, lenders are comfortable with the strength of the market (particularly i
104 Interviews with Tim O’Donnell, Managing Director and Principal, Fantini & Gorga. July 19, 2005 and
106 Financial Forecast Center. “3-Month London Interbank Offered Rate LIBOR Forecast.” July 2005. http://www.forecasts.org/3mlibor.htm. July 30, 2005.
107 Federal Home Loan Mortgage Corporation, op. cit.
August 2, 2005.
105 Ibid.
156

In the base case we have assumed an equity investment sufficient to cover all cash needs in excess of
construction loan. A
the
dditionally, we are assuming the developer will agree to defer receipt of its fee until
after the construction loan is repaid but prior to the repayment of the original equity investment.
Inquiries among Boston-area financial professionals have determined that most investors in condominium
developments are seeking returns in the 20% to 25% range, and sometimes even higher, reflecting the
risks they are taking. These risks are primarily market-related risks (sales prices, absorption and
marketability) or construction risks (delays, cost overruns, labor disputes and design errors). The strong
condominium sales market has created considerable demand for investments in condominium
developments, driving down total returns to investors: some deals have reportedly been done in the high
teens. This project, however, might have more risk than most for an investor. The marketability risks (a
neighborhood not yet established for residential uses, large unit sizes (and high prices) that do not match
f new and
Green are involved, this concern will be greatly alleviated). Although offsetting these risks is the
opportunity to develop in Cambridge, we nonetheless conclude that investors will require a 22% to 27%
internal rate of return in order to invest their capital: we are assuming 25% in the financial model. We
envision setting up the ownership entity as an LLC with the developers as managing members. We
al until the investors have reached an IRR of 18% (including the preferred return), and
the primary market segment’s demand or ability to pay, and the visible affordable component) were
discussed in Section 7. In addition, an investor in this project would have to accept the risks o
untested construction methods, a new marketing wrinkle (buyers choosing their unit configurations as
well as finishes) and an untested development team (although to the extent the principals of Oaktree
assume the equity investors would receive a 12% preferred return and then return of capital, plus 80% of
the residu
thereafter 50% of the remaining cash. The balance of the residual goes to the developers.
157

SPREADSHEETS
We created a financial model including the following components (see Appendix C):
• Schedule of Units: size and pricing
• Analysis of pricing of affordable for sale condominiums
• Capital Budget: hard and soft costs
• Pro Forma Cash Flow Statement: monthly and life of project
y
costs,
RESULTS: PROJECT PROFITABILITY AND RETURN TO EQUITY
• Sales and revenue projections
• Expense projections
• Financing
• Summary of Sources and Uses of Funds
The main Development Pro Forma comprises a project cash flow projection. There are columns for total
project figures as well as per unit and gross per square foot numbers. The spreadsheet also indicates the
totals drawn down in the construction loan and from equity investment, as well as the disposition of an
profit. Finally, a month by month breakout of the above was prepared in order to compute interest
but is not included in the Appendix. A second spreadsheet, Sources and Uses of Funds, recasts these
numbers into sources and uses for the life of the project and during the construction period. Please note
that the return of the original equity investment is included as a use of cash; thus, a deficit equates to the
amount of the original investment that will not be recovered, and a surplus equates to a return on that
investment.
A cash flow chart appears below as Figure 34. The sources of funds, on the top half of the chart, are
primarily the equity investment, released to the project in a lump sum after approvals are in hand;
158

monthly disbursements from the construction lender commencing just after the start of construction; and
sales proceeds immediately after completion of the project. The primary uses of funds include design
work commencing immediately after approvals are received; purchase of the land a few months later;
construction, for which the expenses are heaviest in the first six months; and repayment of the
construc n unit closings. tio loan and equity investment after the
Monthly Cash Flow: Galileo Lofts, Option 1
-20,000,000
-5,000,000
5, ,
10,000,000
15, 000
20, ,
25, ,
30,000,000
Cas
h Fl
ow ($
)
-25,000,000
-15,000,000
-10,000,000
Jun-05 Sep-05 Dec-05 Mar-06 Jun-06 Sep-06 Dec-06 Mar-07 Jun-07 Sep-07
Month
0
000 000
000,
000 000
000 000 Sources of CashUses of Cash
Figure 34: Monthly Cash Flow, Option 1
The spreadsheets show that the base case (Option 1) does not achieve profitability. The equity investor
would receive back only 89% of its capital invested (i.e. the loss would be $772,000); obviously, there is
no residual payment to the developer. The IRR of -6.1% reflects the nearly two-year period of the
investment. The project would not be able to get off the ground.
too large, sale prices are too
able
its.
These results are not surprising, given our findings in Section 7. The units are
high for the target market, and there is the risk of a negative market reaction to the presence of afford
housing on the ground floor. There are also concerns about construction costs and the affordable un
159
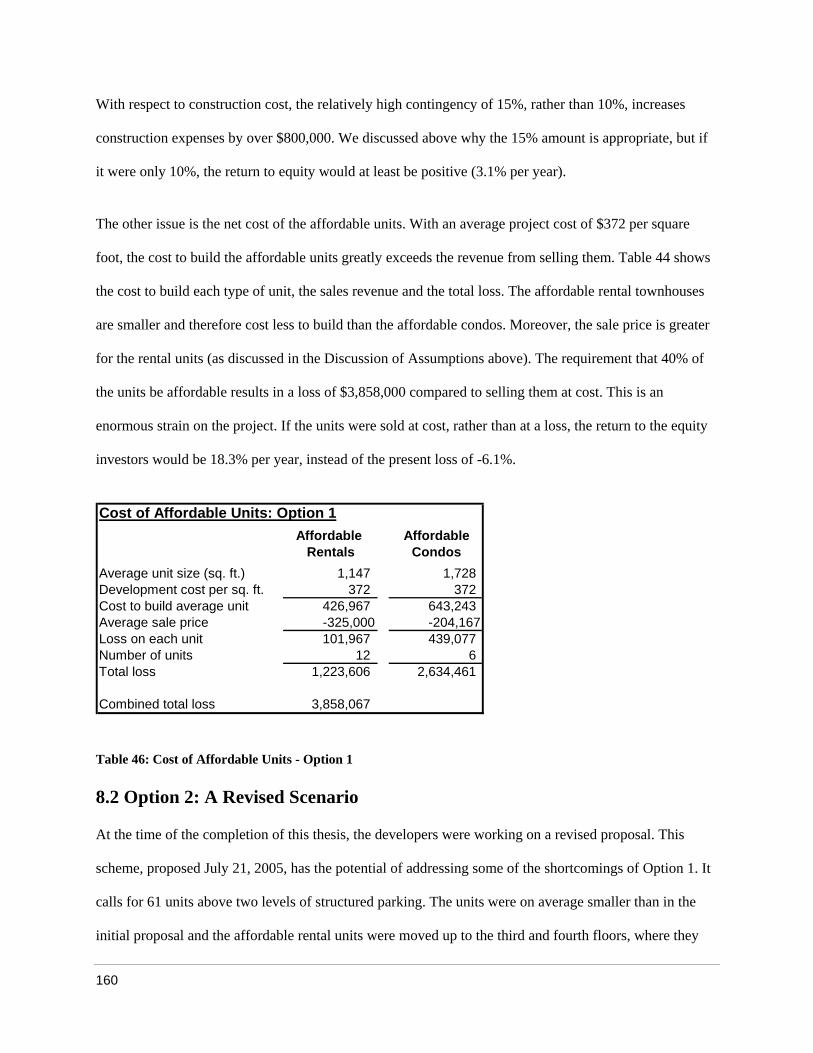
With respect to construction cost, the relatively high contingency of 15%, rather than 10%, increases
construction expenses by over $800,000. We discussed above why the 15% amount is appropriate, but
it were only 10%, the return to equity would at least be positive (3.1% per year).
if
The other issue is the net cost of the affordable units. With an average project cost of $372 per square
foot, the cost to build the affordable units greatly exceeds the revenue from selling them. Table 44 shows
the cost to build each type of unit, the sales revenue and the total loss. The affordable rental townhouses
are smaller and therefore cost less to build than the affordable condos. Moreover, the sale price is greater
for the rental units (as discussed in the Discussion of Assumptions above). The requirement that 40% of
the units be affordable results in a loss of $3,858,000 compared to selling them at cost. This is an
enormous strain on the project. If the units were sold at cost, rather than at a loss, the return to the equity
investors would be 18.3% per year, instead of the present loss of -6.1%.
Cost of Affordable Units: Option 1Affordable Affordable
Rentals CondosAverage unit size (sq. ft.) 1,147 1,728 Development cost per sq. ft. 372 372 Cost to build average unit 426,967 643,243 Average sale price -325,000 -204,167Loss on each unit 101,967 439,077 Number of units 12 6 Total loss 1,22 3,606 2,634,461
Combined total loss 3,858,067
Table 46: Cost of Affordable Units - Option 1
8.2 Option 2: A Revised Scenario
At the time of the completion of this thesis, the developers were working on a revised proposal. This
scheme, proposed July 21, 2005, has the potential of addressing some of the shortcomings of Option 1. It
calls for 61 units above two levels of structured parking. The units were on average smaller than in the
initial proposal and the affordable rental units were moved up to the third and fourth floors, where they
160

would not affect the image of the building, and given a separate entrance. The proposal eliminates the
townhouse component on the ground floor in favor of amenity spaces and residential entries.
Although the average unit is smaller, the issue of unit size is not resolved by this proposal. Of the 45
ge.
We prepared a new model (Option 2), based on the concept of the developers’ revised scheme but
increasing the number of units to 67. Besides further reducing the average unit size, we revised the unit
mix to better meet the demand in the market, in particular including two bedroom units in the 900 sq. ft.
range. (Since our intent was to demonstrate financial feasibility; we did not inquire into structural,
mechanical and design issues which might restrict the combination of unit sizes and configurations.
Obviously that will need to be addressed by the design team.) We adjusted the financial model’s
assumptions relating to the construction budget, unit mix and pricing accordingly (see Assumptions in
Table 47 below). In particular, this option enables us to eliminate the reduction in price per square foot
and absorption as a result of the visible affordable component. The presence of more small units increases
the average per square foot sale price.
condominiums, 12 are 539 sq. ft., which is particularly small, especially when taking into consideration
the other product on the market. The historic sales analysis demonstrated that the average one bedroom
unit is about 672 sq. ft. in the primary market area; units of this size, in new construction, have
consistently been demonstrated to be the first and easiest to sell. The remaining 33 units are all over 1,200
sq. ft. As discussed in Section 7.4, the larger the unit, the less buyers are willing to pay per square foot.
Even the revised proposal for Galileo Lofts does not offer a single unit in the 700 – 1200 sq. ft. ran
Units larger than 1200 sq. ft. are present in the market, but have historically taken longer to sell, and sell
for a lower price per square foot.
161

Assumptions Expected Return
Option 2: 67 units, 2 levels of parking
General:New construction - gross area (n/i garage) 75,000 Units - total 67Market rate condos 40Affordable condos 11Affordable rentals 16Average unit size 1,007 sf
Buildings 1
Sales:Market Units: Base Price / Sq Ft:
1 BR 1 525 2 BR 2 500 3 BR 3 475 4 BR
Floor Premium
Parking spaces 56 (2 levels)
4 455 5,000
Upgrade Package 12,000
Extra Parking Space n/a
Percentage of expected price in this case 100%
Affordable rental unit sale price 325,000
Deed stamps 0.456%200
Commission (market) 4.50%Legal 500Condo working capital 300
Projected future rates of inflation (annual):Price appreciation 5.0%Construction inflation 6.8%
Portion choosing upgrade package (market) 50%
Affordable condo unit sale price:1 BR 1 160,000 2 BR 2 185,000 3 BR 3 200,000 4 BR 4 225,000
Absorption rate: market condos 6 units per month
Expense of Sales:
Closing costs & concessions
162

Purchase Price:Affordable Units 27 10,000 270,000 Market Units 40 30,000 1,200,000 Total Purchase Price 1,470,000 Profit Sharing 30% Maximum: 1,030,000 Maximum price 2,500,000
Expenses:Construction contingency 15.0%Soft cost contingency 8%
Developer's overhead 4%Developer Fee 3%
Project Schedule:Time to permit (months) 9Time to construct (months) 15
Month no.Date of construction estimate -13Start of permitting (month #) 0Receive approvals 5Close on land 8Start of construction (month #) 9Start of marketing (month #) 16Substantial completion (month #) 23CO and 100% completion (month #) 24Closings start 25
Financing:Construction loan:Loan limits: Total Costs 82.5% 28,923,918 23,862,232 Net Sellout 72.5% 29,976,026 21,732,619 Max Construction Loan 21,700,000 Points & fees 1.5% 325,500 Closing costs & lender's legal 50,000 Rate Libor + 2% 5.51%Term (years): 3
Equity:Developer capital deferred development fee 699,197 Investor capital required 6,700,000 Required total return to equity investors 25%Preferred return 12%Residual to investor 80% until IRR of 18%, then 50%Residual to developer 20% , then 50%Investment banking fees 5% 335,000
163

Table 47: Assumptions, Option 2 (preceding two pages)
Monthly Cash Flow: Galileo Lofts, Option 2
-25,000,000
-20,000,000
-15,000,000
-10,000,000
-5,000,000
0
5,000,000
10,000,000
15,000,000
20,000,000
25,000,000
30,000,000
35,000,000
Jun-05 Sep-05 Dec-05 Mar-06 Jun-06 Sep-06 Dec-06 Mar-07 Jun-07 Sep-07
Month
Cash
Flo
w ($
)
Sources of CashUses of Cash
Figure 35: Monthly Cash Flow, Option 2
Unfortunately, these changes actually served to worsen the financial results slightly as compared with
Option 1. A chart of the monthly cash flow projection appears above. As shown on the Option 2 Pro
Forma and related spreadsheets (see Appendix D), the equity investor would lose 11.5% of invested
capital; the IRR would be -6.7%.
Net sales revenue increases from $27.3 million to $30 million. This is a result of 1) having a greater
number of (smaller) units selling at higher prices per square foot (aggregate floor area is unchanged), and
2) relocating the affordable rental component away from the ground floor, thereby removing the $25 per
sq. ft. reduction in price that the visible affordable component would have caused. The absorption rate
also increases as a result. These improvements in price and absorption were not enough to recover the
cost to build the required additional parking, kitchens and bathrooms and pay the additional pu chase r
164

price of the land. (The land price is based on $10,000 per affordable unit and $30,000 per market rate
nit. The additional 9 affordable units and 14 market rate units would raise the land price by $510,000 to
$1,470,000, without counting profit participation.) These changes increase total development costs from
$372 per sq. ft. to $410 per sq. ft. The increased number of affordable units (40% of a larger total number
of units) and the increased per square foot development cost is offset by the smaller size of those units
(see Table 48). The aggregate loss from the affordable units decreases from $3,858,000 (Option 1) to
$3,228,000. We assume that the price for the affordable rental units will not change much even though the
units are smaller. The price for the affordable condos is ultimately based on median income for a given
household size. For this purpose, the number of bedrooms in a unit (not floor area) determines applicable
household size. Thus a 47% reduction in floor area for the average affordable condo unit reduces the
development cost by $269,000 per unit, while reducing the price by only $26,000. Still, the fact remains
that the affordable units in aggregate cost $3,228,000 more to build than they produce in sales revenue.
u
Cost of Affordable Units: Option 2Affordable Affordable
Rentals CondosAverage unit size (sq. ft.) 956 914 Development cost per sq. ft. 410 410
3,227,852
Cost to build average unit 392,038 374,568 Average sale price -325,000 -178,636Loss on each unit 67,038 195,931 Number of units 16 11 Total loss 1,072,609 2,155,243
Combined total loss
Table 48: Cost of Affordable Units - Option 2
On the other hand, Option 2 addresses the issues of unit size, unit price and the visible affordable
component, all of which would have impeded the marketing of the units under Option 1, and therefore it
is in a very real sense less risky. But of course, a proposal expected to lose money will not obtain the
equity or debt financing it needs to be built.
165

SENSITIVITY ANALYSIS
To explore the potential risks in the project, test the assumptions in the financial model, and see if there is
any way to make the project profitable, we performed a sensitivity analysis. The major variables of
concern are: sales prices, absorption rate and capital budget. Because the model already projects increases
in prices at a 5% annual rate, we tested market unit sales prices in a limited range (2.5% and 5%) above
the expected price, but over a larger range (5% and 10%) below the expected values. This range provides
for the possibility that the pricing could be optimistic. Variations outside this range appear unlikely, for
the reasons discussed in Section 3.4. A sensitivity analysis was not necessary for the pricing of the two
types of affordable units. The price of the group of affordable rental units is to be finalized contractually
at the outset of the project. The pricing of the affordable condominiums is tied to what a purchaser at 8
of median income can afford using standard guidelines, and is thus fairly stable. The most significant
variable at this point is the mortgage interest rate, which we projected forward based on Freddie Mac’s
0%
projections for 30-year fixed rate mortgages. In point of fact, there are first-time homebuyer programs
available through MassHousing and the Massachusetts Housing Partnership in conjunction with local
lenders. Often these programs offer below-market interest rates (one of the authors has seen a
commitment letter dated July 27, 2005 for one such program offering a fixed rate of 4.625%,
approximately 1% below prevailing rates). Absorption for Option 2 was projected at 6 per month, based
on similar projects. Since the project is expected to sell out before completion of construction, there can
be no more optimistic case. We tested 4 and 2 sales per month (see Table 49). A slowdown in the rate of
sales does not have much impact until the rate gets to the range of only 2 per month.
166
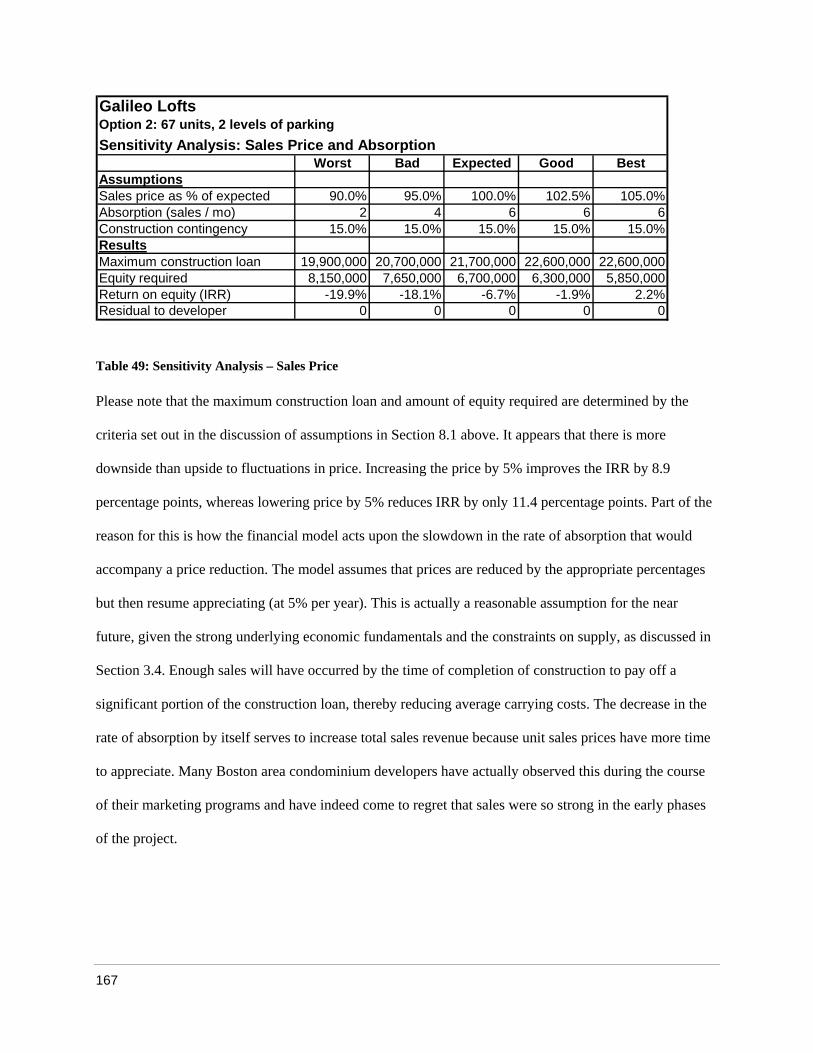
Galileo LoftsOption 2: 67 units, 2 levels of parkingSensitivity Analysis: Sales Price and Absorption
Worst Bad Expected Good BestAssumptionsSales price as % of expected 90.0% 95.0% 100.0% 102.5% 105.0%Absorption (sales / mo) 2 4 6 6 6Construction contingency 15.0% 15.0% 15.0% 15.0% 15.0%ResultsMaximum construction loan 19,900,000 20,700,000 21,700,000 22,600,000 22,600,000Equity required 8,150,000 7,650,000 6,700,000 6,300,000 5,850,000
Residual to developer 0 0 0 0 0Return on equity (IRR) -19.9% -18.1% -6.7% -1.9% 2.2%
Table 49: Sensitivity Analysis – Sales Price
Please note that the maximum construction loan and amount of equity required are determined by the
criteria set out in the discussion of assumptions in Section 8.1 above. It appears that there is more
downside than upside to fluctuations in price. Increasing the price by 5% improves the IRR by 8.9
percentage points, whereas lowering price by 5% reduces IRR by only 11.4 percentage points. Part of t
reason for this is how the financial model acts upon the slowdown in the rate of absorption that would
accompany a price reduction. The model assumes that prices are reduced by the appropriate pe
but then resume appreciating (at 5% per year). This is actually a reasonable assumption for the
future, given the strong underlying economic fundamentals and the constraints on supply, as discussed in
Section 3.4. Enough sales will have occurred by the time of completion of construction to pay off a
significant portion of the construction loan, thereby reducing average carrying costs. The decrease in the
rate of absorption by itself serves to increase total sales revenue because unit sales pric
he
rcentages
near
es have more time
to appreciate. Many Boston area condominium developers have actually observed this during the course
of their marketing programs and have indeed come to regret that sales were so strong in the early phases
of the project.
167

The other major variable is the capital budget. It appears high; hard costs at $310 per sq. ft. and total
project costs at $410 per sq. ft. are both a bit above industry norms for this type of building.108 The
construction budget is based on an estimate from a well-known construction company, but is projected to
increase at the high, but applicable, construction inflation rate of 6.8% per year. The construction
contingency is a substantial 15%, reflecting some of the uncertainties in the final design and the changes
in costs between the date of the estimate in May, 2004 and the projected start of construction in 2006. The
contingency represents a lot of money, about $3 million, but it seems prudent to keep it at that level given
the uncertainties discussed earlier. The project is thus more likely to come in under this budget than over.
ts seem to come in over budget much more often than under.
e
The usual situation is that construction cos
We therefore tested capital expenses by reducing hard cost contingencies to 12.5% and 10%, and by
increasing them to 17.5% and 10%. This resulted in a variation of $1,520,000 in hard costs from on
extreme to another. The table below summarizes the assumptions and results of the analysis.
Galileo LoftsOption 2: 67 units, 2 levels of parkingSensitivity Analysis: Construction Costs
AssumptionsWorst Bad Expected Good Best
Sales price as % of expected 100% 100% 100% 100% 100%
Construction contingency 20.0% 17.5% 15.0% 12.5% 10.0%Absorption (sales / mo) 6 6 6 6 6
ResultsMaximum construction loan 21,700,000 21,400,000 21,700,000 22,600,000 21,700,000
Return on equity (IRR) -15.0% -11.4% -6.7% -1.6% 2.8%Equity required 8,100,000 7,550,000 6,700,000 5,300,000 5,600,000
Residual to developer 0 0 0 0 0
Table 50: Sensitivity Analysis – Construction Costs
108 Cf. RS Means Building Construction Cost Data 2004. Op. cit.
168

Reducing the construction contingency from 15% to 10% might be reasonable if we can obtain a bette
construction cost estimate. This would change the expected return from -6.7% to 2.8%, not enough t
attract the equity capital, but at least not a loss. On the other hand, if construction costs get out of hand,
which is not inconceivable with new methods and materials, an additional 5% contingency more th
doubles the loss.
Galileo LoftsOption 2: 67 units, 2 levels of parkingSensitivity Analysis: Sales Price and Construction Costs
Worst Bad Expected Good BestAssumptions
r
o
an
We did a final iteration of this analysis, varying both sale price/absorption and construction costs. It
appears below. All three iterations are graphed in Figure 36. (In the graph, the worst case is labeled -2, the
expected case is 0, and the best case is 2.)
Sales price as % of expected 90.0% 95.0% 100.0% 102.5% 105.0%Absorption (sales / mo) 2 4 6 6 6Construction contingency 20.0% 17.5% 15.0% 12.5% 10.0%ResultsMaximum construction loan 20,200,000 20,700,000 21,700,000 22,600,000 22,600,000Equity required 9,250,000 8,200,000 6,700,000 5,750,000 5,300,000Return on equity (IRR) -26.4% -22.2% -6.7% 2.5% 6.3%Residual to developer 0 0 0 0 0
Table 51: Sensitivity Analysis – Sales Price & Construction Costs
169

Galileo Lofts, Option 2: Sensitivity Analysis
-30.0%
-25.0%
-20.0%
-15.0%
-10.0%
or's
etu
n on
-5.0%
0.0%
-2 -1 0 1 2
Scenario: Pessimistic / Optimistic
Inve
st R
r E
q (
) 5.0%
10.0%
uity
IRR Sales Prices
Construction Costs
Prices & Costs
Figure 36: Sensitivity Analysis
The best case gives the equity investor an IRR of 6.3%, which is not enough to attract the equity (that
would require a return of approximately 25%); nor does the developer receive a residual. The pes mistic
scenarios are obviously significant losses. In the “Bad” scenario, the investor loses a third of its initial
The assumed variations in sales prices and construction costs also cause variations in the maximum loan
allowed and the equity required. The amount of equity appropriate to invest in a deal of this size,
assuming normal returns, is in the range of 20% of total costs, or about $6 million. The optimistic cases
are below this limit, the expected case is a bit above, and the pessimistic cases are significantly above.
si
investment; in the “Worst” case, it loses 44%.
170
SECTION 9: CONCLUSION AND RECOMMENDATIONS
We have determined that the project has poor marketability and is not financially feasible as originally
proposed (Option 1). The developers are preparing a modified building plan which, with some further
changes (Option 2), would improve marketability significantly, but would not improve financial results.
The sale prices attainable by the market-rate condominiums are not high enough to offset the enormous
cost of selling the affordable units, particularly the affordable condominiums, at a price substantially
below their development cost. This cost, estimated above to be $3,228,000 under Option 2, vastly
outweighs any potential subsidy provided via a below-market price for the land.
The upshot of this analysis is that there is no way that the project could work as presently structured. We
have considered in detail the relevant aspects of the proposed project, including the following:
• the favorable regional and local economic and market context;
osed residential development in the area (supply analysis);
to the proposed building configuration and design
flexibility;
• factors affecting the marketing of the property and how to position it to maximize sales
(marketability);
• factors that determine sales price in relation to other comparable properties;
• capital budget, adjusted for inflation and for unknowns related to the untried construction
methods;
• conventionally available financing options;
• the present and prop
• who are the logical prospective purchasers for the lofts (demand analysis);
• how the property compares to similar properties, including East Cambridge Condominiums
and Lofts available in a wider market;
• how likely purchasers will respond
171

• project cash flows; and
• sensitivity analysis to test the assumptions and evaluate the risks against likely outcomes.
pers
included in the
building (and which ones are close enough to production to be considered in time), and obtain
current budget pricing for construction costs -- as soon as possible -- in order to minimize
, the developers are
510,000
ed into fewer
t
ommend that the developers renegotiate the base
wise go to the developer (i.e., not affecting the portion going to the equity
his should be palatable.
inimal rate of interest, if any, subordinated to the construction loan, in order to
reduce the equity needed and therefore the high returns required to be paid on the equity.
We did not find any way within the structure of the transaction as currently proposed to produce a
financially feasible project.
There are, however, several things the developers might do to enhance the profitability of the project:
• Construction costs remain a substantial question mark. We recommend that the develo
focus the design, decide which innovative construction features will be
cost risks and determine if the contingency can be reduced.
• Given the net cost of developing and selling the affordable units
overpaying for the land. Under Option 2, the base land cost was $1,470,000, or $
above what the CRA would have accepted for the same sized building, divid
units, in Option 1. Additionally, if there were a profit, the CRA would be entitled to 30% of i
up to a total price of $2,500,000. We rec
land price downward, possibly to zero, and agree only to pay CRA a share in the residual that
would other
investors, which would make it harder to raise the capital.) If, as intended, the developer is a
non-profit corporation, t
• To the extent that the base land cost is not reduced to zero, we recommend that the
developers request the Cambridge Redevelopment Authority to lend the purchase price of the
land at a m
172

• We know that there are partial subsidies available for the construction and long-term
The Commonwealth of Massachusetts could potentially provide $550,000 and the City of
Cambridge had at least two sources: HOME funds and the city’s Affordable Housing Trust,
which together might provide approximately $138,500 per unit. Once the design concept and
the expectation that they would be available to the developers at the start of the construction
ould
• ,
idies are available for the
g Trust
.
s
. Perhaps there is a way to change the
financing of the affordable rental component; they are mentioned in the original Proposal.
unit mix are finalized, Just A Start and the developers should apply for these subsidies with
process. This would reduce and postpone funds needed from equity investors, thus reducing
the required returns to equity. The amount of the subsidies received by the developers w
later be credited toward Just-A-Start’s purchase price for those units.
We recommend that the developers seek similar subsidies for the affordable condominiums
which are the most costly units. Some of the above-mentioned subs
production of affordable housing, regardless of tenure. The state’s Affordable Housin
and Housing Stabilization Funds are both potentially available; as are Cambridge’s
Affordable Housing Trust and HOME funds. There are two potential roadblocks, though:
first, the subsidies are rarely approved if the construction of the units is mandated by an
agency of government, and here the CRA’s RFP included a 40% affordability requirement
The reasoning is that the subsidy providers want to apply the subsidies to produce the
maximum number of affordable units. If a developer has to produce the affordable unit
anyway in order to get the project done, why waste the subsidy? In this case, however, a
subsidy may be the only way to get the units built
CRA’s requirement to a preference, which might make it easier to obtain a subsidy.
(Cambridge zoning only requires a 15% affordability requirement: it seems most likely that
no subsidies would be available if only 15% of the units were affordable.) The second
roadblock is programmatic: some of these programs have a limit on the amount they will
173

contribute to any one project, regardless of the number of units, and those subsidies ha
already been eyed for the affordable rentals.
Some of the affordable condos could be put aside for households earning moderate income
at 100% or 125% of median. For example, under Option 2 the affordable condos could be
designated as follows:
o 25% of the units for households earning 80% of median income
o 50% of the units for households earning 100% of median income
o 25% of the units for households earning 125% of median income
The sale prices of these units are based on the ability of persons at the various income levels
to pay the mortgages and other housing costs, using conventional unde
ve
• s
•
rwriting standards (as
o an
l
• e,
The implem
raise equity to
reducing un Option
2, it is our e
of the physi uction
process bein
shown in Appendix C, Buyer’s Underwriting: Affordable Condominiums). Thus, an increase
in the maximum income level can result in an increase in the price. For the scenario above,
the average price would be $227,613, or nearly $49,000 above the price with an income
restriction of 80% of median. For the 11 affordable condo units, this would amount t
additional $538,750 going to the bottom line. But the cost to develop these units would stil
exceed the sales price by $147,000 each.
The last option would be to reduce the requirement for 40% affordable units to a lower figur
and have most, if not all, of the reduction be to the affordable condos.
entation of enough of these changes could reduce the equity required and make it easier to
returns to the level of 25% or more required by the market. If this were done, in addition
it sizes and eliminating the segregation of the low income rental units as proposed in
xpectation that the project could be a successful real estate development and a demonstration
cal feasibility and market response to the innovative chassis and infill design and constr
g developed by House_n and the Open Source Building Alliance.
174
EPILOGUE
Kent Larson of MIT’s House_n Research Consortium conferred briefly after the public hearing with the chagrined agency official. It didn’t look good: the neighborhood was adamant in opposition. A mischievous smile came over the official’s face. He hinted that he might know of another parcel in the area. And it wouldn’t need a zoning change. After what they had been through, Larson was inwardly skeptical. But then he started thinking about how great it would be to put into physical form the concepts he and his team had been working on for the past few years. What a difference these new methods would make to the backward, inefficient process of constructing a building and to the way we live in our homes, he thought. He began to get energized once again. He wondered what those students at the Center for Real Estate came up with. He looked forward to reading their thesis and finding out how his team could pull off this project. Surely some site would work out…. Thus continued the story of the Galileo Lofts.
175

BIBLIOGRAPHY
rs/economy/overview.asp?id=240>
Boston Foundation. “Economy Overview,” Boston Indicators Report 2002.
<http://www.tbf.org/indicato ; U.S. Department of Commerce, Bureau
CB Richard Ellis Northeast Multi-housing Team, “Multi-Housing Market Review: Year End 2004.”
of Cambridge, Massachusetts: Neighborhood
Cambridge Community Development Department. “City of Cambridge, Massachusetts: Demographics
and Socioeconomics Profile.” August 22, 2003.
Cambridge Community Development Department. “City of Cambridge, Massachusetts: Housing Market
Information.” June 20, 2003.
ity of Cambridge, Community Development Department. “Development Log: March/April 2005.”
Cambridge, MA: 2005.
City of Cambridge, Community Development Department. “Development Log: January/February 2004.”
Cambridge, MA: 2004.
City of Cambridge, Community Development Department. “Development Log: May/June 2004.”
Cambridge, MA: 2004.
City of Cambridge, Community Development Department, Eastern Cambridge Planning Study
Committee. “Eastern Cambridge Planning Study.” Cambridge, MA: October 2001.
of Economic Analysis.
Boston, MA, 2004.
Cambridge Community Development Department. “City
Demographics Profile.” March, 2004.
C
176

City of Cambridge. “Mapping Out Cambridge’s Parks, Playgrounds, and Open Spaces.” Cambridge Life.
Spring-Summer 2005. 8 – 10.
y Council. October 15, 2001.
2004.
eaton. Urban Economics and Real Estate Markets. Upper Saddle
Globe Magazine. December 12, 1999.
05.
ag.com/html/content_1202/mit/
HomePrime & Oaktree Development. “Galileo Lofts at MIT: Housing and Urban Park.” Proposal to the
2004.
Jacobs, Jane. The Death and Life of Great American Cities. New York: Vintage Books, 1961.
City of Cambridge. “Part VII - Eastern Cambridge Design Guidelines”, Eastern Cambridge Rezoning
Petition As Adopted by Cit
Colquhoun, Ian. Designing Out Crime: Creating Safe and Sustainable Communities. Boston:
Architectural Press,
Diesenhouse, Susan. “East Cambridge Boomtown to Be.” The Boston Globe. September 25, 2004.
DiPasquale, Denise and William C. Wh
River, NJ: Prentice Hall, 1996.
Fonda, Daren. “Home Smart Home.” The Boston
Grubb & Ellis Property Solutions Worldwide. “Market Snapshot: Cambridge Office & Lab Market Q1
2005.” Boston, MA: March 20
Hall, Peter. “Living for Tomorrow,” Metropolis Magazine. December 2002.
http://www.metropolism
Hillman, Michelle. “Placing a Bet on Rental.” The Boston Business Journal, April 22, 2005.
Cambridge Redevelopment Authority for New Housing and a Public Park on Parcel 7. August 27,
Kelly, Matt. “Executive Domains”, The Boston Business Journal, November 12 – 18, 2004.
177

Larson, Kent. “MIT Open Source Building Alliance: A House_n Initiative.” MIT. Cambridge, MA:
November 11, 2003.
Larson, K., Intille, S., McLeish, T.J., Beaudin, J., and Williams, R.E. “Open Source Building:
Reinventing Places of Living.” BT Technology Journal. 22.4, October 2004. 187 – 202.
ruction.
Westborough, MA: November 23, 2004.
<http://www.mtpc.org/institute/the_index/index_11_23_04final.pdf
Lubell, Sam. “Cambridge’s North Point Names First Architects.” Architectural Record: Const
September 19, 2003.
Massachusetts Technology Collaborative. 2004 Index of the Massachusetts Innovation Economy.
>.
McCarthy, Jonathan and Richard W. Peach. “Are Home Prices the Next ‘Bubble?’” FRBNY Economic
Policy Review. X, 3. December, 2004. Federal Reserve Bank of New York.
McCown, James. “North Point Exposure.” Boston Business Journal. March 15, 2002.
Miles, Mike E., Berens, Gayle, and Weiss, Marc A. Real Estate Development: Principles and Process.
Third Ed., Washington, D.C.: ULI-the Urban Land Institute, 2002.
Massachusetts Institute of Technology. House_n/OSBA/Changing Places Consortium. “Spring 2005
Metropolitan Area Planning Council. Community Population Forecasts, 2005-2025. Boston: March 17,
arket
Update.” Boston, MA: 2005.
<http://www.newyorkfed.org/research/epr/forthcoming/mccarthy.pdf>. July 16, 2005.
Newsletter.” 2005.
2003.
NAI Hunneman Commercial Real Estate Services Worldwide. “Metro Boston Real Estate: M
178

NAI Hunneman Commercial Real Estate Services Worldwide. “The Biotechnology Issue.” Boston, M
August 2004.
A:
cond
e
iniums.” Cambridge, MA: February 18, 2005.
ridge.”
Pitts, Adrian. Planning and Design Strategies for Sustainability and Profit: Pragmatic Design on Building
Reidy, Chris. “Boston Condo Sales Hot; Suburb Housing Cooling.” The Boston Globe. November 12,
2004.
Sharton, Emily. “Playing to Their Peers: Pappas Brothers Build High-End Housing for a Captive
U.S. Department of Housing and Urban Development, Office of Policy Development and Research.
Wilson, William Julius. The Truly Disadvantaged: The Inner City, the Underclass and Public Policy.
NAI Hunneman Commercial Real Estate Services Worldwide. “Metro Boston R&D Market: Se
Quarter 2001 Report.” Boston, MA: 2001.
Nickerson PR Marketing & Events. “Crescent Heights Names Local Marketing Team for the Cambridg
Glass Factory Condom
Palmer, Thomas C., Jr. “Phase I for a City Within a City: Spring Start for NorthPoint in East Camb
The Boston Globe. September 19, 2004.
and Urban Scales. Boston: Architectural Press, 2004.
Audience: Young Professionals Like Themselves.” The Boston Globe. June 22, 2005.
“Housing Data Between the Census: The American Housing Survey.” March 2004.
Chicago: University of Chicago Press, 1987.
179

APPENDIX A: PROPOSAL -- GALILEO LOFTS AT MIT
August 27, 2004
180

Galileo Lofts at MIT:Housing and Urban Park
Proposal to the Cambridge Redevelopment Authority for New Housing and a Public Park on Parcel 7
Developmant Team: A Joint Venture Between
HomePrime and Oaktree Development
Development Partner:
Just-A-Start Corporation
Design and Construction Team:
Suffolk Construction, Construction ManagerSasaki Associates, Landscape ArchitectsWhitney Atwood Norcross Associates Inc., Architects
Friday, August 27, 2004

(This page intentionally left blank.)
182

HomePrime + Oaktree Green LLC, 129 Mount Auburn Street, Cambridge MA 02138
Galileo Lofts at MITA Proposal by HomePrime + Oaktree Green LLC
3
Cover Letter to Cambridge Redevelopment Authority
August 27, 2004
Dear Members of the Cambridge Redevelopment Authority:
Homeprime, Oaktree Green, and Just-a-Start Corporation are pleased to submit this proposal for the development of new housing and public park on parcel 7.
This printed document contains the essential details of our proposal and the team we have assembled. Qualifications are submitted electronically on the accompanying compact disc, including references, CVs, and team member portfolios. If requested, we will provide printed versions of these electronic documents.
We look forward to meeting with the agency to discuss the details of our proposal.
Sincerely,
Kent LarsonLing Yi LiuBarbara Shaw

Galileo Lofts at MIT:Housing and Urban Park
HomePrime + Oaktree Green LLC, 129 Mount Auburn Street, Cambridge MA 021384
Contents:
Cover Letter to Cambridge Redevelopment Authority 3
Table of Contents 4
Introduction 7
1 Parcel 7 and the Eastern Cambridge Planning Study (ECaPS) 9
2 Preliminary Design Proposal 10 2.1 Urban Plan and Context 10 2.2 Parking 12 2.3 Proposed Unit Mix 12 2.4 Affordable Townhouses 12 2.5 Condominiums 14 2.6 Common Space 14 2.7 Public Park 16 2.8 Design and Construction Innovation 16 2.9 Existing Utilities 17
3 Development Team 19 3.1 HomePrime 19 3.2 Oaktree Green LLC 19 3.3 Just-A-Start 19 3.4 Sasaki Associates 20 3.5 Suffolk Construction 20 3.6 Whitney Atwood Norcross Architects (WAN) + Touloukian Touloukian Inc. 20
4 Approval Process Issues 21
5 Affordable Housing Condominium 23 5.1 Purchase by Just-A-Start Corporation 23 5.2 Affordable Housing Financing 23
6 Business Proposal 24 6.1 Business Proposal Outline 24 6.2 Term Sheet - Galileo Lofts @ MIT 25

HomePrime + Oaktree Green LLC, 129 Mount Auburn Street, Cambridge MA 02138
A Proposal by HomePrime + Oaktree Green LLCAugust 27, 2004
5
Table of Contents7 Action Plan (Developer + CRA) 27 Phase 1 Predevelopment and Planning (fall and winter 04) 27 Phase 2 Regulator Process (spring and summer 05) 27 Phase 3 Financing and Presales (fall 05 thru winter 06) 27 Phase 4 Construction (spring 06 thru early spring 07) 27
8 Conclusion 29
Appedix 1 Curriculum Vitae: Key Development Team Personnel 31 Kent Larson 31 Ling Yi Liu 32 Arthur A. Klipfel III 33 Gwendolyn G. Noyes 34 Pradip Tandon 35 Thomas J. McLeish 36
Appedix 2 Qualifications 37 HomePrime and Oaktree Development CD Just-A-Start Corporation CD Suffolk Construction CD Sasaki Associates CD Whitney Atwood Norcross Associates, Inc. CD

Galileo Lofts at MIT:Housing and Urban Park
HomePrime + Oaktree Green LLC, 129 Mount Auburn Street, Cambridge MA 021386

HomePrime + Oaktree Green LLC, 129 Mount Auburn Street, Cambridge MA 02138
A Proposal by HomePrime + Oaktree Green LLCAugust 27, 2004
7
Galileo Lofts at MITHousing and Urban ParkParcel 7, Kendall Square Urban Renewal Area
Introduction
Parcel 7, located in the Kendall Square Urban Renewal Area, is not currently zoned for new development. We believe, however, that carefully designed development project could be approved by the City if it achieves major goals of the community, which include:
• Create more housing with an emphasis on affordable units and housing close to place of work,
• Create additional well-designed open space
• Create 24-hour activity and animate streets with multiple entries.
This proposal has been developed to achieve each of these goals.
In addition, we believe there is a strong market in this area for customizable loft condominiums with rich amenities and services to serve the business and academic community in the immediate area.
To realize the potential of the site, a unique and broadly experienced team has been formed to manage the complex design, permitting, and construction process. This effort will take advantage of state-of-the-art design, visualization, construction, and building technology to produce a high-profile and distinctive project that will be an asset to the community.

Galileo Lofts at MIT:Housing and Urban Park
HomePrime + Oaktree Green LLC, 129 Mount Auburn Street, Cambridge MA 021388

HomePrime + Oaktree Green LLC, 129 Mount Auburn Street, Cambridge MA 02138
A Proposal by HomePrime + Oaktree Green LLCAugust 27, 2004
9
1 Parcel 7 and the Eastern Cambridge Planning Study (ECaPS)
In the 1970s and early 1980s, much of the Kendall Square area consisted of vacant factories and warehouses. Planning and investment in this area focused on the availability of uniquely large parcels of land in close proximity to MIT and an MBTA Red Line station. Through the work of the CRA and others, collective visions became real. After two decades of steady real estate investment, Kendall Square is now the offi ce / R & D core of the City of Cambridge.
In the late 1990s, many residents felt that the pace and scale of development in the City needed to be checked. In 1999, several East Cambridge residents, seeking a moratorium on development in East Cambridge, fi led the Larkin Petition. The City responded by allowing a moratorium, defi ning an East Cambridge Study area, appointing an 18 member Study Committee and hiring a consultant to assist in the planning study. This study and resulting report, the Eastern Cambridge Planning Study, “ECaPS” allowed residents, CRA representatives and other interested parties to re-vision and recommend zoning for several East Cambridge areas including some parts of Kendall Square.
The only CRA controlled parcel included in ECaPS was Parcel 7. Although the ECaPS “Transition Area A and B” plan identifi ed Parcel 7 as open space. Parcel 7 was further identifi ed as in the “Transition Area”. ECaPS identifi ed three overall major goals for the Transition Area*:
1. Encourage new residential development, 2. Use fi nely graduated heights to create transitions in scale, and 3. Create better pedestrian and bicycle connections.
In ECaPS, as in other planning and zoning venues, conversations about Kendall Square have always included the desire to increase housing in the area in order to achieve the following results:
1. Decrease potential traffi c by housing people who might otherwise drive to work 2. Meet the need for housing3. Increase the supply of affordable housing4. Create a 24-hour presence5. Animate streets with multiple entrances
In keeping with the goals articulated in ECaPS, this proposal is for the development of Parcel 7 for housing, with a large portion of affordable housing, and public open space. The developer proposes to meet with East Cambridge residents including ECaPs study members and East Cambridge Planning Team members to seek agreement for the development of the site as proposed and to seek design ideas for the public open space.
* This paragraph updated from original submitted hardcopy.

Galileo Lofts at MIT:Housing and Urban Park
HomePrime + Oaktree Green LLC, 129 Mount Auburn Street, Cambridge MA 0213810
2 Preliminary Design Proposal
A pre-schematic urban plan and building design have been developed to test the potential of the project and to generate a realistic budget. The proposed 9 story building includes approximately 60,000 square feet of housing and common space. Although careful developed, the precise area, number of stories, and design elements may change during the development process due to input from the community, site utility constraints (particularly the existing telephone duct), negotiations with the city, and the marketing/budgeting process. This section describes the design attributes:
2.1 Urban Plan and ContextThe new building has been located at the extreme northern end of the site. It relates to the massing and orientation of the Genzyme building along Binney Street, and completes the building line of Binney Avenue as viewed from the movie theaters and entry to One Kendall Square. The proposed building is as narrow as practical to maximize the area for public park to the south. This new building terminates the Galileo Galilei Way axis that runs north from the Stata Center, and creates a well-defined open space (see Public Park below).
Schematic site plan, urban context.
LOFTS AT MIT APRIL 28, 2004
SITE PLAN
Schematic site plan, Parcel 7.

HomePrime + Oaktree Green LLC, 129 Mount Auburn Street, Cambridge MA 02138
A Proposal by HomePrime + Oaktree Green LLCAugust 27, 2004
11
View of site looking east from movie theater on Binney Street.
View from site looking south down Galileo Galilei Way.
View of site looking north from sixth floor of Stata Center.
View of site looking west on Binney Street.

Galileo Lofts at MIT:Housing and Urban Park
HomePrime + Oaktree Green LLC, 129 Mount Auburn Street, Cambridge MA 0213812
2.2 ParkingParking is located under the building approximately five ft. below street level, with the access drive from Binney Street. This will likely minimize the cost of foundations by allowing spread footings (evaluation by McPhail Associates), will minimize the length of the ramp down from the street, and may result in the telephone cables to remain largely undisturbed. It also places the first level of housing at an elevation that allows for traditionally scaled townhouse entry stoops.
The high percentage of affordable units and the desire to produce a higher-quality-than-normal residential building requires that the building be designed as efficiently as possible. To maximize the use of construction funds, the units and demising walls are designed to transfer loads to the parking level on columns spaced 27ft. - 6in. (accommodating 3 cars), and the 42-foot building width relating to the drive aisle and parking depth. As required by the city, one parking space will be provided for each unit. The development team will investigate the possibility of off-site parking to meet some of the parking requirement. Time-shared spaces for townhouses may allow for fewer on-site parking spaces. In addition, with the CRA’s approval, the development team may wish to request additional units if off-site parking is available and approved by the City.
2.3 Proposed Unit MixWhile the final number and percent of affordable units is dependent upon the total number of units, which will be determined during the permitting, design and financing processes, our initial proposal is for 21 market rate condominiums, 3 inclusionary condominiums and 12 affordable rental units (organized as a single condominium unit). As defined in the CRA Request for Proposals, we propose a mixed income development with more than 40% of the units affordable to household at incomes of 80%of median or less. The percentage of inclusionary and affordable units in our proposal is 41%. Responding to the need for affordable rental housing for families with children, we are proposing that at least half (and perhaps all) of the affordable rental units have 3 bedrooms.
21 market condominiums (58%)
3 inclusionary condominiums (8%)
12 affordable rentals (33%)
36 condominiums and apartments
2.4 Affordable Townhouses One level above parking, and approximately five feet above existing grade, are 12 two-story townhouses. This initial design places the affordable rental units in the most logical place for larger family-sized units housing families with children: close to the ground with multiple entries. We envision townhouse-scaled facades on the lower 2 ½ floors of the building facing Binney Street. In addition to best fitting the needs of residents, this design scheme achieves some of the goals articulated in ECaPS by enlivening the ground floor of the building with active residential use, articulated with multiple entries facing the East Cambridge residential neighborhood to the North. Each townhouse is approximately 1,150 square feet, and each has light from two sides (north and south).

HomePrime + Oaktree Green LLC, 129 Mount Auburn Street, Cambridge MA 02138
A Proposal by HomePrime + Oaktree Green LLCAugust 27, 2004
13
PARKING LEVEL, ELEVATION - 5 FTLOFTS AT MIT APRIL 28, 2004
Dining
Living Room
Cl
Bedroom
Dining
Living Room
Cl
Bedroom
Dining
Living Room
Cl
Bedroom
Dining
Living Room
Cl
Bedroom
Dining
Living Room
Cl
Bedroom
Dining
Living Room
Cl
Bedroom
Dining
Living Room
Cl
Bedroom
Dining
Living Room
Cl
Bedroom
Dining
Living Room
Cl
Bedroom
Dining
Living Room
Cl
Bedroom
Dining
Living Room
Bedroom
CONDOMINIUM TERRACE
PUBLIC PARK
FLOOR 1 LOBBY AND LOWER TOWNHOUSELOFTS AT MIT APRIL 28, 2004
Dining
Living Room
Cl
Bedroom
Cl
FLOOR 2 - UPPER TOWNHOUSELOFTS AT MIT APRIL 28, 2004
Bedroom
Bedroom
Cl
hw
Cl
Bedroom
Bedroom
Cl
hw
Cl
Bedroom
Bedroom
Cl
hw
Cl
Bedroom
Bedroom
Cl
hw
Cl
Bedroom
Bedroom
Cl
hw
Cl
Bedroom
Bedroom
Cl
hw
Cl
Bedroom
Bedroom
Cl
hw
Cl
Bedroom
Bedroom
Cl
hw
Cl
Bedroom
Bedroom
Cl
hw
Cl
Bedroom
Bedroom
Cl
hw
Cl
Bedroom
Bedroom
Cl
hw
Cl
Bedroom
Bedroom
Cl
hw
Parking Plan
Affordable Townhouses : Level One
Affordable Townhouses : Level Two

Galileo Lofts at MIT:Housing and Urban Park
HomePrime + Oaktree Green LLC, 129 Mount Auburn Street, Cambridge MA 0213814
2.5 CondominiumsIn our proposed building design, all condominiums are served by a common lobby that can be entered from both Binney Street and the park to the south. There is a mix of unit sizes, and both flats and duplexes are included. Each unit has unobstructed southern views and light. The two larger units on each floor have light and views on three sides. All units will be customizable (see Design and Construction Innovation, page 16).
2.6 Common SpaceSpace has been designated on the top floor and in the lobby for common space and a roof terrace has been provided. The common space may be adaptable for social events, private functions, and business meetings. The space would include both entertainment and work-related technologies.
MIT House_n study of configurable apartments.

HomePrime + Oaktree Green LLC, 129 Mount Auburn Street, Cambridge MA 02138
A Proposal by HomePrime + Oaktree Green LLCAugust 27, 2004
15
LOFTS AT MIT APRIL 28, 2004 FLOORS 2,4,6,8
FLOORS 3,5,7,9LOFTS AT MIT APRIL 28, 2004
Condominiums : Floors 2, 4, 6, and 8
Condominiums : Floors 3, 5, 7, and 9
LOFTS AT MIT APRIL 28, 2004 FLOOR 10
Common Space at Penthouse

Galileo Lofts at MIT:Housing and Urban Park
HomePrime + Oaktree Green LLC, 129 Mount Auburn Street, Cambridge MA 0213816
2.7 Public ParkWe propose that our development team create a master plan that includes all of the open space visually defined by the new building, which includes the southern portion of parcel 7, the Biogen garden across Galileo Galilei Way, the railroad right of way, the opening to One Kendall Center between the Amgen and Genzyme buildings, and parcel 5 running from Broadway to Main Street to the south (see schematic site plan on page 10). Sasaki Associates has agreed to join the design team to generate the master plan and park design. This master plan will be used to inform the design of a new public park.
The development of new market rate housing will fund the development of a park master plan and basic green space amenities on Parcel 7. We propose that the design team and the Director of the CRA approach the adjacent major businesses to contribute to funding of design, construction, and maintenance of a public park beyond the scope of the housing development funded park. With appropriate funding and with the CRA’s approval, the park may include emerging design and technologies being developed by industry and MIT (particularly the Media Lab), and could extend to parcel 5.
• Street furniture and technologies to create innovative public space and Garden “rooms” for lunch time work, leisure, etc.
• Responsive lighting.• Places for public displays and public art.• Directed audio spotlight for performance (non-disruptive to those outside a zone).• Multi-use path for bikes and running.
A portion of the park – perhaps at the node on parcel 5 that currently houses the largely unused playground – could be developed as at “street lab” to prototype emerging public place technologies that are being developed by industry, the MIT Media Lab, and the MIT Lab for Artificial Intelligence and Computer Science across the street in the new Stata Center. Note: Kent Larson is currently working with the Boston Redevelopment Authority on a proposal to install such technologies on a Central Artery parcel.
2.8 Design and Construction InnovationThe building has been designed to accommodate both conventional steel and concrete construction, as well as prefabricated steel and concrete modules (each 10’-0” high, 13’-6” wide, and 45’-0” deep). The precise construction methodology would be determined during the design phase. The design team will first consider the use of prefabricated open-loft building “chassis” modules with standardized electrical, data, plumbing, and mechanical connections for rapid, low-labor assembly at the site. This methodology takes advantage of the work of the MIT Open Source Building Alliance, directed by Kent Larson, and the industrial sponsors. Two modular fabricators have reviewed the proposed design, and preliminary evaluation indicates that this approach may be cost effective, dramatically reduce construction time, and would result in higher-quality apartment interiors. This approach would also allow for the cost-effective articulation of the façade with varying length modules.

HomePrime + Oaktree Green LLC, 129 Mount Auburn Street, Cambridge MA 02138
A Proposal by HomePrime + Oaktree Green LLCAugust 27, 2004
17
The exterior of the building would consist of a curtain wall, detailed to fit within the context of the adjacent office and institutional buildings. Discussions have been initiated with the Massachusetts Technology Collaborative to subsidize the inclusion of state-of-the-art energy-producing, energy conservation technologies, including building integrated photovoltaics. Other sources of subsidies, both industrial and governmental, may be available.
The condominium units are designed as configurable lofts. Each unit will be constructed with bathrooms, demising walls, wood floors, washer/dryer, individual HVAC system, and carefully located connections for kitchen plumbing, power, and data. At the point of presale (during or before the construction process), a set of options will be offered to the buyer, including a variety of kitchen layouts, cabinetry storage/organizing units, and special purpose components for work, and entertainment. If permitted by the City, buyers will have live-work design options, allowing residential space to be transformed to professional office space during the day.
2.9 Existing Utilities The proposed design assumes that issues related to the existing telephone duct can be successfully resolved, either by reworking it’s configuration to permit foundations and parking, or by relocation. It also assumes that no utility easement would prevent the development of the site. Immediately upon designation as developer, the CRA and the design team’s structural and geo-technical engineer would be asked to investigate the issue and make recommendations to the development team.

Galileo Lofts at MIT:Housing and Urban Park
HomePrime + Oaktree Green LLC, 129 Mount Auburn Street, Cambridge MA 0213818

HomePrime + Oaktree Green LLC, 129 Mount Auburn Street, Cambridge MA 02138
A Proposal by HomePrime + Oaktree Green LLCAugust 27, 2004
19
3 Development Team
The development team will be led by a joint venture of Homeprime Corporation (a company committed to a new model for housing by deploying new technologies, design concepts, and services) and Oaktree Development (a premier residential developer in Cambridge). Just-A-Start Corporation (a non-profit community development corporation creating affordable housing) will pre-purchase the affordable units and will serve as project consultant. The design and construction team will include Sasaki Associates (landscape architects with significant experience in the redevelopment authority area), Suffolk Construction (a leading multifamily residential construction management firm in the Boston area), and WAN Architects (specialists in new construction methods for multi-family residential, dormitories, etc.).
3.1 HomePrimeHomePrime Corporation was founded to exploit the combination of the real world development insights accumulated in Oaktree over the years and innovative ideas originating from MIT housing research to improve housing development. It is a development process company offering design, construction, process, and technology innovations to developers and housing/redevelopment agencies.
3.2 Oaktree Green LLCOaktree was originally founded as Unihab, Inc. in 1969 as a design/build company specializing in factory-produced, urban, multifamily housing. In recent years, Oaktree has focused primarily on urban infill multifamily housing. It has completed many large and successful housing development projects in Cambridge, including Thomas Graves Landing, 1008 Massachusetts Avenue, 950 Massachusetts Avenue, 369 Franklin Street, and Cambridge Park Place near the Alewife T-stop. A 165-unit condominium project with the City of New London Redevelopment Authority is currently under construction in Connecticut.
3.3 Just-A-StartJust-A-Start Corporation (JAS) is a non-profit community development corporation providing a range of services, resources and technical assistance related to expanding training/education and affordable housing opportunities for low and moderate income people. JAS began in 1968 as a program of the Cambridge Redevelopment Authority offering Cambridge teens enrichment opportunities including jobs in neighborhood improvement projects. Since its incorporation as a separate private non-profit corporation in 1970, JAS has expanded into the metro Boston area offering a range of services and resources. With a twelve member Board of Directors and forty-eight full-time employees, JAS has an annual operating budget of 4 million dollars and offices in Cambridge and Boston. Through direct ownership, or ownership by subsidiary corporations and partnerships, JAS now owns and operates 529 affordable apartments in Cambridge at 16 different sites. JAS will assign two staff members to work on this project; Gordon Gottsche is a former CRA employee who has been the Executive Director of Just-A-Start from its inception and Barbara Shaw, Housing Development Director, who has been a JAS employee for 20 years. Additional JAS Housing Development staff trained in architecture, construction and law may assist in the course of development.
Galileo Lofts at MIT:Housing and Urban Park
HomePrime + Oaktree Green LLC, 129 Mount Auburn Street, Cambridge MA 0213820
3.4 Sasaki AssociatesFounded in 1953 by Hideo Sasaki, Sasaki Associates is an interdisciplinary firm of more than 270 professionals. Sasaki has worked with its clients to create some of the most recognizable icons of modern landscape architecture. The landscape architecture practice is integrated with civil engineering and urban design to create new designs on diverse and challenging sites, including urban waterfronts, college campuses, sensitive environmental areas, and brownfields. Sasaki Associates produced the master plan and landscape design for the Biogen campus opposite Parcel 7, and for the nearby Technology Square @ MIT.
3.5 Suffolk ConstructionSuffolk Construction was recognized by Boston Business Journal as the area’s Largest General Contractor in 2003, employing over 650 people and with current annual billings totaling $900,000,000. Suffolk’s current project portfolio encompasses commercial, office, retail, educational, healthcare, senior living, hospitality, multi-family residential, research & development, and industrial sectors – with projects located in 22 states across the United States. Suffolk worked with Ling Yi Liu and Kent Larson on Oaktree Development’s 369 Franklin Street multifamily housing project, completed last year. Michael Moise, Project Executive for 369 Franklin Street, will also work on Galileo Lofts.
3.6 Whitney Atwood Norcross Architects (WAN) Architects + Touloukian Touloukian Inc.Whitney Atwood Norcross Associates, Inc. was founded in 1959. WAN offers a comprehensive range of professional architectural services. The firm has extensive experience in the preparation of feasibility studies and design documents, as well as expertise in construction administration. Recent projects include a number of college and university residence halls, science and research buildings, educational facilities, healthcare institutions, office buildings, and renovations. The construction documents produced by WAN are widely recognized as setting the standard in the profession. WAN has recently completed a number of successful projects with Suffolk Construction, and this relationship will be an asset to the project. WAN the prime architect will combine resources with Touloukian Touloukian Inc., the associated principal designer.

HomePrime + Oaktree Green LLC, 129 Mount Auburn Street, Cambridge MA 02138
A Proposal by HomePrime + Oaktree Green LLCAugust 27, 2004
21
4 Approval Process Issues
Usually a parcel of land has an “as-of-right” amount of buildable square feet associated with it based on the size of the lot and the dimensional requirements of the zoning district in which it is located. A lot of 49,500 square feet (parcel 7 area) would have the potential for residential build-out as indicated in some other Cambridge zoning districts.
District FAR Allowed +InclusionaryRes C-3, O3, O3-A, Bus B, Bus B-2 3.0 148,500 193,050Res C-2A 2.5 123,750 160,875Res C-2B, Office 2, Business C 2.0 99,000 128,700Res C-2B 1.75 86,625 112,613
As part of the “Cambridge Center Mixed Use Development” (MXD) area, parcel 7 is subject to an aggregate district cap for gross floor area of 2,773,000 square feet for non-residential uses and an additional 200,000 square feet for residential uses (exclusive of parking). This total of 2,973,000 has either been built, permitted for building or has been contractually committed to by the CRA for other sites in the District.
The provisions of the MXD zoning district also require a minimum of 100,000 square feet of permanent public open space in the district. Given the open space already developed or proposed for the district, the amount of open space will considerably exceed the required minimum. This development proposes that a minimum of 15,000 square feet, or approximately 33% of the site, be permanently designated as public open space.
If designated, this development team proposes to work with CRA staff, legal assistance and the Cambridge Community Development Department to identify the process by which Parcel 7 can be developed. It is likely that the final Cambridge permitting process may include an application to the Cambridge Board of Zoning Appeals for a variance and an application to the Cambridge Planning Board for a special permit. The proposal will* require an application to the Cambridge City Council for a curb cut.
Parcel 7 is located adjacent to the “Western Connector”, a railroad spur line. This proximity to the railroad triggers permitting requirements under state regulations. The development team will obtain the necessary permits to build on the site. * Updated from original submitted hardcopy.

Galileo Lofts at MIT:Housing and Urban Park
HomePrime + Oaktree Green LLC, 129 Mount Auburn Street, Cambridge MA 0213822

HomePrime + Oaktree Green LLC, 129 Mount Auburn Street, Cambridge MA 02138
A Proposal by HomePrime + Oaktree Green LLCAugust 27, 2004
23
5 Affordable Housing Condominium
5.1 Purchase by Just-A-Start CorporationJust-A-Start Corporation (JAS) proposes to purchase the single ground floor condominium of 12 units at the completion of construction. Commitments to purchase the units, along with financing commitments for the permanent financing, would be obtained at the start of construction. An anticipated sales price for the affordable rental units is approximately 4 million dollars. This is comparable to the development cost of other affordable initiatives with 2-3 bedrooms per unit under development in Cambridge.
5.2 Affordable Housing FinancingJAS will assemble permanent financing using multiple financing sources. Possible financing sources may include the following.
• HUD HOME allocated by the Commonwealth of Massachusetts• Housing Innovation Funding through the Commonwealth of Massachusetts• Housing Stabilization funding through the Commonwealth of Massachusetts• HUD HOME allocated by the City of Cambridge• Cambridge Affordable Housing Trust, including Community Preservation Act • Massachusetts Affordable Housing Trust through MassHousing• A state allocation of low income housing tax credits allowing investor equity• A fixed rate amortizing loan from a conventional lender• Allocation of project based HUD section 8 from Camb Housing Authority• Recent State funding initiatives announced by Mass Housing Partnership and Mass
Housing including funding for housing developed near mass transit.
The goal of the permanent financing package will be to assemble the funds required to purchase the units keeping the debt service ratio at 1.2%.
The development team will also explore the possibility of affordable housing financing that might be made available during the construction of the project due to the high overall percentage of affordable housing.

Galileo Lofts at MIT:Housing and Urban Park
HomePrime + Oaktree Green LLC, 129 Mount Auburn Street, Cambridge MA 0213824
6 Business Proposal
6.1 Business Proposal OutlineWithin 60 days of designation, Galileo Lofts LLC (a joint venture between Oaktree Green LLC and HomePrime Corporation) and CRA will sign a development agreement detailing the milestones that must be achieved before land transfer. It is expected that land transfer will occur at the closing of construction financing for the housing. Significant pre-sales are planned. The townhouses are to be pre-sold to Just-A-Start CDC. Some of the market-rate units may be sold as executive units, while others may be sold as live-work units. Using HomePrime Corporation’s adaptable home designs, strong pre-sales are expected since buyers will be able to buy units more suited to their needs.
Since 40% of the units are to be affordable, the project may qualify for favorable construction financing from the Massachusetts Housing Finance Agency (MHFA). Just-A-Start will work on its own with various funding agencies to purchase of the affordable townhouses. Funding for specific innovative technologies may also be sought from entities such as the Massachusetts Technology Collaborative or corporations currently supporting research at MIT’s House_n research project.
Oaktree and HomePrime are pleased to offer a base amount of $30,000 per market rate unit and $10,000 per affordable unit assuming no adverse site conditions payable at land transfer. At project end, CRA will receive 30% of the project profits up to a final purchase price of $2.5 million. We believe that this method of payment is reasonable given the uncertainties in the permitting process and the high affordable component which makes an accurate determination of the purchase price difficult.

HomePrime + Oaktree Green LLC, 129 Mount Auburn Street, Cambridge MA 02138
A Proposal by HomePrime + Oaktree Green LLCAugust 27, 2004
25
6.2 Term Sheet - Galileo Lofts @ MITThe following terms are proposed for developing the property identified as Parcel 7 of Kendall Square Urban Renewal Area in Cambridge, Massachusetts
1 Developer Galileo Lofts, LLC a Massachusetts Limited Liability Company to be formed as a Joint Venture between HomePrime Corporation and Oaktree Green, LLC.
2 Development Proposal
Develop approximately 60,000 square feet plus parking for 36 residential units comprising of 21 market rate units, 3 inclusionary units, and balance 12 “deep” affordable units.
3 Development Agreement
Developer to sign Development Agreement with CRA to cover decision making process and property transfer. Developer to retain final decision and control over project and marketing of units subject to terms of this agreement.
Just-A-Start (JAS) will sign a purchase and sale agreement with the Developer before closing of the construction loan to purchase 12 affordable units at a price to be mutually agreed upon.
4 Land Purchase Price
$30,000/market rate unit and $10,000/affordable unit payable at closing of Construction Loan ($780,000). Plus 30% of final project profit (up to $1.72 M) after all costs including Developer Overhead / Management Fees are paid. Minus cost of soil remediation and any unusual site related cost (ie moving telephone duct).
5 Project Costs Budget to be developed in consultation with CRA and Just-A-Start.
6 Developer Overhead and Management Fees
Developer overhead and fees will be 7% of project cost including land price. Project management team (included in the 7%) to be $7,000/month from designation till project completion. Fee will accrue until zoning permits are received.
7 Park Project will include the planning of a public park. Scope of park will be determined thru a community process. Contributions towards development and operation of the park will be sought from neighboring companies. CRA will have a lead role in this process. City ownership of park to be explored.
8 Assumptions CRA to provide topographical survey including utility connections as well as borings to ascertain hazardous materials and geotech conditions.
A development agreement between CRA and Galileo Lofts LLC will be signed within 60 days of acceptance of proposal.
CRA will take the lead in obtaining zoning permits from the city.

Galileo Lofts at MIT:Housing and Urban Park
HomePrime + Oaktree Green LLC, 129 Mount Auburn Street, Cambridge MA 0213826
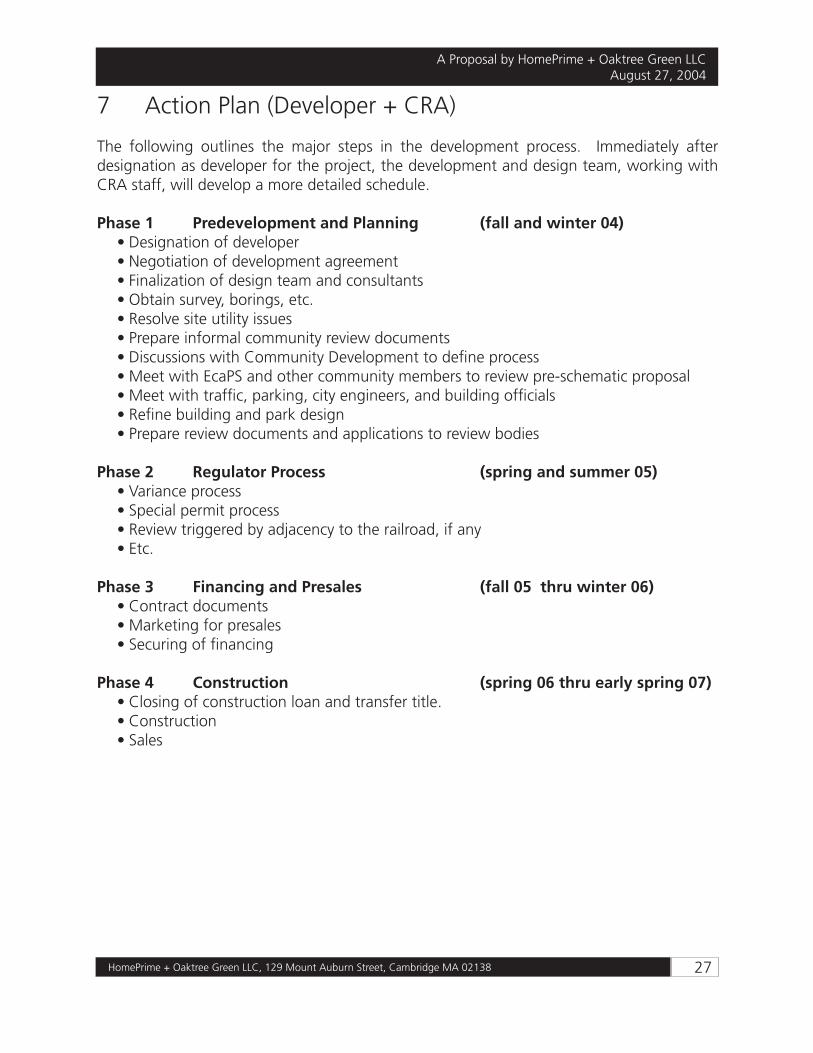
HomePrime + Oaktree Green LLC, 129 Mount Auburn Street, Cambridge MA 02138
A Proposal by HomePrime + Oaktree Green LLCAugust 27, 2004
27
7 Action Plan (Developer + CRA)
The following outlines the major steps in the development process. Immediately after designation as developer for the project, the development and design team, working with CRA staff, will develop a more detailed schedule.
Phase 1 Predevelopment and Planning (fall and winter 04)• Designation of developer• Negotiation of development agreement• Finalization of design team and consultants• Obtain survey, borings, etc.• Resolve site utility issues• Prepare informal community review documents• Discussions with Community Development to define process• Meet with EcaPS and other community members to review pre-schematic proposal• Meet with traffic, parking, city engineers, and building officials• Refine building and park design• Prepare review documents and applications to review bodies
Phase 2 Regulator Process (spring and summer 05)• Variance process• Special permit process• Review triggered by adjacency to the railroad, if any• Etc.
Phase 3 Financing and Presales (fall 05 thru winter 06) • Contract documents• Marketing for presales• Securing of financing
Phase 4 Construction (spring 06 thru early spring 07)• Closing of construction loan and transfer title.• Construction• Sales

Galileo Lofts at MIT:Housing and Urban Park
HomePrime + Oaktree Green LLC, 129 Mount Auburn Street, Cambridge MA 0213828

HomePrime + Oaktree Green LLC, 129 Mount Auburn Street, Cambridge MA 02138
A Proposal by HomePrime + Oaktree Green LLCAugust 27, 2004
29
8 Conclusion
The entire development and design team will immediately begin Phase 1 activities upon designation as developer for this exciting project. We are available to discuss the details of this proposal with the Cambridge Redevelopment Authority.

APPENDIX B: DRAWINGS -- OPTION 1
April 28, 2004
210


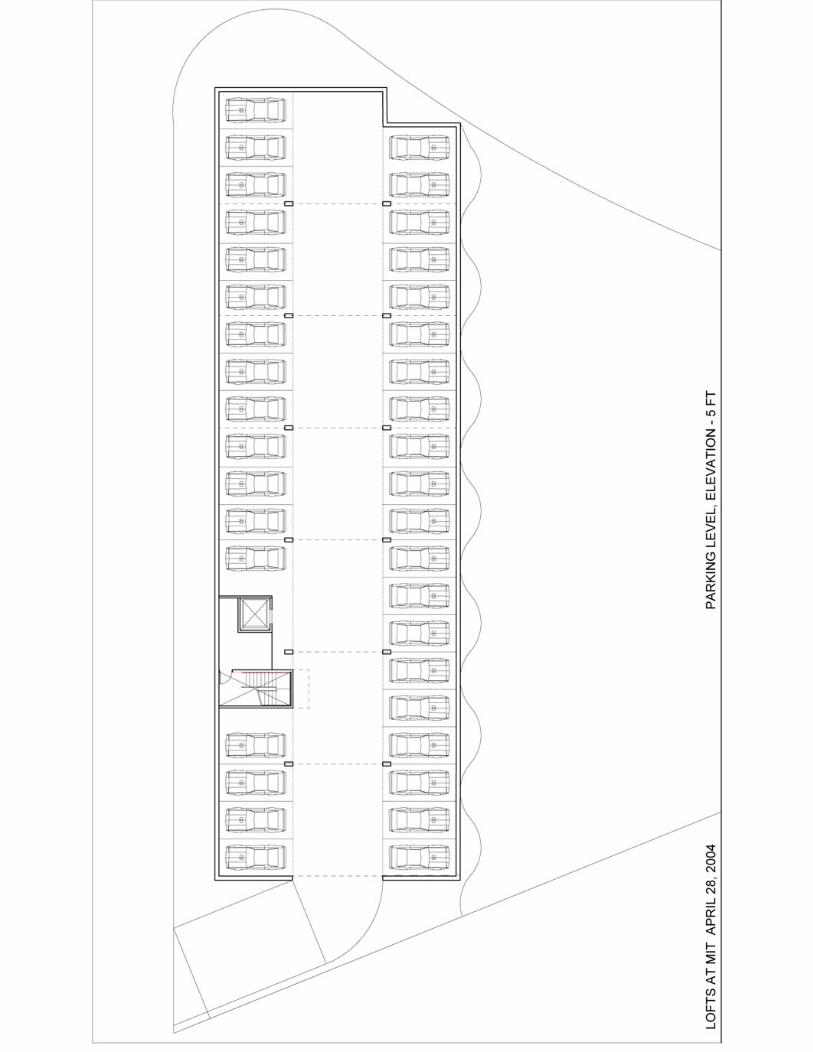


APPENDIX B: DRAWINGS -- OPTION 2
July 21, 2005
217


GA
LILE
O L
OFT
S @
MIT
21J
UL2
005
Fl
oo
rs 3
-4 -
Ren
tal U
nit
s

GA
LILE
O L
OFT
S @
MIT
21J
UL2
005
Fl
oo
rs 5
-9 -
Co
nd
o U
nit
s
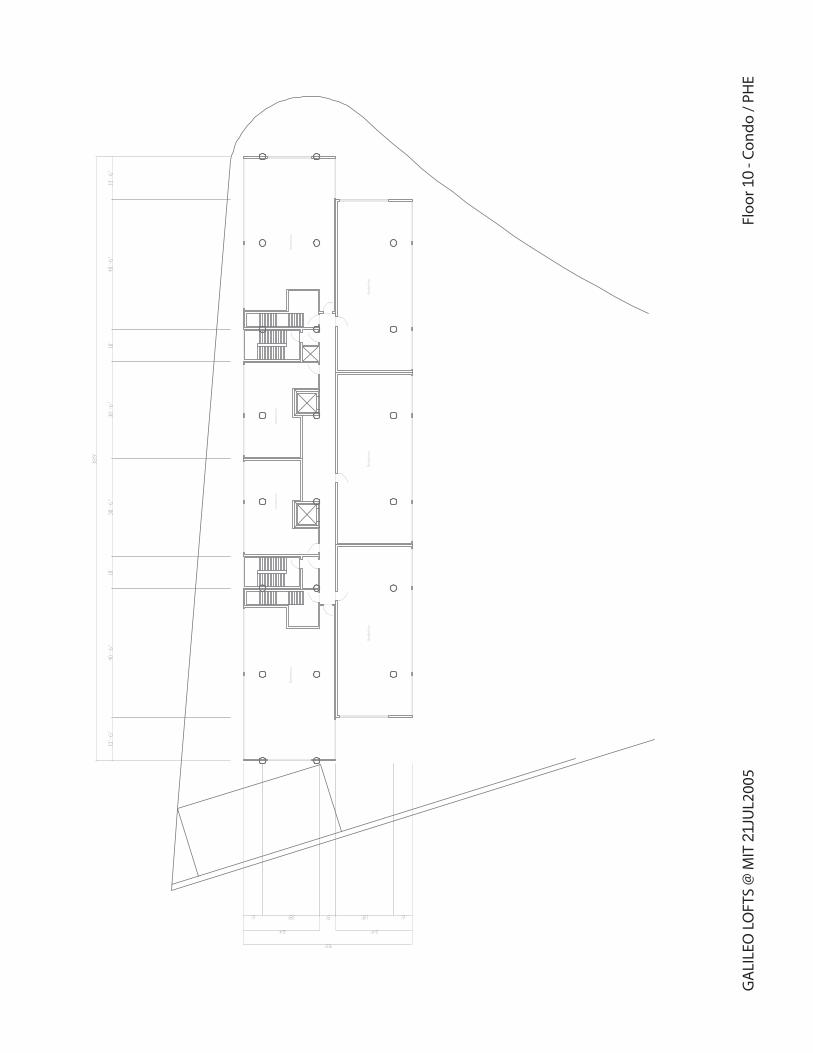
GA
LILE
O L
OFT
S @
MIT
21J
UL2
005
Fl
oo
r 10
- Co
nd
o /
PH
E
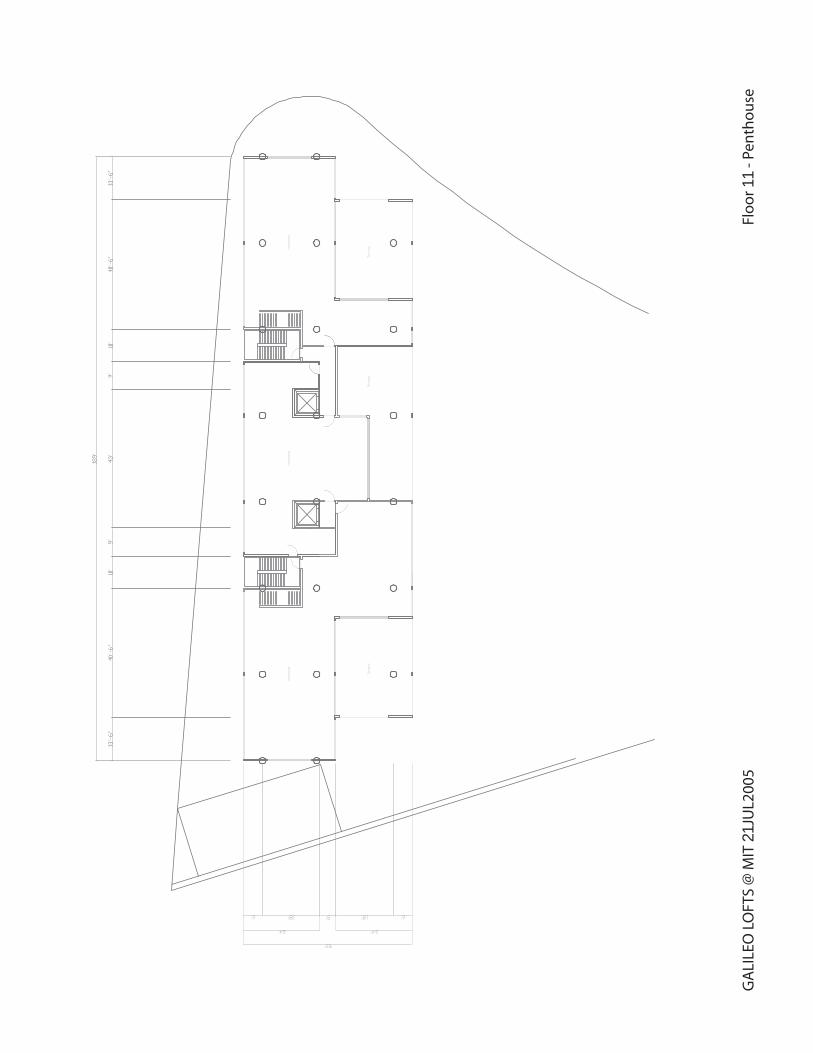
GA
LILE
O L
OFT
S @
MIT
21J
UL2
005
Fl
oo
r 11
- Pen
tho
use

APPENDIX C: FINANCIAL PROJECTIONS -- OPTION 1
Unit Mix
Buyer’s Underwriting: Affordable Condominiums
Capital Budget
Development Pro Forma
Sources and Uses of Funds
224

Unit MixOption 1: 44 units (the Baseline Case)
Unit No. StatusFloor Sq. Ft. BRs Price Price/SF Sq. Ft. BRs Price Price/SF101 AR 1 1155 3 325000 281102 AR 1 1155 3 325000 281103 AR 1 1155 3 325000 281104 AR 1 1155 3 325000 281105 AR 1 1155 3 325000 281106 AR 1 1155 3 325000 281107 AR 1 1155 3 325000 281108 AR 1 1155 3 325000 281109 AR 1 1155 3 325000 281110 AR 1 1155 3 325000 281111 AR 1 1155 3 325000 281112 AR 1 1055 3 325000 308301 AC 3 1732.5 3 200000 115302 M 3 1485 3 689250 464 1485 3 689250 464303 M 3 2310 4 1014300 439 2310 4 1014300 439304 M 3 1620 3 750000 463 1620 3 750000 463401 M 4 1732.5 3 805625 465 1733 3 805625 465402 AC 4 1485 3 200000 135403 M 4 2310 4 1019300 441 2310 4 1019300 441404 M 4 1620 3 755000 466 1620 3 755000 466501 M 5 1732.5 3 810625 468 1733 3 810625 468502 M 5 1485 3 699250 471 1485 3 699250 471503 AC 5 2310 4 225000 97504 M 5 1620 3 760000 469 1620 3 760000 469601 M 6 1732.5 3 815625 471 1733 3 815625 471602 M 6 1485 3 704250 474 1485 3 704250 474603 M 6 2310 4 1029300 446 2310 4 1029300 446604 AC 6 1620 3 200000 123701 AC 7 1732.5 3 200000 115702 M 7 1485 3 709250 478 1485 3 709250 478703 M 7 2310 4 1034300 448 2310 4 1034300 448704 M 7 1620 3 770000 475 1620 3 770000 475801 M 8 1732.5 3 825625 477 1733 3 825625 477802 AC 8 1485 3 200000 135803 M 8 2310 4 1039300 450 2310 4 1039300 450804 M 8 1620 3 775000 478 1620 3 775000 478901 M 9 1732.5 3 830625 479 1733 3 830625 479902 M 9 1485 3 719250 484 1485 3 719250 484903 M 9 2310 4 1044300 452 2310 4 1044300 452904 M 9 1620 3 780000 481 1620 3 780000 481
1001 M 10 1732.5 3 835625 482 1733 3 835625 4821002 M 10 1485 3 724250 488 1485 3 724250 4881003 M 10 2310 4 1049300 454 2310 4 1049300 4541004 M 10 1620 3 785000 485 1620 3 785000 485
Total 70940 26899350 46815 21774350Mean 1612 3.18 611348.9 379 1801 3.27 837475 465No.Units 44 26
Market
225

Unit Mix (continued)Option 1: 44 units (the Baseline Case)
Unit No. Sq. Ft. BRs Price Price/SF Sq. Ft. BRs Price Price/SF101 1155 3 325000 281102 1155 3 325000 281103 1155 3 325000 281104 1155 3 325000 281105 1155 3 325000 281106 1155 3 325000 281107 1155 3 325000 281108 1155 3 325000 281109 1155 3 325000 281110 1155 3 325000 281111 1155 3 325000 281112 1055 3 325000 308301 1732.5 3 200000 115302303304401402 1485 3 200000 135403404501502503 2310 4 225000 97504601602603604 1620 3 200000 123701 1732.5 3 200000 115702703704801802 1485 3 200000 135803804901902903904
1001100210031004
Total 13760 3900000 10365 1225000Mean 1147 3 325000 283 1727.5 3.17 204167 118No.Units 12 6
Affordable Rentals Affordable Condos
226

Buyer's Underwriting: Affordable Condominiums
HUD Determination of low income: Boston,MA-NH PMSAHousehold size 80% of Median income
1 46,300 2 52,950 3 59,550 4 66,150 5 71,450 6 76,750 7 82,050 8 87,350
Interest Rate Assumption: 6.30%Based on first time homebuyer program avail through MassHousing, rate 5.5% as of 8/2/05 projected forward at the rate of increase projected by Freddie Mac for conventional mortgages(see the last paragraph of Section 3.1).
1 BedroomSales price 160,000 Down payment 5% 8,000 Mortgage 152,000
Interest rate / term 6.30% 30 years
Monthly mortgage payment 941 Monthly insurance 15 Monthly RE Tax 6 Monthly common charge 200
1,162 Annual income required at underwriting ratio of: 30% 46,487
Minimum Minimum MaximunHousehold size % Median Income Income
1 80% 46,487 46,300 2 70% 46,487 52,950 3 62% 46,487 59,550 4 56% 46,487 66,150 5 52% 46,487 71,450 6 48% 46,487 76,750 7 45% 46,487 82,050 8 43% 46,487 87,350
227

Buyer's Underwriting: Affordable Condominiums (continued)
2 BedroomSales price 185,000 Down payment 5% 9,250 Mortgage 175,750
Interest rate / term 6.30% 30 years
Monthly mortgage payment 1,088 Monthly insurance 15 Monthly RE Tax 22 Monthly common charge 225
1,350
Annual income required at underwriting ratio of: 30% 54,000
Minimum Minimum MaximunHousehold size % Median Income Income
2 82% 54,000 52,950 3 73% 54,000 59,550 4 65% 54,000 66,150 5 60% 54,000 71,450 6 56% 54,000 76,750 7 53% 54,000 82,050 8 49% 54,000 87,350
3 BedroomSales price 200,000 Down payment 5% 10,000 Mortgage 190,000
Interest rate / term 6.30% 30 years
Monthly mortgage payment 1,176 Monthly insurance 15 Monthly RE Tax 32 Monthly common charge 250
1,473
Annual income required at underwriting ratio of: 30% 58,909
Minimum Minimum MaximunHousehold size % Median Income Income
3 79% 58,909 59,550 4 71% 58,909 66,150 5 66% 58,909 71,450 6 61% 58,909 76,750 7 57% 58,909 82,050 8 54% 58,909 87,350
228

Buyer's Underwriting: Affordable Condominiums (continued)
4 BedroomSales price 225,000 Down payment 5% 11,250 Mortgage 213,750
Interest rate / term 6.30% 30 years
Monthly mortgage payment 1,323 Monthly insurance 15 Monthly RE Tax 48 Monthly common charge 275
1,661
Annual income required at underwriting ratio of: 30% 66,422
Minimum Minimum MaximunHousehold size % Median Income Income
4 80% 66,422 66,150 5 74% 66,422 71,450 6 69% 66,422 76,750 7 65% 66,422 82,050 8 61% 66,422 87,350
229

Capital Budget
Option 1: 44 units (the Baseline Case)Proposed Units: 44Total Gross Square Footage 75,000
Construction inflation 6.8% Applies to hard costs & architectural fees tied to cost of construction.
AMOUNT PER UNIT PER SQ. FT. AMOUNT PER UNIT PER SQ. FT.HARD COSTSSITE PREPARATION
Excavation 50,000 1,136 0.67 56,300 1,280 0.75Demolition 0 0 0.00 0 0 0.00Site Remediation 20,000 455 0.27 22,520 512 0.30Utilities Installation/ Relocation 20,000 455 0.27 22,520 512 0.30Contingency 0 0 0.00 0 0 0.00SUBTOTAL 90,000 2,045 1.20 101,340 2,303 1.35
SITE WORKDriveways & Isles 10,000 227 0.13 11,260 256 0.15Sidewalks, steps, rails 10,000 227 0.13 11,260 256 0.15Surface Parking 0 0 0.00 0 0 0.00Landscaping 50,000 1,136 0.67 56,300 1,280 0.75SUBTOTAL 70,000 1,591 0.93 78,820 1,791 1.05
PROJECT REQUIREMENTSSUBTOTAL 365,337 8,303 4.87 411,366 9,349 5.48
PERSONNEL HOISTSUBTOTAL 277,020 6,296 3.69 311,922 7,089 4.16
PARKING CONSTRUCTIONUnderground Structured Pkg 37 925,000 21,023 12.33 1,041,542 23,671 13.89Overhead Door(s) & Operator 5,500 125 0.07 6,193 141 0.08Ramps incl 0 0 0.00 0 0 0.SUBTOTAL 930,500 21,148 12.41 1,047,735 23,812 13.97
BASE BUILDING CONSTRUCTIONFootings & Foundations 517,900 11,770 6.91 583,151 13,253 7.78Concrete 819,558 18,626 10.93 922,815 20,973 12.30Structural Steel 1,271,851 28,906 16.96 1,432,094 32,548 19.09Miscellaneous Metals 251,950 5,726 3.36 283,694 6,448 3.78Elevators 215,200 4,891 2.87 242,313 5,507 3.23Stair (Wood) 21,850 497 0.29 24,603 559 0.33Fire Protection 280,770 6,381 3.74 316,145 7,185 4.22SUBTOTAL 3,379,079 76,797 45.05 3,804,815 86,473 50.73
BUILDING ENVELOPEComposite Metal Panels 604,193 13,732 8.06 680,316 15,462 9.07Roofing (EPDM) 139,690 3,175 1.86 157,290 3,575 2.10Waterproofing 156,482 3,556 2.09 176,197 4,004 2.35Fireproofing 97,155 2,208 1.30 109,396 2,486 1.46Curtainwall & Exterior Glazing 1,532,700 34,834 20.44 1,725,807 39,223 23.01Skylights 86,240 1,960 1.15 97,106 2,207 1.29SUBTOTAL 2,616,460 59,465 34.89 2,946,112 66,957 39.28
As of Contract date: February, 2006Estimate dated: May, 2004
Inflation AdjustedOriginal estimates
00
230

INTERIORSFraming & Drywall 1,960,383 44,554 26.14 2,207,375 50,168 29.43Finish Carpentry 340,150 7,731 4.54 383,006 8,705 5.11Tile 212,912 4,839 2.84 239,737 5,449 3.20Acoustic Ceilings 58,633 1,333 0.78 66,020 1,500 0.88Wood Flooring 380,283 8,643 5.07 428,195 9,732 5.71Resilient Flooring & Carpet 143,784 3,268 1.92 161,900 3,680 2.16Doors, Frames & Hardware 192,250 4,369 2.56 216,472 4,920 2.89Glazing 28,000 636 0.37 31,528 717 0.42Painting 166,565 3,786 2.22 187,551 4,263 2.50Louvers & Vents 10,500 239 0.14 11,823 269 0.16Misc Specialties 44,793 1,018 0.60 50,437 1,146 0.67Appliances 112,506 2,557 1.50 126,681 2,879 1.69Millwork 236,310 5,371 3.15 266,083 6,047 3.55Granite Counters 194,100 4,411 2.59 218,555 4,967 2.91Window Treatments 12,000 273 0.16 13,512 307 0.18Other 0 0 0.00 0 0 0.00SUBTOTAL 4,093,169 93,027 54.58 4,608,875 104,747 61.45
PLUMBINGUnit Plumbing 679,425 15,441 9.06 765,027 17,387 10.20Common Area Plumbing 93,500 2,125 1.25 105,280 2,393 1.40Gas Piping 52,225 1,187 0.70 58,805 1,336 0.78SUBTOTAL 825,150 18,753 11.00 929,112 21,116 12.39
HVACSUBTOTAL 1,084,586 24,650 14.46 1,221,235 27,755 16.28
ELECTRICALSUBTOTAL 895,804 20,359 11.94 1,008,668 22,924 13.45
CONTRACTOR FEESFee 620,355 14,099 8.27 698,515 15,875 9.31General Conditions 420,248 9,551 5.60 473,196 10,754 6.31Labour, Insurance & Taxes 203,678 4,629 2.72 229,340 5,212 3.06Preconstruction Services 50,000 1,136 0.67 56,300 1,280 0.75GLPD (?) 106,677 2,424 1.42 120,117 2,730 1.60Winter Conditions Premium 80,000 1,818 1.07 90,079 2,047 1.20Performance & Payment Bond 109,679 2,493 1.46 123,498 2,807 1.65Contingency 0 0 0.00 0 0 0.00SUBTOTAL 1,590,637 36,151 21.21 1,791,045 40,706 23.88
PERMITS & FEESBuilding Permit ($10 per 1K) 163,848 3,724 2.18 184,492 4,193 2.46
SUBTOTAL 163,848 3,724 2.18 184,492 4,193 2.46
ADDITIONAL UNITS SUBTOTAL 4 167,100 3,798 2.23 188,153 4,276 2.51
TOTAL BASE CONSTRUCTION COSTS 16,548,690 376,107 220.65 18,633,690 423,493 248.45
CONSTRUCTION CONTINGENCYSUBTOTAL 15% 2,482,304 56,416 33.10 2,795,054 63,524 37.27
TOTAL HARD COSTS 19,030,994 432,523 253.75 21,428,744 487,017 285.72
231
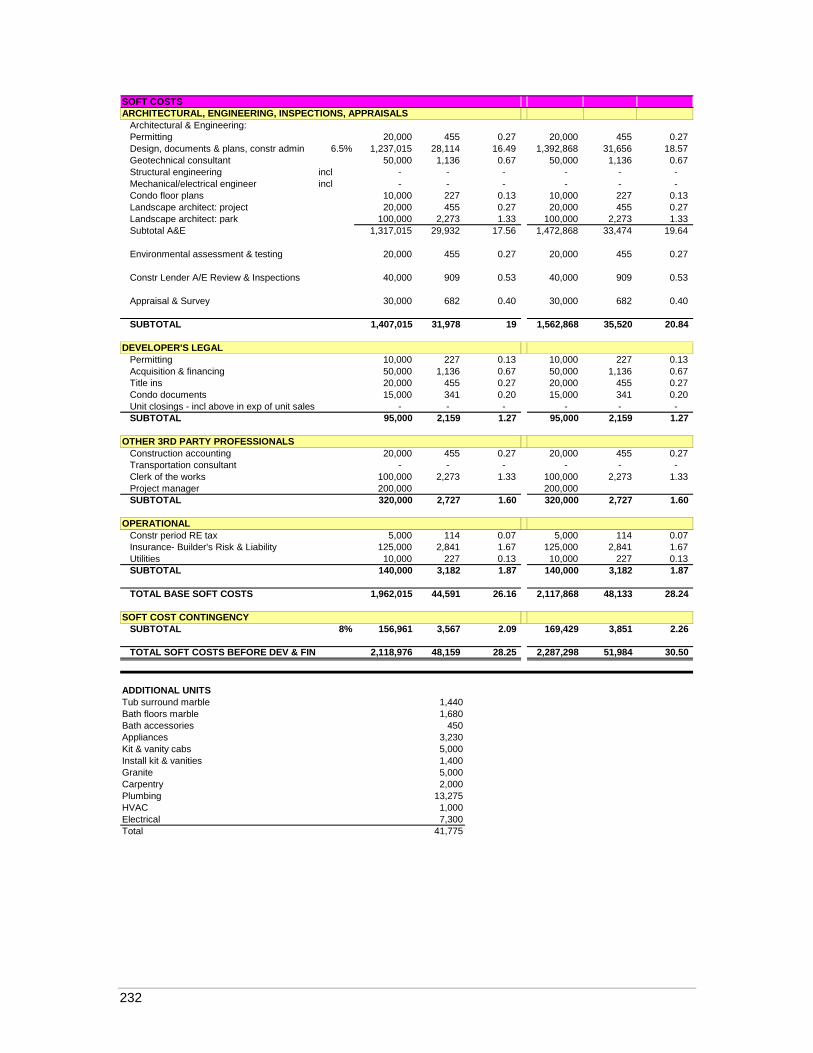
SOFT COSTSARCHITECTURAL, ENGINEERING, INSPECTIONS, APPRAISALS
Architectural & Engineering:Permitting 20,000 455 0.27 20,000 455 0.27 Design, documents & plans, constr admin 6.5% 1,237,015 28,114 16.49 1,392,868 31,656 18.57 Geotechnical consultant 50,000 1,136 0.67 50,000 1,136 0.67 Structural engineering incl - - - - - - Mechanical/electrical engineer incl - - - - - - Condo floor plans 10,000 227 0.13 10,000 227 0.13 Landscape architect: project 20,000 455 0.27 20,000 455 0.27 Landscape architect: park 100,000 2,273 1.33 100,000 2,273 1.33 Subtotal A&E 1,317,015 29,932 17.56 1,472,868 33,474 19.64
Environmental assessment & testing 20,000 455 0.27 20,000 455 0.27
Constr Lender A/E Review & Inspections 40,000 909 0.53 40,000 909 0.53
Appraisal & Survey 30,000 682 0.40 30,000 682 0.40
SUBTOTAL 1,407,015 31,978 19 1,562,868 35,520 20.84
DEVELOPER'S LEGALPermitting 10,000 227 0.13 10,000 227 0.13 Acquisition & financing 50,000 1,136 0.67 50,000 1,136 0.67 Title ins 20,000 455 0.27 20,000 455 0.27 Condo documents 15,000 341 0.20 15,000 341 0.20 Unit closings - incl above in exp of unit sales - - - - - - SUBTOTAL 95,000 2,159 1.27 95,000 2,159 1.27
OTHER 3RD PARTY PROFESSIONALSConstruction accounting 20,000 455 0.27 20,000 455 0.27 Transportation consultant - - - - - - Clerk of the works 100,000 2,273 1.33 100,000 2,273 1.33 Project manager 200,000 200,000 SUBTOTAL 320,000 2,727 1.60 320,000 2,727 1.60
OPERATIONALConstr period RE tax 5,000 114 0.07 5,000 114 0.07 Insurance- Builder's Risk & Liability 125,000 2,841 1.67 125,000 2,841 1.67 Utilities 10,000 227 0.13 10,000 227 0.13 SUBTOTAL 140,000 3,182 1.87 140,000 3,182 1.87
TOTAL BASE SOFT COSTS 1,962,015 44,591 26.16 2,117,868 48,133 28.24
SOFT COST CONTINGENCYSUBTOTAL 8% 156,961 3,567 2.09 169,429 3,851 2.26
TOTAL SOFT COSTS BEFORE DEV & FIN 2,118,976 48,159 28.25 2,287,298 51,984 30.50
ADDITIONAL UNITSTub surround marble 1,440Bath floors marble 1,680Bath accessories 450Appliances 3,230Kit & vanity cabs 5,000Install kit & vanities 1,400Granite 5,000Carpentry 2,000Plumbing 13,275HVAC 1,000Electrical 7,300Total 41,775
232

Development Pro Forma
Option 1: 44 units (the Baseline Case)Budget
Description Total Per Unit Per Sq Ft
REVENUES:Sales proceedsAverage market unit sales price
Market units sold (U/A) 26 Cum market units U/ASales price of units U/A @ 100% of expected prices 23,401,958 Cum sales price of units U/A
Market units closed 26 Affordable condos closed 6 Affordable rentals closed 12 Units closed 44 Cum units closed
Gross sales revenue (market) 23,401,958 Gross sales revenue (affordable condos) 1,225,000 Gross sales revenue (affordable rentals) 3,900,000 Total gross sales revenue 28,526,958 648,340 380.36
Expense of unit sales:Deed stamps 0.456% 130,083 2,956 1.73 Closing costs & concessions 200 8,800 200 0.12 Commission (market) 4.5% 1,053,088 23,934 14.04 Legal 500 22,000 500 0.29 Condo working capital 300 13,200 300 0.18
Total expense of sales 1,227,171 27,890 16.36
Net sales revenue 27,299,786 620,450 364.00
EXPENSES:Acquisition: LandInitial price 960,000 21,818 12.80 (Profit share portion not included -- see below)Total 960,000 21,818 12.80
Hard CostsTotal 21,428,744 487,017 285.72
Soft CostsSubtotal w/o developer OH & fee or financing 2,287,298 51,984 30.50
Developer's overhead 4% 23,716,041 948,642 21,560 12.65 Developer's fee 3% 21,428,744 642,862 14,611 8.57
Total Soft Costs 3,878,802 88,155 51.72
Total Costs excl financing 26,267,545 596,990 350.23
Net cash flow ( if all equity) 1,032,241 23,460 13.76 Internal rate of return (all equity) 4.4%
233

Development Pro Forma (continued)
Financing Costs (see detail below) 1,659,089 37,707 22.12
Additional purchase price for land - - -
Total Project Cost 27,926,634 634,696 372.36
Net cash flow - (626,848) (14,247) (8.36)
Financing CostsPoints & fees 592,000 13,455 7.89 Closing costs & lender's legal 50,000 1,136 0.67 Interest 1,017,089 23,116 13.56 Total financing costs 1,659,089 37,707 22.12
Construction DebtLIBOR ProjectionsInterest rate L+ 2%Interest 1,016,067 23,092 13.55
Beginning BalanceAdvances 19,800,000 450,000 264.00 Repayments (19,800,000) (450,000) (264.00) Ending BalanceLoan net cash flow to project - - - Net cash flow after this loan (626,848) (14,247) (8.36) Cum net cash flow after this loan
Short Term LoanInterest 18% 1,021 23 0.01
Beginning Balance - - - Advances 68,098 1,548 0.91 Repayments (68,098) (1,548) (0.91) Ending Balance 68,098 - - Loan net cash flow to project - - - Net cash flow after this loanCum net cash flow after this loan
234

Development Pro Forma (continued)
EquityBeginning BalanceCapital Contributions 5,900,000 134,091 78.67 Return of capital (5,273,152) (119,844) (70.31)
Ending BalanceEquity net cash flow to project 626,848 14,247 8.36 Net project cash flow after equity - - - Cum project net cash flow after equity
Internal rate of return (equity) -6.1%
Final DistributionTotal "Profit" - - - CRA share 30% 1,540,000 - - - Balance to equity investor & developer - - - Preferred return to equity investor 12% 5,900,000 - - - Residual - - - Residual to equity investor 80% - - - Residual to developer 20% - - -
Equity Investor's Cash Flow
Sources 53,067,884 792,058 707.57
Uses (53,694,732) (801,414) (715.93)
Surplus/Shortfall (626,848) (9,356) (8.36)
235

Galileo LoftsSources and Uses of Funds
Option 1: 44 units (the Baseline Case)Project
Description Total Per Unit Per Sq Ft
Entire ProjectUSES:Acquisition 960,000 21,818 12.80 Construction (hard costs) 21,428,744 487,017 285.72 Soft costs 3,878,802 88,155 51.72 Financing costs 1,659,089 37,707 22.12 Loan repayment 19,868,098 451,548 264.91 Return of investor equity 5,900,000 134,091 78.67 Total uses 53,694,732 1,220,335 715.93
SOURCES:Commonwealth of MA - - - Cambridge HOME/CAHT - - - Acquisition loan - - - Construction loan 19,800,000 450,000 264.00 Short term loan 68,098 1,548 0.91 Mezzanine debt 2 - - - Developer equity - - - Investor equity 5,900,000 134,091 78.67 Net sales revenue 27,299,786 620,450 364.00
Total sources 53,067,884 1,206,088 707.57
Surplus/Deficit (626,848) (14,247) (8.36)
Construction Period:USES:Acquisition 960,000 21,818 12.80 Construction (hard costs) 20,238,258 459,960 269.84 Soft costs 3,755,066 85,342 50.07 Financing costs 1,457,636 33,128 19.44
Total uses 26,410,960 600,249 352.15
SOURCES:Commonwealth of MA - - - Cambridge HOME/CAHT - - - Acquisition loan - - - Construction loan 19,800,000 450,000 264.00 Mezzanine debt (ST loan) 68,098 1,548 0.91 Mezzanine debt 2 - - - Developer equity - - - Investor equity 5,900,000 134,091 78.67 Deferred developer fee 642,862 14,611 8.57
- - Total sources 26,410,960 600,249 352.15
Surplus/Deficit - - -
236

APPENDIX D: FINANCIAL PROJECTIONS -- OPTION 2
Unit Mix
Capital Budget
Development Pro Forma
Sources and Uses of Funds
(Note: The spreadsheet entitled: “Buyer’s Underwriting: Affordable Condominiums” is the same as in
Appendix C.)
237

Unit MixOption 2: 67 units, 2 levels of parking
Unit No. Status Floor Sq. Ft. BRs Price Price/SF Sq. Ft. BRs Price Price/301 AR 3 650 1 325,000 500$ 302 M 3 650 1 362,250 557$ 650 1 362,250 557$ 303 M 3 900 2 471,000 523$ 900 2 471,000 523$ 304 M 3 900 2 471,000 523$ 900 2 471,000 523$ 305 M 3 900 2 471,000 523$ 900 2 471,000 523$ 306 AC 3 1100 2 290,000 264$ 307 M 3 1100 3 543,500 494$ 1100 3 543,500 494$ 308 AR 3 1450 3 325,000 224$ 401 M 4 650 1 367,250 565$ 650 1 367,250 565$ 402 M 4 650 1 367,250 565$ 650 1 367,250 565$ 403 AR 4 900 2 325,000 361$ 404 M 4 900 2 476,000 529$ 900 2 476,000 529$ 405 M 4 900 2 476,000 529$ 900 2 476,000 529$ 406 AR 4 1100 2 325,000 295$ 407 AC 4 1100 3 330,000 300$ 408 M 4 1450 3 714,750 493$ 1450 3 714,750 493$ 501 AC 5 650 1 255,000 392$ 502 M 5 650 1 372,250 573$ 650 1 372,250 573$ 503 AR 5 900 2 325,000 361$ 504 M 5 900 2 481,000 534$ 900 2 481,000 534$ 505 M 5 900 2 481,000 534$ 900 2 481,000 534$ 506 AC 5 1100 2 290,000 264$ 507 AR 5 1100 3 325,000 295$ 508 AC 5 1450 3 330,000 228$ 601 M 6 650 1 377,250 580$ 650 1 377,250 580$ 602 AC 6 650 1 255,000 392$ 603 M 6 900 2 486,000 540$ 900 2 486,000 540$ 604 AR 6 900 2 325,000 361$ 605 M 6 900 2 486,000 540$ 900 2 486,000 540$ 606 M 6 1100 2 586,000 533$ 1100 2 586,000 533$ 607 M 6 1100 3 558,500 508$ 1100 3 558,500 508$ 608 AR 6 1450 3 325,000 224$ 701 AR 7 650 1 325,000 500$ 702 M 7 650 1 382,250 588$ 650 1 382,250 588$ 703 AC 7 900 2 290,000 322$ 704 M 7 900 2 491,000 546$ 900 2 491,000 546$ 705 AR 7 900 2 325,000 361$ 706 M 7 1100 2 591,000 537$ 1100 2 591,000 537$ 707 M 7 1100 3 563,500 512$ 1100 3 563,500 512$ 708 M 7 1450 3 729,750 503$ 1450 3 729,750 503$ 801 AC 8 650 1 255,000 392$ 802 AR 8 650 1 325,000 500$ 803 M 8 900 2 496,000 551$ 900 2 496,000 551$ 804 AC 8 900 2 290,000 322$ 805 M 8 900 2 496,000 551$ 900 2 496,000 551$ 806 AR 8 1100 2 325,000 295$ 807 M 8 1100 3 568,500 517$ 1100 3 568,500 517$ 808 M 8 1450 3 734,750 507$ 1450 3 734,750 507$ 901 M 9 650 1 392,250 603$ 650 1 392,250 603$ 902 M 9 650 1 392,250 603$ 650 1 392,250 603$ 903 AR 9 900 2 325,000 361$ 904 M 9 900 2 501,000 557$ 900 2 501,000 557$ 905 AC 9 900 2 290,000 322$ 906 M 9 1100 2 601,000 546$ 1100 2 601,000 546$ 907 AR 9 1100 3 325,000 295$ 908 M 9 1450 3 739,750 510$ 1450 3 739,750 510$
1001 AR 10 650 1 325,000 500$ 1002 AC 10 650 1 255,000 392$ 1003 M 10 900 2 506,000 562$ 900 2 506,000 562$ 1004 M 10 900 2 506,000 562$ 900 2 506,000 562$ 1005 AR 10 900 2 325,000 361$ 1006 M 10 1100 2 606,000 551$ 1100 2 606,000 551$ 1007 M 10 1100 3 578,500 526$ 1100 3 578,500 526$ 1008 M 10 1450 3 744,750 514$ 1450 3 744,750 514$
PH1 M 11 2552 4 1,222,160 479$ 2552 4 1,222,160 479$ PH2 M 11 1957 4 951,549 486$ 1957 4 951,549 486$ PH3 M 11 1753 3 893,675 510$ 1753 3 893,675 510$
Total 67,462 30,565,634 42,112 22,235,634Mean 1007 2.1 456,203 453$ 1053 2.2 555,891 528$
MarketSF
238

Unit Mix (continued)
Unit No. Sq. Ft. BRs Price Price/SF Sq. Ft. BRs Price Price/SF301 650 1 325,000 500$ 302303304305306 1100 2 290,000 264$ 307308 1450 3 325,000 224$ 401402403 900 2 325,000 361$ 404405406 1100 2 325,000 295$ 407 1100 3 330,000 300$ 408501 650 1 255,000 392$ 502503 900 2 325,000 361$ 504505506 1100 2 290,000 264$ 507 1100 3 325,000 295$ 508 1450 3 330,000 228$ 601602 650 1 255,000 392$ 603604 900 2 325,000 361$ 605606607608 1450 3 325,000 224$ 701 650 1 325,000 500$ 702703 900 2 290,000 322$ 704705 900 2 325,000 361$ 706707708801 650 1 255,000 392$ 802 650 1 325,000 500$ 803804 900 2 290,000 322$ 805806 1100 2 325,000 295$ 807808901902903 900 2 325,000 361$ 904905 900 2 290,000 322$ 906907 1100 3 325,000 295$ 908
1001 650 1 325,000 500$ 1002 650 1 255,000 392$ 100310041005 900 2 325,000 361$ 100610071008
PH1PH2PH3
Total 15,300 5,200,000 10,050 3,130,000Mean 956 2.0 325,000 340$ 914 1.8 284,545 311$
Affordable Rentals Affordable Condos
239

Galileo Lofts: Draft Construction Budget Construction Budget
Option 2: 67 units, 2 levels of parkingProposed Units: 67Total Gross Square Footage 75,000
Construction inflation 6.8% Applies to hard costs & architectural fees tied to cost of construction.
AMOUNT PER UNIT PER SQ. FT. AMOUNT PER UNIT PER SQ. FT.HARD COSTSSITE PREPARATION
Excavation 50,000 746 0.67 56,300 840 0.75Demolition 0 0 0.00 0 0 0.00Site Remediation 20,000 299 0.27 22,520 336 0.30Utilities Installation/ Relocation 20,000 299 0.27 22,520 336 0.30Contingency 0 0 0.00 0 0 0.00SUBTOTAL 90,000 1,343 1.20 101,340 1,513 1.35
SITE WORKDriveways & Isles 10,000 149 0.13 11,260 168 0.15Sidewalks, steps, rails 10,000 149 0.13 11,260 168 0.15Surface Parking 0 0 0.00 0 0 0.00Landscaping 50,000 746 0.67 56,300 840 0.75SUBTOTAL 70,000 1,045 0.93 78,820 1,176 1.05
PROJECT REQUIREMENTSSUBTOTAL 365,337 5,453 4.87 411,366 6,140 5.48
PERSONNEL HOISTSUBTOTAL 277,020 4,135 3.69 311,922 4,656 4.16
PARKING CONSTRUCTIONUnderground Structured Pkg 56 1,400,000 20,896 18.67 1,576,388 23,528 21.02Overhead Door(s) & Operator 5,500 82 0.07 6,193 92 0.08Ramps incl 0 0 0.00 0 0 0.SUBTOTAL 1,405,500 20,978 18.74 1,582,581 23,621 21.10
BASE BUILDING CONSTRUCTIONFootings & Foundations 517,900 7,730 6.91 583,151 8,704 7.78Concrete 819,558 12,232 10.93 922,815 13,773 12.30Structural Steel 1,271,851 18,983 16.96 1,432,094 21,375 19.09Miscellaneous Metals 251,950 3,760 3.36 283,694 4,234 3.78Elevators 215,200 3,212 2.87 242,313 3,617 3.23Stair (Wood) 21,850 326 0.29 24,603 367 0.33Fire Protection 280,770 4,191 3.74 316,145 4,719 4.22SUBTOTAL 3,379,079 50,434 45.05 3,804,815 56,788 50.73
BUILDING ENVELOPEComposite Metal Panels 604,193 9,018 8.06 680,316 10,154 9.07Roofing (EPDM) 139,690 2,085 1.86 157,290 2,348 2.10Waterproofing 156,482 2,336 2.09 176,197 2,630 2.35Fireproofing 97,155 1,450 1.30 109,396 1,633 1.46Curtainwall & Exterior Glazing 1,532,700 22,876 20.44 1,725,807 25,758 23.01Skylights 86,240 1,287 1.15 97,106 1,449 1.29SUBTOTAL 2,616,460 39,052 34.89 2,946,112 43,972 39.28
As of Contract date: February, 2006Estimate dated: May, 2004
Inflation AdjustedOriginal estimates
00
240

INTERIORSFraming & Drywall 1,960,383 29,259 26.14 2,207,375 32,946 29.43Finish Carpentry 340,150 5,077 4.54 383,006 5,717 5.11Tile 212,912 3,178 2.84 239,737 3,578 3.20Acoustic Ceilings 58,633 875 0.78 66,020 985 0.88Wood Flooring 380,283 5,676 5.07 428,195 6,391 5.71Resilient Flooring & Carpet 143,784 2,146 1.92 161,900 2,416 2.16Doors, Frames & Hardware 192,250 2,869 2.56 216,472 3,231 2.89Glazing 28,000 418 0.37 31,528 471 0.42Painting 166,565 2,486 2.22 187,551 2,799 2.50Louvers & Vents 10,500 157 0.14 11,823 176 0.16Misc Specialties 44,793 669 0.60 50,437 753 0.67Appliances 112,506 1,679 1.50 126,681 1,891 1.69Millwork 236,310 3,527 3.15 266,083 3,971 3.55Granite Counters 194,100 2,897 2.59 218,555 3,262 2.91Window Treatments 12,000 179 0.16 13,512 202 0.18Other 0 0 0.00 0 0 0.00SUBTOTAL 4,093,169 61,092 54.58 4,608,875 68,789 61.45
PLUMBINGUnit Plumbing 679,425 10,141 9.06 765,027 11,418 10.20Common Area Plumbing 93,500 1,396 1.25 105,280 1,571 1.40Gas Piping 52,225 779 0.70 58,805 878 0.78SUBTOTAL 825,150 12,316 11.00 929,112 13,867 12.39
HVACSUBTOTAL 1,084,586 16,188 14.46 1,221,235 18,227 16.28
ELECTRICALSUBTOTAL 895,804 13,370 11.94 1,008,668 15,055 13.45
CONTRACTOR FEESFee 620,355 9,259 8.27 698,515 10,426 9.31General Conditions 420,248 6,272 5.60 473,196 7,063 6.31Labour, Insurance & Taxes 203,678 3,040 2.72 229,340 3,423 3.06Preconstruction Services 50,000 746 0.67 56,300 840 0.75GLPD (?) 106,677 1,592 1.42 120,117 1,793 1.60Winter Conditions Premium 80,000 1,194 1.07 90,079 1,344 1.20Performance & Payment Bond 109,679 1,637 1.46 123,498 1,843 1.65Contingency 0 0 0.00 0 0 0.00SUBTOTAL 1,590,637 23,741 21.21 1,791,045 26,732 23.88
PERMITS & FEESBuilding Permit ($10 per 1K) 178,207 2,660 2.38 200,659 2,995 2.68
SUBTOTAL 178,207 2,660 2.38 200,659 2,995 2.68
ADDITIONAL UNITS SUBTOTAL 27 1,127,925 16,835 15.04 1,270,034 18,956 16.93
TOTAL BASE CONSTRUCTION COSTS 17,998,874 268,640 239.98 20,266,584 302,486 270.22
CONSTRUCTION CONTINGENCYSUBTOTAL 15% 2,699,831 40,296 36.00 3,039,988 45,373 40.53
TOTAL HARD COSTS 20,698,705 308,936 275.98 23,306,572 347,859 310.75
241

SOFT COSTSARCHITECTURAL, ENGINEERING, INSPECTIONS, APPRAISALS
Architectural & Engineering:Permitting 20,000 299 0.27 20,000 299 0.27 Design, documents & plans, constr admin 6.5% 1,345,416 20,081 17.94 1,514,927 22,611 20.20 Geotechnical consultant 50,000 746 0.67 50,000 746 0.67 Structural engineering incl - - - - - - Mechanical/electrical engineer incl - - - - - - Condo floor plans 10,000 149 0.13 10,000 149 0.13 Landscape architect: project 20,000 299 0.27 20,000 299 0.27 Landscape architect: park 100,000 1,493 1.33 100,000 1,493 1.33 Subtotal A&E 1,425,416 21,275 19.01 1,594,927 23,805 21.27
Environmental assessment & testing 20,000 299 0.27 20,000 299 0.27
Constr Lender A/E Review & Inspections 40,000 597 0.53 40,000 597 0.53
Appraisal & Survey 30,000 448 0.40 30,000 448 0.40
SUBTOTAL 1,515,416 22,618 20 1,684,927 25,148 22.47
DEVELOPER'S LEGALPermitting 10,000 149 0.13 10,000 149 0.13 Acquisition & financing 50,000 746 0.67 50,000 746 0.67 Title ins 20,000 299 0.27 20,000 299 0.27 Condo documents 15,000 224 0.20 15,000 224 0.20 Unit closings - incl above in exp of unit sales - - - - - - SUBTOTAL 95,000 1,418 1.27 95,000 1,418 1.27
OTHER 3RD PARTY PROFESSIONALSConstruction accounting 20,000 299 0.27 20,000 299 0.27 Transportation consultant - - - - - - Clerk of the works 100,000 1,493 1.33 100,000 1,493 1.33 Project manager 200,000 200,000 SUBTOTAL 320,000 1,791 1.60 320,000 1,791 1.60
OPERATIONALConstr period RE tax 5,000 75 0.07 5,000 75 0.07 Insurance- Builder's Risk & Liability 125,000 1,866 1.67 125,000 1,866 1.67 Utilities 10,000 149 0.13 10,000 149 0.13 SUBTOTAL 140,000 2,090 1.87 140,000 2,090 1.87
TOTAL BASE SOFT COSTS 2,070,416 30,902 27.61 2,239,927 33,432 29.87
SOFT COST CONTINGENCYSUBTOTAL 8% 165,633 2,472 2.21 179,194 2,675 2.39
TOTAL SOFT COSTS BEFORE DEV & FIN 2,236,049 33,374 29.81 2,419,121 36,106 32.25
ADDITIONAL UNITSTub surround marble 1,440Bath floors marble 1,680Bath accessories 450Appliances 3,230Kit & vanity cabs 5,000Install kit & vanities 1,400Granite 5,000Carpentry 2,000Plumbing 13,275HVAC 1,000Electrical 7,300Total 41,775
242

Development Pro Forma
Option 2: 67 units, 2 levels of parkingBudget
Description Total Per Unit Per Sq Ft
REVENUES:Sales proceedsAverage market unit sales price
Market units sold (U/A) 40 Cum market units U/ASales price of units U/A @ 100% of expected prices 24,105,360 Cum sales price of units U/A
Market units closed 40 Affordable condos closed 11 Affordable rentals closed 16 Units closed 67 Cum units closed
Gross sales revenue (market) 24,105,360 Gross sales revenue (affordable condos) 3,130,000 Gross sales revenue (affordable rentals) 5,200,000 Total gross sales revenue 32,435,360 484,110 432.47
Expense of unit sales:Deed stamps 0.456% 147,905 2,208 1.97 Closing costs & concessions 200 13,400 200 0.18 Commission (market) 4.5% 1,084,741 16,190 14.46 Legal 500 33,500 500 0.45 Condo working capital 300 20,100 300 0.27
Total expense of sales 1,299,646 19,398 17.33
Net sales revenue 31,135,714 464,712 415.14
EXPENSES:Acquisition: LandInitial price 1,470,000 21,940 19.60 (Profit share portion not included -- see below)Total 1,470,000 21,940 19.60
Hard CostsTotal 23,306,572 347,859 310.75
Soft CostsSubtotal w/o developer OH & fee or financing 2,419,121 36,106 32.25
Developer's overhead 4% 25,725,693 1,029,028 15,359 13.72 Developer's fee 3% 23,306,572 699,197 10,436 9.32
Total Soft Costs 4,147,346 61,901 55.30
Total Costs excl financing 28,923,918 431,700 385.65
Net cash flow (all equity) 2,211,796 33,012 29.49 Internal rate of return (all equity) 8.2%
243

Development Pro Forma (continued)
Financing Costs (see detail below) 1,838,739 27,444 24.52
Additional purchase price for land 111,917 1,670 1.49
Net cash flow after financing and land 484,974 3,898 3.48
Total Project Cost 30,650,740 460,815 411.66
Net Cash Flow 484,974 3,898 3.48
Financing CostsPoints & fees 674,000 10,060 8.99 Closing costs & lender's legal 50,000 746 0.67 Interest 1,114,739 16,638 14.86 Total financing costs 1,838,739 27,444 24.52
Construction DebtLIBOR ProjectionsInterest rate L+ 2%Interest 1,114,739 16,638 14.86
Beginning BalanceAdvances 21,714,950 324,104 289.53 Repayments (21,714,950) (324,104) (289.53) Ending BalanceLoan net cash flow to project - - - Net cash flow after this loan 373,057 5,568 4.97 Cum net cash flow after this loan
Short Term LoanInterest 18% - - -
Beginning Balance - - - Advances - - - Repayments - - - Ending Balance - - - Loan net cash flow to project - - - Net cash flow after this loanCum net cash flow after this loan
244
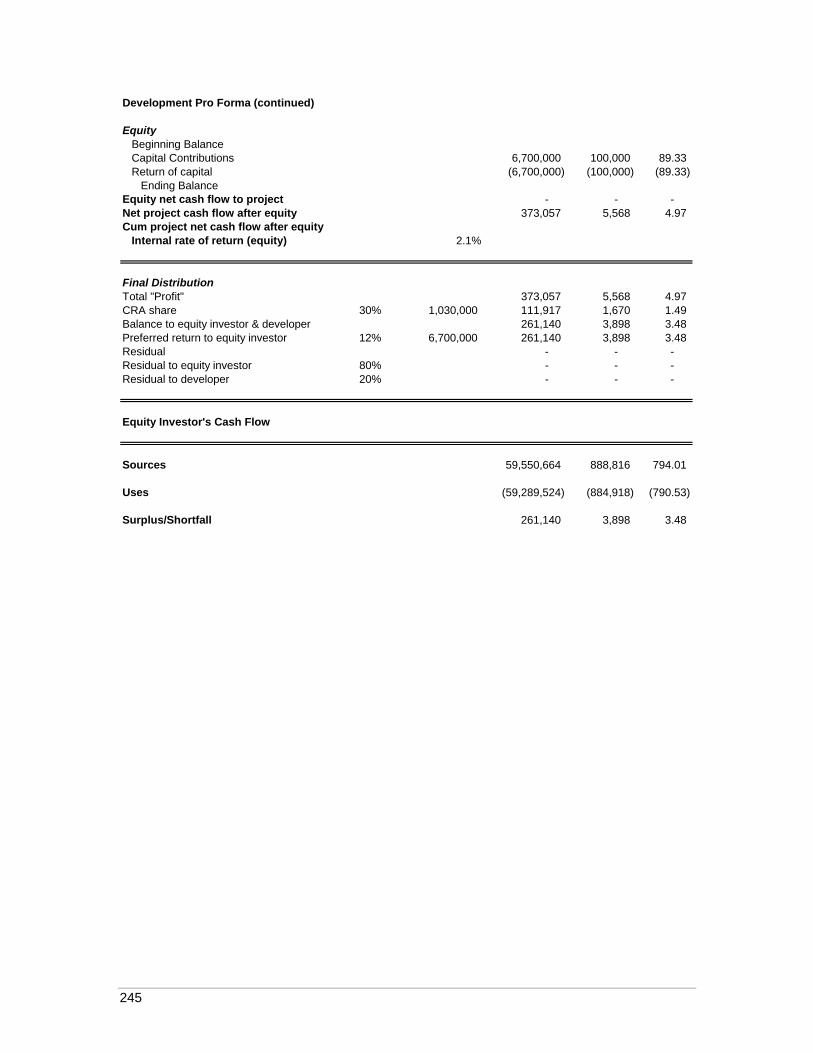
Development Pro Forma (continued)
EquityBeginning BalanceCapital Contributions 6,700,000 100,000 89.33 Return of capital (6,700,000) (100,000) (89.33)
Ending BalanceEquity net cash flow to project - - - Net project cash flow after equity 373,057 5,568 4.97 Cum project net cash flow after equity
Internal rate of return (equity) 2.1%
Final DistributionTotal "Profit" 373,057 5,568 4.97 CRA share 30% 1,030,000 111,917 1,670 1.49 Balance to equity investor & developer 261,140 3,898 3.48 Preferred return to equity investor 12% 6,700,000 261,140 3,898 3.48 Residual - - - Residual to equity investor 80% - - - Residual to developer 20% - - -
Equity Investor's Cash Flow
Sources 59,550,664 888,816 794.01
Uses (59,289,524) (884,918) (790.53)
Surplus/Shortfall 261,140 3,898 3.48
245

Sources and Uses of Funds
Option 2: 67 units, 2 levels of parkingProject
Description Total Per Unit Per Sq Ft
Entire ProjectUSES:Acquisition 1,581,917 23,611 21.09 Construction (hard costs) 23,306,572 347,859 310.75 Soft costs 4,147,346 61,901 55.30 Financing costs 1,838,739 27,444 24.52 Loan repayment 21,714,950 324,104 289.53 Return of investor equity 6,700,000 100,000 89.33 Total uses 59,289,524 884,918 790.53
SOURCES:Commonwealth of MA - - - Cambridge HOME/CAHT - - - Acquisition loan - - - Construction loan 21,714,950 324,104 289.53 Short term loan - - - Mezzanine debt 2 - - - Developer equity - - - Investor equity 6,700,000 100,000 89.33 Net sales revenue 31,135,714 464,712 415.14
Total sources 59,550,664 888,816 794.01
Surplus/Deficit 261,140 3,898 3.48
Construction Period:USES:Acquisition 1,470,000 21,940 19.60 Construction (hard costs) 22,011,762 328,534 293.49 Soft costs 4,013,125 59,897 53.51 Financing costs 1,619,260 24,168 21.59
Total uses 29,114,147 434,540 388.19
SOURCES:Commonwealth of MA - - - Cambridge HOME/CAHT - - - Acquisition loan - - - Construction loan 21,714,950 324,104 289.53 Mezzanine debt (ST loan) - - - Mezzanine debt 2 - - - Developer equity - - - Investor equity 6,700,000 100,000 89.33 Deferred developer fee 699,197 10,436 9.32
- - Total sources 29,114,147 434,540 388.19
Surplus/Deficit - - -
246