galanin induced activation of mapk in primary hippocampal...
TRANSCRIPT

UPTEC X 05 028 ISSN 1401-2138 MAY 2005
NORA BUCHT
Galanin induced activation of MAPK in primary hippocampal neuronal cultures Master’s degree project

Molecular Biotechnology Programme Uppsala University School of Engineering
UPTEC X 05 028 Date of issue 2005-05 Author
Nora Bucht Title (English)
Galanin induced activation of MAPK in primary hippocampal neuronal cultures
Title (Swedish) Abstract Galanin is a neuropeptide that is widely expressed in both the CNS and PNS, as in the endocrinal system. Galanin modulates a variety of physiological/pathological processes and has been implicated in disorders such as epilepsy, depression and Alzheimer’s disease. Galanin act as a ligand on specific galanin receptors. To use galanin receptors as drug targets, the signaling pathways of each receptor has to be determined. Previous experiments conducted in galanin-receptor expressing cell-lines suggest intracellular signaling due to galanin stimulation via activation of mitogen activated protein kinase (MAPK) pathways. To examine this in a native system of galanin-receptor expressing cells, primary hippocampal neuronal cultures were treated with galanin, and western blots stained for the activation of Erk-proteins known to be involved in MAPK pathways. MAPK activation in primary hippocampal cultures was shown due to stimulation with galanin, an activation that peaked after 10 minutes, and could be blocked using the galanin receptor antagonist M40. Keywords
Galanin, galanin receptors, G-proteins, GPCRs, MAPK, Erk, hippocampus
Supervisors Professor Tamas Bartfai, M.D. Xiaoying Lu
The Scripps Research Institute
Scientific reviewer Professor Fred Nyberg
Department of pharmaceutical biosciences, Uppsala University
Project name
Sponsors
Language English
Security
ISSN 1401-2138
Classification
Supplementary bibliographical information Pages 33
Biology Education Centre Biomedical Center Husargatan 3 Uppsala Box 592 S-75124 Uppsala Tel +46 (0)18 4710000 Fax +46 (0)18 555217

Galanin induced activation of MAPK in primary hippocampal neuronal cultures
Nora Bucht
Sammanfattning Galanin är en liten neuropeptid som har visats påverka en mängd olika fysiologiska processer såsom minnesformering, skakningar, mat intag och sexuellt beteende. Man har länkat peptiden till sjukdomar såsom epilepsi, depression och Alzheimers sjukdom. Man har sett att peptiden medierar sin effekt i nervcellerna genom att agera som aktiverande ligand på receptorer på nervcellerna. Galanin verkar på speciella galaninreceptorer. Idag känner man till tre stycken galaninreceptorer och tror att de, genom att de aktiverar olika svar i cellen samt har skild distribution i olika delar av hjärnan, kan vara svaret på hur galanin kan påverka så många olika system med så varierande resultat på skilda platser i hjärnan. Receptorerna som galanin aktiverar tillhör en receptorfamilj vid namn G-protein-kopplade receptorer p.g.a. att de alla, efter extracellulär aktivering via ligand, aktiverar det intracellulära svaret med hjälp av G-proteiner. Vilka G-proteiner som aktiveras leder till olika svar i cellen och ger således olika effekt. Tidigare studier i cellinjer som genom transfektion uttrycker galaninreceptorer på ytan påvisar en aktivering av MAPK (mitogen activated protein kinase) kaskader vid stimulering med galanin. Detta behöver nu kontrolleras i ett nativt system av naturligt receptoruttryckande nervceller, då de transfekterade cellerna kanske inte visar vad som egentligen sker i nervcellerna. I detta experiment dissekerades hippocampus, som är en hjärnstruktur som funnits vara viktig för bl.a. minne och skakningar samt även visat sig innehålla galaninreceptorer, ut ur musfosterhjärnor. Hippocampusnervcellerna odlades på cellplattor och behandlades vid mogen ålder med galanin och M40, en galaninreceptorantagonist. Aktivering av MAPK kaskaden genom behandling med galanin kunde påvisas, den nådde sitt maximum efter 10 minuters behandling, och kunde helt eller delvis blockeras av M40. Således kunde det konfirmeras att den aktivering av MAPK-signalkaskaden som observerats i transfekterade receptoruttryckande cellinjer också gäller för nervceller.
Examensarbete 20 p i Molekylär bioteknikprogrammet
Uppsala universitet Maj 2005

4
Contents 1. Introduction 5
1.1 Galanin receptors 6 1.2 The physiological/pathological role of the galaninergic system 6
1.2.1 Galanin in pain behaviour 6 1.2.2 Galanin in memory and Alzheimer’s disease 7 1.2.3 Galanin in epilepsy and seizures 8 1.2.4 Galanin in depression 8 1.2.5 Galanin in neuroprotection/neurotrophic effects 9 1.2.6 Galanin in feeding behaviour 9
1.3 Background 10
1.3.1 The aim of the project 10 1.3.2 The MAPK signaling pathway 11 1.3.3 G-proteins and G-protein coupled receptors (GPCRs) 12 1.3.4 Previous studies/ background knowledge 14
2. Material and methods 15
2.1 The dissection 15 2.2 Making of the plates 15 2.3 Treating the cell cultures 16
2.3.1 Experimental setup 16 2.3.2 Performing the experiments 16
2.4 Western blot 17 2.5 Quantification 17
3. Results 18 4. Discussion 24 5. Future perspectives 25 6. Acknowledgement 26 7. References 26 8. Appendix 28

5
1. Introduction Galanin is a neuropeptide of 29 amino acids (30 in humans) that is widely expressed in both the central and peripheral nervous system, as in the endocrinal system. [1] It was discovered at Karolinska Institutet in 1983 in porcine intestines, [2] and was named galanin after the N-terminal glycine and the C-terminal alanine residues. The peptide was shown to be much conserved between different species, usually 29 amino acids long and C-terminally amidated, human galanin shown to be an exception with 30 amino acids and with a C-terminal serine residue as a free acid. [2, 3] Galanin modulates a variety of physiological/pathological processes such as cognitive performance, food intake, pain sensation and sexual behaviour. [3] Galanin is highly inducible, showing distinct up-regulation after pathological disturbance in the nervous system. [4] Galanin is strongly neurotrophic during development and subsequent to injury, as well as neuroprotective. [5, 3] It also affects nociception, regulates pain thresholds and seizures when applied intraventriculary. These pathophysiological functions of the galaninergic system make it interesting when it comes to several disorders such as Alzheimer’s disease, epilepsy and depression. [3] The fact that galanin, like many other neuropeptides, mediates its effects by binding to G-protein coupled receptors (GPCRs) makes it even more interesting, since this class of proteins represent an relatively easily targeted class by pharmacologists through the use of agonists and antagonists. No remarkable desensitization of the receptors after galanin stimulation has been observed. [6] To date, three different galanin receptors have been cloned, GalR1-3. [7] Galanin and galanin receptors show an extensive distribution throughout the central nervous system. High immunoreactivity of galanin and galanin receptors are found in the hippocampus, hypothalamus, LC neurons and medulla oblongata. [1] Galanin has been shown to co-localize with several classical neurotransmitters such as acetylcholine, dopamine, glutamate, noradrenaline and serotonine, and acts generally as an inhibitory modulator on neurotransmitter release, having hyperpolarizing properties. [8, 9] Several galanin receptor antagonists have been constructed chimerically, usually using gal(1-13) as N-terminus and an amid in the C-terminus. The one used in this study, M40, is constructed from gal(1-13)Pro2(Ala Leu)2Ala-amide. [10] Also a galanin receptor agonist, a non-peptide ligand called galnon , has been manufactured synthetically, using binding studies of the different amino acid residues in galanin to see which ones are the most important for binding, making the tripeptidomimetric ligand accordingly. Based on the known pharmacophores of galanin and galnon, a combinatorial library were synthesized and screened against the galanin receptors. Galmic was identified as an active compound with affinity for the galanin receptors. Finding non-peptide ligands is important since the peptide ligands are vulnerable to enzymatic degradation and unable to cross the blood-brain barrier. [11, 12] The development of Galanin OE- (overexpressing) and galanin KO- (knockout) as well as GalR1- and GAlR2-KO mice strains have also yielded strong tools to further explore the galaninergic system. [13, 14]

6
1.1 Galanin receptors The effects of galanin are mediated via special galanin receptors. The first binding profiles indicated multiple receptor subtypes; different binding affinities in different tissues for both the full length peptide and subparts of it were observed in native systems with galanin. Interactions with multiple signal transduction pathways have resulted in further speculation about receptor subtype diversity in native systems. To prove this hypothesis, cloning was required. [7] Molecular cloning initially identified two galanin receptors, GalR1 and GalR2, both belonging to the G protein coupled receptor superfamily, showing the seven transmembrane domains typical for the family. The amino acid sequences of GalR1 and GalR2 share only about 40% homology, and though they both bind to galanin with high affinity, the receptors can be pharmacologically distinguished by gal(2-29), a galanin fragment missing the Gly residue in the highly conserved N-terminal, which binds preferentially to GalR2. Following studies of gal(2-11) showed that this peptide binds to GalR2 with a much greater affinity than gal(1-29), and is nowdays used as a receptor discriminating ligand. [7] A third receptor, GalR3, have also been cloned with a homology to GalR1 of 38% and GalR2 of 55%. Even though the homology of the different receptors seems to be very low, they are much conserved between species, suggesting an important physiological role of the receptors. All three receptors are expressed throughout the central nervous system, even though they have been shown to have different distributions. The intracellular signaling profiles of the different galanin receptors have been studied through the examination of coupling profiles to G-proteins. This is further described in the ‘background knowledge’ section. [7] 1.2 The physiological/pathological role of the galaninergic system 1.2.1 Galanin in pain behaviour Pathological conditions such as nerve injury and inflammation makes the expression of neuropeptides in sensory neurons change dramatically. This indicates that these neuropeptides may be important for survival and regeneration of injured neurons, and may implicate pain processing. Galanin and galanin receptors are highly expressed in sensory neurons, suggesting a role for galanin in nociceptive transmission. [15] Peripheral nerve injury rapidly induces an extensive up-regulation of galanin-like immunoreactivity in DRG (dorsal root ganglion) neurons of all sizes. [4, 16] DRG neurons in rats show elevated galanin levels already 24h after sciatic nerve transaction. Galanin expression reaches a maximum within a week and is maintained

7
in the absence of nerve regeneration. [17] Galanin is thought to be required for survival of some of the sensory neurons during development, as Gal KO mice show reduced number of DRG neurons and incapacity to regenerate after injury. [18] Galanin may be released from damaged sensory neurons since nerve injury leads to increased synthesis, central transport and terminal storage of galanin. [15] Galanin is also thought to inhibit nociception as it has been shown to potentiate the antinociceptive effect of morphine. These effects might be through signaling via GalR1 since opiate withdrawal enhances GalR1 expression. Gal KO mice show hyperalgesia while galanin over-expression elevates nociceptive thresholds and reduces neuropathic pain behaviour. It is thought that galanin may reduce the amount of transmitter released from nociceptive afferents by depolarizing the membrane terminals of sensory afferents. [15] 1.2.2 Galanin in memory and Alzheimer’s disease Alzheimer’s disease (AD) is recognized by a severe loss of neurons in the basal forebrain, which leads to reduced levels of neuromodulators including acetylcholine, dopamine and noradrenaline. Galanin has been linked to deficits in memory and learning in AD since galaninergic inter-neurons closely surround the cholinergic cell bodies in humans, and since galanin functions as an inhibitory modulator of acetylcholine in the hippocampus. [19] Galanin has been linked to cognitive impairments in numerous studies and in several memory tasks including Morris water maze. It is thought that galanin may inhibit learning and memory by inhibiting neurotransmitter release and neuronal firing rate. When most neuromodulators show decreased concentrations with neuronal cell loss, galanin-containing fibers hypertrophy and hyperinnervate the surviving neurons of the basal forebrain in the late stage of AD. [20, 21] The loss of cholinergic neurons in the nucleus basalis shows a correlation with the increase in galanin immunoreactivity. [22, 23] An increased number of galanin receptor binding sites in late stage AD are observed within the cholinergic basal forebrain in nucleus basalis and hippocampal areas, which suggests that receptor plasticity accompanies the hyperinnervation of galanin. [21- 24] Based on current knowledge it has been suggested that galanin might reduce cholinergic signaling in the basal forebrain by inhibiting acetylcholine release, especially in late stage AD. The fact that galanin has neuroprotective properties has arisen the hypothesis that the increase in galanin expression is a response to neuronal damages, and that galanin in fact tries to rescue the neurons from dying, trying to maintain cholinergic signaling. [19] Impairment of cognitive functions by galanin and inhibition of acetylcholine release shows a different aspect. Reduced acetylcholine release is seen in galanin OE mice, as inhibition of glutamate release. Cognitive impairments characteristic for AD and reduced long-term potentiation (LTP) is also shown. [25, 26] Even more contradictory results are presented; a recent study shows altered cognitive functions and increased acetylcholine release from hippocampus in rats, agreeing with the neuroprotective hypothesis and suggesting that the augmented

8
levels of galanin reduces cognitive deficits characteristic for AD. [27] Further investigation of how galanin mediate these different effects, via which receptor what response is given, is needed to outline these discrepancies and be able to use the galaninergic system for treatment of AD patients. 1.2.3 Galanin in epilepsy and seizures Galanin innervates many structures in the brain, one of them is the hippocampus. Hippocampus is known to be important in memory and learning, but it has also been shown to be of importance for modulating seizure activity. Regulation of initiation and maintenance of seizures is seen in the dentate gurys of the hippocampus. [28] Presumably, galanin alters hippocampal excitability and modulates seizure activity by inhibiting presynaptic glutamate release during epileptic discharge, and in developing long-term potentiation (LTP). [29] Several experiments indicates an anticonvulsant effect of galanin; by administration of galanin into the lateral ventricle of rats, [30] and in the use of Gal KO mice which show lower thresholds for developing seizures [25] while Gal OE mice show increased resistance to induces seizures. [31] Galanin receptor agonists prevent induction of seizure activity, [12] while seizure activity is facilitated by galanin receptor antagonists. [32] Studies of galanin content in rat models of status epilepticus (SE) show less galanin and galanin immunoreactive fibers in the hippocampus. This indicates that seizure activity and seizure progression deplete galanin in the hippocampus. [32] In three different models of SE augmented susceptibility to seizures were shown in GalR1 KO mice, while it was the severity of the seizures that was increased in GalR2 knockdown rat models. [33] These findings summoned bring us the present hypothesis about how galanin acts in seizure development, through GalR1 in the initiation phase and GalR2 during the maintenance. 1.2.4 Galanin in depression Galanin co-localizes with monoamines known to be involved in mood disorders, which indicates a link between galanin and depressive-like behaviours. [8, 34] It has been shown that Gal OE mice have an increased release of serotonin and noradrenaline upon stressful stimulation. An increased floating in the forced swim test compared to control was also observed, suggesting more depressive-like behaviour and lower tolerance for stress. [35, 36, 37] Indications of galanin having the opposite effect, and being an antidepressant, are presented in a recent study below. Among the most common drugs used for treatment of major depression today are the selective serotonin reuptake inhibitors (SSRI). Although the elevation of synaptic serotonin concentrations is fast, the clinical antidepressant effects requires 14-21 days

9
of treatment, indicating cooperation with other systems in the brain to make functional rearrangements in the CNS. Functional changes in signaling within the major serotoninergic nucleus DRN (dorsal raphe nucleus) and its projection areas, due to transcriptional and translational events, may be required for the therapeutic effects. [38] In a recent study with the SSRI fluoxetine (FLX) the expression of galanin m-RNA were up-regulated 100% and the GalR2-binding sites 50% in the rat DRN, suggesting galanin as one potential player, besides serotonin, in mediating the long-term effects of FLX. Further studies showed that the galanin receptor antagonist M40 attenuated the antidepressant-like effect of FLX in the forced swim test, and that the galanin receptor agonist galnon, by direct activation of the galanin receptors, produced an antidepressant-like effect in the same task. Other indications that galanin is involved in depression includes decreased galanin expression in DRN, hippocampus, and hypothalamus in rat models of depression, as well as a recent clinical study in which preliminary evidence for an antidepressant effect of galanin in depressed patients have been reported. [38] 1.2.5 Galanin in neuroprotection/neurotrophic effects Galanin has been suggested to have a trophic role in the injured nervous system since it shows an extensive up-regulation after nerve injury. [4] Galanin also shows elevated levels prenatally compared to postnatally which implies importance during neuronal development. [5] In a Gal KO model it was showed that absence of galanin during embryonic development resulted in the reduction of small neurons by 13% in L4 and L5 DRG neurons and loss of a third of the cholinergic neurons in the basal forebrain. [39] DRG neurons from Gal KO mice showed a decreased number of neurite outgrowths and shorter neurite lengths when cultured in vitro, [18] which were obstructed by the addition of galanin. In accordance with this, increased neurite outgrowth was shown after addition of the galanin receptor agonist gal(2-11), but reduced after addition of M35, a galanin receptor antagonist. [40] A further evidence for the developmental role of galanin is the expression of galanin mRNA, as well as GalR1 and GalR2 transcripts, in embryonic stem cells. [41] 1.2.6 Galanin in feeding behaviour Galanin's possible role in feeding behaviour has been investigated since the discovery of galanin and its receptors in brain regions that regulate ingestive behaviours. Findings that galanin, when administered centrally, increase ingestion in rats has now been replicated in many laboratories. In rats that were held on ad libitum access to food and water intraventriculary administered galanin produced a significant and dose-dependent increase in consumption. Consistent evidence of galanin-induced feeding across species and at different ventricular injection locations has also been shown in several studies. [42]

10
The greatest affect of galanin on consumption was found in the paraventricular nucleus of the hypothalamus. Since many neurotransmitters in the hypothalamus are known to influence feeding and galanin is known to coexist with several other neurotransmitters, it is possible that the effects seen by galanin could be due to stimulation or inhibition of another major neurotransmitter. Elucidating this, some experiments indicate that galanin induces feeding by releasing hypothalamic norepinephrine. Other studies suggest that galanin may activate neurons in the hypothalamus that project to regions of the nucleus accumbens, in which the rewarding system is activated due to food intake. It is also shown that the opiate receptor antagonist, naloxone, reduces galanin-stimulated feeding in a dose dependent manner, proposing a possible interaction of galanin with endogenous opioid peptides that promote feeding. [42] The galanin and galanin mRNA concentrations in rats who consumed high quantities of fat were significantly increased in the paraventricular nucleus of the hypothalamus, while food deprivation did not show a significant change of galanin mRNA levels, nor did lifelong moderate caloric restriction. These findings suggest that galanin is synthesized in the hypothalamus in response to ingestion, but not in response to starvation. Mixed nutrient diets given to galanin treated rats showed large increases in consumption of both high-fat and high-carbohydrate diets, but with a natural preference for fat. The findings that endogenous galanin seems to play a minor role in normal feeding in rats but a significant one in abnormal feeding suggest a role for galanin in human appetite disorders. Clinical studies in humans have assayed endogenous galanin levels in eating disorders, showing higher plasma concentration of galanin in obese women, while anorectic patients had normal levels. To be able to come to any conclusions regarding this, further studies are needed in this field. [42] 1.3 Background 1.3.1 The aim of the project The diverse physiological functions exerted by galanin may be regulated by multiple G protein-coupled receptor subtypes and intracellular signalling pathways. To be able to use the galaninergic system to create drugs, one has to know exactly how the system works. My project was to look at neuronal cultures created from foetal mice hippocampi and determine if galanin, via its receptors, activates the Erk1 (extracellular signal-regulated kinase) /Erk2 MAPK signaling cascade. This has been suggested from experiments in receptor-expressing cell-lines, but verification in the native environment of naturally receptor-expressing neurons is needed.

11
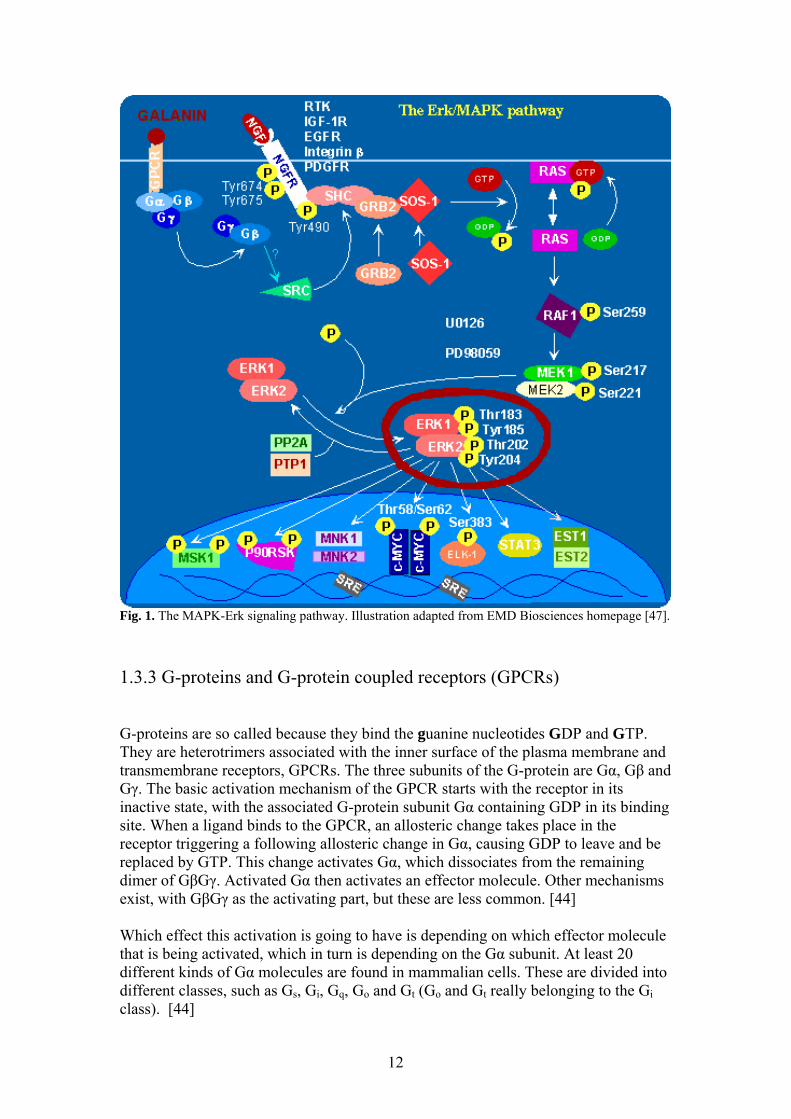
1.3.2 The MAPK signaling pathway Sequential activation of kinases (protein kinase cascades) is a common mechanism of cellular transduction in many cellular processes. There are several related intracellular signaling cascades collectively known as mitogen-activated protein kinase (MAPK) signaling cascades. These MAP kinases are a conserved class of proline-directed serine/threonine kinases that are activated in response to a variety of extracellular stimuli, and mediate signal transduction from the cell surface to the nucleus. In combination with several other signaling pathways, they can differentially alter the phosphorylation status of transcription factors, thus initiating cellular processes such as proliferation, differentiation, development, stress response and apoptosis. Each of these cascades, including Erk1/2, p38 Hog, JNK/SAPK, Erk3 and Erk5, consist of three to six tiers of protein kinases that sequentially activate each other by phosphorylation, making them part of a superfamily of protein kinases. [43, 44] The most widely studied cascade is that of Erk1/Erk2 MAP kinases. These two proteins are 85% identical and are ubiquitously expressed in the cell. These MAP kinases are activated as a response to stimulation by serum, growth factors, cytokines, some GPCR ligands and certain stresses, among other things. In a general activation scheme (see Fig.1), eventually the active Raf kinase phosphorylates a dual specificity kinase, MEK, and activates it. MEK1 then binds to Erk and phosphorylates either a threonine or a tyrosine residue and then dissociates. The monophosphorylated Erk then rebinds to an active MEK1 for dual phosphorylation and complete activation. The activated MEK1 phosphorylates Erk1 on threonine183 and thyrosine185 and Erk2 on threonine202 and thyrosine204. The dually phosphorylated forms of Erk1 and Erk2 have an activity over a 1000-fold greater than the singly or unphosphorylated forms. At one time, there is usually only one active form of Erk1 or Erk2 in the cell but three low active forms, unphosphorylated or singly phosphorylated at either the threonine or tyrosine residue. [44, 45]
12
Fig. 1. The MAPK-Erk signaling pathway. Illustration adapted from EMD Biosciences homepage [47]. 1.3.3 G-proteins and G-protein coupled receptors (GPCRs) G-proteins are so called because they bind the guanine nucleotides GDP and GTP. They are heterotrimers associated with the inner surface of the plasma membrane and transmembrane receptors, GPCRs. The three subunits of the G-protein are Gα, Gβ and Gγ. The basic activation mechanism of the GPCR starts with the receptor in its inactive state, with the associated G-protein subunit Gα containing GDP in its binding site. When a ligand binds to the GPCR, an allosteric change takes place in the receptor triggering a following allosteric change in Gα, causing GDP to leave and be replaced by GTP. This change activates Gα, which dissociates from the remaining dimer of GβGγ. Activated Gα then activates an effector molecule. Other mechanisms exist, with GβGγ as the activating part, but these are less common. [44] Which effect this activation is going to have is depending on which effector molecule that is being activated, which in turn is depending on the Gα subunit. At least 20 different kinds of Gα molecules are found in mammalian cells. These are divided into different classes, such as Gs, Gi, Gq, Go and Gt (Go and Gt really belonging to the Gi class). [44]

13
The Gs class activates the effector molecule adenylyl cyclase, the s standing for stimulatory (see Fig. 2). Adenylyl cyclase is an enzyme in the inner face of the plasma membrane which in its active form catalyzes the conversion of ATP into the second messenger cyclic AMP (cAMP). cAMP then activates protein kinase A (PKA) which phosphorylates proteins at specific Serine or Threonine side chains. cAMP can also activate the transcription factor CREB (cAMP response element binding protein) which, when bound to its response element in the promoters of regulated genes, turns on gene transcription. [44]
Fig. 2. The activation of PKA via Gs proteins. With permission from Karl Loren [48]. The Gi class has the opposite effect of the Gs, inhibiting adenylyl cyclase and lowering the levels of cAMP in the cell, i standing for inhibitory. A subgroup of Gi, Gt, contains the molecule responsible for generating a signal in the rods of the retina in response to light, t standing for transducin. Gαt triggers the breakdown of cyclic GMP (cGMP). Go reduces cAMP levels, open G-IRK (G-protein coupled inward rectifying K+) channels and stimulate MAPK. [44] Gq activates the enzyme PLC (phospholipase C) which cleaves PIP2 ( phosphatidyl inositol-4,5-bisphosphate) into two second messengers, diacylglycerol (DAG) and inositol triphosphate (IP3). DAG binds to and activates protein kinase C (PKC). IP3 activates calcium ion influx into the cell which, among other things, also activates PKC (see Fig. 3). [44]

14
Fig 3. Activation of PKC via G-proteins. With permission from Ashok Kumar [49]. 1.3.4 Previous studies/ background knowledge To study the potential for the galanin receptors to couple to different G-proteins, GalR1- and GalR2-expressing Chinese hamster ovary (CHO) cell lines were generated and examined for their ability to couple to the Gs, Gi, Go and Gq proteins. It was found that galanin was unable to increase cAMP concentrations in GalR1- and GalR2-expressing cells, indicating inability for the receptors to couple to the Gs protein. On the contrary, galanin inhibited forskolin-stimulated cAMP production in GalR1/CHO cells by 70% and in GalR2/CHO cells by 30%, indicating a strong coupling between GalR1 and Gi and a more moderate one between GalR2 and Gi. [46] Both receptors mediated MAPK activity. The stimulation mediated by GalR1 was inhibited by expression of the C-terminus of the C-adrenergic receptor kinase, which inhibits Gβγ signalling specifically, but was unaffected by the PKC inhibitor or cellular depletion of PKC. On the contrary, GalR2-mediated MAPK activation was unaffected by βARKct expression, but abolished by inhibition of PKC activity. This suggests that GalR1 is coupled to a Giβγ signaling pathway to mediate MAPK activation while GalR2 uses a distinct one, consistent with Go-mediated MAPK activation. [46] Galanin was unable to stimulate inositol phosphate (IP) accumulation in cells expressing GalR1, but stimulated a 7-fold increase in IP production in cells expressing GalR2, not affected by pertussis toxin, suggesting linkage with Gq/G11. Thus, GalR1 seems to activate only the Gi pathway while GalR2 seems to activate Gi, Go, and Gq/G11 pathways. These different signalling profiles, the ability to discriminate between the receptors with different parts of the ligand and different distribution patterns of the receptors might be the answer to how galanin can regulate so many diverse physiological functions. [46]
15
2. Material and methods 2.1 The dissection 15-16 day pregnant Swiss-Webster mice were sacrificed, using an anaesthetic overdose of halothane in a jar. The belly were carefully sterilised with 70% alcohol, and thereafter cut open for removal of the foetuses. The foetuses were beheaded and placed in 1X dissection media (25 g glucose, 35 g sucrose, 1.75 g sodium bicarbonate and 500 ml 10X HBSS for 10X). Under a microscope in an air ventilated hood, the brains were removed and put in another Petri dish with dissection media on ice. Thereafter the hippocampi from each brain were removed very carefully using special dissection forceps and stored in yet another Petri dish on ice. Removal of the meninges from the brain tissue is very important since otherwise macrophages will occur in the neuronal cultures, destroying the neurons. 2.2 Making of the plates The plates were incubated with poly-D-lysine (300 µl/well) overnight in 37°C to make the cells attach better. After the incubation, the wells were washed three times with sterile water before the plating of the neurons. The dissection media containing the removed hippocampi (approx. 2 ml) were then transferred into a sterile falcon tube and spinned in a centrifuge, 1000 rpm for one minute, to gather the hippocampi at the bottom of the tube. The dissection media were removed, replaced by cell culturing media (5 ml Fetal Bovine Serum, 5 ml Donor Horse Serum, 1 ml glutamine and 89 ml media stock (900 ml Gibco Water, 100 ml 10X Minimum Essential Medium and 90 ml glucose bicarbonate, the glucose bicarbonate made from 1 L Gibco Water, 29.66 g sodium bicarbonate and 44.44 g glucose)), and the solution homogenised. One mouse often yielded at least 10 foetuses (i.e. 20 hippocampi) which was just enough for two plates, but sometimes just one was made for greater concentrations of neurons. The cells were to be plated on 24 well plates, containing 0,5 ml of the homogenised cell solution in each. The cell plates were placed in an incubator for primary neurons, 37 °C and CO2 level of 7 %. After about 7-10 days the cell cultures needs to be treated with a mitotic inhibitor, AraC (cytosine arabinofuranoside) to a concentration of 5 µM, to stop further glial expansion. The glia cells are essential for neuronal survival, taking care of the excess glutamate in the media and helping the neurons to grow by exchanging nutrients between them. But one layer of glial cells is enough, after 7-10 days micro-glias are starting to form which kills the neurons. Hence, one has to check the proliferation of the glias from day six and see when the perfect time is to inhibit (when this is varies from one cell-culture to another). The timing is very important since if it is too late, the micro-glias will kill the neurons, and too early the neurons will not have the chance to develop properly, they will retract in growth and ultimately die. About 21 days from the day of the plating, the neurons are forming a nice web of fully grown axons and dendrites and the plate is ready for use.

16
2.3 Treating the cell cultures 2.3.1 Experimental setup The different treatments used in the experiments were: Ctrl gal(1-29) (5 µM) gal(2-11) (5 µM) M40 (5 µM) gal(1-29) (5 µM) + M40 (5 µM) gal(2-11) (5 µM) + M40 (5 µM) Samples were both untreated and treated with 1 µM TTX and a time course of both gal(1-29) and gal(2-11) were made. A single experiment in DRN neurons was also conducted. 2.3.2 Performing the experiments The first step in treating the neurons is to wash them, exchanging 2/3 of the cell culturing media for a media without serum (1X HCSS) three times, to calm the cells down. The cells are left in the incubator like this for about 90 minutes, which could kill them, so their condition has to be checked before proceeding with the next step. In the experiments where TTX (tetrodo-toxin) was used, a sodium channel blocker that prevents action potential firing in the neurons, it was added to the media at this state. TTX is used to see the effect induced by galanin on the individual neurons, and not the effect triggered by other neurons in the network. It could also be useful in determining if the effect is pre or post synaptic. In the wells were the galanin antagonist M40 were used, it was also added at this time. Then the cells were left in the incubator again for another 30 minutes. After that, galanin was added, and the plates put back in the incubator. They were left there for ten minutes (which is suggested from the timecourses to be the ultimate incubation time), except for in the making of the timecourses, of course. The next step was to harvest the cells, starting with washing the cells on ice with cold PBS (phosphate-buffered saline) three times. All PBS were removed and 70 µl lysis-buffer with phosphotate inhibitor were added to each well. The cells were lysed for about 15 minutes on ice, rubbed loosed from the plate using a plastic spatula and removed from the plate into eppendorf tubes. The tubes were centrifuged at 10 000 rpm in 4ºC for 15 minutes whereupon the supernatant was transferred to another tube. The protein concentration was measured using a BCA protein assay.
17
2.4 Western blot The gels made for Tris-glycine SDS-Polyacrylamide Gel Electrophoresis consisted of a 10% resolving gel and a 5% stacking gel. One tenth of 1M DTT and loading buffer were added to the samples, whereafter the samples were boiled for 10 minutes at 100ºC to denaturize the protein and loaded onto the gel with 10 µg/well as where 10 µl of the Bench Mark prestained protein ladder (10748-010) which were used for size comparison of the fragments. They were run in 1X running buffer (tris/glycine with 10% SDS) for about an hour at a constant current of 50 mA for two gels. The proteins in the gels were then transferred onto a membrane using transfer buffer (running buffer with 10% methanol to make the proteins move from the gel to the membrane). The membranes were then put in 1% acetic acid to lower the pH whereafter they were stained with Ponseau to see if the running of the gel and the transfer had succeeded. After this check the membranes were washed with water, and finally TBS-tween (0,5% tween), until all Ponseau was gone. After this the membranes were blocked for at least one hour at RT in 6 % non fat dry milk solution (milk powder + TBS-tween) to prevent unspecific binding of the Ab to the membrane. Primary antibody, Phospho-p44/42 MAPK (E10) mouse antibody from cell signaling, which detects dually phosphorylated p44 (Erk1) and p42 (Erk2) proteins (i.e. the activated form), was put 1:2000 in milk solution. The membranes were incubated with primary Ab at 4ºC overnight. After this they were washed 3 times for 10 minutes in TBS-tween, and put in secondary Ab (1:5000). The membrane were incubated at RT for at least an hour, then washed 3 times for 20 minutes, in TBS-tween the first two times and just TBS the last. After this the membranes were developed. After development the membranes were stripped and reprobed with primary Ab p44/42 (cell signaling) in milk solution 1:2000. This Ab detects all Erk1 and Erk2 proteins, even the unphosphorylated forms, and is used for correct comparison between wells. 2.5 Quantification The pictures yielded from the development were scanned using Mac program Magic Scan. The scanned pictures were then quantified for the peak and average intensity of each well using Quantity-One. These results are summoned in Table 6 in the appendix. The ratio between phospho-Erk/total Erk was calculated for every well in every blot. To be able to compare the blots with each other, the ratios were normalized setting the background (untreated control wells) to 1 in every blot. Since there is no activation in these wells, the wells in the two blot pictures (phospho-Erk and Erk) should have the same intensity if exposed alike (supposing the Ab binds to the exact same level). Since this is almost impossible, pretending it is not; setting the ratio in the control well to 1, and compensating for the changes necessary to do so in the other wells, removes the errors from the exposure. This makes it possible to compare the different blots with each other. The normalized values and the calculated averages, standard deviations and standard errors are seen in table 1-5 in the result section.

18
3. Results The normalized results are seen in Table 1-5 below, the raw data and normalization calculations are seen in Table 6 in the appendix. The most important is the peak intensity, but the average intensity is also measured as a control since it is supposed to correlate with the peak intensity. The graphs are made from activation of Erk1 the Ab presumably detects Erk1 levels more accurately than Erk2. In Table 1 below the results from the timecourse using gal(1-29) is presented.
Treatment ERK1 (p44) ERK1(p44) ERK2 (p42) ERK2 (p42) Peak Average Peak Average Intensity Intensity Intensity Intensity ctrl 1 1 1 1 gal(1-29) 1min. 0.86 0.97 1.36 1.36 gal(1-29) 5min. 1.71 1.15 0.92 0.81 gal(1-29) 10min. 6.62 3.26 2.34 3.07 gal(1-29) 15min. 5.62 2.59 1.66 2.67 gal(1-29) 30min. 2.1 0.82 0.93 1.37 gal(1-29) 60min. 2.38 1.53 1.15 2.25
Table 1. Timecourse of Erk activation due to stimulation with gal(1-29) during 60 minutes. A graph of the peak intensity of gal(1-29) activated Erk1 during 60 minutes (column 1) is seen in Figure 4 below. The timecourse shows a maximal neuronal stimulation due to galanin after approximately 10 minutes.
0
1
2
3
4
5
6
7
ctrl gal(1-29)1min.
gal(1-29)5min.
gal(1-29)10min.
gal(1-29)15min.
gal(1-29)30min.
gal(1-29)60min.
Rel
ativ
e In
tens
ity
Fig. 4. The peak intensity of activated Erk1 during 60 minutes stimulation with gal(1-29).
19
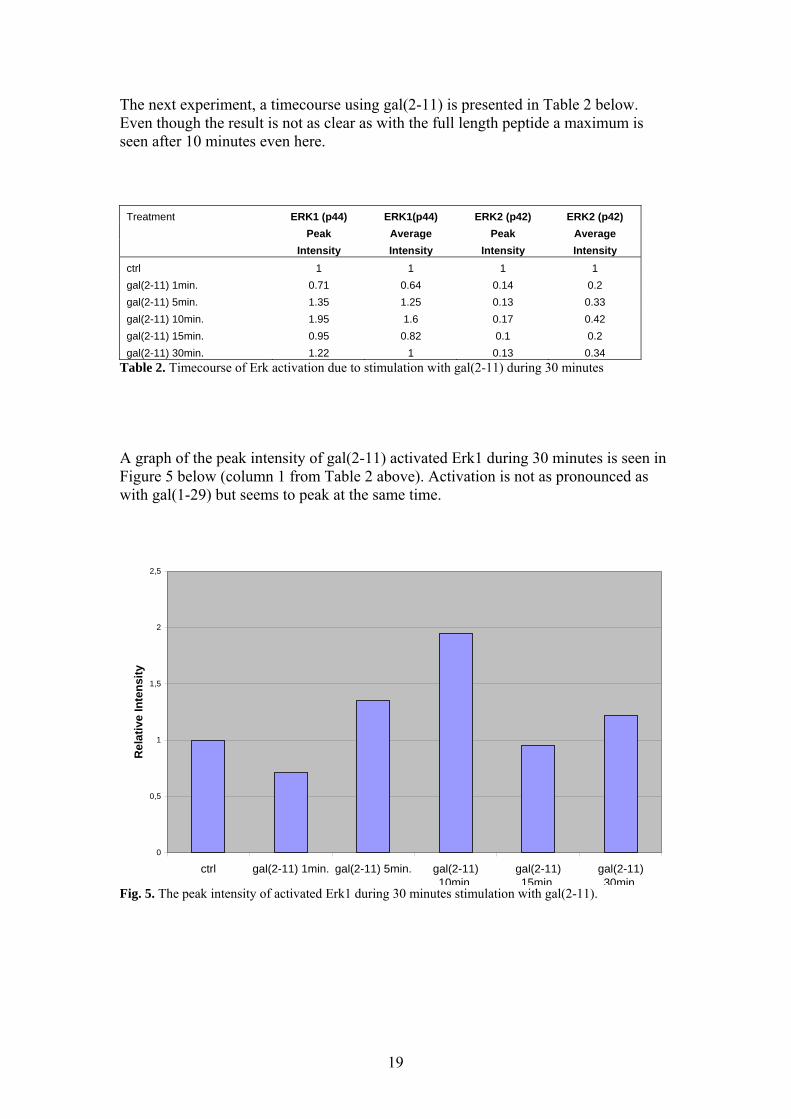
The next experiment, a timecourse using gal(2-11) is presented in Table 2 below. Even though the result is not as clear as with the full length peptide a maximum is seen after 10 minutes even here.
Treatment ERK1 (p44) ERK1(p44) ERK2 (p42) ERK2 (p42) Peak Average Peak Average Intensity Intensity Intensity Intensity ctrl 1 1 1 1 gal(2-11) 1min. 0.71 0.64 0.14 0.2 gal(2-11) 5min. 1.35 1.25 0.13 0.33 gal(2-11) 10min. 1.95 1.6 0.17 0.42 gal(2-11) 15min. 0.95 0.82 0.1 0.2 gal(2-11) 30min. 1.22 1 0.13 0.34
Table 2. Timecourse of Erk activation due to stimulation with gal(2-11) during 30 minutes A graph of the peak intensity of gal(2-11) activated Erk1 during 30 minutes is seen in Figure 5 below (column 1 from Table 2 above). Activation is not as pronounced as with gal(1-29) but seems to peak at the same time.
0
0,5
1
1,5
2
2,5
ctrl gal(2-11) 1min. gal(2-11) 5min. gal(2-11)10min.
gal(2-11)15min.
gal(2-11)30min.
Rel
ativ
e In
tens
ity
Fig. 5. The peak intensity of activated Erk1 during 30 minutes stimulation with gal(2-11).

20
In Table 3 below, the results from neuronal stimulation by incubation with gal(1-29), gal(2-11) and M40 from the TTX omitted wells are presented. Calculated averages, standard deviations and standard errors for each treatment are also presented.
Treatment ERK1 (p44) ERK1(p44) ERK2 (p42) ERK2 (p42) Peak Average Peak Average Intensity Intensity Intensity Intensity Ctrl 1 1 1 1 gal(1-29) 3.3 8.4 0.46 1.87 2.57 2.46 0.89 1.12 Average 2.935 5.43 0.675 1.495 Standard dev. 0.516 4.200 0.304 0.530 Standard error 0.37 2.97 0.21 0.11 gal(2-11) 0.71 0.89 0.96 1.76 M40 0.93 1.2 0.68 1.95 1.14 1.15 1.01 1.75 Average 1.035 1.175 0.845 1.85 Standard dev. 0.148 0.035 0.233 0.141 Standard error 0.1 0.02 0.16 0.1 gal(1-29)+M40 1.23 1.22 0.71 1.5 0.57 1.23 0.77 0.79 Average 0.9 1.225 0.74 1.145 Standard dev. 0.467 0.007 0.042 0.502 Standard error 0.33 0.005 0.03 0.35 gal(2-11)+M40 0.33 0.54 1.29 1.52
Table 3. Normalized values and averages, standard deviations and standard errors for the experiments not using TTX. A graph of the peak intensity of activated Erk1 based on experiments summoned in column 1 Table 3 is seen in Figure 6 on the next page. The average from every treatment is presented, as is the standard errors as error bars. The results indicate stimulation of the Erk/MAPK pathway due to gal(1-29) stimulation, but not by gal(2-11). This stimulation is blocked by the receptor antagonist M40.

21
0
0,5
1
1,5
2
2,5
3
3,5
Ctrl gal(1-29) gal(2-11) M40 gal(1-29)+M40 gal(2-11)+M40
Rel
ativ
e In
tens
ity
Fig. 6. The peak intensity of activated Erk1 for the different treatments in table 3. In Table 4a and 4b below the results from the different treatments using the sodium channel blocker TTX are presented. These results are in agreement with the ones not using TTX (Table 3). This indicates that the effect seen by galanin is pre-synaptic since blocking the firing of action-potentials seems to make no difference.
Treatment ERK1 (p44) ERK1(p44) ERK2 (p42) ERK2 (p42) Peak Average Peak Average Intensity Intensity Intensity Intensity ctrl+TTX 1 1 1 1 gal(1-29)+TTX 3.55 3.89 1.17 2.17 7.77 18.5 1.4 3.15 10.35 16.76 0.4 1.06 9.11 6.9 4.48 11.68 1.53 3.38 1.11 2.59 1.17 1.69 1.04 1.69 0.33 1.18 0.56 0.71 Average 4.83 7.471 1.451 3.293 Standard dev. 4.155 7.197 1.381 3.794 Standard error 1.57 2.72 0.52 1.43 gal(2-11)+TTX 1.14 1.4 0.96 1.88 0.69 1.45 1.76 4.15 1.13 2.57 1.06 2.2 0.81 0.94 1.15 1.87 Average 0.943 1.59 1.233 2.525 Standard dev. 0.228 0.692 0.360 1.094 Standard error 0.11 0.35 0.18 0.55
Table 4a. Normalized values and averages, standard deviations and standard errors for the experiments using TTX, part one.

22
Treatment ERK1 (p44) ERK1(p44) ERK2 (p42) ERK2 (p42) Peak Average Peak Average Intensity Intensity Intensity Intensity M40+TTX 3.32 2.82 1.42 2.65 1.85 2.62 1.22 1.57 1.3 1.57 0.83 0.7 0.93 1.52 1.25 2.46 1.14 1.59 1.23 1.84 0.95 0.91 0.79 0.65 Average 1.582 1.838 1.123 1.645 Standard dev. 0.916 0.731 0.254 0.849 Standard error 0.37 0.3 0.1 0.35 gal(1-29)+M40+TTX 3.23 3.89 1.01 1.41 2.08 1.75 1.07 0.79 0.62 1.03 0.98 1.12 0.46 0.65 0.9 0.55 0.45 1.04 1.5 3.75 0.86 1.02 1.09 1.52 5.39 5.36 1.09 2.69 Average 1.87 2.106 1.091 1.69 Standard dev. 1.865 1.802 0.193 1.139 Standard error 0.7 0.68 0.07 0.43 gal(2-11)+M40+TTX 0.39 1.2 0.73 1.19 0.71 1.07 1.07 2.13 1.25 1.5 2.33 4.09 1.57 1.63 1.78 2.4 Average 0.98 1.35 1.478 2.453 Standard dev. 0.53 0.259 0.717 1.209 Standard error 0.26 0.13 0.36 0.6
Table 4b. Normalized values and averages, standard deviations and standard errors for the experiments using TTX, part two.

23
A graph of the peak intensity of activated Erk1 based on experiments summoned in Table 4a and 4b (column 1) is seen in Figure 7 below. As with the experiments not using TTX, an activation of the Erk/MAPK pathway is seen by gal(1-29) and furthermore blocked by M40.
0
1
2
3
4
5
6
7
Ctrl gal(1-29) gal(2-11) M40 gal(1-29)+M40 gal(2-11)+M40
Rel
ativ
e In
tens
ity
Fig. 7. The peak intensity of activated Erk1 for the different treatments in table 4a and 4b. In Table 5 below, the results of a single experiment in DRN neurons are presented. In these experiment only activation by gal(1-29) and gal(2-11), with and without TTX, is investigated. No antagonist is used in this experiment.
Normalized values ERK1 (p44) ERK1(p44) ERK2 (p42) ERK2 (p42) Peak Average Peak Average Intensity Intensity Intensity Intensity DRN ctrl 1 1 1 1 gal(1-29) 1.56 1.25 1.19 1.71 gal(2-11) 2.11 1.5 1.14 1.36 ctrl+TTX 1 1 1 1 gal(1-29)+TTX 1.5 1.09 1.46 1.52 gal(2-11)+TTX 1 0.55 1.4 1.15
Table 5. Values from a single experiment in DRN neurons.

24
A graph of the peak intensity of activated Erk1 based on a single experiment in DRN neurons presented in Table 5 is seen in Figure 8 below. This indicates a somewhat stronger activation of Erk1 by gal(2-11) that gal(1-29).
0
0,5
1
1,5
2
2,5
ctrl gal(1-29) gal(2-11) ctrl+TTX gal(1-29)+TTX gal(2-11)+TTX
Rel
ativ
e In
tens
ity
Fig. 8. The peak intensity for activated Erk1 in a single experiment in DRN neurons. The interpretations of the results from the different experiments are presented in the discussion. 4. Discussion Previous experiments in galanin receptor expressing CHO cell-lines showed MAPK activation in response to galanin treatment. Coupling of different G-proteins to the galanin receptors outlined a base for this experiment. In these cell-lines, expressing either GalR1 or GalR2, a basic hypothesis regarding the intracellular signaling pathways due to galanin stimulation of galanin receptors was formed.
In these previous experiments it was shown that both receptors mediated MAPK signaling cascades when exposed to galanin. Since this experiment was performed in transfected cell-lines, the question remains; does the signaling follow the same pattern in the native system, in a neuron naturally expressing the receptors. To determine if this was in fact so, primary hippocampal neuronal cultures, known to express galanin receptors, were altered from dissection of foetal mouse brains and subsequently treated with galanin and galanin antagonists.

25
Western blot analysis of the experiments, staining for Erk activation, showed a significant increase of activated Erk in gal(1-29) treated neurons also treated with TTX (Table 4a and 4b). In neurons not treated with TTX the activation was not as profound but followed the same pattern suggesting the effect to be pre-synaptic, since blocking of action-potential firing by TTX seemed to make no difference (Table 3). The timecourse showed that the activation induced by gal(1-29) peaked after approximately 10 minutes (Table 1), which was the incubation time used for following experiments. The activation due to gal(1-29) was also blocked, or partially blocked by the galanin receptor antagonist M40 (Table 4a and 4b/ Figure 7).
The timecourse of gal(2-11) also showed maximal activation of Erk proteins after 10 minutes (Figure 5), but the activation was not as legible as with gal(1-29). In fact, this experiment was unable to show consistent gal(2-11) stimulation in hippocampal neurons. This might be due to signaling via different receptor subtypes since gal(2-11) is used as a selective ligand for GalR2, and the previous experiments indicated different pathways to mediate MAPK activation via GalR1 and GalR2, and that stimulation of GalR2 activates MAPK to a lesser extent since it also can activate other pathways. This may also depend on different distributions of the receptors since a single experiment in DRN neurons indicated that gal(2-11), and to a lesser extent gal(1-29), activated MAPK (Table 5). 5. Future perspectives As a direct continuation of this experiment, to further investigate the signaling pathways of galanin, is to continue this experiment in a larger scale and with other neuronal tissues. To check for the difference between gal(1-29) and gal(2-11) in PKC inhibition/depletion and to determine if the C-terminus of βARK can act as an inhibitor, which of course might be hard in neurons. Try to investigate the differences between the receptors, maybe using tissue from receptor knock-out mice. Check for CREB activation using CREB Ab in western blot to further analyze the pathways.
When it comes to the future of galanin, there is almost nowhere to start in determining what should or could be done in the future, it is too much. The new strains of GalR1- and GalR2 KO mice, together with the Gal KO and Gal OE mouse strains and the galanin receptor antagonists and agonists, provide powerful tools for further characterization of the galaninergic system. The making of GalR3 KO mice, as well as double and triple KO is yet ahead of us. To further characterize the functional coupling of the receptors, to determine exactly which receptor that mediates which response, and to construct receptor selective ligands is one way to go, to ultimately be able to use the galaninergic system for treatment of many disorders such as eating disorders, epilepsy and AD.
26
6. Acknowledgement I would like to thank Professor Tamas Bartfai for giving me the opportunity to perform this work at his lab at The Scripps Research Institute, San Diego. I would also like to thank Xiaoying Lu for supervision and Svetlana, Jacinta and Marga for helping with the dissection and culturing of the neurons. I would also like to thank everyone else in the Bartfai lab for answering my questions, helping out and making me feel welcome in the lab! 7. References 1. Jacobowitz D. M. et al. (2004) Galanin in the brain: chemoarchitectonics and brain cartography – a historical review. Peptides 25, 433-464 2. Tatemoto K. et al. (1983) Galanin - a novel biologically active peptide from porcine intestine. FEBS Lett 164, 124-128 3. Vrontakis M. E. (2002) Galanin: a biologically active peptide. Curr Drug Targets CNS Neurol Disord 1, 531-541 4. Hökfelt T. et al. (1987) Increase of galanin-like immunoreactivity in rat dorsal root ganglion cells after peripheral axotomy. Neurosci Lett 83, 217-220 5. Gabriel S. M. et al. (1989) Tissue specific sex differences in galanin-like immunoreactivity and galanin mRNA during development in the rat. Peptides 10, 369-374 6. Lang R. et al. (2001) Biphasic response to human galanin of extracellular acidification in human Bowes melanoma cells. Eur J Pharmacol 423, 135-141 7. Branchek T.A. et al. (2000) Galanin receptor subtypes. Trends Pharmacol Sci 21, 109-117 8. Melander T. et al. (1986) Coexistence of galanin-like immunoreactivity with catecholamines, 5-hydroxytryptamine, GABA and neuropeptides in the rat CNS. J Neurosci 6, 3640-3654 9. Hökfelt T. et al. (1987) Coexistence of peptides with classical neurotransmitters. Experientia 43, 768-780 10. Bartfai T. et al. (1993) Galanin receptor ligand M40 peptide distinguishes between putative galanin-receptor subtypes. Proc Natl Acad Sci U S A 90, 11287-11291 11. Ceide S. C. et al. (2004) Synthesis of galmic: A nonpeptide galanin receptor agonist. PNAS 101, 16727-16732 12. Saar K. et al. (2002) Anticonvulsant activity of a nonpeptide galanin receptor antagonist. Proc Natl Acad Sci U S A 99, 7136-7141 13. Crawley J. N. et al, (2002) Galanin overexpressing transgenic mice. Neuropeptides 36, 145-156 14. Wynick D. et al. (2002) Targeted disruption of galanin. New insights from knock-out studies. Neuropeptides 36, 132-144 15. Wiesenfeld-Hallin Z. et al. (2001) Neuropeptides in neuropathic and inflammatory pain with special emphasis on cholecystokinin and galanin Eur J Pharmacol 429, 49-59 16. Ma X. et al. (2001) Effects of galanin receptor agonists on locus coeruleus neurons. Brain Res 919, 169-174 17. Villar M. J. et al. (1989) Neuropeptide expression in rat dorsal root ganglion cells and spinal cord after peripheral nerve injury with special reference to galanin. Neuroscience 33, 587-604 18. Holmes F. E. et al. (2000) Targeted disruption of the galanin gene reduces the number of sensory neurons and their regenerative capacity. Proc Natl Acad Sci USA 97, 11563-11568 19. Counts S. E. et al. (2001) Galanin: neurobiologic mechanisms and therapeutic potential for Alzheimer’s disease. CNS Drug Rev 7, 445-470 20. Chan-Palay V. (1988) Galanin hyperinnervates surviving neurons of the human basal nucleus of Meynert in dementias of Alzheimer’s and Parkinson’s disease: a hypothesis for the role of galanin in accentuating cholinergic dysfunction in dementia. J Comp Neurol 273, 543-557 21. Chan-Palay V. (1998) Neurons with galanin innervate cholinergic cells in the human basal forebrain and galanin and acetylcholine coexist. Brain Res Bull 21, 465-472

27
22. Mufson E. J. et al. (1993) Galaninergic innervation of the cholinergic vertical limb of the diagonal band (Ch2) and bed nucleus of the stria terminalis in aging, Alzheimer’s disease and Down’s syndrome. Dementia 4, 237-250 23. Mufson E. J. et al. (2000) Galanin receptor plasticity within the nucleus basalis in early and late Alzheimer’s disease: an in vitro autoradiographic analysis. Neuropharmacology 39, 1404-1412 24. Rodriguez-Puertas R. et al. (1997) 125I-galanin binding sites in Alzheimer’s disease: increases in hippocampal subfields and a decrease in the caudate nucleus. J Neurochem 68, 1106-1113 25. Mazarati A. et al. (2000) Modulation of hippocampal excitability and seizures by galanin. J Neurosci 20, 6276-6281 26. Steiner R. A. et al. (2001) Galanin transgenic mice display cognitive and neurochemical deficits characteristic of Alzheimer’s disease. Proc Natl Acad Sci U S A 98, 4184-4189 27. Elvander E. et al. (2004) Intraseptal muscarinic ligands and galanin: influence on hippocampal acetylcholine and cognition. Neuroscience 126, 541-557 28. Lamour Y. et al. (1988) Neuropeptides and septohippocampal neurons: electrophysiological effects and distributions of immunoreactivity. Peptides 9, 1351-1359 29. Mazarati A. et al. (2004) Galanin type 2 receptors regulate neuronal survival, susceptibility to seizures and seizure-induced neurogenesis in the dentate gurys. Eur J Neurosci 19, 3235-3244 30. Mazarati A. et al. (1992) Anticonvulsive effects of galanin administered into the central nervous system upon the picrotoxin-kindled seizure syndrome in rats. Brain Res 589, 164-166 31. Kokaia M. et al. (2001) Suppressed kindling epileptogenesis in mice with ectopic overexpression of galanin. Proc Natl Acad Sci U S A 98, 14006-14011 32. Mazarati A. et al. (1998) Galanin modulation of seizures and seizure modulation of hippocampal galanin in animal models of status epilepticus. J Neurosci 18, 10070-10077 33. Mazarati A. et al. (2004) Patterns of seizures, hippocampal injury and neurogenesis in three models of status epilepticus in galanin receptor type 1 (GalR1) knockout mice. Neuroscience 128, 431-441 34. Hökfelt T. et al. (1998) Galanin in ascending systems. Focus on coexistence with 5-hydroxytryptamine and noradrenaline. Ann N Y Acad Sci 863, 252-263 35. Xu Z. Q. et al. (1998) Galanin-5-hydroxytryptamine interactions: electrophysiological, immunohistochemical and in situ hybridization studies on rat dorsal raphe neurons with note on galanin R1 and R2 receptors. Neuroscience 87, 79-94 36. Seutin V. et al. (1989) Galanin decreases the activity of locus coeruleus neurons in vitro. Eur J Pharmacol 164, 373-376 37. Yoshitake T. et al. (2004) Enhanced hippocampal noradrenaline and serotonon release in galanin-overexpressing mice after repeated forced swimming test. Proc Natl Acad Sci U S A 101, 354-359 38. Lu X. et al. (2005) A role for galanin in antidepressant actions with a focus on the dorsal raphe nucleus. PNAS 102, 874-879 39. O’Meara G. et al. (2000) Galanin regulates the postnatal survival of a subset of basal forebrain cholinergic neurons. Proc Natl Acad Sci U S A 97, 11569-11574 40. Mahoney S. A. et al. (2003) The second galanin receptor GalR2 plays a key role in neurite outgrowth from adult sensory neurons. J Neurosci 23, 416-421 41. Anisimov S. V. et al. (2002) SAGE identification of gene transcripts with profiles unique to pluripotent mouse R1 embryonic stem cells. Genomics 79, 169-176 42. Crawley J. N. (1999) The role of galanin in feeding behavior. Neuropeptides 33, 369-375 43. Cobb M. H. (1999) MAP kinase pathways. Prog Biophys Mol Biol 71, 479-500 44. Lodish H. et al. Molecular cell biology, fourth edition, NYC (1999) W.H. Freeman and Company, 852-855, 878-894 45. Gudermann T. (2001) Multiple pathways of ERK activation by G protein coupled receptors. Novartis Found Symp 239, 68-79; 80-84; 150-159 46. Wang S. et al. Differential intracellular signaling of the GalR1 and GalR2 receptor subtypes. Biochemistry 37, 6711-6717 47. http://www.emdbiosciences.com/html/EMD/ip_erkmapk.html 48. Karl Loren website: Pain is a subjective experience http://www.painstudy.com/NonDrugRemedies/Pain/ 49. Dr. Ashok Kumar: Baylor College of Medicine, The role of mechanical stress in skeletal myocytes: MAPK SIGNAL TRANSDUCTION PATHWAYS, Reviews in Undergraduate Research - Issue 1

28
8. Appendix
Raw data and calculated ratios ERK1 (p44) ERK1(p44) ERK2 (p42) ERK2 (p42) Peak Average Peak Average 1-4 11/5 Intensity Intensity Intensity Intensity Ctrl+TTX ppERK 80,11 52,59 254,56 148,48 Ctrl+TTX ERK 255 193,06 255 216,48 Ctrl+TTX (ppERK/ERK) 0,31 0,27 1 0,69 Normalized value 1 1 1 1 gal(1-29) +TTX ppERK 255 166,92 255 239,56 gal(1-29) +TTX ERK 232,78 159,04 218,33 159,59 gal(1-29) +TTX (ppERK/ERK) 1,1 1,05 1,17 1,5 Normalized value 3,55 3,89 1,17 2,17 M40+TTX ppERK 229,33 117 250,78 231,33 M40+TTX ERK 222,67 153,44 176,56 126,19 M40+TTX (ppERK/ERK) 1,03 0,76 1,42 1,83 Normalized value 3,32 2,82 1,42 2,65 gal(1-29)+M40+TTX ppERK 255 172,63 255 168,52 gal(1-29)+M40+TTX ERK 255 163,73 253,78 173,04 gal(1-29)+M40+TTX (ppERK/ERK) 1 1,05 1,01 0,97 Normalized value 3,23 3,89 1,01 1,41 1-8 11/01 Ctrl ppERK 93,33 27,09 255 130,61 Ctrl ERK 219,22 110,58 254,33 120,31 Ctrl (ppERK/ERK) 0,43 0,24 1 1,09 Ctrl+TTX ppERK 28,67 14,27 182,56 97,94 Ctrl+TTX ERK 224,78 170,89 255 159,48 Ctrl+TTX (ppERK/ERK) 0,13 0,08 0,72 0,61 Normalized value 1 1 1 1 gal(1-29) +TTX ppERK 255 118,58 255 201,39 gal(1-29) +TTX ERK 251,78 80,3 253,11 105,16 gal(1-29) +TTX (ppERK/ERK) 1,01 1,48 1,01 1,92 Normalized value 7,77 18,5 1,4 3,15 gal(1-29) ppERK 14,78 10,04 182,11 78,22 gal(1-29) ERK 228 79,52 238,78 132,33 gal(1-29) (ppERK/ERK) 0,06 0,13 0,76 0,59 gal(1-29)+M40 ppERK 5,67 4,76 94,11 60,04 gal(1-29)+M40 ERK 203,56 103,96 168,89 122,14 gal(1-29)+M40 (ppERK/ERK) 0,03 0,05 0,56 0,49 M40 ppERK 25,33 14,64 246,67 146,53 M40 ERK 138,11 95,17 160,56 71,93 M40 (ppERK/ERK) 0,18 0,15 1,54 2,04 M40+TTX ppERK 46,33 19,87 203,89 137 M40+TTX ERK 189,89 96,06 234,89 142,11 M40+TTX (ppERK/ERK) 0,24 0,21 0,87 0,96 Normalized value 1,85 2,62 1,22 1,57 gal(1-29)+M40+TTX ppERK 55,44 18,81 152 60,69 gal(1-29)+M40+TTX ERK 205,11 134,22 198,67 127,31 gal(1-29)+M40+TTX (ppERK/ERK) 0,27 0,14 0,77 0,48 Normalized value 2,08 1,75 1,07 0,79 1-8 11/11 Ctrl ppERK 26,67 19,53 204,22 90

29
Ctrl ERK 67,11 53,59 52,22 35,67 Ctrl (ppERK/ERK) 0,4 0,36 3,91 2,52 Normalized value 1 1 1 1 Ctrl+TTX ppERK 67,33 42,67 240 202,08 Ctrl+TTX ERK 181,33 114,28 95,11 61,89 Ctrl+TTX (ppERK/ERK) 0,37 0,37 2,52 3,26 Normalized value 1 1 1 1 gal(1-29) ppERK 228,44 214,26 241,89 240,22 gal(1-29) ERK 172,89 70,83 137,33 51 gal(1-29) (ppERK/ERK) 1,32 3,02 1,76 4,71 Normalized value 3,3 8,4 0,46 1,87 gal(1-29) +TTX ppERK 243,11 161,5 255 242,83 gal(1-29) +TTX ERK 63,44 26 254,44 70,71 gal(1-29) +TTX (ppERK/ERK) 3,83 6,2 1 3,43 Normalized value 10,35 16,76 0,4 1,06 M40 ppERK 62 39,5 242,11 238,7 M40 ERK 167,56 92,39 92,11 48,94 M40 (ppERK/ERK) 0,37 0,43 2,63 4,88 Normalized value 0,93 1,2 0,68 1,95 M40+TTX ppERK 66 39,06 251,33 187,58 M40+TTX ERK 138,33 70,09 121 83,04 M40+TTX (ppERK/ERK) 0,48 0,58 2,08 2,26 Normalized value 1,3 1,57 0,83 0,7 gal(1-29)+M40 ppERK 75,33 43,11 254,89 188,94 gal(1-29)+M40 ERK 154,44 97,25 93,89 50,52 gal(1-29)+M40 (ppERK/ERK) 0,49 0,44 2,72 3,74 Normalized value 1,23 1,22 0,71 1,5 gal(1-29)+M40+TTX ppERK 28,11 19,78 248,67 173,13 gal(1-29)+M40+TTX ERK 123,44 51,8 101,56 48 gal(1-29)+M40+TTX (ppERK/ERK) 0,23 0,38 2,45 3,61 Normalized value 0,62 1,03 0,98 1,12 1-5 11/19 Ctrl+TTX ppERK 54,11 23,07 255 102,44 Ctrl+TTX ERK 190,56 114,04 242,56 126,17 Ctrl+TTX (ppERK/ERK) 0,28 0,2 1,05 0,81 Normalized value 1 1 1 1 gal(1-29) +TTX ppERK 109,33 41,4 253,78 237,93 gal(1-29) +TTX ERK 42,89 30,04 54 25,14 gal(1-29) +TTX (ppERK/ERK) 2,55 1,38 4,7 9,46 Normalized value 9,11 6,9 4,48 11,68 gal(2-11) +TTX ppERK 81,33 41,11 255 248,74 gal(2-11) +TTX ERK 254,22 149,04 253,56 162,22 gal(2-11) +TTX (ppERK/ERK) 0,32 0,28 1,01 1,53 Normalized value 1,14 1,4 0,96 1,88 gal(1-29)+M40+TTX ppERK 33,33 21,19 236,78 82,37 gal(1-29)+M40+TTX ERK 252,11 157,59 249,56 184,96 gal(1-29)+M40+TTX (ppERK/ERK) 0,13 0,13 0,95 0,45 Normalized value 0,46 0,65 0,9 0,55 gal(2-11)+M40+TTX ppERK 19,11 17,97 155,22 102,41 gal(2-11)+M40+TTX ERK 177,78 73,97 202,78 105,59 gal(2-11)+M40+TTX (ppERK/ERK) 0,11 0,24 0,77 0,97 Normalized value 0,39 1,2 0,73 1,19 1-7 11/19

30
Ctrl ppERK 33,67 22,08 255 157,78 Ctrl ERK 164,22 64,4 238,56 110,42 Ctrl (ppERK/ERK) 0,21 0,34 1,07 1,43 Normalized value 1 1 1 1 gal(1-29) 1min. ppERK 30,11 19,53 253,11 139,72 gal(1-29) 1min. ERK 166,67 59,91 174 71,94 gal(1-29) 1min. (ppERK/ERK) 0,18 0,33 1,45 1,94 Normalized value 0,86 0,97 1,36 1,36 gal(1-29) 5min. ppERK 86,22 47,33 247,78 155,96 gal(1-29) 5min. ERK 242,56 122,56 249,11 135,41 gal(1-29) 5min. (ppERK/ERK) 0,36 0,39 0,99 1,15 Normalized value 1,71 1,15 0,92 0,81 gal(1-29) 10min. ppERK 169 45,82 255 246,53 gal(1-29) 10min. ERK 121,67 41,22 101,11 56,3 gal(1-29) 10min. (ppERK/ERK) 1,39 1,11 2,52 4,38 Normalized value 6,62 3,26 2,34 3,07 gal(1-29) 15min. ppERK 198,11 92,85 255 219,47 gal(1-29) 15min. ERK 167,56 105,67 143 57,87 gal(1-29) 15min. (ppERK/ERK) 1,18 0,88 1,78 3,8 Normalized value 5,62 2,59 1,66 2,67 gal(1-29) 30min. ppERK 106,67 29,22 255 191,89 gal(1-29) 30min. ERK 242,11 105,98 254,56 98,07 gal(1-29) 30min. (ppERK/ERK) 0,44 0,28 1 1,96 Normalized value 2,1 0,82 0,93 1,37 gal(1-29) 60min. ppERK 89,11 38,95 255 245,52 gal(1-29) 60min. ERK 179,44 74,27 205 76,31 gal(1-29) 60min. (ppERK/ERK) 0,5 0,52 1,24 3,22 Normalized value 2,38 1,53 1,15 2,25 1-6red 12/10 Ctrl+TTX ppERK 147 62,63 159,44 80,64 Ctrl+TTX ERK 252,78 218,89 157,44 101,37 Ctrl+TTX (ppERK/ERK) 0,58 0,29 1,01 0,8 Normalized value 1 1 1 1 gal(1-29) +TTX ppERK 185,89 100,33 255 226,03 gal(1-29) +TTX ERK 209,56 101,93 226,67 109,44 gal(1-29) +TTX (ppERK/ERK) 0,89 0,98 1,12 2,07 Normalized value 1,53 3,38 1,11 2,59 gal(2-11) +TTX ppERK 94,67 53,17 253 240,82 gal(2-11) +TTX ERK 234,22 126 142,44 72,61 gal(2-11) +TTX (ppERK/ERK) 0,4 0,42 1,78 3,32 Normalized value 0,69 1,45 1,76 4,15 gal(1-29)+M40+TTX ppERK 51,67 40,15 248,33 237,37 gal(1-29)+M40+TTX ERK 195,44 133,7 163,67 78,89 gal(1-29)+M40+TTX (ppERK/ERK) 0,26 0,3 1,52 3 Normalized value 0,45 1,04 1,5 3,75 gal(2-11)+M40+TTX ppERK 89,78 44,47 249,11 239,78 gal(2-11)+M40+TTX ERK 221,56 145,41 231,67 141,44 gal(2-11)+M40+TTX (ppERK/ERK) 0,41 0,31 1,08 1,7 Normalized value 0,71 1,07 1,07 2,13 M40+TTX ppERK 65,22 39,4 234,56 205,64 M40+TTX ERK 120,33 90,33 186,67 104,56 M40+TTX (ppERK/ERK) 0,54 0,44 1,26 1,97 Normalized value 0,93 1,52 1,25 2,46

31
1-6blue 12/10
Ctrl+TTX ppERK 211,31 105,82 244,69 184,28 Ctrl+TTX ERK 241,41 151,76 246,65 233,41 Ctrl+TTX (ppERK/ERK) 0,88 0,7 0,99 0,79 Normalized value 1 1 1 1 gal(1-29) +TTX ppERK 226,62 153,39 249,38 234,27 gal(1-29) +TTX ERK 220,96 129,54 242,14 176,55 gal(1-29) +TTX (ppERK/ERK) 1,03 1,18 1,03 1,33 Normalized value 1,17 1,69 1,04 1,69 gal(2-11) +TTX ppERK 208,89 173,79 245,48 209,4 gal(2-11) +TTX ERK 211,31 96,31 233,17 121,16 gal(2-11) +TTX (ppERK/ERK) 0,99 1,8 1,05 1,73 Normalized value 1,13 2,57 1,06 2,2 gal(1-29)+M40+TTX ppERK 168,76 94,59 244,65 171,31 gal(1-29)+M40+TTX ERK 224,41 133,37 227 143,14 gal(1-29)+M40+TTX (ppERK/ERK) 0,75 0,71 1,08 1,2 Normalized value 0,86 1,02 1,09 1,52 gal(2-11)+M40+TTX ppERK 121,79 84,11 247,55 211,69 gal(2-11)+M40+TTX ERK 110,28 80,19 107,11 65,8 gal(2-11)+M40+TTX (ppERK/ERK) 1,1 1,05 2,31 3,22 Normalized value 1,25 1,5 2,33 4,09 M40+TTX ppERK 73,55 54,66 242,45 153,58 M40+TTX ERK 73,55 49,38 198,69 105,73 M40+TTX (ppERK/ERK) 1 1,11 1,22 1,45 Normalized value 1,14 1,59 1,23 1,84 1-6 12/14 DRH Ctrl ppERK 19,72 14,82 193 92,03 Ctrl ERK 224,65 122,97 219,59 140,82 Ctrl (ppERK/ERK) 0,09 0,12 0,88 0,65 Normalized value 1 1 1 1 gal(1-29) ppERK 32,38 19,31 252,69 198,87 gal(1-29) ERK 236,35 129,36 243,17 179,64 gal(1-29) (ppERK/ERK) 0,14 0,15 1,04 1,11 Normalized value 1,56 1,25 1,19 1,71 gal(2-11) ppERK 35,38 24,85 242,07 164,83 gal(2-11) ERK 189,38 139,77 241,07 188,4 gal(2-11) (ppERK/ERK) 0,19 0,18 1 0,88 Normalized value 2,11 1,5 1,14 1,36 Ctrl+TTX ppERK 13,24 12,92 150,83 65,12 Ctrl+TTX ERK 229,76 118,86 230,48 116,46 Ctrl+TTX (ppERK/ERK) 0,06 0,11 0,65 0,56 Normalized value 1 1 1 1 gal(1-29) +TTX ppERK 20,72 17,75 223,72 161,72 gal(1-29) +TTX ERK 221,07 143,93 235,55 190,07 gal(1-29) +TTX (ppERK/ERK) 0,09 0,12 0,95 0,85 Normalized value 1,5 1,09 1,46 1,52 gal(2-11) +TTX ppERK 13,86 13,03 219,62 146,42 gal(2-11) +TTX ERK 238,83 232,76 241,76 228,63 gal(2-11) +TTX (ppERK/ERK) 0,06 0,06 0,91 0,64 Normalized value 1 0,55 1,4 1,15 1-6 12/20 Ctrl ppERK 58,33 30,2 247,56 116,78 Ctrl ERK 120,89 68,07 236,78 113,48

32
Ctrl (ppERK/ERK) 0,48 0,44 1,05 1,03 Normalized value 1 1 1 1 gal(2-11) ppERK 42,33 22,53 255 219,89 gal(2-11) ERK 125,56 57,56 251,44 121,64 gal(2-11) (ppERK/ERK) 0,34 0,39 1,01 1,81 Normalized value 0,71 0,89 0,96 1,76 gal(2-11) +M40 ppERK 20,56 15,73 255 138,94 gal(2-11) +M40 ERK 132,11 65,22 187,11 88,36 gal(2-11) +M40 (ppERK/ERK) 0,16 0,24 1,36 1,57 Normalized value 0,33 0,54 1,29 1,52 Ctrl+TTX ppERK 28,67 17,89 253,56 164,59 Ctrl+TTX ERK 184,67 109,89 255 163,14 Ctrl+TTX (ppERK/ERK) 0,16 0,16 0,99 1,01 Normalized value 1 1 1 1 gal(2-11) +TTX ppERK 26 21,28 255 184,3 gal(2-11) +TTX ERK 204,33 139,15 223,67 97,44 gal(2-11) +TTX (ppERK/ERK) 0,13 0,15 1,14 1,89 Normalized value 0,81 0,94 1,15 1,87 gal(2-11)+M40+TTX ppERK 26,44 18,15 250,89 168,41 gal(2-11)+M40+TTX ERK 107,56 70 142,67 69,67 gal(2-11)+M40+TTX (ppERK/ERK) 0,25 0,26 1,76 2,42 Normalized value 1,57 1,63 1,78 2,4 1-8 12/20 Ctrl ppERK 32,78 19,56 255 122,85 Ctrl ERK 228,11 151,72 220,56 94,48 Ctrl (ppERK/ERK) 0,14 0,13 1,16 1,3 Normalized value 1 1 1 1 gal(1-29) ppERK 87,89 45,14 253,67 170,33 gal(1-29) ERK 242,89 143,3 243,11 117,67 gal(1-29) (ppERK/ERK) 0,36 0,32 1,04 1,45 Normalized value 2,57 2,46 0,89 1,12 M40 ppERK 39,11 24,37 250,67 190,58 M40 ERK 249,11 157,75 214,56 83,81 M40 (ppERK/ERK) 0,16 0,15 1,17 2,27 Normalized value 1,14 1,15 1,01 1,75 gal(1-29)+M40 ppERK 19,89 15,97 221,22 100,71 gal(1-29)+M40 ERK 243,78 99,33 244,78 98,07 gal(1-29)+M40 (ppERK/ERK) 0,08 0,16 0,9 1,03 Normalized value 0,57 1,23 0,77 0,79 Ctrl+TTX ppERK 45,22 19,03 248,33 127,39 Ctrl+TTX ERK 254 181,14 169,78 93,89 Ctrl+TTX (ppERK/ERK) 0,18 0,11 1,46 1,36 Normalized value 1 1 1 1 gal(1-29) +TTX ppERK 14,22 13,78 197,67 120,74 gal(1-29) +TTX ERK 246,22 105,64 242,22 125,72 gal(1-29) +TTX (ppERK/ERK) 0,06 0,13 0,82 0,96 Normalized value 0,33 1,18 0,56 0,71 M40+TTX ppERK 37,67 21,02 238,67 114,08 M40+TTX ERK 225,11 201,06 205,89 130,07 M40+TTX (ppERK/ERK) 0,17 0,1 1,16 0,88 Normalized value 0,95 0,91 0,79 0,65 gal(1-29)+M40+TTX ppERK 207,11 85,11 240,56 191,52 gal(1-29)+M40+TTX ERK 213,11 144,71 149,44 52,69

33
gal(1-29)+M40+TTX (ppERK/ERK) 0,97 0,59 1,61 3,63 Normalized value 5,39 5,36 1,09 2,69 1-6 01/10 Ctrl ppERK 21,11 16,22 192,96 119,62 Ctrl ERK 34,14 21,68 21,41 17,41 Ctrl (ppERK/ERK) 0,62 0,75 9,01 6,87 Normalized value 1 1 1 1 gal(2-11) 1 min. ppERK 65,31 41,53 229,14 190,49 gal(2-11) 1 min. ERK 148,72 86,22 177,51 146,73 gal(2-11) 1min. (ppERK/ERK) 0,44 0,48 1,29 1,3 Normalized value 0,71 0,64 0,14 0,2 gal(2-11) 5 min. ppERK 87,55 57,89 235,83 203,68 gal(2-11) 5 min. ERK 104,48 61,26 206,04 92,64 gal(2-11) 5min. (ppERK/ERK) 0,84 0,94 1,14 2,2 Normalized value 1,35 1,25 0,13 0,33 gal(2-11) 10 min. ppERK 178,96 107,28 246,24 206,94 gal(2-11) 10 min. ERK 147,41 89,39 159,65 74,32 gal(2-11) 10min. (ppERK/ERK) 1,21 1,2 1,54 2,78 Normalized value 1,95 1,6 0,17 0,42 gal(2-11) 15 min. ppERK 114,55 66,83 223,14 200,58 gal(2-11) 15 min. ERK 193,89 107,05 240,76 149,82 gal(2-11) 15min. (ppERK/ERK) 0,59 0,62 0,93 1,34 Normalized value 0,95 0,82 0,1 0,2 gal(2-11) 30 min. ppERK 103,11 56,05 179,11 147,84 gal(2-11) 30 min. ERK 135,41 74,34 153,45 65,58 gal(2-11) 30 min. (ppERK/ERK) 0,76 0,75 1,17 2,25 Normalized value 1,22 1 0,13 0,34
Table 6. Raw data from all western blots and calculated ratio between phospho Erk and total Erk. The ratios has been normalized to be able to compare the different blots with each other, letting control ratio always be 1.