galactic bulge population ii cepheids in the vvv survey. we present a combined ogle iii and vvv...
TRANSCRIPT

arX
iv:1
707.
0375
5v1
[as
tro-
ph.S
R]
12
Jul 2
017
Astronomy & Astrophysics manuscript no. popII_cep c©ESO 2017July 13, 2017
Galactic Bulge Population II Cepheids in the VVV Survey:
Period-Luminosity Relations and a Distance to the Galactic Center
A. Bhardwaj1, 2, M. Rejkuba1, 3, D. Minniti4, 5, 6, F. Surot1, E. Valenti1, M. Zoccali7, 5, O. A. Gonzalez8,
M. Romaniello1, 3, S. M. Kanbur9, and H. P. Singh2
1 European Southern Observatory, Karl-Schwarzschild-Straße 2, 85748, Garching, Germanye-mail: [email protected]; [email protected]
2 Department of Physics and Astrophysics, University of Delhi, Delhi-110007, India3 Excellence Cluster Universe, Boltzmann-Str. 2, D85748 Garching bei Munchen, Germany4 Departamento de Física, Facultad de Ciencias Exactas, Universidad Andrés Bello Av. Fernandez Concha 700, Las Condes, Santi-
ago, Chile5 Instituto Milenio de Astrofisica, Santiago, Chile.6 Vatican Observatory, V00120 Vatican City State, Italy.7 Pontificia Universidad Católica de Chile, Instituto de Astrofísica, Av. Vicuña Mackenna 4860, Santiago, Chile8 UK Astronomy Technology Centre, Royal Observatory, Blackford Hill, Edinburgh EH9 3HJ, UK9 State University of New York, Oswego, NY 13126, USA
Received xxxx; accepted xxxx
ABSTRACT
Context. Multiple stellar populations of different ages and metallicities reside in the Galactic bulge tracing its structure and providingclues for its formation and evolution.Aims. We present the near-infrared observations of population II Cepheids in the Galactic bulge from VVV survey. The JHKs
photometry together with optical data from OGLE survey provide an independent estimate of the distance to the Galactic center. Theold, metal-poor and low-mass population II Cepheids are also investigated as useful tracers for the structure of the Galactic bulge.Methods. We identify 340 population II Cepheids in the VVV survey Galactic bulge catalogue based on their match with OGLE-IIICatalogue. The single-epoch JH and multi-epoch Ks observations complement the accurate periods and optical (VI) mean-magnitudesfrom OGLE. The sample consisting of BL Herculis and W Virginis subtypes is used to derive period-luminosity relations after correct-ing mean-magnitudes for the extinction. Our Ks-band period-luminosity relation, Ks = −2.189(0.056) [log(P) − 1] + 11.187(0.032),is consistent with published work for BL Herculis and W Virginis variables in the Large Magellanic Cloud.Results. We present a combined OGLE III and VVV catalogue with periods, classification, mean magnitudes and extinction for264 Galactic bulge population II Cepheids having good-quality Ks-band light curves. The absolute magnitudes for population IICepheids and RR Lyraes calibrated using Gaia and Hubble Space Telescope parallaxes, together with calibrated magnitudes for LargeMagellanic Cloud population II Cepheids, are used to obtain a distance to the Galactic center, R0 = 8.34 ± 0.03(stat.) ± 0.41(syst.),which changes by +0.05
−0.25with different extinction laws. While noting the limitation of small number statistics, we find that the present
sample of population II Cepheids in the Galactic bulge shows a nearly spheroidal spatial distribution, similar to metal-poor RR Lyraevariables. We do not find evidence of the inclined bar as traced by the metal-rich red-clump stars.Conclusions. Population II Cepheid and RR Lyrae variables follow similar period-luminosity relations and trace the same metal-poorold population in the Galactic bulge. The number density for population II Cepheids is more limited as compared to abundant RRLyraes but they are bright and exhibit a wide range in period that provides a robust period-luminosity relation for an accurate estimateof the distance to the Galactic center.
Key words. Stars: variables: Cepheids, Galaxy: bulge, Galaxy: structure, galaxies: Magellanic Clouds, Cosmology: Distance scale
1. Introduction
Population II Cepheids are low-mass, metal-poor stars that arefound in globular clusters, Galactic disk and bulge populations(Wallerstein 2002; Sandage & Tammann 2006). These Type IICepheid (T2C) variables are more than a magnitude fainterthan Classical or Type I Cepheids with similar periods and fol-low a shallower Period-Luminosity relation (PLR or “LeavittLaw”, Leavitt & Pickering 1912). T2Cs reside in the instabil-ity strip just above (brighter) RR Lyrae (RRL) variables andare subdivided into three subclasses, BL Herculis (BLH), WVirginis (WVR) and RV Tauris (RVT). These subclasses repre-sent different evolutionary states with short-period BLH mov-
ing from blue horizontal branch to asymptotic giant branch(AGB), intermediate period WVR stars undergo helium shellflashes and make temporary excursions from the AGB intothe instability strip, while long period RVT suggest post-AGBevolution (Wallerstein 2002). The characteristic light curvesfor the subclasses of T2Cs are different and the PLRs exhibita greater dispersion and non-linearity at optical wavelengths(Nemec et al. 1994; Alcock et al. 1998; Kubiak & Udalski 2003;Majaess et al. 2009; Schmidt et al. 2009, and references within),thus, limiting their use as primary distance indicators. At near-infrared (NIR) wavelengths, T2Cs and RRLs follow similarPLRs (Sollima et al. 2006; Matsunaga et al. 2006; Ripepi et al.2015; Bhardwaj et al. 2017) and T2Cs being relatively bright
Article number, page 1 of 9

A&A proofs: manuscript no. popII_cep
variables, can be used to obtain robust distances. These variablesprovide an independent method to determine the distance to theGalactic center and to trace the structure of the old stellar pop-ulation in the Galactic bulge. For example, Groenewegen et al.(2008) estimated a T2C and RRL based distance to the Galacticcenter, R0 = 7.94 ± 0.37 kpc.
The optical light curves of T2Cs in the Galactic bulge andthe Magellanic Clouds (MC) are provided by the third phase ofthe Optical Gravitational Lensing Experiment (OGLE-III) sur-vey (Soszynski et al. 2008, 2010, 2011). The NIR studies ofthese variables in the MC were carried out by Matsunaga et al.(2009, 2011), Ciechanowska et al. (2010), Ripepi et al. (2015)and Bhardwaj et al. (2017). T2Cs in the Galactic globular clus-ters at JHKs wavelengths were observed by Matsunaga et al.(2006). These authors discussed the T2C PLRs and their distancescale applications at NIR wavelengths. The time-series NIR ob-servations for T2Cs in the Galactic bulge have been limited to asample of 39 Cepheids observed by Groenewegen et al. (2008).
The VISTA Variables in the Vía Láctea (VVV) survey(Minniti et al. 2010) has provided a large amount of variablestar data to probe the 3-D structure of the Galactic bulge(Wegg & Gerhard 2013; Gonzalez et al. 2013; Valenti et al.2016; Zoccali & Valenti 2016, and reference therein). Thanks tohigh-resolution spectroscopic investigations of a sizeable sampleof bulge giants (Zoccali et al. 2008; Hill et al. 2011; Ness et al.2013; Rojas-Arriagada et al. 2014; Gonzalez et al. 2015a, andreferences therein) it is now widely accepted that the bulgemetallicity distribution is broad (i.e. −1 ≤ [Fe/H] ≤ +0.5 dex),bimodal, and with two peaks few dex below and above the so-lar value. The observed metallicity gradient as a function ofthe height from the Galactic plane is due to the change of therelative fraction of the metal-rich and metal-poor componentsalong the line-of-sight. On the other hands, the vast major-ity of the photometric studies aimed at dating the bulge stars(Ortolani et al. 1995; Kuijken & Rich 2002; Zoccali et al. 2003;Sahu et al. 2006; Clarkson et al. 2008, 2011; Valenti et al. 2013)revealed predominantly old stellar population. However, ac-cording to spectroscopic microlensing follow-up (Bensby et al.2017, and references therein) a smaller but significant frac-tion of young and intermediate age population may also bepresent. The old metal-poor tracers of the bulge show an axisym-metric and spheroidal distribution (RRLs, Miras, Red-clumpgiants, Dékány et al. 2013; Catchpole et al. 2016; Gran et al.2016; Zoccali et al. 2017), or a triaxial ellipsoidal distribution(RRLs, Pietrukowicz et al. 2015). The metal-rich red-clump gi-ants trace the X-shaped bar in the bulge (McWilliam & Zoccali2010; Nataf et al. 2010; Saito et al. 2011; Gonzalez et al. 2015b;Zoccali et al. 2017).
Recently, Minniti et al. (2016) discovered a dozenfundamental-mode RRL variables in the vicinity of theGalactic Center. T2Cs are less abundant but brighter than RRLand therefore, are easy to find in highly extincted regions in thebulge. A search for new T2Cs in the whole VVV bulge areawill be presented elsewhere. For the present analysis, we use thesample that has optical counterparts in the OGLE catalog.
The paper is structured as follows: We discuss photometry ofT2Cs from VVV survey in Section 2. We derive PLRs at JHKs
wavelengths and compare our results with published work in §3.We determine a distance to the Galactic center using calibratedabsolute magnitudes for T2Cs in §4. In Section 5, we discuss thespatial distribution of T2Cs in the Galactic bulge and compareour results with RRLs and red-clump stars. We summarize ourresults in Section 6.
Fig. 1. Top panel : The spatial distribution and the E(J−Ks) color excessfor Type II Cepheids in the VVV survey. Bottom panel : Histogram ofthe E(J − Ks) color excess. Using reddening law of Nishiyama et al.(2009), the extinction in Ks-band amounts to, AKs = 0.528E(J − Ks).
2. The Data
We present near-infrared photometry of T2Cs from VVV sur-vey (Minniti et al. 2010; Saito et al. 2012) latest DR4 catalog(Hempel et. al, in prep.). We perform a cross-match of positionsfor OGLE-III bulge T2C sample to this catalog within 1′′ searchradius to identify 340 Cepheids. The median separation betweenOGLE and VVV sources is 0.08′′ with a standard deviation of0.15′′ and more than 95% of the matched sources have a separa-tion of . 0.5′′. We adopt the classification based on I-band lightcurves from OGLE-III and there are 147 BLH, 123 WVR and 70RVT type variables with JHKs observations.
The VVV JH-band magnitudes are single epoch observa-tions while the Ks-band has multi-epoch data. The number ofobservations in Ks varies from ∼ 10 to ∼ 100 depending onthe location and brightness of the T2C, and on average thereare ∼ 50 epochs per light curve. The typical apparent magni-tudes for T2Cs in Ks ranges from ∼ 15 to ∼ 10 mag. The period(P), time of maximum brightness in I-band and the optical (VI)mean-magnitudes for the matched T2Cs are taken from OGLE-III catalog (Soszynski et al. 2011). The E(J − Ks) color excessfor T2Cs in the bulge is obtained using the extinction maps ofGonzalez et al. (2011b, 2012). Fig. 1 displays the spatial distri-bution and E(J − Ks) color excess for all 340 T2Cs and the his-togram of color excess is shown in the bottom panel.
In order to select the best-quality light curves, we only con-sidered stars with a minimum of 20 Ks measurements. We use
Article number, page 2 of 9

A. Bhardwaj et al.: Type II Cepheids in the Galactic Bulge
Table 1. Properties of Type II Cepheids in the Galactic bulge.
VVV ID OGLE ID P Class Mean magnitudes σ EJKs
(days) V I J H KS J H KS
515601356315 OGLE-002 2.268 BLH 15.188 13.909 13.116 12.766 12.521 0.072 0.072 0.072 0.173515601679485 OGLE-003 1.484 BLH 16.519 15.061 14.240 13.855 13.387 0.104 0.104 0.104 0.290515594023082 OGLE-005 2.008 BLH 18.666 16.842 15.845 15.354 14.788 0.152 0.153 0.150 0.388515520862858 OGLE-008 1.183 BLH 17.765 15.970 — 14.205 13.935 — 0.060 0.058 0.410515555436341 OGLE-009 1.896 BLH 17.630 15.608 13.887 13.343 13.134 0.098 0.098 0.098 0.461515534145302 OGLE-013 1.517 BLH 18.525 16.193 14.550 13.951 13.676 0.117 0.117 0.116 0.588515543870338 OGLE-014 1.239 BLH 15.376 13.590 12.306 11.905 11.613 0.003 0.004 0.092 0.534515490128302 OGLE-015 1.279 BLH 18.087 15.907 14.291 13.712 13.438 0.008 0.010 0.111 0.591515522173203 OGLE-017 1.098 BLH 18.533 16.251 14.371 13.850 13.669 0.091 0.092 0.090 0.636515490198825 OGLE-018 1.620 BLH 18.072 15.990 14.187 13.630 13.339 0.113 0.113 0.113 0.580
Notes: The OGLE ID, period, subtype and optical mean magnitudes are taken from OGLE-III (Soszynski et al. 2011). EJKs : E(J − Ks) values
are taken from extinction maps of Gonzalez et al. (2011b). The first ten lines of the table are shown here and the entire table is available online as
supplemental material.
0 1 2phase
11.5
11.0
10.5
Ks
OGLE-342 P = 31.1d
0 1 2phase
12.20
12.30
12.40
Ks
OGLE-105 P = 7.77d0 1 2phase
13.6
13.8
14.0
Ks
OGLE-075 P = 1.39d
Fig. 2. The representative light curves in Ks-band for Type IICepheids in the VVV survey. Top/middle/bottom panels display theBLH/WVR/RVT type variables. The solid red line is the Fourier fit tothe light curve. Star IDs and periods are provided at the top of eachpanel.
periods and time of maximum brightness from OGLE to phasethese light curves and apply a fifth order Fourier-series fit (see,Bhardwaj et al. 2015) to determine the peak-to-peak amplitudes(A) and the standard deviation (σ) of the fit. We limit our finalsample to the light curves for which, σ/A < 1/20. This pro-vides an estimate of the impact that photometric uncertaintieshave on the shape of the light-curves. Finally, we also remove4 noisy light curves with very low-amplitudes (A < 0.08 mag).Following these selection criteria, we are left with a final sam-ple of 264 T2Cs. Fig. 2 displays the representative light curves of
BLH, WVR and RVT stars from our final sample of good-qualitylight-curves.
The saturation limit for Ks-band in VVV survey is ∼ 11 mag(see, Figure 2 in Gonzalez et al. 2011b) and the deviation from2MASS occurs around 12 mag in JH. While the higher extinc-tion in the bulge can make these sources fainter, some of thelong-period T2Cs may indeed be affected by non-linearity andsaturation. We note that most of the rejected light-curves belongto long-period bright RVT stars and therefore, this subclass willnot be used for P-L relations and distance estimates.
3. Period-Luminosity relations for Type II Cepheids
in the Bulge
The mean-magnitudes in Ks-band are estimated from the multi-epoch VVV data by fitting templates from Bhardwaj et al.(2017) for T2Cs. For each single-epoch JH measurement, weestimate the phase using the time of maximum brightness in I-band from OGLE survey. We use IKs-band templates and ap-ply phase correction to J and H-band magnitudes to derive theirmean values. The mean properties of T2Cs in our final samplefrom OGLE and VVV are listed in Table 1.
Several studies addressed the reddening law towardsthe Galactic center (e.g. Nishiyama et al. 2006, 2009;Gonzalez et al. 2012; Nataf et al. 2016; Majaess et al. 2016) andits impact on the distance estimates will be discussed in the nextsection. For now, we adopt the Nishiyama et al. (2009) redden-ing law and total-to-selective absorption ratios, RJ = 1.526,RH = 0.855 and RK = 0.528 corresponding to E(J − Ks), toapply extinction corrections. The E(J − Ks) value is greater than1 for only 11 Cepheids in our sample. We also include reddeningindependent optical Wesenheit, WV,I = I − RV
I(V − I), where the
absorption-ratio, RVI= 1.08, is adopted from Soszynski et al.
(2011). The value of RVI
changes significantly depending onthe choice of reddening law but we follow OGLE relation fora relative comparison under the assumption that it exhibits theleast scatter in the optical Wesenheit. We assume that all T2Csare at the same distance and fit a PLR in the following form:
m0λ = aλ[log(P) − 1] + bλ, (1)
where m0λ
is the extinction-corrected mean-magnitude fromVVV survey and λ represents the JHKs wavelengths. The co-efficient a is the slope and b is the zeropoint at P = 10 d. We
Article number, page 3 of 9

A&A proofs: manuscript no. popII_cep
Fig. 3. Extinction-corrected near-infrared PLRs for Type II Cepheids inthe Galactic bulge. The violet and red symbols represent BLH and WVRstars, respectively. The dashed line represents a single regression line fitover colored symbols and small symbols represent the Type II Cepheidsdisplaying evidence of approaching saturation in the long period rangeand 2σ outliers in the short-period range. H-band data for WVR starsare also close to saturation limit and therefore we do not include themin linear regression fit.
fit this equation to the BLH and WVR classes separately andalso to the combined sample of BLH+WVR and iteratively re-move 2σ outliers in all cases. The adopted threshold providesa stronger constraint on the slopes and zeropoints of the PLRs
Table 2. Galactic bulge Type II Cepheid PLRs.
Band Type Slope Intercept σ N
WV,I B+W -2.294±0.055 11.511±0.030 0.342 212J BLH -2.387±0.164 11.393±0.132 0.347 106J WVI -2.037±0.096 11.476±0.012 0.242 93J B+W -2.240±0.031 11.495±0.009 0.316 203H BLH -2.591±0.163 11.019±0.130 0.353 104Ks BLH -2.362±0.170 11.071±0.133 0.294 108Ks WVI -2.373±0.272 11.194±0.034 0.194 95Ks B+W -2.189±0.056 11.187±0.032 0.234 201
Notes: B+W : BL Herculis and W Virginis.
Fig. 4. Calibrated PLRs for Type II Cepheids in the LMC, Galactic glob-ular clusters (GGC) and the Milky Way (solar neighbourhood). The redand green circles represent absolute magnitudes for T2Cs and RRLswith parallaxes in the Milky Way and dashed red line is the best-fit lin-ear regression. Plus symbols display PLR for VVV T2Cs with a zero-point offset with respect to calibrated magnitudes. The error bars repre-sent 1σ dispersion in the P-L relation in each galaxy. Grey dots displayabsolute magnitudes for RRLs in the LMC and globular clusters.
and will be followed throughout the paper. We note that a highersigma-clipping does not change the PLRs significantly and thenumber of stars and the dispersion increases marginally. Fig. 3displays the PLRs for T2Cs in the Galactic bulge. We observe aflattening of the H-band PLR for WVR variables. After lookingat several H-band images, we find that these stars show evidenceof approaching saturation. Therefore, we will use only BLH typevariables in the H-band for the present analysis. The slopes andintercepts of PLRs are listed in Table 2. The dispersion in PLRis presumably dominated by the depth of the bulge with possi-ble contribution due to the inner Galactic bar (Nishiyama et al.2005; Gonzalez et al. 2011a).
3.1. Comparison with published PLRs
We compare the Galactic bulge PLRs for T2Cs with publishedwork in the Galactic globular clusters, the bulge and the LMCfrom Matsunaga et al. (2006), Groenewegen et al. (2008) andBhardwaj et al. (2017). We note that Bhardwaj et al. (2017) de-rived new PLRs for T2Cs in the LMC and found the slopes andintercepts to be consistent with previous results. Therefore, weonly consider PLRs in the LMC from Bhardwaj et al. (2017).We also compare the optical Wesenheit in the bulge with LMC,where total-to-selective absorption ratio, RV
I= 1.55, is taken
from Soszynski et al. (2010) for LMC T2Cs. We note that opti-cal Wesenheits for T2Cs in the LMC and bulge are adopted onlyfor a relative comparison and these relations will not be usedfor distance estimates. We will use standard t-test to comparethe PLRs, given the uncertainties in the slopes and the rms ofthe relation under consideration. The details of the test-statisticsis discussed in Bhardwaj et al. (2016). In brief, the null hypoth-esis i.e. the two slopes are equal, is rejected if the probabilityp(t)<0.05.
The results of t-test statistics are listed in Table 3. We findthat the WV,I Wesenheits and Ks-band PLRs in the Galactic bulgeand the LMC are consistent, if we consider only BLH+WVRvariables. The slope of the Ks-band PLR is consistent with theresult of Groenewegen et al. (2008) for the bulge, while there is
Article number, page 4 of 9

A. Bhardwaj et al.: Type II Cepheids in the Galactic Bulge
Table 3. Comparison of Galactic bulge Type II Cepheids with PLRs from literature.
Band Slope σ N Host Type Source |T| p(t)WV,I -2.294±0.055 0.342 212 GB B+W TW — —
-2.677±0.052 0.176 186 LMC all TW 4.265 0.000-2.508±0.074 0.111 133 LMC B+W TW 1.171 0.242
Ks -2.189±0.056 0.234 201 GB B+W TW — —-2.240±0.140 0.410 39 GB all G08 0.462 0.644-2.395±0.027 0.228 167 LMC all B17 3.621 0.000-2.232±0.037 0.180 119 LMC B+W B17 0.648 0.517-2.413±0.053 0.150 43 GGC all M06 2.309 0.022-2.425±0.295 0.075 9 MW alla B17 0.243 0.808
Notes: B+W : BL Herculis and W Virginis; a represents absolute calibration of PLRs based on parallaxes for T2Cs and RRLs. Source column
represents - TW : This work; G08 : Groenewegen et al. (2008); B17 : Bhardwaj et al. (2017); M06 : Matsunaga et al. (2006) PLR with updated
mean-magnitudes from Bhardwaj et al. (2017). Last two columns represent the observed value of the t-statistic (|T|) and the probability, p(t), of
acceptance of the null hypothesis.
a marginal but statistically significant difference in slopes withGalactic globular clusters. We also compare the Ks-band PLRswith the calibrated PLRs for T2Cs and RRLs using Gaia andHST parallaxes from Bhardwaj et al. (2017). The PLRs are con-sistent, given the large uncertainties in the slope of the calibratedPLR.
Fig. 4 displays the calibrated PLRs in the LMC (violet),Galactic globular clusters (blue) and the MW (red). We adoptthe late-type eclipsing binary distance of 18.493 ± 0.047 mag(Pietrzynski et al. 2013) to calibrate LMC PLR. The two T2Csand five RRLs in the solar neighbourhood are calibrated withavailable trigonometric parallaxes from Gaia and HST (see,Bhardwaj et al. 2017). We also include two T2Cs with pulsa-tion parallaxes from Feast et al. (2008). We note that the en-tire period-range Ks-band PLRs in the LMC, Galactic globu-lar cluster and in the MW have nearly the same slopes andzero-points. This provides an additional evidence that Ks-bandPLRs are less sensitive to the metallicity and extinction and canbe used to obtain accurate distance estimates. The Ks mean-magnitudes for RRLs are also included to extend the PLRs fol-lowed by T2Cs (see, grey symbols in Fig. 4). The near-infraredphotometry of RRLs in the LMC is taken from Borissova et al.(2009); Muraveva et al. (2015), while the globular clusters RRLsdata is adopted from M92 and M4 (Del Principe et al. 2005;Stetson et al. 2014). This further confirms the consistency be-tween the distance scale for T2Cs and RRLs as discussedin previous papers (Sollima et al. 2006; Matsunaga et al. 2006;Ripepi et al. 2015; Bhardwaj et al. 2017).
4. Distance to the Galactic Center
We use Ks-band mean-magnitudes for T2Cs in the Galacticbulge to determine a distance to the Galactic center using theabsolute calibration of PLR for T2Cs and RRLs in the MW andin the LMC. We only use short period BLH and WVR stars andapply separate calibrations based on MW and LMC T2C PLRsto the bulge data to obtain two sets of individual distances. Wetake an average of the two distances for each BLH+WVR typevariables in Ks-band. Fig. 5 displays the histogram of individualdistance estimates for BLH+WVR and RRLs variables. We in-clude OGLE-IV counterparts of the RRLs from VVV survey inour analysis for a relative comparison. The RRLs sample con-sists of more than 20 thousand variables with high-quality lightcurves and their photometry will be discussed in a future publi-cation.
4 6 8 10 12 14R0 (kpc)
0
1
2
N
RRL R0 = 8.25
σ = 1.13
bin = 0.2
4 6 8 10 12 14R0 (kpc)
0
1
2
N
T2C R0 = 8.36
σ = 0.80
bin = 0.2
Fig. 5. Top panel : Histogram of the projected distances of BLH+WVRT2Cs. The blue/magenta bars represent the distance distribution beforeand after the geometric corrections. Bottom panel : Same as top panelbut for RRLs in the VVV survey.
To determine the distance to the center of the population,we need to apply two geometric corrections. First, the individ-ual distances are projected onto the Galactic plane. This is doneby taking cosine of the Galactic latitude, resulting in a distanceof Rcosb. Secondly, we need to correct the distance distributionfor the “cone-effect” which leads to bias in distance estimatesas more objects are observed at larger distances in a solid angle.This is corrected by scaling the distance distribution by R−2. The
Article number, page 5 of 9

A&A proofs: manuscript no. popII_cep
-3.5-3.4Zero-point
-2.2
-2.3
Slo
pe
BLH
-3.5-3.4Zero-point
-2.0
-2.3
-2.6
WVI
8.25 8.30 8.35 8.40 8.45R0 (kpc)
0
0.5
1.0
N (
no
rmal
ised
co
un
t) R0 = 8.335
σ = 0.030
N2009
-3.5-3.4-2.2
-2.3
Slo
pe
BLH
-3.5-3.4-2.0
-2.3
-2.6
WVI
8.30 8.35 8.40 8.45 8.50
0
0.5
1.0
N (
no
rmal
ised
co
un
t) R0 = 8.391
σ = 0.029
N2006
-3.5-3.4-2.2
-2.3
Slo
pe
BLH
-3.5-3.4-2.0
-2.3
-2.6
WVI
8.00 8.05 8.10 8.15 8.20
0
0.5
1.0
N (
no
rmal
ised
co
un
t) R0 = 8.099
σ = 0.031
CCM89
Fig. 6. Result of 104 random realizations of parameters of the global fit to Type II (BLH+WVR) Cepheids in the globular clusters, LMC and theGalactic bulge. Left and middle panels: Slope and the zero point of global fit, Right panels: distance estimates from 104 permutations. CCM89 :Cardelli et al. (1989); N2006 : Nishiyama et al. (2006); N2009 : Nishiyama et al. (2009).
two histogram bars in Fig. 5 represent the distances before (blue)and after (magenta) these corrections. In our sample the correc-tion is marginal (∼ 0.5%) in terms of the change in the peak ofthe distance distribution. We note that both T2Cs and RRLs pro-vide similar estimates for the distance to the Galactic center. TheRRLs distance distribution is based on empirical calibration ofT2C PLR and does not include any metallicity corrections.
In order to obtain a robust distance estimate, we use Ks-bandmean-magnitudes for the T2Cs and apply a simultaneous fit to allBLH+WVR stars in the Galactic bulge, LMC, Galactic globularclusters and T2Cs in the solar neighbourhood. We fit a PLR inthe following form -
m0i j = aS [log(Pi j) − 1] + aL[log(Pi j) − 1] + MKs
+ µ j, (2)
where m0i j
is the extinction-corrected magnitude for a ith T2C in
the jth system. The coefficients aS and aL represent the slopesof BLH and WVR stars and MKs
is the absolute magnitude inKs-band for a T2C with P = 10 days. The distance modulus tothe Galactic bulge is given by µ j. The matrix equation is solvedusing the chi-square minimization (Bhardwaj et al. 2016).
Nishiyama et al. (2009); Matsunaga et al. (2016, and ref-erences therein) showed that the selection of reddening lawleads to significant difference in distance estimates close to theGalactic center. Therefore, we use three different extinction-
laws,AKs
E(J−Ks )= 0.689 (Cardelli et al. 1989),
AKs
E(J−Ks )= 0.494
(Nishiyama et al. 2006) andAKs
E(J−Ks )= 0.528 (Nishiyama et al.
2009), in our analysis.
We carry out Monte-Carlo simulations to create 104 random-realizations of the global fit. We estimate the coefficients of theglobal fit for each permutation and fit a Gaussian function to
Article number, page 6 of 9
A. Bhardwaj et al.: Type II Cepheids in the Galactic Bulge
4 6 8 10 12 14
-2
-1
0
1
2 T2C
4 6 8 10 12 14
-2
-1
0
1
2 RRL
4 6 8 10 12 14
-2
-1
0
1
2
4 6 8 10 12 14
-2
-1
0
1
2
-2 > b > -4
X [Distance from the Sun in kpc]
Y [
kpc]
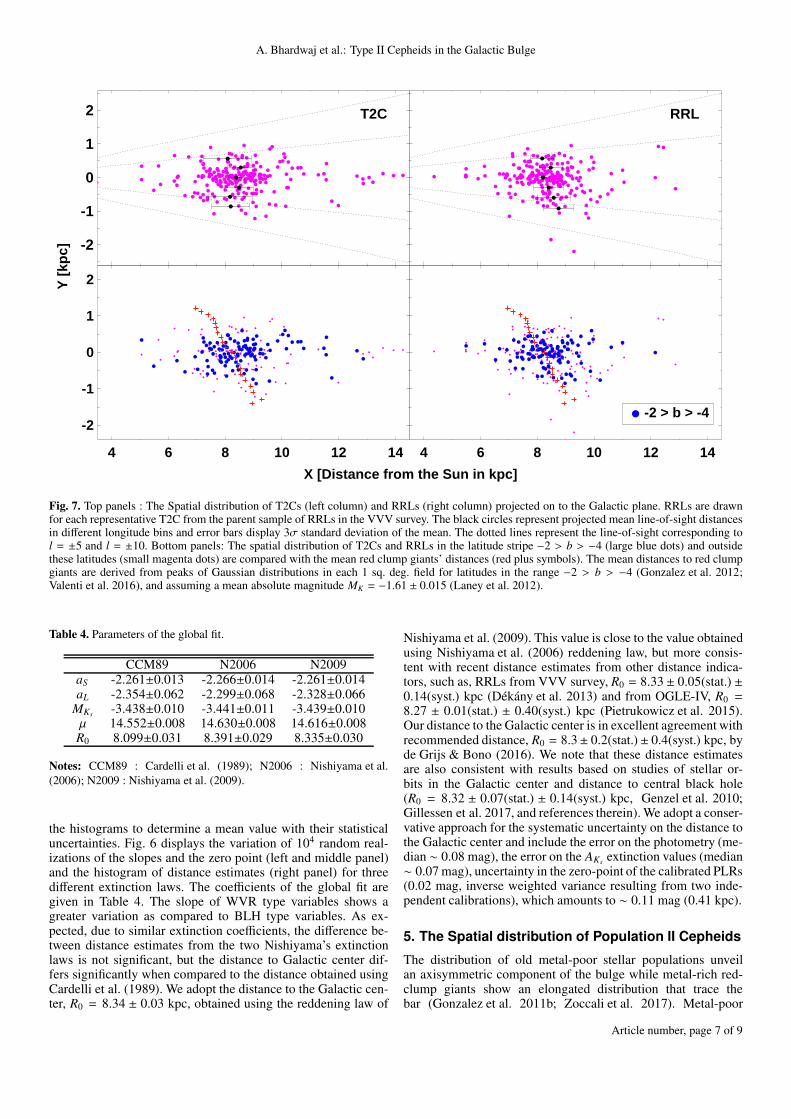
Fig. 7. Top panels : The Spatial distribution of T2Cs (left column) and RRLs (right column) projected on to the Galactic plane. RRLs are drawnfor each representative T2C from the parent sample of RRLs in the VVV survey. The black circles represent projected mean line-of-sight distancesin different longitude bins and error bars display 3σ standard deviation of the mean. The dotted lines represent the line-of-sight corresponding tol = ±5 and l = ±10. Bottom panels: The spatial distribution of T2Cs and RRLs in the latitude stripe −2 > b > −4 (large blue dots) and outsidethese latitudes (small magenta dots) are compared with the mean red clump giants’ distances (red plus symbols). The mean distances to red clumpgiants are derived from peaks of Gaussian distributions in each 1 sq. deg. field for latitudes in the range −2 > b > −4 (Gonzalez et al. 2012;Valenti et al. 2016), and assuming a mean absolute magnitude MK = −1.61 ± 0.015 (Laney et al. 2012).
Table 4. Parameters of the global fit.
CCM89 N2006 N2009aS -2.261±0.013 -2.266±0.014 -2.261±0.014aL -2.354±0.062 -2.299±0.068 -2.328±0.066
MKs-3.438±0.010 -3.441±0.011 -3.439±0.010
µ 14.552±0.008 14.630±0.008 14.616±0.008R0 8.099±0.031 8.391±0.029 8.335±0.030
Notes: CCM89 : Cardelli et al. (1989); N2006 : Nishiyama et al.
(2006); N2009 : Nishiyama et al. (2009).
the histograms to determine a mean value with their statisticaluncertainties. Fig. 6 displays the variation of 104 random real-izations of the slopes and the zero point (left and middle panel)and the histogram of distance estimates (right panel) for threedifferent extinction laws. The coefficients of the global fit aregiven in Table 4. The slope of WVR type variables shows agreater variation as compared to BLH type variables. As ex-pected, due to similar extinction coefficients, the difference be-tween distance estimates from the two Nishiyama’s extinctionlaws is not significant, but the distance to Galactic center dif-fers significantly when compared to the distance obtained usingCardelli et al. (1989). We adopt the distance to the Galactic cen-ter, R0 = 8.34 ± 0.03 kpc, obtained using the reddening law of
Nishiyama et al. (2009). This value is close to the value obtainedusing Nishiyama et al. (2006) reddening law, but more consis-tent with recent distance estimates from other distance indica-tors, such as, RRLs from VVV survey, R0 = 8.33 ± 0.05(stat.) ±0.14(syst.) kpc (Dékány et al. 2013) and from OGLE-IV, R0 =
8.27 ± 0.01(stat.) ± 0.40(syst.) kpc (Pietrukowicz et al. 2015).Our distance to the Galactic center is in excellent agreement withrecommended distance, R0 = 8.3± 0.2(stat.)± 0.4(syst.) kpc, byde Grijs & Bono (2016). We note that these distance estimatesare also consistent with results based on studies of stellar or-bits in the Galactic center and distance to central black hole(R0 = 8.32 ± 0.07(stat.) ± 0.14(syst.) kpc, Genzel et al. 2010;Gillessen et al. 2017, and references therein). We adopt a conser-vative approach for the systematic uncertainty on the distance tothe Galactic center and include the error on the photometry (me-dian ∼ 0.08 mag), the error on the AKs
extinction values (median∼ 0.07 mag), uncertainty in the zero-point of the calibrated PLRs(0.02 mag, inverse weighted variance resulting from two inde-pendent calibrations), which amounts to ∼ 0.11 mag (0.41 kpc).
5. The Spatial distribution of Population II Cepheids
The distribution of old metal-poor stellar populations unveilan axisymmetric component of the bulge while metal-rich red-clump giants show an elongated distribution that trace thebar (Gonzalez et al. 2011b; Zoccali et al. 2017). Metal-poor
Article number, page 7 of 9

A&A proofs: manuscript no. popII_cep
RRLs, Miras and red-clump giants display an axisymmet-ric and spheroidal structure of the bulge (Dékány et al. 2013;Catchpole et al. 2016; Zoccali et al. 2017). RRLs also show atriaxial ellipsoid shape with OGLE-IV data (Pietrukowicz et al.2015). We look at the spatial distribution of T2Cs projected on tothe Galactic plane. We also select a representative RRL within1′ radius of each T2C position from the distribution of RRLsshown in Fig. 5 and adopt a median distance.
The top panels of Fig. 7 displays the spatial distributionof T2Cs, projected onto the Galactic plane. The T2Cs sampleshows a homogeneous distribution with majority of distance es-timates falling within 6-10 kpc. The corresponding RRL distri-bution is more spherically symmetric. The T2Cs distance dis-tribution shows more stars at longer distances as compared toRRLs subsample which is slightly elongated towards us. We alsooverplot mean line-of-sight distances in different longitude binsfor T2Cs and RRLs. Neither population provides evidence of aninclined bar or X-shaped structure as traced by the metal-richred-clump giants. We note that majority of T2Cs in the currentsample are located along b = −2 to b = −4 and their spatial dis-tribution is shown in bottom panel. The distribution along theselatitudes confirms no-barred distribution with current T2C andRRL samples in the bulge.
We also performed two-sided KS-test to compare the dis-tance distributions of T2Cs and RRLs from VVV survey. Wefind that both these populations have similar radial distributionsin most spatial bins. However, the number density of T2Cs isvery limited at present and the results of test-statistics are heavilyinfluenced by small number statistics and the choice of bin-size.In near-future, with more data from OGLE-IV and VVV, T2Cscan become additional important tracers of the bulge metal-poorold populations, probing its structure and formation.
We recall that our T2C and RRL distance estimates are basedon Ks-band mean-magnitudes from VVV survey. We do not useWesenheit relations to get the distance estimates as the time-series observations are available only in Ks-band. Furthermore,given that Ks-band PLR has least dispersion (see Fig. 4 and Ta-ble 2 & 3), we deem it is better to apply extinction correctionto Ks-band PLR adopting external reddening values than con-structing a Wesenheit with random-phase corrected JH magni-tudes. The extinction correction is applied using Nishiyama et al.(2009) reddening law and E(J−Ks) color excess values from theextinction maps of Gonzalez et al. (2011b, 2012), which are de-rived by comparing the mean E(J−Ks) color of red clump giantsin small subfields of 2′×2′ to 6′×6′ with the color of red clumpsin Baade’s window (see, Gonzalez et al. 2012, for details). Thecolor excess for each T2C and RRL is obtained by inserting theirlongitude/latitude to Bulge Extinction And Metallicity Calcula-tor (BEAM)1 and adopting a resolution of 2′.
Given that the 2-D BEAM extinction map assumes all ex-tinction is at the location of the tracer (red clumps, which aremostly located in the bulge/bar), while our targets are locatedalong the line-of-sight at different distances with respect to thebar, we compare the BEAM E(J − Ks) values with E(J − Ks)from 3-D extinction map of Schultheis et al. (2014). The 3-D ex-tinction maps are based on the VVV data and temperature-colorrelation for M giants and the distance-colour relations. The stel-lar population synthesis models were used to offset observed andintrinsic colors and obtain extinction maps with two spatial andone distance dimension.
We compare the distance estimates for each T2C and RRL ata given longitude and latitude and obtain E(J − Ks) color excess
1 http://mill.astro.puc.cl/BEAM/calculator.php
Fig. 8. Top panel: The difference in E(J − Ks) values for T2Csand RRLs obtained from extinction maps based on red clump gi-ants (Gonzalez et al. 2012) and 3-D extinction map of Schultheis et al.(2014) as a function of distance. Bottom panel : The spatial distribu-tion of T2Cs before (grey) and after (magenta) the extinction correctionusing 3-D map.
from 3-D maps. The difference in E(J − Ks) color excess val-ues as a function of distance is shown in the top panel of Fig. 8.The difference increases for the line-of-sight distances towardsus and the offset is ∼ −0.05 mag for T2Cs and ∼ −0.03 mag forRRLs close to the Galactic center. We also correct the extinctionvalues from Gonzalez et al. (2012) and corresponding distanceestimates by iteratively computing the difference in extinctionwith respect to 3-D maps. The initial E(J − Ks) values are cor-rected for offset and the distances are redetermined in each it-eration. The procedure is repeated until extinction or distanceestimates converge.
Bottom panel of Fig. 8 shows the spatial distribution of T2Csbefore (grey) and after (magenta) the extinction correction from3-D maps. At present, the accuracy of the distance dimension of3-D maps is limited to the bin size of 0.5 kpc (upto 10.5 kpc) andtherefore, the correction in extinction converges typically in sec-ond or third iteration. Thus, the difference in resulting distancedistribution is very small and not statistically significant. Mediandifference in extinction is ∼ 0.01 and the distance to the Galac-tic center changes only marginally (∼ 10−3) if we use correctedextinctions from 3D maps.
6. Conclusions
We summarize our results as follows :
– We present a catalogue with mean VIJHK magnitudes,periods, reddening and subclass classifications for 264 TypeII Cepheids in the Galactic bulge by matching the VVV
Article number, page 8 of 9

A. Bhardwaj et al.: Type II Cepheids in the Galactic Bulge
near-infrared observations with optical data from OGLE-III.The sample consists of various subtypes (BL Herculis,W Virginis and RV Tauris) with on an average of 50 Ks
measurements per light-curve.
– We use random-phase corrected JH magnitudes and Ks
mean-magnitudes to derive period-luminosity relationsfor Type II Cepheids. The long-period RV Tauris starsare affected by saturation and therefore a sample of BLHerculis and W Virginis stars is used in our distanceanalysis. The period-luminosity relation in Ks-band,Ks = −2.189(0.056) [log(P) − 1] + 11.187(0.032), is foundto be consistent with published work for the LMC variables.
– We apply a global fit to the Galactic bulge, LMC and Galac-tic globular cluster Type II Cepheid data in Ks-band, togetherwith calibrated absolute magnitudes for Type II Cepheidsand RR Lyrae with Gaia and Hubble Space Telescopeparallaxes, to determine a distance to the Galactic center,R0 = 8.34 ± 0.03(stat.) ± 0.41(syst.) kpc. Our results are in avery good agreement with published distance measurementsbased on Type II Cepheids, RRLs (Groenewegen et al.2008; Dékány et al. 2013; Pietrukowicz et al. 2015) andthe recommended distance by de Grijs & Bono (2016).Adopting a different extinction law amounts to a differenceof +0.05−0.25
in the final distance to Galactic center.
– We also investigated the spatial distribution of Type IICepheids in the Galactic bulge. We compared their distribu-tion with well-studied most abundant tracers in the bulge,such as, RR Lyrae and red-clump giants. We find that TypeII Cepheids display a non-barred distribution, similar toother metal-poor bulge tracers, RR Lyrae (Dékány et al.2013) and red-clump giants (Zoccali et al. 2017). This resultrequires further validation with a larger sample of T2Cs thatare uniformly distributed, in particular at low latitudes.
– We test the individual distance estimates and extinctionvalues for Type II Cepheids in the Galactic bulge by takinginto account the 3-D distribution of dust in the Milky Way.At present, considering the discretization of 3-D maps alongdistance dimension in steps of 0.5 kpc, the correction ofindividual distances is not significant.
Acknowledgments
AB is thankful to the Council of Scientific and Industrial Re-search, New Delhi, for a Senior Research Fellowship (SRF,09/045(1296)/2013-EMR-I). We acknowledge the use of datafrom the ESO Public Survey program ID 179.B-2002 taken withthe VISTA telescope. DM, MR, EV, MZ and OG acknowledgehospitality of the Aspen Center for Physics, where this workwas initiated. The Aspen Center for Physics is supported byNational Science Foundation grant PHY-1066293. DM and MZwere partially supported by a grant from the simons Founda-tion, during their stay in Aspen and gratefully acknowledge sup-port by FONDECYT Regular grant No. 1130196 and 1150345,by the Ministry of Economy, Development, and Tourism’s Mil-lennium Science Initiative through grant IC120009, awarded toThe Millennium Institute of Astrophysics (MAS) and by theBASAL-CATA Center for Astrophysics and Associated Tech-nologies PFB-06.
References
Alcock, C., Allsman, R. A., Alves, D. R., et al. 1998, AJ, 115, 1921Bensby, T., Feltzing, S., Gould, A., et al. 2017, ArXiv e-prints, 1702.02971Bhardwaj, A., Kanbur, S. M., Macri, L. M., et al. 2016, AJ, 151, 88Bhardwaj, A., Kanbur, S. M., Singh, H. P., Macri, L. M., & Ngeow, C.-C. 2015,
MNRAS, 447, 3342Bhardwaj, A., Macri, L. M., Rejkuba, M., et al. 2017, AJ, 153, 154Borissova, J., Rejkuba, M., Minniti, D., Catelan, M., & Ivanov, V. D. 2009,
A&A, 502, 505Cardelli, J. A., Clayton, G. C., & Mathis, J. S. 1989, ApJ, 345, 245Catchpole, R. M., Whitelock, P. A., Feast, M. W., et al. 2016, MNRAS, 455,
2216Ciechanowska, A., Pietrzynski, G., Szewczyk, O., Gieren, W., & Soszynski, I.
2010, Acta Astron., 60, 233Clarkson, W., Sahu, K., Anderson, J., et al. 2008, ApJ, 684, 1110Clarkson, W. I., Sahu, K. C., Anderson, J., et al. 2011, ApJ, 735, 37de Grijs, R. & Bono, G. 2016, ApJs, 227, 5Dékány, I., Minniti, D., Catelan, M., et al. 2013, ApJL, 776, L19Del Principe, M., Piersimoni, A. M., Bono, G., et al. 2005, AJ, 129, 2714Feast, M. W., Laney, C. D., Kinman, T. D., van Leeuwen, F., & Whitelock, P. A.
2008, MNRAS, 386, 2115Genzel, R., Eisenhauer, F., & Gillessen, S. 2010, Reviews of Modern Physics,
82, 3121Gillessen, S., Plewa, P. M., Eisenhauer, F., et al. 2017, ApJ, 837, 30Gonzalez, O. A., Rejkuba, M., Minniti, D., et al. 2011a, A&A, 534, L14Gonzalez, O. A., Rejkuba, M., Zoccali, M., et al. 2013, A&A, 552, A110Gonzalez, O. A., Rejkuba, M., Zoccali, M., Valenti, E., & Minniti, D. 2011b,
A&A, 534, A3Gonzalez, O. A., Rejkuba, M., Zoccali, M., et al. 2012, A&A, 543, A13Gonzalez, O. A., Zoccali, M., Debattista, V. P., et al. 2015a, A&A, 583, L5Gonzalez, O. A., Zoccali, M., Vasquez, S., et al. 2015b, A&A, 584, A46Gran, F., Minniti, D., Saito, R. K., et al. 2016, A&A, 591, A145Groenewegen, M. A. T., Udalski, A., & Bono, G. 2008, A&A, 481, 441Hill, V., Lecureur, A., Gómez, A., et al. 2011, A&A, 534, A80Kubiak, M. & Udalski, A. 2003, Acta Astron., 53, 117Kuijken, K. & Rich, R. M. 2002, AJ, 124, 2054Laney, C. D., Joner, M. D., & Pietrzynski, G. 2012, MNRAS, 419, 1637Leavitt, H. S. & Pickering, E. C. 1912, Harvard College Observatory Circular,
173, 1Majaess, D., Turner, D., Dékány, I., Minniti, D., & Gieren, W. 2016, A&A, 593,
A124Majaess, D., Turner, D., & Lane, D. 2009, Acta Astron., 59, 403Matsunaga, N., Feast, M. W., Bono, G., et al. 2016, MNRAS, 462, 414Matsunaga, N., Feast, M. W., & Menzies, J. W. 2009, MNRAS, 397, 933Matsunaga, N., Feast, M. W., & Soszynski, I. 2011, MNRAS, 413, 223Matsunaga, N., Fukushi, H., Nakada, Y., et al. 2006, MNRAS, 370, 1979McWilliam, A. & Zoccali, M. 2010, ApJ, 724, 1491Minniti, D., Contreras Ramos, R., Zoccali, M., et al. 2016, ApJL, 830, L14Minniti, D., Lucas, P. W., Emerson, J. P., et al. 2010, New Astronomy, 15, 433Muraveva, T., Palmer, M., Clementini, G., et al. 2015, ApJ, 807, 127Nataf, D. M., Gonzalez, O. A., Casagrande, L., et al. 2016, MNRAS, 456, 2692Nataf, D. M., Udalski, A., Gould, A., Fouqué, P., & Stanek, K. Z. 2010, ApJL,
721, L28Nemec, J. M., Nemec, A. F. L., & Lutz, T. E. 1994, AJ, 108, 222Ness, M., Freeman, K., Athanassoula, E., et al. 2013, MNRAS, 430, 836Nishiyama, S., Nagata, T., Baba, D., et al. 2005, ApJL, 621, L105Nishiyama, S., Nagata, T., Kusakabe, N., et al. 2006, ApJ, 638, 839Nishiyama, S., Tamura, M., Hatano, H., et al. 2009, ApJ, 696, 1407Ortolani, S., Renzini, A., Gilmozzi, R., et al. 1995, Nature, 377, 701Pietrukowicz, P., Kozłowski, S., Skowron, J., et al. 2015, ApJ, 811, 113Pietrzynski, G., Graczyk, D., Gieren, W., et al. 2013, Nature, 495, 76Ripepi, V., Moretti, M. I., Marconi, M., et al. 2015, MNRAS, 446, 3034Rojas-Arriagada, A., Recio-Blanco, A., Hill, V., et al. 2014, A&A, 569, A103Sahu, K. C., Casertano, S., Bond, H. E., et al. 2006, Nature, 443, 534Saito, R. K., Hempel, M., Minniti, D., et al. 2012, A&A, 537, A107Saito, R. K., Zoccali, M., McWilliam, A., et al. 2011, AJ, 142, 76Sandage, A. & Tammann, G. A. 2006, ARA&A, 44, 93Schmidt, E. G., Hemen, B., Rogalla, D., & Thacker-Lynn, L. 2009, AJ, 137, 4598Schultheis, M., Chen, B. Q., Jiang, B. W., et al. 2014, A&A, 566, A120Sollima, A., Cacciari, C., & Valenti, E. 2006, MNRAS, 372, 1675Soszynski, I., Udalski, A., Pietrukowicz, P., et al. 2011, Acta Astron., 61, 285Soszynski, I., Udalski, A., Szymanski, M. K., et al. 2008, Acta Astron., 58, 293Soszynski, I., Udalski, A., Szymanski, M. K., et al. 2010, Acta Astron., 60, 91Stetson, P. B., Braga, V. F., Dall’Ora, M., et al. 2014, PASP, 126, 521Valenti, E., Zoccali, M., Gonzalez, O. A., et al. 2016, A&A, 587, L6Valenti, E., Zoccali, M., Renzini, A., et al. 2013, A&A, 559, A98Wallerstein, G. 2002, PASP, 114, 689Wegg, C. & Gerhard, O. 2013, MNRAS, 435, 1874Zoccali, M., Hill, V., Lecureur, A., et al. 2008, A&A, 486, 177Zoccali, M., Renzini, A., Ortolani, S., et al. 2003, A&A, 399, 931Zoccali, M. & Valenti, E. 2016, PASA, 33, e025Zoccali, M., Vasquez, S., Gonzalez, O. A., et al. 2017, A&A, 599, A12
Article number, page 9 of 9