gain report #my0029 malaysia solid wood products 2000 · committed to cut back logging to meet...
TRANSCRIPT

Foreign Agricultural Service
GAIN ReportGlobal Agriculture Information Network
Required Report - public distribution Date: 6/30/2000
GAIN Report #MY0029
Malaysia
Solid Wood Products
Annual
2000
Approved by:Bonnie BorrisU.S. Embassy, Kuala LumpurPrepared by:Raymond Hoh
Report Highlights: 1999 was a year of recovery for the Malaysia timber industry. Production of all thefour major timber products recorded positive growth. Export earnings from the timbersector rose 20 percent to US$4.5 billion. Increase in imports of US softwood lumberand hardwood veneer more than offset the decline in US hardwood lumber imports. The 2000 outlook for the Malaysian furniture/interiors sector is bright. With cut-backs in local log production, American wood suppliers must move aggressively topenetrate the market.
Includes PSD changes: YesIncludes Trade Matrix: Yes
Annual ReportKuala Lumpur [MY1], MY
Table of Contents
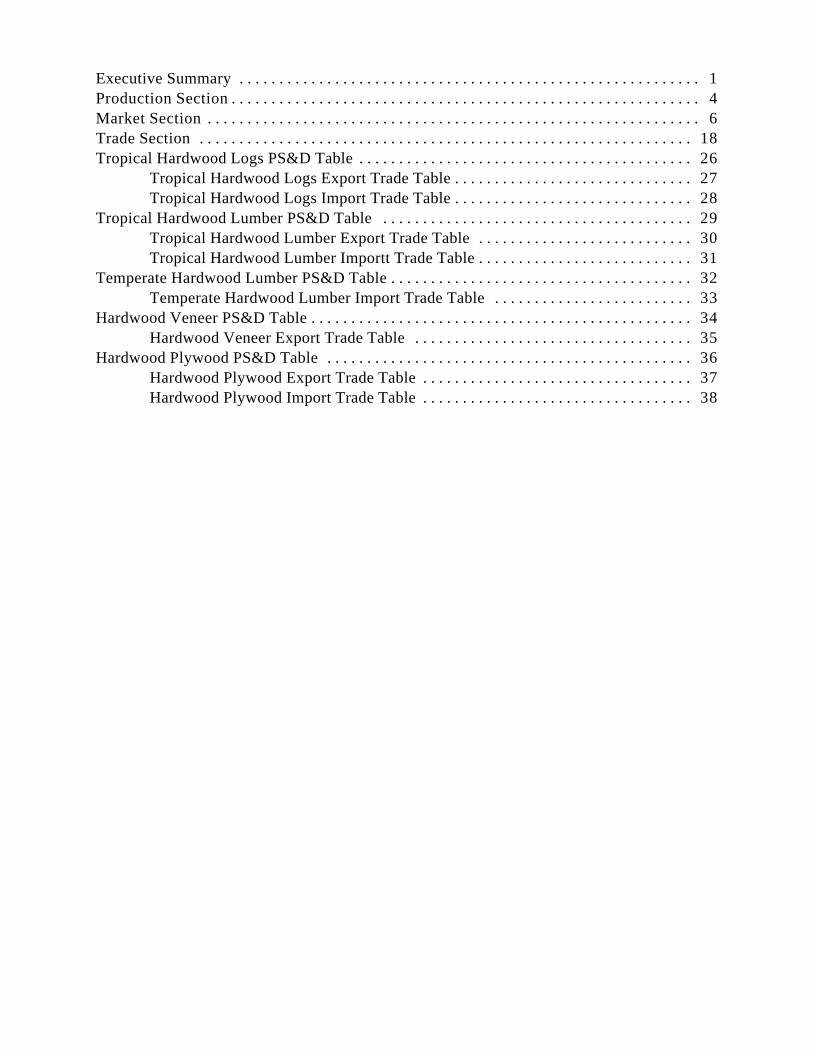
Executive Summary . . . . . . . . . . . . . . . . . . . . . . . . . . . . . . . . . . . . . . . . . . . . . . . . . . . . . . . . . . 1Production Section . . . . . . . . . . . . . . . . . . . . . . . . . . . . . . . . . . . . . . . . . . . . . . . . . . . . . . . . . . . 4Market Section . . . . . . . . . . . . . . . . . . . . . . . . . . . . . . . . . . . . . . . . . . . . . . . . . . . . . . . . . . . . . . 6Trade Section . . . . . . . . . . . . . . . . . . . . . . . . . . . . . . . . . . . . . . . . . . . . . . . . . . . . . . . . . . . . . . 18Tropical Hardwood Logs PS&D Table . . . . . . . . . . . . . . . . . . . . . . . . . . . . . . . . . . . . . . . . . . 26
Tropical Hardwood Logs Export Trade Table . . . . . . . . . . . . . . . . . . . . . . . . . . . . . . 27Tropical Hardwood Logs Import Trade Table . . . . . . . . . . . . . . . . . . . . . . . . . . . . . . 28
Tropical Hardwood Lumber PS&D Table . . . . . . . . . . . . . . . . . . . . . . . . . . . . . . . . . . . . . . . 29Tropical Hardwood Lumber Export Trade Table . . . . . . . . . . . . . . . . . . . . . . . . . . . 30Tropical Hardwood Lumber Importt Trade Table . . . . . . . . . . . . . . . . . . . . . . . . . . . 31
Temperate Hardwood Lumber PS&D Table . . . . . . . . . . . . . . . . . . . . . . . . . . . . . . . . . . . . . . 32Temperate Hardwood Lumber Import Trade Table . . . . . . . . . . . . . . . . . . . . . . . . . 33
Hardwood Veneer PS&D Table . . . . . . . . . . . . . . . . . . . . . . . . . . . . . . . . . . . . . . . . . . . . . . . . 34Hardwood Veneer Export Trade Table . . . . . . . . . . . . . . . . . . . . . . . . . . . . . . . . . . . 35
Hardwood Plywood PS&D Table . . . . . . . . . . . . . . . . . . . . . . . . . . . . . . . . . . . . . . . . . . . . . . 36Hardwood Plywood Export Trade Table . . . . . . . . . . . . . . . . . . . . . . . . . . . . . . . . . . 37Hardwood Plywood Import Trade Table . . . . . . . . . . . . . . . . . . . . . . . . . . . . . . . . . . 38

GAIN Report #MY0029 Page 1 of 50
Executive Summary
1999 brought many cheers to the Malaysian timber industry as optimism returned to the market. Production of all the four major timber products (namely logs, lumber, plywood and veneer) recordedpositive growth. The impressive performance of the Malaysian furniture/interiors sector benefitted UStemperate wood products. Increase in imports of US softwood lumber and hardwood veneer more thanoffset the decline in US hardwood lumber imports. However, US’s competitors, particularly NewZealand and Germany, are moving aggressively into the softwood market.
With the Asian economies recovering, Malaysian timber product exports are expected to remain buoyantover the next two years. Timber demand from East Asia and Europe is expected to remain high. The onlylimiting factor is the cut-back in domestic logging activities in line with the International Tropical TimberOrganization (ITTO)’s Year 2000 objective.
The Malaysian furniture/interiors sector remains a shining star with export earnings topping RM3.9billion in 1999; the outlook is bright with a projected 10-15 percent annual growth in export earningsuntil year 2005. Interest in utilizing temperate hard/soft wood in this sector is very encouraging. Considering the growing competition, American wood product suppliers must be price competitive andmove aggressively into the Malaysian market in order to increase market share.
Export earnings from the timber sector rose 20 percent to RM17.1 billion (US$4.5 billion) in 1999. Thetimber product sector remained as the second commodity export earner after palm-based products (seetable below). With the rapid development of down stream activities, earnings from wood panel andfurniture exports have far surpassed those from logs and lumber.
Malaysia's Export Earnings by Major Commodities(RM billion)
1997 1998 1999
Total Exports of which,
221.4 286.6 321.2
Timber Products 1/ 14.7 14.2 17.1
Palm Oil/Palm BasedProducts
14.1 22.7 19.5
Petroleum Products 9.9 10.1 13.3
Rubber 3.0 2.8 2.3
Cocoa (Bean/Butter) 0.5 0.6 0.5
1/ includes wooden/rattan furniture

GAIN Report #MY0029 Page 2 of 50

GAIN Report #MY0029 Page 3 of 50
Malaysia: Export of Major Timber Products, January-December 1998-99(FOB Value in RM million)
PRODUCTS
PeninsularMalaysia
Sabah
Sarawak
Malaysia
1998 1999 1998 1999 1998 1999 1998 1999
Logs 0 na 165 354 1715 2328 1880 2682
Lumber 929 1108 828 964 799 748 2556 2820
Plywood 295 353 1306 1177 1949 2521 3551 4051
Veneer 17 16 185 417 405 462 607 895
Molding 387 481 294 269 65 75 745 825
Dressed Timber 179 192 na na na na 179 192
Woodchips na na na na 12 25 12 25
Chipboard 119 120 na 11 na 39 119 170
M.D.Fibreboard 591 634 na na na 105 591 739
Building Joinery na na na na na na 662 715
WoodenFurniture
na na na na na na 3246 3900
Rattan Furniture na na na na na na 86 61
Grand Total 2517 2904 2778 3192 4945 6303 14234 17075

GAIN Report #MY0029 Page 4 of 50
Key Economic Indicators for Malaysia(Value in US$ million unless otherwise specified)
1998 1999 2000(f)
Income, Production, Employment:
Population (millions) 22.18 22.7 23.3
GDP in 1978 Prices 46,513 50,579 53,526
Percent Growth -7.5% 5.4% 5.8%
GDP at Current Prices 72,570 78,864 84,672
Percent Growth 0.9% 5.3% 7.4%
Per Capita GDP (Curr. US$) 3,272 3,473 3,642
Official Unemployment Rate 3.2% 3.0% 2.9%
Money and Prices:
Inflation (CPI) 5.3% 2.8% 3.2%
Average Commercial Rate 12.13% 8.56% 7.79%
Balance of Payments:
Merchandise Exports (FOB) 71,925 83,078 92,184
Merchandise Imports (FOB) 54,321 61,105 70,237
Exchange Rate (avg., per US$) 3.92 3.80 3.80
Sources: Bank Negara Annual Report 1999/00 MInistry of Finance Economic Report 1999/00 and US Embassy Estimates.
Exchange rate
1998 average: US$1.00 = RM3.92
1999 average: US$1.00 = RM3.80

GAIN Report #MY0029 Page 5 of 50
2000 (June) : US$1.00 = RM3.80
Production Section
Forest Situation
--The Forest Resource Base
Natural Forest
The total area of natural forest in Malaysia at end of 1999 was estimated to be 18.4 million hectares or 55%of the total land area. The proportion of forested land is higher in Sabah and Sarawak than in PeninsularMalaysia.Approximately, 5.9 million hectares (MH) are located in Peninsular Malaysia, 8.3 MH in Sarawak and 4.2MH in Sabah. While some forest land has been converted to agricultural land in Sarawak, someagricultural land in Sabah and Peninsular Malaysia has been reverted to forest land.
Of the total natural forest, Malaysia has a total of 15.9 million hectares of forested land designated as thePermanent Forest Estate (PFE) which is under sustainable management. Approximately 11.4 million hectaresof the Permanent Forest Estate are production forest with the remaining 4.5 million hectares being protectionand non-commercial forest.
Plantation Forests
Total planted forests in the country amounted to 297,000 hectares by the end of 1999. The State of Sabahleads in planted forest with Sabah Forest Industries having 118,000 hectares in order to supply raw materialfor its pulp and paper mill. The State of Sarawak has issued 15 planted forest licenses covering 1,130,644hectares. In 1998, Borneo Pulp and Paper Sdn. Bhd. (BPP) was the first company in Sarawak to embark ona planted forest venture to gear itself towards building a world-scale pulp and paper industry in the State. Atotal of 200,000 hectares of land would be planted with acacia mangium trees to ensure a sustainable supplyof fiber to its Bintulu pulp mill. Ta Ann Holdings Bhd has ventured into a large-scale commercialreforestation project involving genetically-improved timber species and rubber trees to ensure thesustainability of log supply. About 100,000 hectares in Sibu and Kapit, mostly in existing concession areasbelonging to its two subsidiaries, have been identified and a sum of RM30 million has been set aside for thepurpose. Timber and oil palm are being cultivated in the ratio of 4 to 1 as permitted by the state in an areacovering more than 16,000 hectares.
Agro-forestry
The government has proposed under the New Agriculture Policy that agro-forestry be used to address someissues related to timber, non-timber and food production. In the Malaysian context, agro-forestry is definedas an integration of forest species with agricultural crops and/or animal rearing (for example, sheep, cattleand deer). This is aimed at maximizing land use and providing sustainable higher income and early cash flowto farmers and plantations since the development of forest plantations requires a large capital investment and

GAIN Report #MY0029 Page 6 of 50
involves higher economic risk. Some examples agro-forestry design are as follows:i) oil palm/rubber + short-term crops + forest species (including medicinal plant)ii) oil palm/rubber + short-term crops + animal rearing (such as poultry and sheep) + forest speciesiii) paddy + duck rearing/vegetable farming + forest species on bunds.
Sustainability of the Forest Resources
As a leading exporter of tropical timber products, Malaysia has decided to undertake the task of timbercertification for the dual purpose of meeting market requirements as well as using the process to audit itsforest management practices. The National Timber Certification Council (NTCC) has finalized the MalaysianCriteria, Indicators, Activities and Standards of Performance for Forest Management Certification (MC&I)and follow-up measures are being taken to prepare the assessment procedures. In an effort to train potentiallocal assessors in forest management certification, the NTCC Malaysia and SmartWood Program, withfinancial assistance from Deutsche Gesellschaft fur Technische Zusammenarbeit, jointly organized the firstAssessor Training Program on Forest Certification for Southeast Asian Countries on 20-24 March, 2000 atthe Terengganu Timber Industry Training Centre, Kuala Berang. The MC&I and Assessment procedures serveas reference documents in future training programs being planned by NTCC Malaysia for auditors frompotential assessor companies and organizations. NTCC hopes to complete the whole exercise, whichincludes forest management assessment and chain-of-custody assessment, from the forest to the point ofexport, by the end of 2000.
Timber Products
--Production Trends
With the crisis ridden Asian economies showing definite signs of recovery, confidence and optimism havereturned to the Malaysian timber industry. Production of all timber recorded positive growth. In contrastto the big plunge in 1999, Malaysia's total roundwood production rose slightly to 21.7 million cubic meters(cum) in 2000. Malaysia's output of lumber also rose by 3 percent to 5.2 million cum in 1999. Malaysia’splywood production increased four percent to 4.1 million cum while veneer production rose 32 percent to1 million cum in 1999.
The outlook for log production in 2000 is for a decline in line with the various state governments’ moves togradually lower production quotas year by year. In its effort to regenerate the forest, the Sabah stategovernment endeavors to reduce logging for the next 10 years. The Sarawak state government is alsocommitted to cut back logging to meet ITTO’s Year 2000 objective. The expected drop in log output willhave a negative impact on output of lumber and plywood in the near term.

GAIN Report #MY0029 Page 7 of 50
Market Section
--Construction Sector
Industry Outlook
The Malaysian construction sector contracted moderately at 5.6% in1999, compared with a sharp declineof 23% in 1998. The improvement was particularly evident when a positive annual growth of 1.8% wasrecorded during the second half of the year. Construction activity was supported mainly by theimplementation of infrastructure projects under the fiscal stimulus package, as well as housingdevelopment in response to strong demand and low interest rates. However, growth of the constructionsector continued to be constrained by the oversupply of commercial buildings and poor demand for high-end residential properties.
In contrast to the nosedived economy in 1998, Malaysia is on the way to be one of the fastest growingeconomies in the world. The Government had announced the relaunch of the Express Rail Link to the newKuala Lumpur International Airport, the People Mover-Rapid Transit System, and the new PantaiExpressway. The 1999/2000 budget allocated US$1 billion for the development of infrastructure, particularly for theconstruction of roads, bridges, rail, seaports and civil aviation facilities. However, it will still take sometime to clear the oversupply situation of hotels, condominiums, office space and shopping complexes.
Market Impediments
Given the fact that Malaysia is one of the largest producers of hardwood in the world, USwood productsare unlikely to penetrate into the Malaysian construction sector. Moreover, Malaysia is in closeproximity to timber-rich countries like Indonesia and Papua New Guinea.
Market Opportunities
Unless the timber resources in Malaysia, Indonesia and P.N.Guinea are exhausted, market opportunitiesfor US wood products in the construction sector are extremely limited.
--Furniture/Interiors Sector
Industry Outlook
The Malaysian furniture/interiors sector continued to achieve impressive growth. In 1999, another 9,547condominium/apartment units and a total lettable area of 854,000 sq meters (office and retail) werecompleted in and around Kuala Lumpur. In addition, 97 new hotels/resorts were completed with 22,662rooms in the country. New hotels/resorts are under construction in new growth areas near to the newKuala Lumpur International Airport and the new and modern seaport named Westport. The GOM is in theamidst of building a new Administrative Center at Putrajaya. The whole place, with impressive

GAIN Report #MY0029 Page 8 of 50
governmental and residential buildings, a grand mosque and recreational facilities, is turning into a brandnew city. All these developments provide tremendous opportunities for the expansion of thefurniture/interiors sector and the increased usage of US hardwood.

GAIN Report #MY0029 Page 9 of 50
Supply of Office Space, Retail Space, Condominiums and Apartments in Klang Valley¹
Office Space Retail SpaceCondominiums& Apartments
Squaremetres
Occupancyrate (%)
Squaremetres
Occupancyrate (%)
Units
1991 12,331 96.7 17,502 92.0 13,560
1992 39,825 97.2 58,910 94.2 3,768
1993 332,246 91.5 130,345 97.3 18,232
1994 192,808 94.3 117,340 98.5 9,331
1995 362,851 94.9 341,091 96.1 17,822
1996 296,742 95.5 136,964 92.8 14,568
1997 869,394 94.9 362,574 90.5 5,473
1998 873,346 79.8 395,328 59.5 14,151
1999 795,750 76.2 58,486 76.6 9,547
¹ Refers to Kuala Lumpur & Selangor D.E.
Source: Valuation and Property Services Department

GAIN Report #MY0029 Page 10 of 50
Supply of Hotel Rooms in Malaysia
Year No. Of newHotels
No. of newRooms
Year-endHotel Total
Year-end RoomTotal
1992 36 7,305 1,043 54,928
1993 47 6,077 1,090 61,005
1994 38 4,902 1,128 65,907
1995 92 10,466 1,220 76,373
1996 69 9,141 1,289 85,514
1997 122 27,832 1,411 113,346
1998 54 9,351 1,465 122,697
1999 97 22,662 1,562 124,259
Malaysia is the top exporter of furniture among the ASEAN region with export earnings increasing by 20percent to RM3.9 billion (US$1.02 billion) in 1999. During 1999, the United States continued to be thelargest single market for Malaysian wooden furniture (37 %), followed by Japan (14%), Singapore (9%)and United Kingdom (9%). There was also a significant market diversification with local furniture-related products exported to 176 countries last year as compared with 142 in 1998.
The furniture industry is pursuing its strategy of producing more competitive products for theinternational market. In order to stay ahead of its low-cost competitors such as China and Vietnam, someMalaysian furniture makers have started joint ventures in Burma, Indonesia and China to manufacturecomponents or semi-finished products which could be assembled and finished into final products inMalaysia.
The sixth annual Malaysian International Furniture Fair (MIFF) 2000, held in Kuala Lumpur in earlyMarch 2000, showcased the best of Malaysian manufactured furniture. With 290 exhibitions occupying35,000 sq. meters of exhibition space, MIFF 2000 attracted 17,566 visitors, of which 5,663 wereinternational buyers from 113 countries. RM1.83 billion in sales, recording a 17 per cent increase fromthe preceding year, was generated at the show. The furniture industry projects an average annual growthof 10-15 percent from 1998 to the year 2000. Export earnings from furniture are expected to reachRM6 billion (US$1.6 billion) in 2000 and RM10 billion (US$2.6 billion) by 2005.

GAIN Report #MY0029 Page 11 of 50
Malaysia: Exports of Wooden Furniture(in million RM)
1997 1998 1999
USA. 970 1,270 1,452
Japan 466 509 565
Singapore 257 279 342
United Kingdom 107 214 337
Australia 116 169 267
Canada 54 89 95
U.A.E. 52 87 93
Taiwan 56 74 45
Hong Kong 68 55 52
Saudi Arabia 39 54 70
Others 282 446 582
– Total 2,467 3,246 3,900
Market Impediments
Malaysian imports of temperate hardwood lumber dropped 19 percent in 1999 and imports from the USshowed a 34 percent decline. There had been a shift from using temperate hardwood lumber to temperatehardwood veneer, resulting in imports of US veneer recording a hefty growth of 36 percent in 1999. Austria, Denmark, Sweden and China were the top competitors. Imports from Canada suffered asignificant drop.
Imports of softwood lumber doubled to 47,000 cum in 1999. While imports from the US rose 25percent, its market share was down by 19 %. New Zealand was the biggest gainer with sales quadruplingover the year, while Austria re-emerged as a formidable competitor. South Africa, Germany and Swedenalso managed to increase sales to Malaysia.
Lack of knowledge of US hardwood and softwood is still a constraint, especially the technical applicationof popular US hardwoods in making furniture and flooring in Malaysia. There is also still a need to reacha wider range of potential users such as housing, shopping, restaurants and hotel/resort developers.
Market Opportunities
Much of the success of the Malaysian furniture industry is directly attributable to coupling cheaper native

GAIN Report #MY0029 Page 12 of 50
woods, such as rubberwood, with high-value veneers from the US. Strong increases in market shares ofUS temperate hardwood veneer in past years confirms this trend. As Malaysia aims to be among the topten furniture exporters in the world by 2005, the US wood industry, if properly positioned, would largelybenefit from the realization of such a vision.
The American Hardwood Export Council (AHEC) has done a commendable job of increasing theawareness of US hardwoods in Malaysia. Their main activities including educational programs for thefurniture industry, seminars, trade shows and convention, are highly relevant in assisting US expansion inthis region. It may also be appropriate to conduct a seminar dealing with the technical application ofpopular US hardwoods in making furniture and flooring in Malaysia. Post also feels that US woodsuppliers should participate at trade shows to make direct contact with local furniture manufacturers. Without concerted marketing efforts, US market share will be slowly eroded by aggressive competitors.
Coming events which provide opportunities for US associations and firms to be involved are as follows:-1) The Malaysian Timber Marketing Convention, which has been scheduled for 28-29 September 2000 is
the meeting point for buyers and timber industry players from all four corners of the globe. Some325 participants attended the Convention held in 1999. In conjunction with the Convention,opportunities are available for product exhibition. (For details, please e-mail [email protected] )
-2) The Malaysian International Furniture Fair (MIFF) 2001 is scheduled to be held on 6-10, March 2001. MIFF is becoming a premium furniture fair in the region. This export-oriented exhibition,showcasing the latest design for the world-wide market, represents the largest collection of Malaysianfurniture for the global market. It accounts for about 30 percent of Malaysia’s total annual furnitureexports. However, MIFF generally does not offer exhibition space to foreign timber associations ortimber trading companies. AHEC SEA was the only timber association to have the privilege ofparticipating in MIFF 2000. (For details, please e-mail [email protected] )
Post has proposed to recruit 5 to 6 Malaysian importers and users of US wood products to form a buyingteam to visit US suppliers of lumber, veneer and dimension products and learn more about technicalapplications. This will complement AHEC’s program for the region. The purpose of the trip is toenhance the team’s knowledge of US products and to increase their individual network of US woodsuppliers.

GAIN Report #MY0029 Page 13 of 50
Malaysia: Imports of Temperate Hardwood Lumber(cubic meter)
1997 1998 1999
USA. 9,426 17,853 11,719
Austria 943 2,063 3,527
Denmark 1,043 2,396 3,346
Sweden 1,245 1,486 2,544
China 2,786 2,334 2,218
Canada 2,221 3,448 1,589
Australia 2,852 902 991
New Zealand 146 552 880
Germany 3,327 445 415
Finland 175 0 230
Taiwan 1,738 771 1
Japan 932 0 1
S.Africa 57 0 0
Netherlands 415 768 0
Switzerland 1,826 697 0
Cambodia 0 0 0
India 52 0 0
Geogia 0 0 0
Burma 7 0 0
Guyana 4 0 0
France 262 0 0
Poland 104 0 0
Belgium 0 0 0
Romania 40 0 0
Singapore 9,116 0 0
Russian 106 0 0
Italy 2,599 0 0
Indonesia 50 0 0
U.K. 53 0 0
Hong Kong 2,220 0 0
Dominica 28 0 0
Ghana 56 0 0
--Total 43,829 33,715 27,461

GAIN Report #MY0029 Page 14 of 50
Note: 1/ 1997 imports include transshipment via SingaporeMalaysia: Imports of Temperate Softwood Lumber
(Cubic Meter)
1997 1998 1999
USA. 13,510 11,876 14,838
New Zealand 1,371 2,022 8,462
Austria 2,014 0 3,971
South Africa 1,482 497 3,818
Germany 72 1,081 3,369
Sweden 979 1,339 2,926
Australia 1,117 1,005 1,979
Switzerland 696 854 1,917
Canada 2,385 1,739 1,196
China 683 954 1,178
Denmark 307 733 1,177
France 0 0 1,000
Netherlands 41 119 639
Finland 31 310 335
Taiwan 270 518 253
U.K. 3 247 0
Russian 163 0 0
Belgium 89 0 0
India 3,000 0 0
Japan 69 0 0
Burma 20 0 0
-- Total 28,302 23,294 47,058

GAIN Report #MY0029 Page 15 of 50
--Materials Handling Sector
Industry Outlook
Materials handling is very much tied to the manufacturing sector. In 1998, manufacturing output rose by aslower pace. Apart from semiconductors and television sets and plywood, other output that requirespackaging registered negative growth.
Manufacturing Production: Selected Indicators
Output Change in %
1999 1998 1999
Integrated circuits (millionunits)
14,878 -7.5 28.0
Semiconductors (million units) 9,959 20.4 11.3
Television sets ('000 units) 7,611 3.4 -5.3
Room air-conditioners ('000units)
1,147 -38.9 -11.3
Household refrigerators ('000units)
194 -17.3 -5.8
Plywood ('000 cu. meter) 3,701 -18.6 0.8
Veneer sheets ('000 cu. meter) 1,255 -9.7 9.9
Source: Department of Statistics
Market Impediments
Malaysia has an ample supply of low-priced timber for making packaging, pallets, and crates. Furthermore, there are plenty of saw tailings for this sector.
Market Opportunities
For the near term, market opportunities for US products are essentially nil.

GAIN Report #MY0029 Page 16 of 50
--Export Sector
Industry Outlook
1999 was a recovery year with export earnings for all timber products recording positive growth. Themain contributing factors are the recovering Asian economies and the increase in demand from Europe andthe States. Malaysia's exports of hardwood logs rose 25 percent in 1999. Japan, China and Taiwan were the top three buyers of Malaysian logs, accounting for 70 percent of total log exports in 1999. India’simports of Malaysian logs also recorded a significant increase. Exports of lumber increased three percentin 1999, with Thailand, the Netherlands, Philippines, Japan and Singapore being the top five markets (55percent of total lumber exports). With the exception of Taiwan, all major lumber markets increased theirimports of Malaysian lumber. Due to the oversupply situation in the global market, exports of plywoodwere down 8 percent in 1999; Japan and the US were the predominant buyers. However, exports of veneerrose 31 percent with most of the increase going to China and the Philippines.
Malaysian timber product exports are expected to remain buoyant over the next two years. Timberconsumption in Japan is expected to rise as demand from its housing and construction industry is poised toincrease given the US$19 billion allocation to housing loans. The Chinese Government’s plan to step uphousing construction has increased its total panel consumption. In Europe, too, housing starts werepicking up due to the improved economic situation and increased consumer confidence.
For the near term, Malaysia is also giving more attention to the following countries:a) South Korea - With signs of a strong economic recovery in South Korea, Malaysia is optimistic thattrading levels will recover to pre-crisis volumes. Malaysia had been a significant hardwood productssupplier to South Korea particularly for lumber, plywood , moldings and buildings carpentry and joinery. It has also made progressive inroads into the furniture market.
b) West Asia - As a follow-up to the trade mission to the Middle East (U.A.E., Saudi Arabia and Egypt),Malaysia aims to diversify market and increase the utilization of Malaysian timber and timber products inthese countries. Malaysian furniture manufacturers are encouraged to enter into joint-ventures withTurkish companies to take advantage of the relatively cheap and abundant labor in Turkey to manufacturefurniture which could be exported duty-free to the EU countries. Since Turkish companies have a lot ofexperience in trading with the Russian and Ukraine markets as well as the Central Asian Republics, anotherarea of cooperation could be engaging Turkish furniture companies as agents to penetrate into thesemarkets.
c) Netherlands - The growing demand for certified timber provides a good opportunity for Malaysia’stimber products to regain their market share in the Netherlands following adverse and negative publicreaction towards tropical timber stirred up by environmental non-governmental groups (ENGO’s) inEurope. The creation of the National Timber Certification Council, Malaysia, to implement thecertification of Malaysia’s timber further proves that Malaysia is committed to its sustainable forestmanagement policy. Malaysia sees good prospects in the supply of door and window frames, joinery andflooring to the Netherlands.

GAIN Report #MY0029 Page 17 of 50
d) Poland - Poland offers prospects for the establishment of joint ventures between foreign and Polishtimber-based companies to manufacture timber products such as furniture, flooring and panel products forboth the domestic and export markets such as the EU and other European nations. Since Poland is anassociated member of the EU, European Free Trade Association (EFTA) and the Central Europe FreeTrade Association (CEFTA) and has close linkages with Russia, Ukraine and the former Soviet Republics,exports of timber-based products from Poland to these markets will enjoy preferential treatment. Malaysian exporters are encouraged to increase their promotional and marketing efforts to this market byparticipating at the annual Polish Fair for Furniture and Furnishing at Poznan.
Competitor Activities
The Malaysian Timber Council (MTC) together with the Malaysian Timber Industry Board (MTIB) inPeninsular Malaysia, the Sarawak Timber Industry Development Corporation (STIDC), and the TimberAssociation of Sabah are involved in efforts to promote the usage of Malaysian timber products. In1999/2000, MTC participated in various exhibitions in Shanghai (Furniture China 99), Dubai (Index 99),Paris (International Furniture Exhibition), United States (High Point & Chicago NBPE) and Cologne(Spoga Fair), Neremberg (Fensterbau), Sharjah, UAE (Gulf Interior Fair), Birmingham (INTERBUILD),Berlin (Bautec 2000) and Sao Paulo (Home Brazil 2000).
Trade missions were sent to the United Emirates, Saudi Arabia, Egypt, and Belgium. The annual MalaysianInternational Furniture Fair is fast becoming an important venue for the promotion of Malaysian furniture. Some RM1.83 billion in sales were clinched at the last Fair held at Kuala Lumpur in March, 2000.
Malaysian Timber Council (MTC)’s regional marketing office in Dubai was officially opened on October6, 1999. The purpose of the Dubai office is to strengthen marketing efforts in the Middle East and tocover markets like Kuwait, Yemen, Saudi Arabia. The UAE also serves as a gateway to markets in East andSouth Africa and Central Asia.. MTC has also established regional offices in London and Shanghai.
The following table provides a list of fairs and exhibitions which MTC intends to participate for the rest of2000:
Jul 10 - Jul 13 China International Building & Decoration Fair 2000, Guangzhou, China
Jul 16 - Jul 19 International Building Materials & Equipment Exhibition INTERBUILD,Melbourne, Australia
Aug 13 - Aug 16 National Building Products Exposition, Chicago, USA
Aug 23 - Aug 26 INTERBUILD Africa 2000, Johannesburg, South Africa
Sep* Belgium Timber Day, Brussels, Belgium
Oct 4 - Oct 8 INDEX 2000, Dubai, UAE
Oct 28 - Nov 1 Saudi Build 2000, Riyadh, Saudi Arabia

GAIN Report #MY0029 Page 18 of 50
Dec* Dutch Timber Day, Utrecht, The Netherlands
Dec* China Building 2000, Beijing, China
* Exact dates to be confirmed
Revised Levy for Timber Exports
The GOM has revised the export cess rates by RM5.00 per cubic meter on export of timber products fromPeninsular Malaysia effective March 1, 2000. The rates were last revised in May,1998. Two other timberproducts, particleboard/chipboard and blockboard, including battenboard and laminated board have beenincluded in the list with a cess of RM2.00 per cubic meter.
A ban has been imposed on the export of finger-jointed and /or laminated roughsawn timber in order toincrease the supply of timber for the domestic processing sector, especially the furniture sector.
The revised rates are provided on page 17.

GAIN Report #MY0029 Page 19 of 50
Revised Export Cess Rates for Peninsular Malaysia
Timber Products Rates
(a) Logs (only certain specie permitted for export) RM5.00 per cubic meter or partthereof
(b) Sawn timber or lumber (all sizes of Chengal, DamarMinyak, Nyatoh, Kembang Semangkok and Red Balau)
* RM255.00 per cubic meter or partthereof, either kiln-dried (KD) or air-dried (AD) sawn timber
(c) Sawn timber (all sizes of Rubberwood) * RM125.00 per cubic meter or partthereof, either kiln-dried (KD) or air-dried (AD) sawn timber
(d) Timber strips (of Jelutong, Dark Red Meranti, LightRed Meranti and Red Meranti)
* RM125.00 per cubic meter or partthereof, either kiln-dried (KD) orair-dried (AD) sawn timber
(e) Sawn timber (all sizes and species other than of speciesreferred to in items (b), (c) and (d))
RM5.00 per cubic meter or partthereof
(f) Dressed timber (S4S), E1E, E2E, E3E and E4E ofRubberwood and Chengal
* RM 125.00 per cubic meter or partthereof
(g) Dressed timber (S4S), E1E, E2E, E3E and E4E ofspecies other than Rubberwood and Chengal
RM5.00 per cubic meter or partthereof
(h) Moldings RM5.00 per cubic meter or partthereof
(i) Veneer (2 mm thick and less) RM5.00 per cubic meter or partthereof
(j) Veneer (more than 2 mm thick) * RM255.00 per cubic meter or partthereof
(k) Plywood RM5.00 per cubic meter or partthereof
(l) Blockboard including battenboard and laminboard RM2.00 per cubic meter or partthereof
(m) Particleboard/Chipboard RM2.00 per cubic meter or partthereof

GAIN Report #MY0029 Page 20 of 50
(n) Railway sleepers and crossing, transmission posts,unassembled pallets, fine-ripped door stiles, agriculturestakes, cross-arms, stiffeners for flakeboard, railwaycrossings,fenders and walings from species other thanspecies referred to in items (b) and (c)
RM5.00 per cubic meter or partthereof
Note: * Inclusive of export levy rates which remain unchanged.

GAIN Report #MY0029 Page 21 of 50
Trade Section
Trade Overview
Malaysia: Exports of Tropical Hardwood Logs, 1998(1,000 cubic meters)
Destination Pen. Malaysia Sabah Sarawak Malaysia
Japan 0 144 2081 2225
Taiwan 0 31 939 970
China 0 140 601 741
India 0 21 719 740
Hong Kong 0 19 371 390
South Korea 0 57 177 234
Indonesia 0 156 1 157
Thailand 0 7 90 97
Pakistan 0 0 15 15
Turkey 0 0 8 8
Bangladesh 0 0 2 2
Vietnam 0 2 0 2
Singapore 0 0 1 1
Philippines 0 0 1 1
-- Total 0 577 5006 5583

GAIN Report #MY0029 Page 22 of 50
Malaysia: Exports of Tropical Hardwood Logs, 1999(1,000 cubic meters)
Destination Pen. Malaysia Sabah Sarawak Malaysia
Japan 0 212 2,072 2,284
China 0 382 1,288 1,670
Taiwan 0 58 862 920
India 0 11 830 841
Hong Kong 0 10 430 440
South Korea 0 73 321 394
Indonesia 0 253 0 253
Thailand 0 30 68 98
Philippines 0 22 40 62
Pakistan 0 0 18 18
Vietnam 0 6 3 9
Bangladesh 0 0 2 2
Saudi Arabia 0 0 2 2
Singapore 0 1 1 2
U.A.E. 0 0 1 1
Maldives 0 0 1 1
Australia 0 0 1 1
-- Total 0 1,058 5,940 6,998

GAIN Report #MY0029 Page 23 of 50
Malaysia: Exports of Tropical Hardwood Lumber, 1998(1,000 cubic meters)
Destination Pen. Malaysia Sabah Sarawak Malaysia
USA. 7 1 7 15
Thailand 128 104 128 360
Taiwan 13 52 208 273
Netherlands 175 86 7 268
Singapore 129 18 116 263
Japan 40 155 41 236
Philippines 1 68 147 216
Hong Kong 32 59 41 132
China 7 25 93 125
South Korea 5 52 48 105
Yemen Rep. of 24 18 63 105
Others 268 164 174 604
-- Total 829 802 1073 2702

GAIN Report #MY0029 Page 24 of 50
Malaysia: Exports of Tropical Hardwood Lumber, 1999(1,000 cubic meters)
Destination Pen. Malaysia Sabah Sarawak Malaysia
USA. 8 3 7 18
Thailand 218 119 153 490
Netherlands 178 88 6 272
Philippines 4 83 183 270
Japan 47 177 36 260
Singapore 172 11 66 249
Taiwan 6 44 161 211
South Korea 9 71 64 144
China 14 43 82 139
Hong Kong 10 62 48 120
Yemen Rep. of 26 6 35 67
Others 282 144 122 548
-- Total 974 851 963 2788

GAIN Report #MY0029 Page 25 of 50
Malaysia: Exports of Tropical Hardwood Veneer, 1998(1,000 cubic meters)
Destination Pen. Malaysia Sabah Sarawak Malaysia
USA. 0 3 7 10
China 2 59 220 281
Taiwan 0 46 106 152
Hong Kong 6 30 65 101
Japan 0 25 42 67
Philippines 0 7 54 61
South Korea 0 5 41 46
Thailand 0 2 2 4
Netherlands 0 2 0 2
Singapore 0 1 0 1
Others 2 1 0 5
-- Total 10 181 537 730

GAIN Report #MY0029 Page 26 of 50
Malaysia: Exports of Tropical Hardwood Veneer, 1999(1,000 cubic meters)
Destination Pen. Malaysia Sabah Sarawak Malaysia
USA. 0 2 3 5
China 8 238 204 450
Philippines 0 22 138 160
Taiwan 1 76 70 147
Japan 0 33 40 73
South Korea 0 11 61 72
Hong Kong 1 15 29 45
Thailand 0 1 1 2
Singapore 0 2 0 2
-- Total 10 401 546 957

GAIN Report #MY0029 Page 27 of 50
Malaysia: Exports of Tropical Hardwood Plywood, 1998(1,000 cubic meters)
Destination Pen. Malaysia Sabah Sarawak Malaysia
USA. 2 71 283 356
Japan 49 325 872 1246
Hong Kong 12 294 360 666
China 13 281 164 458
Taiwan 3 131 82 216
Singapore 90 33 71 194
U.K. 52 38 92 182
South Korea 1 40 64 105
Ireland 8 0 20 28
Yemen Rep. of 0 0 27 27
Brunei 0 0 18 18
Others 35 48 51 134
--Total 265 1261 2104 3630

GAIN Report #MY0029 Page 28 of 50
Malaysia: Exports of Tropical Hardwood Plywood, 1999(1,000 cubic meters)
Destination Pen. Malaysia Sabah Sarawak Malaysia
USA. 4 124 318 447
Japan 46 400 1,150 1,597
Hong Kong 9 123 153 285
China 8 72 109 189
Singapore 98 26 52 176
South Korea 2 98 71 171
Taiwan 5 65 99 169
U.K. 41 8 54 104
Yemen Rep. of 0 0 27 27
Thailand 1 8 12 21
Ireland 8 0 11 19
Others 58 17 49 135
-- Total 281 942 2,117 3,340

GAIN Report #MY0029 Page 29 of 50
Tropical Hardwood Logs PS&D Tables
PSD Table
Country Malaysia
Commodity Tropical Hardwood Logs 1000 CUBIC METERS
Revised 1999 Preliminary
2000 Forecast 2001
Old New Old New Old New
Market Year Begin 01/1999 01/2000 01/2001
Production 19000 21741 0 20000 0 19000
Imports 600 639 0 1700 0 2000
TOTAL SUPPLY 19600 22380 0 21700 0 21000
Exports 3000 6998 0 6000 0 5000
Domestic Consumption 16600 15382 0 15700 0 16000
TOTAL DISTRIBUTION 19600 22380 0 21700 0 21000

GAIN Report #MY0029 Page 30 of 50
Tropical Hardwood Logs Export Trade Table
Export TradeMatrix
Country Malaysia
Commodity TropicalHardwoodLogs
Time period Jan-Dec Units: 1,000 CUM
Exports for: 1998 1999
US US
Others Others
Japan 2225 Japan 2284
Taiwan 970 China 1671
China 741 Taiwan 919
India 740 India 840
Hong Kong 390 Hong Kong 439
South Korea 234 South Korea 394
Indonesia 157 Indonesia 253
Thailand 97 Thailand 98
Pakistan 15 Philippines 62
Turkey 8 Pakistan 18
Total for Others 5577 6978
Others notListed
6 20
Grand Total 5583 6998

GAIN Report #MY0029 Page 31 of 50
Tropical Hardwood Logs Import Trade Table
Import TradeMatrix
Country Malaysia
Commodity TropicalHardwoodLogs
Time period Jan-Dec Units: 1,000 CUM
Imports for: 1998 1999
US US
Others Others
Indonesia 322 Indonesia 578
Burma 12 Burma 18
P. New Guinea 7 P. New Guinea 14
South Africa 5 Thailand 9
Thailand 4 Solomon Island 8
Gabon 7
Somalia 5
Total for Others 350 639
Others notListed
Grand Total 350 639

GAIN Report #MY0029 Page 32 of 50
Tropical Hardwood Lumber PS&D Table
PSD Table
Country Malaysia
Commodity Tropical Hardwood Lumber 1000 CUBIC METERS
Revised 1999 Preliminary
2000 Forecast 2001
Old New Old New Old New
Market Year Begin 01/1999 01/2000 01/2001
Production 5070 5187 0 4900 0 4500
Imports 530 1177 0 1800 0 2600
TOTAL SUPPLY 5600 6364 0 6700 0 7100
Exports 2100 2788 0 2500 0 2300
Domestic Consumption 3500 3576 0 4200 0 4800
TOTAL DISTRIBUTION 5600 6364 0 6700 0 7100

GAIN Report #MY0029 Page 33 of 50
Tropical Hardwood Lumber Export Trade Table
Export TradeMatrix
Country Malaysia
Commodity TropicalHardwoodLumber
Time period Jan-Dec Units: 1,000 CUM
Exports for: 1998 1999
US 15 US 17
Others Others
Thailand 360 Thailand 490
Taiwan 273 Netherlands 271
Netherlands 268 Philippines 269
Singapore 263 Japan 260
Japan 236 Singapore 249
Philippines 216 Taiwan 212
Hong Kong 132 South Korea 143
China 125 China 140
South Korea 105 Hong Kong 120
Yemen Rep. of 105 U.A.E 77
Total for Others 2083 2231
Others notListed
604 540
Grand Total 2702 2788

GAIN Report #MY0029 Page 34 of 50
Tropical Hardwood Lumber Import Trade Table
Import TradeMatrix
Country Malaysia
Commodity TropicalHardwoodLumber
Time period Jan-Dec Units: 1,000 CUM
Imports for: 1998 1999
US US
Others Others
Indonesia 343 Indonesia 1120
Thailand 7 Thailand 35
Burma 4 Burma 18
Philippines 2 Philippines 2
Singapore 1 P.New Guinea 1
Cambodia 1
Total for Others 357 1177
Others notListed
Grand Total 357 1177

GAIN Report #MY0029 Page 35 of 50
Temperate Hardwood Lumber PS&D Table
PSD Table
Country Malaysia
Commodity Temperate Hardwood Lumber 1000 CUBIC METERS
Revised 1999 Preliminary
2000 Forecast 2001
Old New Old New Old New
Market Year Begin 01/1999 01/2000 01/2001
Production 0 0 0 0 0 0
Imports 46 27 0 30 0 40
TOTAL SUPPLY 46 27 0 30 0 40
Exports 0 0 0 0 0 0
Domestic Consumption 46 27 0 30 0 40
TOTAL DISTRIBUTION 46 27 0 30 0 40

GAIN Report #MY0029 Page 36 of 50
Temperate Hardwood Lumber Import Trade Table
Import TradeMatrix
Country Malaysia
Commodity TemperateHardwoodLumber
Time period Jan-Dec Units: CUM
Imports for: 1998 1999
US 17853 US 11719
Others Others
Canada 3448 Austria 3527
Denmark 2396 Denmark 3346
China 2334 Sweden 2544
Austria 2063 China 2218
Sweden 1486 Canada 1589
Australia 902 Australia 991
Taiwan 771 New Zealand 880
Netherlands 768 Germany 415
Switzerland 697 Finland 230
New Zealand 552 Taiwan 1
Total for Others 15417 15741
Others notListed
445 1
Grand Total 33715 27461

GAIN Report #MY0029 Page 37 of 50
Hardwood Veneer PS&D Table
PSD Table
Country Malaysia
Commodity Hardwood Veneer 1000 CUBIC METERS
Revised 1999 Preliminary
2000 Forecast 2001
Old New Old New Old New
Market Year Begin 01/1999 01/2000 01/2001
Production 950 1005 0 1200 0 1300
Imports 0 0 0 0 0 0
TOTAL SUPPLY 950 1005 0 1200 0 1300
Exports 750 957 0 1000 0 1000
Domestic Consumption 200 48 0 200 0 300
TOTAL DISTRIBUTION 950 1005 0 1200 0 1300

GAIN Report #MY0029 Page 38 of 50
Hardwood Veneer Export Trade Table
Export TradeMatrix
Country Malaysia
Commodity HardwoodVeneer
Time period Jan-Dec Units: 1,000 CUM
Exports for: 1998 1999
US 10 US 5
Others Others
China 281 China 450
Taiwan 152 Philippines 160
Hong Kong 101 Taiwan 147
Japan 67 Japan 73
Philippines 61 South Korea 72
South Korea 46 Hong Kong 45
Thailand 4 Thailand 2
Netherlands 2 Singapore 2
Singapore 1
Total for Others 715 951
Others notListed
5 1
Grand Total 730 957

GAIN Report #MY0029 Page 39 of 50
Hardwood Plywood PS&D Table
PSD Table
Country Malaysia
Commodity Hardwood Plywood 1000 CUBIC METERS
Revised 1999 Preliminary
2000 Forecast 2001
Old New Old New Old New
Market Year Begin 01/1999 01/2000 01/2001
Production 3060 4071 0 4000 0 4400
Imports 50 9 0 10 0 100
TOTAL SUPPLY 3110 4080 0 4010 0 4500
Exports 2610 3340 0 3160 0 3530
Domestic Consumption 500 740 0 850 0 970
TOTAL DISTRIBUTION 3110 4080 0 4010 0 4500

GAIN Report #MY0029 Page 40 of 50
Hardwood Plywood Export Trade Table
Export TradeMatrix
Country Malaysia
Commodity HardwoodPlywood
Time period Jan-Dec Units: 1,000 CUM
Exports for: 1998 1999
US 356 US 447
Others Others
Japan 1246 Japan 1597
Hong Kong 666 Hong Kong 285
China 458 China 189
Taiwan 216 Singapore 176
Singapore 194 South Korea 171
United Kingdom 182 Taiwan 169
South Korea 105 United Kingdom 104
Ireland 28 Yemen Rep. of 27
Yemen Rep.of 27 Thailand 21
Brunei 18 Ireland 19
Total for Others 3140 2758
Others notListed
134 135
Grand Total 3630 3340

GAIN Report #MY0029 Page 41 of 50
Hardwood Plywood Import Trade Table
Import TradeMatrix
Country Malaysia
Commodity HardwoodPlywood
Time period Jan-Dec Units: 1,000 CUM
Imports for: 1998 1999
US US
Others Others
Indonesia 10 Indonesia 9
Total for Others 10 9
Others notListed
Grand Total 10 9

GAIN Report #MY0029 Page 42 of 50
STRATEGIC INDICATOR TABLE: FOREST AREA (million hectares/million cum)
Country:Malaysia
Report Year: 1999 2000 2001
Total Land Area 32.9 32.9 32.9
Total Forest Area 18.4 18.2 18.0
--of which, Commercial 13.8 13.7 13.5
----of commercial, tropical hardwood 13.8 13.7 13.5
----of commercial, temperate hardwood na na na
----of commercial, softwood na na na
--of forest area, non-commercial 4.6 4.5 4.5
Forest Type
--Of which, virgin 3.6 3.5 3.3
--Of which, plantation 0.4 0.6 1.0
--Of which, other commercial (regrowth) 14.4 14.1 13.7
Forest Ownership
--Nationally owned and no commercial access 4.6 4.5 4.1
--Nationally owned, commercial loggingpermitted
13.5 13.1 12.9
--Other publicly owned land, no commercialaccess
0.0 0.0 0.0
--Other publicly owned, logging permitted 0.3 0.6 1.0
--privately owned commercial forest 0.0 0.0 0.0
Total Volume of Standing Timber na na na
--Of which, Commercial Timber na na na
Annual Timber Removal 1/ 5.30 million cum (ForPeninsular Malayisa only)
Annual Timber Growth Rate 2.0-2.5cum/ha/yr (For Pen.Msia only)
Annual Allowable Cut 46,040 ha (For Pen Msia only)
1/ If Removals exceeds growth rate, analyze impact in text.

GAIN Report #MY0029 Page 43 of 50
STRATEGIC INDICATOR TABLE: CONSTRUCTION MARKET
Country:Malaysia
Report Year: 1999 2000 2001
Total Housing Starts (number of units) na na na
--Of which, wood frame na na na
--Of which, steel, masonry, other materials na na na
--Of total starts, residential na na na
----Of residential, single family na na na
----Of residential, multi-family na na na
--Of total starts, commercial na na na
Total Value of Commercial Construction Market($US million)
na na na
Total Value of Repair and Remodeling Market($US million)
na na na
Are tariffs on softwood from the United Stateshigher, equal or lower than softwood importedfrom other countries? 1/
Equal
Are tariffs on plywood from the United Stateshigher, equal or lower than plywood importedfrom other countries? 1/
Equal
Are non-tariff barriers on softwood from theUnited States higher, equal or lower thansoftwood imported from other countries? 1/
Equal
Are non-tariff barriers on plywood from theUnited States higher, equal or lower than plywoodimported from other countries? 1/
Equal
Are there market development programs forconstruction, softwood or plywood importsfunded by foreign governments?
None
If yes, identify the following:
--Country(ies)
--Form(s) of competition: Export subsidy, tradeshow, trade servicing, permanent marketrepresentative (number), permanent office(location), or other. 2/
--Estimated annual market expansion outlay ($USmillion) by country

GAIN Report #MY0029 Page 44 of 50
Is the acceptability of U.S. style timber frameconstruction (i.e., per building codes, mortgageavailabity, etc.) high, medium or low? 3/
Medium
Are consumer preferences for solid woodmaterials vis-a-vis non-wood materials inconstruction high, medium or low? 3/
Meduim
From Post's experience, is the willingness ofU.S. suppliers to deliver product per importers'specifications low, medium or high? 3/
High
If price quotes for construction and structuralwood products are available, identify the leadingsource(s)
MalaysianInstitute ofArchitects andMalaysianInstitute ofInteriorDesigners
1/ If other than equal, explain in report text.
2/ If "other", then explain in report text.
3/ If low or medium, explain in report text.

GAIN Report #MY0029 Page 45 of 50
STRATEGIC INDICATORS TABLE: FURNITURE & INTERIORS MARKET
Country:Malaysia
Report Year: 1999 2000 2001
Total Housing Starts (number of units) na na na
Total Number of Households) na na na
Furniture Production ($US million) na na na
Interiors Market Size ($US million) na na na
Total Furniture Imports ($US million) 28.0 30.0 34.0
Total Furniture Exports ($US million) 1026 1100 1300
Are tariffs on hardwood from the United Stateshigher, equal or lower than hardwood importedfrom other countries? 1/
Equal
Are non-tariff barriers on hardwood from theUnited States higher, equal or lower thanhardwood imported from other countries? 1/
Equal
Are there market development programs forfurniture or interiors market expansion funded byforeign governments?
No
If yes, identify the following:
--Country(ies) 2/
--Form(s) of competition: Export subsidy, tradeshow, trade servicing, permanent marketrepresentative (number), permanent office(location), or other. 3/
--Estimated annual market expansion outlay ($USmillion) by country
From Post's experience, is the willingness ofU.S. suppliers to deliver product per importers'specifications low, medium or high? 4/
high
If price quotes for furniture and interiorsproducts are available, identify the leadingsource(s)
MalaysianFurnitureIndustry Council
1/ If other than equal, explain in text.
2/ If more than one country, report each countryindividually.

GAIN Report #MY0029 Page 46 of 50
3/ If "other", explain form of subsidy in text.
4/ If low or medium, explain in test.
STRATEGIC INDICATOR TABLE: MATERIALHANDLING MARKET
Country:Malaysia
Report Year: 1999 2000 2001
Total Value of Industrial Output ($US million) 14.5 15.8 17
New Pallet Production (million units) na na na
Are consumer preferences for solid wood palletsand packaging materials vis-a-vis non-woodmaterials high, medium or low? 1/
high
Are industry/trade preferences forrepaired/recycled pallets over new pallets low,medium or high? 1/
low
From Post's experience, is the willingness ofU.S. suppliers to deliver product per importers'specifications low, medium or high? 1/
na
Identify leading source(s) of price quotes: MalaysianPackagingAssociation
Are there market development programs for thematerials handling market expansion funded byforeign governments?
None
If yes, identify the following:
--Which Countries?
--Form(s) of competition: Export subsidy, tradeshow, trade servicing, permanent marketrepresentative (number), permanent office(location), or other. 2/
--Estimated annual market expansion outlay ($USmillion) by country
1/ If low or medium, explain in text of report.
2/ If "other", explain in text of report.
GAIN Report #MY0029 Page 47 of 50
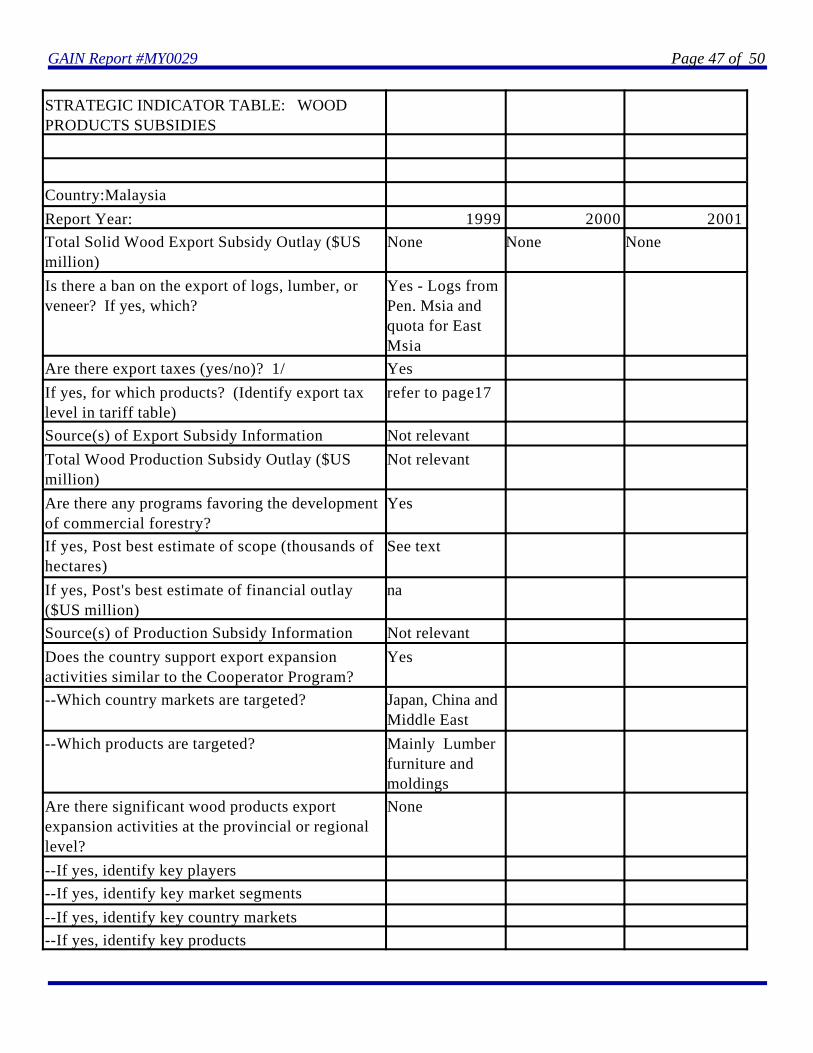
STRATEGIC INDICATOR TABLE: WOODPRODUCTS SUBSIDIES
Country:Malaysia
Report Year: 1999 2000 2001
Total Solid Wood Export Subsidy Outlay ($USmillion)
None None None
Is there a ban on the export of logs, lumber, orveneer? If yes, which?
Yes - Logs fromPen. Msia andquota for EastMsia
Are there export taxes (yes/no)? 1/ Yes
If yes, for which products? (Identify export taxlevel in tariff table)
refer to page17
Source(s) of Export Subsidy Information Not relevant
Total Wood Production Subsidy Outlay ($USmillion)
Not relevant
Are there any programs favoring the developmentof commercial forestry?
Yes
If yes, Post best estimate of scope (thousands ofhectares)
See text
If yes, Post's best estimate of financial outlay($US million)
na
Source(s) of Production Subsidy Information Not relevant
Does the country support export expansionactivities similar to the Cooperator Program?
Yes
--Which country markets are targeted? Japan, China andMiddle East
--Which products are targeted? Mainly Lumberfurniture andmoldings
Are there significant wood products exportexpansion activities at the provincial or regionallevel?
None
--If yes, identify key players
--If yes, identify key market segments
--If yes, identify key country markets
--If yes, identify key products

GAIN Report #MY0029 Page 48 of 50
--Post's estimate for combined outlay ($USmillion)
Source(s) of Provincial/Regional SupportInformation
Are there other wood products export expansionactivities? If yes, describe in report.
Yes

GAIN Report #MY0029 Page 49 of 50
STRATEGIC INDICATORTABLE: FORESTPRODUCT TARIFFS ANDTAXES (percent)
Tariff Tariff Other
Country: Product Current Following
Import TotalCost
Export
Report Year: Description 1/ Year Year Taxes/Fees of Import Tax
4401 Fuel Wood 20% 20% 0
4403 Wood in rough 0 0 0 to 15%
4404 Poles/piles 10 to20%
10 to20%
0
4405 Wood wood/flour 5 to 20% 5 to 20% 0
4406 Rail Sleepers 5% 5% 0
4407 Lumber, sawnlengthwise
0 0 0
4408 Veneer/plywood 0 to 20% 0 to 20% 0
4409 Lumber, molded androunded
20% 20% 0
4410 Particle Board 20% 20% 0
4411 Fibreboard of wood 20% 20% 0
4412 Veneered Panel 25 to40%
25 to40%
0
4413 Densified wood 20% 20% 0
4414 Wooden frames 20% 20% 0
4415 Packingcases/pallets
20% 20% 0
4416 Cask/Barrel/Vat/Tub 20% 20% 0
4417 Tool/handles 20% 20% 0
4418 Builders' joinery 20% 20% 0
4419 Wooden tableware 20% 20% 0
4420 Jewellery cases 5 to 20% 0 to 20% 0
4421 Other woodenarticles
0 to 20% 0 to 20% 0
4422 na
4423 na

GAIN Report #MY0029 Page 50 of 50
4424 na
4425 na
Pre-fabricated Houses, asubsection under chapter 96
9406 Prefab building-wood25%
5 to 30% 25% 0
1/ Insert additional lines forCommodity tariffidentification should tariffsvary within
the four-digit designation.