gaia dr2 rr lyrae. anatomy of an ancient major merger · mnras 000,1{13(2018) preprint 16 october...
TRANSCRIPT
MNRAS 000, 1–13 (2018) Preprint 16 October 2018 Compiled using MNRAS LATEX style file v3.0
The shape of the Galactic halo with Gaia DR2 RR Lyrae.Anatomy of an ancient major merger
Giuliano Iorio1? and Vasily Belokurov1,2†1Institute of Astronomy, University of Cambridge, Madingley Road, Cambridge CB3 0HA, UK2Centre for Computational Astrophysics, Flatiron Institute, 162 5th Avenue, New York, NY 10010, USA
Accepted XXX. Received YYY; in original form ZZZ
ABSTRACT
We use the Gaia DR2 RR Lyrae sample to gain an uninterrupted view of theGalactic stellar halo. We dissect the available volume in slices parallel to the MilkyWay’s disc to show that within ∼ 30 kpc from the Galactic centre the halo is triaxial,with the longest axis misaligned by ∼ 70◦ with respect to the Galactic x-axis. Thisanatomical procedure exposes two large diffuse over-densities aligned with the semi-major axis of the halo: the Hercules-Aquila Cloud and the Virgo Over-density. Wereveal the kinematics of the entire inner halo by mapping out the amplitudes anddirections of the RR Lyrae proper motions. These are then compared to simple modelswith different anisotropies to demonstrate that the inner halo is dominated by starson highly eccentric orbits. We interpret the shape of the density and the kinematicsof the Gaia DR2 RR Lyrae as evidence in favour of a scenario in which the bulk ofthe halo was deposited in a single massive merger event.
Key words: galaxies: individual (Milky Way) – Galaxy: structure – Galaxy: stellarcontent – Galaxy: stellar halo – stars: (RR Lyrae) – Galaxy: kinematics
1 INTRODUCTION
In ΛCDM Cosmology, Dark Matter halos are rarely spheri-cal, their shapes controlled by the environment and the ac-cretion history (Frenk et al. 1988; Dubinski & Carlberg 1991;Warren et al. 1992; Colberg et al. 1999; Allgood et al. 2006;Bett et al. 2007; Hahn et al. 2007). At the early stages ofthe halo assembly, the shape is typically prolate and alignedwith the narrow filaments, via which the mass is supplied,but with passing of time, halos can become triaxial or evenoblate, as the feeding filaments swell and the direction of ac-cretion changes (e.g. Cole & Lacey 1996; Tormen 1997; Altayet al. 2006; Vera-Ciro et al. 2011; Libeskind et al. 2013). Thismetamorphosis does not necessarily imply that the memoryof the early halo configuration is completely erased. Instead,at redshift zero, the history of the Dark Matter halo evolu-tion may be deciphered by studying how its shape changeswith Galactocentric radius (e.g. Hayashi et al. 2007; Vera-Ciro et al. 2011). Note however, that inclusion of baryons(see e.g. Kazantzidis et al. 2004; Gnedin et al. 2004; De-battista et al. 2008; Abadi et al. 2010) or adaptation of adifferent Dark Matter model (e.g. Avila-Reese et al. 2001;
? [email protected]† [email protected]
Dave et al. 2001; Mayer et al. 2002; Peter et al. 2013) canaffect the details of some of the above calculations.
While the behavior of Dark Matter halos shows severalcoherent trends, stellar halos appear to display a wider di-versity, linked to the strong suppression of star formation inlow-mass Dark Matter clumps (see e.g. Bullock & Johnston2005; Cooper et al. 2010). One of the important corollariesof the above stochasticity is the expectation that the bulkof the (accreted) stellar halo of a Milky Way-like galaxy iscontributed by a small number of massive dwarf galaxies(see e.g. De Lucia & Helmi 2008; Deason et al. 2013). Thepicture therefore emerges in which the most massive haloprogenitors not only can define the shape of the stellar halo(see Deason et al. 2013) but also set its overall metallic-ity (Deason et al. 2016; D’Souza & Bell 2018). It is diffi-cult to produce stellar halos without invoking (at least someof) the processes that lead to formation of stars. The in-clusion of baryonic physics tends to alter the shapes of theresulting stellar halos significantly. For examples, the innerportions of the stellar halos built up with semi-analytic ma-chinery are often prolate (see e.g. Cooper et al. 2010), whilehydro-dynamical simulations deliver mostly oblate shapes(e.g. Monachesi et al. 2018). The prevalence of the oblateshapes in the simulated stellar halos is sometimes linked tothe significant contribution of so-called in-situ component
© 2018 The Authors
arX
iv:1
808.
0437
0v2
[as
tro-
ph.G
A]
15
Oct
201
8
2 G. Iorio and V. Belokurov
(Benson et al. 2004; Zolotov et al. 2009; McCarthy et al.2012; Tissera et al. 2013; Cooper et al. 2015).
Early attempts to gauge the properties of the MilkyWay’s stellar halo had to rely on the small number of trac-ers and/or sparse sky coverage (Preston et al. 1991; Reid &Majewski 1993; Sluis & Arnold 1998; Morrison et al. 2000;Siegel et al. 2002). Recently, thanks to the availability ofwide-area deep imaging data, the shape of the Milky Way’sstellar halo has been the focus of many studies (e.g. Newberg& Yanny 2006; Bell et al. 2008; Juric et al. 2008; Sesar et al.2011; Deason et al. 2011; Xue et al. 2015; Iorio et al. 2018).While surveys like the SDSS (see Alam et al. 2015) do pro-vide a much broader view of the halo (see e.g. Carollo et al.2007, 2010), large swathes of the sky are still missing, leavingportions of the inner Galaxy unmapped. Most recently, theGaia mission (see Gaia Collaboration et al. 2016) has pro-vided the first all-sky view of the Galactic halo. By combin-ing the variability statistics from Gaia DR1 with the colorinformation from Gaia and 2MASS, Iorio et al. (2018) builta sample of ∼22,000 RR Lyrae covering most of the celestialsphere, except for narrow regions close to the Galactic plane.Using these old and metal-poor pulsating stars and takingadvantage of largely un-interrupted view of the Galaxy, theywere able to test a wide range of stellar halo models.
In this Paper, we aim to use the Gaia DR2 RR Lyraestars to get both closer to the centre of the Milky Way and togo further beyond the reach of the Iorio et al. (2018) anal-ysis by linking the RR Lyrae density evolution with theirkinematics. Our study is motivated by the recent discoveryof tidal debris from what appears to be an ancient majormerger event (Belokurov et al. 2018b; Myeong et al. 2018b;Helmi et al. 2018) Identified first in the Solar neighbor-hood, this debris cloud, sometimes referred to as the “GaiaSausage” has recently been shown to dominate the Galac-tic stellar halo, stretching from regions in the Milky Way’sbulge to near and past the halo’s break radius around 20−30kpc (see Deason et al. 2018; Simion et al. 2018; Lancasteret al. 2018). Additional evidence has been found in the stud-ies of the detailed chemical abundances of the nearby halostars (see Hayes et al. 2018; Haywood et al. 2018; Mack-ereth et al. 2018). While many pieces of the “Gaia Sausage”have already been reported in the literature, here we attemptto provide the first comprehensive map of this largest halosub-structure. The kinematic portion of our study is com-plementary to the work of Wegg et al. (2018), who recentlyused a sample of PanSTARRS1 RR Lyrae stars to constrainthe shape of the inner portion of the Galactic gravitationalpotential.
This Paper is organized as follows. Section 2 describesthe construction of the clean sample of Gaia DR2 RR Lyraestars. In Section 3 we show how these objects can be usedto slice the Galactic halo to reveal the remnant of a largedwarf galaxy buried close to the Milky Way’s centre. In Sec-tion 4 we complement the spatial analysis with an all-skyRR Lyrae kinematic map and we discuss the implications ofour discovery. Finally, we summarise the conclusions of thiswork in Section 5.
2 THE Gaia DR2 RR LYRAE SAMPLE
2.1 RR Lyrae stars in Gaia DR2
The Gaia DR2 catalogue (Gaia Collaboration et al.2018a, 2016) contains 550,737 variable stars, amongwhich more than 200,000 are classified as RR Lyrae(RRL) stars (Holl et al. 2018). In the Gaia data, theRRL stars are spread across separate catalogues: someare in the tables reporting the results of the gen-eral variability analysis (e.g. vari_classifier_result andvari_time_series_statistics); others can be found in theSOS (Specific Object Studies, Clementini et al. 2018) tablevari_rrlyrae. For further details on the variable stars clas-sification and analysis in Gaia DR2 please see Holl et al.(2018). About half of the RRL stars are shared between theSOS and the other tables, thus in order to merge all clas-sified RRL stars into one final sample, we joined the tablevari_classifier_result and the table vari_rrlyrae usingthe source id unique identifier of each star. The final samplecontains 228,853 RRL stars (∼ 77% RRab, ∼ 21% RRc and∼ 2% RRd). Finally, this table containing all of the Gaia
DR2 RRL stars, was merged with the main gaia_source
catalogue, thus complementing the RRL positions with pho-tometry and astrometry.
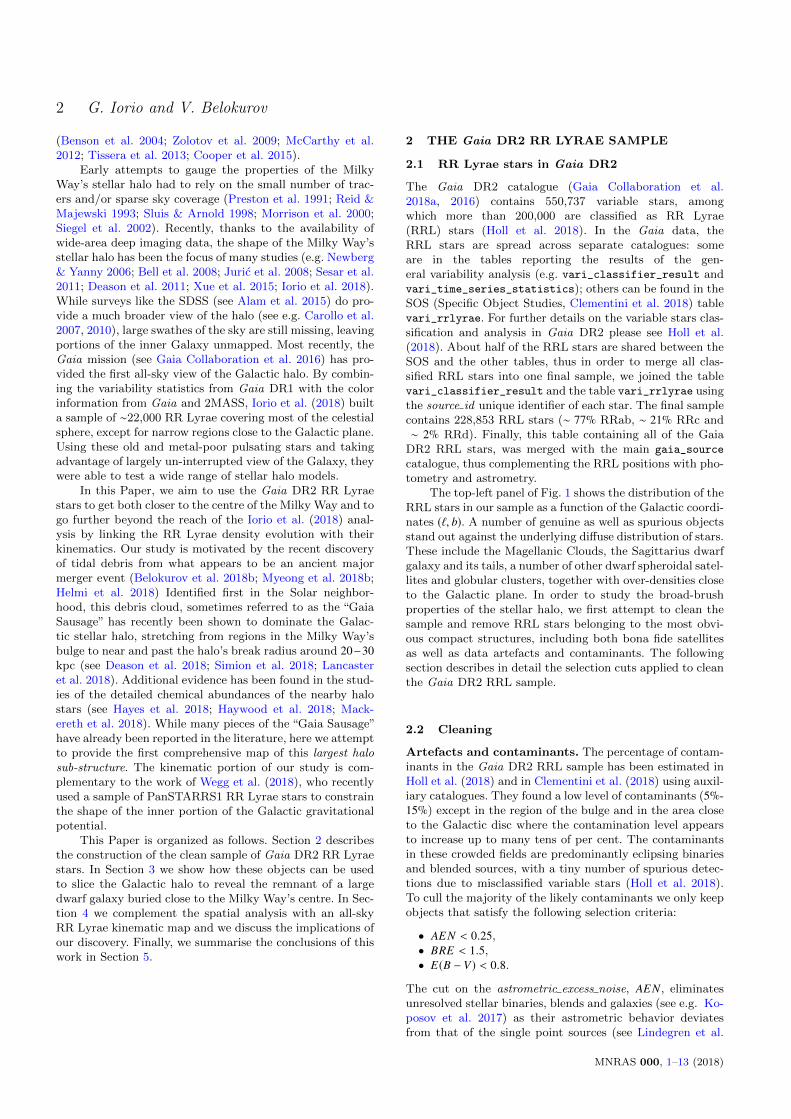
The top-left panel of Fig. 1 shows the distribution of theRRL stars in our sample as a function of the Galactic coordi-nates (`, b). A number of genuine as well as spurious objectsstand out against the underlying diffuse distribution of stars.These include the Magellanic Clouds, the Sagittarius dwarfgalaxy and its tails, a number of other dwarf spheroidal satel-lites and globular clusters, together with over-densities closeto the Galactic plane. In order to study the broad-brushproperties of the stellar halo, we first attempt to clean thesample and remove RRL stars belonging to the most obvi-ous compact structures, including both bona fide satellitesas well as data artefacts and contaminants. The followingsection describes in detail the selection cuts applied to cleanthe Gaia DR2 RRL sample.
2.2 Cleaning
Artefacts and contaminants. The percentage of contam-inants in the Gaia DR2 RRL sample has been estimated inHoll et al. (2018) and in Clementini et al. (2018) using auxil-iary catalogues. They found a low level of contaminants (5%-15%) except in the region of the bulge and in the area closeto the Galactic disc where the contamination level appearsto increase up to many tens of per cent. The contaminantsin these crowded fields are predominantly eclipsing binariesand blended sources, with a tiny number of spurious detec-tions due to misclassified variable stars (Holl et al. 2018).To cull the majority of the likely contaminants we only keepobjects that satisfy the following selection criteria:
• AEN < 0.25,• BRE < 1.5,• E(B − V) < 0.8.
The cut on the astrometric excess noise, AEN, eliminatesunresolved stellar binaries, blends and galaxies (see e.g. Ko-posov et al. 2017) as their astrometric behavior deviatesfrom that of the single point sources (see Lindegren et al.
MNRAS 000, 1–13 (2018)
The Galactic halo shape with Gaia DR2 RR Lyrae 3
1000100 [deg]
50
0
50
b [d
eg]
N = 228853All stars (1,300)
1000100 [deg]
50
0
50
b [d
eg]
N = 93345Clean sample (1,150)
1000100 [deg]
50
0
50
b [d
eg]
N = 112884Rejected stars (1,150)
1000100 [deg]
50
0
50
b [d
eg]
N = 48175Stars in known GCs and satellites (1,300)
Figure 1. All-sky RR Lyrae density maps in Galactic coordinates (`, b). Top-left: original sample of stars classified as RR Lyrae inGaia DR2. Top-right: clean sample of RR Lyrae stars used in this work. Bottom-left: objects filtered from the original sample using
a combination of photometric and astrometric selection cuts. Bottom-right: stars in the original sample belonging to known globularclusters, dwarf spheroidal satellites, the Sagittarius dwarf and a part of its stream and the Magellanic Clouds. The numbers in brackets
in the title of each panel indicate the dynamic range of the grey-scale map; the number in the top-left corner indicates the total number
of stars in each panel.
2012). The phot bp rp excess factor, BRE, represents the ra-tio between the combined flux in the Gaia BP and RP bandsand the flux in the G band, and thus by design is large forblended sources (see Evans et al. 2018). Finally, we removestars in regions with high reddening, E(B −V) (according toSchlegel et al. 1998), for which the dust extinction correctionis likely unreliable (see Sec. 3.1).
Globular clusters and dwarf satellites. We haveremoved all stars within twice the half-light radius of allknown globular clusters listed in Harris (2010). Concerningthe dwarf spheroidal satellites, we excluded all stars withinan angular distance of 0.5◦ from the centre of Carina, UrsaMinor and Hercules, 0.3◦ from Leo I and Leo II, and 1◦ fromSculptor, Fornax, Draco and Sextans.
Sagittarius dwarf. First, we selected all stars with|B− BSgr | < 10◦ and |Λ− ΛSgr | < 50◦, where B and Λ are thelatitude and longitude in the coordinate system aligned withthe Sagittarius stream as defined in Belokurov et al. (2014)and BSgr = 4.24◦ and ΛSgr = −1.55◦ represent the position ofthe Sagittarius dwarf. Then, among the selected objects, wegot rid of all stars with a proper motion relative to Sagit-tarius lower than 1.3 mas yr−1, using the dwarf’s propermotion as reported in Gaia Collaboration et al. (2018b).These spatial and kinematical selection cuts appear to beeffective in removing the Sagittarius dwarf and the initialportions of its tails, as demonstrated in Fig. 1. We havedecided against extending the filter to the rest of the Sagit-
tarius stream (|Λ − ΛSgr | > 50◦) to avoid over-cleaning oursample at large Galactic latitudes.
Magellanic Clouds. In order to identify (and remove)the stars that belong to the Clouds, we selected all ob-jects within an angular distance of 16◦ (12◦) from the LMC(SMC). Of these, only the stars with proper motion relativeto the LMC or to the SMC lower than 5 mas yr−1 with re-spect to the values reported in van der Marel & Sahlmann(2016) were retained for further consideration. Given theexpected G magnitude of the RRL stars at the distance ofthe LMC and SMC (Belokurov et al. 2017), we requiredthe Magellanic stars to have 18.5 < G < 20 (G correctedfor the extinction, see Sec. 3.1). Finally, in order to avoidthe crowded central part of the Clouds, we selected all starswithin 5◦ from the LMC and SMC centre, independently oftheir proper motions and G magnitudes. The stars that sur-vived all of the selection cuts above were removed from ourRRL sample.
The sky distribution of the likely artefacts discarded bythe astrometric and the photometric cuts described above isshown in the bottom-left panel of Fig. 1. As expected, mostof the contaminants are located close to the Galactic plane,while others can be found in the crowded regions of theMagellanic Clouds and the Sagittarius dwarf galaxy. Thedistribution of the (removed) stars projected to lie withinknown Galactic satellites (globular clusters, dwarf galaxies)is shown in the bottom right-panel. The stellar density dis-
MNRAS 000, 1–13 (2018)
4 G. Iorio and V. Belokurov
tribution in the final clean sample containing ∼93,000 RRLstars is shown in the top-right panel.
3 GALACTIC HALO SHAPE WITH Gaia DR2RR LYRAE
3.1 RR Lyrae distances
In the analysis presented below, we use a left-handed Carte-sian reference frame (x, y, z) centred in the Galactic centre asdefined in Iorio et al. (2018). In this reference frame, the Sunis at (8, 0, 0) kpc. Despite the photometric variability, RRLstars have an almost constant absolute magnitude in the vi-sual (see e.g. Catelan et al. 2004). Thus having measured theapparent magnitudes G (corrected for the dust extinction),we can directly estimate the heliocentric distances as
log(
D�kpc
)=
G − MG
5− 2. (1)
Before applying Eq. 1, we correct the observed apparentmagnitudes for the dust extinction and estimate MG ex-ploiting the stars in our sample with robust parallax mea-surements.
Dust extinction. The G band absorption AG =
kGE(B − V) for the RRab stars has been estimated in theSOS (Clementini et al. 2018) through the empirical relationderived by Piersimoni et al. (2002). We used these stars to di-rectly estimate the extinction coefficient kG = AG/E(B −V),where the reddening E(B − V) is obtained from the mapsof Schlegel et al. (1998). The derived kG distribution showsa narrow peak at 1 < kG < 3.4. We fit a Gaussian modelto the measurements of stars inside this kG range takinginto account the errors with the help of the extreme decon-volution technique (ED, Bovy Jo et al. 2011). The best-fitcentroid is at kG = 2.27, i.e. a value slightly lower comparedto that reported previously (e.g. Belokurov et al. 2017). Tosummarise, the observed apparent magnitudes of all stars inour sample have been corrected using AG = 2.27E(B − V).
Absolute magnitude in the G band. Inverting Eq.1 and using the parallax $, the absolute magnitude can beestimated as
MG = G + 5 log$ − 10. (2)
We selected 837 stars from the clean sample i) with robustestimates of the parallax ($/δ$ > 10) and ii) located inregions where the correction for dust extinction is almostnegligible, i.e. E(B − V) < 0.1. Before using Eq. 2, we cor-rected the parallaxes for the offset $ = 0.029 reported inLindegren et al. (2018) (see also Muraveva et al. 2018).The estimated MG distribution exhibits a narrow peak for|MG | < 1.5. As in the case of the reddening coefficient de-scribed above, the distribution was modeled as a Gaussiantaking into account the errors in $ using the ED machin-ery. The best-fit centroid is at MG = 0.64 and the best-fitdispersion is σMG
= 0.25. We estimated the possible sys-tematic effects repeating the analysis considering only thestars classified as RRab (MG = 0.64) or RRc (MG = 0.60) inthe SOS and considering only the metal poor [Fe/H] < −1.0(MG = 0.58) and the metal rich [Fe/H] > −1.0 (MG = 0.72)
HAC
VOD
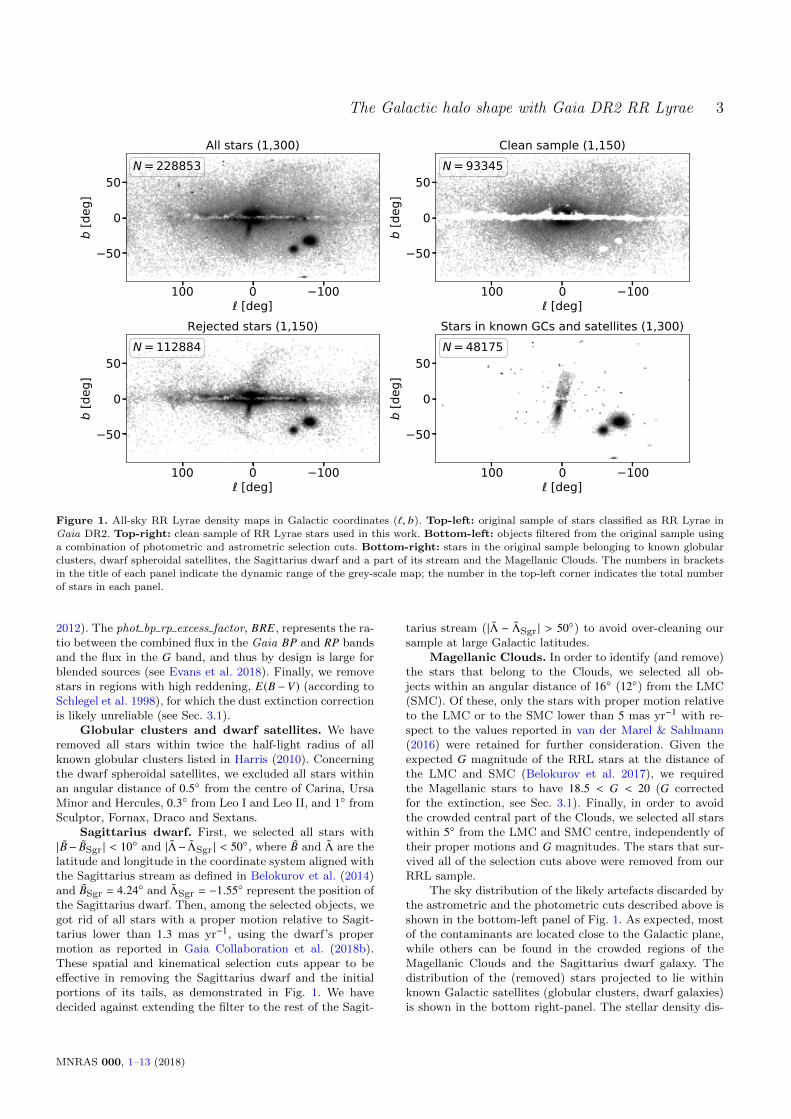
Figure 2. RR Lyrae density projected onto x − y plane for threepairs of z slabs. The two slabs in each pair are positioned symmet-
rically with respect to the Galactic plane. The z range is reported
in the title of each panel. Yellow star indicates the position of theSun (x = 8 kpc, y = z = 0 kpc). Dynamic range of the greyscale
map is given in brackets in the bottom-right corner in each panel.Blue lines indicate the orientation of the major axis of the triaxial
stellar halo model described in Iorio et al. (2018). The red arrows
point out the location of the Hercules-Aquila Cloud (HAC) andthe Virgo Over-Density (VOD).
stars1. We also repeated the analysis not correcting for theparallax offset (MG = 0.45) or using the distance estimatedfrom the parallaxes in Bailer-Jones et al. (2018) (MG = 0.66).Overall all the systematic differences are within the mea-sured spread in MG . For the rest of the paper, we considerMG = 0.64 for all the stars in our clean sample. Note thata difference in magnitude of 0.25 corresponds to an uncer-tainty in distance of ∼1 kpc for a star at 10 kpc and ∼4 kpcfor a star at 50 kpc. Using apparent magnitudes corrected fordust extinction and applying the assumed (constant) valueof the absolute magnitude, we estimated the distance (Eq.1) and the Galactocentric Cartesian (x, y, z) coordinates ofeach RRL star in our clean sample.
1 We used the metallicities reported in the SOS catalogue, seeClementini et al. (2018) for further details
MNRAS 000, 1–13 (2018)
The Galactic halo shape with Gaia DR2 RR Lyrae 5
40 20 0 20 40x [kpc]
40
20
0
20
40
y [k
pc]
DataTriaxial model
20 10 0 10 20x [kpc]
20
15
10
5
0
5
10
15
20
z [kp
c]
201001020y [kpc]
20
15
10
5
0
5
10
15
20
z [kp
c]
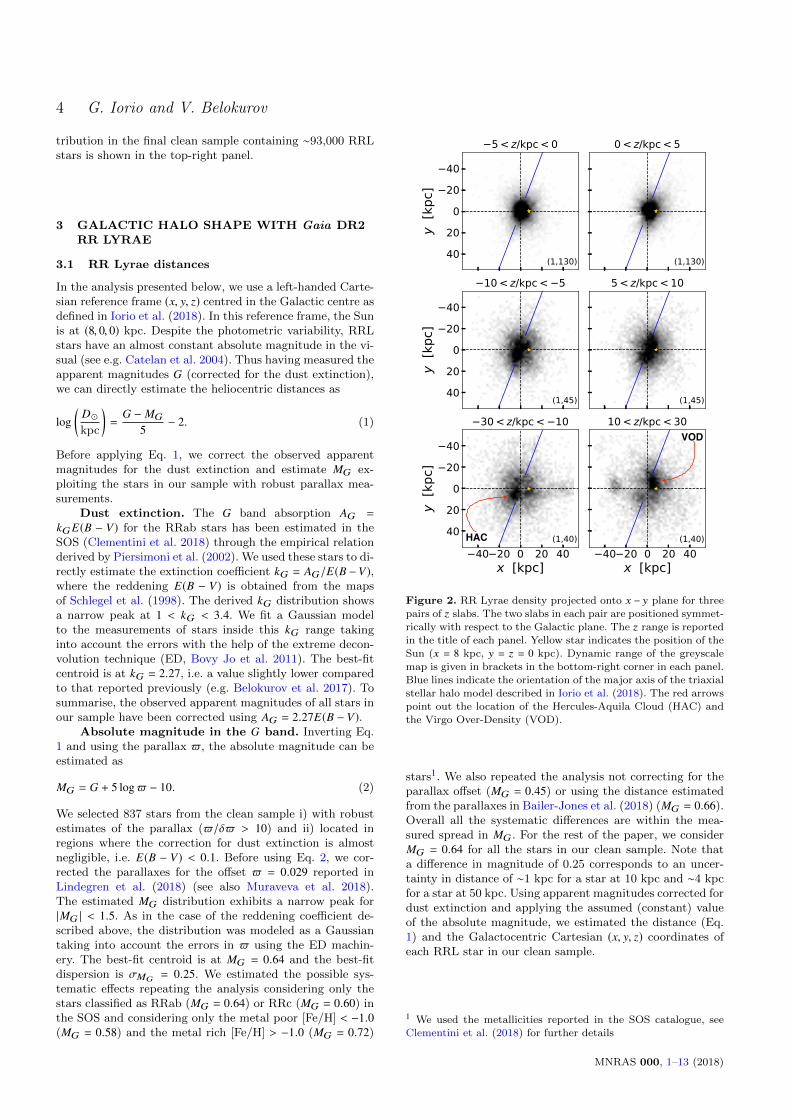
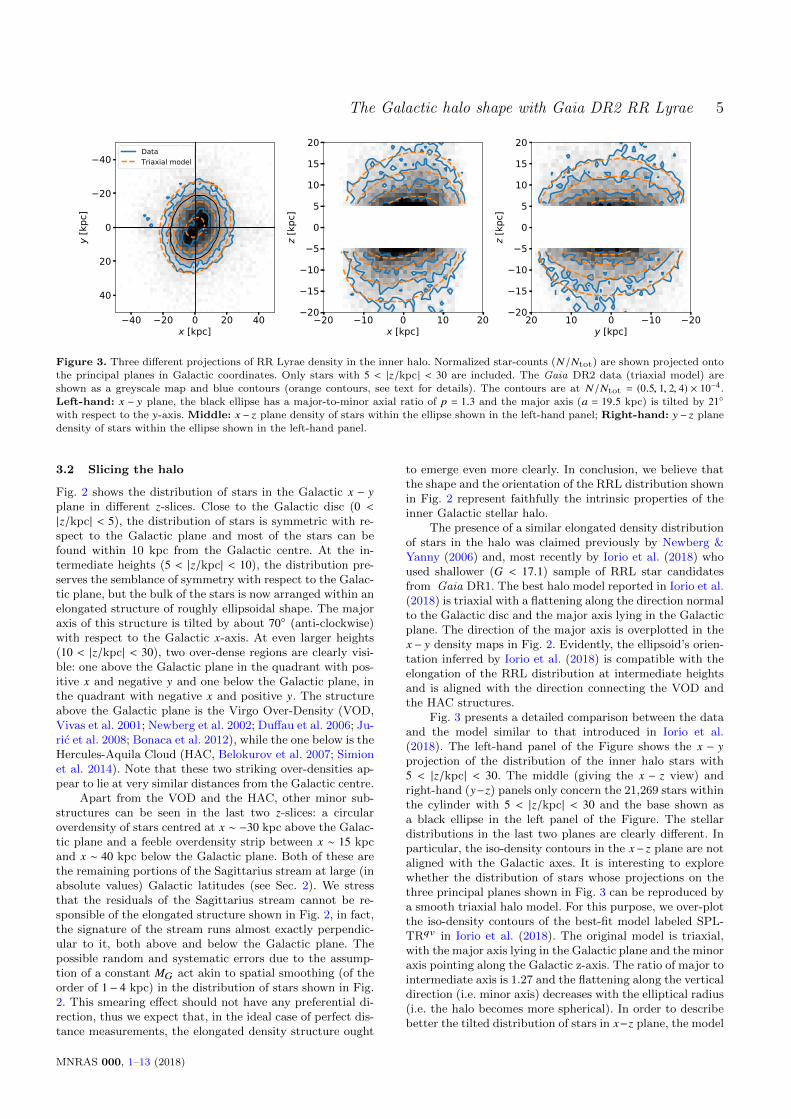
Figure 3. Three different projections of RR Lyrae density in the inner halo. Normalized star-counts (N/Ntot) are shown projected ontothe principal planes in Galactic coordinates. Only stars with 5 < |z/kpc | < 30 are included. The Gaia DR2 data (triaxial model) are
shown as a greyscale map and blue contours (orange contours, see text for details). The contours are at N/Ntot = (0.5, 1, 2, 4) × 10−4.
Left-hand: x − y plane, the black ellipse has a major-to-minor axial ratio of p = 1.3 and the major axis (a = 19.5 kpc) is tilted by 21◦with respect to the y-axis. Middle: x − z plane density of stars within the ellipse shown in the left-hand panel; Right-hand: y − z plane
density of stars within the ellipse shown in the left-hand panel.
3.2 Slicing the halo
Fig. 2 shows the distribution of stars in the Galactic x − y
plane in different z-slices. Close to the Galactic disc (0 <
|z/kpc| < 5), the distribution of stars is symmetric with re-spect to the Galactic plane and most of the stars can befound within 10 kpc from the Galactic centre. At the in-termediate heights (5 < |z/kpc| < 10), the distribution pre-serves the semblance of symmetry with respect to the Galac-tic plane, but the bulk of the stars is now arranged within anelongated structure of roughly ellipsoidal shape. The majoraxis of this structure is tilted by about 70◦ (anti-clockwise)with respect to the Galactic x-axis. At even larger heights(10 < |z/kpc| < 30), two over-dense regions are clearly visi-ble: one above the Galactic plane in the quadrant with pos-itive x and negative y and one below the Galactic plane, inthe quadrant with negative x and positive y. The structureabove the Galactic plane is the Virgo Over-Density (VOD,Vivas et al. 2001; Newberg et al. 2002; Duffau et al. 2006; Ju-ric et al. 2008; Bonaca et al. 2012), while the one below is theHercules-Aquila Cloud (HAC, Belokurov et al. 2007; Simionet al. 2014). Note that these two striking over-densities ap-pear to lie at very similar distances from the Galactic centre.
Apart from the VOD and the HAC, other minor sub-structures can be seen in the last two z-slices: a circularoverdensity of stars centred at x ∼ −30 kpc above the Galac-tic plane and a feeble overdensity strip between x ∼ 15 kpcand x ∼ 40 kpc below the Galactic plane. Both of these arethe remaining portions of the Sagittarius stream at large (inabsolute values) Galactic latitudes (see Sec. 2). We stressthat the residuals of the Sagittarius stream cannot be re-sponsible of the elongated structure shown in Fig. 2, in fact,the signature of the stream runs almost exactly perpendic-ular to it, both above and below the Galactic plane. Thepossible random and systematic errors due to the assump-tion of a constant MG act akin to spatial smoothing (of theorder of 1 − 4 kpc) in the distribution of stars shown in Fig.2. This smearing effect should not have any preferential di-rection, thus we expect that, in the ideal case of perfect dis-tance measurements, the elongated density structure ought
to emerge even more clearly. In conclusion, we believe thatthe shape and the orientation of the RRL distribution shownin Fig. 2 represent faithfully the intrinsic properties of theinner Galactic stellar halo.
The presence of a similar elongated density distributionof stars in the halo was claimed previously by Newberg &Yanny (2006) and, most recently by Iorio et al. (2018) whoused shallower (G < 17.1) sample of RRL star candidatesfrom Gaia DR1. The best halo model reported in Iorio et al.(2018) is triaxial with a flattening along the direction normalto the Galactic disc and the major axis lying in the Galacticplane. The direction of the major axis is overplotted in thex − y density maps in Fig. 2. Evidently, the ellipsoid’s orien-tation inferred by Iorio et al. (2018) is compatible with theelongation of the RRL distribution at intermediate heightsand is aligned with the direction connecting the VOD andthe HAC structures.
Fig. 3 presents a detailed comparison between the dataand the model similar to that introduced in Iorio et al.(2018). The left-hand panel of the Figure shows the x − y
projection of the distribution of the inner halo stars with5 < |z/kpc| < 30. The middle (giving the x − z view) andright-hand (y−z) panels only concern the 21,269 stars withinthe cylinder with 5 < |z/kpc| < 30 and the base shown asa black ellipse in the left panel of the Figure. The stellardistributions in the last two planes are clearly different. Inparticular, the iso-density contours in the x− z plane are notaligned with the Galactic axes. It is interesting to explorewhether the distribution of stars whose projections on thethree principal planes shown in Fig. 3 can be reproduced bya smooth triaxial halo model. For this purpose, we over-plotthe iso-density contours of the best-fit model labeled SPL-TRqv in Iorio et al. (2018). The original model is triaxial,with the major axis lying in the Galactic plane and the minoraxis pointing along the Galactic z-axis. The ratio of major tointermediate axis is 1.27 and the flattening along the verticaldirection (i.e. minor axis) decreases with the elliptical radius(i.e. the halo becomes more spherical). In order to describebetter the tilted distribution of stars in x−z plane, the model
MNRAS 000, 1–13 (2018)
6 G. Iorio and V. Belokurov
was modified by adding a rotation around the major axis ofβ = 20◦ (see Iorio et al. 2018 for a detailed description of thetilt angles formalism). Curiously, this model is similar tothe best-fit triaxial halo model found in Newberg & Yanny(2006), except for the variation of the vertical flattening. Thematch between the data and the model is impressive, espe-cially considering that the fit was performed exploiting onlya limited portion of the halo’s volume (Newberg & Yanny2006; Iorio et al. 2018). Note, however, that according to theleft-hand panel in Fig. 3, it is not possible to reproduce thedouble peak in the projection of the density onto the x − y
plane. These two off-centered over-densities correspond tothe VOD and the HAC.
Overall, the picture that emerges from Fig. 2 and Fig.3 is that of a triaxial stellar halo, misaligned with respectto the x-axis and possibly misaligned with respect to theGalactic plane. The latter statement is less certain due tothe presence of two large stellar over-densities, the VOD (inthe Galactic North) and the HAC (in the South). Theselarge and diffuse Clouds nonetheless appear to be connectedto the stellar halo’s ellipsoid, being arranged approximatelyalong its major axis.
4 ANATOMY OF AN ANCIENT MAJORMERGER
Confronted with the image of the stretched, likely triaxialinner stellar halo as revealed in Figures 2 and 3, it is diffi-cult to envisage a scenario in which such a structure emergesnaturally as a result of multiple randomly oriented accretionevents. On the other hand, major mergers tend to produceexactly such a configuration of debris - an ellipsoid elon-gated in the direction of the collision (e.g. Moore et al. 2004;Cooper et al. 2010). Even if the post-merger halo is nearlyaxi-symmetric e.g. prolate, the shape can evolve with time,under the influence of the growing baryonic component (seee.g. Debattista et al. 2008; Bryan et al. 2013; Tomassettiet al. 2016).
Coincidentally, weighty evidence for an old accretionevent of a massive satellite on a low angular momentum or-bit has recently been uncovered in the Milky Way (see Be-lokurov et al. 2018b; Myeong et al. 2018b; Helmi et al. 2018;Haywood et al. 2018). The give-away sign that the objectthat merged with the Galaxy was massive is the metallicitydistribution of its tidal debris which reaches [Fe/H]∼ −1 (orperhaps, even higher). The independent confirmation of theprogenitor’s high mass comes from the discovery of a largenumber of Globular Clusters likely associated with the event(e.g. Myeong et al. 2018a; Kruijssen et al. 2018). The geome-try of the impact can be gleaned from the orbital anisotropyof the accreted stars: typical values of β ∼ 0.9 (the extremestretching of the velocity ellipsoid gained this halo compo-nent the name “Gaia Sausage”) correspond to eccentricitiesnot too far from 1. This head-on collision appears to havesprayed stars all over the Milky Way, dominating the stellarhalo out to ∼ 30 kpc as evidenced from the recent studiesof the orbital properties of a variety of halo tracers acrossa wide range of Galactocentric distances (Bird et al. 2018;Deason et al. 2018; Lancaster et al. 2018). Finally, usinga sample of RRL stars with radial velocities, Simion et al.(2018) found that the HAC and VOD can also be linked to
this event, representing some of the less mixed portions ofits tidal debris. In the face of the evidence above, the ob-vious question is whether some or most of the stars in thetriaxial structure revealed here (see Sec. 3.2) belong to the“Gaia Sausage”.
With this conjecture in mind, we set out to explore thekinematics of the RRL stars in the inner portions of theMilky Way’s halo.
4.1 RR Lyrae kinematics
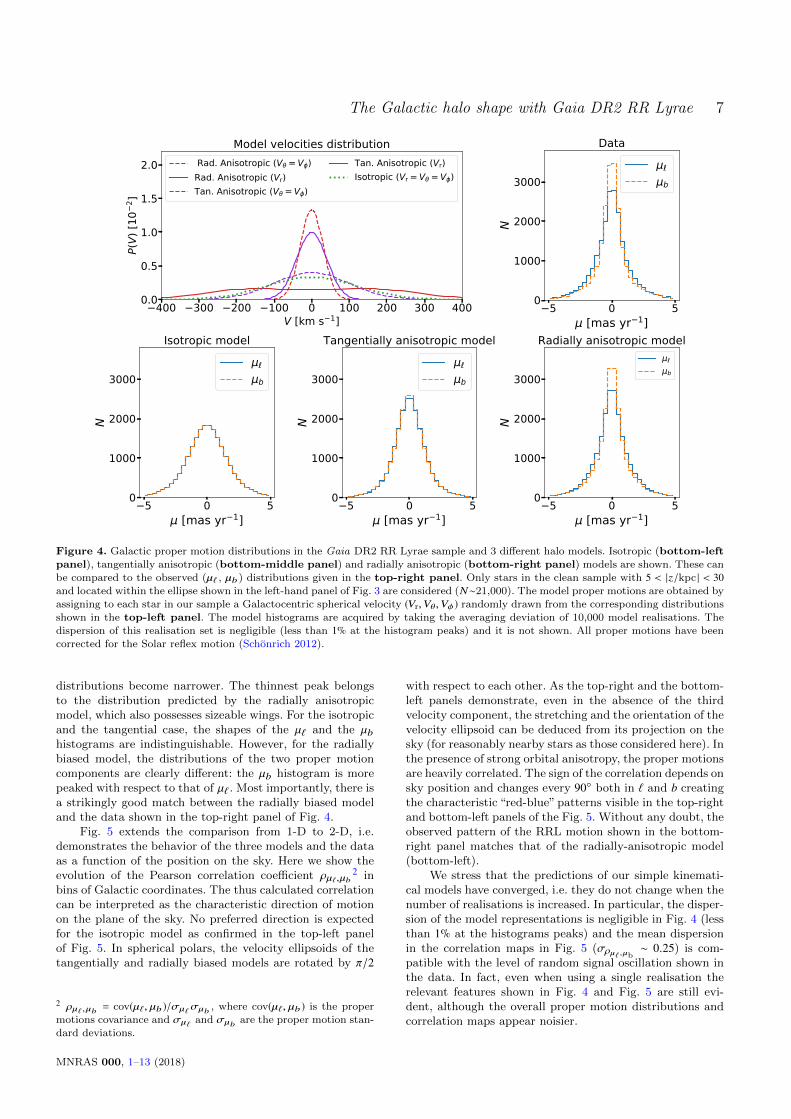
Unfortunately, with only the proper motions measurementsat our disposal, we cannot directly study the orbital prop-erties of the RRL stars in our sample. Recently Wegget al. (2018) circumvented this limitation using a sampleof PanSTARRS1 RRL stars in Gaia DR2 and marginalisingover the unknown line-of-sight velocity component. In thiswork, we decided to use a simpler, but nonetheless effectiveand illuminating approach. In particular, we compare theobserved proper motions distributions to the predictions ofseveral simplified halo models. More precisely, we generatemock proper motions values for the stars in our sample as-suming i) complete orbital isotropy, ii) high radial anisotropy(similar to the “Gaia Sausage”) as well as iii) strong tangen-tial anisotropy. The model velocity distributions in Galacto-centric spherical coordinates are shown in the top-left panelof Fig. 4. The isotropic model is composed of Gaussianvelocity distributions with σθ = σφ = σr = 120 km s−1.The radially anisotropic model is inspired by that used inNecib et al. (2018) and Lancaster et al. (2018). Namely,the Vr distribution contains two Gaussians with peaks atVr = ±160 km s−1 and σr = 130 km s−1, while the Vθ andVφ distribution are single Gaussians centred in 0 and with
σθ = σφ = 30 km s−1. Therefore, this model correspondsto the extreme orbital anisotropy of β ∼ 0.96, similar tothat observed for the “Gaia Sausage” stars (Belokurov et al.2017; Myeong et al. 2018b; Simion et al. 2018). The tan-gentially biased model uses Gaussian velocity distributionswith σθ = σφ = 100 km s−1 and σr = 40 km s−1, these val-ues are arbitrary and have been set to reproduce a strongtangential anisotropy (β = −5.25) maintaining roughly thesame velocity range of the isotropic and radially anisotropicmodels (see Fig. 4). Note, however, that β of our tangentiallyanisotropic model is somewhat lower (signifying a strongeranisotropy) than the lowest anisotropy estimates based onstellar tracers in the Milky Way stellar halo. (see e.g. Kafleet al. 2012; King et al. 2015). In the analysis that follows,we focus only on the ∼21,000 stars belonging to the triaxialstructure highlighted in Sec. 3.2, i.e. those within the regionwith 5 < |z/kpc| < 30 and inside the black ellipse shownin the left-hand panel of Fig. 3. In practice, for each RRLstar in our sample, we draw (Vr,Vθ,Vφ) randomly from thedistributions discussed above. Then, given the fully definedpositions and velocity vectors, we derive the model propermotions (µ`, µb). The final model predictions (see below) areobtained by averaging over 10,000 model realisations.
Armed with the halo models, we compress the kinematicinformation into two simple plots. First, as shown in Fig. 4we compare the 1-D distributions of µ` and µb across the en-tire sample of stars considered. From isotropic, through tan-gentially to radially anisotropic models, the proper motion
MNRAS 000, 1–13 (2018)
The Galactic halo shape with Gaia DR2 RR Lyrae 7
400 300 200 100 0 100 200 300 400V [km s 1]
0.0
0.5
1.0
1.5
2.0
P(V)
[10
2 ]Model velocities distribution
Rad. Anisotropic (V = V )Rad. Anisotropic (Vr)Tan. Anisotropic (V = V )
Tan. Anisotropic (Vr)Isotropic (Vr = V = V )
5 0 5[mas yr 1]
0
1000
2000
3000
N
Isotropic model
b
5 0 5[mas yr 1]
0
1000
2000
3000
N
Radially anisotropic model
b
5 0 5[mas yr 1]
0
1000
2000
3000
N
Data
b
5 0 5[mas yr 1]
0
1000
2000
3000
N
Tangentially anisotropic model
b
Figure 4. Galactic proper motion distributions in the Gaia DR2 RR Lyrae sample and 3 different halo models. Isotropic (bottom-left
panel), tangentially anisotropic (bottom-middle panel) and radially anisotropic (bottom-right panel) models are shown. These can
be compared to the observed (µ` , µb) distributions given in the top-right panel. Only stars in the clean sample with 5 < |z/kpc | < 30and located within the ellipse shown in the left-hand panel of Fig. 3 are considered (N∼21,000). The model proper motions are obtained by
assigning to each star in our sample a Galactocentric spherical velocity (Vr,Vθ,Vφ ) randomly drawn from the corresponding distributions
shown in the top-left panel. The model histograms are acquired by taking the averaging deviation of 10,000 model realisations. Thedispersion of this realisation set is negligible (less than 1% at the histogram peaks) and it is not shown. All proper motions have been
corrected for the Solar reflex motion (Schonrich 2012).
distributions become narrower. The thinnest peak belongsto the distribution predicted by the radially anisotropicmodel, which also possesses sizeable wings. For the isotropicand the tangential case, the shapes of the µ` and the µbhistograms are indistinguishable. However, for the radiallybiased model, the distributions of the two proper motioncomponents are clearly different: the µb histogram is morepeaked with respect to that of µ` . Most importantly, there isa strikingly good match between the radially biased modeland the data shown in the top-right panel of Fig. 4.
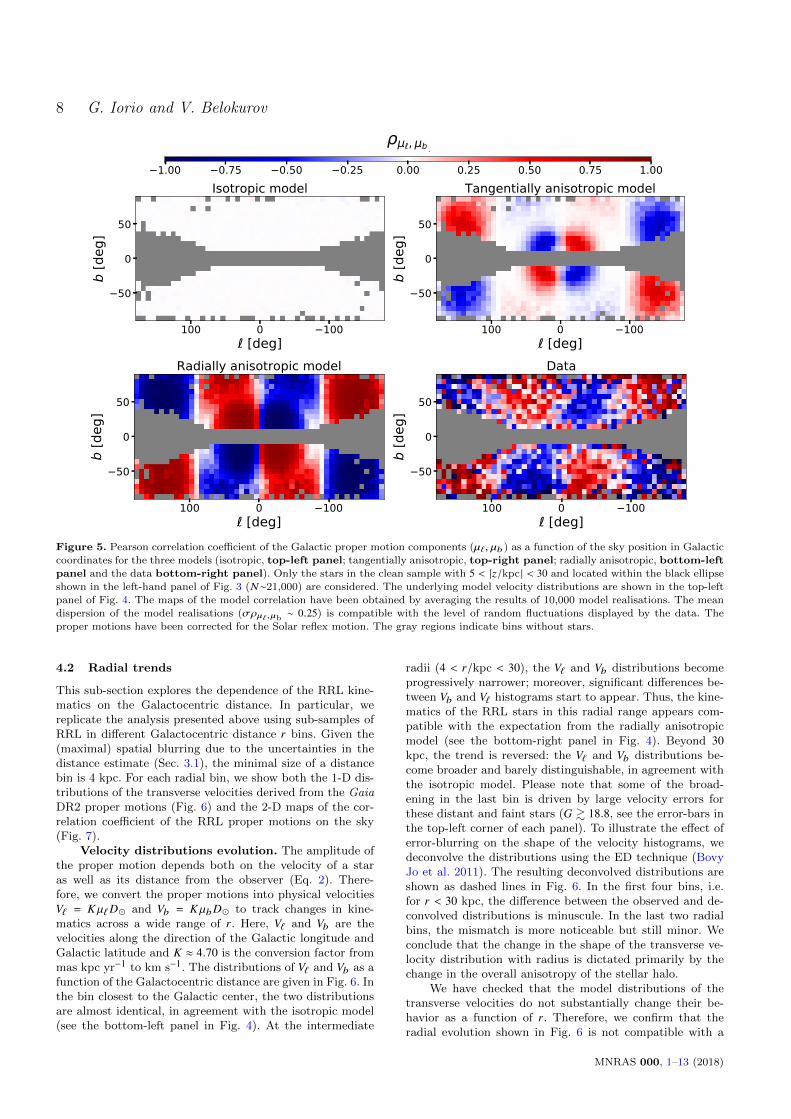
Fig. 5 extends the comparison from 1-D to 2-D, i.e.demonstrates the behavior of the three models and the dataas a function of the position on the sky. Here we show theevolution of the Pearson correlation coefficient ρµ`,µb
2 inbins of Galactic coordinates. The thus calculated correlationcan be interpreted as the characteristic direction of motionon the plane of the sky. No preferred direction is expectedfor the isotropic model as confirmed in the top-left panelof Fig. 5. In spherical polars, the velocity ellipsoids of thetangentially and radially biased models are rotated by π/2
2 ρµ` ,µb = cov(µ`, µb )/σµ`σµb , where cov(µ`, µb ) is the propermotions covariance and σµ` and σµb are the proper motion stan-
dard deviations.
with respect to each other. As the top-right and the bottom-left panels demonstrate, even in the absence of the thirdvelocity component, the stretching and the orientation of thevelocity ellipsoid can be deduced from its projection on thesky (for reasonably nearby stars as those considered here). Inthe presence of strong orbital anisotropy, the proper motionsare heavily correlated. The sign of the correlation depends onsky position and changes every 90◦ both in ` and b creatingthe characteristic “red-blue” patterns visible in the top-rightand bottom-left panels of the Fig. 5. Without any doubt, theobserved pattern of the RRL motion shown in the bottom-right panel matches that of the radially-anisotropic model(bottom-left).
We stress that the predictions of our simple kinemati-cal models have converged, i.e. they do not change when thenumber of realisations is increased. In particular, the disper-sion of the model representations is negligible in Fig. 4 (lessthan 1% at the histograms peaks) and the mean dispersionin the correlation maps in Fig. 5 (σρµ` ,µb ∼ 0.25) is com-patible with the level of random signal oscillation shown inthe data. In fact, even when using a single realisation therelevant features shown in Fig. 4 and Fig. 5 are still evi-dent, although the overall proper motion distributions andcorrelation maps appear noisier.
MNRAS 000, 1–13 (2018)
8 G. Iorio and V. Belokurov
Figure 5. Pearson correlation coefficient of the Galactic proper motion components (µ`, µb) as a function of the sky position in Galacticcoordinates for the three models (isotropic, top-left panel; tangentially anisotropic, top-right panel; radially anisotropic, bottom-left
panel and the data bottom-right panel). Only the stars in the clean sample with 5 < |z/kpc | < 30 and located within the black ellipse
shown in the left-hand panel of Fig. 3 (N∼21,000) are considered. The underlying model velocity distributions are shown in the top-leftpanel of Fig. 4. The maps of the model correlation have been obtained by averaging the results of 10,000 model realisations. The mean
dispersion of the model realisations (σρµ` ,µb ∼ 0.25) is compatible with the level of random fluctuations displayed by the data. The
proper motions have been corrected for the Solar reflex motion. The gray regions indicate bins without stars.
4.2 Radial trends
This sub-section explores the dependence of the RRL kine-matics on the Galactocentric distance. In particular, wereplicate the analysis presented above using sub-samples ofRRL in different Galactocentric distance r bins. Given the(maximal) spatial blurring due to the uncertainties in thedistance estimate (Sec. 3.1), the minimal size of a distancebin is 4 kpc. For each radial bin, we show both the 1-D dis-tributions of the transverse velocities derived from the GaiaDR2 proper motions (Fig. 6) and the 2-D maps of the cor-relation coefficient of the RRL proper motions on the sky(Fig. 7).
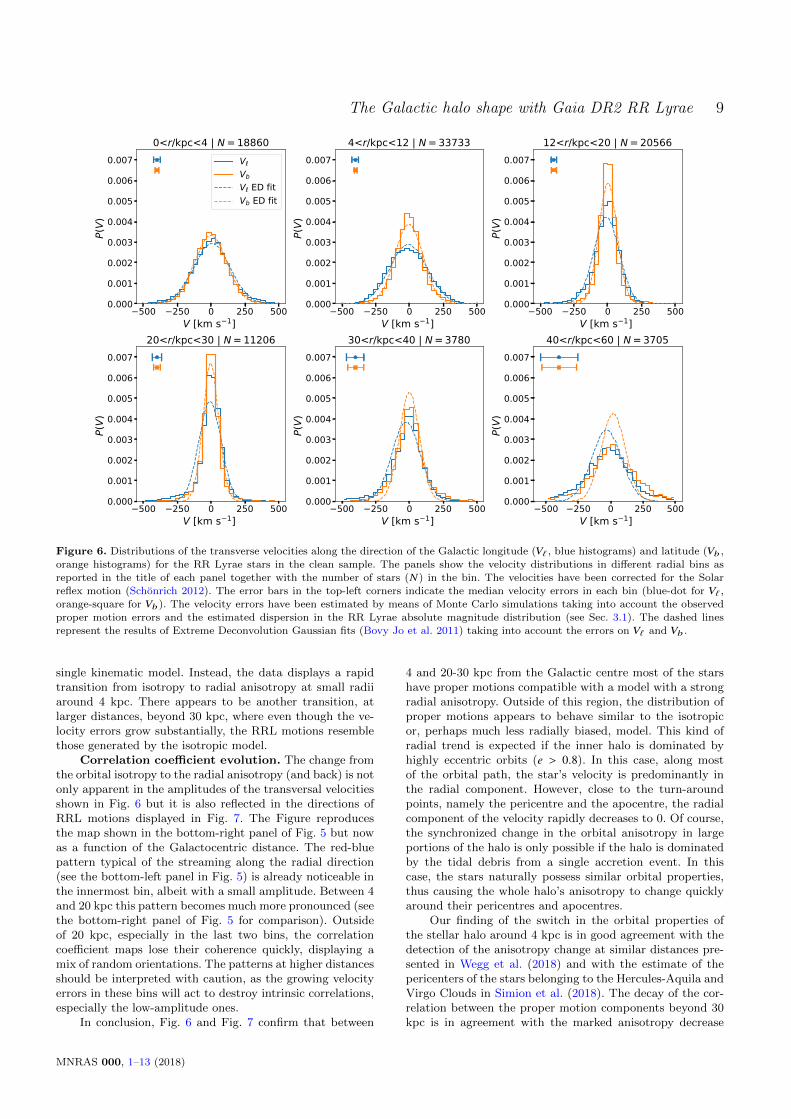
Velocity distributions evolution. The amplitude ofthe proper motion depends both on the velocity of a staras well as its distance from the observer (Eq. 2). There-fore, we convert the proper motions into physical velocitiesV` = Kµ`D� and Vb = KµbD� to track changes in kine-matics across a wide range of r. Here, V` and Vb are thevelocities along the direction of the Galactic longitude andGalactic latitude and K ≈ 4.70 is the conversion factor frommas kpc yr−1 to km s−1. The distributions of V` and Vb as afunction of the Galactocentric distance are given in Fig. 6. Inthe bin closest to the Galactic center, the two distributionsare almost identical, in agreement with the isotropic model(see the bottom-left panel in Fig. 4). At the intermediate
radii (4 < r/kpc < 30), the V` and Vb distributions becomeprogressively narrower; moreover, significant differences be-tween Vb and V` histograms start to appear. Thus, the kine-matics of the RRL stars in this radial range appears com-patible with the expectation from the radially anisotropicmodel (see the bottom-right panel in Fig. 4). Beyond 30kpc, the trend is reversed: the V` and Vb distributions be-come broader and barely distinguishable, in agreement withthe isotropic model. Please note that some of the broad-ening in the last bin is driven by large velocity errors forthese distant and faint stars (G & 18.8, see the error-bars inthe top-left corner of each panel). To illustrate the effect oferror-blurring on the shape of the velocity histograms, wedeconvolve the distributions using the ED technique (BovyJo et al. 2011). The resulting deconvolved distributions areshown as dashed lines in Fig. 6. In the first four bins, i.e.for r < 30 kpc, the difference between the observed and de-convolved distributions is minuscule. In the last two radialbins, the mismatch is more noticeable but still minor. Weconclude that the change in the shape of the transverse ve-locity distribution with radius is dictated primarily by thechange in the overall anisotropy of the stellar halo.
We have checked that the model distributions of thetransverse velocities do not substantially change their be-havior as a function of r. Therefore, we confirm that theradial evolution shown in Fig. 6 is not compatible with a
MNRAS 000, 1–13 (2018)
The Galactic halo shape with Gaia DR2 RR Lyrae 9
500 250 0 250 500V [km s 1]
0.000
0.001
0.002
0.003
0.004
0.005
0.006
0.007
P(V)
0<r/kpc<4 | N = 18860VVb
V ED fitVb ED fit
500 250 0 250 500V [km s 1]
0.000
0.001
0.002
0.003
0.004
0.005
0.006
0.007
P(V)
4<r/kpc<12 | N = 33733
500 250 0 250 500V [km s 1]
0.000
0.001
0.002
0.003
0.004
0.005
0.006
0.007
P(V)
12<r/kpc<20 | N = 20566
500 250 0 250 500V [km s 1]
0.000
0.001
0.002
0.003
0.004
0.005
0.006
0.007
P(V)
20<r/kpc<30 | N = 11206
500 250 0 250 500V [km s 1]
0.000
0.001
0.002
0.003
0.004
0.005
0.006
0.007
P(V)
30<r/kpc<40 | N = 3780
500 250 0 250 500V [km s 1]
0.000
0.001
0.002
0.003
0.004
0.005
0.006
0.007
P(V)
40<r/kpc<60 | N = 3705
Figure 6. Distributions of the transverse velocities along the direction of the Galactic longitude (V` , blue histograms) and latitude (Vb ,
orange histograms) for the RR Lyrae stars in the clean sample. The panels show the velocity distributions in different radial bins as
reported in the title of each panel together with the number of stars (N) in the bin. The velocities have been corrected for the Solarreflex motion (Schonrich 2012). The error bars in the top-left corners indicate the median velocity errors in each bin (blue-dot for V` ,
orange-square for Vb). The velocity errors have been estimated by means of Monte Carlo simulations taking into account the observed
proper motion errors and the estimated dispersion in the RR Lyrae absolute magnitude distribution (see Sec. 3.1). The dashed linesrepresent the results of Extreme Deconvolution Gaussian fits (Bovy Jo et al. 2011) taking into account the errors on V` and Vb .
single kinematic model. Instead, the data displays a rapidtransition from isotropy to radial anisotropy at small radiiaround 4 kpc. There appears to be another transition, atlarger distances, beyond 30 kpc, where even though the ve-locity errors grow substantially, the RRL motions resemblethose generated by the isotropic model.
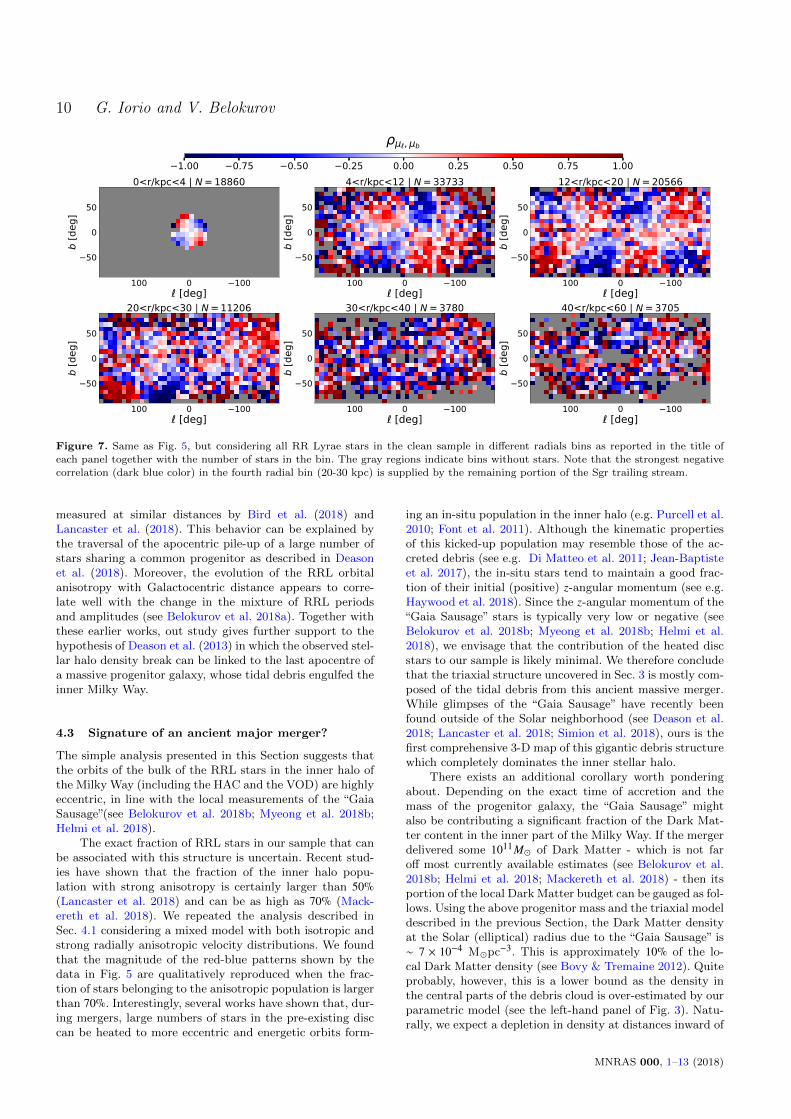
Correlation coefficient evolution. The change fromthe orbital isotropy to the radial anisotropy (and back) is notonly apparent in the amplitudes of the transversal velocitiesshown in Fig. 6 but it is also reflected in the directions ofRRL motions displayed in Fig. 7. The Figure reproducesthe map shown in the bottom-right panel of Fig. 5 but nowas a function of the Galactocentric distance. The red-bluepattern typical of the streaming along the radial direction(see the bottom-left panel in Fig. 5) is already noticeable inthe innermost bin, albeit with a small amplitude. Between 4and 20 kpc this pattern becomes much more pronounced (seethe bottom-right panel of Fig. 5 for comparison). Outsideof 20 kpc, especially in the last two bins, the correlationcoefficient maps lose their coherence quickly, displaying amix of random orientations. The patterns at higher distancesshould be interpreted with caution, as the growing velocityerrors in these bins will act to destroy intrinsic correlations,especially the low-amplitude ones.
In conclusion, Fig. 6 and Fig. 7 confirm that between
4 and 20-30 kpc from the Galactic centre most of the starshave proper motions compatible with a model with a strongradial anisotropy. Outside of this region, the distribution ofproper motions appears to behave similar to the isotropicor, perhaps much less radially biased, model. This kind ofradial trend is expected if the inner halo is dominated byhighly eccentric orbits (e > 0.8). In this case, along mostof the orbital path, the star’s velocity is predominantly inthe radial component. However, close to the turn-aroundpoints, namely the pericentre and the apocentre, the radialcomponent of the velocity rapidly decreases to 0. Of course,the synchronized change in the orbital anisotropy in largeportions of the halo is only possible if the halo is dominatedby the tidal debris from a single accretion event. In thiscase, the stars naturally possess similar orbital properties,thus causing the whole halo’s anisotropy to change quicklyaround their pericentres and apocentres.
Our finding of the switch in the orbital properties ofthe stellar halo around 4 kpc is in good agreement with thedetection of the anisotropy change at similar distances pre-sented in Wegg et al. (2018) and with the estimate of thepericenters of the stars belonging to the Hercules-Aquila andVirgo Clouds in Simion et al. (2018). The decay of the cor-relation between the proper motion components beyond 30kpc is in agreement with the marked anisotropy decrease
MNRAS 000, 1–13 (2018)
10 G. Iorio and V. Belokurov
Figure 7. Same as Fig. 5, but considering all RR Lyrae stars in the clean sample in different radials bins as reported in the title of
each panel together with the number of stars in the bin. The gray regions indicate bins without stars. Note that the strongest negativecorrelation (dark blue color) in the fourth radial bin (20-30 kpc) is supplied by the remaining portion of the Sgr trailing stream.
measured at similar distances by Bird et al. (2018) andLancaster et al. (2018). This behavior can be explained bythe traversal of the apocentric pile-up of a large number ofstars sharing a common progenitor as described in Deasonet al. (2018). Moreover, the evolution of the RRL orbitalanisotropy with Galactocentric distance appears to corre-late well with the change in the mixture of RRL periodsand amplitudes (see Belokurov et al. 2018a). Together withthese earlier works, out study gives further support to thehypothesis of Deason et al. (2013) in which the observed stel-lar halo density break can be linked to the last apocentre ofa massive progenitor galaxy, whose tidal debris engulfed theinner Milky Way.
4.3 Signature of an ancient major merger?
The simple analysis presented in this Section suggests thatthe orbits of the bulk of the RRL stars in the inner halo ofthe Milky Way (including the HAC and the VOD) are highlyeccentric, in line with the local measurements of the “GaiaSausage”(see Belokurov et al. 2018b; Myeong et al. 2018b;Helmi et al. 2018).
The exact fraction of RRL stars in our sample that canbe associated with this structure is uncertain. Recent stud-ies have shown that the fraction of the inner halo popu-lation with strong anisotropy is certainly larger than 50%(Lancaster et al. 2018) and can be as high as 70% (Mack-ereth et al. 2018). We repeated the analysis described inSec. 4.1 considering a mixed model with both isotropic andstrong radially anisotropic velocity distributions. We foundthat the magnitude of the red-blue patterns shown by thedata in Fig. 5 are qualitatively reproduced when the frac-tion of stars belonging to the anisotropic population is largerthan 70%. Interestingly, several works have shown that, dur-ing mergers, large numbers of stars in the pre-existing disccan be heated to more eccentric and energetic orbits form-
ing an in-situ population in the inner halo (e.g. Purcell et al.2010; Font et al. 2011). Although the kinematic propertiesof this kicked-up population may resemble those of the ac-creted debris (see e.g. Di Matteo et al. 2011; Jean-Baptisteet al. 2017), the in-situ stars tend to maintain a good frac-tion of their initial (positive) z-angular momentum (see e.g.Haywood et al. 2018). Since the z-angular momentum of the“Gaia Sausage” stars is typically very low or negative (seeBelokurov et al. 2018b; Myeong et al. 2018b; Helmi et al.2018), we envisage that the contribution of the heated discstars to our sample is likely minimal. We therefore concludethat the triaxial structure uncovered in Sec. 3 is mostly com-posed of the tidal debris from this ancient massive merger.While glimpses of the “Gaia Sausage” have recently beenfound outside of the Solar neighborhood (see Deason et al.2018; Lancaster et al. 2018; Simion et al. 2018), ours is thefirst comprehensive 3-D map of this gigantic debris structurewhich completely dominates the inner stellar halo.
There exists an additional corollary worth ponderingabout. Depending on the exact time of accretion and themass of the progenitor galaxy, the “Gaia Sausage” mightalso be contributing a significant fraction of the Dark Mat-ter content in the inner part of the Milky Way. If the mergerdelivered some 1011M� of Dark Matter - which is not faroff most currently available estimates (see Belokurov et al.2018b; Helmi et al. 2018; Mackereth et al. 2018) - then itsportion of the local Dark Matter budget can be gauged as fol-lows. Using the above progenitor mass and the triaxial modeldescribed in the previous Section, the Dark Matter densityat the Solar (elliptical) radius due to the “Gaia Sausage” is∼ 7 × 10⁻⁴ M�pc−3. This is approximately 10% of the lo-cal Dark Matter density (see Bovy & Tremaine 2012). Quiteprobably, however, this is a lower bound as the density inthe central parts of the debris cloud is over-estimated by ourparametric model (see the left-hand panel of Fig. 3). Natu-rally, we expect a depletion in density at distances inward of
MNRAS 000, 1–13 (2018)
The Galactic halo shape with Gaia DR2 RR Lyrae 11
the pericentre. A different estimate can be obtained by notic-ing that within 30 kpc, i.e. inside the apocentre of the “GaiaSausage”, the MW mass is estimated to be ∼ 2.5 × 10¹¹M�(see e.g. Gibbons et al. 2014; Williams et al. 2017; Posti &Helmi 2018), of which at least 0.5×10¹¹M� can be attributedto the baryonic component (see McMillan 2017). Therefore,the Dark Matter contribution associated with the principalcomponent of the stellar halo can be ∼ 50% within 30 kpc.
In this regard, it is curious that the direction of the ma-jor axis of the triaxial stellar halo described in this work isclose (within 20◦) to the direction of the major axis of thetriaxial Dark Matter halo model found by Law et al. (2009).Although the details of the axial ratios show some differ-ence (the Dark Matter shortest axis is not on the directionnormal to the Galactic plane), the “amount” of triaxialityas measured by the triaxiality parameter T3 is very similar.While the exact orientation of the Dark Matter halo with re-spect to the Galactic disk as suggested by Law et al. (2009)is not stable, the triaxial Dark Matter halo and the baryonicdisk can co-exist happily if the disk’s spin is allowed to bemisaligned with respect to the principal planes of the po-tential (see Debattista et al. 2013). This misalignment canbe induced, for example, by gas accretion at later times asdemonstrated in Debattista et al. (2015).
5 CONCLUSIONS
In this paper, we take advantage of the most comprehensivesample of RRL stars to date, i.e. the one supplied by theGaia DR2, to study the shape of the Galactic stellar halo.In order to assemble a dataset with sensible and stable com-pleteness and purity, we had to get rid of more than a halfof the original total of ∼ 230, 000 objects. While this maysound scary, remember that the estimated contaminationof the Gaia DR2 sample shoots up to ∼ 50% in the bulgearea (see Holl et al. 2018). For our investigations, we haveonly kept RRL stars that possess well-behaved colors and as-trometry. Additionally, we do not consider objects residingin small-scale over-densities, i.e. known Milky Way satellitesand globular clusters. However, even after all these cuts, weare left with nearly 93,000 RRL stars across the entire sky,from the inner several kpc to the distant outskirts - a datasetunprecedented in its richness and reach.
For the very first time, we produce detailed maps ofthe RRL density distribution in the inner Milky Way (seeFig. 2). Slicing the Galaxy at different Galactic heights, wereveal the evolution of the halo shape from nearly spherical(close to the Galaxy’s centre) to clearly triaxial further out.Despite several obvious asymmetries and large-scale over-densities visible in these maps, the overall structure of thehalo appears to be well-described by the SPL-TRqv modelof Iorio et al. (2018). In this model, the major axis lies inthe Galactic plane rotated by ∼ 70◦ (anti-clockwise) awayfrom the Galactic x-axis, i.e. pointing approximately in thedirection of the Magellanic Clouds. The ratio of the majorto intermediate axis is p = 1.3, but the ratio of the minoraxis (aligned with the Galactic z axis) to major one changes
3 T =1−b2/a2
1−c2/a2 , where a, b, c are the longest, intermediate and
shortest axes, respectively.
with distance from the Milky Way centre (from q ∼ 0.5 to q ∼0.8). The clearest deviations from the above model are theVirgo Over-Density and the Hercules-Aquila Cloud, whichprotrude far in the vertical direction on the opposite sides ofthe Galactic plane. As we have demonstrated in Section 3.2and Fig. 3, the SPL-TRqv model of Iorio et al. (2018) can beadjusted slightly to encompass both HAC and VOD. This isachieved by bringing its intermediate axis out of the Galacticplane by ∼ 20◦. From the slices presented in Fig. 2 it is noweasy to judge the whereabouts of the HAC and VOD withrespect to the Milky Way’s centre and to each other. Thesedebris clouds appear to be aligned with the major axis ofthe triaxial structure discussed above.
The first clues that HAC and VOD may actually bepart of the same accretion event have already been pre-sented by Simion et al. (2018), who calculated the orbitalproperties of a sub-sample of RRL stars residing in theseover-densities. Given that both structures appear to be dom-inated by stars on extremely eccentric orbits, Simion et al.(2018) conclude that HAC and VOD represent unmixed por-tions of an ancient massive head-on collision also known asthe “Gaia Sausage”. In an attempt to test this hypothesis,we have studied the kinematics of the inner halo RRL starsas reflected in their proper motions. We claim that acrossa wide range of distances from the Sun, the halo’s veloc-ity ellipsoid can be gleaned from its projection on the ce-lestial sphere. Our results are in good agreement with anearlier analysis of the RRL proper motion data of Wegget al. (2018). Compared to the above study, while we do notattempt to model the shape of the velocity ellipsoid, we doobtain a broader view of the global kinematic patterns in theGalactic halo. Accordingly, contrasting the observed ampli-tudes and directions of the RRL proper motions within ∼ 30kpc from the Galactic centre with simple kinematic models,we show that the entire inner halo is dominated by stars onhighly eccentric orbits.
We interpret the stretched appearance and the extremeradial anisotropy of the inner halo as the tell-tale signs ofa low angular momentum collision with a massive satellite(see e.g. Brook et al. 2003), thus associating the bulk of theRRL stars within 30 kpc with the so-called “Gaia Sausage”merger event (Belokurov et al. 2018b; Myeong et al. 2018b;Haywood et al. 2018; Helmi et al. 2018). By tracking thechange in the behavior of the RRL proper motions withGalactocentric distance, we place constraints on the peri-centre (. 4 kpc) and the apocentre (20-40 kpc) of this enor-mous tidal debris cloud. The fact that today it appears tobe squashed vertically (in the direction perpendicular to theGalactic disc) agrees well with the predictions of numericalsimulations of the Dark Matter halo evolution in the pres-ence of baryons (Kazantzidis et al. 2004; Gnedin et al. 2004;Debattista et al. 2008; Abadi et al. 2010). In terms of localDark Matter density, we have estimated the contributionof the “Gaia Sausage” to be between 10% and 50%. A cu-rious conundrum is starting to emerge in which a clearlytriaxial stellar halo needs to be reconciled with multiplerecent reports of a near spherical inner Dark Matter halo(Bowden et al. 2015; Bovy et al. 2016; Wegg et al. 2018),a measurement itself in tension with the results from nu-merical simulations which do not produce perfect sphericity(e.g. Kazantzidis et al. 2010; Debattista et al. 2015). Thespatio-kinematic information uncovered here will help con-
MNRAS 000, 1–13 (2018)
12 G. Iorio and V. Belokurov
strain the total mass as well as the time of accretion of the“Gaia Sausage”progenitor, and thus understand the role thisevent played in the life of the Milky Way.
ACKNOWLEDGEMENTS
The authors thank Wyn Evans, Victor Debattista, An-drew Cooper, Sergey Koposov, Iulia Simion, Alis Deasonfor most illuminating discussions which helped to improvethis manuscript. G.I. is supported by the Royal SocietyNewton International Fellowship. The research leading tothese results has received funding from the European Re-search Council under the European Union’s Seventh Frame-work Programme (FP/2007-2013) / ERC Grant Agreementn. 308024. This work has made use of data from the Eu-ropean Space Agency (ESA) mission Gaia (https://www.cosmos.esa.int/gaia), processed by the Gaia Data Pro-cessing and Analysis Consortium (DPAC, https://www.
cosmos.esa.int/web/gaia/dpac/consortium). Funding forthe DPAC has been provided by national institutions, inparticular the institutions participating in the Gaia Multi-lateral Agreement.
REFERENCES
Abadi M. G., Navarro J. F., Fardal M., Babul A., Steinmetz M.,2010, MNRAS, 407, 435
Alam S., et al., 2015, ApJS, 219, 12
Allgood B., Flores R. A., Primack J. R., Kravtsov A. V., Wechsler
R. H., Faltenbacher A., Bullock J. S., 2006, MNRAS, 367,
1781
Altay G., Colberg J. M., Croft R. A. C., 2006, MNRAS, 370, 1422
Avila-Reese V., Colın P., Valenzuela O., D’Onghia E., FirmaniC., 2001, ApJ, 559, 516
Bailer-Jones C. A. L., Rybizki J., Fouesneau M., Mantelet G.,
Andrae R., 2018, preprint, (arXiv:1804.10121)
Bell E. F., et al., 2008, ApJ, 680, 295
Belokurov V., et al., 2007, ApJ, 657, L89
Belokurov V., et al., 2014, MNRAS, 437, 116
Belokurov V., Erkal D., Deason A. J., Koposov S. E., De Angeli
F., Evans D. W., Fraternali F., Mackey D., 2017, MNRAS,466, 4711
Belokurov V., Deason A. J., Koposov S. E., Catelan M., Erkal D.,Drake A. J., Evans N. W., 2018a, MNRAS, 477, 1472
Belokurov V., Erkal D., Evans N. W., Koposov S. E., DeasonA. J., 2018b, MNRAS, 478, 611
Benson A. J., Lacey C. G., Frenk C. S., Baugh C. M., Cole S.,
2004, MNRAS, 351, 1215
Bett P., Eke V., Frenk C. S., Jenkins A., Helly J., Navarro J.,2007, MNRAS, 376, 215
Bird S. A., Xue X.-X., Liu C., Shen J., Flynn C., Yang C., 2018,
preprint, (arXiv:1805.04503)
Bonaca A., et al., 2012, AJ, 143, 105
Bovy J., Tremaine S., 2012, ApJ, 756, 89
Bovy Jo Hogg D. W., Roweis S. T., 2011, Annals of Applied
Statistics, 5
Bovy J., Bahmanyar A., Fritz T. K., Kallivayalil N., 2016, ApJ,833, 31
Bowden A., Belokurov V., Evans N. W., 2015, MNRAS, 449, 1391
Brook C. B., Kawata D., Gibson B. K., Flynn C., 2003, ApJ, 585,
L125
Bryan S. E., Kay S. T., Duffy A. R., Schaye J., Dalla Vecchia C.,
Booth C. M., 2013, MNRAS, 429, 3316
Bullock J. S., Johnston K. V., 2005, ApJ, 635, 931
Carollo D., et al., 2007, Nature, 450, 1020
Carollo D., et al., 2010, ApJ, 712, 692
Catelan M., Pritzl B. J., Smith H. A., 2004, ApJS, 154, 633
Clementini G., et al., 2018, preprint, (arXiv:1805.02079)
Colberg J. M., White S. D. M., Jenkins A., Pearce F. R., 1999,
MNRAS, 308, 593
Cole S., Lacey C., 1996, MNRAS, 281, 716
Cooper A. P., et al., 2010, MNRAS, 406, 744
Cooper A. P., Parry O. H., Lowing B., Cole S., Frenk C., 2015,
MNRAS, 454, 3185
D’Souza R., Bell E. F., 2018, MNRAS, 474, 5300
Dave R., Spergel D. N., Steinhardt P. J., Wandelt B. D., 2001,ApJ, 547, 574
De Lucia G., Helmi A., 2008, MNRAS, 391, 14
Deason A. J., Belokurov V., Evans N. W., 2011, MNRAS, 416,
2903
Deason A. J., Belokurov V., Evans N. W., Johnston K. V., 2013,
ApJ, 763, 113
Deason A. J., Mao Y.-Y., Wechsler R. H., 2016, ApJ, 821, 5
Deason A. J., Belokurov V., Koposov S. E., Lancaster L., 2018,ApJ, 862, L1
Debattista V. P., Moore B., Quinn T., Kazantzidis S., Maas R.,
Mayer L., Read J., Stadel J., 2008, ApJ, 681, 1076
Debattista V. P., Roskar R., Valluri M., Quinn T., Moore B.,
Wadsley J., 2013, MNRAS, 434, 2971
Debattista V. P., van den Bosch F. C., Roskar R., Quinn T.,
Moore B., Cole D. R., 2015, MNRAS, 452, 4094
Di Matteo P., Lehnert M. D., Qu Y., van Driel W., 2011, A&A,
525, L3
Dubinski J., Carlberg R. G., 1991, ApJ, 378, 496
Duffau S., Zinn R., Vivas A. K., Carraro G., Mendez R. A., Win-nick R., Gallart C., 2006, ApJ, 636, L97
Evans D. W., et al., 2018, preprint, (arXiv:1804.09368)
Font A. S., McCarthy I. G., Crain R. A., Theuns T., Schaye J.,Wiersma R. P. C., Dalla Vecchia C., 2011, MNRAS, 416, 2802
Frenk C. S., White S. D. M., Davis M., Efstathiou G., 1988, ApJ,
327, 507
Gaia Collaboration et al., 2016, A&A, 595, A1
Gaia Collaboration et al., 2018b, preprint, (arXiv:1804.09381)
Gaia Collaboration Brown A. G. A., Vallenari A., Prusti T., de
Bruijne J. H. J., Babusiaux C., Bailer-Jones C. A. L., 2018a,
preprint, (arXiv:1804.09365)
Gibbons S. L. J., Belokurov V., Evans N. W., 2014, MNRAS, 445,
3788
Gnedin O. Y., Kravtsov A. V., Klypin A. A., Nagai D., 2004,ApJ, 616, 16
Hahn O., Porciani C., Carollo C. M., Dekel A., 2007, MNRAS,
375, 489
Harris W. E., 2010, preprint, (arXiv:1012.3224)
Hayashi E., Navarro J. F., Springel V., 2007, MNRAS, 377, 50
Hayes C. R., et al., 2018, ApJ, 852, 49
Haywood M., Di Matteo P., Lehnert M., Snaith O., Khoperskov
S., Gomez A., 2018, preprint, (arXiv:1805.02617)
Helmi A., Babusiaux C., Koppelman H. H., Massari D., VeljanoskiJ., Brown A. G. A., 2018, preprint, (arXiv:1806.06038)
Holl B., et al., 2018, preprint, (arXiv:1804.09373)
Iorio G., Belokurov V., Erkal D., Koposov S. E., Nipoti C., Fra-ternali F., 2018, MNRAS, 474, 2142
Jean-Baptiste I., Di Matteo P., Haywood M., Gomez A., Montuori
M., Combes F., Semelin B., 2017, A&A, 604, A106
Juric M., et al., 2008, ApJ, 673, 864
Kafle P. R., Sharma S., Lewis G. F., Bland-Hawthorn J., 2012,
ApJ, 761, 98
Kazantzidis S., Kravtsov A. V., Zentner A. R., Allgood B., Nagai
D., Moore B., 2004, ApJ, 611, L73
Kazantzidis S., Abadi M. G., Navarro J. F., 2010, ApJ, 720, L62
King III C., Brown W. R., Geller M. J., Kenyon S. J., 2015, ApJ,
813, 89
MNRAS 000, 1–13 (2018)
The Galactic halo shape with Gaia DR2 RR Lyrae 13
Koposov S. E., Belokurov V., Torrealba G., 2017, MNRAS, 470,
2702
Kruijssen J. M. D., Pfeffer J. L., Reina-Campos M., Crain R. A.,
Bastian N., 2018, MNRAS,
Lancaster L., Koposov S. E., Belokurov V., Evans N. W., Deason
A. J., 2018, preprint, (arXiv:1807.04290)
Law D. R., Majewski S. R., Johnston K. V., 2009, ApJ, 703, L67
Libeskind N. I., Hoffman Y., Forero-Romero J., Gottlober S.,Knebe A., Steinmetz M., Klypin A., 2013, MNRAS, 428, 2489
Lindegren L., Lammers U., Hobbs D., O’Mullane W., Bastian U.,Hernandez J., 2012, A&A, 538, A78
Lindegren L., et al., 2018, preprint, (arXiv:1804.09366)
Mackereth J. T., et al., 2018, preprint, (arXiv:1808.00968)
Mayer L., Moore B., Quinn T., Governato F., Stadel J., 2002,
MNRAS, 336, 119
McCarthy I. G., Font A. S., Crain R. A., Deason A. J., Schaye
J., Theuns T., 2012, MNRAS, 420, 2245
McMillan P. J., 2017, MNRAS, 465, 76
Monachesi A., et al., 2018, preprint, (arXiv:1804.07798)
Moore B., Kazantzidis S., Diemand J., Stadel J., 2004, MNRAS,
354, 522
Morrison H. L., Mateo M., Olszewski E. W., Harding P., Dohm-
Palmer R. C., Freeman K. C., Norris J. E., Morita M., 2000,AJ, 119, 2254
Muraveva T., Delgado H. E., Clementini G., Sarro L. M., GarofaloA., 2018, preprint, (arXiv:1805.08742)
Myeong G. C., Evans N. W., Belokurov V., Sanders J. L., KoposovS. E., 2018a, preprint, (arXiv:1805.00453)
Myeong G. C., Evans N. W., Belokurov V., Sanders J. L., KoposovS. E., 2018b, ApJ, 856, L26
Necib L., Lisanti M., Belokurov V., 2018, preprint,(arXiv:1807.02519)
Newberg H. J., Yanny B., 2006, in Journal of PhysicsConference Series. pp 195–204 (arXiv:astro-ph/0507671),
doi:10.1088/1742-6596/47/1/024
Newberg H. J., et al., 2002, ApJ, 569, 245
Peter A. H. G., Rocha M., Bullock J. S., Kaplinghat M., 2013,MNRAS, 430, 105
Piersimoni A. M., Bono G., Ripepi V., 2002, AJ, 124, 1528
Posti L., Helmi A., 2018, preprint, (arXiv:1805.01408)
Preston G. W., Shectman S. A., Beers T. C., 1991, ApJ, 375, 121
Purcell C. W., Bullock J. S., Kazantzidis S., 2010, MNRAS, 404,1711
Reid N., Majewski S. R., 1993, ApJ, 409, 635
Schlegel D. J., Finkbeiner D. P., Davis M., 1998, ApJ, 500, 525
Schonrich R., 2012, MNRAS, 427, 274
Sesar B., Juric M., Ivezic Z., 2011, ApJ, 731, 4
Siegel M. H., Majewski S. R., Reid I. N., Thompson I. B., 2002,
ApJ, 578, 151
Simion I. T., Belokurov V., Irwin M., Koposov S. E., 2014, MN-
RAS, 440, 161
Simion I. T., Belokurov V., Koposov S. E., 2018, preprint,
(arXiv:1807.01335)
Sluis A. P. N., Arnold R. A., 1998, MNRAS, 297, 732
Tissera P. B., Scannapieco C., Beers T. C., Carollo D., 2013,MNRAS, 432, 3391
Tomassetti M., et al., 2016, MNRAS, 458, 4477
Tormen G., 1997, MNRAS, 290, 411
Vera-Ciro C. A., Sales L. V., Helmi A., Frenk C. S., Navarro J. F.,
Springel V., Vogelsberger M., White S. D. M., 2011, MNRAS,416, 1377
Vivas A. K., et al., 2001, ApJ, 554, L33
Warren M. S., Quinn P. J., Salmon J. K., Zurek W. H., 1992,
ApJ, 399, 405
Wegg C., Gerhard O., Bieth M., 2018, preprint,
(arXiv:1806.09635)
Williams A. A., Belokurov V., Casey A. R., Evans N. W., 2017,
MNRAS, 468, 2359
Xue X.-X., Rix H.-W., Ma Z., Morrison H., Bovy J., Sesar B.,
Janesh W., 2015, ApJ, 809, 144
Zolotov A., Willman B., Brooks A. M., Governato F., Brook C. B.,Hogg D. W., Quinn T., Stinson G., 2009, ApJ, 702, 1058
van der Marel R. P., Sahlmann J., 2016, ApJ, 832, L23
This paper has been typeset from a TEX/LATEX file prepared bythe author.
MNRAS 000, 1–13 (2018)