gabi databases 2016 edition · january 2016 gabi databases upgrades & improvements 2016 edition...
TRANSCRIPT
January 2016
GaBi Databases
Upgrades & improvements
2016 Edition
1
Contents
1. Introduction to the upgrade of databases available with GaBi ....................... 3
2. GaBi Databases 2016 Edition ............................................................................. 4
2.1. Inventories for electricity, thermal energy and steam 6
2.2. Inventories for primary energy carriers 21
2.3. Organic and inorganic intermediates 23
2.4. Inventories for metal processes 25
2.5. Inventories plastic processes 27
2.6. Inventories for end-of-life processes 28
2.7. Inventories for electronic processes 30
2.8. Inventories for renewable processes 30
2.9. Inventories for construction processes 33
2.10. Inventories for textile processes 38
2.11. Inventories for US regional processes 41
3. Industry data in GaBi ........................................................................................ 49
4. General continuous improvements done in the Upgrade ’16 ....................... 53
4.1. Naming 53
4.2. Sorting 54
4.3. Documentation 55
4.4. LCIA / Method 57
4.5. New Objects 58
4.6. Bugs and improvements 61
References ............................................................................................................... 72
Annex: Version 2014 datasets – Explanations and Recommendations ............. 74
2
List of Tables
Table 2- 1: Energy carrier mix for electricity generation – selected EU countries ............................... 9
Table 2- 2: Energy carrier mix for electricity generation – countries with significant changes .......... 10
Table 2- 3: Issues Organic and inorganic intermediates ................................................................... 24
Table 2- 4: Issues metal processes ................................................................................................... 25
Table 2- 5: Issues plastic processes ................................................................................................. 27
Table 2- 6: Issues end-of-life processes ........................................................................................... 28
Table 2- 7: Issues renewable processes ........................................................................................... 31
Table 2- 8: Issues construction processes ........................................................................................ 33
Table 2- 9: Issues textile processes .................................................................................................. 39
Table 2- 10: Issues US regional processes ....................................................................................... 42
3
1. Introduction to the upgrade of databases available with
GaBi
In total over 30 employees of thinkstep were involved in the upgrade of several thousand unit
processes and aggregated LCI datasets. The invested time, knowledge and dedication of our
employees resulted in the new GaBi Databases 2016 Edition with more than 10,800 LCI process
datasets (1,600 of which are new).
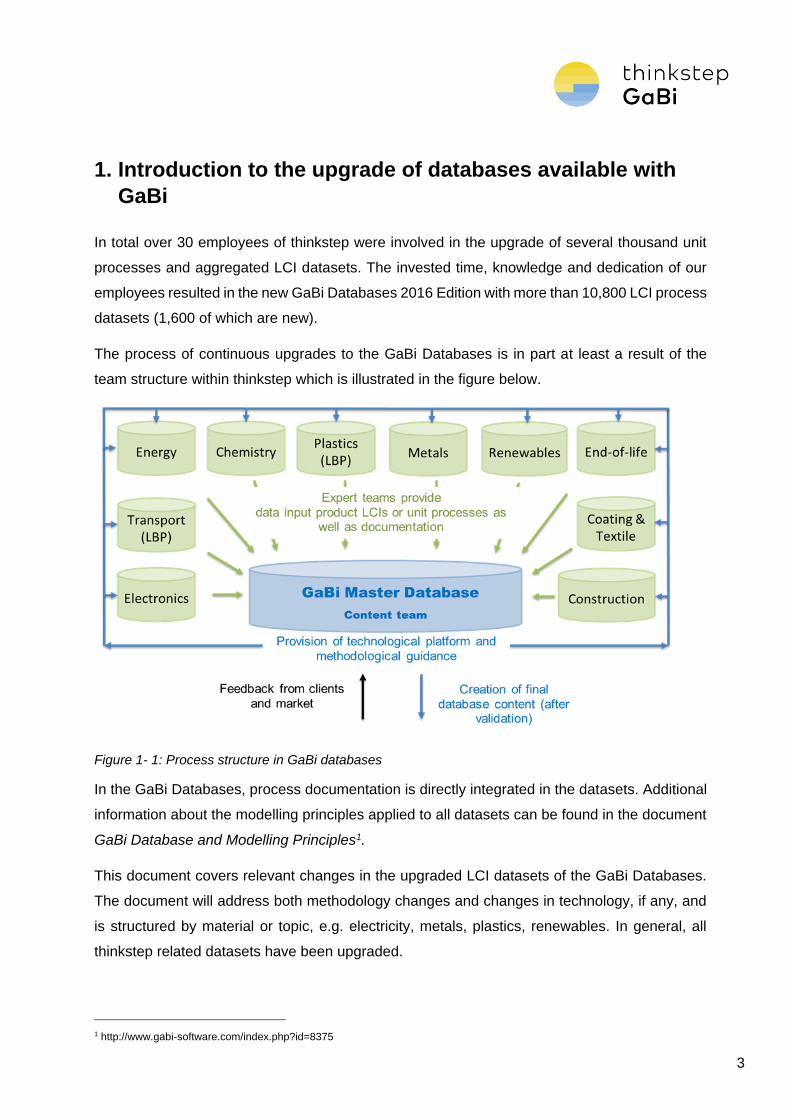
The process of continuous upgrades to the GaBi Databases is in part at least a result of the
team structure within thinkstep which is illustrated in the figure below.
Figure 1- 1: Process structure in GaBi databases
In the GaBi Databases, process documentation is directly integrated in the datasets. Additional
information about the modelling principles applied to all datasets can be found in the document
GaBi Database and Modelling Principles1.
This document covers relevant changes in the upgraded LCI datasets of the GaBi Databases.
The document will address both methodology changes and changes in technology, if any, and
is structured by material or topic, e.g. electricity, metals, plastics, renewables. In general, all
thinkstep related datasets have been upgraded.
1 http://www.gabi-software.com/index.php?id=8375
4
Methodological changes are not endorsed by thinkstep but introduced if necessary.
Methodological changes are only useful if these changes or improvements are supported by
relevant best practise cases, evolving or edited standards or relevant stakeholder initiatives with
a respective practice approval.
2. GaBi Databases 2016 Edition
“Facts do not cease to exist because they are ignored” Aldous Huxley.
thinkstep introduced the annual upgrade of the GaBi databases for three reasons:
to keep your results as up-to-date and close to the evolving supply chains as possible;
including automated upgrades of your valued work to the most current state.
to avoid disruptive changes caused by multiyear intervals that are surprisingly hard to
communicate and interpret.
to keep track on necessary methodological changes and implement them promptly.
thinkstep databases are based on technical facts and internationally accepted and broadly
applied. Standardized methods are used as a preference, which are established in industry,
science and regulatory authorities. New methods are applied, if these have proven to be based
on a relevant standard, on broadly and internationally accepted approaches or when enforced
by relevant regulations.
Changes in datasets are often the result of many effects in the supply chain. But “technical”
reasons should be carefully separated from methodological reasons. Necessary methodological
adoptions due to evolving standards, knowledge and frameworks may be useful; however GaBi
databases do not undertake methodological trials on the back of databases that aim to reflect
technological reality.
Changes in the environmental profile of the datasets from the predecessor GaBi Databases to
the most recent GaBi Databases may be attributed to one or more of the following factors:
Upgrade of the foreground and/or background systems. The market situation,
applied or newly available technology creates different impacts. The environmental
profile for the supply of energy carriers or intermediates may be subject to short-term
changes and affects the environmental profile of virtually all materials and products by
varying degrees. For example a change of energy carrier mix or efficiency for electricity
5
supply changes the environmental profile of all materials or products created using that
electricity supply.
Improvements and changes in the technology of the production process.
Improvements or developments in production processes might achieve for example
higher energy efficiency, through the reduction of material losses and process emissions.
Sometimes, the technology is subjected to higher quality requirements that are defined
further downstream at the products (e.g. more end-of pipe measures to reduce
emissions, higher desulphurization of fuels) and improved use phase performance. In
addition, certain production routes might have been phased out, changing the production
mix of a certain material, substance or energy. A frequently changing and quite dynamic
example is the electricity grid mix datasets, as some countries try to reduce or phase-
out certain types of energy or fuels in the electricity supply mix, which require the
introduction of alternative sources of fuels and energy.
Further standardization and the establishment of regulative modelling
approaches. Modelling of realistic technology chains has always been the core focus of
the GaBi database. Some topics have attracted more attention, such as water and waste.
Further harmonisation and improvement in the LCA methodology and feedback from
clients and employees have enhanced the modelling approach for the GaBi Databases.
Detailed information is given in the document GaBi Database and Modelling Principles2.
Methodological adoptions are carried out extremely carefully, passing through multiple
levels of reviews by thinkstep experts responsible for standardization, technology
knowledge and quality assurance. This internal review process was audited within the
continuous improvement process by our external verification partner. GaBi database
updates and upgrades focus on reliability through consistency to ensure clients system
models and results are not jeopardised due to random methodological changes.
The degree of influence of each of these factors is specific to each process and cannot be
generalised for all cases nor can a single factor be highlighted. However as technological
excellence is a core value of thinkstep data, the focus is to update and apply ALL RELEVANT
AND IMPORTANT improvements and changes in technology and the supply chain and THE
NECESSARRY AND ESTABLISHED improvements and changes in the methodology.
2 http://www.gabi-software.com/index.php?id=8375
6
Supply chain modelling of a single material involves hundreds or even thousands of single
operations. Therefore even opposing effects (improvements of some processes and higher
impacts of other processes along the chain) may occur.
GaBi systems e.g. leading to a single aggregated dataset consists of multiple datasets within
one supply chain. This means users could find many reasons for changes within a single supply
chain. GaBi models must be able to reflect in first instance the necessary complexity of the
reality, in order to be able to provide realistic data. Reduction of complexity is only credible, if
the reality of the supply chains is still mirrored adequately. The change analysis is a time
consuming but important process within thinkstep and the results are documented in this report.
However, the relevance of changes in the GaBi database related to the users own systems is
highly dependent on the goal and scope in the specific user application. This means the same
dataset may lead to significant changes for a certain user, whereas in another users system the
changes might be irrelevant. To shorten the time for users to reflect on the relevancy of the GaBi
databases changes for their own systems, the analyst function of GaBi Software may support in
an effective way. To guide users to the relevant changes in their models due to changes in
external factors and GaBi background data upgrades, thinkstep provides additionally the
document “Database Upgrade, Updates and improvements” in addition to the document “GaBi
Database and Modelling Principles” and over 5000 interlinked electronical documentation files
supplied with thinkstep databases.
The following sections will address the most relevant changes in the GaBi Databases for the
different areas.
2.1. Inventories for electricity, thermal energy and steam
Relevant changes in energy carrier mix for electricity generation after the upgrade
In the GaBi databases 2016 Edition3, the reference year is 2012 for all electricity grid mixes and
energy carrier mixes (hard coal, crude oil and natural gas). One exception are electricity grid
mixes in the Extension Module XVII: Full US (electricity grid mixes for US sub grids and sub-
regions under eGRID), as the eGRID2012 data was not available, when the update process
started in 2015. The reference year for these data sets are therefore still 2010, changes in the
data sets are related to updates of the fuel supplies only.
3 The reference year was 2011 in the GaBi Databases 2014 respectively.
7
Relevant changes in the life cycle inventory (LCI) of the upgraded national grid mix datasets
occur for a couple of countries due to changes in the energy carriers that were used for electricity
generation, as well as changes in the amount of imported electricity and the country of origin of
these imports. The changes in the LCI data sets reveal the following trends:
An ongoing trend in some countries, to increase the share of renewable energies in their
electricity generation, which is for example observable for Denmark, Italy or Germany.
Annual fluctuation in electricity generation from hydro power (availability of water for electricity
generation) due to climate conditions. In 2012, lower water availability for hydro power compared
to 2011 resulted in higher shares of fossil fuels for example in Portugal, Spain, New Zealand
and Brazil. In contrast, higher water availability in Austria, Switzerland and Finland resulted in
distinct higher electricity output from hydro power plants.
Incremental electricity demand in transition countries is predominantly covered by the use of
coal, which is, for example, the case in India (+7 % or 75 TWh incremental production covered
by electricity from lignite), and Indonesia (+7 % or 13 TWh incremental production covered by
electricity from lignite and natural gas). China increased its production by 6 % or 278 TWh (half
of the Brazilian annual production). The incremental electricity was mainly produced by hydro
power (173 TWh), additional 60 TWh were produced by hard coal and 26 TWh by wind power.
The following three figures present the development of the energy carrier mix for electricity
generation in Germany, the European Union and the United States between 1998 and 2012.
8
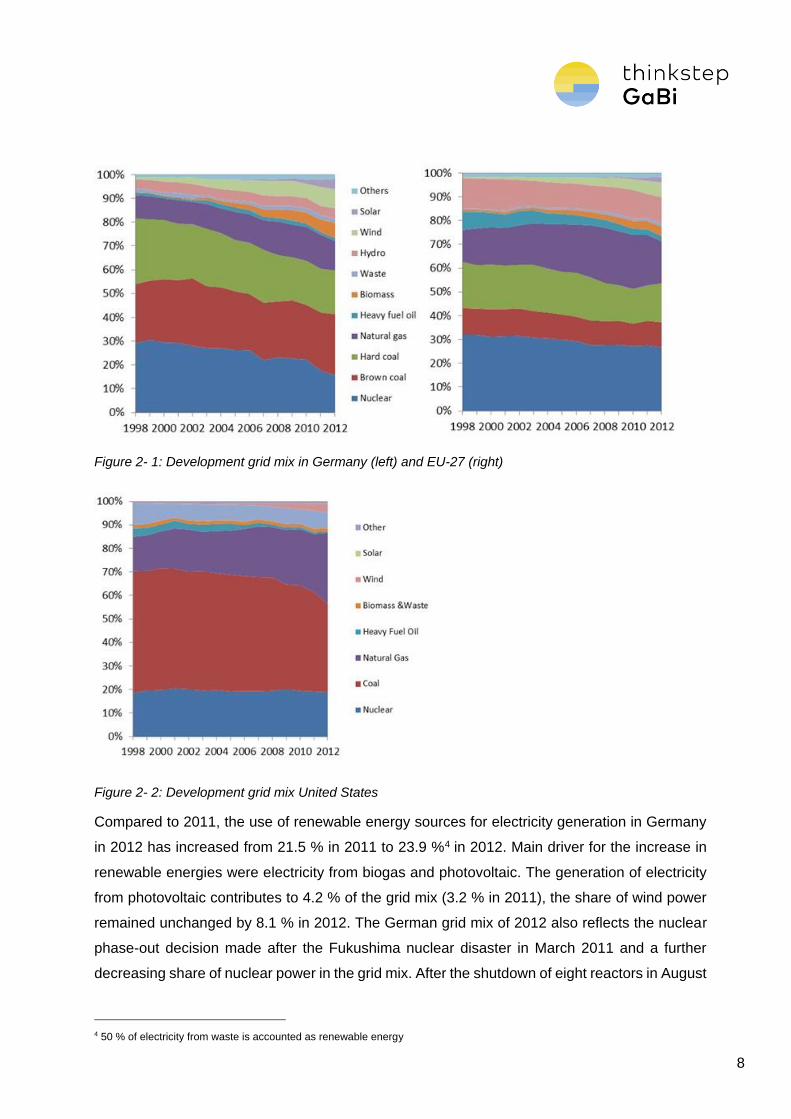
Figure 2- 1: Development grid mix in Germany (left) and EU-27 (right)
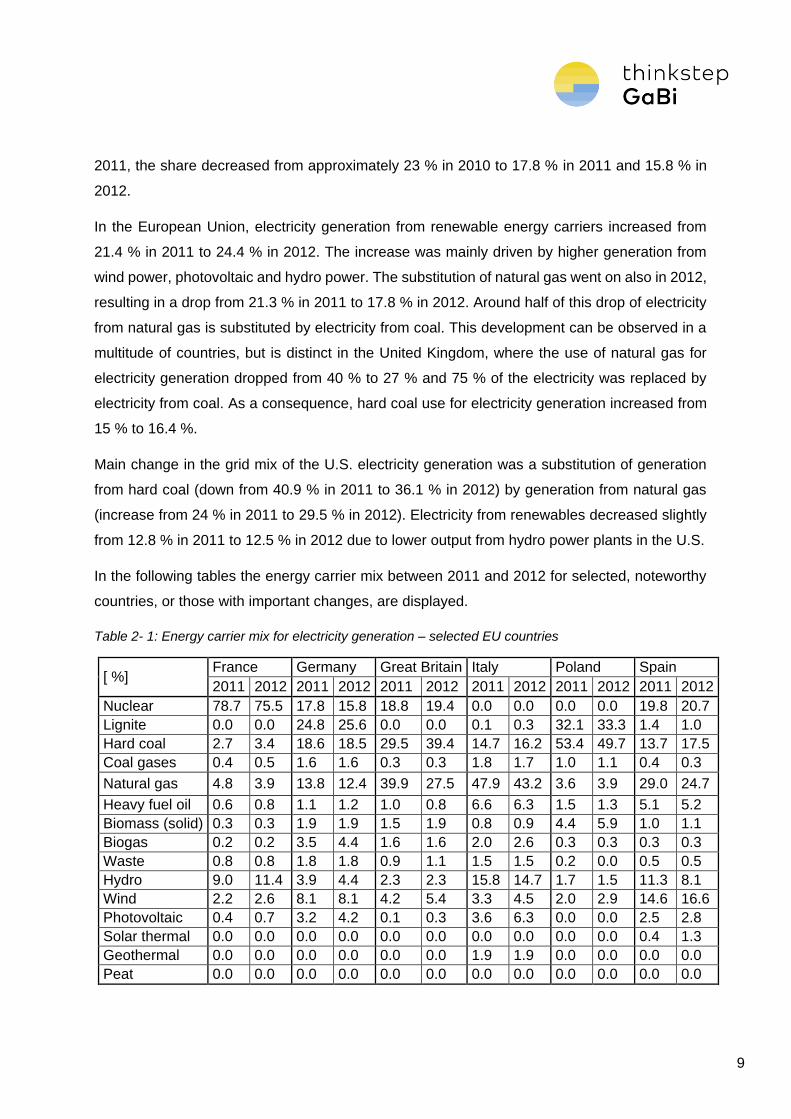
Figure 2- 2: Development grid mix United States
Compared to 2011, the use of renewable energy sources for electricity generation in Germany
in 2012 has increased from 21.5 % in 2011 to 23.9 %4 in 2012. Main driver for the increase in
renewable energies were electricity from biogas and photovoltaic. The generation of electricity
from photovoltaic contributes to 4.2 % of the grid mix (3.2 % in 2011), the share of wind power
remained unchanged by 8.1 % in 2012. The German grid mix of 2012 also reflects the nuclear
phase-out decision made after the Fukushima nuclear disaster in March 2011 and a further
decreasing share of nuclear power in the grid mix. After the shutdown of eight reactors in August
4 50 % of electricity from waste is accounted as renewable energy
9
2011, the share decreased from approximately 23 % in 2010 to 17.8 % in 2011 and 15.8 % in
2012.
In the European Union, electricity generation from renewable energy carriers increased from
21.4 % in 2011 to 24.4 % in 2012. The increase was mainly driven by higher generation from
wind power, photovoltaic and hydro power. The substitution of natural gas went on also in 2012,
resulting in a drop from 21.3 % in 2011 to 17.8 % in 2012. Around half of this drop of electricity
from natural gas is substituted by electricity from coal. This development can be observed in a
multitude of countries, but is distinct in the United Kingdom, where the use of natural gas for
electricity generation dropped from 40 % to 27 % and 75 % of the electricity was replaced by
electricity from coal. As a consequence, hard coal use for electricity generation increased from
15 % to 16.4 %.
Main change in the grid mix of the U.S. electricity generation was a substitution of generation
from hard coal (down from 40.9 % in 2011 to 36.1 % in 2012) by generation from natural gas
(increase from 24 % in 2011 to 29.5 % in 2012). Electricity from renewables decreased slightly
from 12.8 % in 2011 to 12.5 % in 2012 due to lower output from hydro power plants in the U.S.
In the following tables the energy carrier mix between 2011 and 2012 for selected, noteworthy
countries, or those with important changes, are displayed.
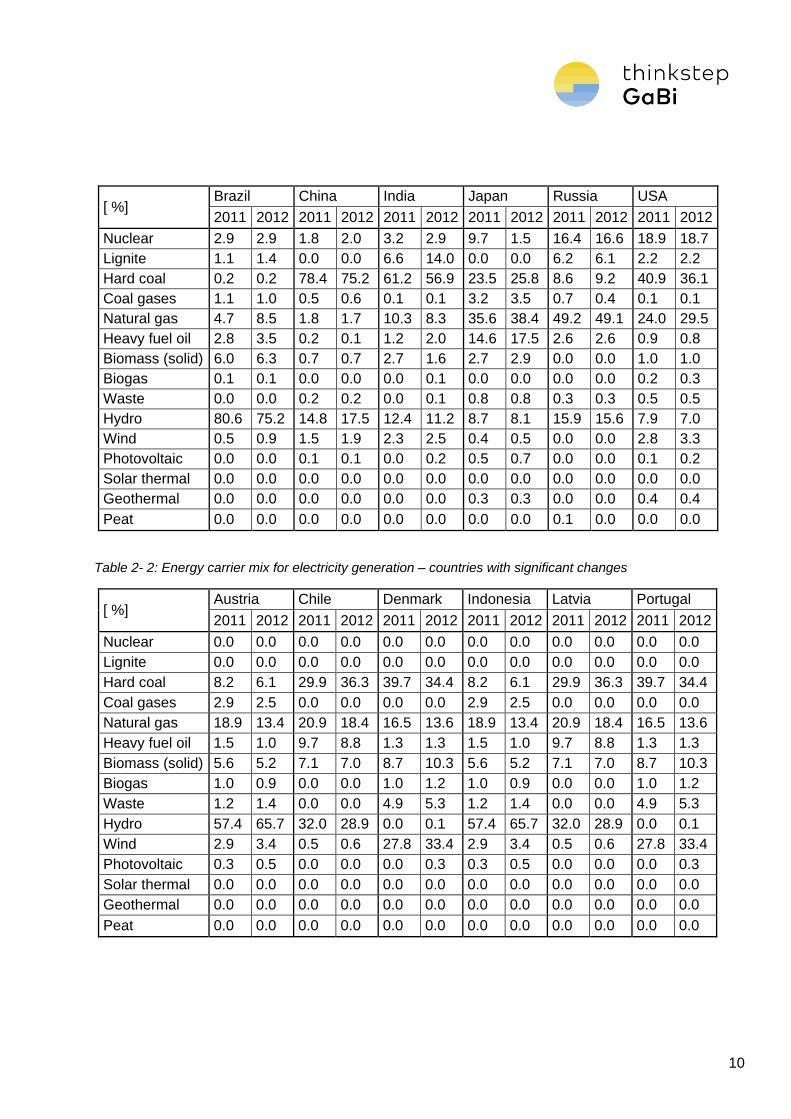
Table 2- 1: Energy carrier mix for electricity generation – selected EU countries
[ %] France Germany Great Britain Italy Poland Spain
2011 2012 2011 2012 2011 2012 2011 2012 2011 2012 2011 2012
Nuclear 78.7 75.5 17.8 15.8 18.8 19.4 0.0 0.0 0.0 0.0 19.8 20.7
Lignite 0.0 0.0 24.8 25.6 0.0 0.0 0.1 0.3 32.1 33.3 1.4 1.0
Hard coal 2.7 3.4 18.6 18.5 29.5 39.4 14.7 16.2 53.4 49.7 13.7 17.5
Coal gases 0.4 0.5 1.6 1.6 0.3 0.3 1.8 1.7 1.0 1.1 0.4 0.3
Natural gas 4.8 3.9 13.8 12.4 39.9 27.5 47.9 43.2 3.6 3.9 29.0 24.7
Heavy fuel oil 0.6 0.8 1.1 1.2 1.0 0.8 6.6 6.3 1.5 1.3 5.1 5.2
Biomass (solid) 0.3 0.3 1.9 1.9 1.5 1.9 0.8 0.9 4.4 5.9 1.0 1.1
Biogas 0.2 0.2 3.5 4.4 1.6 1.6 2.0 2.6 0.3 0.3 0.3 0.3
Waste 0.8 0.8 1.8 1.8 0.9 1.1 1.5 1.5 0.2 0.0 0.5 0.5
Hydro 9.0 11.4 3.9 4.4 2.3 2.3 15.8 14.7 1.7 1.5 11.3 8.1
Wind 2.2 2.6 8.1 8.1 4.2 5.4 3.3 4.5 2.0 2.9 14.6 16.6
Photovoltaic 0.4 0.7 3.2 4.2 0.1 0.3 3.6 6.3 0.0 0.0 2.5 2.8
Solar thermal 0.0 0.0 0.0 0.0 0.0 0.0 0.0 0.0 0.0 0.0 0.4 1.3
Geothermal 0.0 0.0 0.0 0.0 0.0 0.0 1.9 1.9 0.0 0.0 0.0 0.0
Peat 0.0 0.0 0.0 0.0 0.0 0.0 0.0 0.0 0.0 0.0 0.0 0.0
10
[ %] Brazil China India Japan Russia USA
2011 2012 2011 2012 2011 2012 2011 2012 2011 2012 2011 2012
Nuclear 2.9 2.9 1.8 2.0 3.2 2.9 9.7 1.5 16.4 16.6 18.9 18.7
Lignite 1.1 1.4 0.0 0.0 6.6 14.0 0.0 0.0 6.2 6.1 2.2 2.2
Hard coal 0.2 0.2 78.4 75.2 61.2 56.9 23.5 25.8 8.6 9.2 40.9 36.1
Coal gases 1.1 1.0 0.5 0.6 0.1 0.1 3.2 3.5 0.7 0.4 0.1 0.1
Natural gas 4.7 8.5 1.8 1.7 10.3 8.3 35.6 38.4 49.2 49.1 24.0 29.5
Heavy fuel oil 2.8 3.5 0.2 0.1 1.2 2.0 14.6 17.5 2.6 2.6 0.9 0.8
Biomass (solid) 6.0 6.3 0.7 0.7 2.7 1.6 2.7 2.9 0.0 0.0 1.0 1.0
Biogas 0.1 0.1 0.0 0.0 0.0 0.1 0.0 0.0 0.0 0.0 0.2 0.3
Waste 0.0 0.0 0.2 0.2 0.0 0.1 0.8 0.8 0.3 0.3 0.5 0.5
Hydro 80.6 75.2 14.8 17.5 12.4 11.2 8.7 8.1 15.9 15.6 7.9 7.0
Wind 0.5 0.9 1.5 1.9 2.3 2.5 0.4 0.5 0.0 0.0 2.8 3.3
Photovoltaic 0.0 0.0 0.1 0.1 0.0 0.2 0.5 0.7 0.0 0.0 0.1 0.2
Solar thermal 0.0 0.0 0.0 0.0 0.0 0.0 0.0 0.0 0.0 0.0 0.0 0.0
Geothermal 0.0 0.0 0.0 0.0 0.0 0.0 0.3 0.3 0.0 0.0 0.4 0.4
Peat 0.0 0.0 0.0 0.0 0.0 0.0 0.0 0.0 0.1 0.0 0.0 0.0
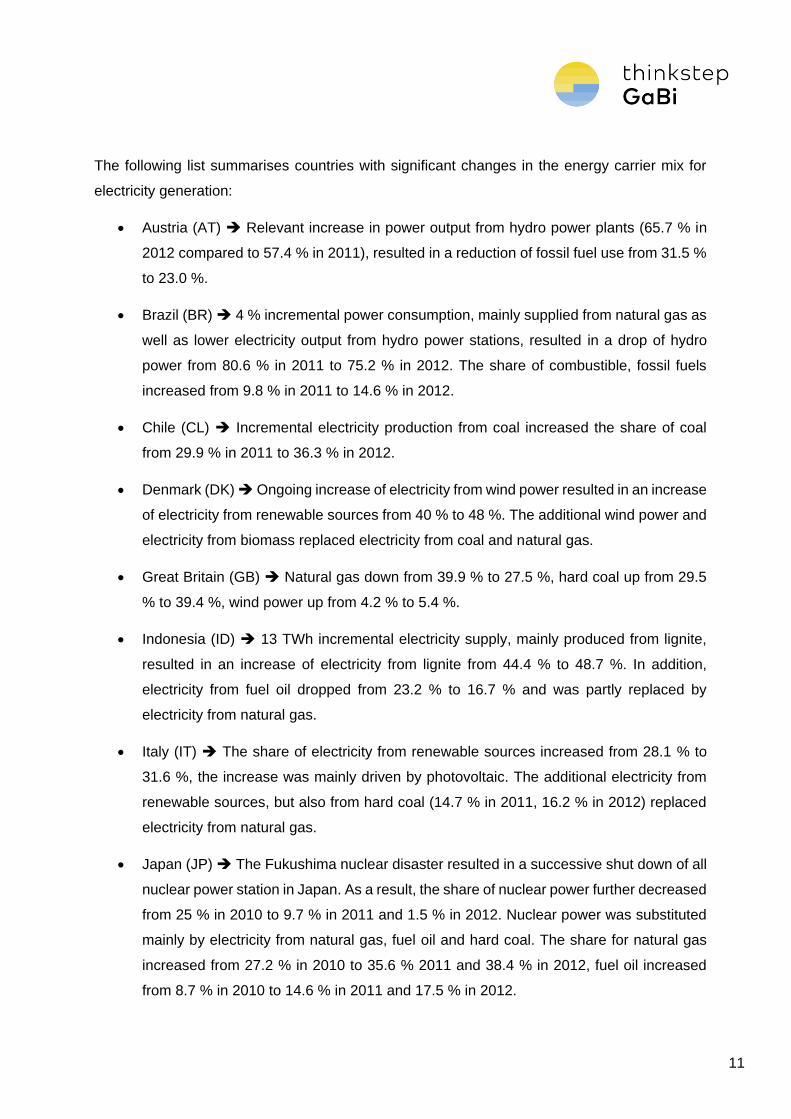
Table 2- 2: Energy carrier mix for electricity generation – countries with significant changes
[ %] Austria Chile Denmark Indonesia Latvia Portugal
2011 2012 2011 2012 2011 2012 2011 2012 2011 2012 2011 2012
Nuclear 0.0 0.0 0.0 0.0 0.0 0.0 0.0 0.0 0.0 0.0 0.0 0.0
Lignite 0.0 0.0 0.0 0.0 0.0 0.0 0.0 0.0 0.0 0.0 0.0 0.0
Hard coal 8.2 6.1 29.9 36.3 39.7 34.4 8.2 6.1 29.9 36.3 39.7 34.4
Coal gases 2.9 2.5 0.0 0.0 0.0 0.0 2.9 2.5 0.0 0.0 0.0 0.0
Natural gas 18.9 13.4 20.9 18.4 16.5 13.6 18.9 13.4 20.9 18.4 16.5 13.6
Heavy fuel oil 1.5 1.0 9.7 8.8 1.3 1.3 1.5 1.0 9.7 8.8 1.3 1.3
Biomass (solid) 5.6 5.2 7.1 7.0 8.7 10.3 5.6 5.2 7.1 7.0 8.7 10.3
Biogas 1.0 0.9 0.0 0.0 1.0 1.2 1.0 0.9 0.0 0.0 1.0 1.2
Waste 1.2 1.4 0.0 0.0 4.9 5.3 1.2 1.4 0.0 0.0 4.9 5.3
Hydro 57.4 65.7 32.0 28.9 0.0 0.1 57.4 65.7 32.0 28.9 0.0 0.1
Wind 2.9 3.4 0.5 0.6 27.8 33.4 2.9 3.4 0.5 0.6 27.8 33.4
Photovoltaic 0.3 0.5 0.0 0.0 0.0 0.3 0.3 0.5 0.0 0.0 0.0 0.3
Solar thermal 0.0 0.0 0.0 0.0 0.0 0.0 0.0 0.0 0.0 0.0 0.0 0.0
Geothermal 0.0 0.0 0.0 0.0 0.0 0.0 0.0 0.0 0.0 0.0 0.0 0.0
Peat 0.0 0.0 0.0 0.0 0.0 0.0 0.0 0.0 0.0 0.0 0.0 0.0
11
The following list summarises countries with significant changes in the energy carrier mix for
electricity generation:
Austria (AT) Relevant increase in power output from hydro power plants (65.7 % in
2012 compared to 57.4 % in 2011), resulted in a reduction of fossil fuel use from 31.5 %
to 23.0 %.
Brazil (BR) 4 % incremental power consumption, mainly supplied from natural gas as
well as lower electricity output from hydro power stations, resulted in a drop of hydro
power from 80.6 % in 2011 to 75.2 % in 2012. The share of combustible, fossil fuels
increased from 9.8 % in 2011 to 14.6 % in 2012.
Chile (CL) Incremental electricity production from coal increased the share of coal
from 29.9 % in 2011 to 36.3 % in 2012.
Denmark (DK) Ongoing increase of electricity from wind power resulted in an increase
of electricity from renewable sources from 40 % to 48 %. The additional wind power and
electricity from biomass replaced electricity from coal and natural gas.
Great Britain (GB) Natural gas down from 39.9 % to 27.5 %, hard coal up from 29.5
% to 39.4 %, wind power up from 4.2 % to 5.4 %.
Indonesia (ID) 13 TWh incremental electricity supply, mainly produced from lignite,
resulted in an increase of electricity from lignite from 44.4 % to 48.7 %. In addition,
electricity from fuel oil dropped from 23.2 % to 16.7 % and was partly replaced by
electricity from natural gas.
Italy (IT) The share of electricity from renewable sources increased from 28.1 % to
31.6 %, the increase was mainly driven by photovoltaic. The additional electricity from
renewable sources, but also from hard coal (14.7 % in 2011, 16.2 % in 2012) replaced
electricity from natural gas.
Japan (JP) The Fukushima nuclear disaster resulted in a successive shut down of all
nuclear power station in Japan. As a result, the share of nuclear power further decreased
from 25 % in 2010 to 9.7 % in 2011 and 1.5 % in 2012. Nuclear power was substituted
mainly by electricity from natural gas, fuel oil and hard coal. The share for natural gas
increased from 27.2 % in 2010 to 35.6 % 2011 and 38.4 % in 2012, fuel oil increased
from 8.7 % in 2010 to 14.6 % in 2011 and 17.5 % in 2012.
12
Latvia (LV) Higher output from hydro power station resulted in an increase of hydro
power from 47.4 % in 2011 to 60.1 % in 2012. The overall share of electricity from
renewable increased from 50.5 % to 66.6 %, as a consequence the share of electricity
from hard coal dropped from 49.5 % to 33.3 %.
Portugal (PT) Lower water availability for hydro power, reduced the share of hydro
power from 23.1 % in 2011 to 14.3 % in 2012. In contrast the share of wind power
increased from 17.5 % in 2011 to 22 % in 2012. In addition, the share of natural gas
dropped from 28.4 % in 2011 to 22.9 % in 2012. To balance the supply, electricity from
hard coal increased from 18.8 % in 2012 to 28.1 % in 2012.
Spain (ES) Also in Spain, lower water availability reduced the output from hydro power
stations. Higher generation from wind power kept the supply from renewable energy
sources constant at 30.5 %. Generation from natural gas dropped from 29 % to 24.6 %
and was replaced by electricity from coal (13.7 % in 2011, 17.5 % in 2012).
Development GWP and other impact categories for electricity grid mix datasets
In the 2016 edition databases, the emission factors for the combustion of fuels in power plants
have been updated. In contrast to the electricity grid mixes, the emission factors are not updated
every year, because new emissions factors are not published on yearly basis, i.e. the emission
factors in the 2014 database referred mainly to a time period of 2006-2008. In the 2016 edition
databases most emission factors refer to 2012. In the European Union, the Large Combustion
Plant (LCP) Directive [EC 2001] has set limits for criteria pollutants, such as SO2, NOx and
particulate matter. The limits are binding for combustion plants with a thermal capacity over 50
MW since 2008. Operators of existing plants were allowed to operate 20,000 hours until 2016
exceeding the limits. After 2023 the emission limits in the LCP will be further tightened by the
Directive on Industrial Emissions [EC 2010].
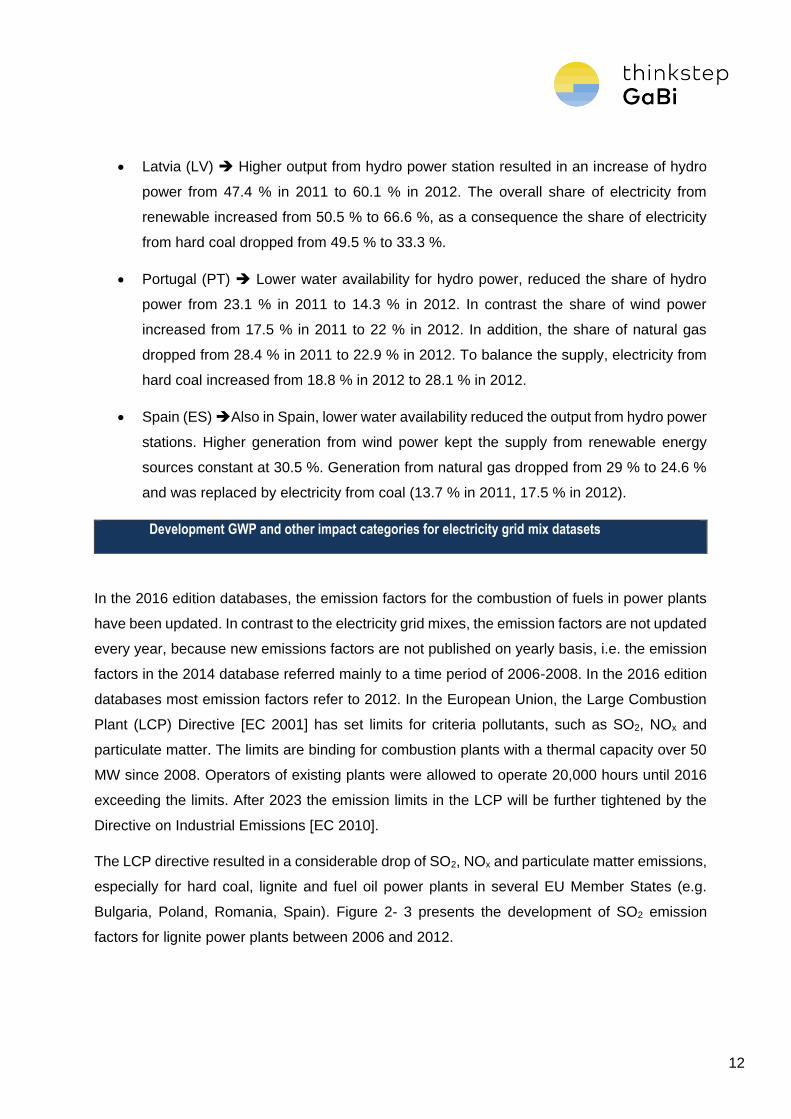
The LCP directive resulted in a considerable drop of SO2, NOx and particulate matter emissions,
especially for hard coal, lignite and fuel oil power plants in several EU Member States (e.g.
Bulgaria, Poland, Romania, Spain). Figure 2- 3 presents the development of SO2 emission
factors for lignite power plants between 2006 and 2012.
13
Figure 2- 3: Development SO2 emission factors for lignite power plants (selected countries)
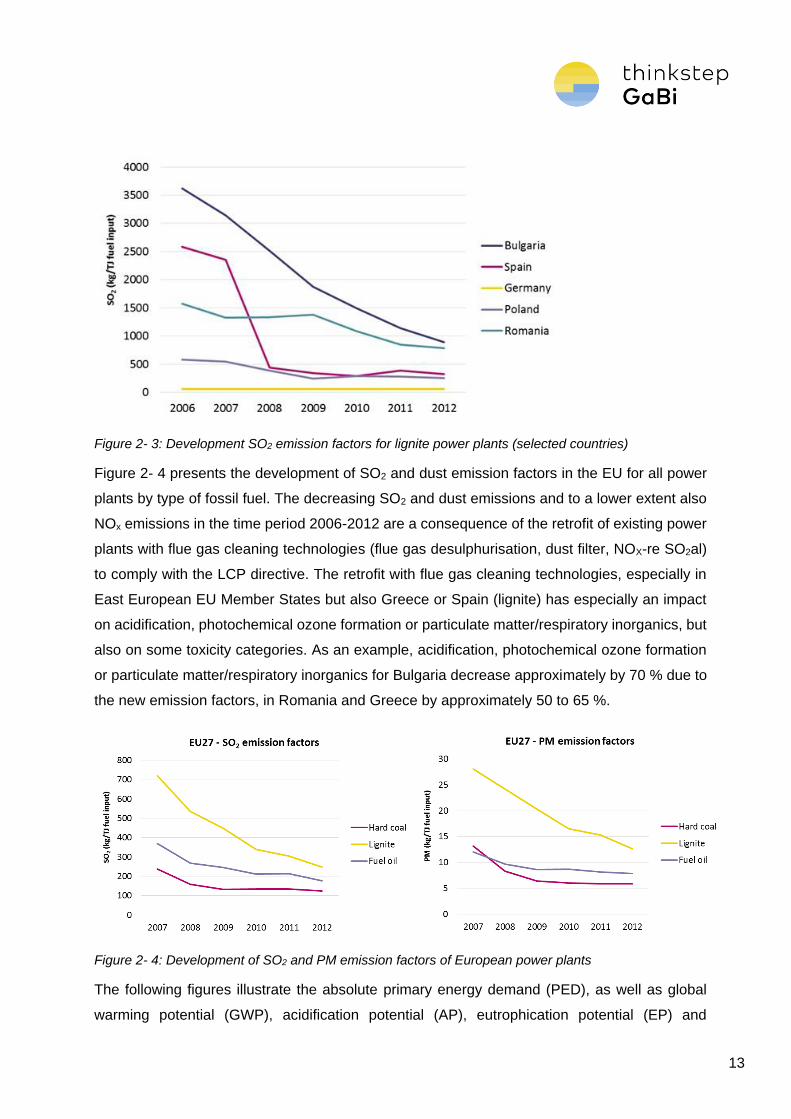
Figure 2- 4 presents the development of SO2 and dust emission factors in the EU for all power
plants by type of fossil fuel. The decreasing SO2 and dust emissions and to a lower extent also
NOx emissions in the time period 2006-2012 are a consequence of the retrofit of existing power
plants with flue gas cleaning technologies (flue gas desulphurisation, dust filter, NOX-re SO2al)
to comply with the LCP directive. The retrofit with flue gas cleaning technologies, especially in
East European EU Member States but also Greece or Spain (lignite) has especially an impact
on acidification, photochemical ozone formation or particulate matter/respiratory inorganics, but
also on some toxicity categories. As an example, acidification, photochemical ozone formation
or particulate matter/respiratory inorganics for Bulgaria decrease approximately by 70 % due to
the new emission factors, in Romania and Greece by approximately 50 to 65 %.
Figure 2- 4: Development of SO2 and PM emission factors of European power plants
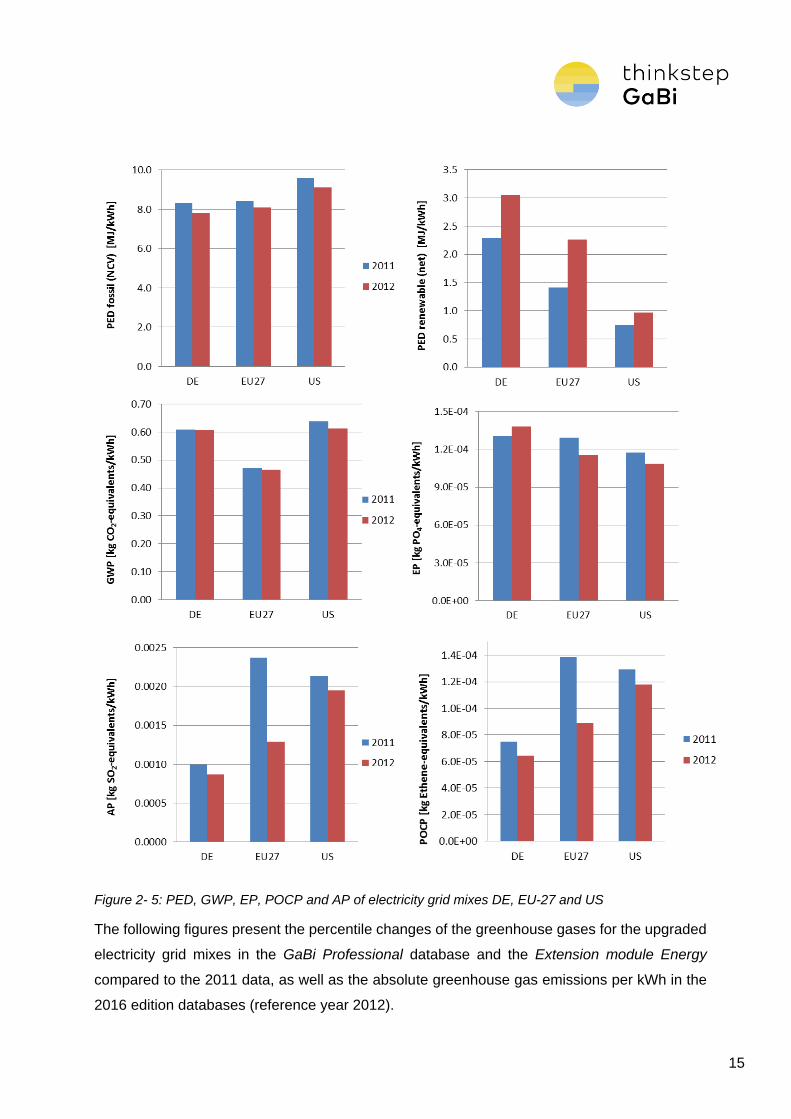
The following figures illustrate the absolute primary energy demand (PED), as well as global
warming potential (GWP), acidification potential (AP), eutrophication potential (EP) and
14
photochemical ozone creation potential (POCP) per kWh of supplied electricity in Germany, the
European Union and the United States.
In Germany, the GWP for the electricity mix remained stable with 606 g/kWh in 2012 compared
to 610 g/kWh in 2011. Although the electricity production from renewables has been grown by
11 %, it has mainly substituted nuclear power with a low carbon intensity. The increase in
renewable PED is driven by the increase of electricity from renewable energy sources. The
changes in AP, EP and POCP are mainly related to updates in the supply of fuels.
Although the share of electricity from renewable sources increased considerably from 21.4 % to
24.4 % in the EU, the GWP in the EU decreased only slightly by 1.5 %. The reason is that the
share of nuclear power decreased and the decreasing share of electricity from natural gas was
replaced by electricity from coal. The LCP directives resulted in a decrease in SO2, NOx and PM
emission from fossil power plants in the EU in 2012. As a result, the impact categories AP (-46
%), POCP (-36 %), EP (-11 %) are lower in the 2016 edition database compared to the previous
version.
In the U.S., the replacement of coal by natural gas for power generation has decreased the
GWP by 4 % as well as AP and POCP by 9 % and EP by 7 %.
15
Figure 2- 5: PED, GWP, EP, POCP and AP of electricity grid mixes DE, EU-27 and US
The following figures present the percentile changes of the greenhouse gases for the upgraded
electricity grid mixes in the GaBi Professional database and the Extension module Energy
compared to the 2011 data, as well as the absolute greenhouse gas emissions per kWh in the
2016 edition databases (reference year 2012).
16
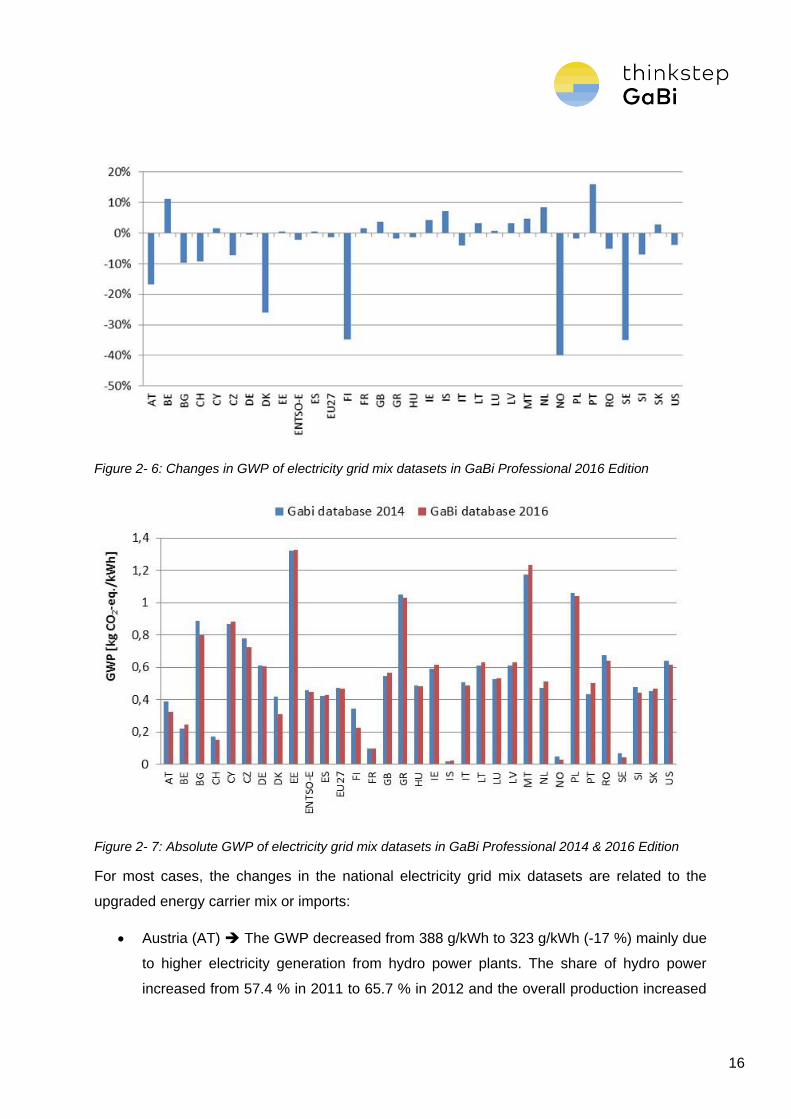
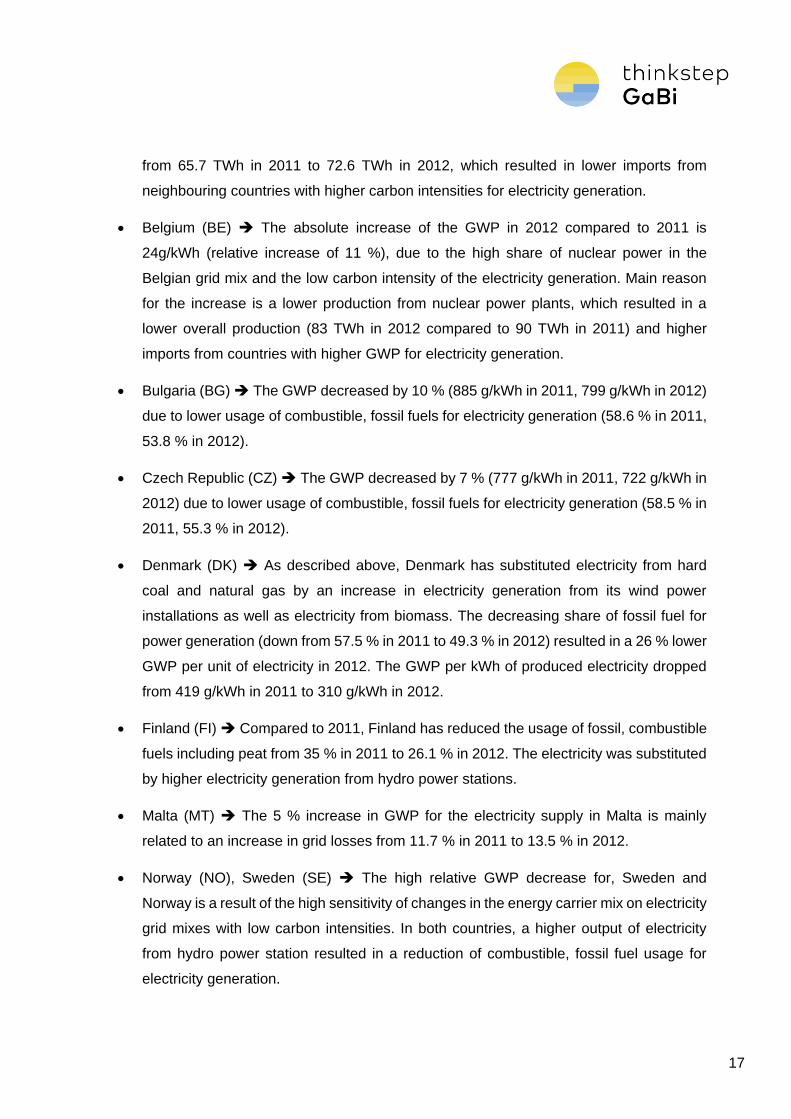
Figure 2- 6: Changes in GWP of electricity grid mix datasets in GaBi Professional 2016 Edition
Figure 2- 7: Absolute GWP of electricity grid mix datasets in GaBi Professional 2014 & 2016 Edition
For most cases, the changes in the national electricity grid mix datasets are related to the
upgraded energy carrier mix or imports:
Austria (AT) The GWP decreased from 388 g/kWh to 323 g/kWh (-17 %) mainly due
to higher electricity generation from hydro power plants. The share of hydro power
increased from 57.4 % in 2011 to 65.7 % in 2012 and the overall production increased
17
from 65.7 TWh in 2011 to 72.6 TWh in 2012, which resulted in lower imports from
neighbouring countries with higher carbon intensities for electricity generation.
Belgium (BE) The absolute increase of the GWP in 2012 compared to 2011 is
24g/kWh (relative increase of 11 %), due to the high share of nuclear power in the
Belgian grid mix and the low carbon intensity of the electricity generation. Main reason
for the increase is a lower production from nuclear power plants, which resulted in a
lower overall production (83 TWh in 2012 compared to 90 TWh in 2011) and higher
imports from countries with higher GWP for electricity generation.
Bulgaria (BG) The GWP decreased by 10 % (885 g/kWh in 2011, 799 g/kWh in 2012)
due to lower usage of combustible, fossil fuels for electricity generation (58.6 % in 2011,
53.8 % in 2012).
Czech Republic (CZ) The GWP decreased by 7 % (777 g/kWh in 2011, 722 g/kWh in
2012) due to lower usage of combustible, fossil fuels for electricity generation (58.5 % in
2011, 55.3 % in 2012).
Denmark (DK) As described above, Denmark has substituted electricity from hard
coal and natural gas by an increase in electricity generation from its wind power
installations as well as electricity from biomass. The decreasing share of fossil fuel for
power generation (down from 57.5 % in 2011 to 49.3 % in 2012) resulted in a 26 % lower
GWP per unit of electricity in 2012. The GWP per kWh of produced electricity dropped
from 419 g/kWh in 2011 to 310 g/kWh in 2012.
Finland (FI) Compared to 2011, Finland has reduced the usage of fossil, combustible
fuels including peat from 35 % in 2011 to 26.1 % in 2012. The electricity was substituted
by higher electricity generation from hydro power stations.
Malta (MT) The 5 % increase in GWP for the electricity supply in Malta is mainly
related to an increase in grid losses from 11.7 % in 2011 to 13.5 % in 2012.
Norway (NO), Sweden (SE) The high relative GWP decrease for, Sweden and
Norway is a result of the high sensitivity of changes in the energy carrier mix on electricity
grid mixes with low carbon intensities. In both countries, a higher output of electricity
from hydro power station resulted in a reduction of combustible, fossil fuel usage for
electricity generation.
18
Portugal (PT) The increased GWP per produced unit of electricity is related to the
lower output from hydro power stations, compensated by electricity from coal, and a
substitution of electricity from natural gas, again, by electricity from hard coal.
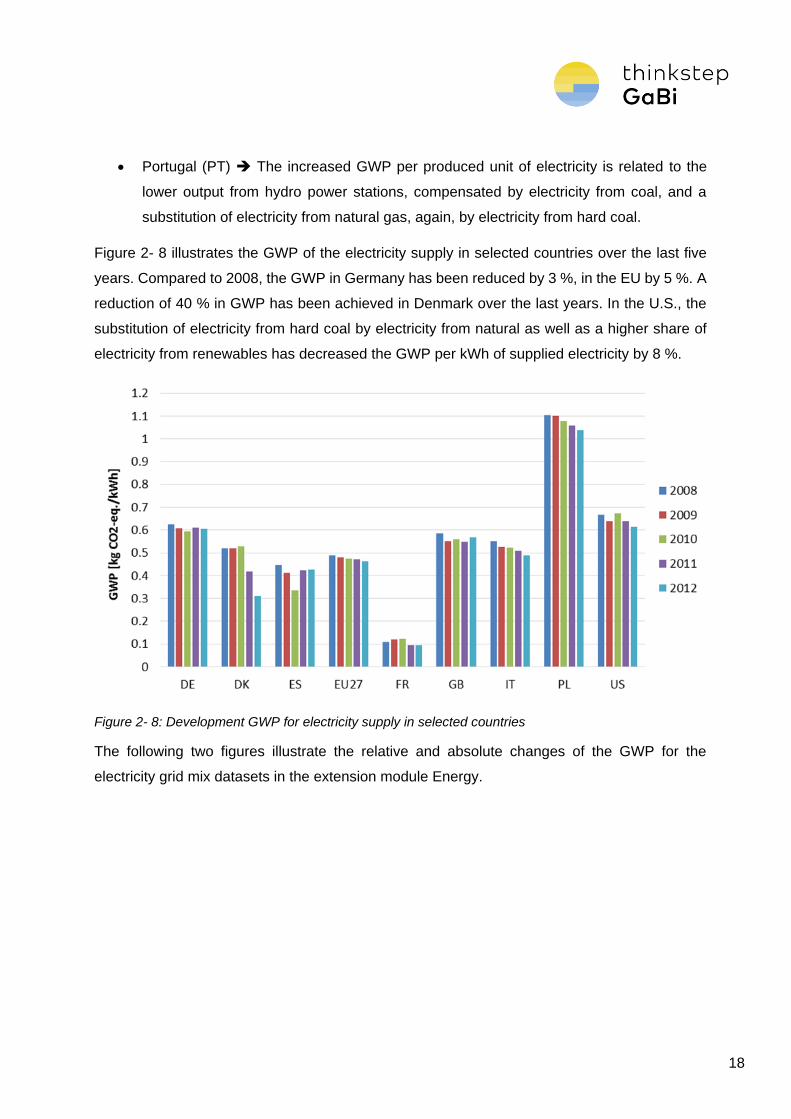
Figure 2- 8 illustrates the GWP of the electricity supply in selected countries over the last five
years. Compared to 2008, the GWP in Germany has been reduced by 3 %, in the EU by 5 %. A
reduction of 40 % in GWP has been achieved in Denmark over the last years. In the U.S., the
substitution of electricity from hard coal by electricity from natural as well as a higher share of
electricity from renewables has decreased the GWP per kWh of supplied electricity by 8 %.
Figure 2- 8: Development GWP for electricity supply in selected countries
The following two figures illustrate the relative and absolute changes of the GWP for the
electricity grid mix datasets in the extension module Energy.
19
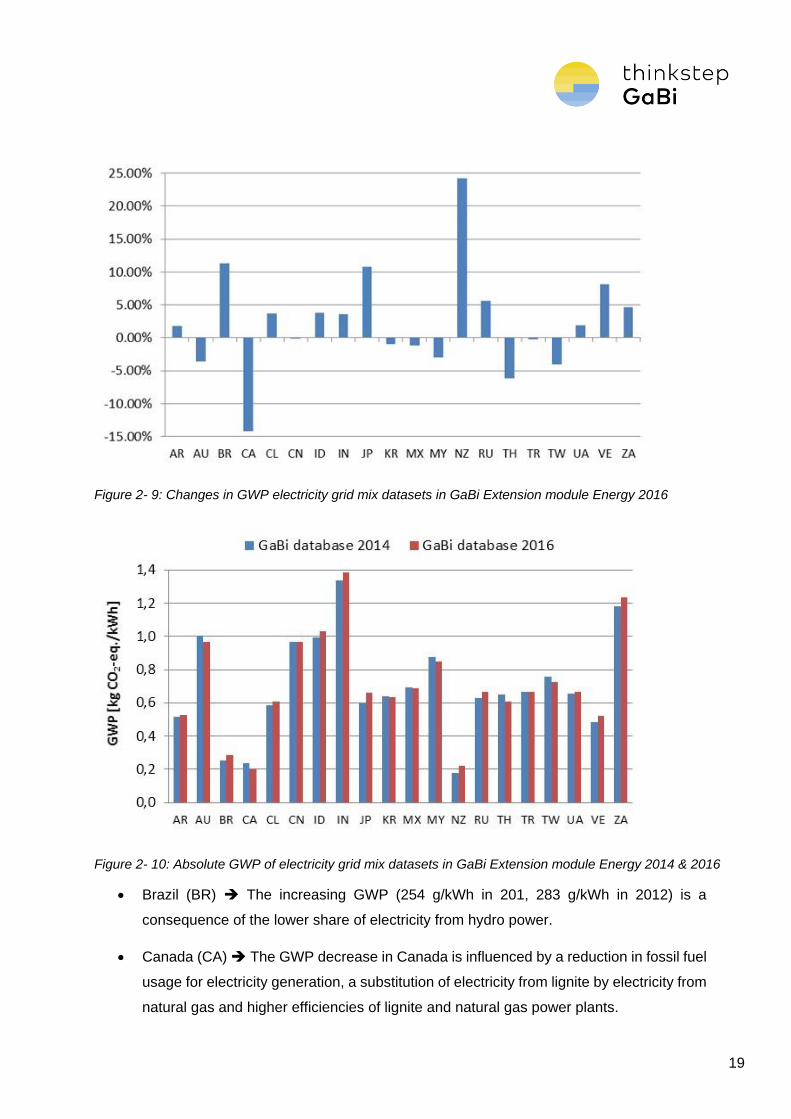
Figure 2- 9: Changes in GWP electricity grid mix datasets in GaBi Extension module Energy 2016
Figure 2- 10: Absolute GWP of electricity grid mix datasets in GaBi Extension module Energy 2014 & 2016
Brazil (BR) The increasing GWP (254 g/kWh in 201, 283 g/kWh in 2012) is a
consequence of the lower share of electricity from hydro power.
Canada (CA) The GWP decrease in Canada is influenced by a reduction in fossil fuel
usage for electricity generation, a substitution of electricity from lignite by electricity from
natural gas and higher efficiencies of lignite and natural gas power plants.
20
India (IN) The increasing GWP in India is a consequence of the incremental electricity
generation from lignite.
Japan (JP) The changes in the GWP of the Japanese electricity supply are influenced
by the Fukushima nuclear disaster in March 2011. The switch from nuclear power
stations (see also discussion above) to natural gas and fuel oil power plants is the main
driver for the increased GWP (596 g/kWh in 2011, 660 g/kWh in 2011).
New Zealand (NZ) The decrease in electricity output from hydro power stations was
mainly substituted by electricity from coal, resulting in a 24 % increase in GWP (177
g/kWh in 2011, 220 g/kWh in 2012).
Further developments in electricity datasets
Changes in electricity data sets from specific fuels:
Power plant efficiencies, calculated based on IEA statistics, can significantly vary between the
reference years. The following reasons are considerations for variations over time:
final or periodic shutdown of specific power plants,
different share between CHP and direct production over time (e.g. different heat demand
over time),
technology measures to increase efficiency
irregular usage over time (e.g. used as reserve capacity),
rounding effects (if little fuel is used),
correction of statistical errors
a combination of several of the factors listed above
Ionizing radiation:
The impact factor Ionizing radiation is - despite ongoing discussions around its liability and
relevance - one of the mandatory indicators in PEF pilot studies (Product Environmental
Footprint). Within the PEF pilot studies a systematic use and interpretation of ionizing radiation
values and its results lead to a proposal to reduce the figures of the ionizing radiation in related
21
GaBi models of the nuclear power plants, as the values were considered to be too high. To be
able to instantly apply this reduced values to the affected GaBi datasets, the release of Service
Pack 28 (SP28) in October 2015 used a manual correction by dividing all the relevant flows by
a factor of 13, knowing that in the next update the changes will be iterated throughout the
complete database. Consequently in the Database 2016 Edition an iteration of the complete
databases was done. Therefore - as an effect of the overall iteration in the 2016 upgrade - the
ionizing radiation increases with a value below 10%, compensating the manual correction of SP
28 to its final values. Checking the European electricity grid mix against the PEF normalisation
factor, we found our values being reasonably within the uncertainty range.
2.2. Inventories for primary energy carriers
In the GaBi databases 2016 Edition3, the reference year is 2012 for all energy carrier supply
mixes (e.g. hard coal, crude oil and natural gas). The changes of the energy carrier processes
after the upgrade are described in the following.
Primary energy carrier processes after the upgrade
Relevant changes in the environmental impact categories of the crude oil mix data sets are
related to the update of the country-specific crude oil mixes (mix of domestic production and
imports). In general, changing shares of crude oil imports from countries with low environmental
impacts (e.g. Norway) or high environmental impacts (e.g. Nigeria) affect the impacts. Mixes
with significant changes are:
Crude oil mix of Great Britain (GB) higher impacts (e.g. GWP: +28 %) are caused by
decreasing shares of domestic production (49 % in 2011, 44 % in 2012) and crude oil
from Norway (31 % in 2011, 26 % in 2012) and increasing shares of crude oil from Libya
(1 % in 2011, 3 % in 2012), Nigeria (4 % in 2011, 7 % in 2012) and Russia (5 % in 2011,
7 % in 2012).
Crude oil mix of Greece (GR) major impact changes (positive and negative) are
related to a decreased share of crude oil from Iran (37 % in 2011, 9 % in 2012) and
increased shares of crude oil from Libya (4 % in 2011, 13 % in 2012), Russia (25 % in
2011, 33 % in 2012), Iraq (10 % in 2011, 16 % in 2012), Kazakhstan (3 % in 2011, 8 %
in 2012).
22
Crude oil mix of Ireland (IE) decreasing share of crude oil from Norway (75 % in 2011,
22 % in 2012) and increasing shares of crude oil from Algeria (1 % in 2011, 34 % in
2012), Nigeria (15 % in 2011, 33 % in 2012), and Libya (5 % in 2011, 11 % in 2012)
result in significant higher impact categories (e.g. GWP: +100 %).
Changing shares of imports from countries with low environmental impacts (e.g. Norway) or high
environmental impacts also affect the environmental impacts of the natural gas mixes.
Furthermore, the transportation method of the imported natural gas (e.g. by tanker as liquefied
natural gas (LNG) or via pipeline) plays an important role. The following mixes show notable
changes in the impacts:
Natural gas mix of Belgium (BE) decreasing share of natural gas from Norway (45 %
in 2011, 35 % in 2012) and increasing share of LNG from Qatar (13 % in 2011, 23 % in
2012) result in significant higher impact categories (e.g. GWP: +21 %).
Natural gas mix of Great Britain (GB) lower impacts (e.g. GWP: -18 %) due to a
decreasing share of LNG from Qatar (21 % in 2011, 14 % in 2012) and an increasing
share of natural gas from Norway (21 % in 2011, 29 % in 2012).
In addition, the country-specific flow properties of natural gas and liquefied natural gas (LNG)
have been updated.
Changes in the impacts of the lignite and hard coal mixes are due to the update of the country-
specific lignite and hard coal mixes (mix of domestic production and imports) and the update
and improvement of the lignite and hard coal mining processes. Except of the lignite mix of
Europe (EU-27), the hard coal and lignite mixes show minor changes:
Lignite mix of Europe (EU-27) lower impacts (e.g. GWP: -17 %) are related to a stop
of lignite imports from Estonia (4 % in 2011, 0 % in 2012) and an increasing share of
lignite from Germany (39 % in 2011, 42 % in 2012). In addition changes are caused by
the update and improvement of the lignite mining process.
The environmental impacts of the fuel mixes (diesel and gasoline, at refinery and filling station)
change considerably due to the following updates and improvements:
Creation of more detailed data sets of the biodiesel and bioethanol supply,
Update of the country-specific mixes (domestic production and imports) of diesel and
gasoline,
23
Update of the country-specific blending quota of biofuels and
Update of the crude oil mixes.
Fuel mixes with significant effects on the impacts are:
Gasoline mix of Brazil (BR) substantial impact changes (positive and negative, e.g.
GWP reduction by 150-190 %) are mostly related to the update of the supply chain of
bioethanol from sugar cane.
Diesel mix of Great Britain (GB) in a large part, the updates of the country-specific
biodiesel mix and the supply chains of biodiesel are responsible to notable changes (e.g.
GWP +24-34 %).
Changes in the environmental impacts of the other refinery products, like aromatics or heavy
fuel oil, are related to changes in the background system (e.g. crude oil supply).
2.3. Organic and inorganic intermediates
Possible updates and upgrades of technologies may happen on 3 different levels. In the
upgraded datasets most cases multiple effects can be observed.
Due to possible breakthrough technologies (improvements in the foreground system of the
existing technology), due to changed situations in a production or consumption mix of different
technologies providing the same product and last but not least due to changes and updates in
the background system of resources and energy supply.
The needed information to check and update the technologies and supply chains are based on
the knowhow of our engineers as well as on information shared by our customers that are active
in the chemical sector. The provided documentation of GaBi datasets serves as viable basis to
discuss supply chain aspects and demands.
Our experts use scientific and engineering knowhow (e.g. thermodynamic laws, the mass- and
energy conservation, stoichiometric balances, combustion calculation and alike) as basis to
maintain and update chemical LCA data. All chemical technologies were checked in this sense.
In relation to possible breakthrough technologies no major new technologies or significant
process improvements on existing technologies were identified by thinkstep experts in this
year’s upgrade.
Changes in the background system mainly relate to:
24
Upgraded distribution on primary, secondary and tertiary fossil resource extraction like
oil and gas
Upgraded market share of imported fossil resources
Upgraded distribution of the type of resources used (oil, gas and coal, etc.)
Increased amount of renewable feedstock and energy supply
Changes in the energy sector and supply chain are in most cases the drivers for overall
improvement throughout several impact categories. The intermediates are directly influenced by
the upgraded performance of the energy supply and the important resource, crude oil and
natural gas.
22 datasets were added to the Extension database Ia: organic intermediates. Among those are
eight datasets for glycerine as a by-product out of the rapeseed methyl ester process (price and
energy allocated, German and European boundary conditions). Other datasets are e.g. “EU-27:
3-Dimethylaminopropylamine (DMAPA)” or “EU-27: Tallow fatty acid (C16-C18 fatty acid from
tallow)”.
Three datasets for titanium dioxide were added to the Extension database Ib: inorganic
intermediates: European dataset for titanium dioxide via chloride and sulphate process
respectively, and one dataset on German boundary conditions via sulphate process. Additionally
a dataset for Aluminium hydroxide from aluminium sulphate is now available.
Table 2- 3: Issues Organic and inorganic intermediates category
JIRA
Tracking
Number
Issue
Category
Item Description Change in
results
Affects
Extension
module
GC-1210 New Titanium
dioxide (TiO2)
dataset
Titanium dioxide is the
most widely used
pigment in the world
and now available to
the Extension database
Ib: inorganic
intermediates and
Extension database
XVII: full US
New
dataset,
therefore not
applicable.
Extension
database Ib:
inorganic
intermediates
GC-1332 New Glycerine
based on
rapeseed
methyl ester
(RME)
8 new glycerine
datasets are now
available in the
"Extension database Ia:
organic intermediates".
They are based on
New
dataset,
therefore not
applicable.
Extension
database Ia:
organic
intermediates
25
rapeseed methyl ester
(RME).
GC-3007 Documen-
tation
Methanol -
included
datasets
Documentation for EU-
27: Methanol mix was
updated, including the
used datasets field
Does not
change the
results.
Extension
database Ia:
organic
intermediates
GC-2465 Documen-
tation
Flow diagram
in HMDA
from
butadiene via
adiponitrile
The flow diagram was
updated.
Does not
change the
results
"Extension
database Ia:
organic
intermediates
2.4. Inventories for metal processes
All data and models have been checked by thinkstep metals experts regarding technological
upgrades and were identified as representative for their technology descriptions in 2016.
In the 2016 upgrade, the PGM metal prices have been updated. The prices were updated using
USGS data. Like in the related publication, the prices have all been normalized to a 1992
equivalent dollar. Additionally, the prices for the rare earth metals have been updated as well.
Further changes in the metals supply chains primarily relate to the update of the background
system (such as energy, intermediates) as thinkstep experts had no indications for other
significant foreground process changes or improvements in the metal sector.
With this year’s upgrade a new dataset for DRI is available: IN: Hot rolled coil (Direct Reduced
Iron Steel).
Table 2- 4: Issues metal processes category
JIRA
Tracking
Number
Issue
Category
Item Description Change in
results
Affects
Extension
module
GC-982 Improve-
ment
Update metal
prices
Some metals (especially
the PGM group) use a
price allocation in the
smelter process. The
prices have been updated
to a 10 year average using
data from USGS.
Additionally, the prices
have been normalized to a
1992 equivalent dollar, as
Most
substantial
change occurs
in palladium
The impacts
decrease by
about 40% in all
categories.
Ruthenium
Extension
database
VI:
precious
metals
26
also done in the USGS
publication.
increases by
about 25%.
GC-1056 Documen-
tation
Aluminium
oxide mix
(alumina,
Al2O3):
process image
The documentation of the
process EU-27 “Aluminium
oxide mix (alumina,
Al2O3)” has been updated.
Does not
change the
results.
Extension
database
IV:
Aluminium
GC-1781 Bug Rare earth
datasets
The electricity mix at the
mining extraction step of
the rare earth was updated
from average Chinese
electricity grid mix to an
electricity mix containing a
higher amount of
hydropower in the
respective Chinese
province.
For the Rare
metals after
processing, the
changes are as
follows:
- decrease of 12
to 16% of ADPf,
EP, GWP,
ODP, POCP)
- no significant
changes in the
other impact
categories
Extension
database
VI:
precious
metals
GC-2395 Bug Manganese:
"Inert rock" as
resource flow
Dataset had Inert rock
[Non renewable resources]
as output flow. This was
changed to "Waste rock".
However, since the waste
rock is redumped into the
pit, this was modelled
accordingly (not
accounting for a netto
waste mass).
Does not
change the
results.
Extension
database
V:
nonferrous
metals
GC-2767 Improve-
ment
GLO: Gold mix
(primary,
copper and
recycling
route)
Recycled gold is now
considered. It originates
from remelted jewellery
and electronics. For
jewellery only the energy
required to remelt the gold
must be accounted for.
Due to the
recycling,
impacts
decrease
between 23%
and 46%.
Extension
database
VI:
precious
metals
GC-2841 Improve-
ment
Price
quantities for
Rare Earth
The prices for the rare
earth metals have been
harmonized to the prices of
2013.
Depending on
the metal, the
change can be
quite
substantial.
Neodymium
oxide,
Praseodymium
oxide and
Yttrium oxide
increase the
Extension
database
VI:
precious
metals
27
Global
Warming
Potential by
about 180%.
ADPelements is
increased by
about 170% as
well. Samarium
oxide
decreases by
about 90%,
2.5. Inventories plastic processes
The environmental profile of polymers is largely influenced by the monomer impacts. thinkstep
experts checked whether the polymerisation technologies are still representative. To our
knowledge no completely new process designs in polymerisation are in industrial use compared
to last year. The polymerisation technologies in the GaBi Databases are considered
representative. This is supported by our experience within the chemistry and polymer industry.
30 new adhesive datasets have been added to the Extension database VII: plastics.
More specific aspects are mentioned in the following table:
Table 2- 5: Issues plastics processes category
JIRA
Tracking
Number
Issue
Category
Item Description Change in
results
Affects
Extension
module
GC-1990 Improve-
ment
US waste
incineration
data sets of
bioplastics
The bioplastic incineration
datasets are now using the
US specific waste
incineration plant as basis
By replacing the
German with
the US
incineration
plant, the LCIA
results increase
between 10 to
40% for the
common impact
categories AP,
EP and the
primary energy.
For the impact
category GWP,
the result
remain stable
(decreases by
Extension
database
XIX:
bioplastics

28
about 1%) and
for POCP it
decreases
about 2%,
except Bio
polyamide (PA)
4.10 which
increases for
about 5% and
Bio polyvinyl
chloride (PVC)
which increases
for about 40%
2.6. Inventories for end-of-life processes
The existing generic end-of-life processes were checked for their validity and passed. New
dataset have been added, which enable the user to create own specific end of life treatments.
The extension database IX: end of life now has a substantial amount of new items: 46 plans and
14 processes were added. Based on Eurostat data, plans for end of life of glass
(landfill/incineration), paper/cardboard (landfill/incineration), plastics (landfill/incineration) and
municipal waste water treatment (sludge treatment mix) are available for Belgium, Germany,
Spain, Europe, France, Great Britain, Italy, The Netherlands, Poland and Romania. If necessary,
the share of the waste treatments can be adapted by the user.
New specific material incineration plants are available, such as cotton, hemp or polyamide.
Additionally, hazardous waste treatments for Europe and Germany using statistic averages can
now be used.
More specific aspects are mentioned in the following table.
Table 2- 6: Issues end-of-life processes category
JIRA
Tracking
Number
Issue
Category
Item Description Change in
results
Affects
Extension
module
GC-1462 New DE:
Hazardous
waste (no C,
incl.
landfilling)
In mining activities, even
after slag recycling, some
hazardous waste is
generated. The modelled
waste is not incinerated
because it is inorganic.
New dataset,
therefore not
applicable.
Extension
database
IX: end of
life
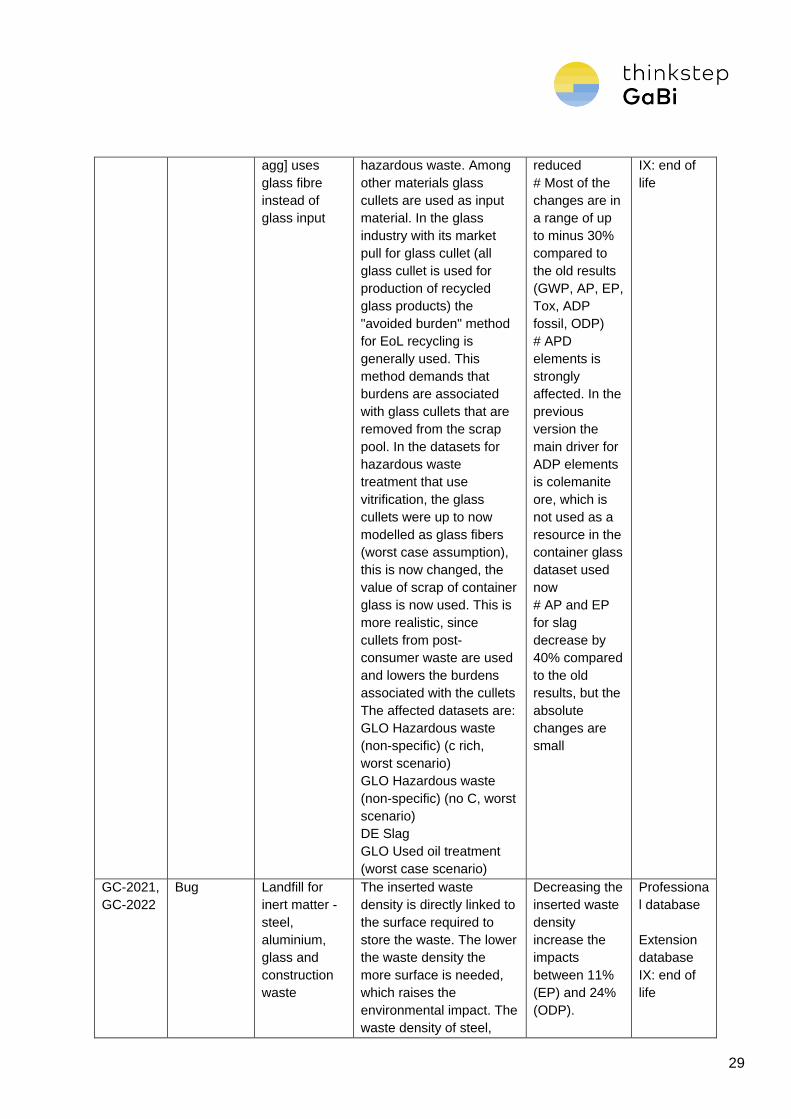
GC-1626 Improve-
ment
DE:
Vitrification [p-
Vitrification is a process
used for processing
Almost all
impacts are
Extension
database
29
agg] uses
glass fibre
instead of
glass input
hazardous waste. Among
other materials glass
cullets are used as input
material. In the glass
industry with its market
pull for glass cullet (all
glass cullet is used for
production of recycled
glass products) the
"avoided burden" method
for EoL recycling is
generally used. This
method demands that
burdens are associated
with glass cullets that are
removed from the scrap
pool. In the datasets for
hazardous waste
treatment that use
vitrification, the glass
cullets were up to now
modelled as glass fibers
(worst case assumption),
this is now changed, the
value of scrap of container
glass is now used. This is
more realistic, since
cullets from post-
consumer waste are used
and lowers the burdens
associated with the cullets
The affected datasets are:
GLO Hazardous waste
(non-specific) (c rich,
worst scenario)
GLO Hazardous waste
(non-specific) (no C, worst
scenario)
DE Slag
GLO Used oil treatment
(worst case scenario)
reduced
# Most of the
changes are in
a range of up
to minus 30%
compared to
the old results
(GWP, AP, EP,
Tox, ADP
fossil, ODP)
# APD
elements is
strongly
affected. In the
previous
version the
main driver for
ADP elements
is colemanite
ore, which is
not used as a
resource in the
container glass
dataset used
now
# AP and EP
for slag
decrease by
40% compared
to the old
results, but the
absolute
changes are
small
IX: end of
life
GC-2021,
GC-2022
Bug Landfill for
inert matter -
steel,
aluminium,
glass and
construction
waste
The inserted waste
density is directly linked to
the surface required to
store the waste. The lower
the waste density the
more surface is needed,
which raises the
environmental impact. The
waste density of steel,
Decreasing the
inserted waste
density
increase the
impacts
between 11%
(EP) and 24%
(ODP).
Professiona
l database
Extension
database
IX: end of
life
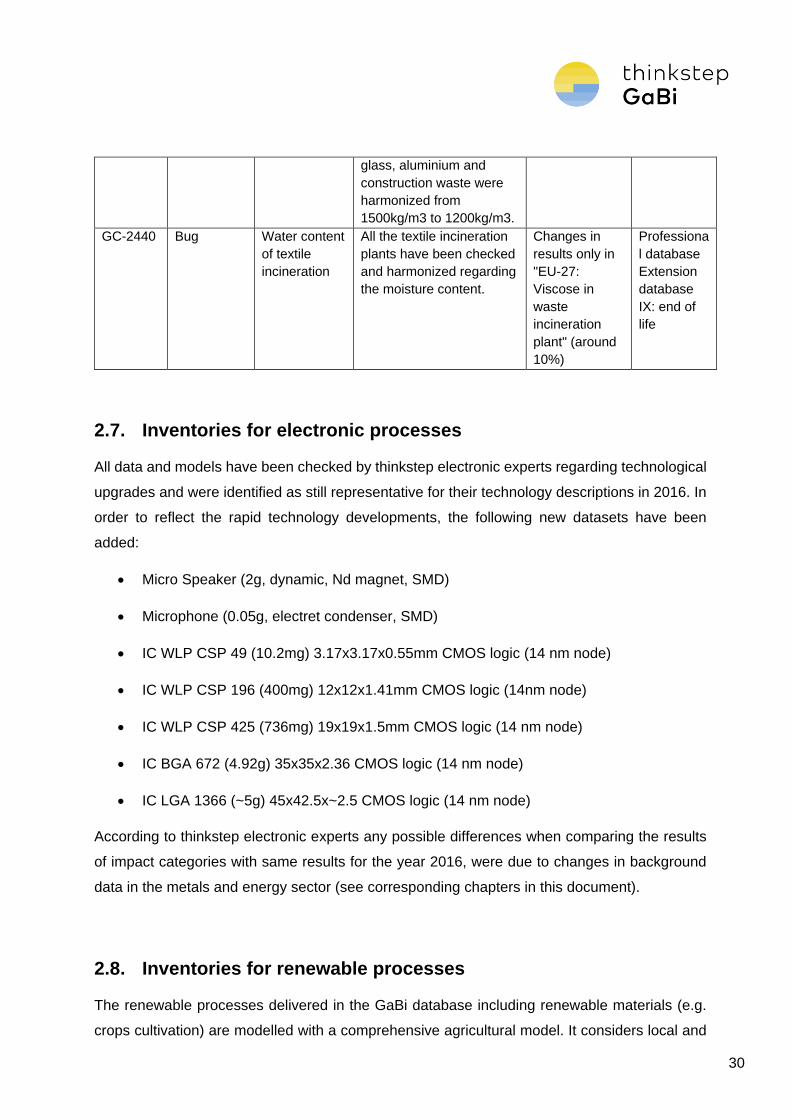
30
glass, aluminium and
construction waste were
harmonized from
1500kg/m3 to 1200kg/m3.
GC-2440 Bug Water content
of textile
incineration
All the textile incineration
plants have been checked
and harmonized regarding
the moisture content.
Changes in
results only in
"EU-27:
Viscose in
waste
incineration
plant" (around
10%)
Professiona
l database
Extension
database
IX: end of
life
2.7. Inventories for electronic processes
All data and models have been checked by thinkstep electronic experts regarding technological
upgrades and were identified as still representative for their technology descriptions in 2016. In
order to reflect the rapid technology developments, the following new datasets have been
added:
Micro Speaker (2g, dynamic, Nd magnet, SMD)
Microphone (0.05g, electret condenser, SMD)
IC WLP CSP 49 (10.2mg) 3.17x3.17x0.55mm CMOS logic (14 nm node)
IC WLP CSP 196 (400mg) 12x12x1.41mm CMOS logic (14nm node)
IC WLP CSP 425 (736mg) 19x19x1.5mm CMOS logic (14 nm node)
IC BGA 672 (4.92g) 35x35x2.36 CMOS logic (14 nm node)
IC LGA 1366 (~5g) 45x42.5x~2.5 CMOS logic (14 nm node)
According to thinkstep electronic experts any possible differences when comparing the results
of impact categories with same results for the year 2016, were due to changes in background
data in the metals and energy sector (see corresponding chapters in this document).
2.8. Inventories for renewable processes
The renewable processes delivered in the GaBi database including renewable materials (e.g.
crops cultivation) are modelled with a comprehensive agricultural model. It considers local and
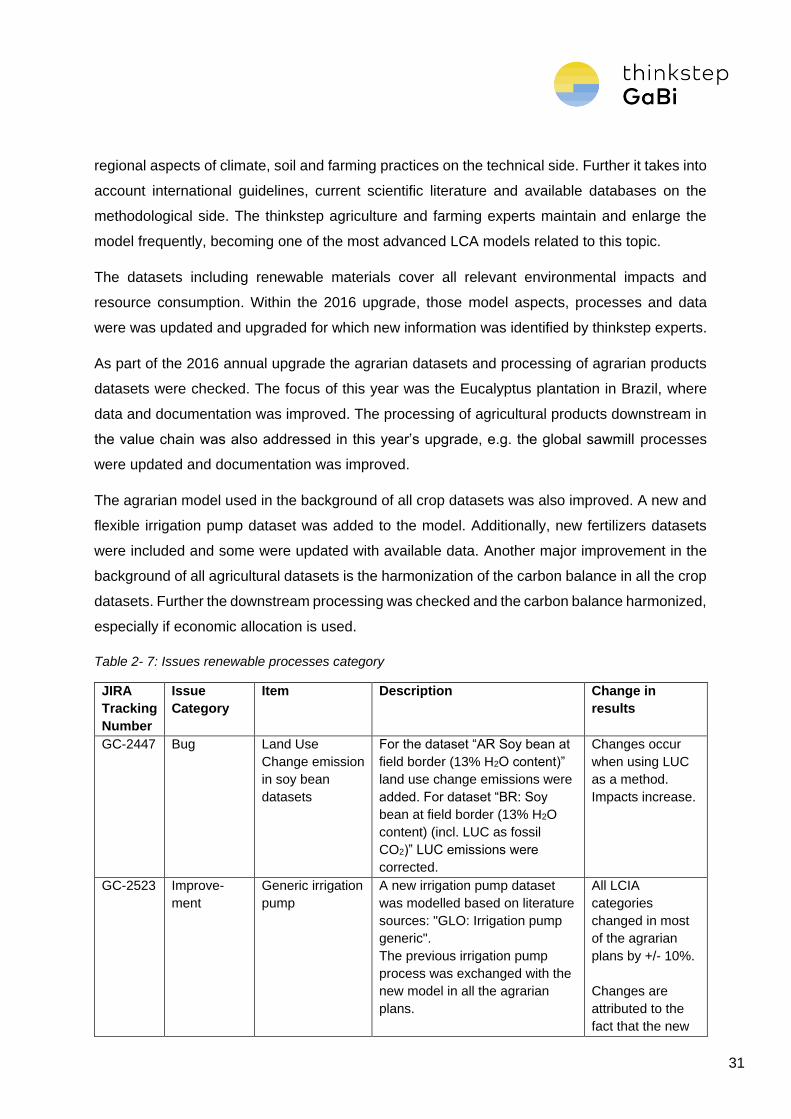
31
regional aspects of climate, soil and farming practices on the technical side. Further it takes into
account international guidelines, current scientific literature and available databases on the
methodological side. The thinkstep agriculture and farming experts maintain and enlarge the
model frequently, becoming one of the most advanced LCA models related to this topic.
The datasets including renewable materials cover all relevant environmental impacts and
resource consumption. Within the 2016 upgrade, those model aspects, processes and data
were was updated and upgraded for which new information was identified by thinkstep experts.
As part of the 2016 annual upgrade the agrarian datasets and processing of agrarian products
datasets were checked. The focus of this year was the Eucalyptus plantation in Brazil, where
data and documentation was improved. The processing of agricultural products downstream in
the value chain was also addressed in this year’s upgrade, e.g. the global sawmill processes
were updated and documentation was improved.
The agrarian model used in the background of all crop datasets was also improved. A new and
flexible irrigation pump dataset was added to the model. Additionally, new fertilizers datasets
were included and some were updated with available data. Another major improvement in the
background of all agricultural datasets is the harmonization of the carbon balance in all the crop
datasets. Further the downstream processing was checked and the carbon balance harmonized,
especially if economic allocation is used.
Table 2- 7: Issues renewable processes category
JIRA
Tracking
Number
Issue
Category
Item Description Change in
results
GC-2447 Bug Land Use
Change emission
in soy bean
datasets
For the dataset “AR Soy bean at
field border (13% H2O content)”
land use change emissions were
added. For dataset “BR: Soy
bean at field border (13% H2O
content) (incl. LUC as fossil
CO2)” LUC emissions were
corrected.
Changes occur
when using LUC
as a method.
Impacts increase.
GC-2523 Improve-
ment
Generic irrigation
pump
A new irrigation pump dataset
was modelled based on literature
sources: "GLO: Irrigation pump
generic".
The previous irrigation pump
process was exchanged with the
new model in all the agrarian
plans.
All LCIA
categories
changed in most
of the agrarian
plans by +/- 10%.
Changes are
attributed to the
fact that the new
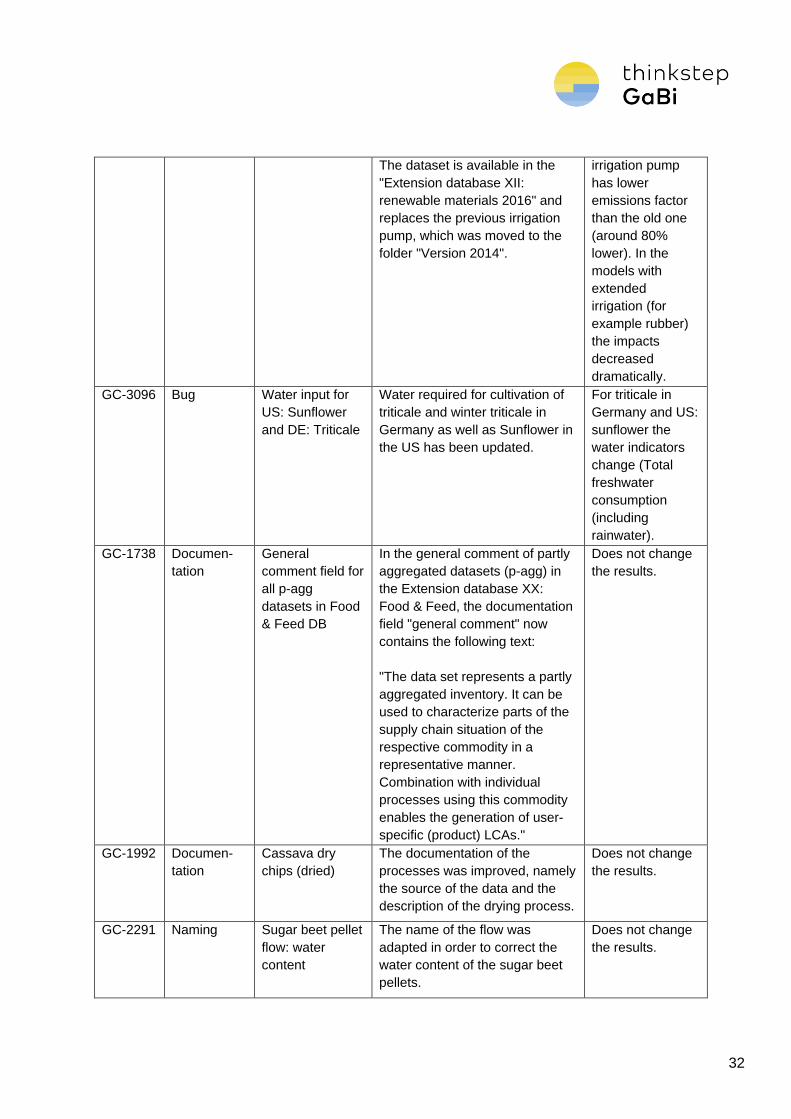
32
The dataset is available in the
"Extension database XII:
renewable materials 2016" and
replaces the previous irrigation
pump, which was moved to the
folder "Version 2014".
irrigation pump
has lower
emissions factor
than the old one
(around 80%
lower). In the
models with
extended
irrigation (for
example rubber)
the impacts
decreased
dramatically.
GC-3096 Bug Water input for
US: Sunflower
and DE: Triticale
Water required for cultivation of
triticale and winter triticale in
Germany as well as Sunflower in
the US has been updated.
For triticale in
Germany and US:
sunflower the
water indicators
change (Total
freshwater
consumption
(including
rainwater).
GC-1738 Documen-
tation
General
comment field for
all p-agg
datasets in Food
& Feed DB
In the general comment of partly
aggregated datasets (p-agg) in
the Extension database XX:
Food & Feed, the documentation
field "general comment" now
contains the following text:
"The data set represents a partly
aggregated inventory. It can be
used to characterize parts of the
supply chain situation of the
respective commodity in a
representative manner.
Combination with individual
processes using this commodity
enables the generation of user-
specific (product) LCAs."
Does not change
the results.
GC-1992 Documen-
tation
Cassava dry
chips (dried)
The documentation of the
processes was improved, namely
the source of the data and the
description of the drying process.
Does not change
the results.
GC-2291 Naming Sugar beet pellet
flow: water
content
The name of the flow was
adapted in order to correct the
water content of the sugar beet
pellets.
Does not change
the results.
33
2.9. Inventories for construction processes
Foreground data and models have been checked by thinkstep construction experts regarding
technological upgrades and passed. Identified technology improvements were updated in the
database. This year’s update includes construction material information on European basis.
Over 500 datasets have been added, e.g. for mineral materials, building appliances and end of
life information. For several European countries, datasets for the usage of woodchip and pellet
boilers have been added. Additionally, in total 50 EPDs datasets have been included in the
extension database XIV: construction materials.
Further changes leading back to the background system (energy, intermediates) are responsible
for the remaining differences between GaBi Databases 2014 and 2016 for construction.
Specific aspects for this year’s upgrade are mentioned in the following table.
Table 2- 8: Issues construction processes category
JIRA
Tracking
Number
Issue
Category
Item Description Change in
results
Affects
Extension
module
GC-830 New Dataset
"Recycling
potential steel
thick plate hot
rolled"
New dataset including all
End of life information
(i.e. not using EN15804
modules) was created
New dataset,
therefore not
applicable.
Extension
database XIV
Construction
materials
GC-1254 Improve-
ment
Cooling agent
in air
conditioners
The refrigerant used in
commercial and
residential air
conditioners is now
mostly R410a. This has
been harmonized in all
production and usage
processes for air
conditioners. Additionally,
the leakage rate has
been adopted. It has
been lowered from 8% to
2%.
The changes
affect most
noticeably
ODP. ODP
decreases
between 50%
for the
production and
about 90% for
the use phase.
Extension
database XIV
Construction
materials
GC-1313 Bug DE: Timber
cedar (12%
moisture/
10,7% Water
content)
The wood species
density was corrected in
the dataset.
The impact
categories
ADP, AP, EP,
GWP and ODP
decreased
Extension
database XIV
Construction
materials
34
between 2%
and 9%
GC-1608 Bug Electronic
ballast EB
(EN15804 C4)
The process "Electronic
ballast EB (EN15804
C4)" now correctly
addresses only module
C4.
Extension
database XIV
Construction
materials
GC-1891 Improve-
ment
Transport
distance for
mineral
materials
The transport distance
between the quarry and
the plant was harmonized
to 10km. In the
documentation of the
affected datasets it was
clarified that a transport
takes place and that the
distance is 10km.
Since the
transport
distance was
lowered, the
GWP, AP, EP,
ADPf and
Primary Energy
decreased
between 10% -
40%. If using
CML, the
POCP
increased.
Extension
database XIV
Construction
materials
GC-1965 Improve-
ment
Harmonize
waste
incineration
plants in
building
services End
of Life
For the end of life
datasets of building
services, EU-27
incinerations plants for
several plastics were
exchanged with German
incineration plants.
ADP elements
increase for all
considered
processes. This
is due to a
difference for
the end of life
treatment of
ashes. ODP
decreases due
to electricity
grid mix
changes to
Germany,
which contains
less nuclear
electricity
Extension
database XIV
Construction
materials
GC-
1973,
GC-3188
Improve-
ment
Scrap input in
datasets
EN 15804 processes
shall have open scrap
inputs so that the
practitioner can loop back
scrap before crediting the
rest of the scrap in
module D.
Impacts
generally
decrease
Extension
database XIV
Construction
materials
35
GC-2242 Improve-
ment
Harmonize
EN15804
modules in
asphalt
production
The installation of the
asphalt was grouped in
A1-A3, this has been
corrected.
Lowers the
results for
module A1-A3.
Extension
database XIV
Construction
materials
GC-2243 Improve-
ment
Transport
distance in
timber
The transport distance for
wood from the logging
site to the site of further
processing was
harmonized to 125km.
Changes are
<1%.
Extension
database XIV
Construction
materials
GC-2509 Bug Datasets have
resource flow
as product
(reference)
flow
The datasets "Tiles and
slabs from natural stone
(average) - Euroroc (A1-
A3)" and "Tiles and slabs
from natural stone
(average) - Euroroc (A4)"
had the flow "Natural
stone [Non-renewable
resources]" as reference
flow.
This was changed to the
valuable substance flow
"Natural stone (mix)".
Does not
change the
results.
Extension
database XIV
Construction
materials
GC-2652 Bug Water balance
in "crushed
stone" dataset
The water balance for
crushed rock, crushed
sand and grit has been
corrected.
Only affected
category is
water
consumption.
Blue water
consumption
and total
freshwater
consumption
decrease to a
very large
extent.
Extension
database XIV
Construction
materials
GC-3174 Naming Quantitative
reference and
name for
aerated
concrete block
The two equally named
datasets "Aerated
concrete block (EN15804
A1-A3)" have been
renamed to "Aerated
concrete block P2 04 not
reinforced (EN15804 A1-
A3)" and "Aerated
concrete block P2 05 not
Does not
change the
results.
Extension
database XIV
Construction
materials
36
reinforced (EN15804 A1-
A3)". In the
documentation, the
average density of
"Aerated concrete block
P2 05 not reinforced
(EN15804 A1-A3)" has
been corrected to 472
kg/m3.
GC-3258 Improve-
ment
Steel profiles
(I/U/H/L/T)
(EN15804 A1-
A3) and Steel
sections
(EN15804 A1-
A3)
Steel profiles and
sections used for
construction applications
consist to a large extent
of secondary steel (EAF
route) and not primary
steel. This has been
adapted in two datasets:
DE: Steel sections
(EN15804 A1-A3) and
DE: Steel profiles
(I/U/H/L/T) (EN15804 A1-
A3). Steel sections now
consist of 80% secondary
and 20% primary steel,
steel profiles of 70%
secondary and 30%
primary steel.
The documentation has
been updated
accordingly.
The impacts of
steel sections
and steel
profiles
decreases by
about 50% to
60% in all
categories.
Extension
database XIV
Construction
materials
GC-3543 Bug Harmonization
of valuable
substance
flows for
concrete and
cement
processes
The valuable substance
flow in concretes
BR/CN/UA C25/30 has
been changed from
"Concrete C20-25" to
"Concrete C25-30". In
concretes from
BR/CN/UA C35/45 the
valuable substance flow
has been changed from
"Concrete C30-35" to
"Concrete C35-45". In
UA: Cement CEM IV 42.5
the valuable substance
Does not
change the
results.
Extension
database XIV
Construction
materials
37
flow has been changed
from "Cem III 42.5" to
"Cem IV 42.5".
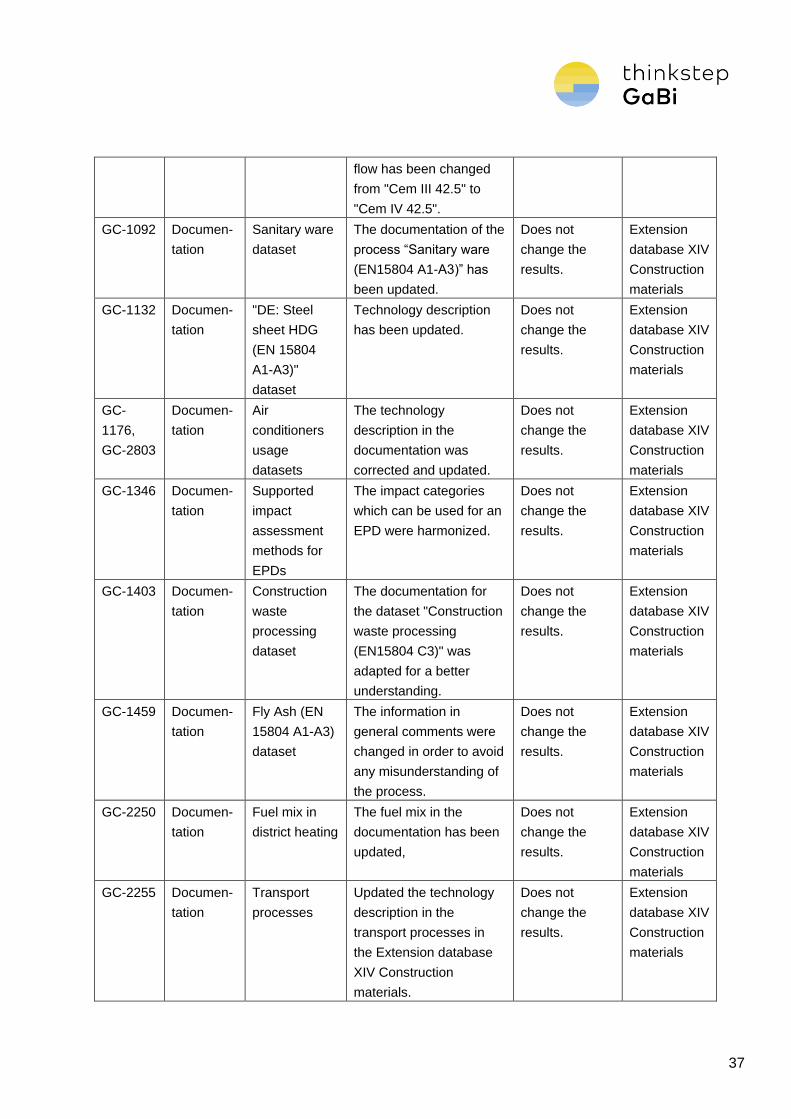
GC-1092 Documen-
tation
Sanitary ware
dataset
The documentation of the
process “Sanitary ware
(EN15804 A1-A3)” has
been updated.
Does not
change the
results.
Extension
database XIV
Construction
materials
GC-1132 Documen-
tation
"DE: Steel
sheet HDG
(EN 15804
A1-A3)"
dataset
Technology description
has been updated.
Does not
change the
results.
Extension
database XIV
Construction
materials
GC-
1176,
GC-2803
Documen-
tation
Air
conditioners
usage
datasets
The technology
description in the
documentation was
corrected and updated.
Does not
change the
results.
Extension
database XIV
Construction
materials
GC-1346 Documen-
tation
Supported
impact
assessment
methods for
EPDs
The impact categories
which can be used for an
EPD were harmonized.
Does not
change the
results.
Extension
database XIV
Construction
materials
GC-1403 Documen-
tation
Construction
waste
processing
dataset
The documentation for
the dataset "Construction
waste processing
(EN15804 C3)" was
adapted for a better
understanding.
Does not
change the
results.
Extension
database XIV
Construction
materials
GC-1459 Documen-
tation
Fly Ash (EN
15804 A1-A3)
dataset
The information in
general comments were
changed in order to avoid
any misunderstanding of
the process.
Does not
change the
results.
Extension
database XIV
Construction
materials
GC-2250 Documen-
tation
Fuel mix in
district heating
The fuel mix in the
documentation has been
updated,
Does not
change the
results.
Extension
database XIV
Construction
materials
GC-2255 Documen-
tation
Transport
processes
Updated the technology
description in the
transport processes in
the Extension database
XIV Construction
materials.
Does not
change the
results.
Extension
database XIV
Construction
materials
38
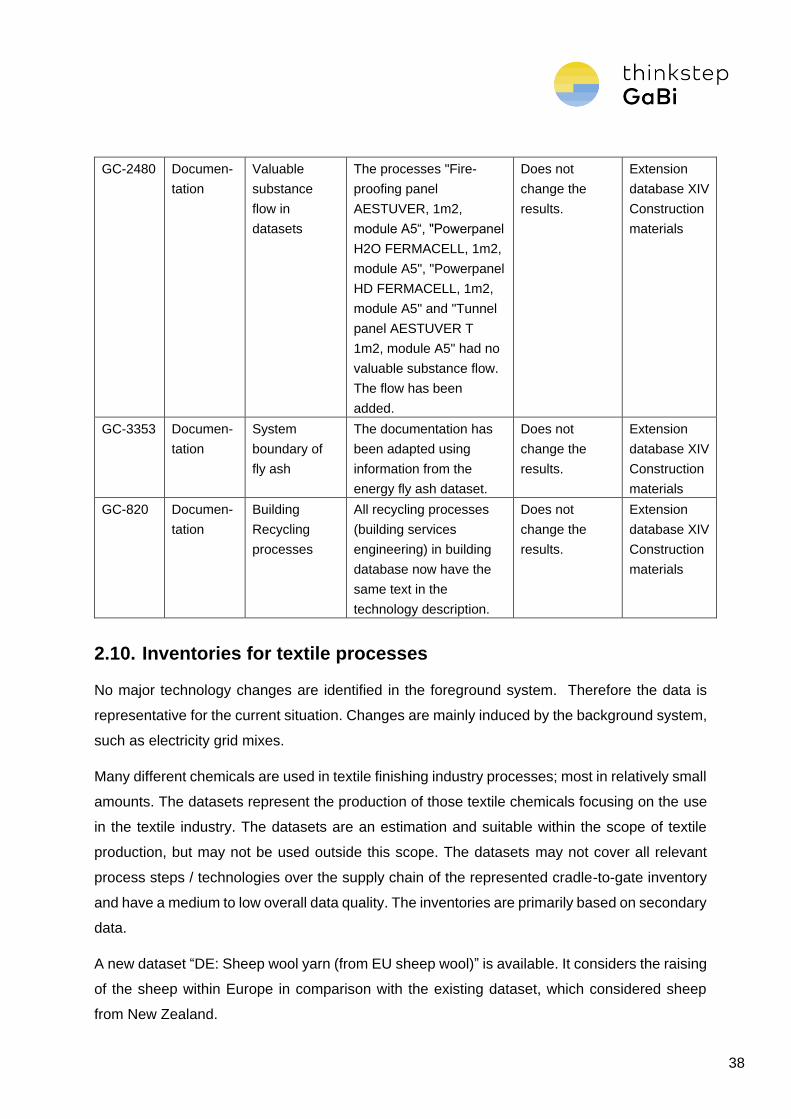
GC-2480 Documen-
tation
Valuable
substance
flow in
datasets
The processes "Fire-
proofing panel
AESTUVER, 1m2,
module A5“, "Powerpanel
H2O FERMACELL, 1m2,
module A5", "Powerpanel
HD FERMACELL, 1m2,
module A5" and "Tunnel
panel AESTUVER T
1m2, module A5" had no
valuable substance flow.
The flow has been
added.
Does not
change the
results.
Extension
database XIV
Construction
materials
GC-3353 Documen-
tation
System
boundary of
fly ash
The documentation has
been adapted using
information from the
energy fly ash dataset.
Does not
change the
results.
Extension
database XIV
Construction
materials
GC-820 Documen-
tation
Building
Recycling
processes
All recycling processes
(building services
engineering) in building
database now have the
same text in the
technology description.
Does not
change the
results.
Extension
database XIV
Construction
materials
2.10. Inventories for textile processes
No major technology changes are identified in the foreground system. Therefore the data is
representative for the current situation. Changes are mainly induced by the background system,
such as electricity grid mixes.
Many different chemicals are used in textile finishing industry processes; most in relatively small
amounts. The datasets represent the production of those textile chemicals focusing on the use
in the textile industry. The datasets are an estimation and suitable within the scope of textile
production, but may not be used outside this scope. The datasets may not cover all relevant
process steps / technologies over the supply chain of the represented cradle-to-gate inventory
and have a medium to low overall data quality. The inventories are primarily based on secondary
data.
A new dataset “DE: Sheep wool yarn (from EU sheep wool)” is available. It considers the raising
of the sheep within Europe in comparison with the existing dataset, which considered sheep
from New Zealand.
39
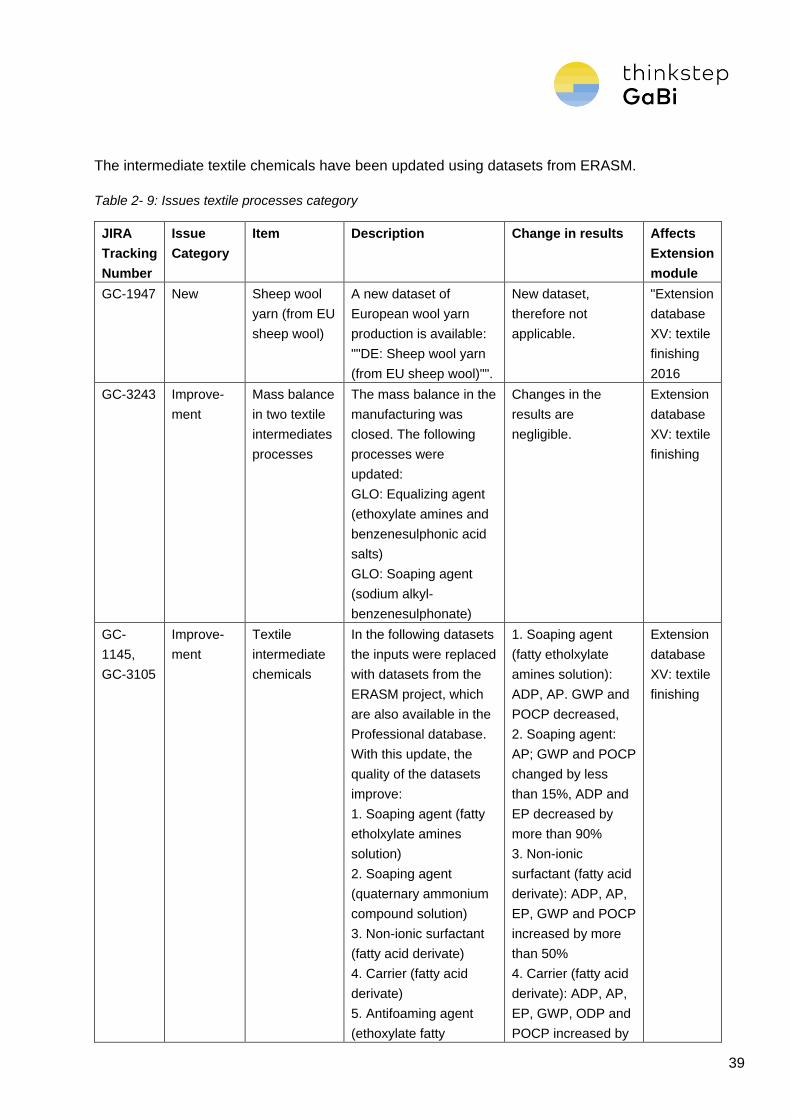
The intermediate textile chemicals have been updated using datasets from ERASM.
Table 2- 9: Issues textile processes category
JIRA
Tracking
Number
Issue
Category
Item Description Change in results Affects
Extension
module
GC-1947 New Sheep wool
yarn (from EU
sheep wool)
A new dataset of
European wool yarn
production is available:
""DE: Sheep wool yarn
(from EU sheep wool)"".
New dataset,
therefore not
applicable.
"Extension
database
XV: textile
finishing
2016
GC-3243 Improve-
ment
Mass balance
in two textile
intermediates
processes
The mass balance in the
manufacturing was
closed. The following
processes were
updated:
GLO: Equalizing agent
(ethoxylate amines and
benzenesulphonic acid
salts)
GLO: Soaping agent
(sodium alkyl-
benzenesulphonate)
Changes in the
results are
negligible.
Extension
database
XV: textile
finishing
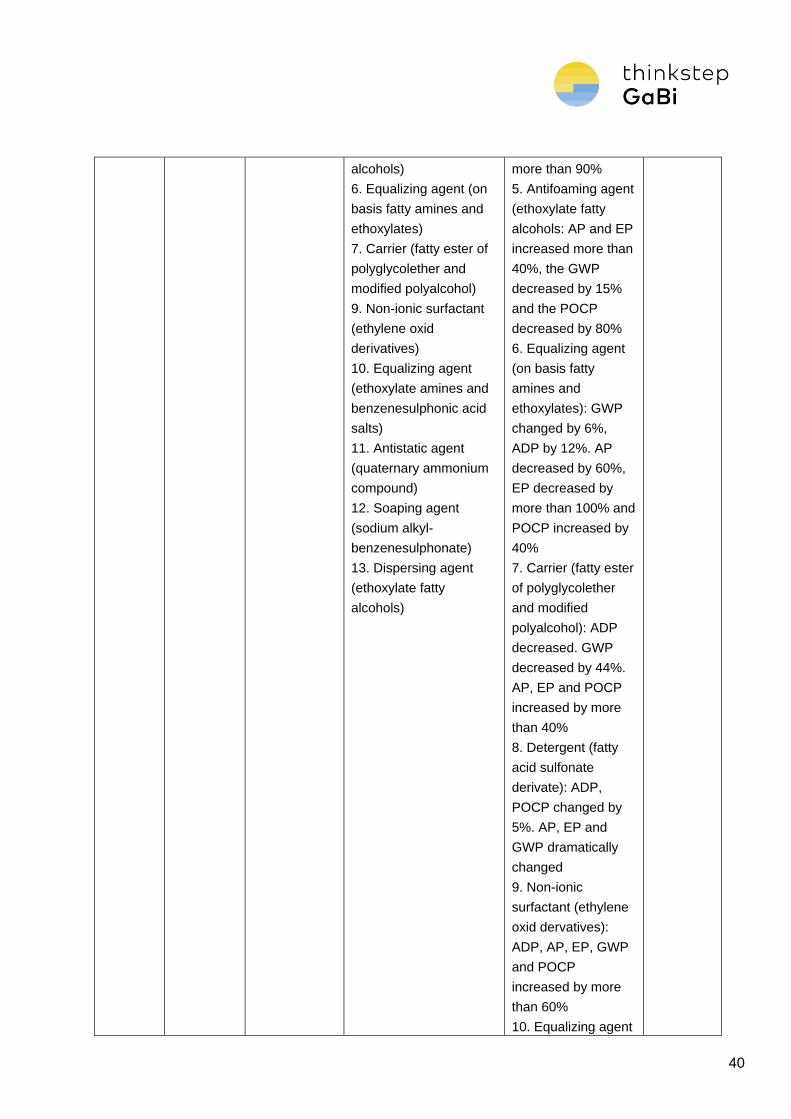
GC-
1145,
GC-3105
Improve-
ment
Textile
intermediate
chemicals
In the following datasets
the inputs were replaced
with datasets from the
ERASM project, which
are also available in the
Professional database.
With this update, the
quality of the datasets
improve:
1. Soaping agent (fatty
etholxylate amines
solution)
2. Soaping agent
(quaternary ammonium
compound solution)
3. Non-ionic surfactant
(fatty acid derivate)
4. Carrier (fatty acid
derivate)
5. Antifoaming agent
(ethoxylate fatty
1. Soaping agent
(fatty etholxylate
amines solution):
ADP, AP. GWP and
POCP decreased,
2. Soaping agent:
AP; GWP and POCP
changed by less
than 15%, ADP and
EP decreased by
more than 90%
3. Non-ionic
surfactant (fatty acid
derivate): ADP, AP,
EP, GWP and POCP
increased by more
than 50%
4. Carrier (fatty acid
derivate): ADP, AP,
EP, GWP, ODP and
POCP increased by
Extension
database
XV: textile
finishing
40
alcohols)
6. Equalizing agent (on
basis fatty amines and
ethoxylates)
7. Carrier (fatty ester of
polyglycolether and
modified polyalcohol)
9. Non-ionic surfactant
(ethylene oxid
derivatives)
10. Equalizing agent
(ethoxylate amines and
benzenesulphonic acid
salts)
11. Antistatic agent
(quaternary ammonium
compound)
12. Soaping agent
(sodium alkyl-
benzenesulphonate)
13. Dispersing agent
(ethoxylate fatty
alcohols)
more than 90%
5. Antifoaming agent
(ethoxylate fatty
alcohols: AP and EP
increased more than
40%, the GWP
decreased by 15%
and the POCP
decreased by 80%
6. Equalizing agent
(on basis fatty
amines and
ethoxylates): GWP
changed by 6%,
ADP by 12%. AP
decreased by 60%,
EP decreased by
more than 100% and
POCP increased by
40%
7. Carrier (fatty ester
of polyglycolether
and modified
polyalcohol): ADP
decreased. GWP
decreased by 44%.
AP, EP and POCP
increased by more
than 40%
8. Detergent (fatty
acid sulfonate
derivate): ADP,
POCP changed by
5%. AP, EP and
GWP dramatically
changed
9. Non-ionic
surfactant (ethylene
oxid dervatives):
ADP, AP, EP, GWP
and POCP
increased by more
than 60%
10. Equalizing agent
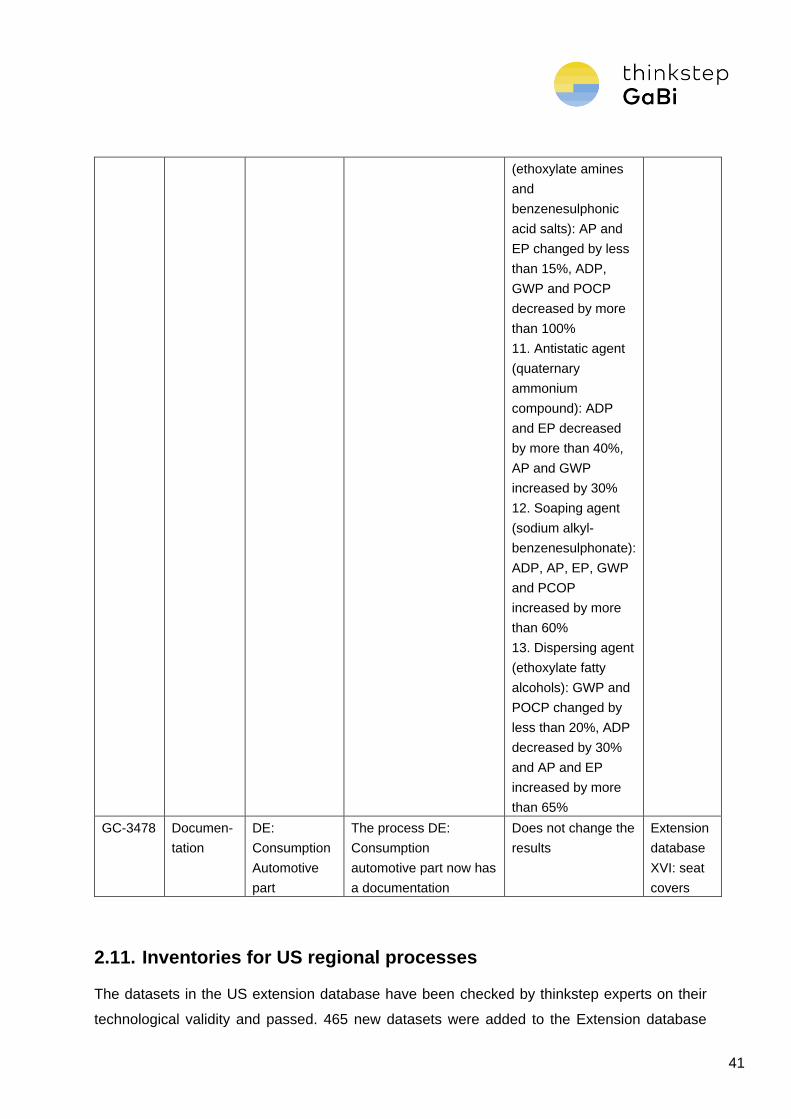
41
(ethoxylate amines
and
benzenesulphonic
acid salts): AP and
EP changed by less
than 15%, ADP,
GWP and POCP
decreased by more
than 100%
11. Antistatic agent
(quaternary
ammonium
compound): ADP
and EP decreased
by more than 40%,
AP and GWP
increased by 30%
12. Soaping agent
(sodium alkyl-
benzenesulphonate):
ADP, AP, EP, GWP
and PCOP
increased by more
than 60%
13. Dispersing agent
(ethoxylate fatty
alcohols): GWP and
POCP changed by
less than 20%, ADP
decreased by 30%
and AP and EP
increased by more
than 65%
GC-3478 Documen-
tation
DE:
Consumption
Automotive
part
The process DE:
Consumption
automotive part now has
a documentation
Does not change the
results
Extension
database
XVI: seat
covers
2.11. Inventories for US regional processes
The datasets in the US extension database have been checked by thinkstep experts on their
technological validity and passed. 465 new datasets were added to the Extension database
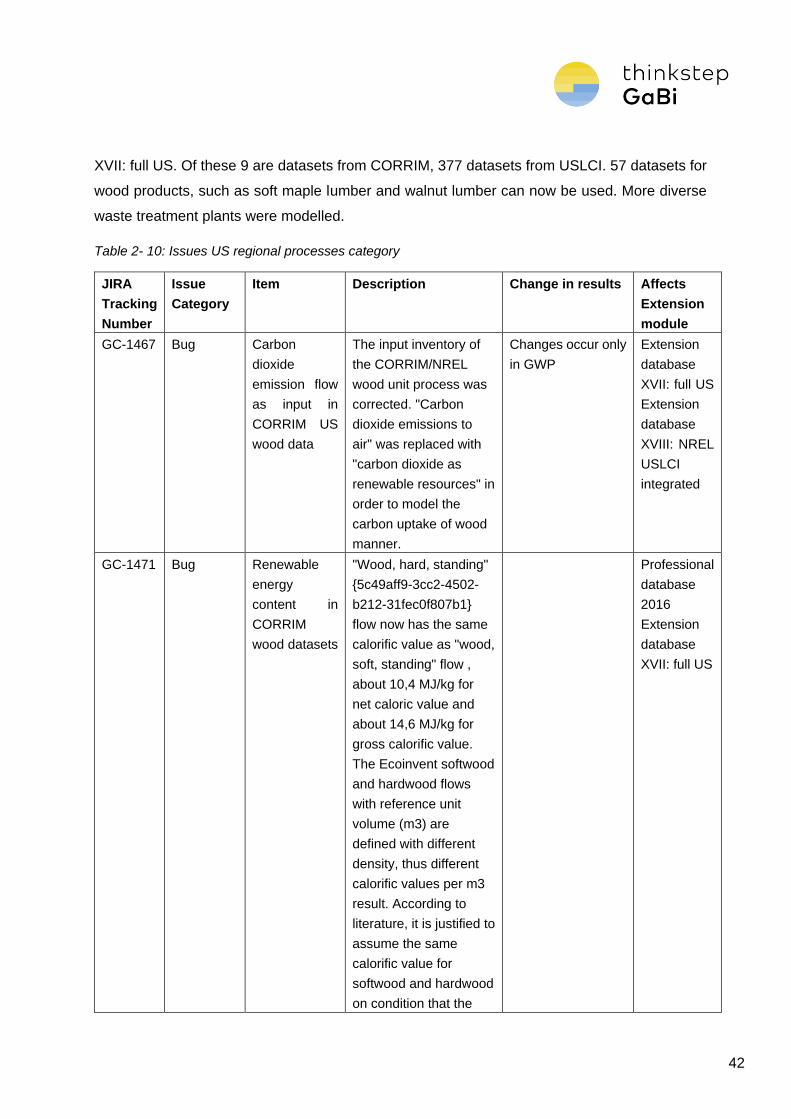
42
XVII: full US. Of these 9 are datasets from CORRIM, 377 datasets from USLCI. 57 datasets for
wood products, such as soft maple lumber and walnut lumber can now be used. More diverse
waste treatment plants were modelled.
Table 2- 10: Issues US regional processes category
JIRA
Tracking
Number
Issue
Category
Item Description Change in results Affects
Extension
module
GC-1467 Bug Carbon
dioxide
emission flow
as input in
CORRIM US
wood data
The input inventory of
the CORRIM/NREL
wood unit process was
corrected. "Carbon
dioxide emissions to
air" was replaced with
"carbon dioxide as
renewable resources" in
order to model the
carbon uptake of wood
manner.
Changes occur only
in GWP
Extension
database
XVII: full US
Extension
database
XVIII: NREL
USLCI
integrated
GC-1471 Bug Renewable
energy
content in
CORRIM
wood datasets
"Wood, hard, standing"
{5c49aff9-3cc2-4502-
b212-31fec0f807b1}
flow now has the same
calorific value as "wood,
soft, standing" flow ,
about 10,4 MJ/kg for
net caloric value and
about 14,6 MJ/kg for
gross calorific value.
The Ecoinvent softwood
and hardwood flows
with reference unit
volume (m3) are
defined with different
density, thus different
calorific values per m3
result. According to
literature, it is justified to
assume the same
calorific value for
softwood and hardwood
on condition that the
Professional
database
2016
Extension
database
XVII: full US
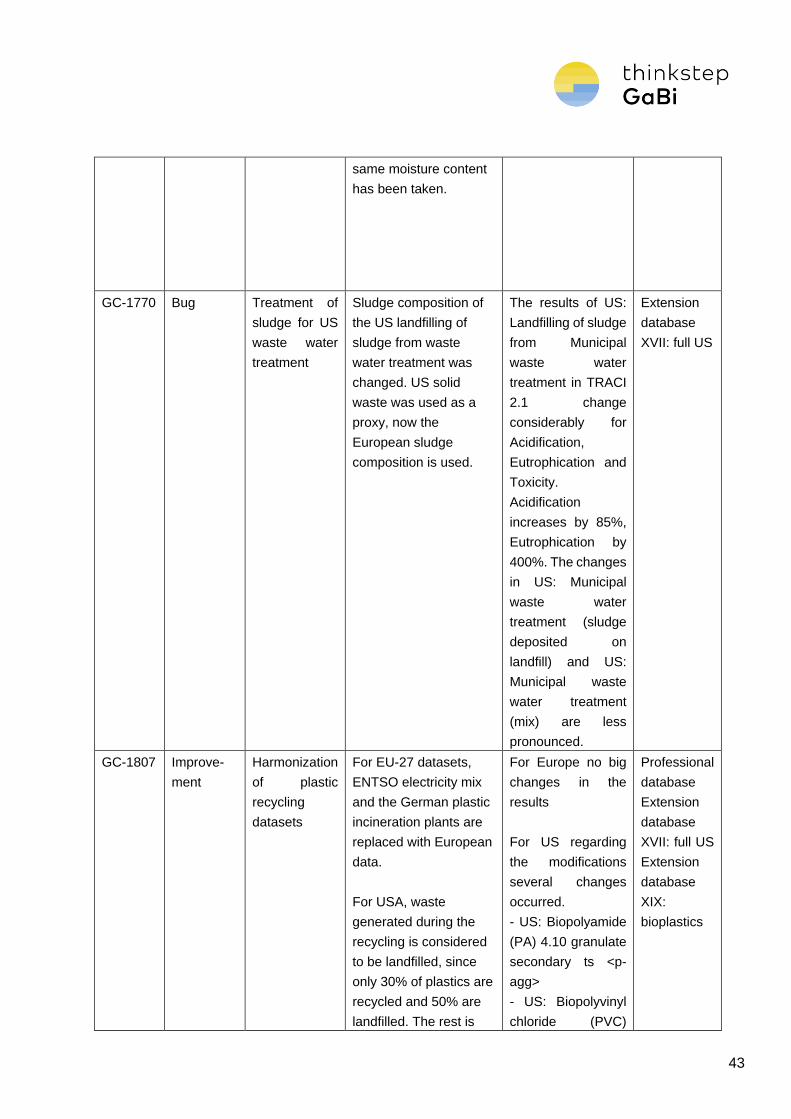
43
same moisture content
has been taken.
GC-1770 Bug Treatment of
sludge for US
waste water
treatment
Sludge composition of
the US landfilling of
sludge from waste
water treatment was
changed. US solid
waste was used as a
proxy, now the
European sludge
composition is used.
The results of US:
Landfilling of sludge
from Municipal
waste water
treatment in TRACI
2.1 change
considerably for
Acidification,
Eutrophication and
Toxicity.
Acidification
increases by 85%,
Eutrophication by
400%. The changes
in US: Municipal
waste water
treatment (sludge
deposited on
landfill) and US:
Municipal waste
water treatment
(mix) are less
pronounced.
Extension
database
XVII: full US
GC-1807 Improve-
ment
Harmonization
of plastic
recycling
datasets
For EU-27 datasets,
ENTSO electricity mix
and the German plastic
incineration plants are
replaced with European
data.
For USA, waste
generated during the
recycling is considered
to be landfilled, since
only 30% of plastics are
recycled and 50% are
landfilled. The rest is
For Europe no big
changes in the
results
For US regarding
the modifications
several changes
occurred.
- US: Biopolyamide
(PA) 4.10 granulate
secondary ts <p-
agg>
- US: Biopolyvinyl
chloride (PVC)
Professional
database
Extension
database
XVII: full US
Extension
database
XIX:
bioplastics
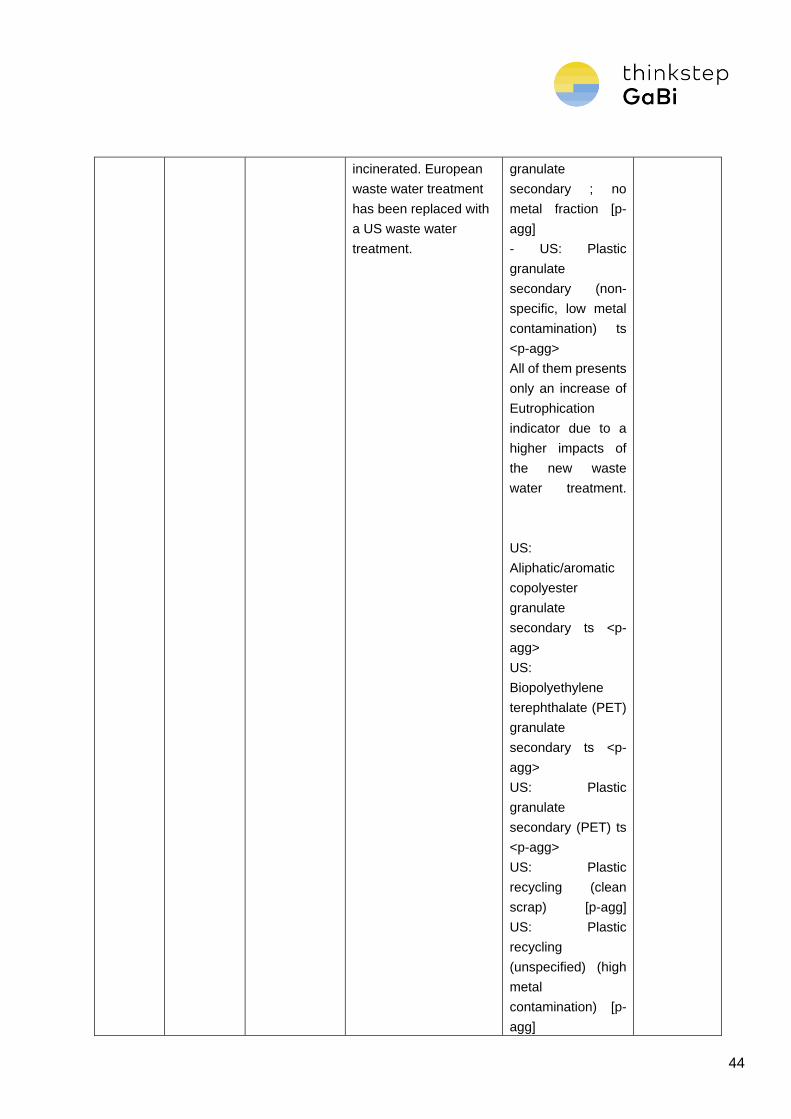
44
incinerated. European
waste water treatment
has been replaced with
a US waste water
treatment.
granulate
secondary ; no
metal fraction [p-
agg]
- US: Plastic
granulate
secondary (non-
specific, low metal
contamination) ts
<p-agg>
All of them presents
only an increase of
Eutrophication
indicator due to a
higher impacts of
the new waste
water treatment.
US:
Aliphatic/aromatic
copolyester
granulate
secondary ts <p-
agg>
US:
Biopolyethylene
terephthalate (PET)
granulate
secondary ts <p-
agg>
US: Plastic
granulate
secondary (PET) ts
<p-agg>
US: Plastic
recycling (clean
scrap) [p-agg]
US: Plastic
recycling
(unspecified) (high
metal
contamination) [p-
agg]
45
US:
Starch/polyethylene
(PE) blend
granulate
secondary ; no
metal fraction [p-
agg]
US:
Starch/polyvinyl
alcohol (PVA) blend
granulate
secondary ; no
metal fraction [p-
agg]
Increase of
Acidification (AP),
Eutrophication
(EP), Ozone
Depletion potential
(ODP) and
Photochemical
pollution(POCP).
Greenhouse gases
(GWP) emissions
are lower.
AP increase
because more
electricity is needed
in the new EOL
scenario
EP increase due to
a higher impacts of
the new waste
water treatment
GWP decrease
because the
quantity of waste
burned is lower and
more waste go to
landfill
ODP is higher
because more
electricity is
46
required
POCP increase
because in this new
scenario more
waste go to landfill
US:
Biopolyethylene
granulate
secondary ts <p-
agg>
US:
Biopolypropylene
granulate
secondary ts <p-
agg>
AP, EP, GWP,
ODP, POCP
increase.
AP because more
electricity in the
new scenario
EP increase due to
a higher impacts of
the new waste
water treatment
GWP increase
because more
electricity is
required in this new
scenario
ODP is higher
because more
electricity is
required
POCP increase
because in this new
scenario more
waste go to landfill
47
GC-1888 Bug Water in US
landfill of glass
and inert
waste
Water release from
landfill body was
changed from waste
water to rain water
Only blue water
consumption
affected. Change
from small negative
values to small
positive values
(absolute change:
plus 0.3kg blue
water consumption
for arid, plus 1.2 kg
for wet climate).
Negligible overall
effect on other
datasets than the
ones directly
affected
Extension
database
XVII: full US
GC-2228 Bug US landfills:
methane
emission
Emissions from US:
landfill gas processing
have been changed
from fossil methane to
biotic methane.
Results for US:
Landfilling of sludge
from Municipal
waste water
treatment:
No changes in
GWP incl. biogenic
carbon.
GWP excl. biogenic
carbon decreases
by 6%
Extension
database
XVII: full US
GC-2444 Improve-
ment
US: Nitric acid
update
Using newer
information, the US
production process of
nitric acid was updated.
CML2015:
The categories
ADPe has an
increase of about
5%. ADPf, GWP
and ODP less than
1%. AP and POCP
decrease by about
5%.
Extension
database
XVII: full US
GC-2946 Bug Carbon
dioxide flow in
USLCI wood
datasets
The dataset
'Roundwood,
hardwood, average,
Med Intensity
Management, NE-NC'
now uses the flow
'Carbon dioxide
Does not change
the results.
Professional
database
2016
Extension
database
XVII: full US
48
[Resources]' as an
input.
GC-1896 Documen-
tation
Link to NREL
homepage
In the NREL/USLCI
contacts a non-
functional link was
given to the NREL
homepage, this has
been corrected
Does not change
the results.
Extension
database
XVII: full US
Extension
database
XVIII: NREL
USLCI
integrated
GC-2207 Documen-
tation
Carbon
monoxide (via
synthesis gas)
dataset
Documentation has
been updated.
Does not change
the results.
Extension
database
XVII: full US
Data on
Demand
GC-2507 Documen-
tation
Reference
flow for "US:
Municipal
Solid Waste
on landfill"
Dataset "US: Municipal
Solid Waste on landfill"
now has the correct
reference flow marked
in the documentation
tab.
Does not change
the results.
Extension
database
XVII: full US
GC-2955 Documen-
tation
Process
image of
acetic acid
"US: Acetic anhydride"
has an updated process
image.
Does not change
the results.
Extension
database
XVII: full US
GC-3131 Documen-
tation
US: Ethanol
(from corn)
(DDGS)
Documentation of the
dataset US: Ethanol
(from corn) (DDGS) has
been improved.
Does not change
the results.
Extension
database
XVII: full US
49
3. Industry data in GaBi
Despite the fact, that several associations have updated their data, some associations did not
update this year. Since they have an own cycle for upgrading their data, these processes
cannot be updated by thinkstep in the yearly upgrade without permission. thinkstep must
keep these processes identical to those in the GaBi Databases 2014 until the associations
decide to update and make them available in our system. However, several new association
datasets use the GaBi database to reach global customers.
New sources of industry data added in GaBi Databases 2016 Edition:
From ALIPA (http://www.alipa.org):
EU-27: Aliphatic Isocyanates
From CORRIM (http://www.corrim.org)
RNA: Particle board
RNA: Oriented strandboard (OSB)
RNA: Laminated veneer lumber (LVL)
RNA: Softwood lumber
RNA: Engineered I-joists
US: Redwood Decking (California)
RNA: Glued laminated timber
RNA: Softwood plywood
RNA: Medium density fiberboard (MDF)
From EBAM (http://www.petrochemistry.eu)
EU-27: 2-Ethylhexyl Acrylate
EU-27: Ethyl acrylate
EU-27: Glacial Acrylic Acid
EU-27: Methyl acrylate
EU-27: n-Butyl acrylate
50
From ECPI (http://www.ecpi.org)
EU-27: Di-isononyl phthalate (DINP)
From ERASM (http://www.erasm.org)
GLO: Refined coconut oil (incl. LUC)
GLO: Crude coconut oil (incl. LUC)
GLO: Coconut oil methyl ester (incl. LUC)
GLO: Refined palm oil (incl. LUC; incl. peat emissions)
GLO: Refined palm kernel oil (incl. LUC; incl. emissions peat, 75 cm)
GLO: Palm oil methylester (incl. LUC, incl. peat emissions)
GLO: Palm kernel oil methylester (incl. LUC, incl. peat emissions, 75 cm)
GLO: Crude palm oil (incl. LUC; incl. peat emissions)
GLO: Crude palm kernel oil (incl. LUC; incl. peat emissions)
EU-27: C10-13 Linear alkylbenzene sulphonic acid (HLAS) (petro based) (No 2 - Matrix)
EU-27: C12-14 Alkyl sulphate (oleo/petro based) (No. 5 - Matrix)
EU-27: C12-14 Alcohol Ether Sulphates (oleo based) (No. 6 - Matrix)
EU-27: Ethylene Oxide (No. 8 - Matrix)
EU-27: C12-15 Alcohol (petro) Ethoxylate, 3 moles EO (No. 11 - Matrix)
EU-27: C12-15 Alcohol (petro) Ethoxylate, 7 moles EO (No. 12 - Matrix)
EU-27: C16-18 Alcohol (oleo) Ethoxylate, >20 moles EO (No. 14 - Matrix)
EU-27: Cocamide diethanolamine (oleo based) (No. 16 - Matrix)
EU-27: C12-14 Amine Oxide (oleo/petro based) (No. 20 - Matrix)
EU-27: C16-18 TEA-Quat (oleo based) (No. 24 - Matrix)
EU-27: C8-18 Alkyl amidopropyl betaine (oleo based) (No. 28 - Matrix)
EU-27: Sodium cumene sulphonate (No. 30 - Matrix)
EU-27: Sodium Cocoamphoacetate (No. 32 - Matrix)
51
EU-27: C12-14 Alcohol (oleo) Ethoxylate, 3 moles EO (No. 9 - Matrix)
EU-27: C12-14 Alcohol (oleo) Ethoxylate, 7 moles EO (No. 10 - Matrix)
EU-27: C12-13 Alcohol Ether Sulphates (petro based), 2 mole EO (No. 7 - Matrix)
EU-27: C16-18 fatty alcohol from palm oil (No. 13 - Matrix)
EU-27: C16-18 fatty alcohol from beef tallow (No. 21 - Matrix)
EU-27: Beef tallow
From EUROPUR (http://www.europur.org)
EU-27: Polyurethane flexible foam (PU) - TDI-based, no flame retardant, high density
EU-27: Polyurethane flexible foam (PU) - TDI-based, no flame retardant, low density
EU-27: Polyurethane flexible foam (PU) - TDI-based, with flame retardant
EU-27: Polyurethane flexible foam (PU) - MDI-based, no flame retardant
From Fertilizers Europe (http://www.fertilizerseurope.com)
EU-27: Triple superphosphate (TSP, 46% P2O5)
EU-27: Raw phosphate (32% P2O5)
EU-27: Phosphoric acid (H3PO4, 54% P2O5)
EU-27: Potassium chloride (KCl/MOP, 60% K2O)
EU-27: Ammonium nitrate (AN, 33.5% N)
EU-27: Ammonia (NH3)
EU-27: Nitric acid (98% HNO3)
EU-27: Urea (46% N)
EU-27: Calcium ammonium nitrate (CAN, 27% N)
EU-27: Urea ammonium nitrate (UAN, 30% N)
EU-27: Sulphuric acid (100% H2SO4)
EU-27: Ammonium phosphate (AP, 52% P2O5, 8.4% N)
EU-27: NPK 15-15-15 (nitrophosphate route, 15N-15P2O5-15K2O)
52
EU-27: Diammonium phosphate (DAP, 18% N, 46% P2O5)
From PlasticsEurope (http://www.plasticseurope.org)
EU-27: Expandable polystyrene (EPS), white and grey
EU-27: Styrene acrylonitrile (SAN), a-Methyl styrene acrylonitrile (AMSAN)
EU-27: Acrylonitrile butadiene styrene (ABS)
From Textile Exchange (http://www.textileexchange.org)
GLO: Cotton fiber (organic) (at gin gate)
53
4. General continuous improvements done in the Upgrade ’16
4.1. Naming
JIRA
Tracking
Number
Issue
Category
Item Description Change in results Affects
Extension
module
GC-853 Naming Harmonize names between
Manufacturing and End of
Life
The name of lighting products containing W
(watts) was harmonized.
Does not change the
results.
Extension
database XIV
Construction
materials
GC-1447 Naming Aluminum and Steel
Datasets to be set to p-agg
Steel and Aluminum datasets were set to p-
agg based on the open scrap input.
Does not change the
results.
Several
GC-1895 Naming Flow: US Ethanol (from
corn) (DDGS)
The valuable substance output flow was
changed from 'Ethanol from wheat' to
'Ethanol from corn'.
Does not change the
results.
Extension
database XVII:
full US
GC-1996 Naming Technology in name of
acetic acid processes
The manufacturing technology was added
to the name of acetic acid datasets.
Does not change the
results.
Several
GC-2264 Naming Region code "NA" Region codes were harmonized from NA
(Namibia) to RNA (Region North America)
Does not change the
results.
Several
GC-2411 Naming Lanthanides flow Flows "Lanthanides" were changed to
"Lanthanum"
Does not change the
results.
All
GC-2934 Naming Ferric oxide dataset The name of the dataset EU-27: Ferric
oxide process was corrected to EU-27:
Ferrous oxide, which represents the right
oxidation state of iron produced through this
process [Iron (II)].
Does not change the
results.
Extension
database XIV:
construction
materials
54
GC-2939 Naming Dataset type infrared
thermoforming
The dataset type for "GLO: Infrared
Thermoforming (LDPE, HDPE, PS, PVC,
PMMA, PA-6)" was changed to u-so.
Does not change the
results.
Extension
database X:
machining
processes
4.2. Sorting
JIRA
Tracking
Number
Issue
Category
Item Description Change in results Affects
Extension
module
GC-1209 Sorting GLO: Plastic Film (PE, PP,
PVC)" in Professional DB
The dataset "GLO: Plastic Film (PE, PP,
PVC)" is now available in the professional
database.
Does not change the
results.
Professional
database
Extension
database X:
machining
processes 2014
GC-1213 Sorting Plastic extrusion profile
(unspecific)" in Professional
DB
"GLO: Plastic extrusion profile (unspecific)"
{d26e6276-9582-49f0-bd90-82189d485e1d}
has been moved from the machining
extension database to the professional
database.
Does not change the
results.
Professional
database
55
GC-1217 Sorting Polyethylene (PE-HD) blow
moulding" in Professional
DB
“DE: Polyethylene (HDPE/PE-HD) blow
moulding“{3979582f-0678-4dfe-8304-
1860a797c0b8} has been moved from the
machining extension database to the
professional database.
Does not change the
results.
Professional
database
4.3. Documentation
JIRA
Tracking
Number
Issue
Category
Item Description Change in results Affects
Extension
module
GC-1100 Documentation CN: Magnesium dataset Technology description has been updated. Does not change
the results.
Professional
database
GC-1379 Documentation Sodium Hydroxide Documentation for sodium hydroxide
processes has been updated. Production
shares are now correctly displayed.
Does not change
the results.
Several
GC-1567 Documentation Expiry date ELCD/CEWEP
incineration data sets
Validity extended after talking back to industry
sector expert within thinkstep
Does not change
the results.
Professional
database
GC-1986 Documentation Merge "National
Cottonseed Products
Association" reference
The following two references were merged:
National Cottonseed Products Association,
2002 {1556a008-ea2b-45b6-891a-
d1c37eed5861}
National Cottonseed Products Association,
2002 (Copy) {79e22769-91fd-46eb-b047-
95a43530302c}
Does not change
the results.
All
56
GC-2196 Documentation Mix and location types in
electricity grid mixes
For a few countries, "Electricity grid mix"
datasets had a mix and location type
„production mix (region specific plants), at
consumer". This was corrected to
"consumption mix, at consumer".
Does not change
the results.
Professional
database
GC-2305,
GC-2171,
GC-2170
Documentation ILCD recommended 3
documentation fields in
GaBi documentations
In order to be ILCD compliant, the first three
fields of a documentation were filled out.
Does not change
the results.
All
GC-2405 Documentation Datasets with more than
one marked reference flow
The process documentation of all 6 processes
now only has 1 flow as reference flow
Does not change
the results.
Several
GC-2479 Documentation Legend in documentation
of energy processes
Pie chart in process documentation changed Does not change
the results.
Several
GC-2508 Documentation Source used in contact
field
The contact which were in the data sources
were deleted and new references were created
in order to still have the information available
regarding the data origin
Does not change
the results.
All
GC-2842 Documentation Supported impact methods
in documentation field
Datasets now have the same amount of
supported impact categories in the
documentation.
Does not change
the results.
All
GC-2908 Documentation Sodium Hydroxide -
updated shares diagram
Updated flow chart with the shares of sodium
hydroxide was added.
Does not change
the results.
Several
GC-3099 Documentation General comment
electricity grid mixes
The fact that grid losses are included in the
electricity grid mixes, is now stated in the
general comment field.
Does not change
the results.
Professional
database
Extension
database II:
Energy
GC-3190 Documentation Creative Commons license
to datasets published on
Added to Access and use restrictions to
datasets published on the Life Cycle Data
Network (LCDN): thinkstep has put this specific
Does not change
the results.
Several
57
the Life Cycle Data
Network (LCDN)
dataset into The Life Cycle Data Network
(LCDN)
(http://46.163.107.157:8080/Node/index.xhtml)
under the following Creative Commons license
http://creativecommons.org/licenses/by-nc-
nd/4.0/
GC-3410 Documentation Train goods dataset Added information: "The utilisation factor
depends on the type of cargo. It also includes
the average share of empty runnings."
Does not change
the results.
Professional
database
GC-3475 Documentation CAS codes The flows Zinc (Zn65) (radioactive emissions to
air & radioactive emissions to air fresh water)
now have the CAS code 013982-39-3
Does not change
the results.
All
4.4. LCIA / Method
JIRA
Tracking
Number
Issue
Category
Item Description Change in results Affects
Extension
module
GC-2688 LCIA POCP characterization
factors in EDIP2003
The characterization factors for POCP impact
on human health were all a factor 10 too high.
Characterization factor for three single VOCs
were corrected.
All
GC-3313 LCIA POCP values in EDIP2003
for R143a
POCP (Photochemical ozone formation
potential) characterization factors for impact on
vegetation and impact on human health and
materials in EDIP2003 were added for R143a.
All
58
GC-3489 LCIA USEtox implementation Three new USEtox quantities are created with
only recommended factors. These cannot be
normalized as the published normalization
factors only cover the complete set
(recommended+interim).
All
GC-3428 LCIA Correction of ILCD version
of USEtox
The characterization factors for the USEtox
methods were harmonized.
All
GC-2235 LCIA UBP 2013: POPs into
water
The methodology UPB 2013 (Swiss
Ecoscarcity) now has characterization factors
for POPs into water.
All
GC-2694 LCIA UBP 2013, Non radioactive
waste to deposit
Only long term emissions are now considered. All
4.5. New Objects
JIRA
Tracking
Number
Issue
Category
Item Description Change in results Affects
Extension
module
GC-1921 New EU-27 Propene mix EU-27 Propene (propylene) via FCC technology
mix was created.
New dataset,
therefore not
applicable.
Professional
database
GC-2195 New Infrastructure (as plans) Generic infrastructure datasets such as
buildings and power plants: are now available
as plans in the Professional database,
GLO: Building, administration type (1 m³ gross
New dataset,
therefore not
applicable.
Professional
database
59
volume)
GLO: Building, reinforced concrete frame
construction (1 m³ gross volume)
GLO: Building, steel frame construction (1 m³
gross volume)
GLO: Combined heat and power plant (lambda
1 engine, 160 kW, 1 piece)
GLO: Gas-fired power plant (350 MW, 1 piece)
GLO: Hard coal power plant (800 MW, 1 piece)
[p-agg]
GLO: Investment goods, generic (1 piece used
for 1 year)
GLO: Lignite power plant (950 MW, 1 piece)
GLO: Metal-cutting machine (1 piece)
GLO: Passenger car (medium, gasoline, 1
piece)
GLO: Pipeline (diameter 350 - 500 mm, 1 m
length)
GLO: Pipeline (diameter 500 - 700 mm, 1 m
length)
GLO: Pipeline (diameter 700 - 1000 mm, 1 m
length)
GLO: Truck (7 t tara, diesel engine, 1 piece)
GC-2253 New Polyethylene
terephthalate (via PTA)
and purified terephthalic
acid (PTA)
New datasets are available:
DE: Polyethylene terephthalate bottle grade
granulate (PET) via PTA
EU-27: Polyethylene terephthalate bottle grade
granulate (PET) via PTA
New dataset,
therefore not
applicable.
Professional
database
60
DE: Purified terephthalic acid (PTA)
EU-27: Purified terephthalic acid (PTA)
GC-2392 New Future scenario energy
grid mixes
Using data from EU energy trends (2020, 2030,
and 2050) and IEA World Energy outlook (2020,
2030, and 2040), datasets for future scenario
energy grid mixes were made.
Available countries: Brazil (IEA), China (IEA),
Germany (EU), EU-27 (IEA & EU), France (EU),
United Kingdom (EU), India (IEA), Italy (EU),
Japan (IEA) and US (IEA)
Based on actual electricity grid mix plans the
following parameters on the country specific
grid mix plans were adapted: share of energy
carrier, net losses, own consumption and if
possible, important emission factors.
New dataset,
therefore not
applicable.
Extension
database II:
energy
GC-3483 New Electricity grid mix direct
and indirect
For 77 countries, electricity grid mixes with
direct and indirect emissions which can be used
for Greenhouse Gas reporting are now
available.
New dataset,
therefore not
applicable.
Extension
database II:
energy
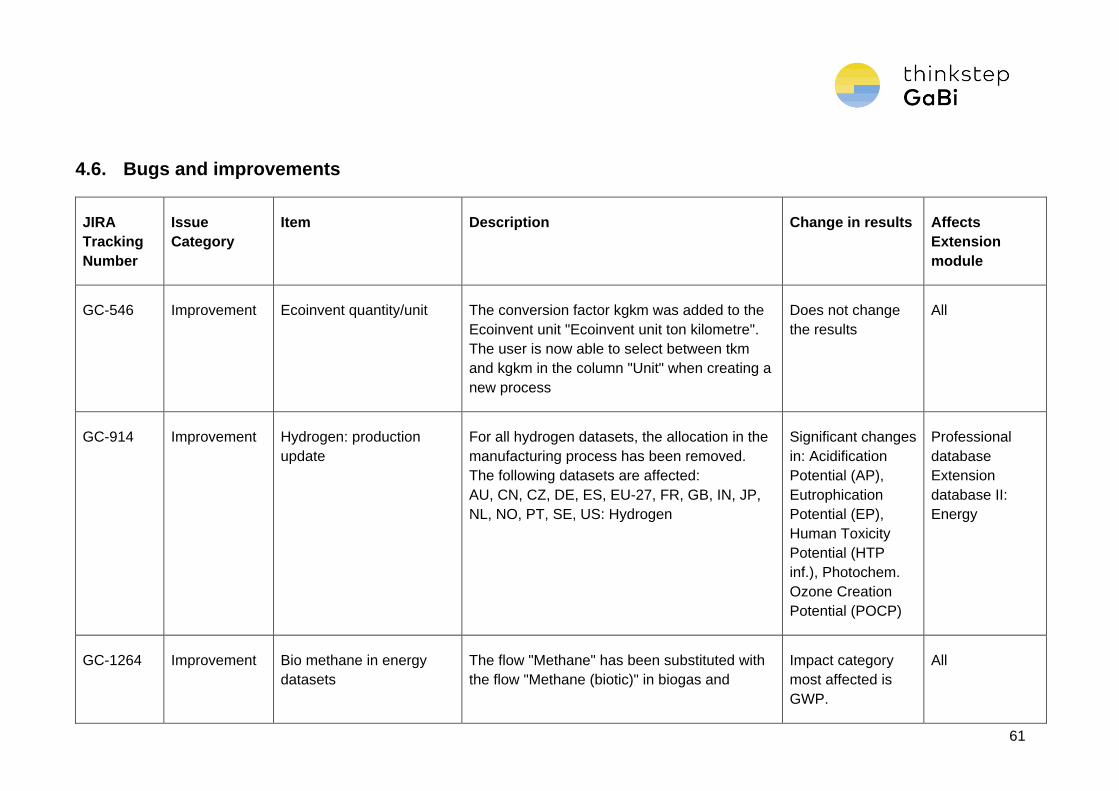
61
4.6. Bugs and improvements
JIRA
Tracking
Number
Issue
Category
Item Description Change in results Affects
Extension
module
GC-546 Improvement Ecoinvent quantity/unit The conversion factor kgkm was added to the
Ecoinvent unit "Ecoinvent unit ton kilometre".
The user is now able to select between tkm
and kgkm in the column "Unit" when creating a
new process
Does not change
the results
All
GC-914 Improvement Hydrogen: production
update
For all hydrogen datasets, the allocation in the
manufacturing process has been removed.
The following datasets are affected:
AU, CN, CZ, DE, ES, EU-27, FR, GB, IN, JP,
NL, NO, PT, SE, US: Hydrogen
Significant changes
in: Acidification
Potential (AP),
Eutrophication
Potential (EP),
Human Toxicity
Potential (HTP
inf.), Photochem.
Ozone Creation
Potential (POCP)
Professional
database
Extension
database II:
Energy
GC-1264 Improvement Bio methane in energy
datasets
The flow "Methane" has been substituted with
the flow "Methane (biotic)" in biogas and
Impact category
most affected is
GWP.
All
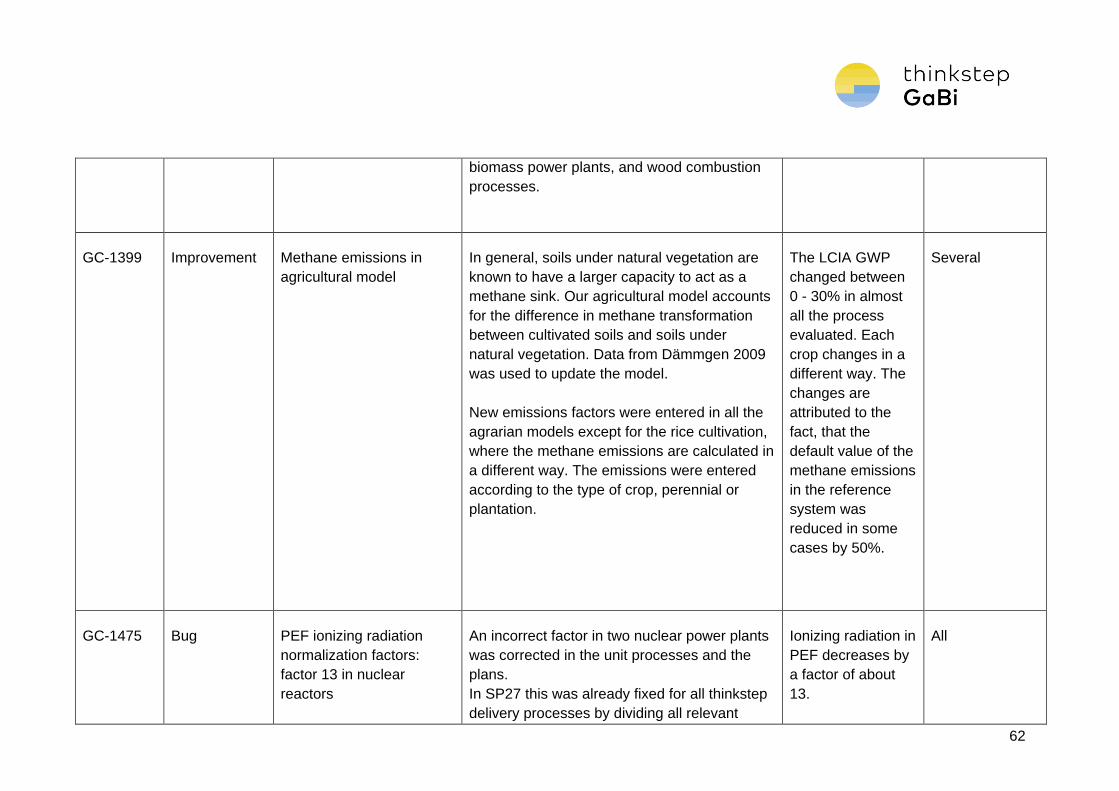
62
biomass power plants, and wood combustion
processes.
GC-1399 Improvement Methane emissions in
agricultural model
In general, soils under natural vegetation are
known to have a larger capacity to act as a
methane sink. Our agricultural model accounts
for the difference in methane transformation
between cultivated soils and soils under
natural vegetation. Data from Dämmgen 2009
was used to update the model.
New emissions factors were entered in all the
agrarian models except for the rice cultivation,
where the methane emissions are calculated in
a different way. The emissions were entered
according to the type of crop, perennial or
plantation.
The LCIA GWP
changed between
0 - 30% in almost
all the process
evaluated. Each
crop changes in a
different way. The
changes are
attributed to the
fact, that the
default value of the
methane emissions
in the reference
system was
reduced in some
cases by 50%.
Several
GC-1475 Bug PEF ionizing radiation
normalization factors:
factor 13 in nuclear
reactors
An incorrect factor in two nuclear power plants
was corrected in the unit processes and the
plans.
In SP27 this was already fixed for all thinkstep
delivery processes by dividing all relevant
Ionizing radiation in
PEF decreases by
a factor of about
13.
All
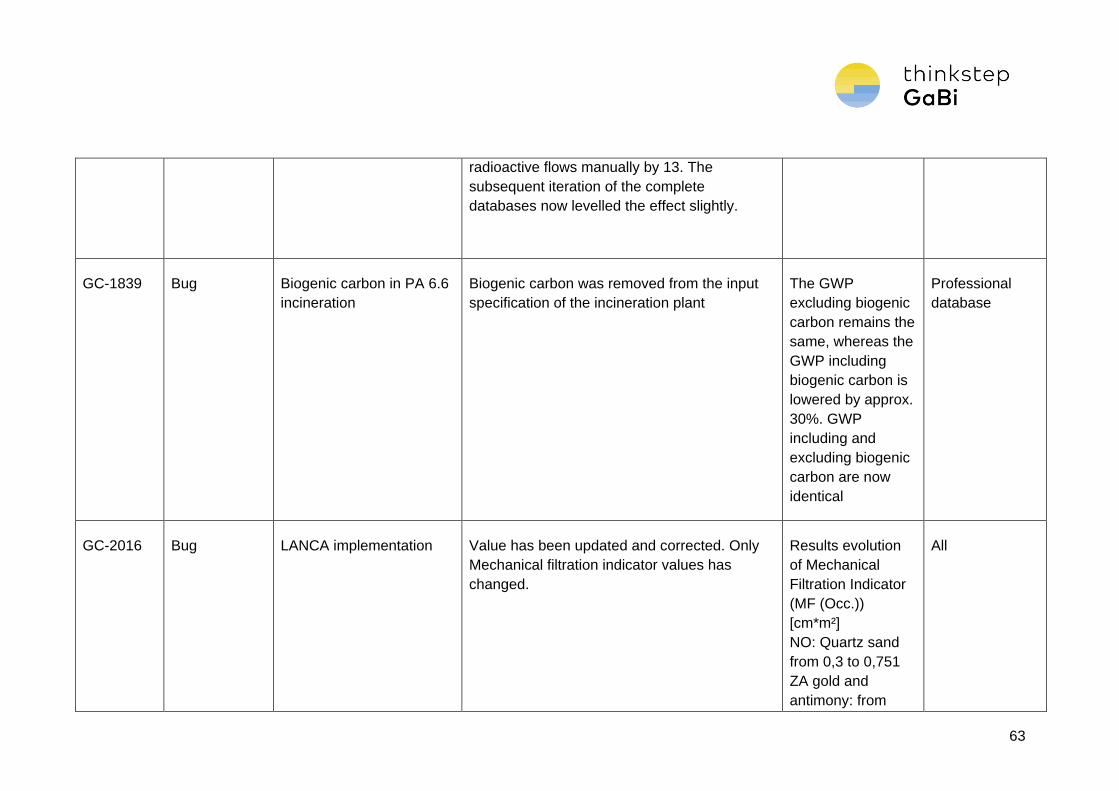
63
radioactive flows manually by 13. The
subsequent iteration of the complete
databases now levelled the effect slightly.
GC-1839 Bug Biogenic carbon in PA 6.6
incineration
Biogenic carbon was removed from the input
specification of the incineration plant
The GWP
excluding biogenic
carbon remains the
same, whereas the
GWP including
biogenic carbon is
lowered by approx.
30%. GWP
including and
excluding biogenic
carbon are now
identical
Professional
database
GC-2016 Bug LANCA implementation Value has been updated and corrected. Only
Mechanical filtration indicator values has
changed.
Results evolution
of Mechanical
Filtration Indicator
(MF (Occ.))
[cm*m²]
NO: Quartz sand
from 0,3 to 0,751
ZA gold and
antimony: from
All
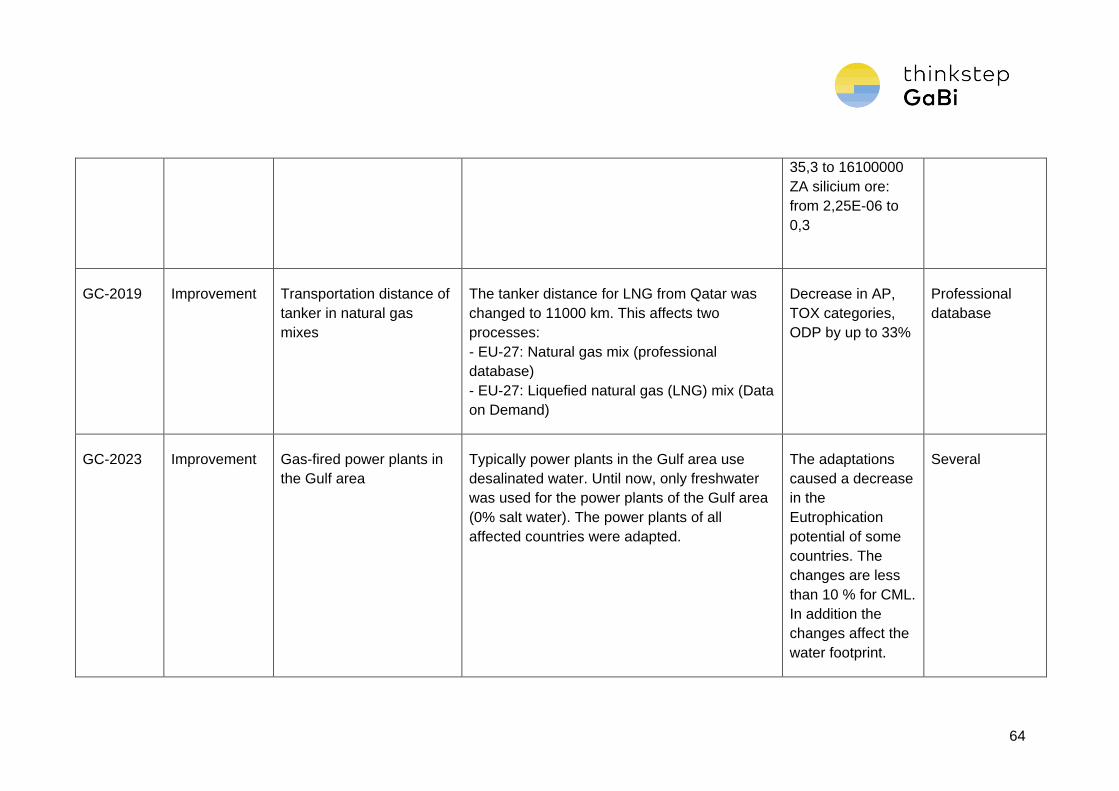
64
35,3 to 16100000
ZA silicium ore:
from 2,25E-06 to
0,3
GC-2019 Improvement Transportation distance of
tanker in natural gas
mixes
The tanker distance for LNG from Qatar was
changed to 11000 km. This affects two
processes:
- EU-27: Natural gas mix (professional
database)
- EU-27: Liquefied natural gas (LNG) mix (Data
on Demand)
Decrease in AP,
TOX categories,
ODP by up to 33%
Professional
database
GC-2023 Improvement Gas-fired power plants in
the Gulf area
Typically power plants in the Gulf area use
desalinated water. Until now, only freshwater
was used for the power plants of the Gulf area
(0% salt water). The power plants of all
affected countries were adapted.
The adaptations
caused a decrease
in the
Eutrophication
potential of some
countries. The
changes are less
than 10 % for CML.
In addition the
changes affect the
water footprint.
Several
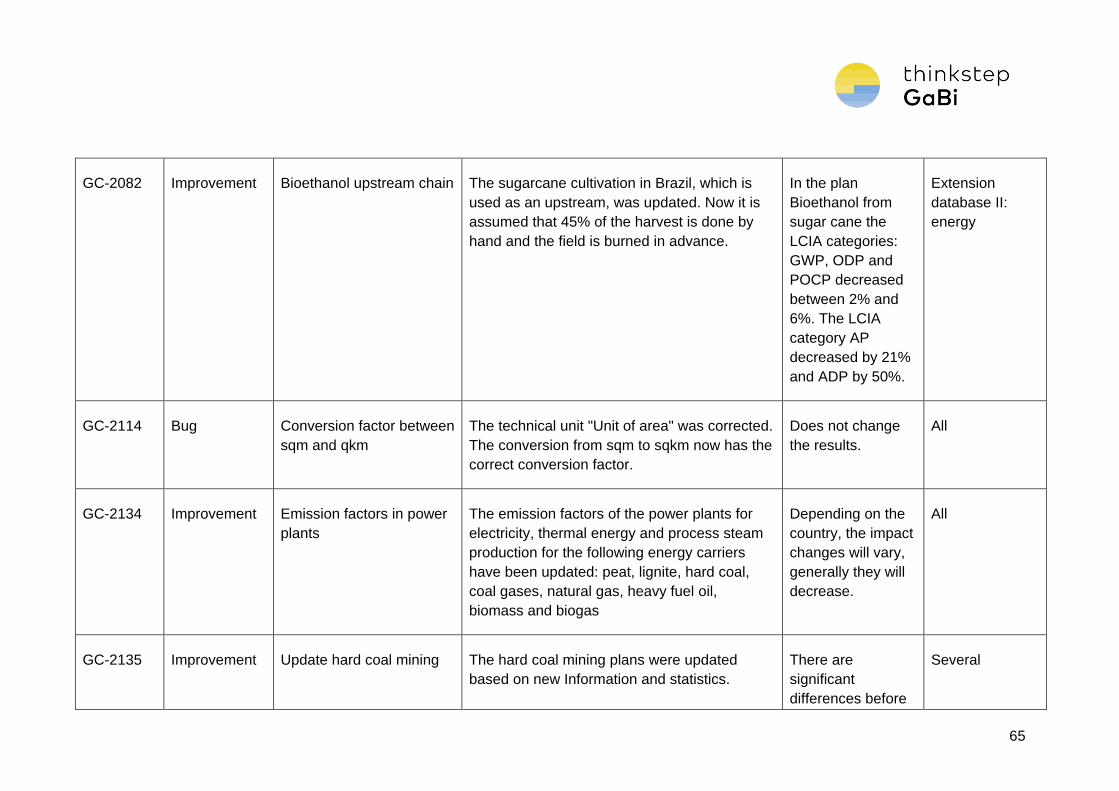
65
GC-2082 Improvement Bioethanol upstream chain The sugarcane cultivation in Brazil, which is
used as an upstream, was updated. Now it is
assumed that 45% of the harvest is done by
hand and the field is burned in advance.
In the plan
Bioethanol from
sugar cane the
LCIA categories:
GWP, ODP and
POCP decreased
between 2% and
6%. The LCIA
category AP
decreased by 21%
and ADP by 50%.
Extension
database II:
energy
GC-2114 Bug Conversion factor between
sqm and qkm
The technical unit "Unit of area" was corrected.
The conversion from sqm to sqkm now has the
correct conversion factor.
Does not change
the results.
All
GC-2134 Improvement Emission factors in power
plants
The emission factors of the power plants for
electricity, thermal energy and process steam
production for the following energy carriers
have been updated: peat, lignite, hard coal,
coal gases, natural gas, heavy fuel oil,
biomass and biogas
Depending on the
country, the impact
changes will vary,
generally they will
decrease.
All
GC-2135 Improvement Update hard coal mining The hard coal mining plans were updated
based on new Information and statistics.
There are
significant
differences before
Several
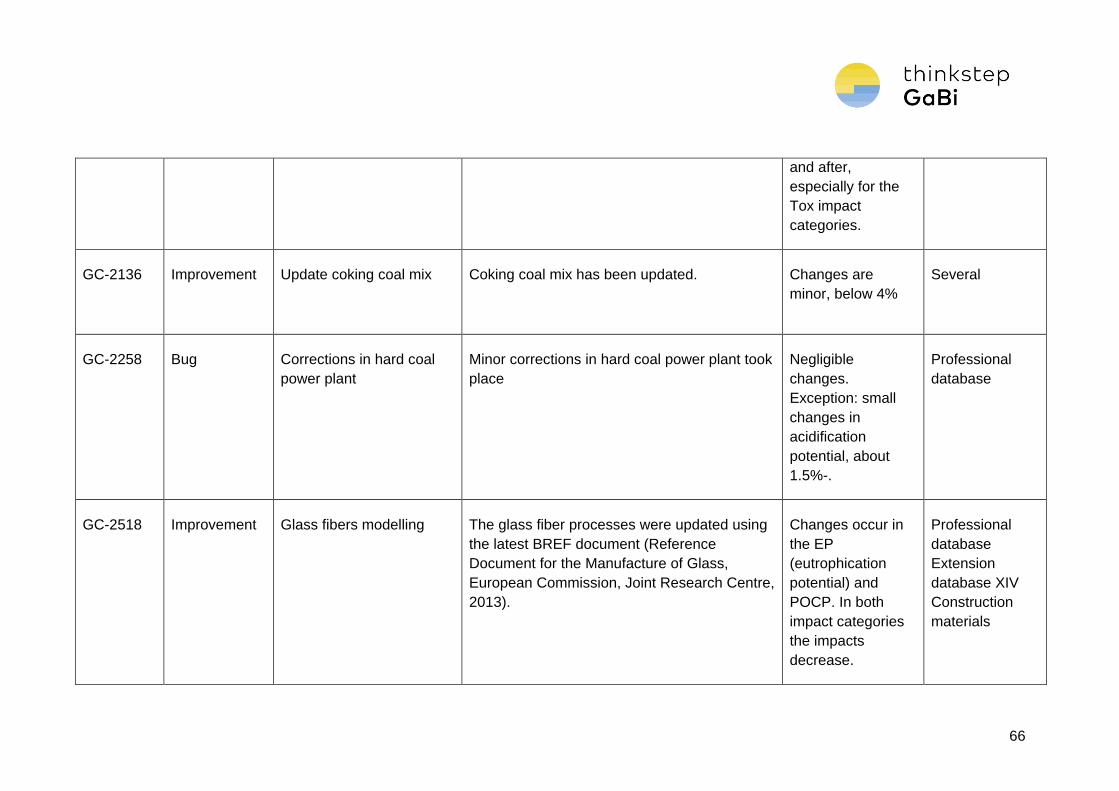
66
and after,
especially for the
Tox impact
categories.
GC-2136 Improvement Update coking coal mix Coking coal mix has been updated. Changes are
minor, below 4%
Several
GC-2258 Bug Corrections in hard coal
power plant
Minor corrections in hard coal power plant took
place
Negligible
changes.
Exception: small
changes in
acidification
potential, about
1.5%-.
Professional
database
GC-2518 Improvement Glass fibers modelling The glass fiber processes were updated using
the latest BREF document (Reference
Document for the Manufacture of Glass,
European Commission, Joint Research Centre,
2013).
Changes occur in
the EP
(eutrophication
potential) and
POCP. In both
impact categories
the impacts
decrease.
Professional
database
Extension
database XIV
Construction
materials
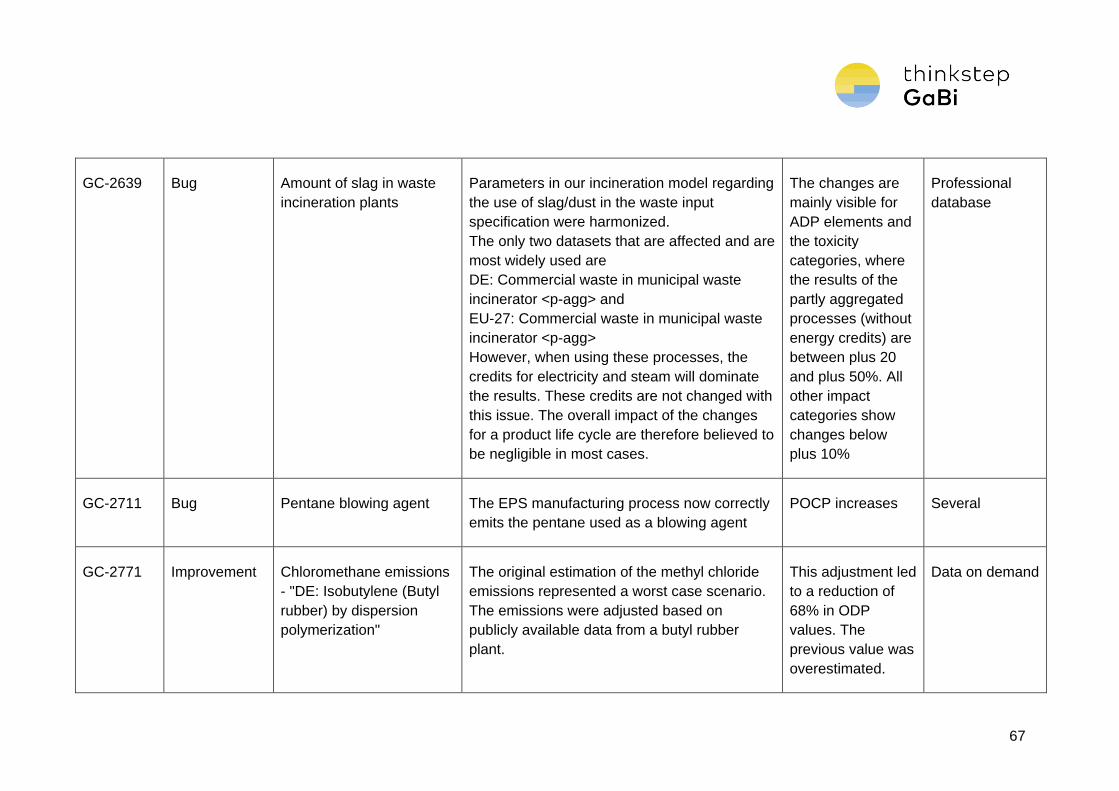
67
GC-2639 Bug Amount of slag in waste
incineration plants
Parameters in our incineration model regarding
the use of slag/dust in the waste input
specification were harmonized.
The only two datasets that are affected and are
most widely used are
DE: Commercial waste in municipal waste
incinerator <p-agg> and
EU-27: Commercial waste in municipal waste
incinerator <p-agg>
However, when using these processes, the
credits for electricity and steam will dominate
the results. These credits are not changed with
this issue. The overall impact of the changes
for a product life cycle are therefore believed to
be negligible in most cases.
The changes are
mainly visible for
ADP elements and
the toxicity
categories, where
the results of the
partly aggregated
processes (without
energy credits) are
between plus 20
and plus 50%. All
other impact
categories show
changes below
plus 10%
Professional
database
GC-2711 Bug Pentane blowing agent The EPS manufacturing process now correctly
emits the pentane used as a blowing agent
POCP increases Several
GC-2771 Improvement Chloromethane emissions
- "DE: Isobutylene (Butyl
rubber) by dispersion
polymerization"
The original estimation of the methyl chloride
emissions represented a worst case scenario.
The emissions were adjusted based on
publicly available data from a butyl rubber
plant.
This adjustment led
to a reduction of
68% in ODP
values. The
previous value was
overestimated.
Data on demand
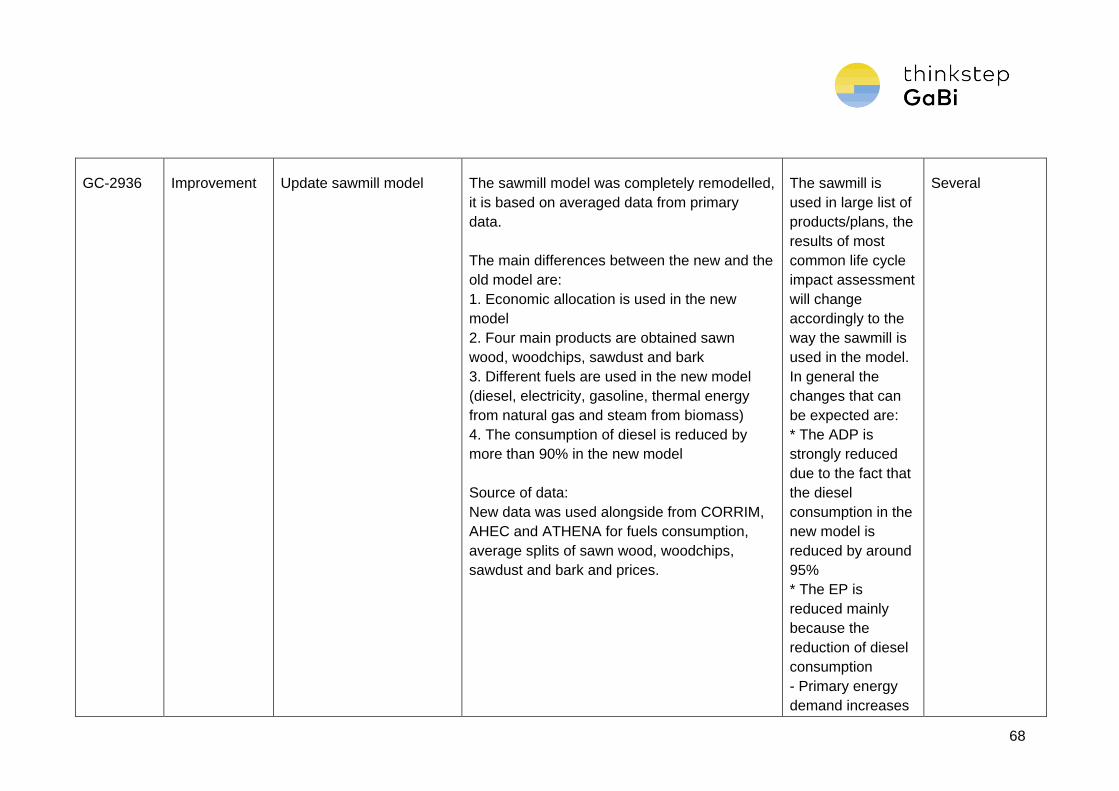
68
GC-2936 Improvement Update sawmill model The sawmill model was completely remodelled,
it is based on averaged data from primary
data.
The main differences between the new and the
old model are:
1. Economic allocation is used in the new
model
2. Four main products are obtained sawn
wood, woodchips, sawdust and bark
3. Different fuels are used in the new model
(diesel, electricity, gasoline, thermal energy
from natural gas and steam from biomass)
4. The consumption of diesel is reduced by
more than 90% in the new model
Source of data:
New data was used alongside from CORRIM,
AHEC and ATHENA for fuels consumption,
average splits of sawn wood, woodchips,
sawdust and bark and prices.
The sawmill is
used in large list of
products/plans, the
results of most
common life cycle
impact assessment
will change
accordingly to the
way the sawmill is
used in the model.
In general the
changes that can
be expected are:
* The ADP is
strongly reduced
due to the fact that
the diesel
consumption in the
new model is
reduced by around
95%
* The EP is
reduced mainly
because the
reduction of diesel
consumption
- Primary energy
demand increases
Several
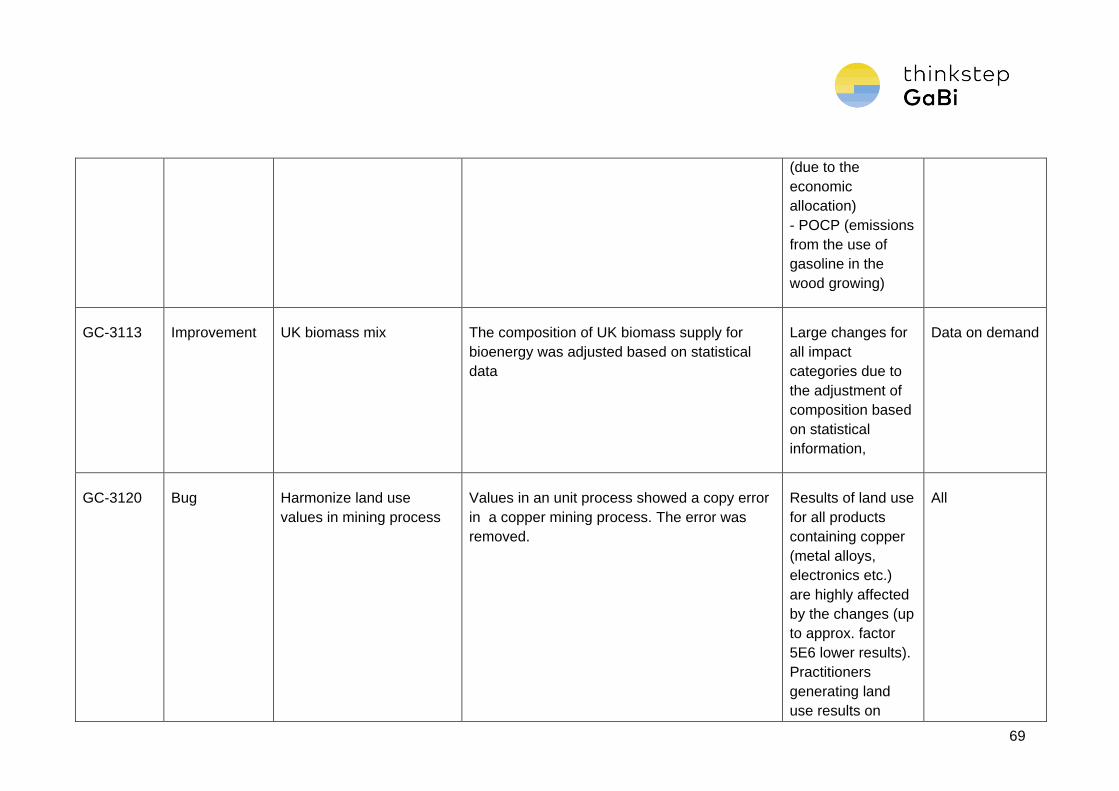
69
(due to the
economic
allocation)
- POCP (emissions
from the use of
gasoline in the
wood growing)
GC-3113 Improvement UK biomass mix The composition of UK biomass supply for
bioenergy was adjusted based on statistical
data
Large changes for
all impact
categories due to
the adjustment of
composition based
on statistical
information,
Data on demand
GC-3120 Bug Harmonize land use
values in mining process
Values in an unit process showed a copy error
in a copper mining process. The error was
removed.
Results of land use
for all products
containing copper
(metal alloys,
electronics etc.)
are highly affected
by the changes (up
to approx. factor
5E6 lower results).
Practitioners
generating land
use results on
All
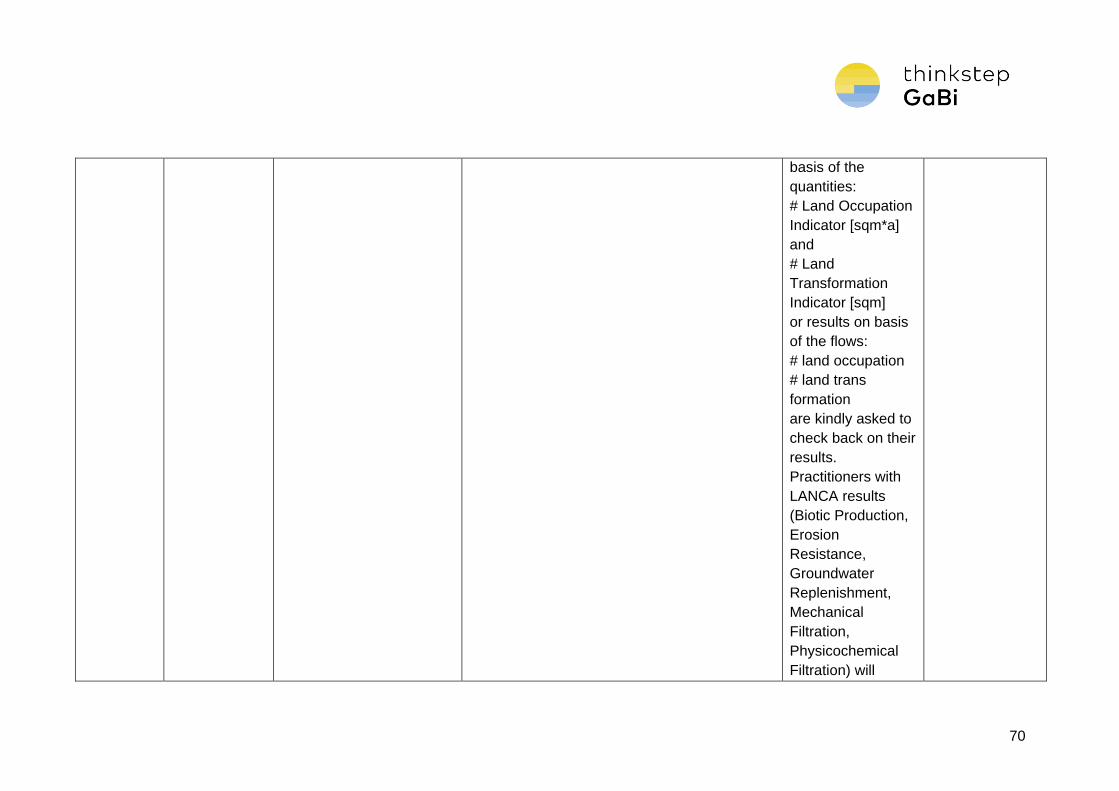
70
basis of the
quantities:
# Land Occupation
Indicator [sqm*a]
and
# Land
Transformation
Indicator [sqm]
or results on basis
of the flows:
# land occupation
# land trans
formation
are kindly asked to
check back on their
results.
Practitioners with
LANCA results
(Biotic Production,
Erosion
Resistance,
Groundwater
Replenishment,
Mechanical
Filtration,
Physicochemical
Filtration) will
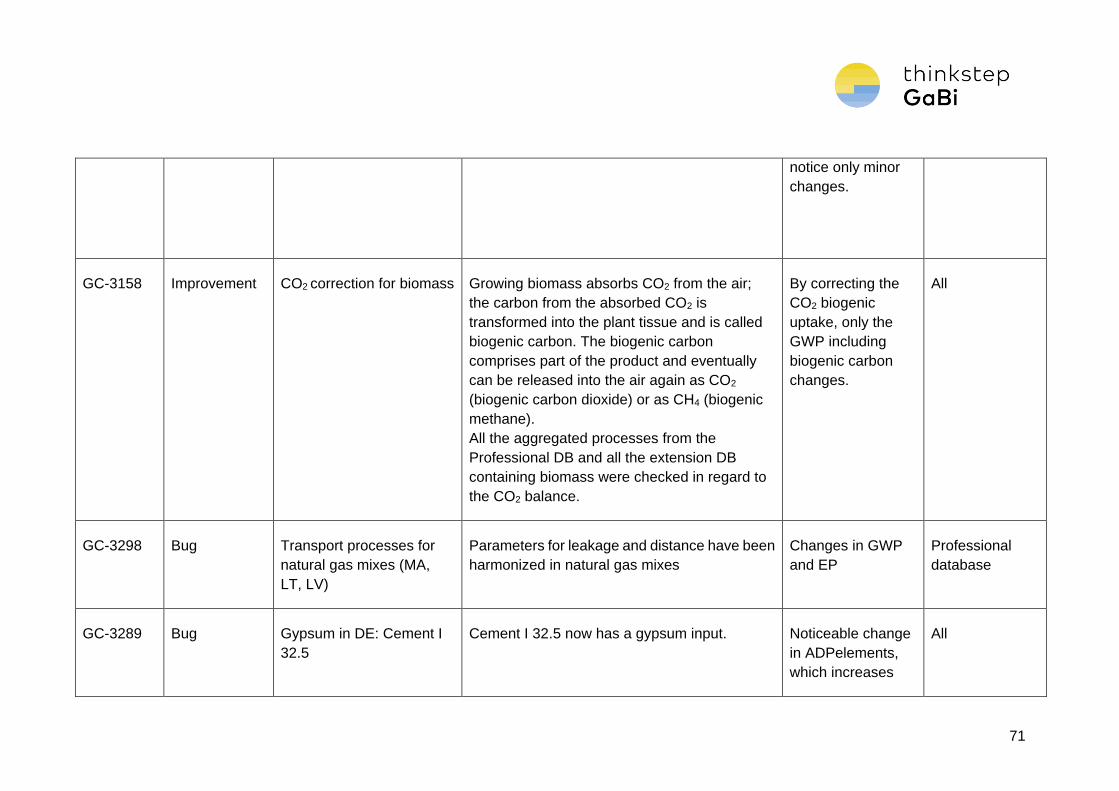
71
notice only minor
changes.
GC-3158 Improvement CO2 correction for biomass Growing biomass absorbs CO2 from the air;
the carbon from the absorbed CO2 is
transformed into the plant tissue and is called
biogenic carbon. The biogenic carbon
comprises part of the product and eventually
can be released into the air again as CO2
(biogenic carbon dioxide) or as CH4 (biogenic
methane).
All the aggregated processes from the
Professional DB and all the extension DB
containing biomass were checked in regard to
the CO2 balance.
By correcting the
CO2 biogenic
uptake, only the
GWP including
biogenic carbon
changes.
All
GC-3298 Bug Transport processes for
natural gas mixes (MA,
LT, LV)
Parameters for leakage and distance have been
harmonized in natural gas mixes
Changes in GWP
and EP
Professional
database
GC-3289 Bug Gypsum in DE: Cement I
32.5
Cement I 32.5 now has a gypsum input. Noticeable change
in ADPelements,
which increases
All
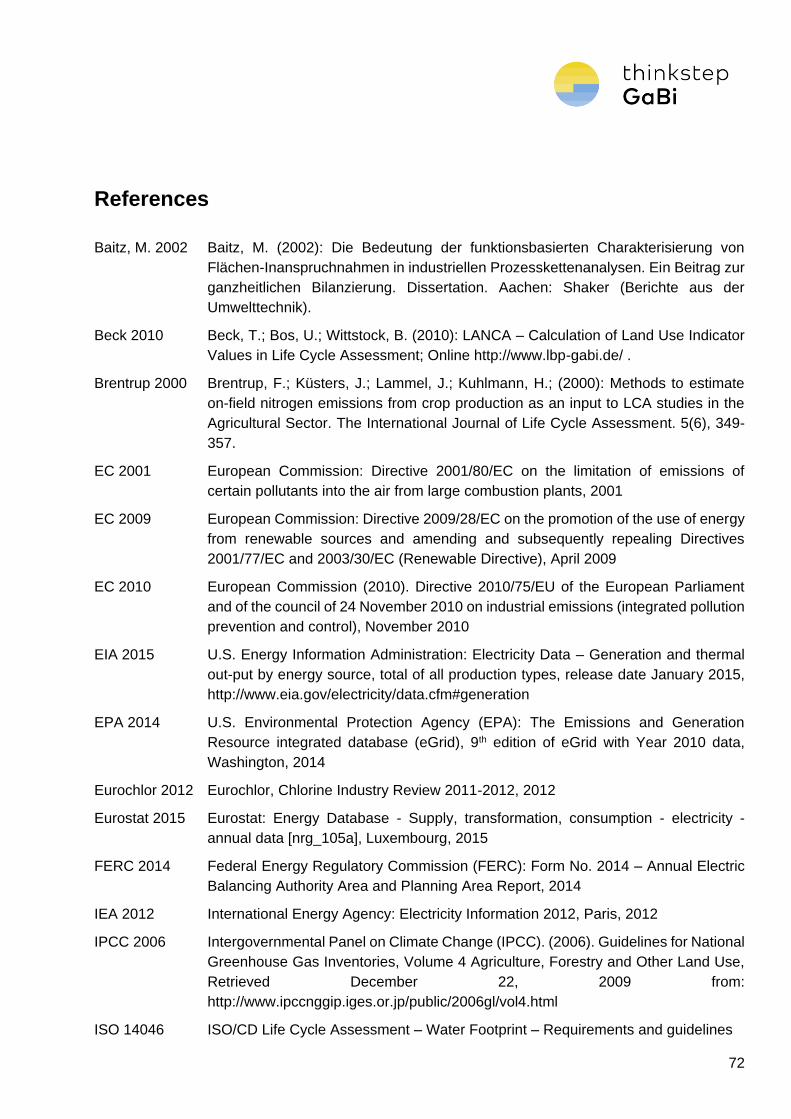
72
References
Baitz, M. 2002 Baitz, M. (2002): Die Bedeutung der funktionsbasierten Charakterisierung von
Flächen-Inanspruchnahmen in industriellen Prozesskettenanalysen. Ein Beitrag zur
ganzheitlichen Bilanzierung. Dissertation. Aachen: Shaker (Berichte aus der
Umwelttechnik).
Beck 2010 Beck, T.; Bos, U.; Wittstock, B. (2010): LANCA – Calculation of Land Use Indicator
Values in Life Cycle Assessment; Online http://www.lbp-gabi.de/ .
Brentrup 2000 Brentrup, F.; Küsters, J.; Lammel, J.; Kuhlmann, H.; (2000): Methods to estimate
on-field nitrogen emissions from crop production as an input to LCA studies in the
Agricultural Sector. The International Journal of Life Cycle Assessment. 5(6), 349-
357.
EC 2001 European Commission: Directive 2001/80/EC on the limitation of emissions of
certain pollutants into the air from large combustion plants, 2001
EC 2009 European Commission: Directive 2009/28/EC on the promotion of the use of energy
from renewable sources and amending and subsequently repealing Directives
2001/77/EC and 2003/30/EC (Renewable Directive), April 2009
EC 2010 European Commission (2010). Directive 2010/75/EU of the European Parliament
and of the council of 24 November 2010 on industrial emissions (integrated pollution
prevention and control), November 2010
EIA 2015 U.S. Energy Information Administration: Electricity Data – Generation and thermal
out-put by energy source, total of all production types, release date January 2015,
http://www.eia.gov/electricity/data.cfm#generation
EPA 2014 U.S. Environmental Protection Agency (EPA): The Emissions and Generation
Resource integrated database (eGrid), 9th edition of eGrid with Year 2010 data,
Washington, 2014
Eurochlor 2012 Eurochlor, Chlorine Industry Review 2011-2012, 2012
Eurostat 2015 Eurostat: Energy Database - Supply, transformation, consumption - electricity -
annual data [nrg_105a], Luxembourg, 2015
FERC 2014 Federal Energy Regulatory Commission (FERC): Form No. 2014 – Annual Electric
Balancing Authority Area and Planning Area Report, 2014
IEA 2012 International Energy Agency: Electricity Information 2012, Paris, 2012
IPCC 2006 Intergovernmental Panel on Climate Change (IPCC). (2006). Guidelines for National
Greenhouse Gas Inventories, Volume 4 Agriculture, Forestry and Other Land Use,
Retrieved December 22, 2009 from:
http://www.ipccnggip.iges.or.jp/public/2006gl/vol4.html
ISO 14046 ISO/CD Life Cycle Assessment – Water Footprint – Requirements and guidelines
73
ISO 2006 International Organization for Standardization (ISO). (2006): Environmental
Management – Life Cycle Assessment – Principles and Framework. Series 14040
and 14044.
Pfister 2011 Pfister, S.; Bayer, P.; Koehler, A.; Hellweg. S. (2011): Environmental Science &
Technology 2011 45 (13), 5761-5768 Environmental Impacts of Water Use in Global
Crop Production: Hotspots and Trade-Offs with Land Use
SICAS 2008 Semiconductor Industry Association (SIA): Semiconductor International Capacity
Statistics (SICAS) 2008
UBA 2010 Handbuch Emissionsfaktoren des Straßenverkehrs, Version 3.1, Umweltbundesamt
Berlin; BUWAL / OFEFP Bern; Umweltbundesamt Wien, http://www.hbefa.net,
Berlin, Bern, Vienna / Germany, Switzerland, Austria
WaterGAP 2012 Water - a Global Assessment and Prognosis. Version 2.0. Center for
environmental systems research, University of Kassel, Germany. 2012
WSTS 2008 World Semiconductor Trade Statistics: Semiconductor Market Forecast 2008
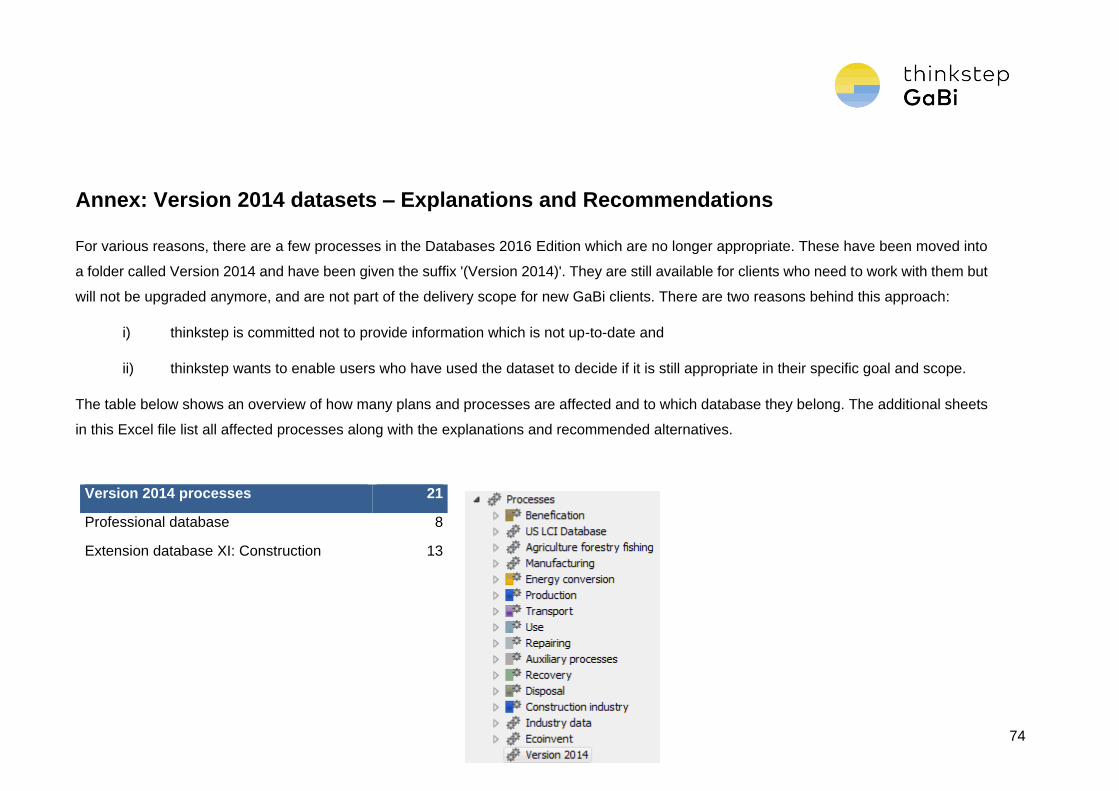
74
Annex: Version 2014 datasets – Explanations and Recommendations
For various reasons, there are a few processes in the Databases 2016 Edition which are no longer appropriate. These have been moved into
a folder called Version 2014 and have been given the suffix '(Version 2014)'. They are still available for clients who need to work with them but
will not be upgraded anymore, and are not part of the delivery scope for new GaBi clients. There are two reasons behind this approach:
i) thinkstep is committed not to provide information which is not up-to-date and
ii) thinkstep wants to enable users who have used the dataset to decide if it is still appropriate in their specific goal and scope.
The table below shows an overview of how many plans and processes are affected and to which database they belong. The additional sheets
in this Excel file list all affected processes along with the explanations and recommended alternatives.
Version 2014 processes 21
Professional database 8
Extension database XI: Construction 13
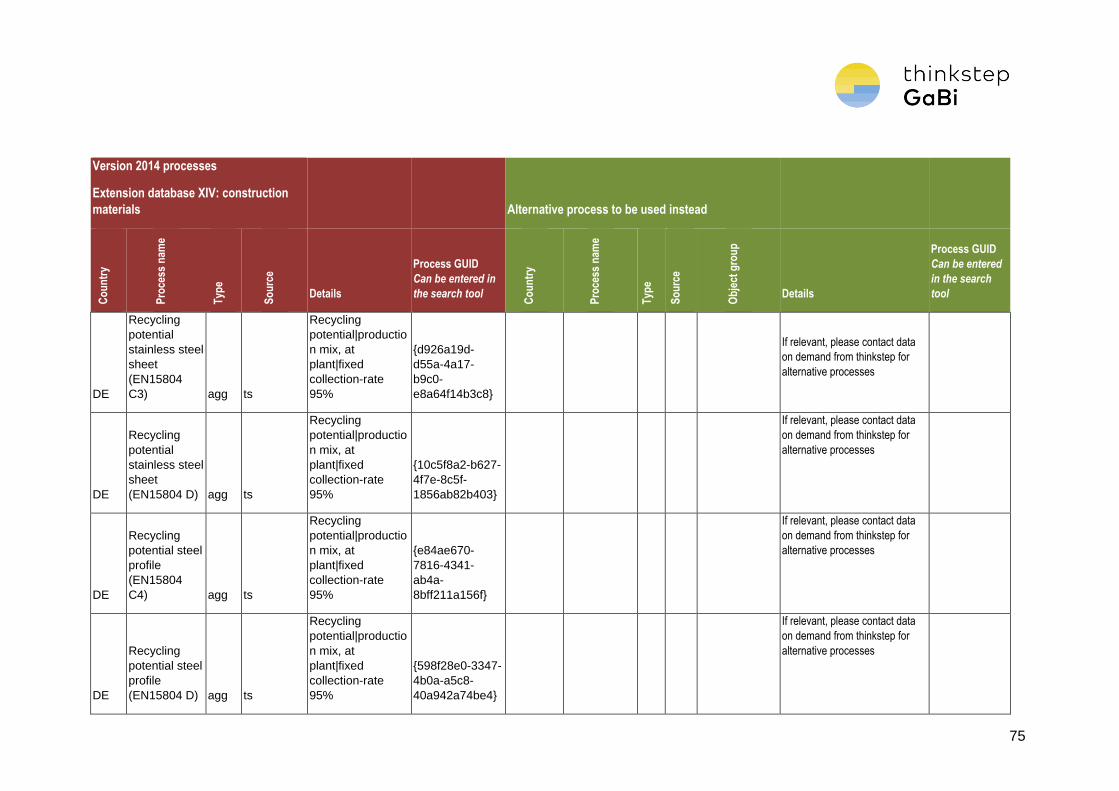
75
Version 2014 processes
Extension database XIV: construction
materials Alternative process to be used instead
Co
un
try
Pro
cess
nam
e
Typ
e
So
urc
e
Details
Process GUID
Can be entered in
the search tool
Co
un
try
Pro
cess
nam
e
Typ
e
So
urc
e
Ob
ject
gro
up
Details
Process GUID
Can be entered
in the search
tool
DE
Recycling
potential
stainless steel
sheet
(EN15804
C3) agg ts
Recycling
potential|productio
n mix, at
plant|fixed
collection-rate
95%
{d926a19d-
d55a-4a17-
b9c0-
e8a64f14b3c8}
If relevant, please contact data
on demand from thinkstep for
alternative processes
DE
Recycling
potential
stainless steel
sheet
(EN15804 D) agg ts
Recycling
potential|productio
n mix, at
plant|fixed
collection-rate
95%
{10c5f8a2-b627-
4f7e-8c5f-
1856ab82b403}
If relevant, please contact data
on demand from thinkstep for
alternative processes
DE
Recycling
potential steel
profile
(EN15804
C4) agg ts
Recycling
potential|productio
n mix, at
plant|fixed
collection-rate
95%
{e84ae670-
7816-4341-
ab4a-
8bff211a156f}
If relevant, please contact data
on demand from thinkstep for
alternative processes
DE
Recycling
potential steel
profile
(EN15804 D) agg ts
Recycling
potential|productio
n mix, at
plant|fixed
collection-rate
95%
{598f28e0-3347-
4b0a-a5c8-
40a942a74be4}
If relevant, please contact data
on demand from thinkstep for
alternative processes
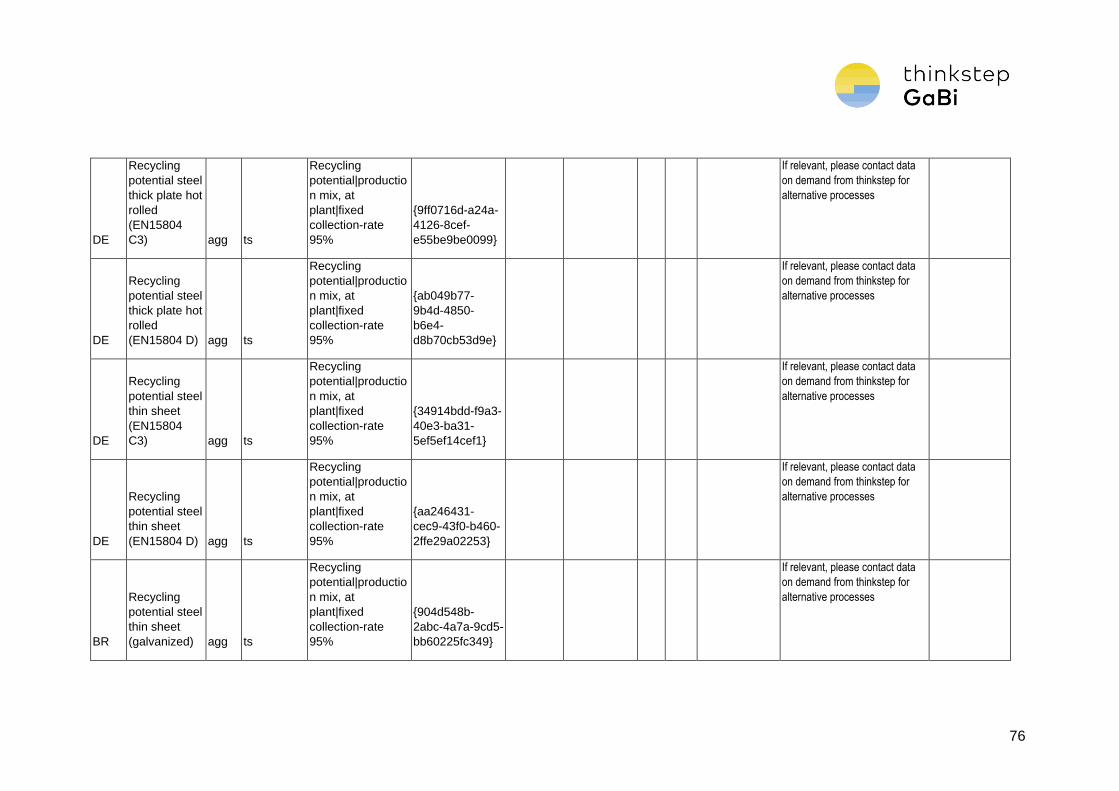
76
DE
Recycling
potential steel
thick plate hot
rolled
(EN15804
C3) agg ts
Recycling
potential|productio
n mix, at
plant|fixed
collection-rate
95%
{9ff0716d-a24a-
4126-8cef-
e55be9be0099}
If relevant, please contact data
on demand from thinkstep for
alternative processes
DE
Recycling
potential steel
thick plate hot
rolled
(EN15804 D) agg ts
Recycling
potential|productio
n mix, at
plant|fixed
collection-rate
95%
{ab049b77-
9b4d-4850-
b6e4-
d8b70cb53d9e}
If relevant, please contact data
on demand from thinkstep for
alternative processes
DE
Recycling
potential steel
thin sheet
(EN15804
C3) agg ts
Recycling
potential|productio
n mix, at
plant|fixed
collection-rate
95%
{34914bdd-f9a3-
40e3-ba31-
5ef5ef14cef1}
If relevant, please contact data
on demand from thinkstep for
alternative processes
DE
Recycling
potential steel
thin sheet
(EN15804 D) agg ts
Recycling
potential|productio
n mix, at
plant|fixed
collection-rate
95%
{aa246431-
cec9-43f0-b460-
2ffe29a02253}
If relevant, please contact data
on demand from thinkstep for
alternative processes
BR
Recycling
potential steel
thin sheet
(galvanized) agg ts
Recycling
potential|productio
n mix, at
plant|fixed
collection-rate
95%
{904d548b-
2abc-4a7a-9cd5-
bb60225fc349}
If relevant, please contact data
on demand from thinkstep for
alternative processes
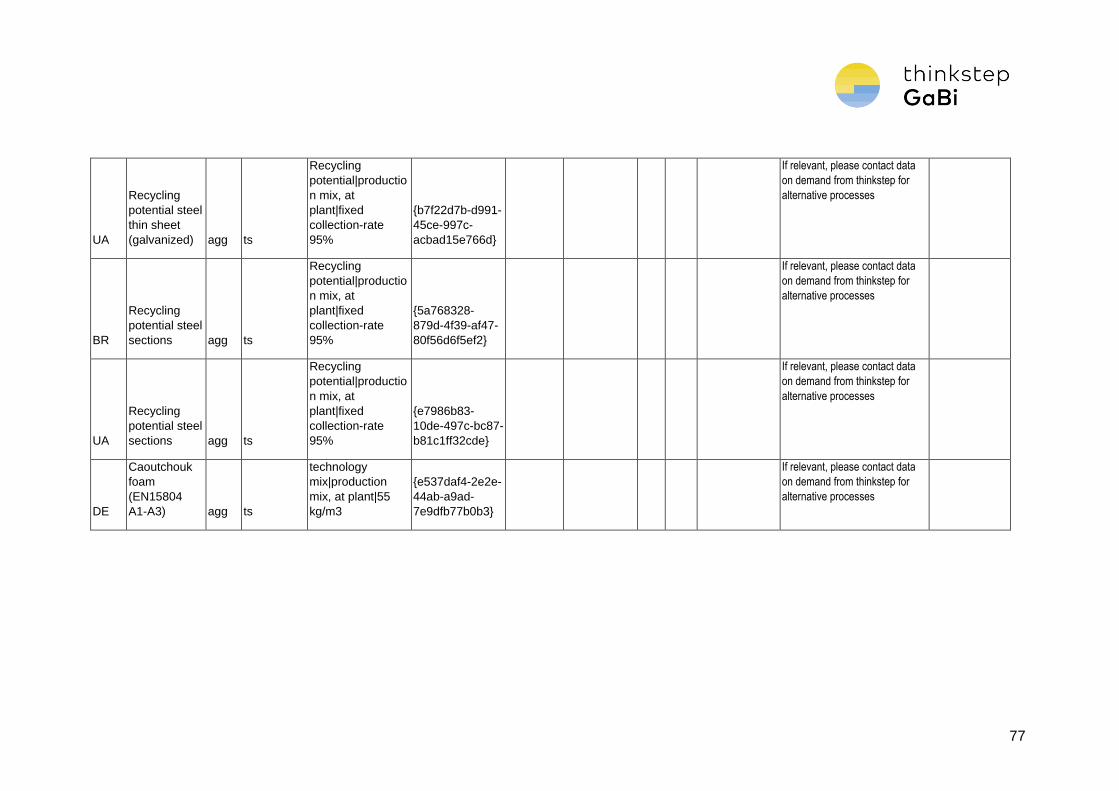
77
UA
Recycling
potential steel
thin sheet
(galvanized) agg ts
Recycling
potential|productio
n mix, at
plant|fixed
collection-rate
95%
{b7f22d7b-d991-
45ce-997c-
acbad15e766d}
If relevant, please contact data
on demand from thinkstep for
alternative processes
BR
Recycling
potential steel
sections agg ts
Recycling
potential|productio
n mix, at
plant|fixed
collection-rate
95%
{5a768328-
879d-4f39-af47-
80f56d6f5ef2}
If relevant, please contact data
on demand from thinkstep for
alternative processes
UA
Recycling
potential steel
sections agg ts
Recycling
potential|productio
n mix, at
plant|fixed
collection-rate
95%
{e7986b83-
10de-497c-bc87-
b81c1ff32cde}
If relevant, please contact data
on demand from thinkstep for
alternative processes
DE
Caoutchouk
foam
(EN15804
A1-A3) agg ts
technology
mix|production
mix, at plant|55
kg/m3
{e537daf4-2e2e-
44ab-a9ad-
7e9dfb77b0b3}
If relevant, please contact data
on demand from thinkstep for
alternative processes
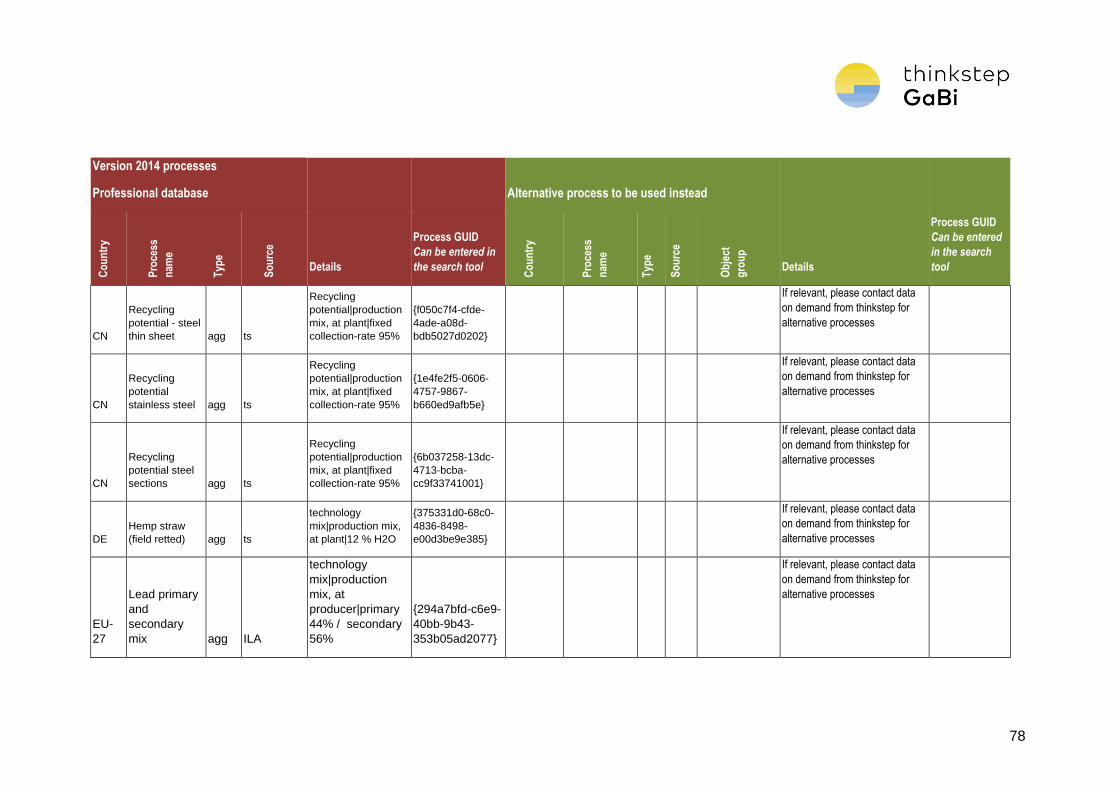
78
Version 2014 processes
Professional database Alternative process to be used instead
Co
un
try
Pro
cess
nam
e
Typ
e
So
urc
e Details
Process GUID
Can be entered in
the search tool
Co
un
try
Pro
cess
nam
e
Typ
e
So
urc
e
Ob
ject
gro
up
Details
Process GUID
Can be entered
in the search
tool
CN
Recycling
potential - steel
thin sheet agg ts
Recycling
potential|production
mix, at plant|fixed
collection-rate 95%
{f050c7f4-cfde-
4ade-a08d-
bdb5027d0202}
If relevant, please contact data
on demand from thinkstep for
alternative processes
CN
Recycling
potential
stainless steel agg ts
Recycling
potential|production
mix, at plant|fixed
collection-rate 95%
{1e4fe2f5-0606-
4757-9867-
b660ed9afb5e}
If relevant, please contact data
on demand from thinkstep for
alternative processes
CN
Recycling
potential steel
sections agg ts
Recycling
potential|production
mix, at plant|fixed
collection-rate 95%
{6b037258-13dc-
4713-bcba-
cc9f33741001}
If relevant, please contact data
on demand from thinkstep for
alternative processes
DE
Hemp straw
(field retted) agg ts
technology
mix|production mix,
at plant|12 % H2O
{375331d0-68c0-
4836-8498-
e00d3be9e385}
If relevant, please contact data
on demand from thinkstep for
alternative processes
EU-
27
Lead primary
and
secondary
mix agg ILA
technology
mix|production
mix, at
producer|primary
44% / secondary
56%
{294a7bfd-c6e9-
40bb-9b43-
353b05ad2077}
If relevant, please contact data
on demand from thinkstep for
alternative processes
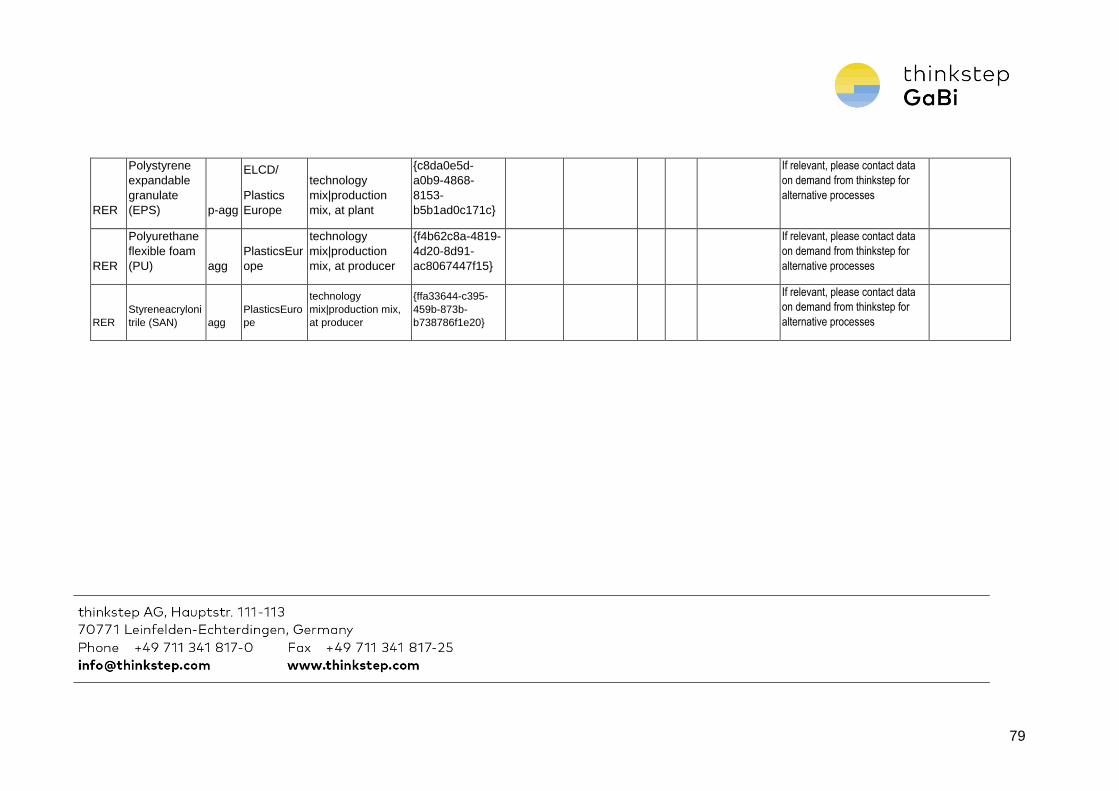
79
RER
Polystyrene
expandable
granulate
(EPS) p-agg
ELCD/
Plastics
Europe
technology
mix|production
mix, at plant
{c8da0e5d-
a0b9-4868-
8153-
b5b1ad0c171c}
If relevant, please contact data
on demand from thinkstep for
alternative processes
RER
Polyurethane
flexible foam
(PU) agg
PlasticsEur
ope
technology
mix|production
mix, at producer
{f4b62c8a-4819-
4d20-8d91-
ac8067447f15}
If relevant, please contact data
on demand from thinkstep for
alternative processes
RER Styreneacryloni
trile (SAN) agg PlasticsEuro
pe
technology
mix|production mix,
at producer
{ffa33644-c395-
459b-873b-
b738786f1e20}
If relevant, please contact data
on demand from thinkstep for
alternative processes