g model downloaded from article in...
TRANSCRIPT
A
AAm
UQ1
Ja
b
c
d
e
a
ARRAA
KGLIDMC
1
Q3NwmQ4bQ5
aoMb
Q2
h1
1
2
3
4
5
6
7
8
9
10
11
12
13
14
15
16
17
18
19
20
21
22
23
24
25
26
27
28
29
30
31
32
33
34
35
36
37
38
ARTICLE IN PRESSG ModelSOC 3573 1–11
Applied Soft Computing xxx (2016) xxx–xxx
Contents lists available at ScienceDirect
Applied Soft Computing
j ourna l h o mepage: www.elsev ier .com/ locate /asoc
pplication of Gabor wavelet and Locality Sensitive Discriminantnalysis for automated identification of breast cancer using digitizedammogram images
. Raghavendra a,∗, U. Rajendra Acharya b,c,d, Hamido Fujita e, Anjan Gudigar a,en Hong Tan b, Shreesha Chokkadi a
Department of Instrumentation and Control Engineering, Manipal Institute of Technology, Manipal 576104, IndiaDepartment of Electronics and Computer Engineering, Ngee Ann Polytechnic, Clementi, 599489, SingaporeDepartment of Biomedical Engineering, School of Science and Technology, SIM University, Clementi, 599491, SingaporeDepartment of Biomedical Engineering, Faculty of Engineering, University of Malaya, Kuala Lumpur 50603, MalaysiaIwate Prefectural University (IPU), Faculty of Software and Information Science, Iwate, Japan
r t i c l e i n f o
rticle history:eceived 11 January 2016eceived in revised form 9 April 2016ccepted 27 April 2016vailable online xxx
eywords:abor waveletSDAnterclass variationDSMammography
a b s t r a c t
Breast cancer is one of the prime causes of death in women. Early detection may help to improve thesurvival rate to a great extent. Mammography is considered as one of the most reliable methods to pre-screen of breast cancer. However, reading the mammograms by radiologists is laborious, taxing, andprone to intra/inter observer variability errors. Computer Aided Diagnosis (CAD) helps to obtain fast,consistent and reliable diagnosis. This paper presents an automated classification of normal, benign andmalignant breast cancer using digitized mammogram images. The proposed method used Gabor waveletfor feature extraction and Locality Sensitive Discriminant Analysis (LSDA) for data reduction. The reducedfeatures are ranked using their F-values and fed to Decision Tree (DT), Linear Discriminant Analysis (LDA)and Quadratic Discriminant Analysis (QDA), k-Nearest Neighbor (k-NN), Naïve Bayes Classifier (NBC),Probabilistic Neural Network (PNN), Support Vector Machine (SVM), AdaBoost and Fuzzy Sugeno (FSC)classifiers one by one to select the highest performing classifier using minimum number of features.
Downloaded from http://iranpaper.irhttp://tarjomano.com
AD tool The proposed method is evaluated using 690 mammogram images taken from a benchmarked Digi-tal Database for Screening Mammography (DDSM) dataset. Our developed method has achieved meanaccuracy, sensitivity, specificity of 98.69%, 99.34% and 98.26% respectively for k-NN classifier using eightfeatures with 10-fold cross validation. This system can be employed in hospitals and polyclinics to aidthe clinicians to cross verify their manual diagnosis.
© 2016 Published by Elsevier B.V.
39
40
41
42
43
44
45
46
47
. Introduction
Breast cancer is the second major cause of death in women.early, 1.7 million new breast cancer cases are diagnosed world-ide in 2012 according to the Globocan project [1]. However,ortality rates, due to breast cancer, have been reducing due to
etter diagnostic facilities and effective treatments.Breast Self-Examination (BSE) and Clinical Breast Exam (CBE)
re the two methods that women can go for. However, these meth-
Please cite this article in press as: R. U., et al., Application oysis for automated identification of breast cancer using digihttp://dx.doi.org/10.1016/j.asoc.2016.04.036
ds are not capable of detecting the cancer at its earliest stage.ammography is the popular technique designed to image the
reast [2]. It comprises of an X-ray systems that permits scanty
∗ Corresponding author.E-mail address: [email protected] (R. U.).
ttp://dx.doi.org/10.1016/j.asoc.2016.04.036568-4946/© 2016 Published by Elsevier B.V.
48
49
50
application of X-ray, high contrast, and high resolution detectors.Mammography has been proven to be most effective in screen-ing and diagnosis [3]. Generally, masses and calcifications are thetwo abnormalities present in the mammogram images [2]. Pres-ence of a star-shaped structure around mass lesions characterizesthe malignant tumors. Usually, spicules exhibit very weak con-trast with respect to their neighboring regions on mammogram[4]. Based on the shape, masses can be classified as either benignor malignant. Benign tumors are usually in round or oval shapewhereas malignant tumors are partially rounded shape with irreg-ular outlines. Analyzing these mammogram images is a challengingtask for the radiologists. Their interpretation depends on certain
f Gabor wavelet and Locality Sensitive Discriminant Anal-tized mammogram images, Appl. Soft Comput. J. (2016),
criteria such as experience, training etc., Sometimes; radiologistsmay miss breast cancer due to fatty and dense breasts and falsepositive judgment results a biopsy for diagnosis.
51
52
53
ING ModelA
2 ompu
rftssoteowma[aftcn[
tfshtdrtaaipLspwaPttft
54
55
56
57
58
59
60
61
62
63
64
65
66
67
68
69
70
71
72
73
74
75
76
77
78
79
80
81
82
83
84
85
86
87
88
89
90
91
92
93
94
95
96
97
98
99
100
101
102
103
104
105
106
107
108
109
110
111
112
113
114
115
116
117
118
119
120
121
122
123
124
125
126
127
128
129
130
131
132
133
134
135
136
Downloaded from http://iranpaper.irhttp://tarjomano.com
ARTICLESOC 3573 1–11R. U. et al. / Applied Soft C
Consequently, Computer-Aided Diagnosis (CAD) assists theadiologists to analyze the mammogram images. The generalramework for CAD system using mammogram images consists ofwo major processing stages namely, feature extraction and clas-ification. Most of the work additionally includes pre-processingtage prior to feature extraction, to enhance the quality of Regionf Interest (ROI). Few of them are thresholding [5–7], region-basedechniques [8–10] and edge detection techniques [11,12]. Featurextraction is a basic step to observe the nature of different classesf mammogram images. It extracts discriminative information,hich can be utilized to efficiently classify into normal, benign andalignant lesions. Commonly used feature extraction techniques
re Gabor filter [13,14], set of filter banks [15], Zernike moments16] and Discrete Wavelet Transform (DWT) [17–25]. Most of thebove approaches commonly use feature extraction algorithmsollowed by machine learning algorithms to intelligently classifyhe samples into normal and abnormal cases. Commonly usedlassification methods are artificial neural networks [7,13,22,26] k-earest neighbor [27], fuzzy [20,28], Support Vector Machine (SVM)6,27,29,30–32,33] and Linear Discriminant Analysis (LDA) [34].
Multiresolution analysis of mammogram is one of the popularechniques as they highlight abnormalities in the extracted textureeatures. The original mammogram image is decomposed intoeveral sub-bands that can preserve information regarding bothigh and low frequencies. Wavelet transform is one among theseechniques. Variety of multiresolution based techniques is intro-uced in the recent years [17–25]. Wei et al. [35] have used multiesolution texture analysis to differentiate normal and abnormalissues and achieved an Area Under Curve (AUC) of 0.96. Anotherpproach uses textural information of the mammogram images a statistical measure of a pixel in a region. This informations essential to discriminate normal from benign and malignantatterns. The most popular method of texture analysis is Grayevel Co-occurrence Matrix (GLCM) to compute second ordertatistical measures of an image [36–38]. Chan et al. [39] haveroposed Spatial Gray Level Dependence matrices based approachith genetic algorithm as a feature selection technique and
chieved AUC of 0.89. In Ref. [40], GLCM is optimized using Hybridarticle Swarm Optimization and Genetic algorithm and achievedhe classification accuracy of 94%. Recently, in order to increase
Please cite this article in press as: R. U., et al., Application oysis for automated identification of breast cancer using digihttp://dx.doi.org/10.1016/j.asoc.2016.04.036
he overall efficiency, a classifier is accompanied with the noveleature weight adjustments technique [3]. The detailed review ofhe existing classification techniques is presented in Ref. [2].
Fig. 1. Block diagram of p
PRESSting xxx (2016) xxx–xxx
Most of the studies include constrained sample size during theexperiment [3,5,6,7,41] and the method may not be extended tolarge samples as majority of them concentrate on local appear-ances [3,5,7,41]. Many techniques use morphological operations[42] and various methods for image enhancement. But, deciding aproper structuring element is difficult [43]. Also a single texturefeature is not sufficient to model benign and malignant massesdue to slight structural difference. Moreover, analysis of mam-mogram images with a particular orientation and frequency maynot be able to extract significant information about the abnormal-ities.
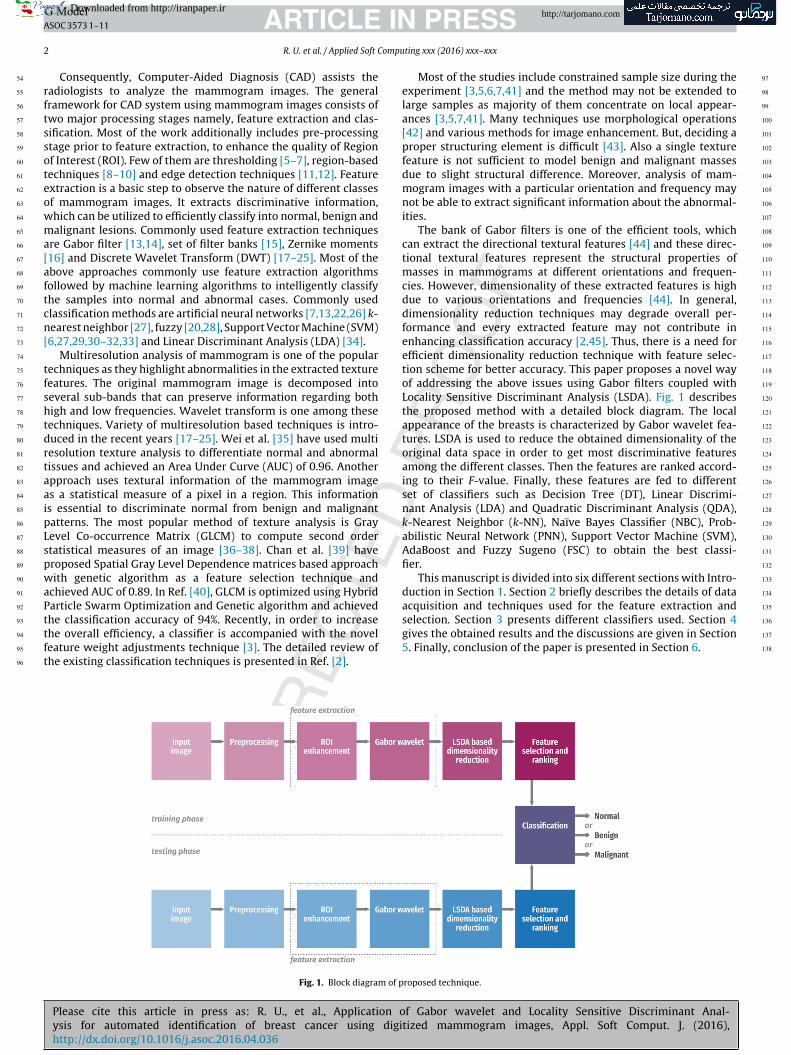
The bank of Gabor filters is one of the efficient tools, whichcan extract the directional textural features [44] and these direc-tional textural features represent the structural properties ofmasses in mammograms at different orientations and frequen-cies. However, dimensionality of these extracted features is highdue to various orientations and frequencies [44]. In general,dimensionality reduction techniques may degrade overall per-formance and every extracted feature may not contribute inenhancing classification accuracy [2,45]. Thus, there is a need forefficient dimensionality reduction technique with feature selec-tion scheme for better accuracy. This paper proposes a novel wayof addressing the above issues using Gabor filters coupled withLocality Sensitive Discriminant Analysis (LSDA). Fig. 1 describesthe proposed method with a detailed block diagram. The localappearance of the breasts is characterized by Gabor wavelet fea-tures. LSDA is used to reduce the obtained dimensionality of theoriginal data space in order to get most discriminative featuresamong the different classes. Then the features are ranked accord-ing to their F-value. Finally, these features are fed to differentset of classifiers such as Decision Tree (DT), Linear Discrimi-nant Analysis (LDA) and Quadratic Discriminant Analysis (QDA),k-Nearest Neighbor (k-NN), Naïve Bayes Classifier (NBC), Prob-abilistic Neural Network (PNN), Support Vector Machine (SVM),AdaBoost and Fuzzy Sugeno (FSC) to obtain the best classi-fier.
This manuscript is divided into six different sections with Intro-duction in Section 1. Section 2 briefly describes the details of dataacquisition and techniques used for the feature extraction andselection. Section 3 presents different classifiers used. Section 4
f Gabor wavelet and Locality Sensitive Discriminant Anal-tized mammogram images, Appl. Soft Comput. J. (2016),
gives the obtained results and the discussions are given in Section5. Finally, conclusion of the paper is presented in Section 6.
roposed technique.
137
138
ARTICLE IN PRESSG ModelASOC 3573 1–11
R. U. et al. / Applied Soft Computing xxx (2016) xxx–xxx 3
F originm
2
2
Ddtu21(ir
2
paaoo(baioav
Q6
139
140
141
142
143
144
145
146
147
148
149
150
151
152
153
154
155
156
157
158
159
160
161
162
163
164
165
166
167
168
169
170
171
172
173
174
175
176
177
178
179
180
181
182
183
184
185
Downloaded from http://iranpaper.irhttp://tarjomano.com
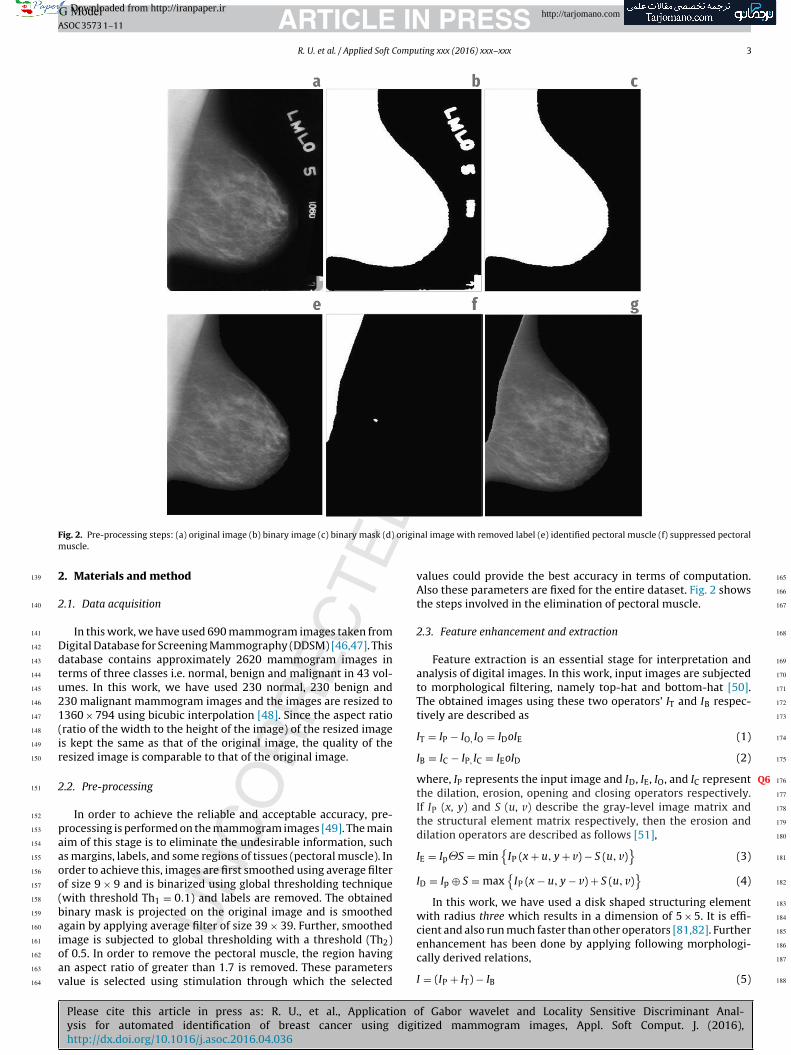
ig. 2. Pre-processing steps: (a) original image (b) binary image (c) binary mask (d)uscle.
. Materials and method
.1. Data acquisition
In this work, we have used 690 mammogram images taken fromigital Database for Screening Mammography (DDSM) [46,47]. Thisatabase contains approximately 2620 mammogram images inerms of three classes i.e. normal, benign and malignant in 43 vol-mes. In this work, we have used 230 normal, 230 benign and30 malignant mammogram images and the images are resized to360 × 794 using bicubic interpolation [48]. Since the aspect ratioratio of the width to the height of the image) of the resized images kept the same as that of the original image, the quality of theesized image is comparable to that of the original image.
.2. Pre-processing
In order to achieve the reliable and acceptable accuracy, pre-rocessing is performed on the mammogram images [49]. The mainim of this stage is to eliminate the undesirable information, suchs margins, labels, and some regions of tissues (pectoral muscle). Inrder to achieve this, images are first smoothed using average filterf size 9 × 9 and is binarized using global thresholding techniquewith threshold Th1 = 0.1) and labels are removed. The obtainedinary mask is projected on the original image and is smoothedgain by applying average filter of size 39 × 39. Further, smoothed
Please cite this article in press as: R. U., et al., Application oysis for automated identification of breast cancer using digihttp://dx.doi.org/10.1016/j.asoc.2016.04.036
mage is subjected to global thresholding with a threshold (Th2)f 0.5. In order to remove the pectoral muscle, the region havingn aspect ratio of greater than 1.7 is removed. These parametersalue is selected using stimulation through which the selected
al image with removed label (e) identified pectoral muscle (f) suppressed pectoral
values could provide the best accuracy in terms of computation.Also these parameters are fixed for the entire dataset. Fig. 2 showsthe steps involved in the elimination of pectoral muscle.
2.3. Feature enhancement and extraction
Feature extraction is an essential stage for interpretation andanalysis of digital images. In this work, input images are subjectedto morphological filtering, namely top-hat and bottom-hat [50].The obtained images using these two operators’ IT and IB respec-tively are described as
IT = IP − IO,IO = IDoIE (1)
IB = IC − IP,IC = IEoID (2)
where, IP represents the input image and ID, IE, IO, and IC represent
the dilation, erosion, opening and closing operators respectively.If IP (x, y) and S (u, v) describe the gray-level image matrix andthe structural element matrix respectively, then the erosion anddilation operators are described as follows [51],
IE = Ip�S = min{IP (x + u, y + v) − S (u, v)
}(3)
ID = Ip ⊕ S = max{IP (x − u, y − v) + S (u, v)
}(4)
In this work, we have used a disk shaped structuring elementwith radius three which results in a dimension of 5 × 5. It is effi-cient and also run much faster than other operators [81,82]. Further
f Gabor wavelet and Locality Sensitive Discriminant Anal-tized mammogram images, Appl. Soft Comput. J. (2016),
enhancement has been done by applying following morphologi-cally derived relations,
I = (IP + IT) − IB (5)
186
187
188
ARTICLE IN PRESSG ModelASOC 3573 1–11
4 R. U. et al. / Applied Soft Computing xxx (2016) xxx–xxx
featu
(icic
b
w(
k
wifevofppwttGam
189
190
191
192
193
194
195
196
197
198
199
200
201
202
203
204
205
206
207
208
209
210
211
212
213
214
215
216
217
218
219
220
221
222
223
224
225
226
227
228
229
230
231
232
233
234
235
236
237
238
Downloaded from http://iranpaper.irhttp://tarjomano.com
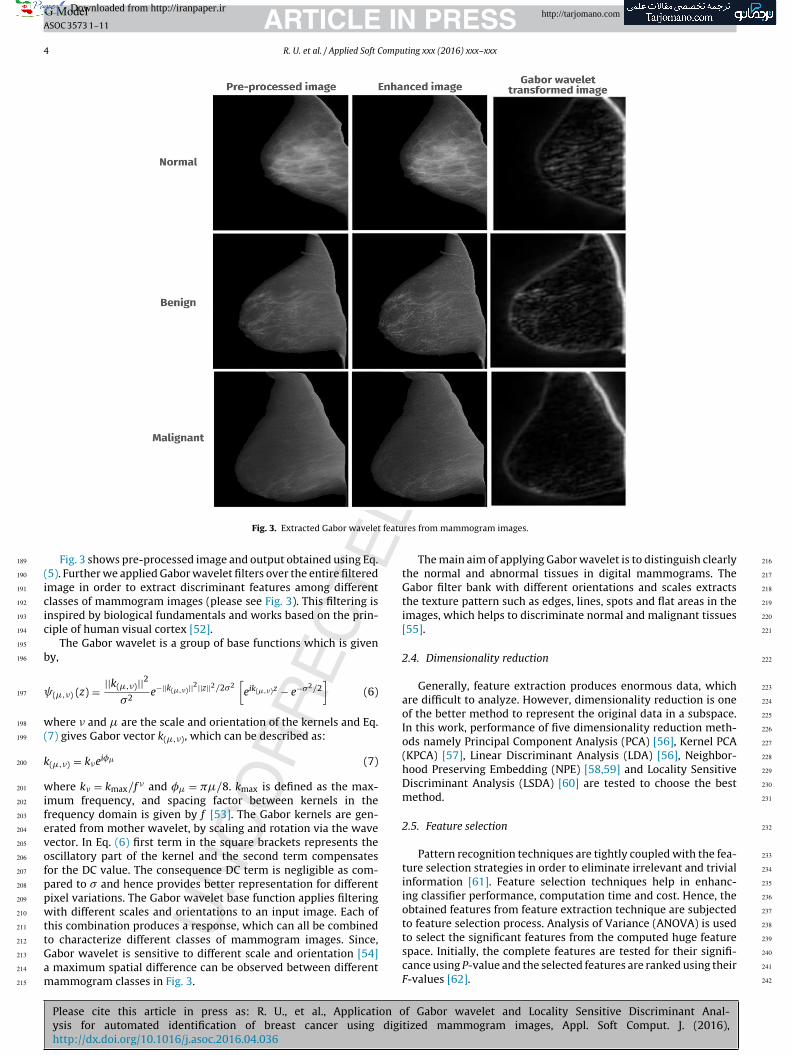
Fig. 3. Extracted Gabor wavelet
Fig. 3 shows pre-processed image and output obtained using Eq.5). Further we applied Gabor wavelet filters over the entire filteredmage in order to extract discriminant features among differentlasses of mammogram images (please see Fig. 3). This filtering isnspired by biological fundamentals and works based on the prin-iple of human visual cortex [52].
The Gabor wavelet is a group of base functions which is giveny,
(�,�) (z) = ||k(�,�)||2�2
e−||k(�,�)||2||z||2/2�2[eik(�,�)z − e−�
2/2]
(6)
here � and � are the scale and orientation of the kernels and Eq.7) gives Gabor vector k(�,�), which can be described as:
(�,�) = k�ei�� (7)
here k� = kmax/f � and �� = ��/8. kmax is defined as the max-mum frequency, and spacing factor between kernels in therequency domain is given by f [53]. The Gabor kernels are gen-rated from mother wavelet, by scaling and rotation via the waveector. In Eq. (6) first term in the square brackets represents thescillatory part of the kernel and the second term compensatesor the DC value. The consequence DC term is negligible as com-ared to � and hence provides better representation for differentixel variations. The Gabor wavelet base function applies filteringith different scales and orientations to an input image. Each of
his combination produces a response, which can all be combined
Please cite this article in press as: R. U., et al., Application oysis for automated identification of breast cancer using digihttp://dx.doi.org/10.1016/j.asoc.2016.04.036
o characterize different classes of mammogram images. Since,abor wavelet is sensitive to different scale and orientation [54]
maximum spatial difference can be observed between differentammogram classes in Fig. 3.
res from mammogram images.
The main aim of applying Gabor wavelet is to distinguish clearlythe normal and abnormal tissues in digital mammograms. TheGabor filter bank with different orientations and scales extractsthe texture pattern such as edges, lines, spots and flat areas in theimages, which helps to discriminate normal and malignant tissues[55].
2.4. Dimensionality reduction
Generally, feature extraction produces enormous data, whichare difficult to analyze. However, dimensionality reduction is oneof the better method to represent the original data in a subspace.In this work, performance of five dimensionality reduction meth-ods namely Principal Component Analysis (PCA) [56], Kernel PCA(KPCA) [57], Linear Discriminant Analysis (LDA) [56], Neighbor-hood Preserving Embedding (NPE) [58,59] and Locality SensitiveDiscriminant Analysis (LSDA) [60] are tested to choose the bestmethod.
2.5. Feature selection
Pattern recognition techniques are tightly coupled with the fea-ture selection strategies in order to eliminate irrelevant and trivialinformation [61]. Feature selection techniques help in enhanc-ing classifier performance, computation time and cost. Hence, theobtained features from feature extraction technique are subjectedto feature selection process. Analysis of Variance (ANOVA) is used
f Gabor wavelet and Locality Sensitive Discriminant Anal-tized mammogram images, Appl. Soft Comput. J. (2016),
to select the significant features from the computed huge featurespace. Initially, the complete features are tested for their signifi-cance using P-value and the selected features are ranked using theirF-values [62].
239
240
241
242
ARTICLE IN PRESSG ModelASOC 3573 1–11
R. U. et al. / Applied Soft Computing xxx (2016) xxx–xxx 5
ents f
3
brmacatsi
3
ustp
3
niasla
3
sifih
3
c[v
243
244
245
246
247
248
249
250
251
252
253
254
255
256
257
258
259
260
261
262
263
264
265
266
267
268
269
270
271
272
273
274
275
276
277
278
279
280
281
282
283
284
285
286
287
288
289
290
291
292
293
294
295
296
297
298
299
300
301
302
303
304
305
306
307
308
309
Downloaded from http://iranpaper.irhttp://tarjomano.com
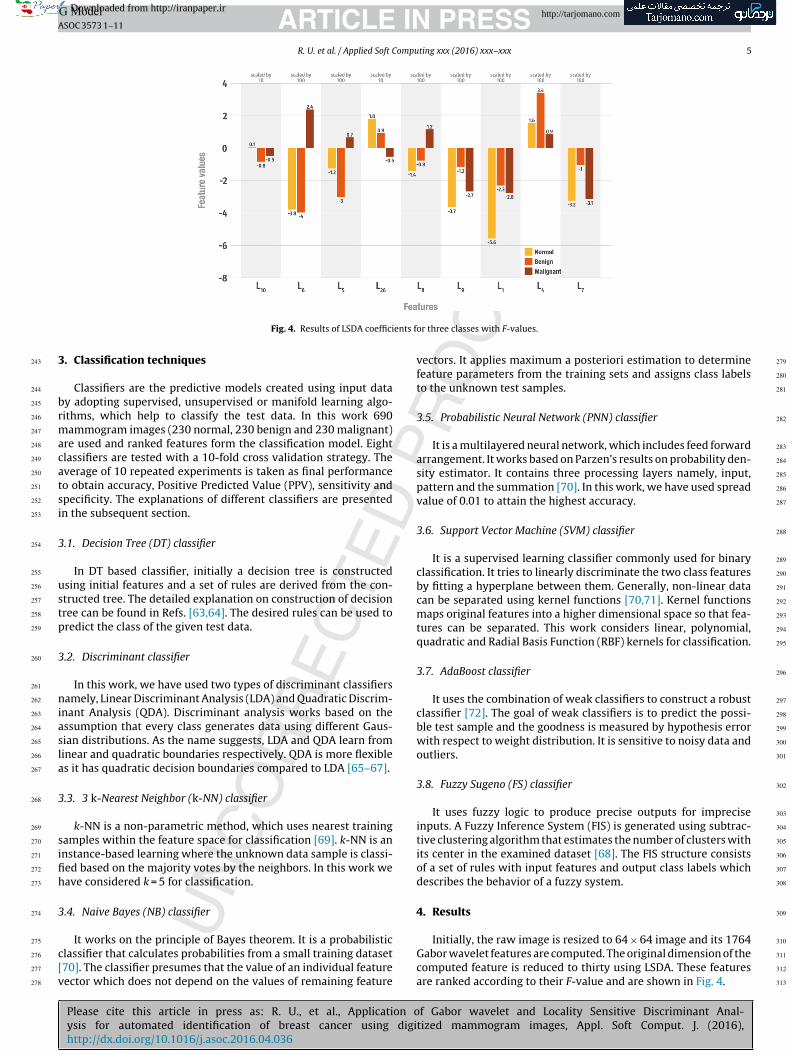
Fig. 4. Results of LSDA coeffici
. Classification techniques
Classifiers are the predictive models created using input datay adopting supervised, unsupervised or manifold learning algo-ithms, which help to classify the test data. In this work 690
ammogram images (230 normal, 230 benign and 230 malignant)re used and ranked features form the classification model. Eightlassifiers are tested with a 10-fold cross validation strategy. Theverage of 10 repeated experiments is taken as final performanceo obtain accuracy, Positive Predicted Value (PPV), sensitivity andpecificity. The explanations of different classifiers are presentedn the subsequent section.
.1. Decision Tree (DT) classifier
In DT based classifier, initially a decision tree is constructedsing initial features and a set of rules are derived from the con-tructed tree. The detailed explanation on construction of decisionree can be found in Refs. [63,64]. The desired rules can be used toredict the class of the given test data.
.2. Discriminant classifier
In this work, we have used two types of discriminant classifiersamely, Linear Discriminant Analysis (LDA) and Quadratic Discrim-
nant Analysis (QDA). Discriminant analysis works based on thessumption that every class generates data using different Gaus-ian distributions. As the name suggests, LDA and QDA learn frominear and quadratic boundaries respectively. QDA is more flexibles it has quadratic decision boundaries compared to LDA [65–67].
.3. 3 k-Nearest Neighbor (k-NN) classifier
k-NN is a non-parametric method, which uses nearest trainingamples within the feature space for classification [69]. k-NN is annstance-based learning where the unknown data sample is classi-ed based on the majority votes by the neighbors. In this work weave considered k = 5 for classification.
.4. Naive Bayes (NB) classifier
Please cite this article in press as: R. U., et al., Application oysis for automated identification of breast cancer using digihttp://dx.doi.org/10.1016/j.asoc.2016.04.036
It works on the principle of Bayes theorem. It is a probabilisticlassifier that calculates probabilities from a small training dataset70]. The classifier presumes that the value of an individual featureector which does not depend on the values of remaining feature
or three classes with F-values.
vectors. It applies maximum a posteriori estimation to determinefeature parameters from the training sets and assigns class labelsto the unknown test samples.
3.5. Probabilistic Neural Network (PNN) classifier
It is a multilayered neural network, which includes feed forwardarrangement. It works based on Parzen’s results on probability den-sity estimator. It contains three processing layers namely, input,pattern and the summation [70]. In this work, we have used spreadvalue of 0.01 to attain the highest accuracy.
3.6. Support Vector Machine (SVM) classifier
It is a supervised learning classifier commonly used for binaryclassification. It tries to linearly discriminate the two class featuresby fitting a hyperplane between them. Generally, non-linear datacan be separated using kernel functions [70,71]. Kernel functionsmaps original features into a higher dimensional space so that fea-tures can be separated. This work considers linear, polynomial,quadratic and Radial Basis Function (RBF) kernels for classification.
3.7. AdaBoost classifier
It uses the combination of weak classifiers to construct a robustclassifier [72]. The goal of weak classifiers is to predict the possi-ble test sample and the goodness is measured by hypothesis errorwith respect to weight distribution. It is sensitive to noisy data andoutliers.
3.8. Fuzzy Sugeno (FS) classifier
It uses fuzzy logic to produce precise outputs for impreciseinputs. A Fuzzy Inference System (FIS) is generated using subtrac-tive clustering algorithm that estimates the number of clusters withits center in the examined dataset [68]. The FIS structure consistsof a set of rules with input features and output class labels whichdescribes the behavior of a fuzzy system.
4. Results
f Gabor wavelet and Locality Sensitive Discriminant Anal-tized mammogram images, Appl. Soft Comput. J. (2016),
Initially, the raw image is resized to 64 × 64 image and its 1764Gabor wavelet features are computed. The original dimension of thecomputed feature is reduced to thirty using LSDA. These featuresare ranked according to their F-value and are shown in Fig. 4.
310
311
312
313
ARTICLE IN PRESSG ModelASOC 3573 1–11
6 R. U. et al. / Applied Soft Computing xxx (2016) xxx–xxx
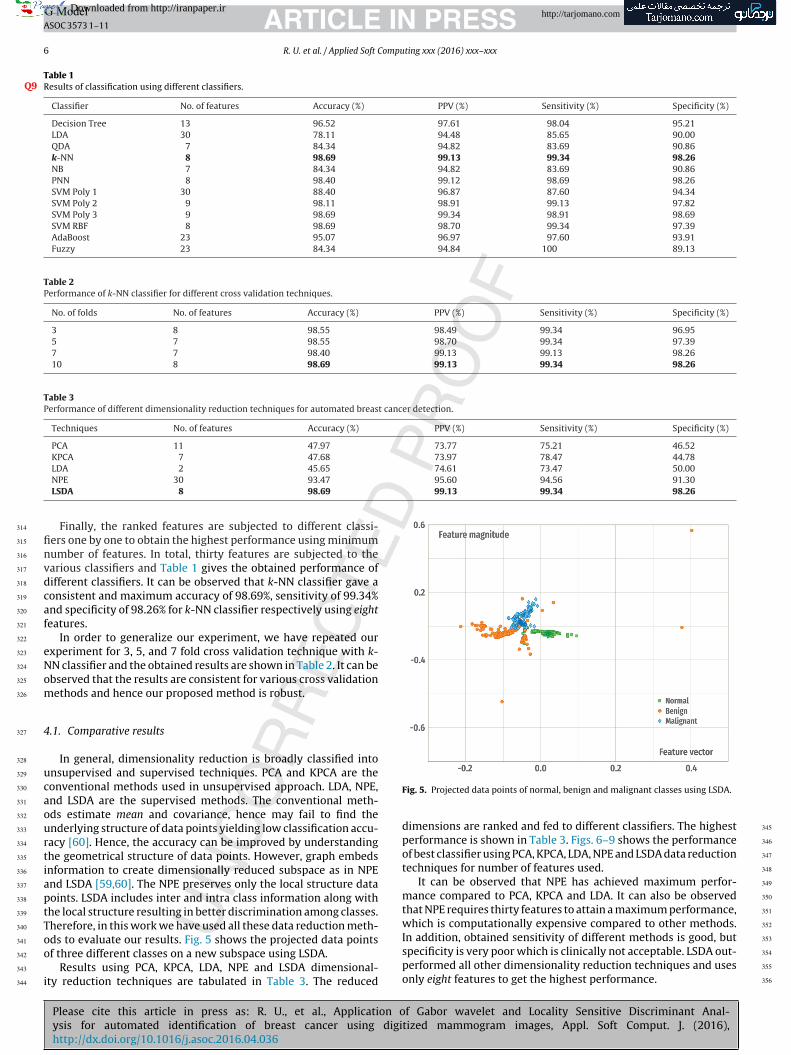
Table 1Results of classification using different classifiers.Q9
Classifier No. of features Accuracy (%) PPV (%) Sensitivity (%) Specificity (%)
Decision Tree 13 96.52 97.61 98.04 95.21LDA 30 78.11 94.48 85.65 90.00QDA 7 84.34 94.82 83.69 90.86k-NN 8 98.69 99.13 99.34 98.26NB 7 84.34 94.82 83.69 90.86PNN 8 98.40 99.12 98.69 98.26SVM Poly 1 30 88.40 96.87 87.60 94.34SVM Poly 2 9 98.11 98.91 99.13 97.82SVM Poly 3 9 98.69 99.34 98.91 98.69SVM RBF 8 98.69 98.70 99.34 97.39AdaBoost 23 95.07 96.97 97.60 93.91Fuzzy 23 84.34 94.84 100 89.13
Table 2Performance of k-NN classifier for different cross validation techniques.
No. of folds No. of features Accuracy (%) PPV (%) Sensitivity (%) Specificity (%)
3 8 98.55 98.49 99.34 96.955 7 98.55 98.70 99.34 97.397 7 98.40 99.13 99.13 98.2610 8 98.69 99.13 99.34 98.26
Table 3Performance of different dimensionality reduction techniques for automated breast cancer detection.
Techniques No. of features Accuracy (%) PPV (%) Sensitivity (%) Specificity (%)
PCA 11 47.97 73.77 75.21 46.52KPCA 7 47.68 73.97 78.47 44.78
74.61 73.47 50.0095.60 94.56 91.3099.13 99.34 98.26
finvdcaf
eNom
4
ucaourtiaptToo
i
314
315
316
317
318
319
320
321
322
323
324
325
326
327
328
329
330
331
332
333
334
335
336
337
338
339
340
341
342
343
344
345
346
347
348
349
350
351
352
Downloaded from http://iranpaper.irhttp://tarjomano.com
LDA 2 45.65
NPE 30 93.47
LSDA 8 98.69
Finally, the ranked features are subjected to different classi-ers one by one to obtain the highest performance using minimumumber of features. In total, thirty features are subjected to thearious classifiers and Table 1 gives the obtained performance ofifferent classifiers. It can be observed that k-NN classifier gave aonsistent and maximum accuracy of 98.69%, sensitivity of 99.34%nd specificity of 98.26% for k-NN classifier respectively using eighteatures.
In order to generalize our experiment, we have repeated ourxperiment for 3, 5, and 7 fold cross validation technique with k-N classifier and the obtained results are shown in Table 2. It can bebserved that the results are consistent for various cross validationethods and hence our proposed method is robust.
.1. Comparative results
In general, dimensionality reduction is broadly classified intonsupervised and supervised techniques. PCA and KPCA are theonventional methods used in unsupervised approach. LDA, NPE,nd LSDA are the supervised methods. The conventional meth-ds estimate mean and covariance, hence may fail to find thenderlying structure of data points yielding low classification accu-acy [60]. Hence, the accuracy can be improved by understandinghe geometrical structure of data points. However, graph embedsnformation to create dimensionally reduced subspace as in NPEnd LSDA [59,60]. The NPE preserves only the local structure dataoints. LSDA includes inter and intra class information along withhe local structure resulting in better discrimination among classes.herefore, in this work we have used all these data reduction meth-
Please cite this article in press as: R. U., et al., Application oysis for automated identification of breast cancer using digihttp://dx.doi.org/10.1016/j.asoc.2016.04.036
ds to evaluate our results. Fig. 5 shows the projected data pointsf three different classes on a new subspace using LSDA.
Results using PCA, KPCA, LDA, NPE and LSDA dimensional-ty reduction techniques are tabulated in Table 3. The reduced
Fig. 5. Projected data points of normal, benign and malignant classes using LSDA.
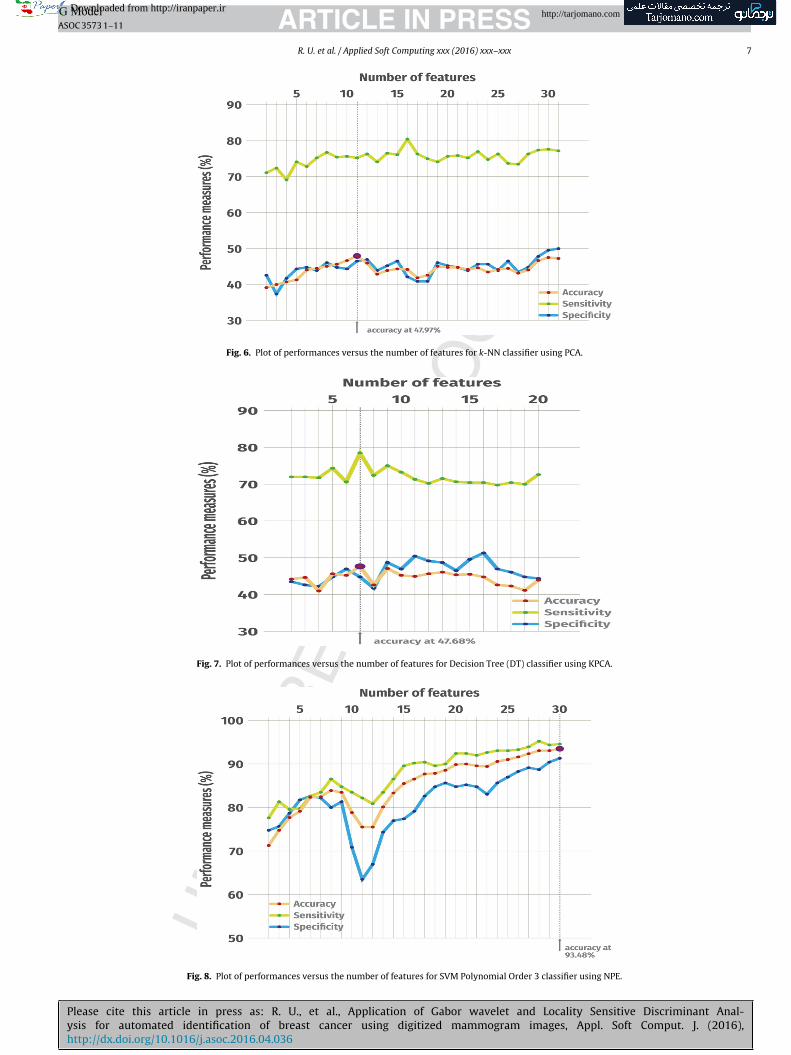
dimensions are ranked and fed to different classifiers. The highestperformance is shown in Table 3. Figs. 6–9 shows the performanceof best classifier using PCA, KPCA, LDA, NPE and LSDA data reductiontechniques for number of features used.
It can be observed that NPE has achieved maximum perfor-mance compared to PCA, KPCA and LDA. It can also be observedthat NPE requires thirty features to attain a maximum performance,which is computationally expensive compared to other methods.
f Gabor wavelet and Locality Sensitive Discriminant Anal-tized mammogram images, Appl. Soft Comput. J. (2016),
In addition, obtained sensitivity of different methods is good, butspecificity is very poor which is clinically not acceptable. LSDA out-performed all other dimensionality reduction techniques and usesonly eight features to get the highest performance.
353
354
355
356
Please cite this article in press as: R. U., et al., Application of Gabor wavelet and Locality Sensitive Discriminant Anal-ysis for automated identification of breast cancer using digitized mammogram images, Appl. Soft Comput. J. (2016),http://dx.doi.org/10.1016/j.asoc.2016.04.036
ARTICLE IN PRESSG ModelASOC 3573 1–11
R. U. et al. / Applied Soft Computing xxx (2016) xxx–xxx 7
Fig. 6. Plot of performances versus the number of features for k-NN classifier using PCA.
Fig. 7. Plot of performances versus the number of features for Decision Tree (DT) classifier using KPCA.
Fig. 8. Plot of performances versus the number of features for SVM Polynomial Order 3 classifier using NPE.
Downloaded from http://iranpaper.irhttp://tarjomano.com

ARTICLE IN PRESSG ModelASOC 3573 1–11
8 R. U. et al. / Applied Soft Computing xxx (2016) xxx–xxx
mber
5
tduc
haMattmlrvicrPcmsCcuhBogacbbpFilup
Q7
357
358
359
360
361
362
363
364
365
366
367
368
369
370
371
372
373
374
375
376
377
378
379
380
381
382
383
384
385
386
387
388
389
390
391
392
393
394
395
396
397
398
399
400
401
402
403
404
405
406
407
408
409
410
411
412
413
414
415
416
417
418
419
420
421
422
423
424
425
426
427
428
429
430
431
432
433
434
435
436
Downloaded from http://iranpaper.irhttp://tarjomano.com
Fig. 9. Plot of performances versus the nu
. Discussion
This section presents the summary of recently developed CADools for breast cancer diagnosis using mammogram images. Theeveloped method has achieved an average accuracy of 98.69%sing only eight significant features. Hence, the proposed methodan efficiently separate three classes of mammograms.
Acharya et al. [73] have developed a CAD system using area,omogeneity, and microcalcification parameters. These featuresre fed to back propagation neural network and Gaussian Mixerodel (GMM) for the classification of three classes. Their method
chieved an accuracy of 94.44%, sensitivity and specificity of morehan 90%. Vadivel and Surendiran [28] have developed a sys-em to describe masses by shape and margine properties. Their
ethod can classify masses into four categories (round, oval, lobu-ar and irregular) using 17 shapes and margine features. They haveeported an accuracy of 87.76%. A one class classification (normalersus abnormal) based mammographic image analysis is proposedn Ref. [74]. Their method used trace transform functional and GMMlassifier. They have achieved a highest accuracy of 92.48%. In aecent study [75], a laws texture energy measures are used witharticle Swarm Optimized Wavelet Neural Network (PSOWNN) tolassify in to two classes (normal and malignant). The developedethod achieved an accuracy of 93.67%, specificity of 92.10% and
ensitivity of 94.16%. A new method is developed using Gray Levelo-occurrence Matrix (GLCM) in Ref. [41]. They found that, micro-alcification and normal cases have achieved an accuracy of 100%sing Multilayer Preceptor (MLP); benign and malignant classesave achieved maximum accuracy of 71% using MLP classifier.eura et al. [76] have also used GLCM on all detailed coefficientsf 2D DWT. The features ranked using t-test are fed to Back Propa-ation Neural Network (BPNN) classifier. They have achieved anccuracy of 98.8% for the classification of normal and abnormalases, 97.4% for benign and malignant classes. Li et al. [77] usedackground intensity independent texture method for classifyingreast cancer risk. They observed that the region just behind nip-le is the best local region for estimating the risk. Miranda andelipe [78] have developed a fuzzy inference system for categoriz-ng Breast Imaging-Reporting and Data System (BI-RADS) of breast
Please cite this article in press as: R. U., et al., Application oysis for automated identification of breast cancer using digihttp://dx.doi.org/10.1016/j.asoc.2016.04.036
esions. Their method has achieved an accuracy of 76.67% for nod-les and 83.34% for calcification. Recently, Jen and Yu [3] haveroposed intensity and gradient based method with Abnormal-
of features for k-NN classifier using LSDA.
ity detection classifier (ADC) for the classification of normal andabnormal mammograms. Feature weights are determined usingPrincipal Component Analysis (PCA) and have obtained a sensitiv-ity of 86%. Recently, Al-Najdawi et al. [42] developed a thresholding
based segmentation method. Their method achieved an accuracy of90.7% using several image enhancement algorithms. An alternateapproach uses taxonomic diversity index and taxonomic distancesto describe the texture regions of interest. The method has achievedan accuracy of 98.88% using SVM classifier [79].
The above study shows that researchers have developed eitherCAD tools for the classification of normal, benign and malignantmammograms. Moreover, majority of the work considered twoclass classifications with limited sample size. Hence, there is a needto develop three class automated system for breast cancer diagno-sis with huge database. Therefore, in this work we have developeda segmentation independent automated system for breast can-cer analysis using Gabor wavelet. The extracted Gabor waveletfeatures from raw mammogram images show significant informa-tion regarding condition of breast. These features also representthe local characteristics of the breast. In addition, Gabor waveletefficiently captures the small variation in gray level within a neigh-borhood. In real-life situation, benign and malignant features mayoverlap. So there is a need to discriminate these features into benignand malignant classes. Hence, we have used LSDA based dimension-ality reduction technique which resulted in discriminative reducedfeatures. LSDA based feature representation has many advantagecompared to other projections such as LDA [60]. Moreover, with-out having prior information on data distribution, intra class margincan better characterize the separability of different classes thanLDA. In order to select significant features from the reduced dimen-sion, features are fed to F-value ranking method. These rankedfeatures are fed to a set of classifiers to test their performance. Theobtained performance of different classifiers is listed in Table 1.It can be observed that, with a set of 690 mammogram images,developed system has achieved an accuracy of 98.69%, sensitivityof 99.34% and specificity of 98.26% for k-NN classifier. It can benoticed that k-NN has achieved the highest and consistent accu-racy. Our method is superior as compared to the existing methodsand has the ability to classify significant number of images (690
f Gabor wavelet and Locality Sensitive Discriminant Anal-tized mammogram images, Appl. Soft Comput. J. (2016),
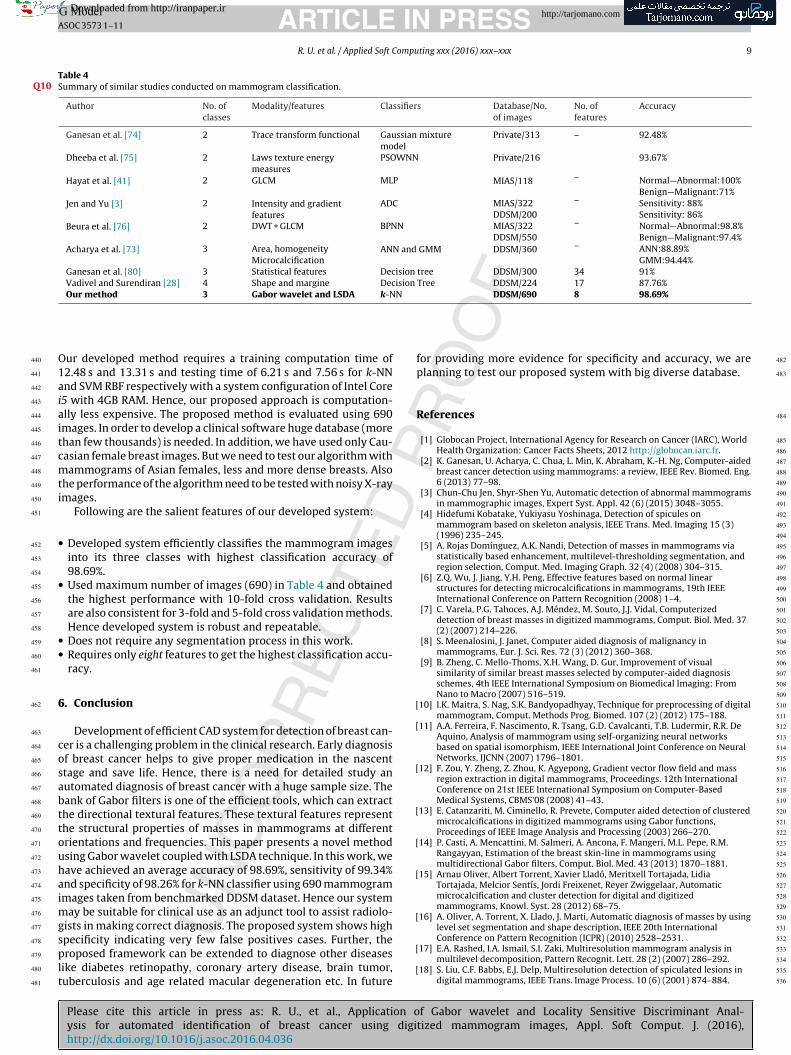
images) with a highest clinically acceptable accuracy. Table 4 sum-marizes performance of state-of-the-art techniques used for theautomated breast cancer classification using mammogram images.
437
438
439
ARTICLE IN PRESSG ModelASOC 3573 1–11
R. U. et al. / Applied Soft Computing xxx (2016) xxx–xxx 9
Table 4Summary of similar studies conducted on mammogram classification.Q10
Author No. ofclasses
Modality/features Classifiers Database/No.of images
No. offeatures
Accuracy
Ganesan et al. [74] 2 Trace transform functional Gaussian mixturemodel
Private/313 – 92.48%
Dheeba et al. [75] 2 Laws texture energymeasures
PSOWNN Private/216 93.67%
Hayat et al. [41] 2 GLCM MLP MIAS/118 – Normal—Abnormal:100%Benign—Malignant:71%
Jen and Yu [3] 2 Intensity and gradientfeatures
ADC MIAS/322 – Sensitivity: 88%DDSM/200 Sensitivity: 86%
Beura et al. [76] 2 DWT + GLCM BPNN MIAS/322 – Normal—Abnormal:98.8%DDSM/550 Benign—Malignant:97.4%
Acharya et al. [73] 3 Area, homogeneity ANN and GMM DDSM/360 – ANN:88.89%Microcalcification GMM:94.44%
Ganesan et al. [80] 3 Statistical features Decision tree DDSM/300 34 91%Vadivel and Surendiran [28] 4 Shape and margine Decision Tree DDSM/224 17 87.76%Our method 3 Gabor wavelet and LSDA k-NN DDSM/690 8 98.69%
O1aiaitcmti
•
•
••
6
cosabttouhaimgsplt
[
[
[
[
[
[
[
440
441
442
443
444
445
446
447
448
449
450
451
452
453
454
455
456
457
458
459
460
461
462
463
464
465
466
467
468
469
470
471
472
473
474
475
476
477
478
479
480
481
482
483
484
485
486
487
488
489
490
491
492
493
494
495
496
497
498
499
500
501
502
503
504
505
506
507
508
509
510
511
512
513
514
515
516
517
518
519
520
521
522
523
524
525
526
527
528
529
530
531
Downloaded from http://iranpaper.irhttp://tarjomano.com
ur developed method requires a training computation time of2.48 s and 13.31 s and testing time of 6.21 s and 7.56 s for k-NNnd SVM RBF respectively with a system configuration of Intel Core5 with 4GB RAM. Hence, our proposed approach is computation-lly less expensive. The proposed method is evaluated using 690mages. In order to develop a clinical software huge database (morehan few thousands) is needed. In addition, we have used only Cau-asian female breast images. But we need to test our algorithm withammograms of Asian females, less and more dense breasts. Also
he performance of the algorithm need to be tested with noisy X-raymages.
Following are the salient features of our developed system:
Developed system efficiently classifies the mammogram imagesinto its three classes with highest classification accuracy of98.69%.Used maximum number of images (690) in Table 4 and obtainedthe highest performance with 10-fold cross validation. Resultsare also consistent for 3-fold and 5-fold cross validation methods.Hence developed system is robust and repeatable.Does not require any segmentation process in this work.Requires only eight features to get the highest classification accu-racy.
. Conclusion
Development of efficient CAD system for detection of breast can-er is a challenging problem in the clinical research. Early diagnosisf breast cancer helps to give proper medication in the nascenttage and save life. Hence, there is a need for detailed study anutomated diagnosis of breast cancer with a huge sample size. Theank of Gabor filters is one of the efficient tools, which can extracthe directional textural features. These textural features representhe structural properties of masses in mammograms at differentrientations and frequencies. This paper presents a novel methodsing Gabor wavelet coupled with LSDA technique. In this work, weave achieved an average accuracy of 98.69%, sensitivity of 99.34%nd specificity of 98.26% for k-NN classifier using 690 mammogrammages taken from benchmarked DDSM dataset. Hence our system
ay be suitable for clinical use as an adjunct tool to assist radiolo-ists in making correct diagnosis. The proposed system shows high
Please cite this article in press as: R. U., et al., Application oysis for automated identification of breast cancer using digihttp://dx.doi.org/10.1016/j.asoc.2016.04.036
pecificity indicating very few false positives cases. Further, theroposed framework can be extended to diagnose other diseases
ike diabetes retinopathy, coronary artery disease, brain tumor,uberculosis and age related macular degeneration etc. In future
[
[
for providing more evidence for specificity and accuracy, we areplanning to test our proposed system with big diverse database.
References
[1] Globocan Project, International Agency for Research on Cancer (IARC), WorldHealth Organization: Cancer Facts Sheets, 2012 http://globocan.iarc.fr.
[2] K. Ganesan, U. Acharya, C. Chua, L. Min, K. Abraham, K.-H. Ng, Computer-aidedbreast cancer detection using mammograms: a review, IEEE Rev. Biomed. Eng.6 (2013) 77–98.
[3] Chun-Chu Jen, Shyr-Shen Yu, Automatic detection of abnormal mammogramsin mammographic images, Expert Syst. Appl. 42 (6) (2015) 3048–3055.
[4] Hidefumi Kobatake, Yukiyasu Yoshinaga, Detection of spicules onmammogram based on skeleton analysis, IEEE Trans. Med. Imaging 15 (3)(1996) 235–245.
[5] A. Rojas Domínguez, A.K. Nandi, Detection of masses in mammograms viastatistically based enhancement, multilevel-thresholding segmentation, andregion selection, Comput. Med. Imaging Graph. 32 (4) (2008) 304–315.
[6] Z.Q. Wu, J. Jiang, Y.H. Peng, Effective features based on normal linearstructures for detecting microcalcifications in mammograms, 19th IEEEInternational Conference on Pattern Recognition (2008) 1–4.
[7] C. Varela, P.G. Tahoces, A.J. Méndez, M. Souto, J.J. Vidal, Computerizeddetection of breast masses in digitized mammograms, Comput. Biol. Med. 37(2) (2007) 214–226.
[8] S. Meenalosini, J. Janet, Computer aided diagnosis of malignancy inmammograms, Eur. J. Sci. Res. 72 (3) (2012) 360–368.
[9] B. Zheng, C. Mello-Thoms, X.H. Wang, D. Gur, Improvement of visualsimilarity of similar breast masses selected by computer-aided diagnosisschemes, 4th IEEE International Symposium on Biomedical Imaging: FromNano to Macro (2007) 516–519.
10] I.K. Maitra, S. Nag, S.K. Bandyopadhyay, Technique for preprocessing of digitalmammogram, Comput. Methods Prog. Biomed. 107 (2) (2012) 175–188.
11] A.A. Ferreira, F. Nascimento, R. Tsang, G.D. Cavalcanti, T.B. Ludermir, R.R. DeAquino, Analysis of mammogram using self-organizing neural networksbased on spatial isomorphism, IEEE International Joint Conference on NeuralNetworks, IJCNN (2007) 1796–1801.
12] F. Zou, Y. Zheng, Z. Zhou, K. Agyepong, Gradient vector flow field and massregion extraction in digital mammograms, Proceedings. 12th InternationalConference on 21st IEEE International Symposium on Computer-BasedMedical Systems, CBMS’08 (2008) 41–43.
13] E. Catanzariti, M. Ciminello, R. Prevete, Computer aided detection of clusteredmicrocalcifications in digitized mammograms using Gabor functions,Proceedings of IEEE Image Analysis and Processing (2003) 266–270.
14] P. Casti, A. Mencattini, M. Salmeri, A. Ancona, F. Mangeri, M.L. Pepe, R.M.Rangayyan, Estimation of the breast skin-line in mammograms usingmultidirectional Gabor filters, Comput. Biol. Med. 43 (2013) 1870–1881.
15] Arnau Oliver, Albert Torrent, Xavier Lladó, Meritxell Tortajada, LidiaTortajada, Melcior Sentís, Jordi Freixenet, Reyer Zwiggelaar, Automaticmicrocalcification and cluster detection for digital and digitizedmammograms, Knowl. Syst. 28 (2012) 68–75.
16] A. Oliver, A. Torrent, X. Llado, J. Marti, Automatic diagnosis of masses by usinglevel set segmentation and shape description, IEEE 20th International
f Gabor wavelet and Locality Sensitive Discriminant Anal-tized mammogram images, Appl. Soft Comput. J. (2016),
Conference on Pattern Recognition (ICPR) (2010) 2528–2531.17] E.A. Rashed, I.A. Ismail, S.I. Zaki, Multiresolution mammogram analysis in
multilevel decomposition, Pattern Recognit. Lett. 28 (2) (2007) 286–292.18] S. Liu, C.F. Babbs, E.J. Delp, Multiresolution detection of spiculated lesions in
digital mammograms, IEEE Trans. Image Process. 10 (6) (2001) 874–884.
532
533
534
535
536
ING ModelA
1 ompu
[
[
[
[
[
[
[
[
[
[
[
[
[
[
[
[
[
[
[
[
[
[
[
[
[
[
[
[Q8
[
[
[
[
[
[
[
[
[
[
[
[
[
[
[
[
[
[
[
[
[
[
[
[
[
[
[
[
[
[
537
538
539
540
541
542
543
544
545
546
547
548
549
550
551
552
553
554
555
556
557
558
559
560
561
562
563
564
565
566
567
568
569
570
571
572
573
574
575
576
577
578
579
580
581
582
583
584
585
586
587
588
589
590
591
592
593
594
595
596
597
598
599
600
601
602
603
604
605
606
607
608
609
610
611
612
613
614
615
616
617
618
619
620
621
622
623
624
625
626
627
628
629
630
631
632
633
634
635
636
637
638
639
640
641
642
643
644
645
646
647
648
649
650
651
652
653
654
655
656
657
658
659
660
661
662
663
664
665
666
667
668
669
670
671
672
673
674
675
676
677
678
679
680
681
682
683
684
685
686
687
688
689
690
691
692
693
694
695
696
697
698
699
700
701
702
Downloaded from http://iranpaper.irhttp://tarjomano.com
ARTICLESOC 3573 1–110 R. U. et al. / Applied Soft C
19] C.B.R. Ferreira, D.L. Borges, Analysis of mammogram classification using awavelet transform decomposition, Pattern Recognit. Lett. 24 (7) (2003)973–982.
20] R. Mousa, Q. Munib, A. Moussa, Breast cancer diagnosis system based onwavelet analysis and fuzzy-neural, Expert Syst. Appl. 28 (4) (2005) 713–723.
21] A. Mencattini, M. Salmeri, R. Lojacono, M. Frigerio, F. Caselli, Mammographicimages enhancement and denoising for breast cancer detection using dyadicwavelet processing, IEEE Trans. Instrum. Meas. 57 (7) (2008) 1422–1430.
22] J.L. Jasmine, A. Govardhan, S. Baskaran, Microcalcification detection in digitalmammograms based on wavelet analysis and neural networks, IEEEInternational Conference on Control, Automation, Communication and EnergyConservation, INCACEC (2009) 1–6.
23] V. Alarcon-Aquino, O. Starostenko, J. Ramirez-Cortes, R. Rosas-Romero, J.Rodriguez-Asomoza, O.J. Paz-Luna, K. Vazquez-Munoz, Detection ofmicrocalcifications in digital mammograms using the dual-tree complexwavelet transform, Eng. Intell. Syst. 17 (1) (2009) 49.
24] Danilo Cesar Pereira, Rodrigo Pereira Ramos, Marcelo Zanchetta DoNascimento, Segmentation and detection of breast cancer in mammogramscombining wavelet analysis and genetic algorithm, Comput. Methods Prog.Biomed. 114 (1) (2014) 88–101.
25] Giuseppe Boccignone, Angelo Chianese, Antonio Picariellob, Computer aideddetection of micro-calcifications in digital mammograms, Comput. Biol. Med.30 (2000) 267–286.
26] Nikhil R. Pal, Brojeshwar Bhowmick, Sanjaya K. Patel, Srimanta Pal, J. Das, Amulti-stage neural network aided system for detection of microcalcificationsin digitized mammograms, Neurocomputing 71 (13–15) (2008) 2625–2634.
27] W.A. Mohamed, M.A. Alolfe, Y.M. Kadah, Microcalcifications enhancement indigital mammograms using fractal modeling, IEEE Biomedical EngineeringConference, CIBEC, Cairo International (2008) 1–5.
28] A. Vadivel, B. Surendiran, A fuzzy rule-based approach for characterization ofmammogram masses into BI-RADS shape categories, Comput. Biol. Med. 43(4) (2013) 259–267.
29] F. Moayedi, Z. Azimifar, R. Boostani, S. Katebi, Contourlet-basedmammography mass classification using the SVM family, Comput. Biol. Med.40 (4) (2010) 373–383.
30] Jinchang Ren, ANN vs. SVM: which one performs better in classification ofMCCs in mammogram imaging, Knowl. Syst. 26 (2012) 144–153.
31] Daniel Rodrigues Ericeira, Marcelo Gattass, Aristófanes Corrêa Silva, AnselmoCardoso de Paiva, Detection of masses based on asymmetric regions of digitalbilateral mammograms using spatial description with variogram andcross-variogram functions, Comput. Biol. Med. 43 (2013) 987–999.
32] Defeng Wang, Lin Shi, Pheng Ann Heng, Automatic detection of breast cancersin mammograms using structured support vector machines, Neurocomputing72 (13–15) (2009) 3296–3302.
33] Xiaoming Liu, Zhigang Zeng, A new automatic mass detection method forbreast cancer with false positive reduction, Neurocomputing 152 (2015)388–402.
34] Christine Tanner, Guido van Schie, Jan M. Lesniak, Nico Karssemeijer, GáborSzekely, Improved location features for linkage of regions across ipsilateralmammograms, Med. Image Anal. 17 (2013) 1265–1272.
35] D. Wei, H.-P. Chan, N. Petrick, B. Sahiner, M.A. Helvie, D.D. Adler, M.M.Goodsitt, False-positive reduction technique for detection of masses on digitalmammograms: global and local multiresolution texture analysis, Med. Phys.24 (6) (1997) 903–914.
36] A.S. Kurani, D.-H. Xu, J. Furst, D.S. Raicu, Co-occurrence matrices forvolumetric data, in: 7th IASTED International Conference on ComputerGraphics and Imaging, Kauai, USA, 2004, pp. 447–452.
37] R.M. Haralick, K. Shanmugam, I.H. Dinstein, Textural features for imageclassification, IEEE Trans. Syst. Man Cybern. 6 (1973) 610–621.
38] F. Albregtsen, et al., Statistical Texture Measures Computed from Gray LevelCo-occurrence Matrices, vol. 20, Image Processing Laboratory, Department ofInformatics, University of Oslo, 1995, pp. 1–14.
39] H.-P. Chan, B. Sahiner, K.L. Lam, N. Petrick, M.A. Helvie, M.M. Goodsitt, D.D.Adler, Computerized analysis of mammographic microcalcifications inmorphological and texture feature spaces, Med. Phys. 25 (1998) 2007–2019.
40] J. Jona, N. Nagaveni, A hybrid swarm optimization approach for feature setreduction in digital mammograms, WSEAS Trans. Inf. Sci. Appl. 9 (2012)340–349.
41] Mohamed Hayat, Mai S. Mabrouk, Amr Sharawy, Computer aided detectionsystem for micro-calcifications in digital mammograms, Comput. MethodsProg. Biomed. 116 (3) (2014) 226–235.
42] Nijad Al-Najdawi, Mariam Biltawi, Sara Tedmori, Mammogram image visualenhancement, mass segmentation and classification, Appl. Soft Comput. 35(2015) 175–185.
43] Jinsung Oh, Heesoo Hwang, Feature enhancement of medical images usingmorphology-based homomorphic filter and differential evolution algorithm,Int. J. Control Autom. Syst. 8 (4) (2010) 857–861.
44] Salabat Khan, Muhammad Hussain, Hatim Aboalsamh, George Bebis, Acomparison of different Gabor feature extraction approaches for massclassification in mammography, Multimed. Tools Appl. (2015) 1–25, http://dx.doi.org/10.1007/s11042-015-3017-3.
Please cite this article in press as: R. U., et al., Application oysis for automated identification of breast cancer using digihttp://dx.doi.org/10.1016/j.asoc.2016.04.036
45] Anjan Gudigar, Shreesha Chokkadi, U. Raghavendra, U. Rajendra Acharya,Multiple thresholding and subspace based approach for detection andrecognition of traffic sign, Multimed. Tools Appl. (2016) 1–19, http://dx.doi.org/10.1007/s11042-016-3321-6.
[
PRESSting xxx (2016) xxx–xxx
46] M. Heath, K. Bowyer, D. Kopans, R. Moore, W.P. Kegelmeyer, The digitaldatabase for screening mammography, in: M.J. Yaffe (Ed.), Proceedings of the
5th International Workshop on Digital Mammography, Medical PhysicsPublishing, 2011, pp. 212–218.
47] University of South Florida Digital Mammography Home Page, DDSM: DigitalDatabase for Screening Mammography. http://marathon.csee.usf.edu/Mammography/Database.html (last accessed in June 2015).
48] R. Keys, Cubic convolution interpolation for digital image processing, IEEETrans. Acoust. Speech Signal Process. 29 (6) (1981) 1153–1160.
49] M. Sundaram, K. Ramar, N. Arumugam, G. Prabin, Histogram modified localcontrast enhancement for mammogram images, Appl. Soft Comput. 11 (8)(2011) 5809–5816.
50] Robert M. Haralick, Linda G. Shapiro, Computer and Robot Vision, vol. 1,Addison-Wesley, 1992.
51] Hamid Hassanpour, Najmeh Samadiani, S.M. Mahdi Salehi, Usingmorphological transforms to enhance the contrast of medical images, Egypt. J.Radiol. Nucl. Med. 46 (2) (2015) 481–489.
52] J.G. Daugman, Uncertainty relation for resolution in space, spatial frequency,and orientation optimized by two-dimensional visual cortical filters, J. Opt.Soc. Am. A (1985) 1160–1169.
53] M. Lades, J.C. Vorbruggen, J. Buhmann, J. Lange, C. von der Malsburg, R.P.Wurtz, W. Konen, Distortion invariant object recognition in the dynamic linkarchitecture, IEEE Trans. Comput. 42 (1993) 300–311.
54] B. Schiele, J.L. Crowley, Recognition without correspondence usingmultidimensional receptive field histograms, Int. J. Comput. Vis. 36 (1) (2000)31–52.
55] X. Llado, A. Oliver, J. Freixenet, R. Marti, J. Marti, A textural approach for massfalse positive reduction in mammography, Comput. Med. Imaging Graph. 33(6) (2009) 415–422.
56] R.O. Duda, P.E. Hart, D.G. Stork, Pattern Classification, 2nd edition,Wiley-Interscience, Hoboken, NJ, 2000.
57] B. SchoÈlkopf, A. Smola, K.R. Muller, Nonlinear component analysis as aKernel eigenvalue problem, Neural Comput. 10 (5) (1998) 1299–1319.
58] Sam Roweis, Lawrence K. Saul, Nonlinear dimensionality reduction by locallylinear embedding, Science 290 (2000).
59] X. He, Deng Cai, S. Yan, H.J. Zhang, Neighborhood preserving embedding, Proc.of the 10th IEEE International Conference on Computer Vision (2005)1208–1213.
60] Deng Cai, Xiaofei He, Kun Zhou, Jiawei Han, Hujun Bao, Locality sensitivediscriminant analysis, Proceedings of the 20th International Joint Conferenceon Artificial Intelligence IJCAI’07 (2007) 708–713.
61] Brijesh Verma, Ping Zhang, A novel neural-genetic algorithm to find the mostsignificant combination of features in digital mammograms, Appl. SoftComput. 7 (2) (2007) 612–625.
62] A. Gelman, Analysis of variance: why it is more important than ever, Ann.Stat. 33 (2005) 1–53.
63] D.T. Larose, Discovering Knowledge in Data: An Introduction to Data Mining,Wiley Interscience, New Jersey, USA, 2004.
64] A.E.G. Rodríguez, J.F.M. Trinidad, M.G. Borroto, J.A.C. Ochoa, Mining patternsfor clustering on numerical datasets using unsupervised decision trees,Knowl. Syst. 82 (2015) 70–79.
65] Z.H. Huang, W.J. Li, J. Wang, T. Zhang, Face recognition based on pixel-leveland feature-level fusion of the top-level’s wavelet sub-bands, Inf. Fusion 22(2015) 95–104.
66] A. Khan, H. Farooq, Principal component analysis-linear discriminant analysisfeature extractor for pattern recognition, IJCSI Int. J. Comput. Sci. Issues 8 (6)(2011) 267–270.
67] Scikit Learn, LDA and QDA, Information available at: http://scikit-learn.org/stable/modules/lda qda.html (last accessed in June 2015).
68] M. Sugeno, Industrial Applications of Fuzzy Control, Elsevier Science Pub. Co.,1985.
69] W.C. Lin, S.W. Ke, C.F. Tsai, CANN: an intrusion detection system based oncombining cluster centers and nearest neighbours, Knowl. Syst. 78 (2015)13–21.
70] J. Han, M. Kamber, J. Pei, Data Mining: Concepts and Techniques, MorganKaufmann, 2005.
71] C.H. Chuang, S.S. Huang, L.W. Ko, C.T. Lin, An EEG-based perceptual functionintegration network for application to drowsy driving, Knowl. Syst. 80 (2015)143–152.
72] S. Dua, U.R. Acharya, P. Dua (Eds.), Machine Learning in HealthcareInformatics, scr. Intelligent Systems Reference Library, vol. 56, Springer, 2014.
73] U.R. Acharya, E.Y.K. Ng, Y. Hong, Y. Jie, G.J.L. Kaw, Computer-basedidentification of breast cancer using digitized mammograms, J. Med. Syst. 32(2008) 499–507.
74] K. Ganesan, U.R. Acharya, C.K. Chua, C.M. Lim, K.T. Abraham, One-classclassification of mammograms using trace transform functions, IEEE Trans.Instrum. Meas. 63 (2) (2014) 304–311.
75] J. Dheeba, N. Albert Singh, S. Tamil Selvi, Computer-aided detection of breastcancer on mammograms: a swarm intelligence optimized wavelet neuralnetwork approach, J. Biomed. Inform. 49 (2014) 45–52.
76] S. Beura, B. Majhi, R. Dash, Mammogram classification using two dimensional
f Gabor wavelet and Locality Sensitive Discriminant Anal-tized mammogram images, Appl. Soft Comput. J. (2016),
discrete wavelet transform and gray-level co-occurrence matrix for detectionof breast cancer, Neurocomputing 154 (2015) 1–12.
77] X.-Z. Li, S. Williams, M.J. Bottema, Texture and region dependent breastcancer risk assessment from screening mammograms, Pattern Recognit. Lett.36 (15) (2014) 117–124.
703
704
705
706
707

ING ModelA
ompu
[
[
[
H: J. Eng. Med. 227 (7) (2013) 721–732.
708
709
710
711
712
713
714
715
716
717
Downloaded from http://iranpaper.irhttp://tarjomano.com
ARTICLESOC 3573 1–11R. U. et al. / Applied Soft C
78] G.H.B. Miranda, J.C. Felipe, Computer-aided diagnosis system based on fuzzylogic for breast cancer categorization, Comput. Biol. Med. (2014), http://dx.doi.org/10.1016/j.compbiomed.2014.10.006.
Please cite this article in press as: R. U., et al., Application oysis for automated identification of breast cancer using digihttp://dx.doi.org/10.1016/j.asoc.2016.04.036
79] Fernando Soares Servulo de Oliveira, Antonio Oseas de Carvalho Filho,Aristófanes Correa Silva, Anselmo Cardoso de Paiva, Marcelo Gattass,Classification of breast regions as mass and non-mass based on digitalmammograms using taxonomic indexes and SVM, Comput. Biol. Med. 57(2015) 42–53.
[
[
PRESSting xxx (2016) xxx–xxx 11
80] K. Ganesan, R. Acharya, K.C. Chua, L.C. Min, K.T. Abraham, Decision supportsystem for breast cancer detection using mammograms, Proc. Inst. Mech. Eng.
f Gabor wavelet and Locality Sensitive Discriminant Anal-tized mammogram images, Appl. Soft Comput. J. (2016),
81] R. Adams, Radial decomposition of discs and spheres, Comput. Vis. Graph.Image Process.: Graph. Models Image Process. 55 (5) (1993) 325–332.
82] R. Jones, P. Soille, Periodic lines: definition, cascades, and application togranulometries, Pattern Recognit. Lett. 17 (1996) 1057–1063.
718
719
720
721