g. kaupp, m. r. naimi-jamal powerpoint presentation of the nanomech 5, hückelhoven, germany...
TRANSCRIPT

G. Kaupp, M. R. Naimi-Jamal
Powerpoint Presentation of the
Nanomech 5, Hückelhoven, Germany
September 5-7, 2004

Nanoindentations
Why do we need the new quantitative treatment?
G. Kaupp, M. R. Naimi-Jamal, Nanomech 5, 7.-9. September 2004

Iterative analysis of the Berkovich multiple unloads/reloads according to ISO 14577. fused quartz SrTiO3
unload # 1 2 3 4 1 2 3 4 Er (Gpa) 67,1 66,0 65,9 66,5 254,5 263,0 251,4 242,0 H (Gpa) 7,99 7,83 7,81 7,47 10,36 9,99 10,02 9,37 S (N/µm) 84,4 83,8 83,8 86,5 281,4 296,0 282,7 281,3 A (µm2) 1.242 1.267 1.270 1.329 0.9595 0.9945 0.922 1.061 B (constant) * 13,190 18,696 18,339 18,677 0,794 1,060 5,861 10,114 hf (nm) 127,97 136,55 136,47 142,66 119,14 126,03 135,76 145,59 m (exponent) * 1,314 1,255 1,258 1,261 2,173 2,140 1,794 1,686
*The exponent m and the constant B are iterated for the 20 to 95% FN range
Multiple unloadings/reloadings
G. Kaupp, M. R. Naimi-Jamal, Nanomech 5, 7.-9. September 2004

Nanoindentation to glassy polymers
G. Kaupp, M. R. Naimi-Jamal, Nanomech 5, 7.-9. September 2004

y = 97,419x-0,2487
0
5
10
15
20
25
30
0 1000 2000 3000 4000 5000
FN (µN)
Er
(GP
a)
Polycarbonate (PC): dependence of Er on the load
Strong exponential dependence
Er values according to the standard procedure!
G. Kaupp, M. R. Naimi-Jamal, Nanomech 5, 7.-9. September 2004

hf
hmaxhchs
FN
surface profile after load removal
initial surface
surface profile under load
indenter
Common assumptions about the indentation geometry
This is certainly not valid for most materials, except the standards
G. Kaupp, M. R. Naimi-Jamal, Nanomech 5, 7.-9. September 2004

Some different cube corner indents
G. Kaupp, M. R. Naimi-Jamal, Nanomech 5, 7.-9. September 2004

(We will also clarify what happened under the surface)
Isotropic and far-reaching anisotropic indentation response
SrTiO3 (100)
SrTiO3 (110) SrTiO3 (111)
(rotation of the crystals)
G. Kaupp, M. R. Naimi-Jamal, Nanomech 5, 7.-9. September 2004

The common standard formulas
G. Kaupp, M. R. Naimi-Jamal, Nanomech 5, 7.-9. September 2004
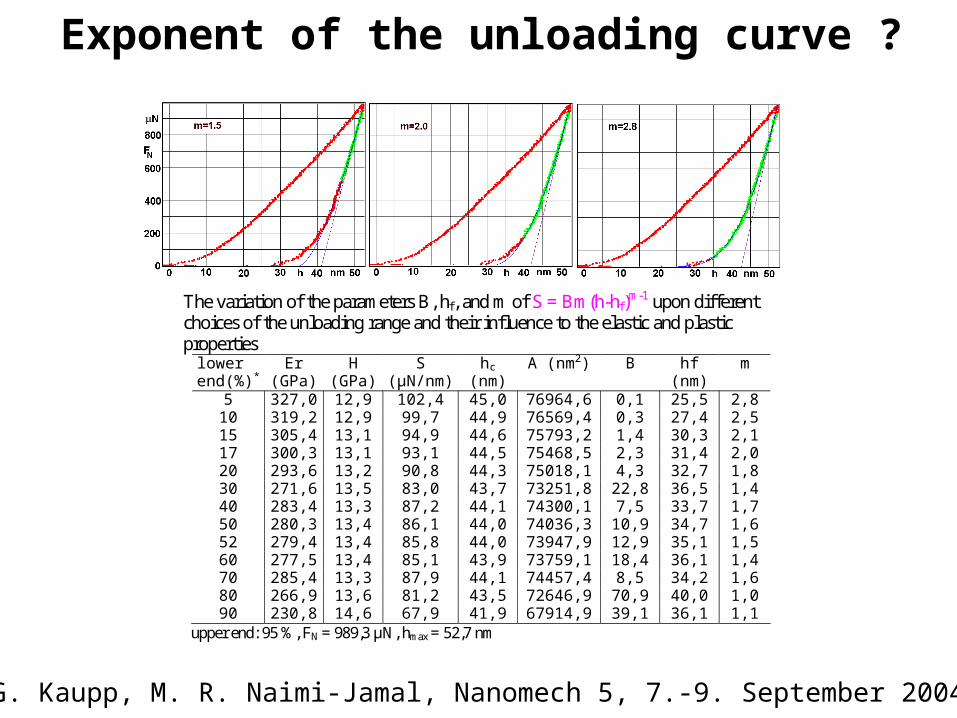
The variation of the parameters B, hf, and m of S = Bm(h-hf)m-1 upon different
choices of the unloading range and their influence to the elastic and plastic properties
lower end(%)*
Er (GPa)
H (GPa)
S (µN/nm)
hc (nm)
A (nm2) B hf (nm)
m
5 327,0 12,9 102,4 45,0 76964,6 0,1 25,5 2,8 10 319,2 12,9 99,7 44,9 76569,4 0,3 27,4 2,5 15 305,4 13,1 94,9 44,6 75793,2 1,4 30,3 2,1 17 300,3 13,1 93,1 44,5 75468,5 2,3 31,4 2,0 20 293,6 13,2 90,8 44,3 75018,1 4,3 32,7 1,8 30 271,6 13,5 83,0 43,7 73251,8 22,8 36,5 1,4 40 283,4 13,3 87,2 44,1 74300,1 7,5 33,7 1,7 50 280,3 13,4 86,1 44,0 74036,3 10,9 34,7 1,6 52 279,4 13,4 85,8 44,0 73947,9 12,9 35,1 1,5 60 277,5 13,4 85,1 43,9 73759,1 18,4 36,1 1,4 70 285,4 13,3 87,9 44,1 74457,4 8,5 34,2 1,6 80 266,9 13,6 81,2 43,5 72646,9 70,9 40,0 1,0 90 230,8 14,6 67,9 41,9 67914,9 39,1 36,1 1,1
upper end: 95 %, FN = 989,3 µN, hmax = 52,7 nm
Exponent of the unloading curve ?
G. Kaupp, M. R. Naimi-Jamal, Nanomech 5, 7.-9. September 2004

S2 FN -1 = 4 π-1(Er)
2 H-1
(a) cube corner, (a’) defective cube corner, (b) Berkovich, (c) 60° pyramidal indenter tip;95%- 20% of the unloading curves were iterated
An approach without use of projected areaNanoscopic FN – S2 plots for indents on fused silica
Furthermore, errors of stiffness are squared
G. Kaupp, M. R. Naimi-Jamal, Nanomech 5, 7.-9. September 2004

FN = k h3/2 or FN2/3 = k2/3 h; k [µN/nm3/2]is termed indentation coefficient
Quantitative analysis of the loading curveThe relation of lateral force and normal displacement
Fused quartz: a-d: sharp cube corner (trial plots a and c invalid), e: sharp 60° pyramid, f: conosphere (R = 1 µm) Valid for all types of materials in nanoindentations
On the basis of Hertzian theory this exponent would be the arithmetric mean of the flat and the conical punch‘s
G. Kaupp, M. R. Naimi-Jamal, Nanomech 5, 7.-9. September 2004

Further demonstration of the FN = k h3/2 relation
G. Kaupp, M. R. Naimi-Jamal, Nanomech 5, 7.-9. September 2004

Au
Au
Gold exhibits phase transition; square plots are invalid
Linearity up to 10 mN load and 370 nm depth.Faulty square plots or microindentations do not detect thepressure induced phase tranformation
G. Kaupp, M. R. Naimi-Jamal, Nanomech 5, 7.-9. September 2004
0
1000
2000
3000
4000
5000
6000
0 1000 2000 3000
(norm. displ.)1.5 (nm1.5)
no
rmal
fo
rce (
µN
)
Quartz (10-10)
0
500
1000
1500
2000
2500
3000
0 250 500 750 1000(norm. displ.)1.5 (nm1.5)
no
rmal
fo
rce
(µN
)
SrTiO3 (110)
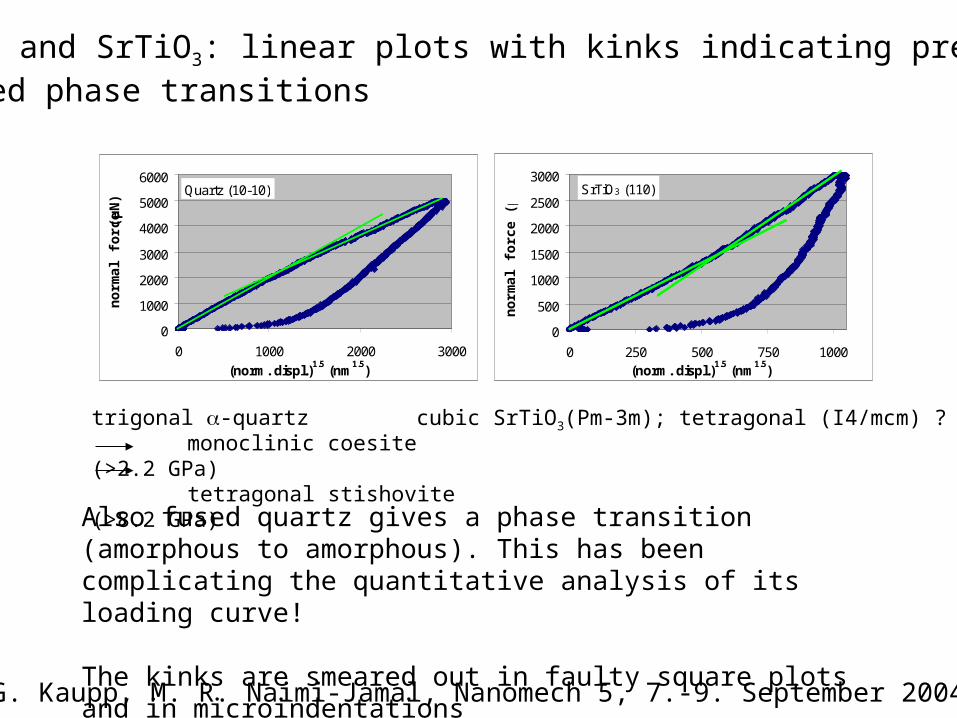
cubic SrTiO3(Pm-3m); tetragonal (I4/mcm) ?trigonal -quartzmonoclinic coesite (>2.2 GPa)tetragonal stishovite (>8.2 GPa)
Also fused quartz gives a phase transition (amorphous to amorphous). This has been complicating the quantitative analysis of its loading curve!
The kinks are smeared out in faulty square plots and in microindentations
-SiO2 and SrTiO3: linear plots with kinks indicating pressure induced phase transitions
G. Kaupp, M. R. Naimi-Jamal, Nanomech 5, 7.-9. September 2004

0
50
100
150
200
250
0 500 1000 1500 2000
(norm. displ.)1.5
(nm)1.5
no
rmal
fo
rce
(µN
)
Ninhydrin
OH
OH
O
O
k1 = 0.169 [µN/nm3/2
Cube corner:
k2 = 0.0805 [µN/nm3/2
]
]
Phase transition with organic crystals
G. Kaupp, M. R. Naimi-Jamal, Nanomech 5, 7.-9. September 2004
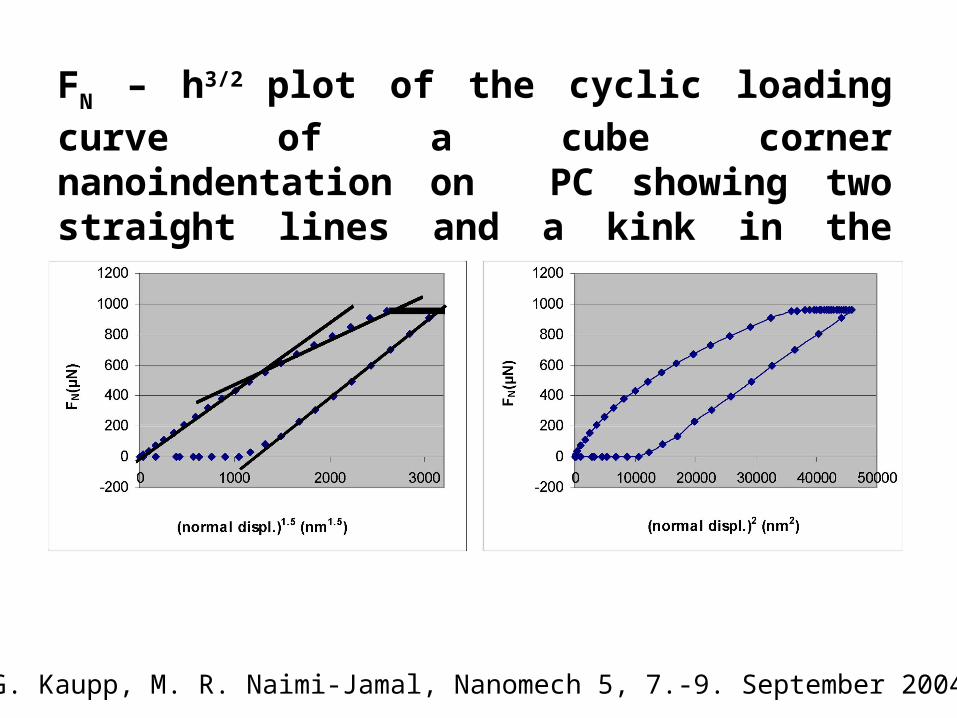
FN – h3/2 plot of the cyclic loading curve of a cube
corner nanoindentation on PC showing two straight lines and a kink in the loading curve that is not seen in the FN – h2 trial plot.
G. Kaupp, M. R. Naimi-Jamal, Nanomech 5, 7.-9. September 2004
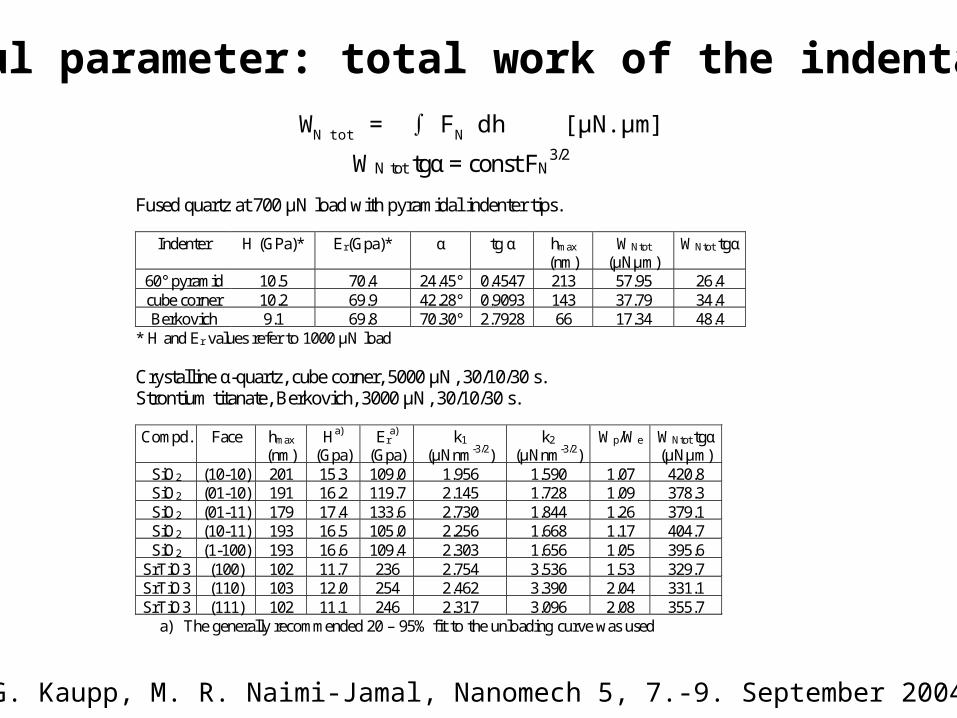
WN tot tgα = const FN3/2
Fused quartz at 700 µN load with pyramidal indenter tips.
Indenter
H (GPa)* Er(Gpa)* α tg α hmax (nm)
WNtot (µNµm)
WNtot tgα
60° pyramid 10.5 70.4 24.45° 0.4547 213 57.95 26.4 cube corner 10.2 69.9 42.28° 0.9093 143 37.79 34.4 Berkovich 9.1 69.8 70.30° 2.7928 66 17.34 48.4
* H and Er values refer to 1000 µN load
Crystalline α-quartz, cube corner, 5000 µN, 30/10/30 s. Strontium titanate, Berkovich, 3000 µN, 30/10/30 s.
Compd. Face hmax
(nm) Ha)
(Gpa) Er
a) (Gpa)
k1 (µNnm-3/2)
k2
(µNnm-3/2) Wp/We WNtot tgα
(µNµm) SiO2 (10-10) 201 15.3 109.0 1.956 1.590 1.07 420.8 SiO2 (01-10) 191 16.2 119.7 2.145 1.728 1.09 378.3 SiO2 (01-11) 179 17.4 133.6 2.730 1.844 1.26 379.1 SiO2 (10-11) 193 16.5 105.0 2.256 1.668 1.17 404.7 SiO2 (1-100) 193 16.6 109.4 2.303 1.656 1.05 395.6
SrTiO3 (100) 102 11.7 236 2.754 3.536 1.53 329.7 SrTiO3 (110) 103 12.0 254 2.462 3.390 2.04 331.1 SrTiO3 (111) 102 11.1 246 2.317 3.096 2.08 355.7
a) The generally recommended 20 – 95% fit to the unloading curve was used
WN tot = ∫ FN dh [µN.µm]
Useful parameter: total work of the indentation
G. Kaupp, M. R. Naimi-Jamal, Nanomech 5, 7.-9. September 2004

Appearances of nanoscratches by AFM
ramp experiment constant normal force
G. Kaupp, M. R. Naimi-Jamal, Nanomech 5, 7.-9. September 2004

Quantitative treatment of nanoscratching
FL = K FN3/2
K [N-1/2] is the new scratch coefficient
What then about the „friction coefficient“ FL/FN? not correct in nanoscratching!
Our quantitative relation is valid for all types of materials(we published on that)
Lateral force proportional to (normal force)3/2
G. Kaupp, M. R. Naimi-Jamal, Nanomech 5, 7.-9. September 2004

y = 0,1926x - 44,289
0
50
100
150
200
250
0 300 600 900 1200 1500
normal force (μN)
late
ral f
orce
(μN)
y = 0,0046x + 0,022
0
50
100
150
200
250
0 10000 20000 30000 40000 50000
normal force1.5 (μN1.5)
late
ral f
orce
(μN)
y = 0,0001x + 21,791
0
50
100
150
200
250
0 500000 1000000 1500000 2000000
normal force2 (μN2)
late
ral f
orce
(μN)
(a) (b) (c)normal force (µN) (normal force)1.5 (µN1.5) (normal force)2 (µN2)
FL = K·FN3/2 (K = scratch coefficient [N-1/2])
Linear plot through the origin only with exponent 1.5 (not 1 or 2)
The relation of lateral force and (fixed) normal force
Fused quartz and cube corner indentation tip, edge in front
G. Kaupp, M. R. Naimi-Jamal, Nanomech 5, 7.-9. September 2004
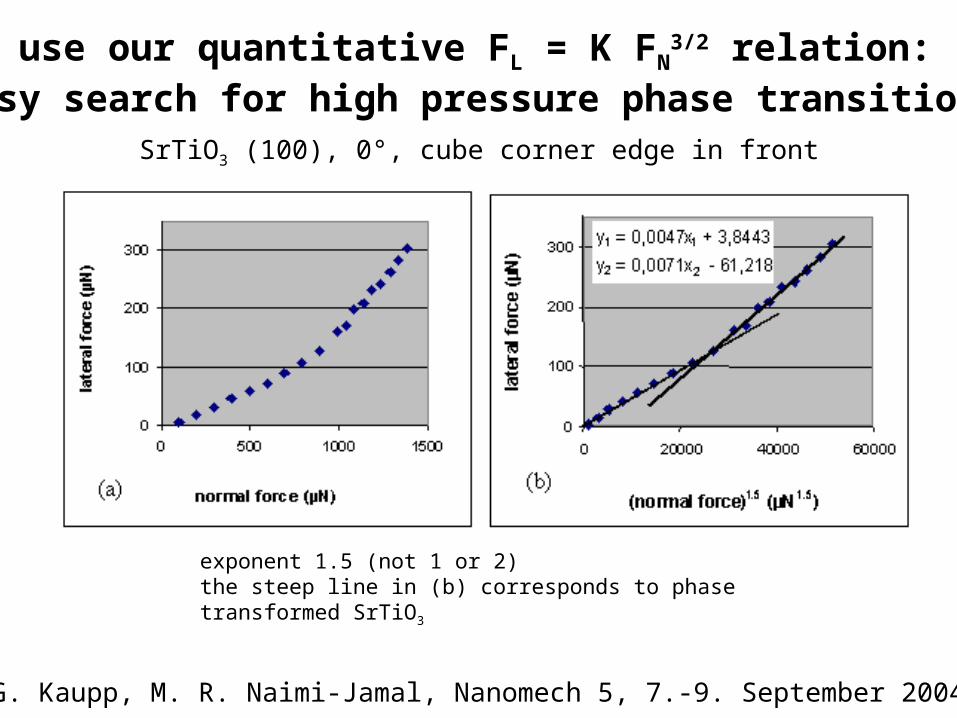
exponent 1.5 (not 1 or 2)the steep line in (b) corresponds to phase transformed SrTiO3
We use our quantitative FL = K FN3/2 relation:
easy search for high pressure phase transitionsSrTiO3 (100), 0°, cube corner edge in front
G. Kaupp, M. R. Naimi-Jamal, Nanomech 5, 7.-9. September 2004

Instead of inapplicable friction coefficient (FL / FN) or residual scratch resistance (which lacks precision of the residual volume measurement) an easily and unambiguously obtained new parameteris defined:
The specific scratch work (the work for 1 µm scratch length following indentation with a specified normal force)
spec WSc = FL.1 [µNµm]
(We just multiply the lateral force value with 1 µm)
G. Kaupp, M. R. Naimi-Jamal, Nanomech 5, 7.-9. September 2004

Angular dependence of specific scratch work on (1-100) of -quartz and crystal packing
Angle µNµm (FN=1482 µN)
90° 206 45° 223 0° 225
spec WSc = FL.1 [µNµm] = work for 1 µm scratch length of the indented tip
c-direction (90): alternation of 0.5405nm Si-Si rows; the other directions are less distant and the skew (10-11) cleavage plane is cutting in c-direction
G. Kaupp, M. R. Naimi-Jamal, Nanomech 5, 7.-9. September 2004

SrTiO3 (100) SrTiO3 (110) SrTiO3 (111)
Spec. scratch work (3 µm, 60 s, FN = 1190 µN ) Angle µNµm 0° 246.6 45° 270.1 90° 240.4
Spec. scratch work (3 µm, 60 s, FN = 1190 µN ) Angle µNµm 0° 244.3 45° 253.0 90° 206.8
Spec. scratch work (3 µm, 60 s, FN = 1190 µN ) Angle µNµm 0° 326.2 45° 239.5 90° 241.9
Angular and facial dependence of specific scratch work (WSc,spec = FL.1 [µNµm])
or residual scratch resistance (RSc,res = FLl/Vres[N/m2]) on strontium titanate(why should we use the latter parameter as the volume measurement is insecure?)
G. Kaupp, M. R. Naimi-Jamal, Nanomech 5, 7.-9. September 2004

New Parameter: Full Scratch Resistance (RSc full) Definition RSc = FL l / V [Gpa] (FL = lateral force; l = length)
RSc full = FL l / Vfull = FL/Q (Q = indenter cross section)
for ideal cube corner Q = A / √3 (A = FN / H = projected area at full load)
it follows RSc full = FL√3 / A = H FL√3 / FN (FN = normal force)
and with FL = const.FN
3/2 (our experimental relation)
RSc full = const3/2 H FL
1/3√3
2 convenient linear plots: FL = K RSc full3 ; FN = K’ RSc full
2
G. Kaupp, M. R. Naimi-Jamal, Nanomech 5, 7.-9. September 2004

y = 225,24x + 2,1866
0
20
40
60
80
100
120
140
160
0 0,2 0,4 0,6 0,8
(RSc,full)3
F L
y = 376,62x + 12,893
0
50
100
150
200
250
300
350
0 0,2 0,4 0,6 0,8
(RSc,full)2
F N
ninhydrin
y = 7,3336x + 37,472
0
200
400
600
800
1000
0 50 100 150
(RSc,full)3
F L
y = 110,51x + 336,44
0
500
1000
1500
2000
2500
3000
3500
0 10 20 30
(RSc,full)2
F N
quartz
Examples for linear FL = K RSc full3 and FN = K’ RSc full
2 plots
These lines cut close to the origin as required
G. Kaupp, M. R. Naimi-Jamal, Nanomech 5, 7.-9. September 2004

y = 0,0054x + 0,7599
0
200
400
600
800
0 50000 100000 150000
(norm. displ.)2.25 (nm 2.25)
late
ral f
orc
e (μ
N)
y = 0,0202x - 5,2546
0
100
200
300
400
0 5000 10000 15000 20000
(norm. displ.)2.25 (nm 2.25)la
tera
l fo
rce
(μN
)
y = 0,0081x - 4,7136
0
50
100
150
200
250
300
0 10000 20000 30000 40000
(norm. displ.)2.25 (nm 2.25)
late
ral f
orc
e (μ
N)
y = 0,0001x + 4,512
0
20
40
60
80
100
0 200000 400000 600000 800000
(norm. displ.)2.25 (nm 2.25)
late
ral f
orc
e (
μN
) y = 0,0006x + 4,9997
0
20
40
60
80
0 40000 80000 120000
(norm. displ.)2.25 (nm 2.25)
late
ral f
orc
e (μ
N) y = 0,0001x + 4,512
0
20
40
60
80
100
0 200000 400000 600000 800000
(norm. displ.)2.25 (nm 2.25)
late
ral f
orc
e (μ
N)
(a) (b) (c)
(d) (e) (f)
(a) fused quartz, (b) SrTiO3, (c) Si, (d) thiohydantoin, (e) ninhydrin and (f) tetraphenylethylene
(normal force) ~ (normal displacement)3/2 and (lateral force) ~ (normal force)3/2
imply the relation (lateral force) ~ (normal displacement)9/4
Consistency of our quantitative laws
G. Kaupp, M. R. Naimi-Jamal, Nanomech 5, 7.-9. September 2004