g/-a/ 37yy-1 z -a m x 7...
TRANSCRIPT

Document of
The World Bank
FOR OFFICIAL USE ONLY
g/-A/ 37YY-1
Z -A M X 7 / 6 / Report No. 12059-BR
STAFF APPRAISAL REPORT
BRAZIL
STATE HIGHWAY MANAGEMENT II PROJECT
(STATES OF MARANHAO, PIAUI AND TOCANTINS)
FEBRUARY 23, 1994
MICROGRAPHI CS
Report No: 12059 BRType: SAR
LAI DepartmentInfrastructure Operations DivisionLatin America and the Caribbean Regional Office
This document has a restricted distlibution and may be used by recipients odv in the performance oftheir official duties. Its contents may not otherwise be disclosed without World Bank authorization.
Pub
lic D
iscl
osur
e A
utho
rized
Pub
lic D
iscl
osur
e A
utho
rized
Pub
lic D
iscl
osur
e A
utho
rized
Pub
lic D
iscl
osur
e A
utho
rized
Pub
lic D
iscl
osur
e A
utho
rized
Pub
lic D
iscl
osur
e A
utho
rized
Pub
lic D
iscl
osur
e A
utho
rized
Pub
lic D
iscl
osur
e A
utho
rized
CURRENCY EOUIVALENTS
Currency Unit = Brazilian Cruzeiro Real (Cr$)US$1 = Cr$ 353.14 (January 13, 1994)This exchange rate has been used throughout the report unless otherwise indicated
WEIGHTS AND MEASURES
Metric System
FISCAL YEAR
January 1- December 31
ABBREVIATIONS AND ACRONYMS
ABDER - Associacao Brasileira dos Departamentos Estaduais de Estradas de RodagemBrazilian Association of State Road Agencies
ADT (vpd) - Average Daily Traffic (number of vehicles per day)ASPLAN - Assessoria de Plailejamento do Govemo do Tocantins
Planning Secretariat of the State of TocantinsCEPRO - Fundacao Centro de Pesquisas Economicas e Sociais do Piaui
Center for Economic and Social Studies of the State of PiauiCVRD - Companhia Vale do Rio Doce
Vale do Pio Doce CompanyDEOVI - Departamento de Obras Viarias do Estado do Tocantins
Tocantins State Road DepartmentDER - Departamento Estadual de Estradas de Rodagem
State Road DepartmentDER-MA - Departamento de Estradas de Rodagem do Estado do Maranhao
Maranhao State Road DepartmentDER-PI - Departamento de Estradas de Rodagem do Estado do Piaui
Piaui State Road DepartmentDNER - Departamento Nacional de Estradas de Rodagem
National Road DepartmentEA - Environmental AssessmentFPE - Fundo de Participacao dos Estados
State Participation FundGEIPOT - Empresa Brasileira de Planejamento dos Transportes
National Transport Planning AgencyICMS - Imposto sobre a Circulacao de Mercadorias e Servicios
Value Added TaxIP - Implementation ProgramIRI - International Roughness IndexMT - Minist6rio dos Transportes
Ministry of TransportNPV - Net Present ValueOM - Operational ManualPMU - Project Management UnitSEINF-TO - Secretaria de Infra-Estrutura do Estado do Tocantins
- Tocantins State Infrastructure SecretariatSEMATUR - Secretaria do Meio Ambiente e Turismo do Estado do Maranhao
Secretariat of the Environment and Tourism of the State of MaranhaoTIRERR - Taxa Interna de Retomo/Economic Rate of Return

ZmIL FOR OMCAL USE ONLY
STATE MGHWAY MANAGEMENT I PROJECT
STAW APPRALSh ElT
Table of Contents
Page NoLoan and Project Summary ............................................ (i)
A. The Institutional and Policy Framework ................................ IB. The Trasport Sector in the Economy .............. ................... 2C. The Road Transport Industry ....................................... 2D. The Road Networks, Maintenance Condition and Policies ..................... 3E. Road Administration, Organizadon and Decentraization ...................... 6F. Road Finmcin .......................................... 6G. Bank Sector Experience and Strategy ................................... 7
B. THE ROAD SYSTEMS IN THEEPROJECT STATES .. 9A. The Geographic Setting . ......................................... 9B. Overview of the States' Economies ............. ...................... 9C. Tne States' Road Networks, Maintenance Condition and Strategies .............. 11D. The States' Road Expenditure Programs ............................... 13E. The States' Road Agencies: Organization, Management and Personnel .... ........ 13F. Environmental Management ....................................... 15G. Financing the States' Road Programs ................................. 17
in1. THE EROJECT . ............................................... 18A. Project Origin, Objectives and Rationale ............................... 18B. Project Description ............................................. 19C. Project Cost and Financing ....................................... 21D. Project Enviromnental and Economic Assessments ......................... 22E. Project Risks . ............................................... 23
IV. PROJECT IMPEMENTATON ..................................... 24A. Institutional Responsibilities ........... ........................... 24B. OrganizationalArrangements ..................................... 24C. ImplementationPrograns ........................................ 25D. ProcurementArrangements .................. ..................... 27E. Disbursement, Accounting and Audit Arangements ........................ 28F. Monitoring and Supervision Plan ................................... 29
V. AGREEMENTS REACH4ED AND sECO>MdENDATIQ .................................... 30
This report is based on the findings of an appuaisal mission which visited Brmzil dufing May 1993. The mission conprisd Mes.Jacques Cellier (Task Manager. LAIIN). Gerard Lisutaud (Highway Enginer , LAlII), Vitor Bellia (Environmes Consultant),Rafael Perez (Organization Consultant), and Rodrigo Archondo-Calwo (thighway Economist Consulnt). Mr. Homan Levy (PeerReviewer, EA2TP) provided technical advice. Ms. Joy Obialor provided adminisative support. Messrs. Asif Faiz, OrvilleGrimes, and Rainer Sen are respectively the manging Divison Chief, Projes Adviser, and Depa_rmt Diector for theopeation.
This document has a tcstricted distribution snd may be used by recipients only in the perfonnanceof their oMcia duties. Its conteints tnay not otherwiso be disclosed without Wofld Bank authorization.

VI. ANNXS
1. Supporting Tables and Charts:
Tables:1. Brazil's Transportation Expenditures by Mode .................... 322. Brazil's Motor Vehicle Fleet ............................... 333. Brazil's National and Transportation Aggregates ................... 344. Brazil's State Road Network Characteristics ..................... 355. Brazil's Road User Charges .......................... ... 366. Maranhao State Finances .. ......................... 3t7. Maranhao State Road Cost Recovery ..... ...... .............. 388. Piaui State Finances .................................... 399. Piaui State Road Cost Recovery .......................... 4010. Tocantins State Finances ............. ............. 4111. Tocantins State Road Cost Recovery ......................... 4212. Estimated Schedules of Disbursements ............. ,......... 43
Chars1. Maranhao State Road Department Organization ................... 442. Piaui State Road Department Organization ...... ................ 453. Tocantins State Infrastructure Secretariat Organization ..... .......... 46
2. Regional Economic Development Prospects ........ ................... 473. Maranhao State Road Network, Maintenance and Upgrading Strategies .... ...... 504. Piaui State Road Network, Maintenance and Upgrading Strategie .... ......... 565 Tocanth:s State Road Network, Maintenance and Upgrading Strategies .... ...... 61!,. State Road Departments: Organization, Management and Personnel .... ........ 667. State Technical Assistance Programs ............................... 69B. State TrainingPograms .............. ......................... 719. tate Environmental Management Programs .......................... 7410. Maranhao Subproject Description, Costs and Financing ................... 811 1. Piaui Subproject Description, Costs and Financing ...................... 8612. Tocantins Subproject Description, Costs and Financing ................... 9113. Environmenal Assessment Summary .............................. 9614. Economic Analysis of Subprojecs ................................ 10315. Maranhao Subproject Implementation Program, Indicators and Targets .... ...... 10816. Piaui Subproject Implementation Program, Indicators and Targets .... ......... 11517. Tocantins Subproject Implementation Program, Indicators and Targets .... ...... 12118. Project Monitoring and Supervision Plan ............................ 12719. Selected Documents and Data Available in the Project File ................. 129
Man: IBRD No. 23773R1: Brazil - State Highway Management II Project

STATE HIGHWAY MANAGEMENT11 PROlE
Loan ano ProJect Summary
Ibrrowers States of Maranhao, Piaui, and Tocanuns
Guarshtor: Federative Republic of BrazilEmutingAzdes IThe road agencies in the above states
Amounts: US$79.0 million equivalent to the State of MaranhaoUS$54.0 million equivalent to the State of PiauiUS$87.0 million equivalent to the State of Tocantins
Ter: Repayment in 15 years, including five years of grace, at the Bank's standard variableinterest rate.
Qkihves: The project aims to check further deterioration of the state road networks and improvetheir serviceability. To this effect, it would specifically: (a) ensure adequate priority andfnding for the maintenance, rehabilitation and upgrading components of the state roadprograms; (b) implement appropriate road maitenace, rehabilitation, and upgradingsregies and programs, and improve the management of maienance actvities;(e) develop and improve compliance with environmental standards for state roads. Theproject is also expected to help establish an insiutional and technical framework formaintenance, rehabilitation and upgrading of state roads natinwide. The ultimateobjective is to contribute to the resumption of economic growth by reducing the cost ofu-ansport on the state road networks.
fr@jct:irpIion: The project would consist of three similar subprojects in the borrower states, each
supported by a separate Bank loan. Each subproject would include: (A) a poicy andinstitutional development program to: (a) prepare and anmnally update the state'spluriannuat and annual road expenditure and funding programs, in accordance withpolicies and economic criteria satisfactory to the Bank, and, thereby, strengthen the stateroad agency's planning system; (b) develop and monitor efficient maintenance, rehabilit-ation and upgrading strategies and programs, and strengthen the agency's contract andproject management systems; and (c) develop approprat capability in the Govemnmentto implement and enforce environmental standards and guidelines for state roads; (B) arebabilitation and maintenance program consisting of rehabilitation, resurfacing, andperiodic and routine maintenac components of the state's 1994-98 road program; and(C) an upgrading program, consisting of the highest-priority upgrading and pavingcomponents of the state's 1994-98 road program. The three subprojects combined wouldhave a total scope of about 1,550 km for rehabilitation and resurfacing, 18,500 km forperiodic and routine maintenance, and 2,650 km for upgrading and paving.
lknfimts: ITe project, by improving the maintenance and serviceability of the state road networks,would avoid fiuther losses of valuable capital invested in public roads, substantiallyreduce the cost of tnmsport on state roads, and support sustinable growth in agriculture,industry, and exports. It would contribute to enhanced accountability and more efficient

ii
use of public resources in the road subsector, and to the mitigation of adverseenvironmental impacts of road construction and maintenance.
Peerol Riska: Possible risls include ineffective management of subprojects by the state road agencies,inadequate provision of budgetary resources by the states, and inadequate coordinationand monitoring of the project by DNER. To minimize these risks, the experienceacquired with the previous highway and feeder road projects has been incorporated intothe project's design. In particular, the project would provide for: well-defined subprojectimplementation programs and organizaional armngements, including the strengtheningof the agencies' key planning and control systems; and regular annual reviews of thestates' road expenditure and funding programs at the time of budget preparation. 'TeDNER unit responsible for the coordination and monitoring of the project has beenadequately strengthened with technical assistance. A Mid-Term Review of thesubprojects would be carried out by the end of 1996, and the Bank would seekappropriate remedies if peformance is not satisfactory.
tmated rojet Costs and Flnandng(US$ million equivalent)
Proe ct osts 1/ La o Ere;n Tota
. Maranhao Subproject 112.7 75.2 187.9
. Piaui Subproject 75.3 50.2 125.5
. Tocantins Subproject 137.0_ 91.4 2284Total Base Cost 325.0 216.3 541.8
• Physical Contingencies 22.4 14.9 37.3. Price Contingencies 14.2 915 _23.7Total Project Cost 361.6 241.2 602.8
Elunla no State Govement Bank raw
. Maranhao Subproject 130.5 79.0 209.5
. Piaui Subproject 86.9 54.0 140.9
. Tocantins Subproject 15.4 7.0 _2S2.4Total 382.8 220.0 602.8
slimated Disbkm" EX24 EW ON FM 9M I=
Annual 21 19.0 27.0 42.0 48.0 44.0 40.0Cumulative 19.0 46.0 88.0 136.0 180.0 220.0
1/ including emated loca taxes and duties totaling US$90.0 million.2/ including initial deposits into Special Accounts totaling US$11.0 million.
Rate of Return:
The esdmated economic rate of reb rn for the first-year program is 29%. The economicrates of return for the remaining investments are expected to range from above 12% toover 50%, with most of them exceeding 20%.

BRAZIL
STATE HIGHWAY MANAGEMENT II PROJECT
1. SECTOR OVERVIEW
A. The Institutional and Policy Framework
1.1 The management of the transport sector is shared among three levels of govermnent. At thefederal and state levels, the administrative and operational functions are generally vested in sub-sectoralautonomous agencies and public enterprises, respectively, under the jurisdiction of the Ministry ofTransport (MT) and the states' Secretariats for Transport or Infr.^tructure. The National RoadDepartment (DNER) administers a network of federal highways, mostly interstate, but also somehighways of essentially state interest. The State Road Departments (DERs) are responsible for statehighways and the more important feeder roads, while the Municipal Governments have jurisdiction overthe rural roads of local interest, and urban streets. With the exception of some state-controlled buscompanies in the major cities, the road passenger and freight transport industries are mostly private. Thethree levels of government, however, regulate the provision of passenger services through a system ofconcessions. Although some attempts have been made to impose restrictive measures on trucking, theindustry operates in an unregulated regime (para. 1.9).
1.2 The Federal Railway (RFtFSA) is a consolidation of 18 formerly independent regional railways.It has recently curtailed its non-viable long-distance passenger services, spun off its commuter trainsystems into a subsidiary, the Brazilian Urbat. Train Company (CBTU), and now operates mostly freightservices in the southeastern, southern, and part of the northeastern regions. The Sao Paulo State Railway(FEPASA), which is owned by the State of Sao Paulo, operates mainly freight servics on a rail networkwhich serves the state and neighboring areas, and some passenger services, including commuter trainsin the metropolitan region of Sao Paulo. The large mining group Companhia Vale do Rio Doce (CVRD)owns and operates two railways. mainly for iron ore, in the southeast and in the north. The FederalGovernment, through the Portobras system, Petrobras for oil and petroleum products, and CVRD for ironore, and through concessions to private companies, controls the country's entire port system. IheFederation also owns and operates a substantial portion of the merchant fleet and is present in inlandshipping. Airlines are privately owned, but the state regulates services and controls rates.
1.3 The Government's objectives and strategy for the transport sector adequately emphasize: (a) thereduction of the size of tb.a public sector, through the elimination or restructuring of non-viable statecompanies or agencies, and the nrivatization of operating companies; (b) the deregulation of transportactivities and the promotion of private sector involvement in transport, particularly in ports and railwayoperations, and in the financing and operation of public infrastructure projects, e.g. toll roads; (c) thedecentralization of administrative responsibilities to lower levels of government, in particular in thehighways, urban transport, and port subsectors; (d) the rebabilitation and maintenance of existinginfrastructure, and the minimum investment required to enable the economy to recover; and(e) operational performance improvements, in particular through improved integration of the varioustransport systems.
1.4 Some important measures have already been taken. They include: (a) the liquidation of thenational port company, Portobras, the deregulation of shipping, and the receat approval of a law whichprovides the basis for a broad reform of the port system; (b) the restructuriag of DNER and preparation

.2
of legislation to decentralize highway administration and to regulate concessions of public services; (c) theliquidation of the Brazilian Urban Transport Enterprise and start-up of programs to transfer the operationof urban train systems to the state and local levels; (d) the rationalization of railway services and start-upof their privatization; and (e) limited deregulation of the airline industry to allow for increasedcompetition. The above measures have already led to substantial reductions in total public sectortransport employment.
B. The Transo Sector to the Ecnmy
1.5 Tle transport sector accounts for a rather low 3.7% of Brazil's GNP, and road transport alonefor about 3%. These figures, however, exclude the very important segments of own-account transort,services by truck owner-operators, and private automobile use, which are not accounted for in GNPcalculations. Total expenditures on transport services alone amounted to US$52 billion in 1985,equivalent to about 22% of GNP. Road transport accounts for over 80% of that total (Table 1, Annex 1).Wthin road wansport, private automobile use accounts for 47% and bus transport for 8% of the total.Ro2d transport also accounts for over 90% of passenger-km and about 60% of ton-km outputs. Thereare about 11 million cars and 1.1 million trucks in Brazil, in addition to 150,000 buses and 1.2 millionlight comme.cial vehicles (I'able 2, Annex 1). The trucking industry comprises about 15,000 commercialtrucking rms which, together, have about 250,000 employees and anmnal operating revenues of US$8.0billion equivalent, and about 275,000 truck owner-operators. The road transport industry has grown atrates which have systematically exceeded those of GNP and other industries. Freight and passengertrasport outputs increased at average annuial rates of 8.2% and 10.2% respectively between 1970 and1986, compared to 5.6% and 4.0% for the industrial and agricultural sectors respectively (see alsoTable 3, Annex 1).
1.6 Public investment in transport, which accounted for about 40% of total public capital formationIn the 1960's and the early 1970's and reached 3.3% of GNP in 1975, has drastically declined, and hasremained below 1% of GNP since 1981. Roads received the largest share of those investments unt themid-1970's. irom 1975-85, railways were given higher priority in the investments of the FederalGoverment in an attempt to conserve energy, and road expenditures had to be curtailed even moredrsically. This resulted in the rapid deterioration of large portions of the networks, which were builtin the 1950's and 1960's. Tne size of the transport industry, its direct impact on the productive sectors,as well as the extensive involvement of the government in the sector and the fiscal implications point tothe critical importance of the transport sector to the success of stabilization and recovery efforts.
C. The Road Transport Indusy
1.7 Road Freight Transport Industry. The country's 15,000 commercial trucking firms togetherown about 25% of the truck fleet, and truck owner-operators operate another 25% of the fleet. Own-account trucking therefore represents the remaining half of the truck fleet. Trucking firns are highlyspecialized as to the type of market served and service provided, including routes and products. Largerfirms concentate their services on denser routes, while smaller firms appear more frequently in lessdense or more specialized links. Although there may be hundreds of firms operating in a particularsegment of the market, the few larger firms hold a significant share (zenerally from 30 % to 60%) of thatmarket. Owner-operators can be attached to trucking or other firms, but most are completelyindependent. They generally operate older, medium-size trucks with conventional open bodies, onmedium- and long-distance haus. Own-account trucking is most important in pick-up and deliveryservices in the cities, and in the inter-city transport of cargoes which require speciized equipment.

.3 -
1.8 The trucking industry overall is efficient. Truck rats reveal a competitive position in relationto rail transport. T'e share of operational eipenses to revenues varies from 50 to 70%, and totalexpenses are about 90% of revenues. There is no evidence of above-normal profits. Investments by theindustry, however, have tended to decline in relation to GNP since the mid-1970's. Medium-size truckshave been substituted for smaller trucks and pick-ups in the urban services, and for heavier trucks ininter-city services. Recently, there has also been significant improvement in truck technology, with moreefficient engines and modem bodies, as a result of the now stronger compatition between the four majormanufacturers. There is evidence, however, that upgrading and appropriate renewal of fleets is takingplace mainly within the large truckdng firms and own-account trucking segments of the industry. Thenumber of owner-operators has been decreasing gradually since the mid-1970's and their fleet is rapidlyAging.
1.9 The role of the Government vis-a-03 the trucking industry, has essentially been to provide andmaintain the road infastucture. The industry was largely unregulated until 1983. The Governmentinfluenced operations only indirectly through pricing and taxation of inputs, and license fees. In 1983,a law was passed authorizing the Govermment to regulate the industry. In addition to formalizing thedistictons among the above-menticned categories of truck operators, two new important restrictionswere introduced: firns Involved ip own-account trucking were forbidden to sell trucking services to thirdparties; and the Ministry oI Transport (hM) was given a mandae to Impose restrictive measures on theentry of new trucking firms. MT later established minimum eapacaty levels for commercial truckingfirms and limits on areas of operation as well as on the type of commodity carried. In practice, however,problems with the implemeion of the operator's mandatory register and insufficient political supportand means of enforcing legislation have made the impact of these restrictions negligible. In 1990, theGovemment revoked all these restrictions.
1.10 Road Passenger Transport Industry. Passenger transportation in Brazil is considered to be apublic service. Entry into the sector is regulated by govenment through licenses or concessions. Federal,State, and municipal governments set raes, routes, frequencies, and safety and quality stomdards inpractically all market segments. There are a few publicly-owned and operated finms in stae of theargest cities. Private enterprises, however, are predominant in number and hold the largest share of themarket. The majority of these firms are small to medium in size, and controlled by one entreprenr orby a family group. In the interstate segment and in dense inter-municipal connections, however, thereare a few firms providing services in complex networks, operatig fleets of more than a thousand buses.In the urban segment, large firms are rare; they usually serve a stictly defined geographic zone,opeating a fleet of up to two or three hundred buses from a single garage.
D. The Road Networks. Maintennoe Conditlon and Polides
1.11 Brazil's road system has a total length ofabout 1.5 milion km. The system is divided ino Table1.j: Bian's Netwoad bnusandKm)three administrive levels: (a) a federal network of Pai Unavod Bjabout 67,000 km, which is under DNER'sjurisdiction; (b) state networks totaling about 215,000 'gs 17 67km, which are under the responsibility of the 26 Sta% 82 133 215
states, two federal territories and the Federal District; 12 1,206 1.218and (c) municipal networks extending over some 1.2mIllion km, which fall under the jurisdictions of over Ta1 144 1,356 1,104,000 Municipalities.

-4 -
1.12 The federal network is paved over 75% of its length, i.e. about S0,000 km. Ihe majority ofthe unpaved network is located in the Amazon region, where traffic volumes are still too low to warrantcostly paving improvements. Built mainly between the 1950's and the 1970's, the federal network hassuffered extensive deterioration as a result of age, heavier-than-expected traffic volumes and axle-weights,and inadequate maintenance. In the early 1980's, the situation of the federal network was dramatic, withthe proportion of pavements in bad condition, because of major structural problems, reaching between25% and 30%. From that time, however, DNER, scaling down new construction programs, has placedmajor emphasis on the rehabilitation and maintenance of existing highways. Between 1985 and 1992,almost 15,000 km were rehabilitated or resurfaced, in part with assistance from the Bank under twocompleted projects (Sixth Highway Project, Loan no. 1557-BR, and Federal Highways Sector Project,Loan no. 2446-isR) and an ongoing project (Highways Management and Rehabilitation 'roject, Loanno. 3169-BR). Pavement condition surveys sarried out in 1992 show that the pace of deterioration ofthe network, in terms of both structura capacity and surface defects, has effectively slowed down.However, the proportion of pavements with high deflection values (above 80/100 mm), a high roughness(RI above 6), or low present serviceability index (PSI below 1.5) still ranges between 10% and 20%.
1.13 A pavement rehabilitation and maintenance strategy and program for the federal network wasdeveloped by DNER on the basis of assessments of alternative policies under different levels of budget,with the help of the Bank-developed Highway Design and MaIntenzAce Standards (HDM Q) model. Inthe absence of budget constraints, the program would consist of: (a) extensive strengthening, renewal orreconstruction of about 10,000 km (i.e. 20% of the paved network); (b) resurfacing of about 15,000 km(i.e. 30% of the network) in order to slow down pavement deterioration; and (c) preventive maintenanceand limid surface corrections on the remaining 25,000 km (i.e. 50% of the network), wher.e pavementsare sufficienty strong. The total cost of such a program, however, was estimated at about US$3.0 billionover three years, which is far above the resources presently allocated to DNER for this purpose.Alternative programs have therefore been developed for various budget constraints.
1.14 The state networks comprise approximately215,000km, i.e. 14% of Brazil's total road length.About 82,000 km (i.e. 38% of total state network length and 57% of the country's paved network lengh)are paved, 83,000 km (i.e. 39% of the state network) are graveled, and 50,000 km (i.e. 23%) consistof earth roads. Network length has been increasing at a steady rate of 7% p.a. over the past 30 years.The density of state roads, however, is sfill very low (23 meters per km2 and 700 inhabitants per km efroad, as an average). Five states (Goias, Minas Gerais, Sao Paulo, Mato Grosso and Bahia) togetheraccount for half of the total length, and four states (Sao Paulo, Parana, Bahia and Minas Gerais) accountfor half the length of the paved networks (Table 4, Annex 1). Traffic on state networks is estimated atabout 50 biUlion vehicle4an, i.e. about 25% more tDan on the federal network, and it is growing faster(at about 9% p.a.), which leads to a substantial need for pavement maintenance and strengthening, as wellas for new paving and capacity expansion programs.
1.15 Ihe surface condition of the pavedstate networks in 1989 was not significantly Table 1.2: Condition of Stat PAved Networks. 1989
bet han that of the federal network, despite R_ Ed TOW
the younger age of the pavements (the 3 20.0 82.0weighted average age being about 12 years).A comparative study of the maintenance s 42% 3S% 23% 100%
condition of the federal and state networks,carried out in 1989 under the coordination ofthe Brazilian Association of the DERs (ABDER), showed that about 42% of the paved state highwayswere in good condition, 35% in regular condition, and 23% in poor condition; and about 75% of thosein good condition were less than five years old and 80% of those in regular condition were in the five

-5 -
to ten year age range. The majority of the pavements in poor condition are more than twelve year old.These results confirm that after a relatively slow but increasing deterioration process in the first ten years,paved highways deteriorate very rapidly when adequate maintenance is not carried out. Considering theabove-mentioned average age, the state networks are therefore now reaching a critical phase of rapiddeterioration, thus requiring intensive rebabilitation and maintenance efforts.
1.16 The coinditlon of the unpaved network is also a source of concern. The above-mentioned surveyshows that 36% of the roads are in good condition, 39% in regular, and 25% In bad condition. Also,almost 25,000 km of gravel roads are subject to traffic volumes above 200 vehicles per day, and arecandidates for paving to reduce road ma4ntenance and vehicle operating costs.
1.17 Tne maintenance and rehabilitation programs of the state governments are generally inadequate.A recent survey showed that, in 1989, for example, only about 2,250 km and 2,600 kmn of paved statehighways across the entire country were respectively resealed and strengthened, which represents less than10% of the total needs. In addition, a substantial proportion of the maintained sections received only aslurry seal, a technique which reduces the pace of deterioration for only two to three years. The surveyalso indicated that a high percentage of maintenance activities are concentated in a few states, essenlyin Sao Paulo, Mines Gerais, Parana and Santa Cataina. The great majority of the states do litdemainteance, despite the substantial economic returns from appropriate and timely interventions.Furthermore, the survey also revealed that most states have suspended traffic counts since 1985, and thatvery few have carried out pavement condition surveys.
1.18 Many state governmens urgently need to develop and implement well-balanced road programswhich give adequate priority to routine and preventive maintenance, and to pavement strengthening andrehabilitation, while keeping upgrading and paving programs consistent with the financial capabilities ofthe state. For that purpose, state governments will have to strengten their highway agencies, throughtcnical assistance and training of their personnel, with a view to monitoring the condition of theirnetworks, and developing efficient rehabilitation and maintance strategies and programs. Consideringthe present condition of the networks and the traffic levels, a possible strategy for many of the stateswould be to:
(a) strengthen the paved highways and feeder roads which are in regular condition, through timelyperiodic overlays, in order to avoid their reaching the poor condition category and the subsequentneed for costly rehabilWion (about 28,000 km);
(b) gradually rehabilitate the sections which are already in poor condition (about 20,000 km),possibly over three to six years, depending on the budget constraints of the respective states;
(c) carry out routine maintenance programs on the entire networks; and
(d) gradually upgrade and pave gravel roads with appropriate economic justification, in accordancewith the financial capabilities of the respective state (25,000 km of state roads country-wide withaverage daily traffic (AD) levels above 200 vehicles are possible candidates).
The total cost of the rehabilitation and maintenance of the state networks, including their unpaved portion,is estimated at about US$7.0 billion equivalent over 1994-1998, i.e. about US$1.4 billion per year.

-6 -
IL Road Adminisiratb ONaWntizon and Remimlizatlan
1.19 Responsibilities for administering the country's road network are shared between DNER(67,000 kIn), the 26 state road departments (DERs, 200,000 kn), and the 4,000 or so municipalities(1.2 million km). Following the 1988 constitutional and fiscal reforms, which have transferred the bulkof road user tax revenues to the states and municipalities (para. 1.22), the Federal Government has alsodecided to decentralize responsibilities for administering the road networks. In particular, the size of thefedoral network is to be reduced to the main interstate highways, through gradualiy transferring to thestate governments the respnslbility for the other highways, with predominandy local interest, Many stuchhighways had been built or improved under DNER's budgets through political pressure, and, by acquiredrights, had become federal highways. The Federal Government has prepared a plan, including the relevantdraft legislation, for the transfer of about 20,000 km of roads from federal to state jurisdictions. Beforesuch transfers can take place, however, the Federal Government intends to seek agreement witi therespective states on specific highways and the timing of their transfers.
1.20 DNER and many of the DERs developed into large organizations to administer the extensiveconstruction programs of the previous decades. There are still substantial needs for building new roads,in particular in the Center-West Region, and for capacity investments in the South and Southeast regions.However, since large portions of the networks are now reaching a critical age, highway maintenance isbecoming, or it should become, the main activity of most agencies. Therefore, the agencies have to makeimportant institional adjustments, in particular to develop appropriate road maintenance planning andmangement systems, and to rely more systenatically on the more efficient private contractor industryrather than force account even for routine maintenane activities. DNER and some DERs haveundertaken such reforms, under ongoing Bank-financed projects. Ihere are, however, significant
chnological and institonal gaps among the various DERs, and the road _aienance capacity of thelocal governments is very weak.
1.21 The decentralization process, besides the above-mentioned transfers of non-interstate highways,will therefore require a broad reform and strengthening of the highway instittions. The PederalGovernment has developed a strategy and an action plan to implement such administAtve reform of thehighway subsector, which includes action programs to: (a) gradually transfer the federal highways ofpredominandy local interest to the state governments; (b) develop appropriate capabilities at the federallevel, for subsector policy formulation, planning, research and technological development, including themanagement of the reduced federal network; (c) reorganize and streamline DNER in accordance with itsnew responsibilities; (d) establish appropriate financing and funding mechnisms for road maitenance;(e) assist the state governments in developing appropriate capacity within the DERs for the managementand maintenance of the state networks, including the transferred highways. The Highways Managementand Rehabilitation Project (Loan No. 3169-BR, signed in April 1991) was designed to support theimplementation of programs (a) to (d). The State Highway Management Project (Loans no. 3547-BR and3548-BR) approved on December 22, 1993, and the proposed project would support the implementationof program (e) in a first group of states.
F. Road Fnandng
1.22 Road User Charges. The system of road user taxes underwent substantia changes with the fiscalreform of 1989. The federal level lost its power to impose taxes on petroleum and alcohol products andon motor-vehicle ownership, retaining only the petroleum import tax (UP). The states gained from theinclusion of petoleum and alcohol products and of i-state and inter-municipal transport services inthe base of the value added tax (ICMS) and the right to tax motor-vehicle ownership. The municipal

-7 -
level increased its participation in the revenues of the value added tax from 20 to 25%, and in those ofthe motor-vehicle ownership tax (IPVA) from 40 to 50%; and they gained authority to impose a tax onsales of gasoline and alcohol (IVVC), up to 3% of retail price. Overall, the states' and municipalities'revenues from road user taxation have increased substantially, while those of the Federation have beenreduced. Although DNER and some states intend to expand toll collection on high-trafficked highways,toll revenues, compared to tax revenues, are and will remain marginal. A summary of the current roaduser charges is shown in Table 5, Annex 1.
1.23 The ICMS imposed on petroleum and alcohol products has resulted in a net increase in taxrevenues and in an improved structure of road user taxes, as compared to the previous tax, which waslevied at a reduced rate on diesel oil and from which alcohol was exempted. The three administrativelevels recover at least the total costs of the appropriate operation, maintenance and rehabilitation of theirroad networks (rable 5, Annex 1). State and municipal governments are also able to recover from roadusers a portion of their road upgrading and construction expenditures. A policy for road cost-recoveryhas recently been developed under the Highways Management and Rehabilitation Project (Loan no. 3169-BR), and a system is being established to monitor the adequacy of road user charges. The FederalGovernment is committed, under the same project, to a system of road user charges which: (a) permitsthe recovery of at least the maintenance and rehabilitation costs of road use; (b) is free of distortionsdetrimental to energy conservation; and (c) is updated on a timely basis. Under the proposed project,the participating state governments would be committed to recover from road users at least the total costsof the operation, maintenance and rehabilitation of their networks, and a minimum percentage of theirtotal road expenditures (para. 3.6).
1.24 Fuel Prices. The prices of motor-vehicle fuels at the pump, in early July 1993, were aboutUS$0.53, US$0.41 and US$0.33 equivalent per liter of gasoline (which includes up to 20% of ethanol),of hydrated ethanol, and of diesel-oil respectively. These prices have been consistendy maintained wellabove intnational prices, including the necessary adjustments for taxes, distribution costs and retailers'margins.
1.25 Funding of Road Agencies. Road expenditures used to be fimded mainly through revenues fromroad user taxes, which were shared between the three levels of government and earmarked for thatpurpose. In the early 1980's, however, tax earmarking was gradually discontinued with a view torestoring central control over public expenditures. The road agencies have consequendy seen theirresources erode drastically since general budget allocations did not make up for the loss of earmarkedfunds. Their total reliance upon the less predictable transfer from general revenue has badly affectedtheir construction and maintenace programs. Federal road expenditures are now funded by the revenuesfrom ti petroleum import tax (although such revenues are not legally earmarked for road expenditures)and frcn general revenue. The DERs, however, still remain entirely funded from the states' generalrevenues. It is a major objective of the proposed project to assist the DERs in preparing appropriate roadprograms based on sound technical and economic priority criteria, and to ensure adequate funding fortheir rehabilitation and maintenance programs (para. 3.7).
G. Bank Sector Exegence and Strategy
1.26 The Bank has made 27 loans in the Brazil transport sector since the early 1960s: 12 for highways,three for feeder roads, four for railways, two for ports, and six for urban transport, in addition tofinancing rural roads under a number of agriculture projects, and the construction of an 890 km railwayunder the Carajas Iron Ore project. Until 1975, the projects concentrated on the expansion of the trunkhighway network and on the improvement of the railway, port and mass transit systems. In subsequent

-8-
years, emphasis gradually shifted to the maintenance and rehabilitation of the interstate and trunk highwaynetwork, to the planning and implementation, on a decentralized basis, of feeder roads programs, andto improving public (bus) transport and traffic management in the major cities. More recently, with therapid deterioration of the financial and operational performance of the sector's state-owned enterprises,the policy and Institutional reforms advocated by the Bank for more efficient resource use and formanagement effectiveness have had a broader impact. In support of the financial rehabilitation andcommercially-oriented operation of the public enterprises, the Bank approved a Federal Rakilway ExportCorridor Project in 1985 (Loan no. 2563-BR), a FEPASA Railway Rehabilitation Project in 1987 (Loanno. 2857-BR), and a Ports Technical Assistance Project in 1988 (Loan no. 2941-BR). In support of thereorganization of the highway sub-sector management, the Bank approved a State Highways Management-Sao Paulo Project in 1989 (Loan no. 2830-BR), a (Federal) Highways Management and RehabilitationProject in 1990 (Loan no. 3169-BR), and a State Highway Management (Alagoas and Santa r itarina) in1992 (Loans no. 3547-BR and 3548-BR), all of which are now progressing well. FinaLh, the Bankapproved two metropolitan transport decentralization Projects, one for Sao Paulo in July 1992 (Loan no.3457-BR), and the other for Rio de Janeiro in June 1993 (Loan no. 3633-BR).
1.27 The Bank's involvement in the transport sector has generally been successfil1. The projects'physical objectives have mostly been met, although the recent difficult economic conditions and relatedfunding problems have often caused substantial delays. Progress on policy reforms and institutionalstrengthtning has often been slower than expected. The size and complexity of the sector, the largenumber of government agencies and public enterprises involved, the complex political system, and thedifficulty in reaching the needed consensus for policy reforms have been major factors in the delays, butthere might also have been unrealistic expectations on the Bank's part on the pace of policy reform.
1.28 The Bank's strategy in Brazil is to support policies and investments that will encourage economicgrowth and socW development in a context of macro-economic stability. The main emphasis is onefficient resource allocation, increased efficiency in the public sector and the appropriate targeting anddelivery of support systems to the poor. The strategy for the infrastructure sectors, including transport,is elaborated in a Medium-Term Strategy Paper for the Infrastructure Sectors (Report No. 9473-BR,July 31, 1991). The transport sector objectives are oriented by the broader country strategy objectivesand therefore include: (a) the stabilization process, and the consequent need to reduce public expenditure,increase revenue mobilization, and improve resource utilization in the sector; (b) the resumption ofeconomic growth, including the provision of efficient and reliable transport services to targeted sectorsof the economy; (c) the promotion of private sector investment and operations in transport; (d) thestrengthening of public sector management, in particular through enterprise reform and decentralization;and (e) improved environmental management in transportation.
1.29 The main focus of the Bank's assistance strategy in the transport sector is on: (a) transportpriing, including liberalization of price controls, restoration of adequate pricing policies and costrecovery mechanisms in the public sector, and appropriate transport user taxation; (b) the re-design ofsector regulations and implementation of regulatory reforms which, together with efficient pricingmechanisms and privatization measures, would aim at restoring the role of market forces in the operationand development of the transport sector; (c) institutional reform, including decentralization of governmentresponsibilities to strengthen the management of public infrastructure and establish appropriatemechanisms to control the impact of transport investments on the environment; and (d) investmentprogramming, aimed in particular at economic stabilization and resumption of growth.

- 9 -
II. TE ROAD SYSIS IN TI PROJECT ffATES
A. The Geoeraphic Setting
2.1 The neighboring states of Maranhao, Piaui and Tocantins form a homogeneous sub-region of anarea of about 865,000 km2, lying in the Northeast and Center-West regions of BrazL It is a zone oftransition between the semi-arid "sera" of the Northeast to the east, the humid low plains of easternAmazonia to the west, and the high plains of the cerrados to the south (Map IBRD 23773Rl).
2.2 State of Maranhao. With an area of about 325,000 Km2, Maranhao is the second largest statein the Northeast region of Brazil. It is a zone of transition between the semi-arid "sertao of theNortheast and the humid plains of eastern Amazonia. The southern part of the state consists of plateauswith altitudes ranging from 300 to 800 meters. Large plains in the central area open up to the Gulf ofSao Luiz and to the northern seaboard. The climate is tropical, with a period of heavy rainfall, whichextends from November or December to April or May, and a dry season. Annual rainfall ranges from2,000 mm in the northwest to 1,000 mm In the southeast, and annual average temperatures range between2g and 2r Celsius. The vegetation ranges from tropical forest in the northwest, through native babassupalm in the central area, to savannah, which is typical of the cerrados, in the south.
2.3 State of Piaui. With an area of about 250,000 Km2, Piaui is the third largest state in theNortheast region of Brazil. The state essentially consists of plains and plateaus, with altudes notexceeding 900 meters. It is located mainly in the semi-arid sertao of the Northeast. The climate variesfrom semi-arid to semi-humid with irregular rainfall ranging from 600 mm in the southeast to 1,500 mmon the coast. Rains occur during January to June, with a peak in March and April. The state hasmportant rivers, and an abundant aquifer. Annual average temperatures range between 250 and 2?Celsius. The vegetation consist of savannah in the southwest, dry bush in the semi-arid southeast, andnative palm in most of the central region.
2.4 State of Tocantins. Created on January 1, 1989 tirough separation from the state of Golas, thestate of Tocantins, locaed in the Center-West region of Brazil, has an area of almost 290,000 Km2. Itis a zone of transition between the high plains of the Center-West cerrados in the south and the humidplains of eastern Amazonia in the north. The physical aspects of the state are chacterized by two majorrivers, the Tocantins and the Araguaia. The Araguaia flows along the state's western border with MatoGrosso and Para before joining the Tocantins. The plains of Banana, in the center-west of the state, haveconsiderable poteal for irrigation, which is already being developed. The climate is tropical, hot andhumid, with a dry season from June to September. The savannah of the cerrados covers most of thestate. In the northern part of the state, towards Maranhao, the native babassu palm dominates. The statehas few remains of tropical forest.
B. Overview of the States' Economies
2.5 The three states are among those with the lowest-incomes, and their infastructure, particularlyroads, are among the least developed in the country. Their development prospects, however, are veryencouraging. The conjunction of a number of factors, including new soya varieties well suited to thesubregion's climatic and sol conditions (cerrados), and investments for grain exports recently made inthe Carajas corridor, are making the subregion's grain production increasingly competitive in interatonalmarkets (Annex 2). The poor standards and condition of the roads in the production areas and In the

- 10-
corridors leading to the railway or to local and regional consumer centers, however, remain an importantdetent to more intensive private investment in agriculture and to the development of the region. Thepoor condition of the road network also limits access to basic services such as education and health,resulting in illiteracy, malnutrition and high infant mortality, which are widespread in rural areas.
2.6 State of Maranhao. The state's economy was, until the early 1980's, dominated by agricultureand cattle farming, which employed up to 80% of the economically active population. Since the mid-1980's, however, it has benefitted from the development of the iron ore mines at Carajas in theneighboring state of Para through the Carajas-Itaqui railway, which runs across the northwest of the stateand through associated industrial projects such as a major aluminum plant located at the port and anumber of pig iron plants located along the railway. Per capita income increased from about US$400in 1980 to about US$1,000 by the end of the decade, while the national ecoromy has been stgnantAlthough its contribution to GDP and to employment has declined, agriculture has remained a dynamicsector. The production of rice (about 1.2 million tons in 1990) and maize increased at about 15% p.a.between 1985 and 1990. The cultivation of soya was initiated after 1985 in the area of Balsas, the mainagricultural center located in the south of the state. In addition to appropriate soil and climate conditionsfor new soya varieties and the low price of land, the area benefits from the proximity of the railway tothe port of Itaqui. The area's exports of soya are still small (26,000 tons in 1992 and a forecast of90,000 tons in 1993). Its development potential, estimated at about five million hectares, however, isimportant, and has been confirmed by the recent investments and the interest demonstrated by privateinvestors (Annex 2).
2.7 State of Piaui. Piaui is one of the poorest states in the country. Per capita income was estimatedat about US$1,000 in 1990, compared to about US$2,600 average for Brazil. The situation is even worsein rura areas, where 60% of the state's economically active population employed in agriculture and catdearming generutes only 19% of the state's GDP. The state's main crops are rice, maize, beans, cassava,
bananas, and cotton. A large proportion of these food crops is produced by small farmers, many ofwhom do not own the land they work. Irregular rainfal has resulted in the recent reduction of the state'sproduction of many food crops. The agricultural potential of the state, however, is significant. Thedevelopment of irrigation systems, particularly in the more arid southeatt, will gradually reduce the totldependence on rainfall. More importantly, the southwestern part of the state, where rainfall is moreregular, has vast plains which are promising for the development of soya and rice production (Annex 2).Major investments in land clearing and soil correction have already been made. The poor condition offarm-t-market roads, however, is hampering a more rapid development of this region.
2.8 State of Tocanlins. Formerly the northern part of the state of Goias, Tocantins is a frontier statewhere agriculture and catde firming are the main occupations. These activities account for about 25%and 12% of govermment revenues from the value-added tax (ICMS) respectively, while industry accountsfor only 6%. The main crops are rice, maize, soybeans, cassava, bananas and sugar cane. Productionis generally consumed locally. Exceptions are rice, which is exported to other states in the Northeast,in particular Bahia, and soybeans, which are shipped to the processing centers of Goias and Parana. Withthe Tocantins and Araguaia river basin covering most of its area, the state has a significant potential forirrigated agriculture. A major irrigation project, Rio Formoso, located in the southwest of the state, hasalready increased the state's irrigated land by 30,000 ha., enabling two, sometimes three harvests of riceand/or soybeans per year. As in the other states, the lack of basic infrastructure investments, in particularroads, is a handicap to a more rapid development of the state's agricultural potential.

- 11 -
C. he States' Road Networim Mainteflace CMtonltlNon n 8ktrai
2.9 Network Characteristcs. lhe totillengffi of the networks under the jurisdiction of able2j1: StasWRoad Netwo*ksaMA
the three sta is of the order of 20,650 kn, bid u_each state being responsible for between 5,000and 8,000 km. Approximately 19% of the total 1,900 3,250 5,1network is paved, 60% Is graveled and the PIaui 1,550 6,45 8,00remaining 21% consists of earth roads. Typical TOOWA?3 550 6,950 7,500pavement cotruction comprises a laeic gravelbase course overlain by either a fourcnti Tel 4,000 16,6S0 20,650thick sand-asphalt carpet or a surface treatment.
2.10 Condition. Maint-ence conditions vary significantly as a Table 2.2: Condton of Stat No*twork. 1992function of paeent surfacing type. On the _b God ha __
paved network, visua surveys show that 32%of the network is in good condition, 42% in Pd 32X 42% 26% 4,000regular condition and 26% in poor condition. uIpaved 16% 62% 22% 16,650On the unpaved network, only 16% of thenetwork is in good condition, while 62% and22% are respectively in reglar and poor condition. The maintenance condition of the entire networkunder the responsbility of the three states is shown in Table 2.2 above. The chrac and surfaceconditon of each stae network are described in Annexes 3 to S.
2.11 Traffic. Most of theheavy traffic in the ftfree states is concentraed on the paved federalhighway system where avere daily traffic (ADI) normally ranges between 1,000 and 3,000 vehicles.On the state highway network, traffic volumes are usually low, dte weighted average ADT vaying fromS0 to 200 vehicles. On the paved state network, daiy traffic seldom exceeds 500 vehicles, of which 30to 50% are commerdal vehicles. On unpaved roads, ADTs average about 100 vehicles. Trfc volumeson the individual state networks are presented in Aexes 3 to 5.
2.12 MaInte-ance-and Upgring Strategies. In order to restore and preserve an adequate level ofservice over their entire road network, the three state governments are implementing the followingstrategies:
(a) rehabilitation or resurfacing over a period of about three to five years of all sections of the pavednetwork which are presently showing signs of fatigee or deterioration;
(b) adequat rouie mai ance on the tot length of both the paved and unpaved networks; and
(c) upgrading and paving of the portion of the network where total transport costs have becomeexcessive as a result of traffic volume and expensive grading and regraveling.
2.13 RehabItatIon and Resrfai. Two sets of standards have been defined to rehabilitate orresurface paved roads which show evidence of structurl or surface defects, generally after 12 to 20 yearsof service:
(a) the fist set of standards normally applies to pavements where exensive cracking or significanttransverse deformations, such as ruting and potholes, have occurred. These roads are generaly

- 12-
more than 12 years old and are traveled by more than 250 vehicles per day. Current roughnesslevels exceed 5 IRM. Rehabilitation works involve: (i) recycling of the exisig base, i.e, itsscarification and blending with imported new gravel base material, followed by watering andcompaction; (Ci) construction of a new wearing course consisting of a double surface dressing ora three to five-centimeter thick sand-asphalt carpet, depending on material availability; and(iii) regraveling and priming or single surface dressing of the shoulders. Average rehabilitationunit costs range between US$30,000 and US$70,000 per km.
(b) the second set of standards is for pavements showing only superficial defects or early signs offatigue. Roughness values are generally within a range of 4 to S IRI. Reconstruction or recyclingof the base is unneo ssary and only resurfacing works are required. Depending on trafficvolumes and material availability (stones or sand), resealing operations will coosist of efither:(i) a slurry seal or preferably a single surface treatment when traffic is low, of the order of 100vehicles per day; (ii) a double surface treatment, for traffic above 150 vehicles per day; and(ii) a thin (three to five centimeter) overlay, using bituminous concrete, if stone is available, orotherwise a sand-asphalt carpet for traffic in the range of 150 to 500 veh/day. Averagerrfacing unit costs range between US$9,000 and US$45,000 per km.
2.14 Maintenanee Activities. All three state road departments plan to achieve an adequate level ofroutine maienance, both on the paved and unpaved networks, durinAg project implementation. The mostefficient applicable maintenance strategies have been defined using the HDM m model and the morerecent HDM Manager, with updated input data on network surface condition, traffic volumes, vehicleoperating costs and maitnan unit costs. On the unpaved networks, optimum grading frequencies werefound to range from two gradings per year where ADT is below 25 vehicles per day (vpd), to sixgradings per year where ADT ranges from 100-300 vpd. On low-traffic paved roads (i.e, less than 200vpd), the optimum maintenance policy normaly requires patching of all potholes or ravelted areas, andperiodic resealing of the pavement surface using slurry seals or preferably single surface treatment, atfive to seven year intervals. On higher-traffic roads, thin (3-5 cm) bituminous concrete or sand asphaltoverlays become the most efficient solutions as soon as the roughness level reaches 5 IRI. These policieswil be put ino effect gradually since the three states will have to increase funding for maintance, andthe road agencies, which do not have adequate force account capacities, will have to contract themainteance. of an increasing portion of their networks (up to 70% to 80%) to private contractors. Theyare expected to improve roughness, on the average, from 10-12 to 7-8 IRI on unpaved networks, andfrom 5-7 IRI to 3.54.5 IRI on the paved networks, by the fourth or fifth year of project implementation,and therefore to substantially reduce the cost of transport on these networks.
2.15 Upgrading and Paving. On roads where total transport costs have become excessive as a resultof traffic volumes and cosdiy grading or regraveling operations, their improvement and paving are likelyto yield significant economic returns, more particularly so in areas with high agricultural potential. Onlythehighestpriority improvementshave been taken into consideration. Appropriate and generally low-costdesign standards have been selected to suit the range of traffic volumes normally observed, i.e, between100 and 500 vehicles per day. These standards include: (i) limited earthworks in order to improve gradeand horizontal alignments; (ii) the construction of all drainage facilities, including precast or reinforcedconcrt bridges; and (iii) the execution of a pavement consisting of a 30 cm thick sub-base and basecourse, in naturally occurring gravel, overlain with a double surface treatment or a thin sand asphaltcapet, six or seven meters wide with shoulder widths varying between 1 and 1.5 meters. Typicalestimated unit costs range between US$100,000 to 120,000 per km, of which paving accounts for about50% to 60%, earthworks for 20%, and drainage, including bridges, for 20% to 30% of total cost.

- 13 -
2.16 Road Safety. The level of road safety awareness is generally low in the three state roadagencies. Accident data are scarce or have never been collected at all. As a flrst step towards improvingroad safety in the three states, measures aiming at reducing traffic hazards have been incorporated intothe engineering designs for project roads, so that the higher speed resulting from rehabilitation and pavingdoes not give rise to more accidents and fatalities. As a second step, during the course of the project,two series of actions wil be taken: (i) training courses on highway safety for key personnel of the roadagencies involved in design or maintenace activities; and (ii) collection and analysis of accident data tosubsequently allow the preparation of suitable countermeasures and blackspot improvements.Furthermore, safety public campaigns, involving education through the media and awareness raisingacdons at school level, are already being implemented, at the national level, under the ongoing HighwaysManagement and Rehabilitation Project (Loan No. 3169-BR).
D. The States' Rand EXenditure Programs
2.17 The three states will give the highest priorityto gradually improving their maintenance programs in Table 23: Fo-Year Road Prorams ({km)like with the above strategies to cover their entire PiM4
paved and unpaved networks and to meet physicalimplementation targets (see also Annexes 15 to 17, a. wf. 6S0 600 300Table 1). They will also rehabilitate or resurface all _atnaowe P..) 4900 6200 9200
their paved road sections which require such works Ups a Pavt 750 900 1000
over periods of three to five years. Since rehabilit-ation or resurfacing needs are modest in the three NOWC _ 500 250 800
states, they will be able to carry out substantiupgrading and paving programs, which are economically justied. The implemention of their newconstuction programs, which are tentative, will largely depend on the availability of budgetary resources.Table 2.3 above summaizes the scope of the three state programs. The maintenance, rehabilitation andupgrading components are described in Annexes 10 to 12.
E. The States' Road Agencies: Organizaton. Mananent and Personnel
2.18 The state road departments of Manhao (DER-MA) and Piui (DER-PI) were established in the1940s. They are under the jurisdictions of the states' Secetariats for Public Works (Piaui) and forInfrastructure (Maranhao). Created to admnister road constuction programs which were then beinginitiated, they rapidly developed into large, rather centralized organizations, with an internal capacity tobuild roads at a time when the private contracting industry was stiRl very limited. Provided with arelatively constant flow of revenues generated by earmarked taxes, and with competent civil engineers,the DERs have generally been effective in carrying out the construction programs, although moreattention was put upon physical than economic and financial planning. With the development of theprivate contractor industry, the agencies were no longer involved in the execution of major works, butthey retained control of the road programs. The elimination of earmarked revenues in the 1980s,however, led to a drastic reduction of the programs. At the same time, large po-tions of the statenetworks, which were reaching a critical age, entered into a process of more rapid deterioration. But theDERs, due to their rather centralized organization, the predomiaty engineering background of theirstaff, and also to the insufficient priority given to mantenance at government level, have been adjustigslowly to the more complex tasks of maintaining the networks under their responsibility. In the new stateof Tocantins, responsibility for roads is vested in the Ifastructure Secretariat (SEINF-TO). TheSecretariat's department of road works (DEOVI) carries out the execution functions. Since its creation

- 14-
in 1989, the Govermment of Tocantins has contracted out most of its activities, and has kept governmentstaff to a minimum. This policy has been effective for the engineering and construction of new roads.In order to effectively maintain the road network, however, SEINF-TO needs to build up a minimumplanning and management organization. Annexes 6 to 8 present diagnostics of the organization andmanagement of the three roaa agencies and a description of the measures, including the technicalassistance and training programs, proposed under the project. The following paragraphs summarize theirmost important aspects.
2.19 Highway Planing and Flnandig. Since they were assured of adequate funds, including theirnew construction programs, through earmarked taxes, the DERs have never developed the capacity foreconomic planning which is required to effectively compete with other sectors for general revenueappropriations. Later on, their increased dependence on the general revenues of the states led to increasedGovernment intervention in defining the DERs' prioritides, which also contributed to discouraging theDERs' economic planning efforts. Furthermore, the DERs' professional staff has traditionally consistedalmost exclusively of civil engineers who, when promoted to managerial positions, tended to place moreattention on engineering and execution than on programming, budgeting and monitoring. Although areturn to a system of earmarked tax revenues could be an effective means of ensuring adequate fundingfor the mainteace of road networks, it is un!ikely to be achieved in the short term since it would requirechanges in the recently approved federal and state constitutions. DER-MA, DER-PI and SEINF-TOtherefore need to strengthen their planning capabilities to prepare the states' anmnal and multi-year roadprograms on the basis of appropriate technical and economic criteria, and to seek appropriate fundingcommitments from the governments and other possible financiers. An action program, including technicalassistance and traning of staff, has been included in the proposed project in order to assist the BorrowersIn developing such planning capability and preparing their annual and multi-year road expenditure andfunding programs, and to ensure that appropriate priority will be given to the rehabilitation andmitennce of the networks (para. 3.u).
2.20 MintenanProgramming and Monitoring. The development and monitoring of appropriatenetwork maintenace strategies and pluriannual and anmnal programs have, with the rapid deteriorationof the networks and increased budget constains, become the most critical tasks fiaced by the roadagencies. The planning and programming process, however, in order to be effective, requires adequatehiformation on the condition of the network and on its traffic, and analytical tools to assess and optimizemaintenance and improvement policies and strategies, and to prepare and evaluate rehabilitation andmaint ce projects and programs. The road agencies have some elements of such a planning system,but they should be strengthened and complemented with the missing elements. In particular, roadinventories should be updated more systematically and surface condition data, which are now mostlyqualitaive, should systmatically incorporate roughness measurements. Regular traffic counting programsshould be established or re-stablished. Network information should be organized in a form suitable foranalysis, in appropriate computerzed network data bases. Maintenance policies and programs should beassessed on the basis of appropriate economic criteria and methodologies, and revised accordingly formore efficient resource use. Considering the limitaions of information and experienced planning staff,the agencies will, in the short term, have to rely on simplified methodologies. They should, however,improve the relevant information systems and train their maintenance planning and mangement staff, sothat they can later on make effective use of the HDM ImI methodology. An action program, includingtechnical assistance and training of staff, has been included in the proposed project for these purposes(pam. 3.7).
2.21 Contct and Program Management. The three agencies contract out all their capitalinvestment works, including new construction, paving, rehabilitation and resurfacing works. They alsoconact about 25% to 30% of their routine maintenance activities. The three agencies have appropriate

- 15 -
orgaization for and experience with procurement. Their administrative systems, however, which areinvolved in the management of contracts and in the management and monitoring of the projects andprograms, need to be strengthened. Their centralized organization makes any flow of information acrossorgaizational units difficult and many administative tasks cumbersome. The three agencies haveundertaken programs to streanline their administrative procedures and to computerize some of theiradministrative systems. The above-mentioned action program will also help the road agencies to developand implement, with technical assistance and training of personnel, appropriate computerized contractmanagement and program monitoring systems (paras. 3.7 and 3.9).
2.22 Persomel and Trahing. DER-MA has a staff of about 780, including 70 with university-leveleducation. DER-PI has a staff of about 1,100, including 130 engineers or economists. In Tocandns,SEINF-TO has a staff of 270, including 55 engineers, and DEOVI has a staff of about 1,100, including65 with a university degree (Annexes 6 to 8). With the restrictions imposed on the recruitment andmanagement of government employees, including a number of freezes on hiring, and the insufficientattention given to staff development, the DERs have been unable to maintain a competent staff to carout their changing responsibilities. Although they are newly-created agencies, SEINF-TO and DEOVIface similar problems since many of their senior staff have been transferred from the road agencies ofthe state of Goias. In order to implement the above-mentioned action programs, as well as theenvironmental control action program (see section F below), the agencies will therefore need to train theirprofessional staff and management personnel in the areas of: (a) network mainenance planning andmanagement systems, techniques of pavement diagnosis, design and rehabilitation, and use of theHDM m model; (b) conut maitenance and maintenance administration systems, includingprcrement, management and supervision of contracts, and monitoring of projects and programs; and(c) environmental magement, including environmental cost-benefit analyses and dbsemation of theEnvironmental Guidelines for highways. Appropriate training programs, consisting of a series of courses,seminars and conferences covering the above areas, have been developed by DNER and ABDER, andwill be offered to both DNER and DER personnel. Some of these programs are supported by theongoing Highways Management and Rehabilitation Project (see Annex 7 of SAR Report No. 8308-BR).In the couse of project preparation and on the basis of the above programs, the state road agencies haveprepared satisfactory training plans, which are described in Annex 8. The project will provide assistanceto the Borrowers to implement such training plans (para. 3.9).
F. IjirommLagt
2.23 The Government has established that any major civil works project should be subject to anappropriate environmental impact assessment to measure its effects on the inhabitants and on the naturdenviromnent in the project area. For those investments likely to have negative impacts, finds should beincluded to mitigate any adverse effects. Although the states' highway agencies have, with assistance ofconsultants, prepared environmental impact assessments (MAs) for the upgrading and paving projects, theyhave not yet established the instional capacity to implement the state environmental regulations. Underthe Highways Management and Rehabilitation Project, the Federal Government and DNER have finalizedenviromental standards and guidelines for the transport sector in general and for the highway subsectorin particular; and they are strengthening the institutional capability for monitoring compliance with thesestmdards (Report No. 8308-BR). The project would help the Borrowers to strengthen their road andenvironmental agencies with technical assistance and adequately-trained staff, establish appropriateenvironmental standards and guidelines for the road subsector, revise state specifications for road worksand engineering accordingly, and enforce such environmental standards and specifications (para 3.8).

- 16-
2.24 State of Maranhao. The Secretariat of the Environment and Tourism (SEMATUR) isresponsible for the implementation of the state's recently-established Environmental Protection Code.SEMATUR is preparing, joindy with the Brazilian Geography and Statistics Institute (IBGE) and theMaranhao State University (UEMA), an economic-ecological zoning of the state at the scale of1:1,000,000. This effort should be completed by June 1994, and will constitute an adequate instrumentfor regional environmental impact assessments and control. SEMATUR, however, would have to bestrengthened with appropriate technical assistance, adequately-trained staff, and some control equipmentIn order to effectively carry out its review and control responsibilities. DER-MA has selected the woadssections to be paved in the first year of the project in zones which are already developed, and has, withtechnical assistunce, prepared satisfactory EAs, which are summarized in Annex 13, section B. DER-MAhas also revised the state's norms and specifications for road engineering and works, incorporatingadequate requirements for environmental quality. However, although it will continue to contract out tospeciaized frms all futre EAs, DER-MA needs to establish a small environmental unit, with adequatelytrained staff, which will be responsible to develop state environmental standards and guidelines for roads,define and supervise the work of the consultants, and to supervise the implementation of the guidelinesand mitigatory measures. DER-MA and SEMATUR have prepared technical assistance and training plansfor the above purposes (Annex 9, section E), which will be implemented under the project (para 3.8).
2.25 Stat, of Piaui. The state government recently terminated its Secretariat for Environment,Science, Technology and Urban Development, and transferred the environmental policy, plaming andcontrol fuctions to CEPRO, a foundation under its planning secretariat (SEPLAN). CEPRO and DER-PI, with assistance from consultants, have completed a broad revision of the state's norms andspecifications for road engineering and works, incorporating requirements for environmental quality, andprepared satisfactory EAs for all the improvement and paving investments to be initiated in the first yearof the project. A summary of these EAs is given in Annex 13, section C. They also prepared a planto establish a small environmental unit in DER-PI, to be responsible for defining and supervising thework of the consultants, and for the preparation and monitoring of appropriate state environmentalstandards and guidelines for highways. The plan, which includes a component to strengthen CEPRO'senvironmental planning and review capabilities and a study of a proposed natural, babassu palm reserve(Annex 9, section F), will be Implemented under the project (para 3.8).
2.26 State of Tocantln. The Tocantins Nature Foundation (NATURATINS) is responsible foreironmenal management, including for reviewing EIAs and authorizing investments. The stategovernment's planning unit (ASPLAN) is responsible for preparing, with assistance from IBGE, aneconomic-ecological zoning plan of the state at the scale of 1:1,000,000. However, both ASPLAN andNATURATINS lack experienced personnel and adequate equipment to effectively carry out theirplanning, review and control responsibilities. Both would have to be strengthened with appropriatechnical assistance, equipment and adequately-trained staff. SEINF-TO has selected the roads sectionsto be paved in the first year of the project in zones whk - are already developed, and has preparedsatisfactory EAs (see summaries in Annex 13, section D). SEINF-TO has also prepared and put intoeffect new norms and specifications for road works and engineering, incorporating adequate requirementsfor environmental quality. SEINF-TO, ASPLAN and NATURATINS have also prepared a plan toestablish a small environmental unit in SEINP-TO. This unit would be responsible for defining andsupervising work on EAs, and for preparing and monitoring appropriate environmental standards andguidelines for state roads. The plan, which also includes components to strengthen ASPLAN andNATURATINS planning and review capabilities, and to complete the state economic-ecological zoningby July 31, 1994 (Annex 9, section 0) would be implemented under the project (para 3.8).

- 17 -
G. Finandng the State Boad Pragm
2.27 State of Maranhao. The stats revenues were about US$500 million In 1992. The two mainrevenue sources are the value added tax (1CMS) and federal transfers from the State Participation Fund(FPE). Payments for debt service and for wages have averaged 15% and 40% of net revenuesrespectively. The Government has been allocating about US$75 million (about 15% of total revenues)each year to the road subsector. Since state revenues, considerng the measures being taken to reducetax evasion. are expected to increase at a minimum of 2% p.a. over the next five years, the state willhave adequate capacity to finance the proposed road program, including counterpart funds for theproposed project (Table 6, Annex 1). Regarding road cost recovery, state revenues from the value addedtax imposed on motor-vehicle fuels and road transport services together with those from the motor-vehicleregistration tax, after transfers to municipalities, have reached about US$24 million in 1992. Theserevenues are sufficient to cover the anmal costs of operation, maint ce, and rehabilitation of the statenetwork, as weU as about 50% of the state's total road expenditures (Table 7, Annex 1).
2.28 State of Piauli. The state's revenues were about US$330 million in 1992. Payments for debtservice and for wages have averaged 5% and 50% of net revenues respectively. The Government hasbeen allocating about US$15-25 million (about 5-8% of total revenues) each year to the road subsector.Since revenues are expected to incease at a minimum of 2% p.a. over the next five years, the state wiUlhave adequate capacity to finamce the proposed road program, including its counterpart of the proposedproject (Table 8, Anmex 1). Regading road cost recovery, net revenues from road user taxes, aftertransfers to municipalities, reached about US$11 million in 1992. These revenues are sufficient to coverthe anmnal costs of operation, maitenance, and rehabilitation of the state network, and about 50% of thestate's total road nditu (TCable 9, Annex 1).
2.29 State of Tocanutns. The state's revenues were about US$265 miUlion in 1992, including US$55million from the value added tax (ICMS) and US$160 milion from transfers of the State ParticipationFund (FPE). Payments for wages and other current expenditures have averaged 32% and 19% of totalrevenues respectively. The state has not yet contracted any significant debt. The Government has beenallocating about US$60 million (about 23% of total revenues) each year to the road subsector. Since staterevenues are expected to increase at a minitmm of 3% p.a. over the next five years, the state will haveadequate capacity to finance the road program, including the proposed project (Table 10, Annex 1).Regarding road cost recovery, net revenues from road user uxes, after transfers to municipalities, reachedabout US$11 million equivalent in 1992. With the new ICMS tax rate on motor-vehicle fuels, whichincreased from 17% to 25% at the beinnin of 1993, road user tax revenues are expected to reach aboutUS$16 million in 1993. These revernes will be sufficient to cover the annual costs of operation,maintenance, and rehabilitation of the state network, and about 30% of the state's total anual roadexpenditures ('able 11, Annex 1).
2.30 Under the project, the state goverments would be committed to provide all the funds for theappropriate mainuance of their networks, as well as all the counterpart funds for the rehabilitation andupgading programs (para. 3.14). To ensure appropriate recovery of road costs in the fiture, the stateswould be committed to continue to recover from road users aU the costs of operation, maintenance andrehabilitation of their networls, and, at a minimum, the percentages of their total road expendituresindicated in the above paragraphs for the respective states. Ihe Bank would annually review the states'road expenditre and fnding programs and cost-recovery levels against the agreed targets, and wouldapply appropriate remedies if Borrower performance is not satisfactory (paras. 3.6 and 4.5, item 1).

- 18-
m. TEZBPRECT
A. _rgejtI_dgJnJ)hWtlesindRaonl
3.1 Project Origin. The project's concept originated from the conjunction of two main factors:(a) the broad adminitrative decentralization, which Brazil initiated with the 1988 Constitution, combinedwith the decision to reduce the federal network to interstate highways and to transfer other highways tostate jurisdictions, have increased the importance of the states in the management of the road network;and (b) the experience with the state DERs, gained under the Third Feeder Roads Project (Loan 2224-BR), highlighted the need to allocate adequate priority and resources to the rehabilitation and maintenanceof the state networks and to improve the effectiveness of the road maintenance activities of DERs. Fivestates were initially selected for a first project. Only two of these states (Alagoas and Santa Catarina),however, obtained a federal guarantee for the proposed loans. The first State Highway ManagementProject (Loans no. 3547-BR and 3548-BR), consisting of two subprojects in these two stntes, wasapproved by the Board on December 22, 1992. A nmmber of other states have shown interest and havested preparing simlar projects for financing by the Bank or other financiers such as the IDB. Theproposed project would consist of three similar subprojects in the three states of Maranhao, Piaui, andTocantins.
3.2 Project Objectives. The project aims to check further deterioration of the state road networksand improve their serviceability. To this effect, it would specifically: (a) ensure adequate priority andfunding for the maintenance, rehabilitation and upgrading components of the state road programs;(b) ihiplement appropriate road maitnance, rehabilitation, and upgrading strategies and programs, andImprove the management of maitenan actiities; and (c) develop and improve compliance withenvironmental standards for state roads. The project is also expected to help establish an Institutional andtechnical framework for maintenance, rehabilitation and upgrading of state roads nationwide. Theultimate objective is to contribute to the resumption of economic growth by reducing the cost of transporton the state road networks.
3.3 Ratienale for Bank Involvement. In addition to support for the ongoing financial rehabilitaionof the railroads and the decentralization of the urban rail systems, a key sectoral priority is to assist thefederal and state governments to decentralize and strengthen road administration. Having made 10 loansfor federa highways and three for state feeder roads, the Bank has established a leadership role and isin an excelient position to offer assistance In modernizing the subsectors organization and management.Becase of the breadth of the Institutional measures, the multiplicity of the agencies involved, and thetime span required to implement the reform, effective Bank support requires a series of well-coordinatedroad projects. The Highways Management and Rehabilitation Project (Loan No. 3169-BR) is assistingthe Federal Government in preparing and undertaking the first phase of the decentralization program, i.e.,the transfer of operation and maintenance responsibilities for portions of the federal network to the statesand the reorganization and streamlining of DNER, including the dissemination of appropriate maintenancepolicies and planning methodologies and the monitoring of the ongoing and proposed projects. Theongoing and proposed state projects will assist the state administrations in carrying out their roadmaintenane responsibilities, including those transferred from DNER, and the rehabilitation and upgradingof their most important highways.

- 19-
B. EMect bdr4
3A The project would consist of three similar subprojects in the borrower states, each supported bya separate Bank loan. Each subproject would include: (A) a poUcy and institutional developmentprogram to: (a) prepare and annually update the state's multi-year and annual road expenditure andfimding programs, in accordance with policies and economic criteria satisfactory to the Bank, and,thereby, stengthen the state road agency's planning system; (b) develop and monitor efficientmaintence, rehabilitation and upgrading strategies and programs, and strengthen the agency's contractand project management systems; and (c) develop appropriate capability in the Government to implementand enforce environmental standards and guidelines for sate roads; (B) a rehabilitation andmaintenance program consisting of the rehabilitation, resurfacing, and periodic and routine maintenancecomponents of the state's 1994-98 road program; and (C) an upgrading progam, consisting of thehighest-priority upgrading and paving components of the state's 1994-98 road program. The threesubprojects combined would have a total scope of about 1,550 km for rehabilitation and resurfacing,18,500 km for periodic and routine maintenance, and 2,650 km for upgrading and paving.
(a) Ule and lftional Dvlme
3.5 The policy and institutional development progms would consist of actions specifically designedto achieve the above-mentioned objectives in the respective states. These programs were developed bythe state governments and their road agencies in the course of project preparation. The project wouldprovide the neceary technical assistance and training of road agency staff to effectively implement theseacons. Agreement was reached with each Borrower during loan negotiations on: (a) the objectives ofthe action programs (paras. 3.6-3.9); and (b) an Implementaion Program (IP) detailing the actions to betaken and the related timetable (para. 4.5), with reference to: (c) an Operational Manual (OM),satisfactory to the Bank, establishing the administaive procedures and technical and economic criteriaand methodologies; and (d) the Terms of Reference (OR) for technical assistance and staff training(para. 3.9 and Annexes 7 and 8).
3.6 Preparalow and Review of State Road Prgams, Budgets, and Cost Recovery. Theobjective of this action program is to ensure that appropriate priority is given to the maintenance,rehabilitation and upgrading of existing networks in the states' anmnal and multi-year road programs, andthat recovery of road costs from road users is sadsfactory. For this purpose, the road agencies havedeveloped their 1994-98 road expenditure and funding programs, taking into account: the condition ofthe networks based on available information; a preliminary assessment of the rehabilitation, periodic androutine matenace requirements; budget performance in the past five years; a maintenance strategywhich aims at carrying out, in addition to adequate matn, the needed rehabilitation program overa period of about three to five years; and an upgrading strategy which is consistent with the financialcapabiLties of the states (Annexes 3 to 5). The road agencies would annually update these multi-year andannual road programs to reflect implementtion progress and finding expectations, as weil as theirimproved information and analytical capabilities (para. 3.7), in accordance with policies and economiccriteria satisfctory to the Bank. The project would provide technical assistance and truaining of agencyplanning staff for this purpose (Annexes 7 and 8). The Bank would annually review these programs toensure that the priorities remain adequate. The Bank would also annually review the level of staterevenues from road user charges. The related actions, timetable, and implementation targets includedIn item 1 of the IP (para. 4.5) and in Annexes 15 to 17 were agreed with the respective Borrowers duringloa neoatios.

-20 -
3.7 Design and ImplenentatIon of Maintenance and Upgradlng Stratgies and Progrms. Theobjectives of this action program are to help the road agencies to design and monitor appropriatemaintenance and upgrading strategies and programs, to effectively manage their contracts, and to monitortheir programs. For this purpose, the agencies have defined sets of actions to: carry out regular pavementcondition, traffic, axle-weight and accident surveys; design and monitor network maintenance andupgrading strategies and programs based on appropriate technical and economic analyses; and strengthentheir contract management and project and program implementation monitoring systems. The projectwould provide technical assistance and training of staff for these purposes (Annexes 7 and 8). The relatedactions, timetable, and implementation targets included in item 2 of the IP (para. 4.5) and in Annexes 15to 17 were agreed with the respective Borrowers during loan negotiations.
3.8 Environmental Management. The objective of this action program is to assist the stategovernments and the road agencies to prepare state environmental guidelines for roads, developinstitutional capabilities to carry out appropriate EAs for all their road programs and projects, and toenforce the environmental standards and guidelines for roads. For this purpose, the state governmentsand their agencies have defined sets of actions to: prepare state environmental guidelines for roads,taking into account the environmental guidelines for the road subsector prepared by DNER; to establishor strengthen environmental units in the road agencies with adequately-trained staff to carry out the EAsand to implement the environmeal guidelines; and to strengthen the supervision and enforcementcapabilities of the state enviromental agencies. The project would provide technical assistance andtraining of staff for these purposes, including for carying out of EAs of the proposed road programs(Annex 9). The related actions, tetable, and implementation targets included in item 3 of the IP(para. 4.5) and in Annexes 15 to 17 were agreed with the respective Borrowers during loan negotiations.
3.9 Technical Assistance and Training. In order to implement the above action progranms, the roadagencies have prepared plans to contact technical assistance and to train their relevant personnel. Asummary of these plans, including outline terms of reference for the technical assistance and trainingprograms, are presented respectively in Annexes 7 and 8. Agreement was reached with each Borrowerduring loan negotiations on: (a) the terms of reference for the technical assistance; (b) the training plan;and (c) the preparation, review and implementation of annual triing programs in accordance with theactions, timetable and implementation targets set forth in item 4 of the IP (para. 4.5) and in Annexes 15to 17.
(b) RehablUtaon and Mainteanme Prgram
3.10 The rehabilitation and maintenance progrm would include the r ilitation and resurfacing ofthe paved networks, and the periodic and routine maintenance of both the paved and unpaved networks.In the course of project preparation, he road agencies have developed network maintenance strategieswith the help of the HDM m model. The mintance strategies for the paved networks consist ofcarrying out: (a) resurfacing works on paved sections which would otherwise soon reach a level ofdeterioration requiring extensive rehabilitation, through appropriate slurry seal, surface treatment, orasphalt concrete overlay techniques, depending upon traffic levels; (b) pavement rehabilitation works onsections which have already reached or exceeded their lifetime, through appropriate techniques rangingfrom asphalt concrete overlays to complete reconstruction of pavement; and (c) routine maintenanceworks as needed. The selected maintennce strategies for the unpaved networks consist of carrying out(d) periodic grading and regraveling works, consistent with traffic loads and the quality of materials; and(e) routine maintence works as needed. The specific maintenance and rehabilitation strategies of therepective state agencies are presented in sections B, Annexes 3 to 5.

-21-
3.11 The States intend tocarry out their entire Te 3.1: S of Rb and M ce Cowsones of Subrehabilitation programs over W)a period of about three to five SubwIct RhabUjiig ReAMdAcina MintenaneC MaWnttaOnyears. Assuming that the Paved Unnavedsize of the States' annual road M o ISO 500 2,140 2,820budgets would remain close Piai 368 232 1,560 4,650to past averages, theupgrading and construction Tocantins 150 ISO 1,170 6,140programs have been adjusted Total 668 882 4,870 13,610to reflect these objectives aswell as the maintenancerequirements. The resulting multi-year programs are presented in Annexes 10 to 12, Table 1, andsummarized in Table 3.1 above. The three subprojects combined would have an aggregated scope ofabout 1,550 km for rehabilitation and resurfacing, 4,870 km for routine maintece of paved networks,and 13,610 km for routine and periodic maitence of unpaved networks. It is expected, however, thatdue to the current lack of adequate information on the condition of the networks and insufficient analyticalcapabilities of the agencies, the periodic maintenance programs will not be fully adequate until the actionprograms are Implemented. Consequendy, additional sections will further deteriorate to the point wherethey will need rehabilitation. The maintenance strategies and programs will therefore be reviewed andupdated annually on the basis of the gradually improved information and analytical tools of themaintenance planning systems, implemention progress and updated funding expectations. They will bepresented to the Bank for review as part of the annual updates of the state road programs.
(*c) Upring Dun=
3.12 The scope of the upgradingcomponents of the subprojects have Table 3.: Scu of Umfu Comuoneab of Snbanliectsbeen defined on the basis of the )above-mentioned pluriannual road s_xina IgITlprograms, including the related traffic M - 750 750and economic analyses, and of thefinancial capacity of the state. The ra 4S0 450 900three subprojects combined would Tomn. - 1,000 1,000
have an aggregated scope of about ToW 4S0 2,200 2,650
450 km for improvement of earthroads, and about 2,200 km forpaving. The scope of the individual subprojects is detailed in Annexes 10 to 12, Table 2, and issummarzed in Table 3.2 above. The first-year investmens are presented in Annexes 10 to 12, Table 3.
C. Project Cost and 1nandng
3.13 Ihe total cost of the project is esdmated at US$602.8 million equivalent, including US$209.5million for Maranhao, US$140.9 million for Piaui, and US$252.4 million equivalent for the Tocantinssubprojects. The foreign exchange cost component is esmated at US$241.2 million, or 40%, and thetax component at US$90.0 million, or 15%. The total project cost includes physical contingencies ofUS$37.3 million or about 7% of base cost, and price contingencies of US$23.7 million (or about 4% ofbase cost plus physical contingencies), estimated on the basis of the disbursement schedule and of a 2.8%

- 22 -
annual price escalation for both local andforeign expenditures expressed in US Table 3.3i Esdmate SubFIOct and PMneet Coso and Flacbidollars. Cost estimates for civil works (USS wJion equivalout)are based on average per-kilometer costs j oiwt o Lsupported by engineering estimates and 112.7 7S.2 187.9recent contract prices. Cost esfimatesfor consultant services are based on Pi*I 753 50.2 125.5
prevailing local and foreign man-month Tocantins 137.0 91.4 228.4
rates. The estimated costs of the TetdBa_Cod 325.0 216.8 541.8individual subprojecs are detailed inAnnexes 10 to 12, Table 3, and are PhysIa Coutizg. 22.4 14.9 37.3
summarized in Table 3.3 on this page. Prc Cotg. 14.2 9.5 23.7
Toalx Cost 361.6 241.2 602.83.14 The project would be financedfrom the proposed three Bank loans FWanc-Pb StetC. Du TobJ
totWling US$220.0 million (or 36% of Maranhao 130.5 79.0 209.5
the project cost) and from the respective .i 86.9 54.0 140.9
states' own resources for US$382.8million (or 64% of the project cost). Tocnins 165.4 87.0 2S2.4
The corresponding financing plans of the Totld 382.8 220.0 602.8
subprojects are detailed in Annexes 10 to12, Table 5, respectively, and aresummarized in Table 3.3 above. Agreement was reached with each state govermment during loannegotiatons on: (a) the Borrower's guarantee regarding the necessary subproject counterpart funds; (b)the Federal Governmen's guarantee of the loans to the states; and, in order to permit the implementationof urgent subprojects, on (c) retroactive financing in an amount of not more than 10% of the loan amountfor civil works, goods, and consultant and training exenditures incurred not earlier than July 1, 1993or twelve months before the date of the loan agreement, whichever is later. During negotiations,appropriate jusflcation was given that the Borrowers have provided for adequate budgetary allocationsfor the first year of the respective subprojects.
D. Proect Environmental and Economnc Assessments
3.15 Environmental Assessments. The direct environmental impacts of road works are primarilyrelated to quarries and borrow pits, disposal of used pavement materials and other wastes, and theactivities of road crews. The upgrading and paving components of the project could have indirectenvironmental impacts tmrough increased settlement or intensified land use. In the course of projectpreparation, the road agencies have: (a) revised their norms and specifications for road engineering andworks in order to incorporate appropriate requirements for environmeal quality of the works, and tomake payments to contractors subject to compliance with these requirements; (b) selected the roadsections to be upgraded and/or paved in the first-year of the project in areas which are already developed,or away from any environmentally sensitive areas; and (c) carried out environmental assessments, inaccordance with agreed terms of reference, for all such sections to be improved and/or paved in !he first-year of the project. The Bank has reviewed the revised norms and specifications and the environmentalimpact assessments and has found them satisfactory. A summary of the environmental impact assessmentsof the first-year upgrading and paving programs and of the related mitigation measures is presented inAnnex 13.

- 23 -
3.16 Environmental Management. Ihe revised norms and specifications will be put into effect inthe three states and incorporated into all future contracts for road engineering and works. The state roadagencies will prepare detailed environmental impact assessments, in accordance with the agreed terms ofreference, for all their subsequent upgrading, paving and new construction investments, for submissionto the states' environmental agencies which authorize the investments. Summaries of such assessments,in an agreed format, will be reviewed by the Bank prior to authorizing the financing of the specificinvestments under the project. Agreement on the above measures to strengthen environmentalmnagement was reached with each Borrower during loan negotiations. In addition, under theenvironmental management program, each Borrower will: by April 30, 1994, have strengthened theenvironmental unit of its road agency with two adequately-trained professional staff; by June 30, 1994,have strengthened its environmei.il agency by training staff responsible for the review of EAs and theenforcement of the standards and guidelines; and by July 1, 1994, have prepared environmental guidelinesfor state roads, based on the existing federal guidelines and state environmental standards, and have putthem into effect, including the preparation of appropriate EAs for all its major road projects. The projectwill include technical assistance and training of staff for this purpose (Annex 9).
3.17 Project Benefi-ts. By helping to reduce the deterioration of existing state highway networks andimprove the condition of state roads, the project would: (a) avoid further depletion of valuable capital inpublic roads; and (b) substantially reduce the cost of tansport on state roads, and consequently supportthe resumption of growth in agriculture, industry and exports. It would also contribute to: (c) enhancedaccountability and more efficient use of public resources in the highway subsector; and (d) mitigation ofadverse enviromental impacts of road construction and maintenance.
3.18 Economic Evaluation. An economic analysis has been carried out for the identifiedrehabilitation, resurfacing, upgrading and paving works included in the first-year programs of the threestates, using the HDM m and the recent HDM Manager models. The road characteristics, alteivemaintenance policies and standards, the costs of works and of vehicle operation are presented, togetherwith the results of the analysis, in Annex 14. The estimated economic rate of return (ERR) of theaggregated first-year program is about 29% (25% for the Mamahao subproject, 33% for the Piauisubproject, and 33% for the Tocatins subproject). The individual investments have estimated ERRranging from 13% to 68%. Ihe sensitivity analysis has shown in particular that if the investment costswere to increase by 20%, the estimated ERR for the aggregated first-year program would be reduced to24%. In this case, the estimated ERR of the first-year subprojects would be about 21% in Maranhao,28% in Piaui, and 26% in Tocantins, which would still be very satisfactory.
E. Prolect lBsks
3.19 Possible risks include ineffective management of subprojects by the road aiencies, insufficientprovision of budgetary resources by the states, and inadequate coordination and monitoring of the projectby DNEL To minimize these risks, the experience acuired with the previous highway and feeder roadprojects has been incorporated into the project's design. In particular, the project would provide for:(a) well-defined subproject implementation programs and organitonal arrangements, including thestrengthening of the road agencies' key planming and control systems; and (b) consistent anmual reviewsof the states' road expenditure programs and funding plans at the time of budget preparation. Also,DNER's existing unit responsible for the coordination and monitoring of the project has been strengthenedwith adequate technical assistance and traning under the ongoing Highway Management andRehabilitation Project (Loan no. 3169-BR). In addition, a Mid-Term detailed Review of the subprojectimplementation would be carried out by the end of 1996, and the Bank would apply appropriate remedies,including suspension of disbursements or loan cancellation, if performance is not satisfactory.

- 24 -
IV. PECT ION
A. Institutional Resnonsibilftes
4.1 The State Governments, through their road agencies (DER), would be direcdy responsible forimplementing the respective subprojects, in accordance with: (a) organizational arrangements (section Bbelow); (b) Implementation Programs (section C); (c) procurement arrangements (section D);(d) disbursement, accounting and audit arrangements (section E); and (e) subproject monitoring andreporting arrangements (para. 4.12), for which detailed guidelines are provided in the OM. They wouldenter into separate loan agreements with the Bank, which would specify all the above.
4.2 The Federal Government, in addition to guaanteeing the loans, would, through DNER, providetechnical assistance and training programs to the DERs. DNER would also coordinate and monitor theproject in accordance with: (a) organizational arrangements (section B); and (b) a Supervision andMonitoring Plan (section F). For each loan, the Federal Government would enter into a separateguarante agreement with the Bank. DNER is already committed under the Highways Management andRehabilitation Ptoject (Loan No. 3169-BR) to perform the above functions, including the provision oftechnical assistnce and training to the states. DNER also entered into satisfactory CooperationAgreements with each DER, which specify the responsibilities of DNER in providing such technicalassistance and training programs to the DERs.
B. QM.i,aonal Agn&="
4.3 The DERs have set up appropriate organizational arrangements to carry out the subprojects.Execution responsibilities would be distributed according to the specific organization of each DER (seealso Annex 6). Each DER has established and would mantain an appropriatey staffed ProjectManagement Unit (PMU) headed by a qualified and experienced Project Manager, who would reportdirectly to the DER Director-General (or to the Infrastructure Secretary in the state of Tocantins). EachDER has also established a special task force, with representatives from the various organizational unitsinvolved, to coordinate the preparation of the state road programs. With these arrangements, the DERshave the capabilities to carry out the respective subprojects efficiently. Assurances were obtained duringloan negotiations that each DER would maintain organizational arrangements for subproject executionsatisctory to the Bank, including: (a) a Project Management Unit, with TOR and staffing, and headedby a Project Manager with qualifications and experience, sadsfactory to the Bank; and (b) a special taskforce responsible for coordinating the road programs, with TOR and composition satisfactory to the Bank.
4.4 DNER has, under the Highways Management and Rehabilitation Project (Loan no. 3169-BR),established an organizational unit to assist the DERs in strengthening their maintenance capabilities. Theunit has already assisted the DERs in preparng the proposed subprojects, has prepared the OM, and hashelped to prepare the training programs. DNER has recendy contracted technical assistance to strengthenIts unit for the putpose of carrying out its technical assistance, coordination and monitoring fimctionseffectively. During loan negotiations, the Federal Government and each state government confirmed thatDNER and each DER will comply with their respective obligations under the Cooperation Agreementsfor purpose of provsion by DNER of technical assistance and training to the DERs.

- 25 -
C. mRplfuflumLon rogLaIm
4.5 The State Governments are committed to canying out their subprojects in accordance with thelmplementation Programs (IP) which are presented in Annexes 15 to 17 respectively for the Maranhao,Piaui, and the Tocantins subprojects. The IPs, which are summarized below, were confirmed during loannegotiations.
(A) Policy and Institutional Devlopment Program
1. Preparation and Review of State Road Programs, Budgets and Cost Recovery:
(a) The DER will: prepare annual and multi-year road expenditure and funding programs inaccordance with policies and economic criteria set forth in the OM, satisfactory to the Bank, andwith the annual physical implemenion and fimding targets set forth hereafter, and, by July 31each year, present such programs to the Bank for comments; and thereafter implement the anmnalprograms, taking into account the Bank's comments.
(b) The Borrower will take into account the DER's programs and the Bank's comments in preparingits anmual budget proposals with a view to achieving the mininmm funding targets formaintenance, and the priority funding targets for rehabilitation-resurfacng versus total roadexpenditures, as set forth hereafter.
(c) The Borrower will seek to maintain or adjust road user charges to recover each year, at aminimum, the total costs of operation, maitenance and rehabilitatio of the road network underits jurisdiction, and the percentages of its total road expenditures set forth hereafter.
2. Stthening of Road Planning, Maintenance Management, and Monitoring Systems:
(a) ITe DER wiUl each year: carry out surface condition surveys on its entire network, traffic, axle-weight, and accident surveys; organize these data in a computerized database; review its networkmaance, rhabilitaion, and upgrading policies, staegies and programs on the basis of theresults of these surveys, all in accordance with the procedures, criteria and methodologies setforth in the OM; and reflect the results of these surveys and analyses in the road expenditureprograms to be presened to the Bank anmually as specified in section 1 above.
(b) The DER will contract out the maintenance of an anmally increasing portion of the networkunder its Jurisdiction, in accordance with the annual targets set forth hereafter.
(c) The DER will have established a computerized project management system to plan, monitor andreport on project implemention, and have strengtened it administaive systems for contractmanagement, in accordance with guidelines included in the OM, by April 30, 1994.
3. Strn gf Environmental Management:
(a) The DER will: have strengthened its eonmental unit with two adequately-ained professionalstaff by April 30, 1994; and have prepared enironmentl guidelines for state roads, taking intoaccount the enviromental guidelines prepared by DNER and the state e protectionstandards, and have put them into effect, including the preparation of appropriae EAs for all itsmajor road projects, by July 1, 1994.

- 26 -
(b) The Borrower will have strengthened its environmental agency oy training staff responsible forthe review of EAs and for the enforcement of the state environmental standards and guidelinesby June 30, 1994.
4. Teumical Assistance, Personnel and Training:
(a) The DER, in order to carry out the above action programs efficiently, will, by April 30, 1994,have conthacted one or several consulting firms in accordance with Bank Guideiines for the Useof Consultants (August 1981) and on the basis of terms of reference satisfactory to the Bank.
(b) The Borrower will keep the total number of DER road staff within agreed annually-decreasingtargets.
(c) The DER will prepare, in consultation with DNER, a training program for tle following year byOctober 31 each year, present it to the Bank for comments and/or financing approval and, takinginto account the comments of the Bank, thereafter implement it.
(B) lnvestment ProEm
S. Selection, Preparation and Economic Evaluation of Investments:
(a) The DER will select the road segments to be included in the annual rehabilitation, resurfacing,upgrading and paving programs on the basis of: () the agreed network mainenance andupgrading strategies and pluriannual programs, as periodically updated and refined; and(il) technical and economic criteria and methodologies specified in the OM.
(b) Prior to initiating detailed engineering designs, the DER will prepare and submit to the Bank,with a copy to DNER, draft applications in a form specified in the OM providing informationon each proposed investment in the annual program. The Bank will approve the financing of theengineering designs under the loan on the basis of a review of the draft applications.
(c) After completing detailed engineering designs and prior to contracting the works, the DER willupdate and fnalize the applications as required to reflect the final engineering designs, costestimates, EAs for the upgrading investments and economic evaluation, and present them to theBank, with a copy to DNER. The Bank will approve the financing of the investments under theloan on the basis of the review of the final application forms.
(d) All the investments included in the subprojects would have estimated internal economic rates ofreturn exceeding 12 percent.
6. Preparatlon and Monitoring of Procurement and Ekecution llmeschedules:
(a) The DER will prepare subproject procurement and execution timeschedules as specified in theOperational Manual, consistent with its annual and pluriannua expenditure and funding programs;and, by October 31 of each year, present them to the Bank for comments, with a copy to DNER.

- 27 -
(b) The DER will monitor subproject implementation on the basis of the procurement and executiontimeschedules and inform DNER and the Bank through quarterly progress reports, as specifiedin the OM, and against the agreed implementation indicators and targets set forth hereafter.
7. Monitoring of Road Surface Conditions:
(a) The Borrower will monitor the surface condition of the state road network through regular visualsurveys and roughness measurements made in accordance with the procedures and guidelines setforth in the OM against the network condition targets set forth hereafter, and will present asynthesis of the survey results to the Bank together with the road expenditure programs to bepresented annually as specified in section I above.
4.6 The subproject implementation indicators and targets referred to in para. 4.5 are presented inAnnexes 15 to 17 (Table 1) for the Maranhao, Piaui and Tocantins subprojects, respectively.
D. Procurement Arrangements
4.7 Procurementarrangements are Table 4.1: Procuresuent Method y
summarized in Table 4.1. (Uss million)
r Procuremcnt Method
4.8 All civil works Proiect Elementcontracts estimated to costUS$5.0 million or more Civil Works 189.6 205.0 - 168.8 563.4
would be procured through (94.8) (102.5) (197.3)
International Competitive Equipment - - 2.3 - 2.3
Bidding (ICB) procedures,in accordance with Bank (2.3) (2.3)Guidelines and using Consultants & Traming 1' - - 37.1 - 37.1
relevant standard bidding a20.4' a.n
documents issued by the - - 3 16
Bank. Any modificat-ions Total 189.6 20S.0 39.4 168.8 602.8
to such documents which (Bak financed) (94.8) (102.5) (22.7) - (220.0)
may be necessary would I/ Figures in parentheses are the respective amounts financed by the Bank loanhave to be agreed with the 21 Routin and periodic maintenance works, not Bank-financed.
Bank. Civil works a/ Services contracted in accordance with Bank Guidelines for Use of Consultants
contracts below US$5.0million, up to an aggregate amount of US$205.0 million, would be procured through Local CompetitiveBidding (LCB) procedures, based on standard bidding documents which were reviewed by the appraisalmission and found satisfactory, and which, after approval by the Bank, will be included in the OM. Thevalue of individual civil works contracts is expected to vary between US$0.5 and US$10.0 million (totalcost about US$394.6 million). Miscellaneous road laboratory and office equipment and software wouldbe purchased by shopping on the basis of price quotations from at least three eligible suppliers, when theycannot be packaged in contracts exceeding US$50,000, up to an aggregate amount of US$2.3 million.LCB procedures would be used for contracts for goods exceeding US$50,000 and below US$250,000 inthe event that such contracts are required. Consultants for detailed engineering, construction supervision,technical assistance and training programs would be selected and engaged following Bank Guidelines forthe Use of Consultants (August 1981) and the standard contract issued by the Bank would be used forcomplex, time-based assignments.

- 28 -
4.9 The DERs are the principal implementing agencies, responsible for carrying out the subprojects,including all procurement. The DERs' organization for and experience with procurement were reviewedduring appraisal and found to be satisfactory. The Borrowets' procurement regulations and procedureshave recently been revised through a new procurement law (Law no. 8.666 of June 21, 1993). The newlaw improves a number of procedures, and it specifically authorizes executing agencies to procure goodsand services financed by multilateral institutions in accordance with the norms and procedures of thefinancial institutions. But it also includes several provisions which are or can be interpreted as divergingfrom Bank procurement policy. Special provisions applicable to LCB procedures have therefore beenincorporated in Schedule 4 of the Loan Agreement in order to ensure that the Borrowers will followsatisfactory procurement procedures. All ICB contracts, all LCB contracts for civil works estimated atUS$3.0 million equivalent or more, all contracts for goods estimated at US$250,000 equivalent or more,all contracts with consulting firms estimated at US$100,000 equivalent or more, and all contracts withindividual consultants would be subject to the Bank's prior review of all procurement documentation anddecisions. AU contracts with consulting firms below US$100,000 would be subject to the Bank's priorreview of the terms of reference. These prior-review arrangements would cover contracts totaling about70% of the total cost of Bank-financed works, goods and services. The balance of contracts would besubject to selective ex-post review by the Bank after contract award. Agreement was reached with eachBorrower during loan negotiations on the above procurement arrangements, including the above-mentioned special provisions.
4.10 Within the 50% of cost sharing, net of taxes and duties, the Bank would disburse for: (a) civilworks, at the rate of 50% of total expenditures; (b) equipment, at the rate of 100% of foreignexpenditures and 100% of local expenditures (ex-factory cost, excluding taxes); and (c) consultantservices and staff training at the rates of 50% of local expenditures and 100% of foreign expenditures.The allocations of the proceeds of each loan are shown in Annexes 15 to 17. Based upon experience withsimilar projects and the relevant standard disbursement profile for highway projects, the implementationperiod for the project is estimated at six years. Subproject completion dates would therefore be June 30,1999, and the Closing Dates would be December 31, 1999 for each loan. Estimated loan disbursementschedules are shown in Table 12, Annex 1.
4.11 In order to reduce the interval during which the Borrowers would finance the Bank's share ofsubproject cost with their own resources, the Borrowers would establish Special Accounts (SA) in USdollars in commercial banks to cover local and foreign currency expenditures of the subprojects. TheBank would deposit up to US$4.0 million in the SA for Maranhao and Tocantins, and up to US$3.0million in the SA for Piaui. The Bank would replenish the Special Accounts for the amount ofwithdrawals on account of eligible expenditures at the request of the Borrowers. The Borrowers' DERshave adequate accounting control to enable disbursement to be made on the basis of Statements ofExpenditures. Supporting documentation with respect to expenditures against contracts valued at up toUS$3.0 million equivalent for civil works, US$250,000 equivalent for goods, and US$ 100,000 equivalentfor consulting firm services, would be retained by the DERs, be available for inspection during projectsupervision missions, and be subject to aditng by the DERs' extal auditors. Expenditures forcontracts above these limits and for all contracts with individual consultants would be documented.During loan negotiations, agreement was reached with each state government on: (a) the abovedisbursement arrangements; and (b) the DERs to retain independent auditors, acceptable to the Bank, toaudit their accounts, including the project accounts, financial statements, Special Accounts and Statementsof Expenditures, and to furnish the auditors reports to the Bank not later than six months after the endof each fiscal year.

-29 -
Fr. Monitoring and Supervislon Ehn
4.12 As part of their action programs to strengthen contract management and program monitoring, theDERs would establish an appropriate system to monitor the implementaton of the subprojects5 so as toproduce adequate information to report to DER management and to the Bank, in accordance with thespecifications included in the OM. During negotiations, agreement was reached with each stategovernment that the DER would have established an appropriate project monitoring system byApril 30, 1994. The DER would thereafter prepare and forward to the Bank, with a copy to DNER,quarterly progress reports satisfactory to the Bakn, not later than one month after the end of each quarter.
4.13 DNER would coordinate and monitor the project, and review the following documents:(a) application forms for investments included in the annual rehabilitation, resurfacing, upgrading andpaving programs; (b) snmnsu procurement and execution timeschedules; (c) prcurement documentationfor civil works and equipment; (d) terms of reference, invitaion letters, short-lists and draft contacts forconsujtant services; and (e) DER quarterly progress reports; and would forward comments to the BanlkDNER project staff wouid also participate in the Bawk's supervision missions, and gradually increase theircontribution to the missions' work program.
4.14 The Bank would retain full responsibility for approving all the above documents and rdatedactions by the DERs, taking into account DNER comments. The Bank would supervise and monitor theimplementation of the project, with assistance from DNER, in accordance with the Monitoring andSupervision Plan presented in Annex 18. The estimates of Bank supervision inputs into key acivities,which are shown in the table of this annex, take into consideration the expected support from DNER, aswell as the need for DNER staff training to carry out their tasks.
4.15 The implementation of subprojects will be monitored against the set of actions and timetable, andai the agreed targets for the following implementation indicators, which are set forth in theImplementaion Programs of the respective subprojects in Annexes 15 to 17: (C maintenance qanieseut (patching of potholes, grading and regraveling of gravel and earth roads) and rehabilitation-resurfang and upgrading-paving works procured and executed; (i) funding levels for mainta, andrehabilitation-resufcing over total road funding ratios; (mii) road cost recovery levels in relation tooperation, mainteance and rehabilitation, and to total state road expendi ; (iv) percentage of networklength maintined by private contractors; (v) total number of DER road staff; (vi) training effort measuredby the total mnmber of trainee-weeks; (vi) surface condition of paved network measured by the percentageof network length with an IRI value below an agreed level; and (vii) surfac condition of unpavednetwork measured by the maximum Ill on 80% of the network length.
4.16 Midterm, detailed reviews of the implementation of the subprojects will be carried out by theend of 1996. The reviews will cover all the agreed actions, target dates, asVd implementaion indicatorsincluded in the Implementation Programs, and the status of compliance with all covens of the LoanAgreemen. Partica importanc will be given to: (a) the Borrowers' commitment to provide adequatefunds for maitenance and rehabilitation, and counterpart funds for the subprojects; and (b) the DERs'performance under the agreed m and institutional development programs. The Bank wouldhave the right to exercise appropriate remedies if performance is not satisfactory.

-30-
VI. REACIE AND
5.1 During negiadnas, agreement was reached with the State Governments and/or the FederalGovernment on the following:
(a) preparation and annual review of the state road programs, budgets, and road costrecovery levels, and related policies, criteria, and subproject implementation and cost-recovery targets (paras. 3.6, 4.5 item 1, and Annexes 15 to 17, Table 1);
(b) the DERs to strengthen their planning, maintenance management and monitoring systems,including the carrying out of regular trffic, road condition and accident surveys, and ofanmnal increases in maitenance by contact, and related targets (part. 3.7, 4.5 item 2);
(c) the DERs to strengthen their eironmen units by April 30, 1994, and to prepare andimplement environmeal guidelines for state roads by July 1, 1994, and the Borrowerstrengthen their environmental agencies by June 30, 1994 (paras. 3.8, 4.5 item 3);
(d) the DERs to contract technical assistance, gradually reduce staffing levels, and prepareand Implement annual training programs, and related targets (paras. 3.9, 4.5 item 4);
(e) criteria and methodologies for selection, preparation and economic evaluation of projectinvestments (para. 4.5 item 5);
(t) Borrowers' guantees for counterpart funds, Federal Govenment guarntees for theloans, and retroactive financing arrangements (para. 3.14);
(g) organizational arrangements for subproject execution by DERs (para. 4.3);
(h) DNER and DERs to comply with the terms of the Cooperation Agreements para. 4.4);
(i) Implementation Programs (para. 4.5 and Annexes 15 to 17);
0) procurement arrangements (paras. 4.74.9 and Annexes 15 to 17);
(k) disburset, accoung and audit arrangements (paras. 4.10-4.11); and
OI) monitoring and reporting arrngements, including impl aon targets and mid-termreview of subproject implementation (par. 4.12-4.16 and Anmexes 15 to 17, Table 1).
5.2 There would be no special Conditions of Effectiveness.
5.3 Recommenda: Subject to the above, the project provides a suitable basis for the followingBa*nk loans, with the Guarantee of the Federative Republic of Brazil:
(a) a loan of US$79.0 million to the State of Maranhao;(1b) a loan of US$54.0 million to the State of Piau; and(c) a loan of US$87.0 mfllion to the State of Tocandns.
The tems would be 15 years, including five years of grace, at the Bank's standard variable interest rate.

-31- Annex 1
STATE HWGHWA MANAGEMENT EPROSEC
Annex 1: Suporging Tables and Charts
Iablw ~ ~ ~ ~ ~ b
1.Brazil'sTransptationE Eb pendituresbyMode ... . ....... 322. Brazil's Motor Vehicle Fleet ... . ................ . 333. Brazil's National and Transportation Aggreptes .............. 344. Brazil's StateRoad NetworkChratii ... .............. 35S. Brzil's Road User Charges ... ......... ..... . .......... . 366. Maranhao Stae Finances ....................... . . . o. .. . . 377. Mamnhao State Road Cost Recovery ............................ . 388.PiauiStaeFinances .. .. ........................... . 399. Piaui State Road Cost Rewovery ....................... . 4010. Tocantins State Finances ... . . . .. . . . .............. 41 . 4111. Tocantins State Road Cost Recovery ............................ . 4212. Estimted SchedWes ofDisbursements .................... 43
1. Marmn State Road Departent Oranizaton ..................... . 442. Piaui StateRoad Department Organization . . . . . . .. . . . . 453. Tocantins StateInwfratructure Secretariat Oraiain. ..... 46
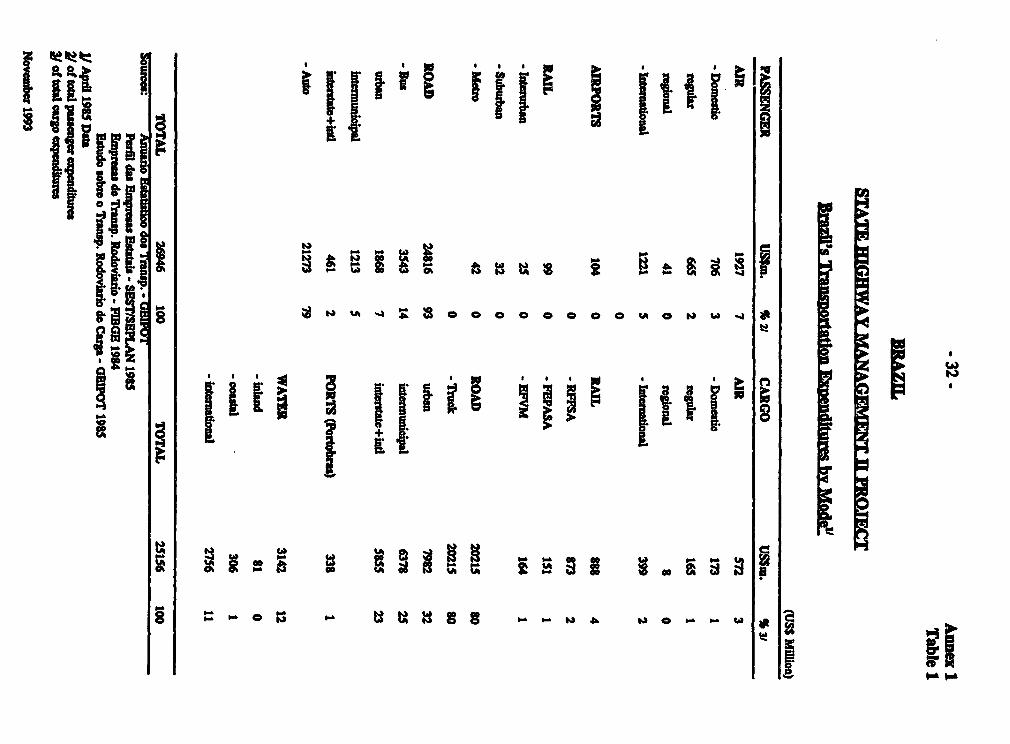
I. Ii {! I Iii II
1 I 1111 2 ai IdEE9t§ f
U I, )"8s Z w0|t
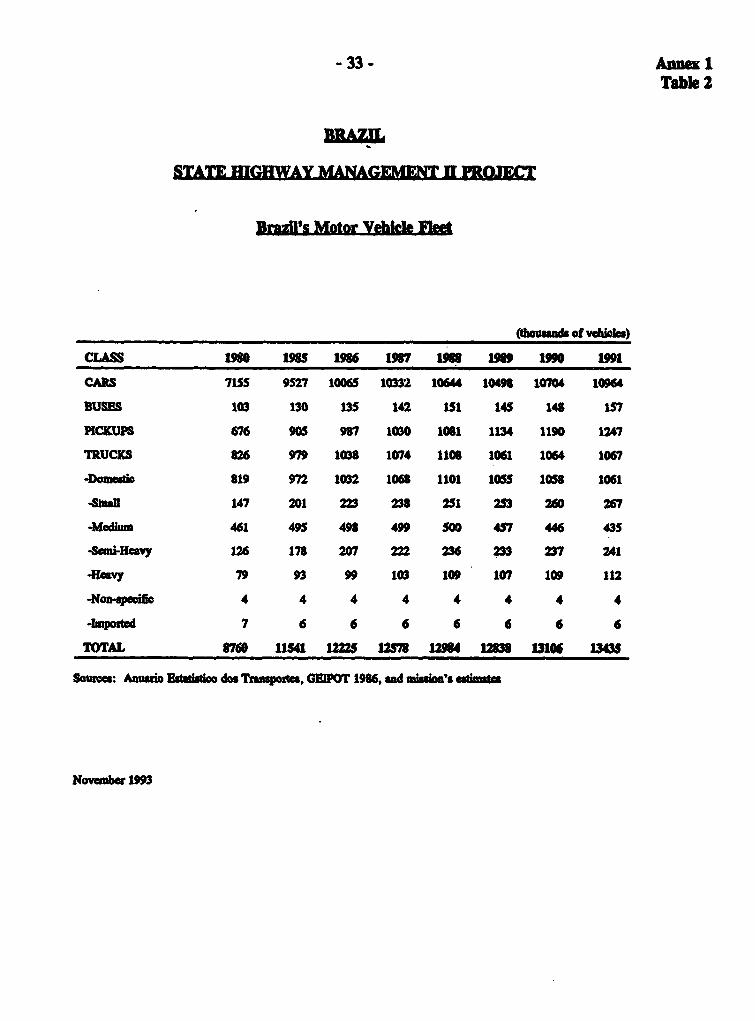
- 33 - A 1Table 2
Brazls Motor Vebce Fleet
(Ihouuad of vebibl)
CLASS 190 19 96 97 198 1 991
CARS 7155 9527 10065 10332 10644 10498 10704 1096
BUSES 103 130 135 142 151 145 143 1i7
PICKUPS 676 905 987 1030 1081 1134 1190 1247
TRUCKS 826 979 1038 1074 1108 1061 1064 1067
-Douxmal 819 972 1032 1068 1101 1055 1058 1061
-Sftn 147 201 223 238 251 253 260 267
-M4dium 461 495 49 499 50 457 446 435
-Seni-Neavy 126 178 207 222 236 233 23 241
-Heavy 79 93 99 103 109 107 109 112
-NonD-Rmaeo 4 4 4 4 4 4 4 4
-mpoxted 7 6 6 6 6 6 6 6
TOTAL 8760 1 12225 12578 19 1 113106 134M
Sources: Amusrio EBtai"Moo dos TrausportesPOT 1986, and imkion' estinm
Noveber 1993
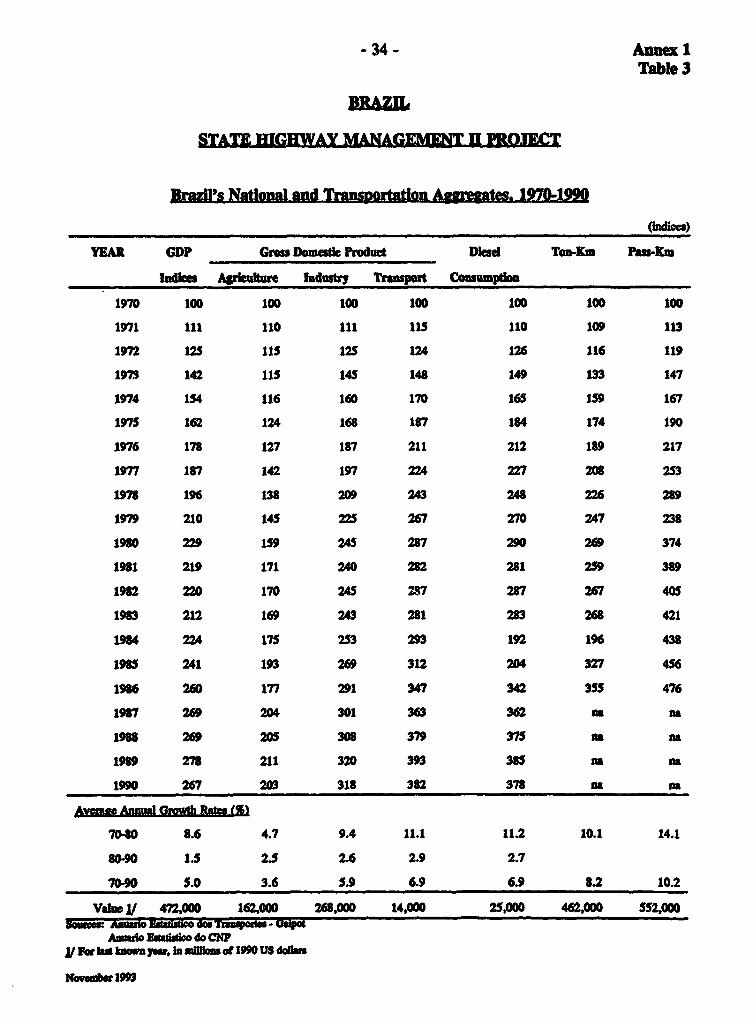
- 34 - Annex 1Table 3
Bral's YapoWa anld tI-SpOfttoD Aggregates 12M0199
(mdioa)
TMAl GDP Gnu DomutiC Product Diens Ton-Km Pus-KM
lnou AJ4be Industry Tnmpost Conumpo
1970 1o0 100 100 100 100 100 100
1971 111 110 111 115 110 109 113
1972 12S 115 125 124 126 116 119
1973 142 115 145 148 149 133 147
1974 154 116 160 170 165 159 167
1975 162 124 168 187 184 174 190
1976 178 127 187 211 212 189 217
1977 187 142 197 224 227 208 2S3
1978 196 138 209 243 248 226 289
1979 210 145 22S 267 270 247 238
1980 229 159 245 287 290 269 374
1981 219 171 240 282 281 2S9 389
1982 220 170 245 287 287 267 40S
1983 212 169 243 281 283 268 421
1984 224 175 253 293 192 196 438
1985 241 193 269 312 204 327 456
1986 260 177 291 347 342 355 476
1987 269 204 301 363 362 no na
1988 269 205 308 379 375 nA na
1989 278 211 320 393 385 oa ns
1990 267 203 318 382 378 as na
A Anu groth Rafts (S)
7040 8.6 4.7 9.4 11.1 11.2 10.1 14.1
80-90 1.5 2.5 2.6 2.9 2.7
70-90 5.0 3.6 5.9 6.9 6.9 8.2 10.2
ValuelJ 472,000 162,000 268,000 14,000 25,000 462,000 52,0005aiu Amai Nvto des -h~o1 - Uspo
Amul Ngadgo do CiNPJV Fat US known ywr, In mum of 1990 usdduM.
Novsama 1993

- 35 -Anne 1Table 4
UBZ
SIMT MIGHIWAY MANAGEMENT aROlEC
Brls Staim Road N1etrk ChaStrIaMtic 11
St Nctw*k (Kn) Am Po p. Weibte ADT Codkltiot*%) of PrvNctwdc
Paved Gave Eath TOa (0W Kmi' (I) Tol Paved Good Fair Poor
Acre 174 174 63 411 152.6 0.4 7 145 52 8 41Amap t10 200 200 500 139.1 0.2 29 104 50 25 25AmaJ _a 384 435 4 823 1559.0 1.8 302 237 75 26 0Pan 2101 3S68 846 6515 1227.5 4.5 123 91 96 3 1Rondonia 96 1340 42 1451 243.0 0.9 126 905 100 0 0Roia 100 900 1000 2000 230.1 0.1 13 0 50 25 25Subtol 2928 6617 2155 11700 3551.3 7.9
Alago 1332 838 503 2673 27.7 2.3 416 583 30 40 30labia 6471 6721 2270 15462 560.0 10.9 322 569 50 30 20caste 3736 4266 173 8175 146.8 6.0 311 453 5 57 38Maran 823 3800 0 4623 324.6 4.8 208 375 67 24 9Parals. 1574 1572 1038 4148 56.4 3.1 234 430 36 44 20Penambuco 2528 1211 480 4219 98.3 6.9 529 719 25 51 24Piaui 1975 5632 348 7955 250.9 2.5 139 228 30 40 30Rio G. Nta 1745 680 851 3276 53.0 2.2 145 190 10 65 25Serge 1320 1472 137 2929 22.0 1.3 277 208 60 27 13Subtoald 21666 25354 6031 53051 1539.6 39.8
Eap. So 1943 1215 1485 4643 45.6 2.3 505 775 80 7 13mainG. 6157 8196 6155 20508 582.6 14.9 798 2114 50 32 18Rio deiataeo 2219 693 2006 4918 43.3 13.0 1299 655 19 74 8S Paulo 17460 795 1132 19387 247.3 30.2 3689 4395 43 41 17Subtol 27779 10899 10778 49456 918.8 60.4
Paa 9117 2177 505 11799 199.1 8.3 177 197 57 32 11Rio 0. Sul 4300 5900 10200 267.5 8.6 1668 3800 62 24 14S. CA&uic& 2630 2639 0 5269 9f.5 4.2 633 893 45 24 31Subtotal 14111 11702 873 26686 562.1 21.1
D. Fedeal 645 91 811 1547 1.6 2255 4519 49 39 13Goin 5030 8190 12677 25902 647.8 4.5 281 817 67 12 21AL Gros 1122 10791 5118 17031 881.0 1.5 81 255 74 22 4ML. Ore. Sul 1723 4965 7514 14202 350.5 1.6 225 498 21 59 20Subtoal 8520 24042 26120 5882 1879.4 9.3
Totalaall 750 78614 45957 199575 8451. 138.5 1623souae: ADDER (Natag), C _ Caftsous (USE110), WQM putbOn)i 1986 Doa fot Alain Seama Cadna Muaa , Pa! ad Tocanta which am 1990 or 1991 datN.q..trgP

-36- Annex 1Table 5
IR&Z
Bragft Road User Char
TAX or CHARGE U TAXBASE RATES REVENUEW BlN ClS
(USS mmiEn) FEDERATON SrATE MUNICIPIOS
1. VAfic w-dom AD novethil 23% S 580 50% 50%(IPVA)
2. Pat itleum Imoit 18% 840 100% - -
S. V!u hd T(ICMS) * Interstate/ 17% 340 - 75% 25%
Intermunicipal
* alool, descl, 17%0 2,600 75% 25%
4. Sake gaolin, ad ablol 3% 300 - - 100%lVC) (diso awmpd
Muncipal tax onoalcho and pasolico
S. vehicleon specifi 140 60% 40%
- Totalnnud Reveues 4,800 920 2,550 1,330(IJSS milon)
- Annual Network 3,000 900 1,400 700O p o r a t i o a ,Maintenance andRe_MhU CuatC
- Revenu/Expenditur 1.6 1.0 1.8 1.9
u.:GEmpr am mimon animats
m Ras v h tgpe ofthides amd smes.
p1 Some A" tshaelcsdsthl se n to5%.
Octob0 1M

-37 Anne 1Table 6
STAID}lGlWAt ANAGEI II IIOJC
M Sbt nls
aetual -- projectedCat_ n. no 9 1V90 991 1992 13 1994 1995 1996 1997 1998
ICMS 119 170 202 195 173 178 184 189 195 201 207Currat Tanh rs (FM 336 370 42S 386 336 350 361 368 375 383 390B Qoowing 91 35 2 1 18 20 20 10 10Capital Tlnser 22 4 14OdIR.enau 5 4 5 6 5 5 5 5 5 5 6
Total Rowus 573 583 634 602 514 533 567 582 595 599 612
Patersoa 115 174 170 163 154 156 157 159 160 162 163DebtService 24 43 50 48 54 55 56 57 58 59 60CUnan TrInsf6ts 58 81 50 130 16 140 143 146 149 152 155Otir Crate Evsa& 16 17 22 60 36 30 30 31 31 31 32Aboit 213 315 292 401 380 381 386 392 398 404 410kveatment.RQQca 57 90 15 33 75 35 44 47 47 47 45.Otbsrlnvesatmas 213 143 150 91 33 88 107 113 120 118 127sumtdotiawna nnts 270 233 165 124 108 13 151 160 167 165 m
Amort of Deft 36 25 29 18 23 25 25 25 25 25 25Caplal Transtfa 11 44 9 3 3 4 5 5 5 s 5Abtotld 317 302 203 145 134 152 181 190 197 195 202
Totd EbamndEbu 530 617 495 546 514 533 567 582 595 599 612
lwRWUNCE DMDC&TOUB. Gmss Domestic Prods 4820 5010 5197 5296 5300 5400 5508 5618 5731 584S 5962
ROAJD EXPEND1Dr PROGRAMa a peretvag. oh.PabbEc blodlatmst 21 39 9 27 t9 28 29 29 28 28 26.Totu Exielftuma 11 15 3 6 15 7 8 8 8 8 7
Sou:tm SsWaa da FaP ads do EB do d amsba and Mission NalmAas
Novembe 1993

-38 - Annea 1Table 7
STATE HIGHWAY MANAG3MENT U PROJECT
M a.nbso State Rod Cost da m)
actual 41. p-rojget odCMIu 3988 133 93 1491 3992 393 394 39639 397 1998
SIA7E REVNIJW ROM USER CHARGES1018 trmpoit 0.4 4.2 5.0 6.5 6.0 6.1 6.2 6.4 6.5 6.6101 fad 5.1 17.2 22.0 23.0 23.0 30.0 30.6 31.2 31.8 32.5IPVA 1.7 1.4 1.4 2.9 3.6 4.0 4.1 4.2 4.2 4.3 4.4Subtl 1.7 6.9 22.8 29.9 33.1 33.0 40.2 41.0 41.8 42.7 43.5
TMO$fm toM maijuMmll 0.9 2.1 6.1 8.2 9.2 93 11.1 113 11.5 11.7 12.0SubtotaL nct*ler 0.9 4.8 16.8 21.7 23.9 23.8 29.1 29.7 30.3 30.9 31.5
STATROADD Dropem" & Mebu m i5.1 7.9 5.2 8.1 6.9 8.4 9.3 9.9 10.8 11.6 12.5
RebabOdim & ResoficinS 3.0 18.0 4.0 10.2 7.9 7.9 4.5 2.3Ipov & Pavng u d.rPw oect 5.0 18.0 24.0 24.0 12.0 7.0Jmpmt & Paing out c Pjt 48.0 77.9 7.2 6.5 51.7 10.2 15.0 20.0Now Cauioo (imd CODEMA) 1.1 4.5 2.8 20.0 20.0 15.0 15.0 15.0 15.0 15.0
Toal Epmd_zs 57.2 90.3 15.2 32.6 82.6 43.6 52.5 56.8 57.7 58.1 56.8
ROAD NU RA CHGESa apeftatagoofX0OA M &h Rabihao 10 61 322 83 219 283 149 167 162 192 213.Totald _za "db 1 5 110 67 29 54 55 52 53 53 56
REff3 MINDCATOIISP-puhtion(*Awani) 2! 4611 4715 4821 4929 502S 5128 5231 5335 5442 5551 5662ODP (US$ilu* 31 4820 5010 5197 5296 5500 5712 5933 6162 6400 6647 6903ercqpI -Pn (USS) 1045 1063 1078 1074 1094 1114 1134 1155 1176 1197 1219
Pua Cowngdas (md5o 1gm) 41.uono - 59.2 79A 85.5 88.4 91.1 93.8 96.6 99.5 102.5 105.6sloobhol 89.9 107.0 83.9 110.3 113.6 117.0 120.5 124.1 127.9 131.7d.deo - 711.5 702.8 723.1 676.5 696.8 717.7 739.2 761.4 784.2 807.8
V&ioPl.Fed (thuad) 1/cm - - - - 77.1 79.0 81.0 83.0 85.1 87.2 89.4bum- - - - 2.7 2.8 2.8 2.9 3.0 3.1 3.1.l _o - - - 15.9 163 16.7 17.1 17.6 18.0 18.4medium -u* - - - 13.2 13.5 13.9 14.2 14.6 14.9 15.3
.Uok&ua - -- - 0.7 0.7 0.7 0.8 0.8 0.8 0.8t - - - - 109.6 112.3 118.0 121.0 124.0 127.1
Soau.: logoad da FmmP ado Nado do MmabaoSerots doeonfia.Bows d Wo 4* MmbhoMion BaE_t
11 25% of IlJ tviu sad 50% of IPVA 21 b o 1991 om= by IRM an 2.2% pa. _nra.meftw.31 bud on 1988" -e, 2.0% p.a in _a& after.41 baud an 89-1992 eidm. sud 3% p.s _Ibno amtor.5/ banud omambof ovolhlogbmd su in 1992 d 2.5% p.. i teesa.
Novebw 1993

-39- Annex 1Table 8
BRLA
STATE E Q flIMM A RQ Q[
,m)
actual -a- projoctoedCgao _m US1 155 1U1 151 1992 199 1994 1595 196 1997 V9S
mCmS 49 72 125 112 94 97 100 103 106 109 112Coumn TrowfnraP(FM 76 110 220 165 159 165 170 173 177 180 184DOnroWinlp 11 18 1 10 15 1S 15 10Caitu1 Trmaua& 43 18 9 28 16 IS 15 16 16 17 17OthermnR nam 35 60 34 S7 65 55 56 57 58 60 61
Totd RIwomas 214 278 389 362 334 332 351 364 372 381 384
Personnel 89 126 192 146 121 122 123 125 126 127 128DebtSonvic 11 2 8 IS 8 10 10 11 11 12 12Cusred Trmubza 50 62 43 105 78 80 82 S3 85 87 88OtherCurret ERpNA 7 43 48 28 41 30 -30 31 31 31 32
aibtota 157 233 291 294 248 242 246 249 253 257 260
.Roda 13 17 20 23 20 20 21 26 28 23 20
.adUAtion 10 4 2 14 5 8 9 10 10 11 11
.Halth 4 8 11 9 2 8 9 9 10 10 It
.Otw brJvatnead 12 6 42 11 29 44 51 55 56 65 67Abta iwA_mant 39 35 75 57 56 80 90 100 104 109 109
Amogt.ofDebt 4 1 1 10 10 10 10 10CapitaTrau a 14 9 23 10 30 10 5 5 S 5 5
subtotal 57 45 98 68 86 90 105 ItS 119 124 124Total Ez_ ndur__ 214 278 389 362 334 332 351 364 372 381
REFERENCE DDICATOR* Population (million) 2.1 2.1 22 22 22 2.3 2.3 2.4 2.4 2.5 2.5. Gr Domei Ptoduct 2034 2191 2116 2222 2336 2406 2478 2553 2629 2708 2789. Per Capita GDP (US$) 982 1037 981 1010 1041 1051 1061 1072 1082 1093 1104
ROAD EXPENDnX)RE PROGIAMm a perentp of.Public nwvetma 33 49 27 40 36 25 23 26 27 21 18.TotblEpenS " 6 6 5 6 6 6 6 7 8 6 5
Sourc: Saretaia da Fau do Ebbadb do PhA and Miasion Estimta
Novembet 193
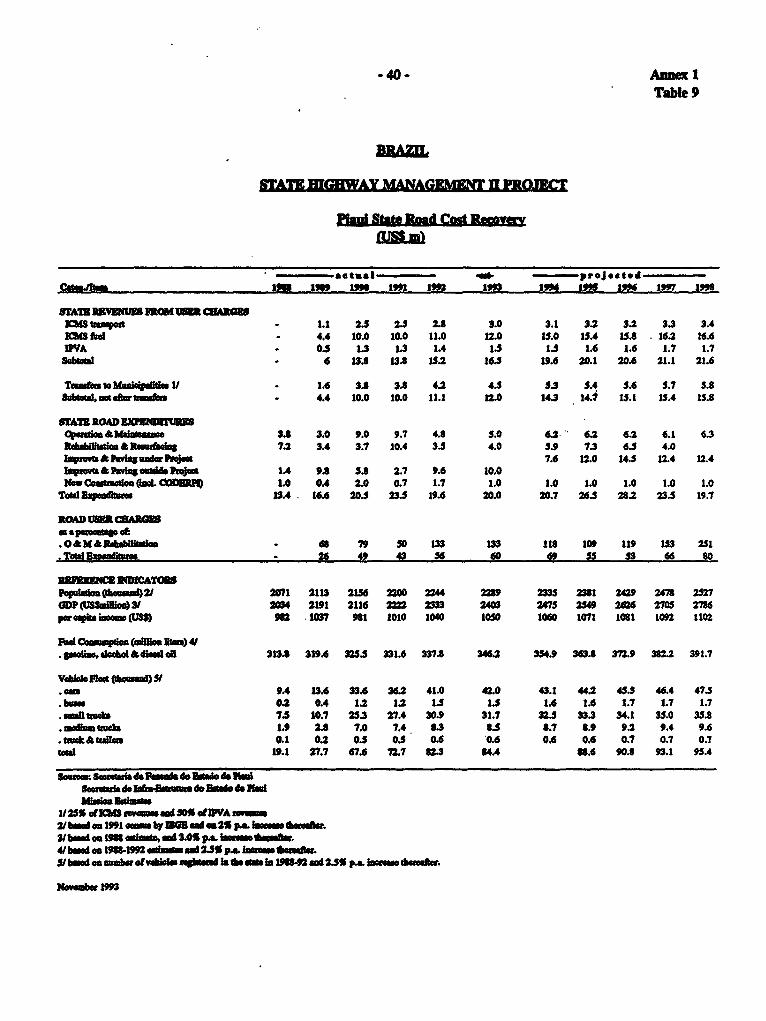
-40- Annex 1Table 9
(US ml
-a. tue -1. -_ projeeted,Cd_tjhm _ 19a 19m 1"a am I90 am gm am 19m7 I"m
STATE UYWW uROSI 83MMAgS ttaWat - 1.1 2. 2.3 2.8 3.0 3.1 3.2 3.2 3.3 3.4JX48 -a 4.4 10.0 10.0 11.0 12.0 1U.0 15.4 15.8 16.2 16.6IPVA 03 1.3 1.3 1.4 1i lj 1.6 1.6 1.7 1.7Sd o 6 12.8 13.8 15.2 16. 19.6 20.1 20.6 21.1 21.6
TS N t_Vto 1.6 38 3. 4.2 4 3 5.4. .6 5.7 3.8S_b,otdErt al=, 4.4 10.0 10.0 11.1 12.0 143 14. 15.1 15.4 15.1
STAIX R QLD _IRNE(pwa6 &malea.i3 3.8 50 9.0 9.7 4.8 5.0 6Z 6 6.2 62 6.1 6.3RbilIsatiou A R&3A gh 7.2 3.4 3.7 10.4 33 4.0 5.9 7.3 6d 4.01pO a PWt vaUUuIVti_ 7.6 120 14.3 12.4 12.4IPosaM.?a.jssa 1.4 9. 5.8 2.7 9.6 10.0NCow VUu.zo=L( oD 1.0 0.4 2.0 0.7 1.7 1.0 1.0 1.0 1.0 1.0 1.0
ToeBd_aiatu 1.4 16.6 20. 235 19.6 20.0 20.7 26. 2812 23.5 19.7
mt- epawatap.,O&MRuhblll a s 79 so 133 133 1 109 119 n3 251. TotIa um- 26 49 43 56 a0 69 53 S3 66 S0
opi"mo(tm=421 2071 2113 216 2200 2244 2289 233 2381 249 2478 2527GDP (S8mUSh*3 2034 2191 2116 2222 2333 2403 2475 2549 2626 2705 2786VW capi _ wio M 982 1037 981 1010 1040 1050 1060 1071 LO8 1092 t1O0
Plad C.ungdo mMious rime) 41. m1Imeoddo l" &adan 313* 3196 325.5 331.6 337*1 346.2 334.9 363W 3.9 382.2 391.7
.am 9.4 13. 33A 36.2 41.0 42. 43.1 44.2 43.3 46.4 47<
.bu_ 0.2 0.4 12 12 1.3 1. 1.6 1.6 1.7 1.7 1.7.WA _M b 7.5 10.7 2S.3 27.4 30.9 31.7 32.5 333 34.1 35.0 35.8.aAn uuob 1.9 2.8 7.0 7.4 . 83 Si 8.7 8.9 9.2 9.4 9.6.ttek&ttaIt 0.1 0.2 03 0. 0.6 0.6 0.6 0.6 0.7 0.7 0.7mal 19.1 27.7 676 77 3 4.4 88.6 90.8 93.1 95
saiasm So ew s d FPus de Mado,de.U3.A
1/28% dIW8 tw= ad 50% ePVA _ 2t_ea on1991 cme E3 6 2% p.a. h huwM.
4 tbM ea 1984M92 madim .2.% p.4. h__sat.313usod as aamb.rofv I _ inaqIiuui ht,amgh 196892aud2J% p... jam.. thmd *wt.
NSb 1993

-41- Annex 1Table 10
TeceinsState Finances(USS m)
S ae- projected-,c 989 1990 13 1994 96 997 19"
ICmS 41 53 54 55 59 62 65 68. 73 77}PE 99 186 157 161 1170 178 187 198 209 223Cuiroai TgansfeBorrowings 12 23 40 20 16 8 9Capital TransfesOther Reenues 61 36 44 37 102 101 113 119 126 135
To' Revenues 201 275 255 265 354 387 385 401 416 444
Persulnd 62 69 115 85 87 91 96 101 107 114Debt ServcCOrrent TransfesOthrCmuneat BpRnd. 30 46 56 49 59 62 65 69 73 78
suboal 92 115 171 134 146 154 161 170 180 192
,Roa&d 47 61 60 90 110 93 93 90 96.Dduca±on 5 3 9 12 13 13 14 IS 16.Health Warar 3 10 18 28 29 31 32 34 37.O therlnvestea 117 142 43 43 78 82 86 91 97 103AmortL of DebtCapital Transfr
subowl 117 197 117 130 208 234 223 231 236 2S2Total Expenditaes 209 312 288 264 354 387 385 401 416 444
REFERENCE INDICATORS. GDP(US$tm) 990 1032 1079 1123 1174 1227 1283 1342 1403
ROAD EXPENDITIJER PROGRAMs a peroenago of:
.PubioInvoestmeus 0 24 52 46 43 47 42 40 38 38
.Totd Elxpenwnlrs 0 i5 21 23 25 28 24 23 22 22
Sources: Seosrauia do, F-eando do 1stao do Tocanutns and Mision EtimtKes
November 1993

- 42 - Anex ID1RAZtr Table 11
Teamns SateRoad Cost Rcvr(m)m
- actual l fft- projectedcCa*tteaItn 19 1990 1991 1992 1993 1994 1995 1996 _1997 199
WMS tranpot 1.7 2.8 2.3 1.8 2.1 2.2 2.3 2.4 2.6 2.7ICMS fued *.1 6.5 4.5 12.2 19.0 20.0 20.9 22.0 23.1 24.2IWVA 02 0.2 0.4 0.6 0.8 1.0 1.1 1.1 1.2 1.2BmviOther revnues
Toad Revenues 6.0 9.4 7.2 14.6 21.9 23.2 24.3 25.5 26.8 28.1
opeatic&MAalaeanc 9.8 11.7 14.6 14.3 15.4 16.1 17.0 17.4RelbitWon & Rsmf. 1.2 1.2 2.0 1.4 0.2
4ravts & Phvin undw rojet 25.6 38.4 25.6 25.6 12.8kwofuts &N g out"ide proet 40.0 53.8 52.7 22.0 13.9 10.0 10.0 20.0 25.0New Consaructin 7.0 7.0 7.5 8.0 8.0 8.0 8.0 8.0 8.0
Tota xpenditue 0.0 47.0 70.6 71.9 44.6 63.0 73.0 61.7 72.0 63.4
ROAD USEt CHARGESa,s apeoet of 0.OM & M & Relzablta 73 125 150 149 146 141 146 160
_Ts Em,endkure 20 10 20 49 37 33 41 37 44
_R la5WR lNDICTlORSPopuktion (thousnd) I 880 900 920 943 962 981 1001 1021 1041 1062pw wapit income 2 1100 1122 1144 1167 197 1226 1257 1289 1321CDP(US$M.) 990 1032 1079 1123 1174 1227 1283 1342 1403
stae Fuel Cou ton (million ltes¢) 3/. soloIn 17.5 18.4 19.3 20.3 21.3 22.3 23.5 24.6 25.9sloohod 25.8 27.1 28.4 29.9 31.4 32.9 34.6 36.3 38.1
.ddisd oil 214.0 224.7 235.9 247.7 260.1 273.1 286.8 301.1 316.2
sta Veicle 9est 4/.acrs 9.5 11.0 11.6 12.1 12.7 13.4 14.0 14.7b.nes 0.2 0.3 0.3 0.3 0.3 0.3 0.3 0.4smin trucks 6.2 7.2 7.6 7.9 8.3 8.8 9.2 9.6mnedium uncs 1.6 1.8 1.9 2.0 2.1 2.2 2.3 2.4.UQok &tbNles 0.2 0.2 0.2 0.2 0.2 0.2 0.3 0.3
totd 17.7 20.5 21.5 22.6 23.7 24.9 26.1 27.4
Souce.: Seeets de Pmzmad do BAtdo de TooentiSeeoreti de Im-Nsltm do Ntdo de ToceatiuMibion Esltha
1 based on 1991 census by MM end on 2.5% pa. buenes.2/ sd on 1991 estma, 2.01% p.a bIe up to 1993, and 2.4% pa. thtafte.3/ based On 1990 estmat end 5% p.a hue.41 mnubw ofvei regstee in e. eItimated at only 15% of vehicles aperfaed In te stte.
November 1993

-43- Annex ITabb 12
UAT NIGHWAY MAAD I R
M,an Disbursetment Schedules
Buk F*a Year Quwy Quay QatadydQiazt Nad_ DiubL =W.Dbbu D DiuLCma
(w MSSm) s (US$M) (USSm s (SSn (USSU s
March31, 1994 5.u 5. 7 4.0v 4.0 7 S.si 5.5 6Js=30, 1994 1.5 7.0 9 1.0 5.0 9 15 7.0 a
Spmber30,1994 1.5 8.5 11 1.0 6.0 11 3.0 10.0 11Dewmnber3,11994 2.S 11.0 14 1.0 7.0 13 3.0 13.0 ISmIrch31, 1995 2S 13.5 17 2.0 9.0 17 3.0 16.0 18lun.30, 199S 2.S 16.0 20 2.0 11.0 20 3.0 19.0 22
FH "6Septrmber30, 1995 4.0 20.0 2S 2.0 13.0 24 4.0 23.0 26DembSert31, 1995 4.0 24.0 30 3.0 16.0 30 4.0 27.0 31Marh 31,1996 4.0 28.0 35 3.0 19.0 35 4.0 31.0 36Jun. 30,1996 4.0 32.0 41 2.0 21.0 39 4.0 35.0 40
p19g7Sepember30, 1996 4.0 36.0 46 3.0 24.0 44 S.0 40.0 46December31,1996 4.0 40.0 S1 3.0 27.0 S0 5.0 45.0 52Mrch 31, 1997 4.0 44.0 S6 3.0 30.0 56 5.0 50.0 S7June 30, 1997 4.0 48.0 61 3.0 33.0 61 S.0 55.0 63
ix 1mSeptember30,1997 4.0 52.0 66 3.0 36.0 67 4.0 59.0 68Dwember31,1997 4.0 56.0 71 3.0 39.0 72 4.0 63.0 72Maurh 31, 198 4.0 60.0 76 3.0 42.0 78 4.0 67.0 77Jun.30, 1998 4.0 64.0 81 3.0 45.0 83 4.0 71.0 82
September30, 1998 4.0 68.0 8S 3.0 48.0 89 4.0 75.0 86December31, 1998 4.0 72.0 90 2.0 50.0 93 4.0 79.0 91March 31, 1999 4.0 76.0 96 2.0 52.0 96 4.0 83.0 95Jun 30,1999 3.0 79.0 100 2.0 54.0 100 4.0 87.0 100
3VDn- hosah Ndinma1/ DesI io Special Acou
F*brcny 1994

-44- An=ex 1Chart 1
BRAZILSTATE HIGHWAY MANAGEMENT 11 PROJECTMaranho State Road Department Organization
Road Council
AdministrativeCoundl
Director-General
DIRECTORATES
Works operations Planning Administtion
DMSIONS
Jure 1M9
k9*00W4192C

-45 - A 1Chart 2
BRAZILSTATE HIGHWAY MANAGEMENT 11 PROJECT
Piaui State Road Department Organization
Administrative Coundl |(CAD)
Director-Genral |(OGE)
Cabinet Deputy DlrectorGeneral(OGA)
Assistant
RodTrinal BiddingL PJU) of Teresina (GEL)
DIRECTORATES
Administrative Plans & Engieeng | Maitenance& Finance I Prgram construcLon Mant
DIVSIONS
Resourm Budget & Constucon Maintenance Maintenance(ORM) (DFO) (DPR) (DPC) (OCR) (OME)
June Nuc1qs k 92
June 18m3 ksr/c4/w54192a

46- Annex 1Chart 3
BRAZIL
STATE HIGHWAY MANAGEMENT If PROJECT
Tocantins State infrastructure Secretariat Organization
SEINF
Infrastructure Secretary of State - - - -- - -- -
GASAC . _ COTRA IASTEP [TrafficCouncil|
DEPARTMENTS
DEOVI DEOCI DETME DESAF
Telecom, AdministrationRoad Works Civil Workes Mines & Energy & Finance
COESP COCON COOPE| COTRE
Studies & Constrction Operations TransportEngineering C
DIREG
RegionalDirectorates
REROD
RoadResidencies
DIVISIONS _
DIEST DIPROIMEC DITRA
H | ~~~Engineedn Supervision ~~~s~~~~~ndg &Cn
DIMPA DIART DIAMU I
I Construction | Bridges & Support to( UPaving Structures Municipos
June 1993 kCSdlw41M928

- 47 - Annex 2
S!ATE HIGWAY MANAGEMNM H PROJECT
Refonal 13coomic Deselopmet Prospcsh
A. Inhadn
1. The neighboring states of Tocantins, Maranhao and Piaui form a homogeneous sub-region of anarea of about 865,000 kIm2, lying in the Northeast and Center-West regions of Brazil (Map No.23773Rl). It is a zone of transition between the semi-arid usertao" of the Northeast to the east, thehumid low plains of easten Amazonia to the west, and the high plains of the "cerrados- to the south.Their environment consist primarily of. cerrado, or open pasture with bnrsh vegetation, in virtually allof the state of Tocandns, southern Maranhao and southwestern Piaui; caaflnga, or brush land, insoutheasten and north central Piaui; an environmentally stressed area of pre-Amazon forest, in thewestern parts of Maranhao and Tocantins, in the Araguaia River valley; and palm tree areas, primarilybabassu palm, which appears throughout northeastern Maranhao and northern Piaui.
2. The three states are among the lowest-income states, and their infrastructure, particularly roads,are among the least developed in the country. Their development prospects, however, are veryenorgi. The combinion of a number of factors, including new soya varieties well suited to thesubregion's climatic and soil conditions (cerrados), and investments for grain exports recenty made inthe Northem corridor, are turning the subregion's grain production very competitive in the inteationalmarkets. 'he poor standards and condition of the roads in the production areas and in the corridorsleading to the railway or to local and regional consumer centers, however, remain an important deterrentto more itensive private investment in agriculture and to the development of the region. The poorcondion of the road network also limits access to basic services such as education and health, resultingi illkeracy, malmtriion and high iant mortality, which are widespread in rural areas.
B. Tbe NordhMl CorddIoL& l4stlI
3. The Northern Corridor presetly consists of: (a) the Carajas Railway, built and operated byCVRD, which links the Carajas iron ore mines in the state of Para to the Port of Ponta da Madeira, nearSao Luis (K4 km); (b) the Acailandia-Inperatri railway section in the state of Maranhao, recently bufltby the federad government as a first section of the North-South railway project, which is now operatedby CVRD as a branch-line to the Carajas railway (the rail distance between Imperatriz and Ponta daMadeir is about 600 kn); (c) a grain transfer tminal at the railhead of Imperatriz, which consists ofa transfer s!lo, truck unloading facilities, and a wagon loading facility of a 120 ton/hour capacity, whichwas recently built and is operated by CVRD; and (d) the port terminal of Ponta da Madeira, which hasa loading pier accessible to ships of up to 365,000 deadweight tons (dwt) (or 23 m draft), a shiploadingf1cility of 16,000 ton/h for iron ore, and a second pier under construction. CVRD recendy built a grainsflo of a 22,000-on static capacity which is connected to the shiploader which delivers about 1,500 tonlhof soybeans.
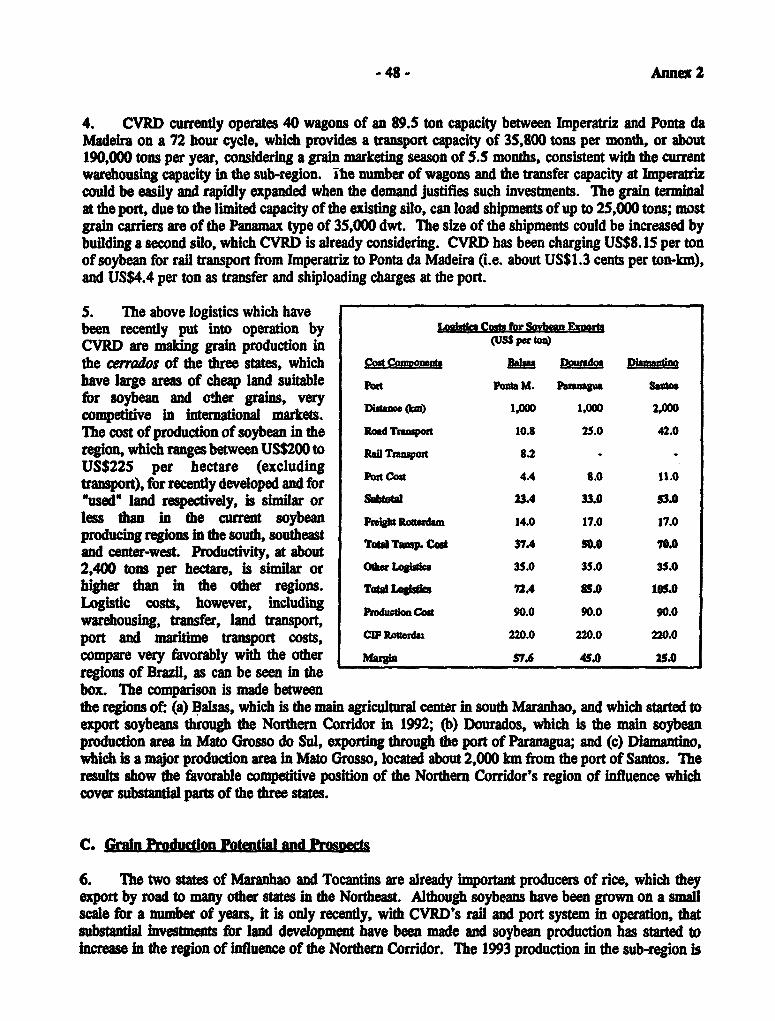
- 48- Annex 2
4. CVRD currendy operates 40 wagons of an 89.5 ton capacity between knperatriz and Ponta daMadeira on a 72 hour cycle, which provides a transport capacity of 35,800 tons per month, or about190,000 tons per year, considering a grain marketing season of 5.5 months, consistent with the currentwarehousing capacity in the sub-region. ise mumber of wagons and the transfer capacity at Imperatrizcould be easily and rapidly expanded when the demand justifies such investments. The grain terminalat the port, due to the limited capacity of the existing silo, can load shipments of up to 25,000 tons; mostgrdn carriers are of the Panamax type of 35,000 dwt. The size of the shipments could be increased bybuilding a second silo, which CVRD is already considering. CVRD has been charging US$8. 15 per tonof soybean for rail transport from Imperatriz to Ponta da Madeira (i.e. about US$1.3 cents per ton-kn),and US$4.4 per ton as transfer and shiploading charges at the port.
5. The above logistics which havebeen recendy put into operation by Lot Cosb tow Soyben ExrCVRD are making grain production in (US pr ton)the cerrados of the three states, which cm Bg Dwd D _auhave large areas of cheap land suitable Pw M. sasofor soybean and other grains, very Dq.. wm2competitive in inteional markets. 1,000 1,000 2,00The cost of production of soybean in the Road Taoit 10.8 25.0 42.0
region, which ranges between US$200 to Ran Tqt 8.2 - -
US$225 per hectare (excludingaport), for recenty developed and for Pz C. 4A 8.0 11.0used' land respectively, is similar or Subot 23.4 33.0 S3.0
less than in the current soybean FWh Rt dm 14.0 17.0 17.0producing regions in the south, southeast Tot Tamp. Codtand ceter-west Productivity, at about2,400 tons per hectare, is similar or Oie Lostc 35.0 35.0 35.0higher than in the other regions. TOMI rIwks 72.4 850 105.0
Logistic costs, however, including iCwarehousing, transfer, land transport,port and maritime transport costs, CMPRo.da 220.0 220.0 220.0
compare very favorably with the other Mar&U s76 4s.0 25.0regions of Brazil, as can be seen in thebox. The comparison is made betweenthe regions of. (a) Balsas, which is the main agricultural center in south Maranhao, and which started toexport soybeans dtough the Northern Corridor in 1992; (b) Dourados, which is the main soybeanproduction area in Mato Grosso do Sul, exporting ihrough the port of Paranagua; and (c) Diamantio,which is a major production area in Mato Grosso, located about 2,000 km from the port of Santos. Theresults show the favorable competitive position of the Northern Corridor's region of influence whichcover substan parts of the three states.
C. mIn ProdciQon Potential Md rnect
6. The two states of Maranhao and Tocantins are already important producers of rice, which theyexport by road to many other states in the Northeast. Although soybeans have been grown on a smallscale for a number of years, it is only recently, with CVRD's rail and port system in operation, thatsubstantial investmes for land development have been made and soybean production has started toincrease in the region of influence of the Northern Coridor. The 1993 production in the sub-region is

49- Annex 2
simated at about 60,000 tons of riceand 90,000 tons of soybeans. _
(thouan hoctarc)
7. CVRD esdmaes of future wd c Pproduction are about 150,000 tons of P 1,159 1.9 s0rice and about 1.0 milion tons ofsoybeans by 1998. Althugb these s 1,244 9.6 220estimates might seem optfimic, the sub- Riatha S95 S.6 80region has a definite competitive s. Raiudo 411 11.9 80advantage in relation to the other majorexporting regions in Brazi, and an T P 452 7.7 130importa poteal in terms of Odhr 2,201 9.0 210availability of adequae land for grain Maranhao 6,062 42.7 800production. G~O pmducdoji- ~~~ailbw 348 3
8. The agricultura land areas in tLe Ribmo Gonuva 1,217 1.0Northern Corridor sub-region's Sam POMM 540 - -
municipalities is shown in the box. This .6information was taken into account indefining the priorities for road upgrading ToWal da 3,002 13and paving, and in preparing the 04ad 1.091 .2proposed project. P Ao 430 .9
T cAndnpls 567 - -
Other 449 .1
TOW Toesmads 2,57 1-
Tdal &a m 11,im0 45.9 +800

-50- Anne 3
STATE H[GHWAY MANAGENMEN E RlC
Maranha. State Road Network. Maintenance and U1ppding Stratels
A. De Road
1. Network kngth and classification.Ihe State of Maranhao's road network has Notwot Undh and sc n aria tota leng of approxcimuely 53,000 km,of which 3,282 km are federa highways, cx_on h3md Unood5,142 km fa1 under state's jurisdiction, and F.dal 2,152 1,130 3244,376 km ar municipal roads. A total of Saeb 11900 3,242 5,14266% of the federal network is paved as Muni4al - 44,376 44,376opposed to only 37% for the state roadsystem. However, over the last six years, Tolal 4,0S2 48,748 52,800the prportion of paved roads on the statenetwork has been significandy expanded,Inreasing from 820 km in 1985 to 1,900 km in 1993, i.e., at an average rate of 14% per year.
2. Traffic. Most of the traffic is concenated onthe paved network and particularly on the federal NeMwoDiubieon by Tmaflio(Shighways, where current average daily traffic volumes s" suare ditibuted as shown below, with an average value of ADZ vekd Unpavd1,200 vpd. On the state highway network, no regulartraffic counts have been caried out since 1986 and traffic <- - 60volumes are in the process of being collected. Ihe 1986 0O-100 - - 31traffic suvey carried out under the coordination of 100-300 4 38 9ABDER showed tat the average ADT on the paved state 500-00 10 S9network was of the order of 375 vehicles. More recent 1000-2000 58 -
spot checks of traffic volumes over the paved and 2000-5WO 11unpaved network (covering approximately 15 percent ofthe total lengt of the network, in March 1993) give thedistibudon shown in the table, with a percentage of heavy vehicles averaging 45% to 50%.
3. Network dcharaeristics. The paved network isrelatively young since approximaey half of its total leng is less than eight years old. All of it is of the w c Ld l flexible type with a very large proportion (amost 92%) E 77 15.0of wearing courses consting of a 3 to 5 cm. thick sand- od 24un 48.0asphalt carpet, while only 2% and 6% are respectively SID SuSMe d4uW 0 0bitmnou concete srfacing and surface treamts. D S d_ig 69 1.4Sand eapbAl 176 34.7Ibese are generally underlain by latedtic gravel base 45 0.9couses and sub-bae. The unpaved network is graveled S142 100over 76% of ts total length (2472 km), the remaining Tul24% 770 kn) consist of earth roads.

-51- Annex 3
4. Network Surface Condition. Quite recently, in May 1993,roughness measurements were carried out over the entire paved network.The distribution of roughness values was as shown in the box. Despite M san KMD Ithe efforts made to increase the length of the paved network since 1986, < 33 76 37.2surface condition has deteriorated quite rapidly over the last seven years 3.s54.0 613 322as shown in the following table. This suggests that stronger emphasis 4.0-S.0 326 17.2
needs to be placed upon the mantenance and the rehabilitation of this 5.04.0 122 6.4Pi ~~~~~~~~~~~~~~6.0.7.0 112 5.9network. 'he proportion of paved highways in bad condition has 7.08.0 21 1.2increased from 9% in 1986 to 14% in 1993, i.e., from a length of 74 kmto 255 km. On the unpaved network no rougluess measurements have yetbeen performed but from visual assessment of road surface conditions made by the district engineers, anaverage roughness value of 10 to 12 IRI can be assumed.
Suva" Cd&imasofutN
aood Es I= a1lK I Km IKM I Km
Pavd 706 37 939 49 255 14 1900
Uipxvd 357 12 1123 3S 1732 53 3242
5. The federal road system is in better condition. A recentsurvey undertaken by DNER shows the distrbution of pavement s Co^te of Pcden Ncwsurface condition rating presented in the box. AM ml coDiAdoa Km £
1 2-3.5 ood 17W0 73
D. Min mnance andReilblftionSa| 35 Rflagu 380 15.55-12 POW 280 11.5
6. MIntenance Strate. It is the Government'sintention to improve the maitnan standards on the roadnetwork, in terms of boti quality and physical achievements. So far, considering the limited equipmentcapacity within DERMA Land budget constits, the unpaved network, for example, could only be gradedabout twice a year with litle spot regraveling. This was done almost irrespective of traffic volume, roadsurface condition and weaing course materials. Average expenditures over the last fi -e years for theseactivities have ranged between US$ 900 and US$ 1,500/km. As a result, vehicle operating costs havebeen very high, with road roughness values averaging 12 to 15 IRI.
7. In order to assist in the design of a more cost-effective mintence policy, the Bank requestedtraffic counts and, as a first step, visual pavement surface condition surveys to be carried out, as well assharper and updated assessment of maintenance and vehicle operating unit costs. Maintenance conditionsurveys (including roughness measurements using a May's meter on the paved network) were undertaenbetween March and May 1993, and traffic counts were performed in March 1993 on a representativesample of the network (covering about 15%).
8. On the basis of the information so obtained, HDM Manager was used to define the optimumstrategy both for the unpaved and paved network. Considering the relaive uniformity of climate, geology(material resources) and topography across the State, each network was- as a first step- considered as alink, for which average repreentative chartics could be assumed. However, for the unpaved roads

-52 - Annex 3
and considering the sensitivity of the requirements to traffic volumes, these were classified into threecategories, namely: ADT<50, 50<ADT< 100 and l00<ADT<300. For the paved network, ADTnormally ranges between 200 and 600 vehicles and therefore there was no need to include this as avariable in the analysis, a single weighted average value of 320 having been selected for the analysis.
9. Opllmum strategy for the unpaved network. lhe process used for the detemination of thebest mainteance strategy consisted in testing various frequencies of grading, in order to identify theoptimum value at which the highest Net Present Value (NPV), at a 12% discount rate, was obtained. Ihebase standard implied no grading at all. For all standards, it was assumed that regular routinemintenance would be carried out ,as described below, and also, except for the base standard, regravelingoperations aiming at compensating gravel loss were scheduled to bring the total thickness of gravel backto 10 cm. as soon as it reaches 1 cm. The following ranges of intervals between grading operations weretested according to traffic volume classes:
* ADT<50: from to 60 to 730 days i.e.between 0.5 and 6 gradings per year.* 50<ADT< 100: from 30 to 180 days, i.e. between 2 and 12 gradings per year.* 100<ADT<300: from 12 to 180 days, i.e between 2 and 30 gradings per year.
The tables and graphs shown on the last page of this annex summarize the results of the analyses.
10. For all traffic categories, the relationship between the NVP (or IRD and the level of mabenanceexpenditure was translated by a curve showing a sharp increase of benefits ( or a corresponding high rateof improvement of roughness ) as grading operations started and progressed up to a point where the curvebegan to flatten out, near the optimum value. The most cost effective frequency of grading was thenselected at the critical chnge of curvature, somewhat below the peak of the cruve. The following tableshows the final result and by comparison present practices or what the situation has probably been overthe last five years.
mlSh}SatW NIPV
<50 1541 1 990 37.5 11 2 UN6 43.5 83
50s100 S44 2 1200 117.7 11 4 3209 139.6 8.0
100-300 214 3 1500 277.4 6 4414 363.9 8.6
0400 2899 2 1100 426 12 3.8 2838 547 8ANa,:ADr Avmpdal WMKu -lawatAwa&6bnayN .bsof gmdlglyt
U5$IY, - MaehtmeascNPV - hIn mof USSDE1 inb mI
11. Considering the improvements which are needed, both institutionally and financially, beforethe optmum strategy can efctively be put into effect, implementation of the new policy wassceduled to take place progressively, in parallel with instionbuilding and budget increases. It wasassumed that fuHll momentum would be reached by the fourti or fifth year of the project.

-53- Annes 3
12. According to the surveys carried out andthe results of the analysis of optimum strategy,the network of unpaved roads will be subject to 1. Gria8 AD<50 : 2/yearthe following regular maintenance activities 2. Resavefg SO<ADTi100: 4/yearthroughout the implementation period of the 100<ADrC300:6/yearproject. Under this policy, the average roughness 3. Buhi.cin, 50CC<r<100 200cu.i/km/yr
on the unpaved roads will be reduced from a 4. Culve cleaning 100 <ADT <300: 300 cuiaJkmlyrcuret value of 12 to about 8.5. s. Erosion I s500kq.yr
6. BdWg it 0.20 eu.mkAntyt7. Veidal algns 0.6 cU.m/Wmyr
13. Optlmum strategy for the paved I I.r/km/yrnetwork Most of the paved network consists of I uiui/ytsand asphalt carpet having an average thicknessof 4 cm. Mean traffic volume s of the order of350 vehicles per day. Several alternative standards for mantce were tested, namely:
* Standard 1.: Base standard, comprsing essentially routine activities without anyrepair of the pavement.
a Standard 2.: comprising routine maintenance and patching of aU potholes untilreconstruction occurs at a cridcal roughness level of 8.5 IRI.
• Stadard 3.: comprising routine maintenance and sealing of pavement surface over30% of the total area.
* Standard 4.: comprising routine mainenance and resurfacing with single surfiacetreatment every 5 years.
* Standard 5.: including routine main e, patching and an overlay with 4 cm. ofsand asphalt, as soon as the roughness level reaches S IRI.
14. The anaysis showed that Standard S yielded the best rate of return and highest Net PresentValue. This sandard was therefore selected as the staty to be applied on the paved networl.Under this strategy, the mean roughness value on the paved state roads would be kept within a rangeof 3.0 to a maximum of 4.0 IRI, as compared to the range of 3 to 7 measured on the network in May1993. The average unit cost of mintenance would be about USS 2200 /km/yr.
15. Furthermore, the following improvements were deemed necessary and would gradually be putinto practice during the implementation period of the project:
(1) regular monitoring of pavement condition using standardized procedures (includingroughness measurements on the unpaved network), as well as traffic counts and axleload weighing, would be carried out every year, in order to adjust the maintenanceprogram and budget requirements accordingly.
(i) Increase the involvement of private contractors in mantenace activies up to 80%,which would be compatible with present equipment capacity of DERMA.
(Ci) intensify the use of surfce treatment as reuraing material as opposed to sandasphalt, through extensive search of stone resources, as the unit cost of sand asphalt Isfive to eight times higher.
(IV) ncrease the practice of adequawt compaction of unpaved roads immediately after wetgrading and regraveling operations.

-54- Annex 3
16. Rehabilltatlon Strateg. In line with the optimum strategy described above for the pavednetwork, approxnimatly 415 knm of paved roads showing roughness values near or above 5 IRI, havebeen programmed to be rehabilitated during the first and second year of the project. Consistent withtraffic levels, (generally less than 500 veh/day, surface condition and material resources (abundanceof suitable sands) only two standards of rehabilitation have been selected:
(i) the first standard applies to pavements showing roughness between 4 and 4.5 IR1, andwill consist of a sand asphalt carpet of 3 cm., after appropriate patching and shouldertreatement (releveling and priming) are carried out;
(ii) the second standard applies to slightly rougher pavements having between 4.5 and 6IRI, and will consist of a 4 cm. thick sand asphalt carpet, which will be laid afteradequate patching and in some cases, partial recycling and reconstruction of the basecourse have been carried out, together with shoulder repairs;
Ihe works to be carried out on the pavement itself will absorb about 90% of the total rehabilitationCost
c. _Mf n f"RM
17. The excessive costs which would be incured for an adequate maintenance of unpaved roadssubject to high volumes of traffic have led the road agency to consider their upgrading and paving asa possible alteative. Altogether, some 300 km of such roads baving present traffic volumes between150 and 250 vehicles per day have been selected as needing urgent improvement and paving works,as their economic rates of return range between 16% and 35%. Pavement design for a 15 year lifegenerally calls for a sub-base of 15 cm. and a base-course of 20 cm, both in lateritc grvels,followed by either a double surfac-dressing or a 3 to 4 cm thick sand asphalt carpet. Ihe bitmswearing course has a reasonable width of 6 m. and shoulders,one meter wide. Construction costsaverage US$ 120,000 per km and are broken down, on average, as follows: earthworks: 17%;pavement: 57%; drainae: 15%; structures : 5%; signalization: 6%.
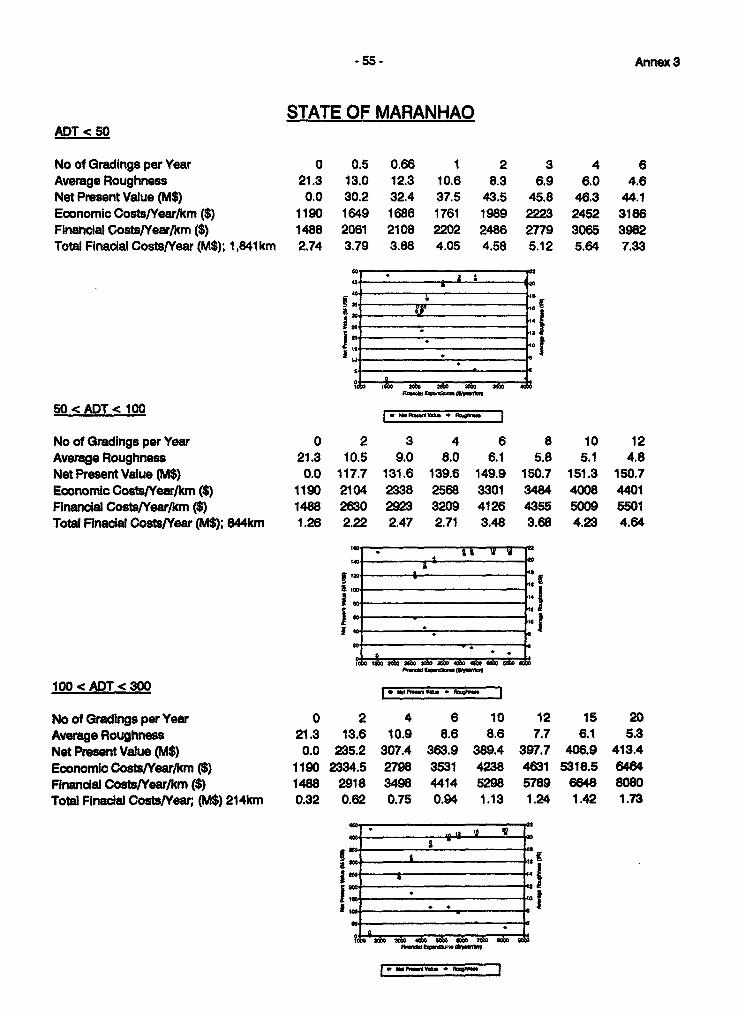
55 - Annex 3
STATE OF MARANHAOADT < 50
No of Gradings per Year 0 0.5 0.66 1 2 3 4 6Average Roughness 21.3 13.0 12.3 10.6 8.3 6.9 6.0 4.6Net Present Value (M$) 0.0 30.2 32.4 37.5 43.5 45.8 46.3 44.1Economic Costs/Year/km($) 1190 1649 1686 1761 1989 2223 2452 3186Financial Costs/Year/km ($) 1488 2061 2108 2202 2486 2779 3065 3982Total Finacial Costs/Year (M$); 1,841km 2.74 3.79 3.88 4.05 4.58 5.12 5.64 7.33
I ~ ,,,4. . ~ ~ ~~~~~~~~~~~~~~~.
50 < ADT c 100_____1 __ 4 _ _ _ _
NooofGradingsper Year 0 2 3 4 6 8 10 12Average Roughness 21.3 10.5 9.0 8.0 6.1 5.8 5.1 4.8Net Present Value (M$) 0.0 117.7 131.6 139.6 149.9 150.7 151.3 150.7Economic Costs/Year/km ($) 1190 2104 2338 2568 3301 3484 4008 4401Financial Costs/Year/km ($) 1488 2830 2923 3209 4126 4355 5009 5501Total Flnadal Costs/Year (M$); 844km 1.26 2.22 2.47 2.71 3.48 3.68 4.23 4.64
16t* ii w'a
a. .eo tot
Id 10 14 }1 4 400(04
100<ADT<300 __I
NoofGradingsperYear 0 2 4 6 10 12 15 20Average Roughness 21.3 13.6 10.9 8.6 8.6 7.7 6.1 5.3Net Present Value (M$) 0.0 235.2 307.4 363.9 389.4 397.7 406.9 413.4Economic Costs/Year/km ($) 1190 2334.5 2798 3531 4238 4631 5318.5 6484Finandal Costs/Year/km ($) 1488 2918 3498 4414 5298 5789 6848 8080Total Finacial Costs/Year (M$) 214km 0.32 0.62 0.75 0.94 1.13 1.24 1.42 1.73
!40 _ ;sK4: 2X 12'"
60
140 ; A zi 0 bo4 61i 0 40 i
-bPwtI t

- 56 - Annex 4
BRAZI
STATE HIGHWAY MANAGEMEN 1I POJECT
Plau State Road Network, Maintenance Condition and Progm
A. Tbe Road Network
1. Network Lngth and Clasfication. Iheroad network under the jurisdiction of 1he State of TubI3.1: and ua(Piaid has a toWal legth of 9,016 kmn, including 7,987 x" d VW" U 1dkm of state highways and 1,029 km of delegatd PFe(dd" ) 434 595 1,019federal highways. Overall, 20% of the total extension s 1,S35 6,453 7,987of the state network is paved, i.e.,approximately Sub-mT. 1,969 7.048 9,016
1,535 kw. Compared to data obtained in 1986 from Fd 1,550 - ISSOa survey conducted by ABDER it can be noted mw,600 46,000practically no paving has been canried out in this state TOS 3,519 533648 57,166over the last seven years. I___
2. Traic. Since the beginning of the 1980's no Nwok Di bution by Traffic (%)regnlar traffic counts have been caried out on the statenetwork. The only available informaton refer to traffic AL sUatsurveys card out, (i) in 1992 by DNER on the federal ADT frxid 1lDedroad network; (i) in 1986, by ABDER, on the state road <- - 76network, and (ii) in 1992-93 on the sections of roads 25-50 22included in ftis proposed project. In 1986, the average 50-100 - - 2daily traffic volume on the paved state network was of 100o300 7 67
the order of 228 vehicles. In 1993, the distribution of 300-50 32 20the network by traffic volumes is shown in the box. On 1000-2000 is -
e state nwork, traffic counts conducted in 1992 on a > 2000 4sample of sub-projects considered for inclusion in thefirst year rehabilitation program yielded ADT rangingfrom 60 to 400 vehicles, with percenages of commercialvehicles varyui between 20% and 70%.
3. NetworkChracterIsics.The state paved network DiofN oAcowdito Su Ty m
(mcluding delegated federal C A U dhighways) comprises essentially sw so Afltflexible-type pavements consisng T S P ldof granular b-courses and sub- Pdu (ddb.) 0 v 0 216 379 1,029
bases overlain by a thin carpet of sI* iso 9S0 4v 3,594 1,810 6,958sand asphalt (3 to 5 cm) or surfae Towlm IS0 1,384 454 3,810 2,189 7,987treatment, with the following PIKp(%) 2 17 27 100propordons:

- 57 - Annex 4
(a) sand asphalt wearing course on 1,384 km i.e., about 90%; (b) single or double surface treatment on132 km i.e., about 10%. About 64% of the paved network is less than 10 years old. The unpavednetwork is graveled over 66% of its total length, i.e., approximately 4,264 km, of which 454 km havereceived a special anti-dust protection (emulsion spray). The remaining 934 km are earth roads. Thetable shows the distribution of the network according to surfacing types.
4. Surface Condition. Asurvey of the network surface Sufaco Condition of State Networkcondition carried out in 1991 Pavednkm) Unzaved (km) I1shows that, overall, the proportion Dd ftm 96 An (ravel A Km Iof pavements in good, fair andpoor condition are respectively alod 110 231 22 0 861 13 1202 1S22.3%, 42% and 35.7% for the Pair 124 521 42 29 4,S54 71 5,228 66
paved network, and 13.3%, 71 % Por 200 348 36 42S 584 16 1,SS7 19and 15.7% for the unpavednetwork. The low percentage of o 4 10 1 4 5 1 7 100roads in good condition, both onthe paved network (about 20%) and on the unpaved network (about 15%) emphasize the need for urgentmaintenance and rehabilitation actions. Low-cost biuminous surfacing such as single surface dressingand light emulsion spray (for dust protection) have suffered most, as practically 100% are badlydeteriorated. Almost one-third of sand asphalt carpets need to be renewed or overlaid because ofextensive cracking and potholes. Regarding gravel roads, almost 20% are rated in bad condition, thussuggesting that frequencies of gradings and spot regraveling can be improved.
B. MaintenanmandRehabiliation Strakg
S. The road administration is currently implementing a dynamic maintenance program over 75% ofthe gravel and paved network, using 13 force-account teams (which handle 75% of die total maintenanceactivity) and 4 small private enterprises (to which the 25% remaining maintenance activity has beencontracted). Each of the so-called 'flying' maintenance unit is responsible for the maintenance of about250 km of roads per year, and has been suitably provided with sufficient personnel and equipment tocarry out approximately 2 gradings/year (range of 1 to 3 depending on traffic volume), 700cu.meter/km/year of regraveling, plus other routine maintenance operations, over 4,200 km of unpavedroads. Adequate patching and routine maintenance tasks are also being provided on 1,500 km of thepaved networl. The equipment fleet repair and mannce is sub-contracted to private firms.
6. Maintenance capacity is being further increased through: (i), the establishment of two specialgrading units designed and equipped (3 graders each, working simultaneously) to achieve an averageoutput of 50 km per day, and (ii) the purchase of 3 slurry seal laying machines for periodic maintenanceof the paved roads. There are already available 3 cold sand asphalt mixing plants which are operatingacross the state to provide cold mix for patching purposes. The average maintenance expenditure overthe last three years has been on the order of USS 1,000/year, for each km of road mainained.
7. Analyses using HDM Manager were performed during appraisal to help define the improvementswhich would be required to achieve, over the medium-term, the most cost-dfective strategy both for theunpaved and paved network. For the unpaved roads and consistent with currently observed tafficvolumes, traffic was classified in three categories : ADT <25 (over 759% of this network), 25< ADT<50 (over 22% of this network), and 50< ADT < 100 ( over only 3 % of the network). For the paved

- 58 - Annex 4
network, the average traffic volume is sligthly below 300 vehicles/day and this value was adopted for theanalyses.
8. Optimum strategy for the unpaved network. The results ofthe analyses are summarized in the Tables and accompanying graphs AJT <25 2 smnaytrshown on the last page of this Annex. Compared to current practices 25< AVr <50 3 d~yen
which provide for 1 to 3 gradings per year, depending on trafficvolumes, the strategy which yielded the highest Net Present Value, 50< Awr <100 4gmdin/y.eafrom HDM simulations, is shown in the box. Under this strategy,which also includes suitable regraveling to compensate for materialloss, the maintenance cost would be within a range of USS 1,160 to 1,615, i.e., approximately 249%above recent past or current levels. Roughness values would be improved from an estimated actual valueof 9-10 IRI to 6.5-7.5 RI.
9. In additon to grading and regraveling operations, bi_* otQtlv/rouine maintenance activities will be regularly carried out as B0shown in the box. -. s m 6,0Q0 q.1tuEteo control 12 cuus
Ditbch d uct. clesang USS 45/yr10. Optimum strateg for the paved network. The Vtdia ag 1 awry l0kmpaved network currently comprises either sand asphalt carpetor double suce-dressing, overlying gramnlar lateritie base-coure and sub-base. The following alternative maintenance and/or rehabilitation stategies were testdfor each of the wearing course types:
e Standard 1: Base standard, including only routine maintenance.* Standard 2: Patching of all potholes plus rouine maintenance.- Standard 3: Patching and routine mantnce plus slurry seal every 5 years.* Standard 4: Patching and routine maintenance plus surface treatment every 7 yeas.* Standard 5: Patching and routine plus overlay of 3,4 or 5 cm of sand asphalt.
11. For the level of traffic generally encountered on this network, i.e. less than 300 veh/day, the beststandard yielding the highest economic rate of return ( between 42% and 48% ). consists of sealings orresurfacings, every 5 to 7 yeas, using slurry seals or preferably single surface-dressing. Sand asphaltoverlays with thickness ranging between 3 and 5 cm still yielded ERR varying between 12% and 15%and should not be overlooked as a possible altnative, particularly when traffic volumes exceed 300vehicles per day. Under the resealing strategy, roughness is expected to average about S to 5.5 MI overthe next 10 to 15 years and the average cost of maienance of the order of USS 1,400A=/year (asopposed to a current value of USS 700 which only provides for local patching and routine matenance).
12. Rdeabilitation strategy. In line with the above considerations, the first year program, under thisproject, would consist of the rehabiltation of two road segments which deserve urgent attention. Twostandards have been designed in accordance with traffic volumes and present surface condition:
*Standard 1: applicable to a badly deteriorated pavement whose wearing course consists of a'dust-protectng thin sand emulsion layer. Rather than considering a sandasphalt overlay, a miore economical technique involving scarification andrecycling of the old base followed by the addition of new lateiic gravel over athickness of 15 cm overlaid by a double surface treatment was adopted at anaverage cost of USS 50,000/am.

-59. Annex 4
Standard 2: to be applied to a road showing a regular surface condidon, which requires onlyresurfacing. A double surfact dressing has been adopted, at a cost ofUSS 23,000/km.
C. UDgraMn and Pavlng tt
13. Two road segments having a total length of about 120 km have been selected for the first yearprogram of upgrading and paving. The works will include grade and horizontal alignment improvements,the construction of all drainage facilities, including bridges, and the execution of a pavement consistingof 15 cm of sub-base, and 20 cm of base course, both in naturally occurring gravels, followed by theconstiucon of a bituminous wearing course. The wearing course will be either a double surfacetreatment or a 3 to 4 cm thick sand asphalt carpet, depending on material availability. Averageconstruction cost is on the order of US$ 100,000/km. As current traffic levels are relatively low, varyingbetween 20 and 60 vehicles per day, phased constrction is envisaged. The first phase will involve thecarying out of all earthworks and deep drainage or bridge construction (about 40% of total costs),followed by sub-base execution, thus providing a provisional gravel wearing surface. Ihe second phasewhich is scheduled for the second and third year of the program, will provide for the completion of thepaving (construction of base course and bituminous surfacing) as wel as all surface drainage facilities.Further details regarding sub-project description and the calculation of the rates of return are given inAnnexes 11 and 14.
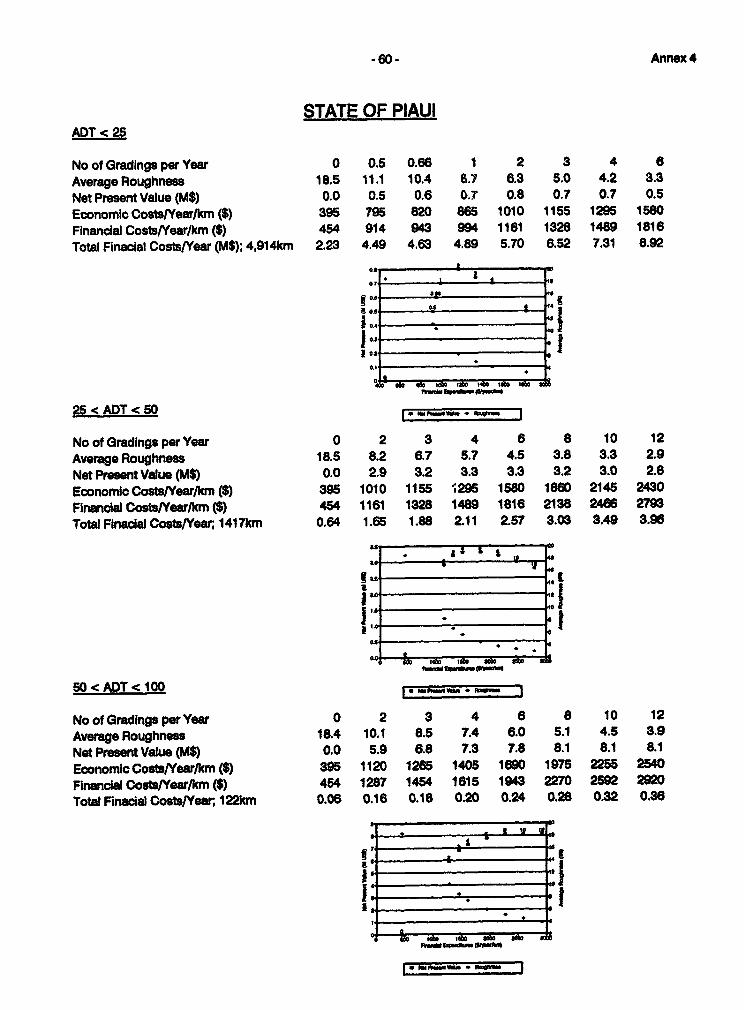
860- Annex 4
STATE OF PIAUIADT < 25
No of Gradings per Year 0 0.5 0.66 1 2 3 4 6
Average Roughness 18.5 11.1 10.4 8.7 6.3 5.0 4.2 3.3
Net Present Value (M$) 0.0 0.5 0.6 0.7 0.8 0.7 0.7 0.5
EconomicCosts/Year/km($) 395 795 820 865 1010 1155 1295 1560
Financial Costs/Year/km ($) 454 914 943 994 1161 1328 1489 1816
Total Finacial Costs/Year (M$); 4,914km 2.23 4.49 4.63 4.89 5.70 6.52 7.31 8.92
01
eI 4OU~~~~~~~~~4
J0~~~~~~~~~~~~~~4
NoN Ltx v q I i25 < ADT < 50 r_______ -
No of Gradings perYear 0 2 3 4 6 8 10 12
Average Roughness 18.5 8.2 6.7 5.7 4.5 3.8 3.3 2.9
Net Present Value (M$) 0.0 2.9 3.2 3.3 3.3 3.2 3.0 2.8
Economic Costs/Year/km ($) 395 1010 1155 '295 1580 1860 2145 2430
Financial Costs/Yea/km ($) 454 1161 1328 1489 1816 2138 2466 2793
TotW Finacial Costs/Year 1417km 0.64 1.65 1.88 2.11 2.57 3.03 3.49 3.96
* I M
hi~~~~~t 41
*~~~~~~~~~~~~~4
54Ss~ ~ib low50 < ADT < 100 NM _ * ____ I
NoofGradingsperYear 0 2 3 4 6 8 10 12
Average Roughness 18.4 10.1 8.5 7.4 6.0 5.1 4.5 3.9
Net Present Value (M$) 0.0 5.9 6.8 7.3 7.8 8.1 8.1 8.1
Economic Costs/Year/kn ($) 395 1120 1265 1405 1690 1975 2255 2540
Financial Costs/Year/km ($) 454 1287 1454 1615 1943 2270 2592 2920
Total Finacal Costs/Year, 122km 0.06 0.16 0.18 0.20 0.24 0.28 0.32 0.36

-61- ArAex S
STATE HIGHWAY MANAGEMENT PRO
Tntins State Road Network. Maintenance and Uprading Straties
A. IM a
1. Network length andassificatlon Ihe Tocanti 4.Netw utandCafictnoad network presently has a cLanxci kmkm ge TOWm)
tota leng of approximately a E Tow9,244 kmL The federal roadsystem, under DNER's FwtuI 802 181 7m 6939 75489jurIscdor, represents 1,754km and the netork under the TOWa km 1,352 6,520 1,372 7,892 9,244responsibility of the state. s 14.6 70.5 14.9 85.4 100covers some 7,490 km.Overall, only 15% of the total network is paved, i.e., about 1,353 km. Of the 7,890 km which areunpaved, the federal network accounts for 952 kn, leaving to the State some 6,930 km, 91 % of whichae grvel roads. Over the next five years it is planned to further construct some 2,650 km, which willbring the total extension of the network to nearly 12,000 km. The following table summar the statusof the network:
2. Trafic. Most of te heavy traffic s concenraed on thepaved fedad network where curent ADT ranges firom 1,500 to Nd kw DLbuuion by Tmffio ()2,000 vehicles. On the state network, traffic volumes are much ADEC Fmaumlower as shown in the following ADT distrbution obtained from < so 35.8a traic survey carried out In November - December 1991, on a 50-100 30.4representaive sample of the network. The average daily traffic on 100-200 21.0this retwork is of the order of S0 vehicles of which 25 to 30% are 200-300 4.4commercial vehicles. 300_600_4_4
3. Network Mainten Condidtonl Thepaved federal highway has recendy ben s admoniored by DNER over Its entir lenth and ad rthe survey shows dat applay67% are in K s K 5 xm sgood cndition and 33% In regular to poorcondWtio On the sta neork, the following 215 39 1,393 20 1,608 21maienan condition has recety be PaR 100 18 4,673 67 4,773 63observed. In terms of roughness, It is estmat et 235 42 873 12 1,108 14that the paved and unpved network Laverespecdvely average values of the order of 4 to Tal 550 100 6,939 100 7,489 100S and 10 to 12. Paved roads consist of laterlidcgravels with double surface dressings and almost 90% of this network i less than 10 years old.

-62- Annex 5
B. hintenance ad Rehabilitation Stctg
4. Maintenance strategy. The Government's intention is to gradually improve maintenance overthe entire network, throughout the implementation period of the project, and reach, by 1998, the bestpracticable strategy. To this effect and upon Bank request, visual surveys were conducted on pavementsurface condition and traffic volumes were obtained over a representative sample, covering about 50%of the total length of the network. In addition, updated information was collected on actual physicalachievement of maintenance activities, as well as on maintenance and vehicle operating unit costs. Thedata were introduced in the recently developed HDM Manager program (Version 2) in order to helpdefine the most cost-effective maintenance policy for both the paved and unpaved networks.
5. Optimum strategy for the unpaved roads. In view of the relative uniformity of this networkin terms of climate, topography, material resources and geometric standards, average representativevalues for the above parameters were assumed and the analyses conducted, considering the whole networkas a homogeneous link. However,traffic was classified into three categories consistent with the range ofADT observed on this network, namely: ADT<S0, S0<ADT< 100 and 100<ADT<300. Variousfrequencies of grading were simulated, and systematic regraveling operations were consistendy taken intoaccount to compensate for an annual gravel loss ranging between 1 and 2 cm per year. Relationships werethen obtained between maintenance expenditures fn particular, intervals between gradings), Net PresentValues (NPV) and average roughness on the roads. The steep slope of the curve as gradings wereinitiated, followed by a rather small improvement of NPV, as well as roughness, when approaching thepeak of the curve, allowed, for each traffic class, the most cost-effective options (those located just belowthe highest NPV) to be determined.
6. The tables and graphs shown on the next page summarize the results of the analysis. Ihey showin particular a comparison between present practice and the desirable or targeted strategy. It can be seenthat while actual maintenance activities cost about USS 1900 per km, resulting in an average roughnesslevel of 10 IRI, the most cost- effective policy will be to spend US$ 2300 per km, thereby improvingroughness to a value of approximately 7.5.
7. The analyses carried out indicate thefollowing intensity of maintenance activity to be oachieved on the unpaved network, during the i. Gadi ADT<50 :21yeaimplementation period of the project. s0<Ar(<100 :4*year
100<ADF<300:61' ;r2. RogsveUn ADT<SO : 80O cu.kmlyr
8. Opftmum strateg for the paved 50<ADlsrQ0 :120cumim//yrnetwork. Considering the recent paving works 100 <AD<300: 160cumnlkm/yrcarried out, the state paved network has a total 4 Dhh clnig 2000 Lm4. BoA cearing 20,000 sq.mlength of about 500 km, of which 295 km are to 5 lww 36 cumbe rehabilitated and/or resurfiaced under the 6. Shucouapaf 0.3 1.mproject. Ihe remaining 205 km are presently in 7. VelI ps 2 uni2t
excellent or good to regular condition. By the endof the project, further paving works will expandthis network to a total length of approximately 1500 km. The average traffic volume is of the order of500 vehicles per day. Several maintece standards were testd using HDM Manager, including fullpatching and periodic sealings. The optimum policy comprises:

-63 - Annm 5
() the carrying out of regular maitenance, every year;(ii) the patching of all potholes and the resealing of ravelled areas, when they occur (about
20 sq. meters per year);(iii) the execution of an overlay of 5 cm of bituminous concrete when the roughness level
reaches 5 IRI.
9. Under this strategy, the average unit cost of maintenance is of the order of US$ 1520 per kmper year. Roughness values, on average, will be improved from an estimated actual value of about 5 or6 to 3.54.0. Ibis optimum maintenance strategy was adopted to be applied throughout the project period,in addition to the rehabilitation and resurfacing works which are otherwise contemplated.
10. Furthermore, the following improvements were deemed necessary and will be put gradually intoeffect during the implementation period of the project:
(i) carry out regular pavement condition surveys using standardized procedures, trafficcounts, and aile-load weighing campaigns every year, with a view to updating themanenance program and corresponding budgets;
(CH) introduce and generalize the practice of adequate compaction of unpaved roadsimmediately following wet grading or regraveling operations;
(i) substitute the use of slurry seals by single surface treatments for resurfacing purposes,whenever technically (availability of aggregates) and economically feasible;
tiv) increase the involvement of the private sector in maintenance activities from 30% (thepresent level) to 70%, using force account only when dictated by crcunc, i.e.,equipment capacity, expertise or flexibility of DEOVI.
11. Rehabilitation Strategy. The moddling of surface deterioration on the paved network over thenext five years indicate that providing the above optmum maintenance straeg is applied, the meanroughness value will seldom exceed the critical level of 5 IRI, and will vary generally between 3.8 and4.8. Consequenly, extensive bituminous overlay should not be expected, except in xeptional cases andIn localized areas. Only periodic minance consistig of resealing or reurfacing with slurry seals orpreferably single surface treatment should be necessary, at an average cost of USS 8,000 to 9,000 perkm, or eventually thin asphalt concrete overlay (3 to 4 cm) at an average unit cost of USS 30,000.
12. Consistent with the above considerations, the fist year program of rehailitation, under thisproject, comprises two road segments of an equal length of 32 km which will be subject to the followingtwo standards of rehabilitation:
* Standard 1: slurry seal
* Standard 2 : 3 cm thick bituninous concrete carpet
The slurry seal is to be applied on a road surface showing regular condition and subject to a low volumeof trafic of the order of 100 vehicles per day. The unit cost of this resealing is about USS 8,500/km. Theasphalt concrete carpet will be applied to a pavement already showing signs of deterioration (cracking andravelling) under heavier traffic estimated to be sdightly upwards of 200 vehicles per day. The unit costof this overlay is estimated at US$ 29,0001km.

- 64- Annex S
C. UID3adiID and .E Shtmtga
14. Among the roads which would be eligible for upgrading and paving, both on technical andeconomical grnds, the first year program has selected six high priority road segments, totalling about400 km. Traffic volumes on these roads are already significant, ranging between 200 and 400 vehiclesper day. Upgrading will involve earthworks aimed at improving vertical and horizontal alignments (28%of tota costs), and the construction of drainage facilities, including the replacement of wooden bridgesby reinforced concrete structures, (26% of total costs). Paving accounts for approximately half of the totalcosts and will consist of the construction of a lateritc gravel sub-base and base course over an averagetotal thickness of 30 cm, overlain by a double surface treatment, 7 m wide. Total construction costsrange between US$90,000 and 170,000, with an average unit cost of US$130,000 per km. Further detailson sub-project description and economic analyses are given in Annexes 12 and 14.

-65 - Annex 5
STATE OF TOCANTINSADT < 50
No of Gradings per Year 0 0.5 0.66 1 2 3 4 6Average Roughness 19.2 12.4 11.7 10 7.6 6.1 5.2 3.7Net Present Value (M$) 0.0 19.3 21.3 26.0 31.6 33.9 34.6 33.1EconomicCosts/YearJkm($) 560 1,102 1,135 1,199 1,392 1,591 1,785 2,408Financial Costs/Year/km ($) 700 1,378 1,419 1,499 1,740 1,989 2,231 3,010Total Finacial Costs/Year (M$); 2,617km 1.83 3.60 3.71 3.92 4.55 5.20 5.84 7.88
20 4 80 *
1A t - a
50 < ADT < 100 pwft____ I
No of Gradings per Year 0 2 3 4 6 8 10 12Average Roughness 19.2 10 8.5 7.4 5.3 5 4.3 3.9Net Present Value (M$) 0.0 84.0 96.0 104.0 114.0 115.0 116.6 116.5Economic Costs/Y'ear/km($) 560 1540 1739 1934 2557 2713 3158 3491Financial Costs/Year/km ($) 700 1925 2174 2418 3196 3391 3948 4364Total Finacial Costs/Year (M$); 2,081km 1.46 4.01 4.52 5.03 6.65 7.06 8.21 9.08
ft- WS, , t
tO0 < ADT < 300 NM P- wt. _
No ofGradings per Year o 2 3 4 6 8 I10 1 2Average Roughness 19.2 13 11.6 10.5 8.2 7.8 6.8 6.2Noit Present Value (MA$) 0.0 1S8.0 193.0 220.0 272.0 280.0 297.0 306.0Economic Costs/Yearikm ()560 1838 2037 2232 28S5 3010 3455 3789_Financial Costs/Year/km ($) 700 2298 2546 2790 3569 3763 4319 473BTotalFinacial Costs/Year (M$); 1,8381an 1.29 4.22 4.68 5.13 6.56 B.92 7.94 8.71
FW..W O*.MA u '01Sl . _ .
9 * SwSO IO 8~~.
p~~~

-66- Annex 6
STATE HIGHWAY MANAGEMENT II POEC
State Road Depsarments: ranization. Management and Personnel
A. Qganzation and P onnel
1. Maranha. State Road Department (DER-MA). DER-MA is under the authority of the StateSecret riat for Inrastructure. It is supervised on an ad-hoc basis by the State's Road Counci and iscoordinated by an Administrave Board consisting of representatives from various segments of the civilsociety, all elected by the Governor. The agency Is headed by a general Director also appointed by theGovernor, and comprises four directorates: (a) the Directorate of Civil Works which is responsible fornew constructions, paving and bridges; (b) the Directorate of Operations which is in charge of equipmentsmangement and supervision of works; (c) the Directorate of Planning which provides for studies andprogramming; and (d) the Directorate of Administration and Finance. The DER-MA organizationalchart is shown on Chart 1, Annex 1. Maintenance activities in the field are carried out by 12 roaddistrcts failing directly under the authority of the General Director. Each district is responsible for alength of network ranging between 100 and 800 km of roads.
2. DER-MA has 786 employees, of which 72 hold university degrees (S1 civil engineers). About65% of the staff and the majority of engineers are in DER-MA's headquartes in Sao-Luis. They carryout essentially administrve functions, but also manage the 1st road district which is responsible for themance of 100 km of paved roads. The remainder of the personnel, i.e about 250, are scatteredaoss the state, in l1 other districts, the average number of employees per district varying between 1Sand 25. However, as a majority of tis personnel has been workidng for more than 20 years in the agency(the staf's average age is almost 50 years), one dtird of the districtpersonnel is expected to retire withinthe next year or so.
3. Plaui State Road Department (DER-PI). DER-PI is under the authority of the State Secretaryof Public Works. I is headed by a Geneal Direcor and is coordinted by an Administrative Boardwhose members are elected by the Governor. The agency comprises four directorates: (a) theDirectorate of Engineeig which is in charge of project design, new constructions and traffic issues;(b) the Directorate of Planning; (c) the Directorate of Mantenance; and (d) the Directorate ofAdmbinistve and Ficial affairs. Manteance operations in the field are carried out jointly by sixroad Districts failing under the direct authority of the General Director. and by six Residencies which areaccountable to the Director of Maitnance. Respective responsibilitias of the Districts on the one hand,and of the Residencies on the other, are not clearly defined and the latter are expected to disappear orotherwise merge into the Districts. The DER-PI organizational chart is shown on Chart 2, Annex 1.
4. DER-PI employs approximaely 1000 civil servants, of which 80 hold university degrees, including54 civil engineers. About half of the personnel is based at the headquarters in Teresina, while the 535other employees are scattered among the various Districts and Residencies. During the period ofmaintee activities, between April and December, the field staff is strengthened by mostly civil andmechanical engineers from the head office. Over the last three years, and at the initiative of the currentGeneral Director, maintenace activies have been boosted. Some 13 "flying" squads composed of

- 67 - Annex 6
District and Residency personnel have been established, each having the responsibility to maintain, undera system of financial incentives, a network of approximately 250 km.
S. Tocantins State Road Department. Unlike DER-MA and DER-PI, the road authority in thenewly created State of Tocantins is exercised by the State Secretary of Infrastructure (SEINF-TO). It issupported by a Planning Advisory Unit (ASTEP) and by a Road Department (DEOVI) which comprisesihree operational divisions: (a) the Division of Studies and Projects; (b) the Division of Construction,
responsible for new constructions including paving and bridges; and (c) the Division of Operations whichhas responsibility for seven Districts assigned to maintenance activities. The SEINF-TO organizaionalchart is shown in Chart 3, Annex 1.
6. DEOVI has 1270 employees of which 54 are civil engineers, and 15 others are universitygraduates. Each district is staffed with 100 to 200 persons, and is managed by a civil engineer. Ihey,individually, are in charge of a network of about 1000 km of roads. In contrast with the other two states,the managers and engineers working in DEOVI headquarters in Palmas, are relatvely young and havebeen recruited from the private sector. Those working in the field originate mostly from the ConsorcioIntermunicipal of the former State of Goias.
B. P ng and Manteace aeement Caoabiei
7. In assessing the capabilities of the state road departments to effectively prepare, plan, execute orsupervise maintenance advities, a number of common features or deficiencies have been identified:
(a) although stafn is more than adequate in numerical terms, averaging 150 per 1000 km ofroads to be maintned, no trining program has been set up in either state, in order to raiseand update the technical capacity and know-how of the staff, to the level required for anefficient management of maintenace programs and activities. In addition, most of theexperniece available is rdated to new constuction and/or paving activities, rather than torehabilitation and maintenance.
(b) even though peridic mainenance and rehabilitation works are, as a rule, contracted out,the proportion of routie maienanc carried out by force-account is of the order of 60 to80%. However, eqpmet capacity in al the three states does not normally allow for moreta 30% of the total needs to be efectively performed, using only force-account. As aresult, the quality of maiae is far below optimum, and the use of private contractorsfor routine mance must be sbttialy incresed. In that perspective, the proficiencyof the road agencies in the design, procurement and supervision of contrated routinemantance needs improvement, and both training and technical assistance are required toaddress this issue.
(c) the planning and priorizing of road construction and mainenance programs are carried outon an ad-hoc and short-term basis, relying only upon subjective and qualitative assessmentof network surface conditions made by, and only when requested from, the distictenginees. Proper pavement condition surveys using standardized and objective proceduresare not carriet out at the network level. Over the last ten years, no traffic counts have beenperformed on the network, and no information is avaflable on awle load characteristics. Anetwork information system for rational planning is urgently needed. This would consist

-68- Annex 6
of a data base on road inventory, current and historical pavement constitution, and trafficvolumes and loadings, for both the paved and unpaved network.
(d) likewise, there is little capacity to process and analyze the data in order to define currentor expected future needs in accordance with appropriate criteria. Design manuals, whetherfor new construction or for rehabilitation and maintenance, are either obsolete, being mostlyderived from DNER's experiences and publications dating back to the late 70's, or inspiredby foreign methodologies which may not have incorporated the specificities of the region,in terms of economy, climate, materials and soils conditions, and local constructionstandards. A review of this technical documentation is of paramount importance and in thisrespect, all the information which has been collect ' and already processed on roaddeterioration in Brazil during the HDM exeriment program, between 1975 and 1984,both on paved and unpaved roads, can and should be profitably used with eventually fiutherspot calibration, with a view to evolving new maintence and construction policiesspecifically adapted to each state.
(e) the decision-support system also lacks appropriate procedures for the ranking of alternativestrategies, using economic models applied at the network level, which would facilitate thepreparation of adequate ammal and pluriannua programs, and in particular a suitable stateroad network master plan. Provision would be made to strengthen the capacity of the roadagencies in implemening simple but efective methodologies for identifying economicallywell-justified projects and for defining priorties under budgetary constraint.
S. Ihk aforementioned deficiencies and Issues would be addressed through technical assistance andtaining programs (presented In Annexes 7 and 8) designed for this purpose.

- 69 - Annex 7
SIATI: HIGHWAY MANAGEkNr I RO1C
mmTehda Assistance lPr
1. Technical assistnce is to be provided under the proposed project, to strengthen the capacities ofthe state road departments, and in pardcular their Project Management Unit (PMU), in establishing moreadequate planning and implementation structures. Tne emphasis is to be placed upon developingcomprehensive highway network condition and traffic surveys, processing, analyzing and applying thedata In the planning proces, using suitable economic models, and updated constructionlmpolicies and standards, for both the paved and unpaved network, and preparing and updaig the states'plur_ann and annual ependiture and funding programs.
B. Out_ine Terms of Reerem
2. The Consultants' responsibilities are to:
(1) Develop and propose apropriat metologies and procedures for detailed pavement conditionsurveys, for either paved and unpaved roads, including not only surface defects inventory such as
roughness and condition index rating, but also structural capacity measurements (deflection tests,layer thickneses and other properties);
(2) Develop and propose adequate traffic surveys, including volume counts and ade loadmsrmes, at siable locations, selec in such a way as to cover the whole network;
(3) Carry out (together with DER counterparts to be trained on-the-job) the first series of tfie surveysdeveloped in (1) and (2) above, and this over the whole network;
(4) Collate the data and evolve computer processing programs enabling the results of these surveysto be presented in a sutable form for efficient interpretation;
(5) Review the techmical manas and specfications currently used in the states for new constructiondesign, overlay structual design and maintenance strategies; carry out limited experimentalresearch as may be necessary, in order to adapt or evolve new guidelines in these three technicalareas, taking into account materals caacistics, traffic volumes and weights, and the specificroad deation patterns prevailing in the state;
(6) Review and update unit cost for new constuctions, rehabilitation, and mainance activitiesconsidering, as may be appropriate, force-account and private sector involvement;

-70 - Annea 7
(7) On the basis of the above information, assist the DER In preparing the annual and pluriannualprioritized m nt and upgrading programs, using the HDM model and/or the more recentHDM Manager program.
(8) Assist the road agency in the preparation of a state road network master plan, using a suitablemulti-criteria approach;
(9) Develop and implement an information system to adequately monitor the actual implementationperformance of the programs;
(10) Assist the road agency in the selection and procurement of consultancy services needed for thefinal designs or supervision of the sub-project roads included in the first and second year of theproposed project;
(11) Review DER's policy on mainteance, i.e, in particular:
(i) analyze the stucture of the road districts, assessing their personnel and equipment capacityand performances, as well as local or regional contractor capabilities;
(ii) propose a stategy for improving the current organization and aimed at enabling moreefdective maintenance implementation programs to be developed, while keeping force-account involvement within practicable or reasonable limits;
(iii) develop procedures and assist DER in the design, procurement and supervision ofmaintenance contracts with the private sector.
C. Oumu and Tmetabl
3. The assignment wil extend over a period of 24 months. The outputs required for the various tkszentioned above are the foUowing:
IvA Out" Redi By
1-2 Rod monAoing ad :taTi mrey hodwologie Month 2
3 1994 rad conditn and trUific vqey red Morith 6
4 rad dababe Month 7
5-6 design mada nd cost estm for new pament, overys Month 12 (plimnay repor)
and maiteme straegies Month 24 (final repou)
7 annual and phuial progams Month 6 (1995 progam)Month 18 (1996 pgram)
8 sta rod netwaok Matr Plan Month 20
9 compuAized program system Month 3
10 consult_my conams for design and supervision Thughout
11 mvised m _nao policies and orpnization Month 18

-71 - Annex 8
URAZ
SZ.SU~- II,POJEC
Ihbe Trinig ptgm
A. lntmodusion
1. All three road agencies present virully the same deficiencies in their ability to effectively prepare,plan and Implement a comprehensive program of road maintenance and rehabilitation. For the most par,and in view of the emphasis placed so far upon network expansion and upgrading, their expertise mainlycovers new road construcdon and paving, and little attention has been paid to planning andimplemenation of road mainte4nce programs. In addition, and until now, few opportuities have beenmade available to staff for training, and at least in two states (Maranhao and Piaui), the rather advancedage of the personnel in dcarge suggests that some recycling initiative be taken in order to upgrade andupdate their professJional skills.
2. In all of the states, there is simllarity not only in the number and stcture of the staff to beaddressed by training (each agency has between 700 and 1000 employees, 70 to 80 university degreeholders of which 50 to 60 are civil engineers), but also, as neighboring states, in their physical conditionsand geographical locations. This has led to the design of a compact and cost-effective training programcomprising similar courses and a consistent time table of human and financial resources, throughout the5-year implementation period of the project.
B. ObleJlUes
3. The major objectives of the trainig program are to:
(a) strengthen the peformance capabilities of the road agencies personnel, particularly in the planningand implnin of their road maintea management, placing major emphasis upon: (i)adequate network and traffic monitoring; (ii) design of appropriate standards, best suited to theregion's specificities; (iii) efective planing, budgetng and prioritzing procedures, using moderneconomic models such as the HDM model; and (iv) efficient implementation of maintenanceactivities, involving a suitable mix of force-account and private sector participation, as well asadequate contract management procedures (procurement and supervision).
(b) motivate personnel and create opportunities for career development through enhaced professionalsldlls and abilities.
(c) complement the actions ad services otherwise provided by the Technical Assistance programwhose duration is shorter, thus enabling the agencies to reduce their dependency upon externalconsultancy, in the performance of their essental functions of planning and monitoring.

- 72- Annex 8
C. Deplion of Traini ngPm
4. Four subject areas have been selected in which training is required: (i) Road Maintenance Planning,(O) Road Administration ad Management, (iii) Execution of Maintenance activities by Force-account,and (v) Computer and Information System. Each training subject comprises between one and threemodules which cover the essential pats of the topic concerned, as listed below.
Suiet Trahiinig Module or Course
Road Planming 1. Network and traffic monitoring.2. Design principles and standards for new pavements
(surfuced and unsurfaced), overlays, strengtening and
3. Economic analyses at network level, including costing,planning, priodrzing, budgeting and programming.
Road Management 4. Design, procurement, supervision and monitoring ofcontacted maintenance activities.
5. Road safety problems.6. Environmental issues.
Force-account 7. Practical training on equipment use and maintenance inworks on unpaved roads.
Comput system 8. The use of computers for word and data processing.
5. Each module would have a duration of 20 to 60 hours, depending on subject complexity, and theaverage number of trainees per course will range between 10 and 20, this being a function of the typeof profile to be addrssed and the num of candidates having this profile.
6. In addition to the modar traiing activities, other events have been programmed to occur withinthe 5-year implementation period of the training component lhey include: Oi one or two regionalseminars, each year, gathering selected participants in order to exchange views and experiences on theon-going road programs in each state; and (ii) trips and study tours abroad, notably for seniormanagement staff, in order to keep abreast of the latest techologies in road maintance andmanagement.
7. To eosure adequate coordnation of the action plans and achieve cost-effectiveness, the three stateswDI set up a joint stewing committee, including DNER and ABDER representatives, who will beresponsible for planning, preparig, organizing and monitoring the training program.
8. Altogether, the training targets epressed in tems of number of trainee-weeks, wfll vary between100 and 200 each year, with a total estimated cost of US$ 400,000 per state.

-73- Annea 8
D. QDneIof TrWhnIg frggmM
1. Network and Tndfc Monitoring. Civil Engineers, both head-office and districts. To emphasize the need for adequate sveys, both of road conditions and traffic, for planingpurposes. To describe moniwring methods, and the meaning and usefulness of the results obtainedfor defining mtenance and rehabilitation needs.
2. Design Principles and Standard for New Pavements, Overlays, and Maintenance for theNortesten Region of 1r1. Civi Enginee. To provide pardcipants with essential element governing the design of new pavements,strengthening, and mnnance sandards. To highlight the influence of specific featur of t'heregion (soils, climate, materials resowces and traffic) and devise a methodological firamework forthe setting up of adaptd guidelines for structral design, drawing, in particular, on the roaddeterioration pattens obseved in Brazil, during the HDM experimental program.
3. PlanIng of Road Activities at Network Level. Senior Managers, Economists, Civil Engineers. To familiarize participants with the methods for drawing up, under budgetary constraints, asuitable work plan for road upgrading and maintenance programs, at the network level. Thecose wil ge typical examples of an economic analysis of alternative staegies, using the 1DMmodel, and show how to derive the best short and medium term policy for the state network
4. tof Road Mantena by Contct. District Engineers. To provide paricipants with elemens for effective preparation (design of contract dcuments,and procurement procedure), and supervision of mainnce works by cotact.
S. Road Safety Isues. Engineers and Senior Managers. To raise awares of participants on the importance of highway safety issues. To discuss safety-integrated designs and outline the feares of a program for reducing road accidents
6. Road Euvliuent Imm. Enginees and Senior Managers. To flize pardcipants with road design and construction-related environmental impacts
7. Executon of te by Ferceaoount. Foremen, Medcanical Engineers and Equipment Operators. To acquaint pardcipants with, and Introduce standards and procedures likely to result in higherwork productivity and better quality of matenance (grading and regraveling opations)
8. Computer and lnfownaon Systems. Adminstive and support staff. To introduce participants to basic computer operations and to software (word pcssing,spreadshee, data base) best adapted to the needs of a road agency.

- 74 - Annex 9
MU MGHWAY MANAGEMENT n PRO.ECT
State Environmental Management Programs
A. Introduclion
1. The states of Tocantins, Maranhao and Piaui are located in central and northeastern Brazil (MapNo. 23773R1). Their environment consist primarily of: cerrado, or open pasture with brush vegetation,in virtuly all of the state of Tocantins, southern Maranhao and southwestern Piaui; caatinga, or brushland, in southeastern and north central Piaui; an environmentally stressed area of pre-Amazon forest, inthe western parts of Maranhao and Tocantins, in the Araguaia River valley; and palm tree areas,primarily babassu palm, which appears throughout northeastern Maranhao and northern Piaui.
2. The road projects proposed by the states of Maranhao, Piaui and Tocantins include institutionalmeasures designed to manage more efficiently the capital invested in roads, and road works. The latterconsist of: (i) rehabilitation or resurfacing of deteriorated roads; and (ii) upgrading and/or paving ofexisting earth or gravel roads.
3. Road rehabilitation and resurfacing usually involves a low environmental risk. Its impacts havea confined geographic distribution in that they deal mainly with careful traffic safety measures, disposalof waste materal removed, and pollution that might be caused by the industrial machinery used to makecushed stone and asphalt concrete. All these impacts are easily controllable and the majority are shortlived. Road paving, even on existing roads, adds to the aforementioned impacts a significant gain inaccessibility for the regions served by reducing transport cost and enhancing traffic safety. Theenvironmental risk in this case affects the entire indirect area of influence of the road.
4. As a consequence, the various Bank preparation and appraisal missions sought to ensure that theeffects on the environment were properly evaluated, on a project-by-project basis, and that the appropriatemeasures would be taken to control the adverse effects on the environment. Accordingly, it was decidedto incorporate into the projects an environmental component that would have the following objectives:(i) provide the road agencies of each state participating in the program with powerfil technical andinstitutional instruments for their environmental work; (ii) support the state environmental controlagencies so that they too have a strong technical, instrumental and institutional structure, and can becomecapable of conducting the program evaluation and follow-up activities with quality and effectiveness; and(iii) guarantee that aU the works involved in the new paved roads, whether supported or not by the Bank,would be supported by studies of their environmental impacts.
B. Diagnosis of the Environmental Institutions
S. Since January 1986, when the National Environmental Council (CONAMA) resolution no. 001/86was issued, all road construction works have required specific licensing issued by local environmental

-75 - Annex 9
control agencies (either state or city). These agencies have the authority to require, or to waive, inaccordance with the law, environmental impact studies.
6. Since states and cities were not (and few are now) prepared to handle the new requirements, thestate road agencies (DER) came to view the requirements of resolution 001/86 either as a bureaucraticpernit procedure aimed only at gathering statistics or as an obstacle in the way of tne works which badto be resolved by the state governor.
7. As can be understood from the information given here, and even though resolution 001/86 onCONAMA has been in force seven years, none of the state road agencies in Tocantins. Mlaranhao or Piauiis ready to incorporate the environment as one of the variables in its activities. It is also true that theenvironmental control agencies in the three states are inadequately staffed, primarily in terms ofspecialized personnel, with the result that routine decisions vary greatly in content and they are usuallyeither too empirical or too political.
8. It was found that the three states have the same type and degree of weakness in enviromnentaladministration. It is characterized by: (i) lack of the tools needed to guide development, including thelack of appropriate economic-ecological zoning; (ii) lack of experience in dealing with the requirementto prepare environmental impact assessments (EAs) for undertakings that are most aggressive with respectto the ecology; and (iii) lack of skilled staff, both to conduct the environmental impact studies and tomanage the activities and control the measures established in projects and contracts, either by the agencyresponsible for the roads (SEINF-TO, DER-MA and DER-PI) or by the agency responsible for stateenvironmental management (NATURATINS-TO, SEMATUR-MA and CEPRO-PI). Consequently, it wasdecided that the program would not orly help strengthen the road agencies but would also help strengthenthe state environment agencies to address the above weaknesses.
C. Strengthening of DER Environmental Management Capabilities
(a) Organizational Aspects
9. Environmental units will be created and/or strengthened in each of the DERs. This wouldnormally require hiring road environmental specialists. However, the overstaffing of public agencies andrestrictive legislation and regulations on public sector employment and compensation would make it verydifficult, if not impossible, to attract professionals with proven skills to these jobs with very low salariesof 500 to 600 dollars per month. As a result, it was agreed that each DER will select at least four (4)technical professional staff interested in environmental affairs, and train them to carry out theresponsibilities of the environmental management unit of each DER.
10. The environmental management units of the DERs will have the following functions:
(a) specify, standardize and estimate costs, and monitor and enforce procedures for the purpose ofprotecting the environment and natural resources;
(b) guide and advise other parts of the DER in all procedures required to control impacts on theenvironment and on natural resources;
(c) prepare reconnaissance studies of the natural resources available in the area of influence of existingand planned roads, as well as their related installations;

-76 - Annex 9
(d) evaluate, review, qualify and quantify the impacts that construction, maintenance, improvementand operation of roads and related installations (parking, rest and recreation areas, observationpoints and overlooks) have on natural resources and the environment, considering at least thefollowing groups of impacts:
(i) physical-chemical impacts such as hazardous products, noise, vibrations, air andwater pollution;
(ii) biologi ,J impacts on biological diversity, ecosystems, wild areas, and habitat;
(iii) social impacts such as involuntary relocation, cultural heritage and aesthetic heritage;
(e) monitor projects and specifications aimed at protecting the envirownent and enforce them, in bothconstruction and maintenance phases, as well as the activities involved in operating the roads andtheir installations;
(f) monitor the effects of investments made over the short, medium and long terms, includingpreparation of new projects, to redirect the impacts, whenever necessary;
(g) inspect, review and give opinions on the Environmental Impact Assessments (EAs) and theEnvironmental Impact Reports;
(h) specify and furnish cost estimates for the aforementioned studies and reports;
(i) give opinions on processes that pertain to the environment and issue instructions on them;
'D represent or participate in representation of the DER in necessary contacts with other agencies andinstitutions aimed at resolving environmental problems relating to the roads under the jurisdictionof the agency, including monitoring of EA approval processes with the agencies responsible forissuing works and operating licenses.
(b) Technical Assistance and Training
11. The DER environmental teams wiUl be trained on-the-job by specialized consulting firns which,at the same time, will develop the environmental management instruments. In principle, the work to beperformed will consist of:
(a) a review of the general specifications for road works in effect within road agencies, internalizingthe environment as a variable, and implementing the new specifications in DER contracts. Ihemain objective will be to make payments for significant parts of the services performed bycontractors contingent on the adoption and effective performance of procedures and services thataddress environmental concerns;
(b) establishment of standards and guidelines to manage the environment as a variable within the DER;
(c) preparation, follow-up and control of the terms of reference (TOR) and of the corresponding EAsfr the roads included in the program from the second year on;

n77 - Annex 9
(d) follow-up and control of actual execution, quality and effectiveness of the mitigatory andmaximiziny measures decided for each new investment, and preparation of the information neededto guarantee good performance of the functions performed by the DER environmental teams;
(e) participation in cou0rses and promotion of events aimed at personnel training, either within theindiviud'al states, outside or abroad.
12. Staff of the state environmental control agencies will also participate in the- DER environmentalteams training in order to facilitate the adoption of common techniques and practices. In the future, thiswill assist in internalizing and consolidating environmental concepts in planning, projects, construction,maintenance and operation of roads.
D. Strengthening of State Environmental Protection Agencies
13. The objectives of the environmental component for the state environmental agencies (SEMATURin Marahao, NATURATINS and ASPLAN in Tocantns, and the CEPRO Foundation in Piaui) are asfollows: (i) training and technical specialization of agency staff; (ii) institutional strengthening aimed atcetain and effective action with respect to road undertakings; and (iii) giving instruments to the agenciesby supporting plaming activities (economic-ecological zoning) and providing the additional equipmentthat proves to be necessary for the tasks associated with this program.
14. The technical training and specialization of environmental control agency staff will be doneprimarily on the job. It wil use the activities of preparation and control of environmental planninginstruments discussed below, some of which could be financed by the Bank:
(a) economic-ecological macro-zoning, on scales between 1:250,000 and 1:1,000,000 for selectedareas, especially those in which road investmen are programmed and development projects aresupported by the state governments in their strategic plans for human settlement or development;
(b) analysis, evaluation and monitoring of the EAs and of the related mitigating and maximizingmeasures;
(c) participation in courses and promotion in events aimed at staff specialization either within the state,outside, or abroad.
The project will finance the hiring of a consulting firm or a university to develop and implement suchtraining programs.
E. Maranhao State Envirorunental ManZfgeqt Proz
15. The macro-oning of the legal Amazon region which is being prepared by the Brazilian Instituteof Geography and Statistics (IBGE) at a scale of 1:1 million, and coordinated in the state of Maranhaoby the State Secretariat for the Environment and Tourism (SEMATUR), covers about 50% of the statearea and will be completed by the end of 1993. With the state law no. 5405 of April 8, 1992, whichestablished the Environmental Protection Code, and the State Environmental System for the AppropriateUse of the State's Natural Resources, and with the new macro-zoning, SEMATUR will have adequatetools to measure the regional impacts of projects, including the road projects submitted by DER-MA.

- 78 - Annex 9
However, SEMATUR still lacks skilled staff and some equipment to effectively carry out its supervisionand monitoring responsibilities.
16. The project will include an institution-building component for SEMATUR consisting of an on-the-job training program which will be coordinated with the training program for DER-MA (para. 17). Thetraining program will be focused on the analysis, evaluation and monitoring of the EAs, particularly forthe road projects, and of the supervision and control of the implementation of the related mitigating andmaximizing measures. The project will also finance laboratory equipment and computer hardware andsoftware which are necessary for the implementation of monitoring and surveillance systems, particularlyfor the areas affected by the roads to be financed under the project.
17. DER-MA will establish a small environmental management unit, responsible for the functionsdescribed in para. 10. At least four (4) technical professional staff interested in environmentalmanagement, to of whom will be permanently assigned to the environmental unit, will be selected andtrained to carry out the DER enviromnental management responsibilities. The training program willinclude the participation of the above and other DER staff in short courses and seminars to be organizedby DNER and ABDER, and of on-the-job training to be provided by a specialized consulting firm. Thetechnical assistance and on-the-job training contract will involve the following tasks:
(a) a review of he general specifications for road works in effect within road agencies, internalizingthe environment as a variable, and implementing the new specifications in DER contracts;
(b) establishment of standards and guidelines to manage the environment as a variable within the DER;and
(c) preparation, follow-up and control of the terms of reference (TOR) and of the corresponding EAsfor the roads included in the program from the second year on.
18. The cost estimates and financing plan of the environmental components of the Maranhao subprojectare shown in Table 5, Annex 10.
F. Piaui State Environmental Management Program
19. Recently the government of the state of Piaui abolished the former Secretariat of Environment,Science, Technology and Urban Development, and transferred its functions of environmental planning,licensing, monitoring and management to the CEPRO Foundation, connected to the Office of theSecretary of Planning (SEPLAN). Even though the CEPRO Foundation is still not functioningsatisfactorily, mainly because its technical staff have little experience, the foundation has been workingin conjunction with DER/PI in an effort to adapt its works to the requirements of protecting theenvironment.
20. The Piaui subproject will include a component to strengthen the DER-PI environmental unit as wellas a training and institution building component for the CEPRO Foundation. As for Maranhao, thecomponent for CEPRO will be focused on the analysis, evaluation and monitoring of the EAs,particularly for the road projects, and of the supervision and control of the implementation of the relatedmitgating and maxim1zing measures. The project will also finance laboratory equipment and computerhardware and software which are necessary for the implementation of monitoring and surveillancesystems, particularly for the areas affected by the roads to be financed under the project. The CEPRO
-79 - Annex 9
component will also include financing for the studies which are necessary to establish the native palmreserve of Miguel Alves, which was recommended in the EA for the upgrading of Miguel Alves - Portoto mitigate the impacts of the project on the local groups which derive their revenues from the babassupalm.
21. During project preparation, DER-PI undertook an extensive review of its standards and worksspecifications for the purpose of adapting them technically to legal requirements, including forenvironmental protection. The Bank has reviewed and found satisfactory these new standards andspecifications, which make payments for significant parts of the services performed by contractorscontingent on the adoption and effective performance of procedures and services that addressenvironmental concerns.
22. DER-PI will establish an envirommental management committee responsible for the functionsdescribed in para. 10. At least four (4) technical professional staff interested in environmentalmanagement, two of whom wil be permanently assigned environmental tasks, will be selected and trainedto carry out the DER environmental management responsibilities. The training program will include theparticipation of the above and other DER staff to short courses and seminars to be organized by DNERand ABDER, and of on-the-job training to be provided by a specialized consulting firm. The technicalassistance and on-the-job training contract will involve the following tasks:
(a) establishment of standards and guidelines to manage the environment as a variable within the DER;and
(b) preparation, follow-up and control of the terms of reference (OR) and of the corresponding EAsfor the roads included in the program from the second year on.
23. The cost estimates and financing plan of the environmental components of the Piaui subproject areshown in Table 5, Annex 1.
G. Tocantins State Environmental Mangement Program
24. 'The agency responsible for the environment in the state of Tocantins is the Nature Foundation ofTocantins-NATURATINS. The State Planning and Coordination agency (ASPLAN) is responsible forcarrying out the economic-ecological zoning of the state. But due to lack of resources, the zoning workshave been parayzed for some time. ASPLAN and NATURATINS have developed a plan for technicaland institutional strengthening which would enable them to move quicldy ahead in the performance oftheir legal functions. The project will provide support to implement this plan, including to:
(a) complete the economic-ecological macro-zoning of the state (on a scale of 1:1,000,000), which isto be concluded before December 31, 1994;
(b) train NATURATINS personnel on the analysis, evaluation and monitoring of the EAs, particularlyfor the road projects, and of the supervision and control of the implementation of the relatedmitigatig and maximizing measures;
(c) finamce laboratory equipment and computer hardware and software which are necessary for theimplementation of monitoring and surveillance systems, particularly for the areas affected by theroads to be financed under the project; and

- 80 - Annex 9
(d) finance the studies which are necessary to establish the environmental protection reserve of Riodo Peixe river mouth, which was recommended in the EA for the upgrading of the Gurupi-Peixeroad section (Annex 13).
25. During project preparation, SEINF-TO undertook an extensive review of its standards and worksspecifications for the purpose of adapting them technically to legal requirements, including forenvironmental protection, in effect. The nmssion reviewed and found satisfactory these new standardsand specifications, which make payments for significant parts of the services performed by contractorscontingent on the adoption and effective performance of procedures and services that addressenvironmental concerns.
26. SEINF-TO will establish a small environmental management unit, responsible for the functionsdescribed in para. 10. At least four (4) technical professional staff interested in environmentalmanagement, to of whom will be permanently assigned to the environmental unit, will be selected andtrained to carry out the DER environmental management responsibilities. The training program willinclude the participation of the above and other DER staff to short courses and seminars to be organizedby DNER and ABDER, and of on-the-job training to be provided by a specialized consulting firm. Thetechnical assistance and on-the-job training contract will involve the following tasks:
(a) establishment of standards and guidelines to manage the environment as a variable within the DER;and
(b) preparation, follow-up and control of the terms of reference (TOR) and of the corresponding EAsfor the roads included in the program from the second year on.
27. The cost esfimates and financing plan of the environmental components of the Tocantins subprojectare shown in Table 5, Annex 12.

-81 - Annex 10
STATE MGHWAY MANAGEMEff IIPOlC
Maranhao SubpKoject Desiption. Costs-and Flnandng
A. Subprojert Description
1. Objectives. The proposed subproject would check the firther deterioration of the state roadnetworks and improve their condition by: (a) ensuring adequate priority and funding for the rehabilitationand maintenance versus the new-construction and upgrading components of the state road programs; and(b) designing and implementing appropriate highway rehabilitation, maintenance and upgrading strategiesand programs, and improving the management of state road maintenance activities. It would also helpto: (c) develop and improve compliance with environmental standards for state roads.
2. Description. The subproject would include:
(a) a policy and Institutional development program to: (i) prepare and annually update the state'smulti-year and anmual road expenditure and funding programs, in accordance with policies andeconomic criteria satisfactory to the Bank, and, to this effect, strengthen the state road agency'splanning system; (i) develop and superwise efficient rehabilitation and maintenance strategies andprograms, and strengthen the agency's contract and project management systems; and (iii) developappropriate capability in the Government to implement and monitor environmental standards andguidelines for state roads;
(b) a rehablitation and maintenance program consisting of the rehabilitation, resurfacing, andperiodic and routine maintenance components of the state's 1994-98 road program; and
(c) an upgrading program, consisting of the highest-priority improvement and paving componentsof the state's 1994-98 road program.
(a) Policy and Institutional Development Program
3. Preparation and Review of State Road Programs, Budgets, and Cost Recovery. The objectiveof this action program is to ensure that appropriate priority is given to the rehabilitation and maintanceof existing networks in the state's annual and multi-year road programs, and that recovery of road costsfrom road users is adequate. DER-MA would anmually update the multi-year and annual road programsto reflect implementation progress and funding expectations, as well as their improved information andanalytical capabilities (para. 4), in accordance with policies and economic criteria satisfactory to the Bank.The project would provide technical assistance and training of agency planning staff for this purpose(Annexes 7 and 8). The Bank would annually review these programs to ensure that the priorities remainadequate. The Bank would also annually review the level of state revenues from road user charges.
4. Design and Implemenion of Maintenance and Upgradlng Strategies and Programs. Theobjectives of this action program are to help DER-MA to: design and monitor appropriate network

82 - Annex 10
maitenance and upgrading strategies and programs; and to effectively manage its contracts and monitortheir projects and programs. For that purpose, DER-MA has, in the course of project preparation,defined sets of actions to: carry out regular pavement condition, traffic, axle-weight and accident surveys;design and monitor network maintenance and upgradmg strategies and programs based on appropriatetechnical and economic analyses; and strengthen their contract management and project and programimplementation monitoring systems. The project would provide technical assistance and training of stafffor these purposes (Annexes 7 and 8).
5. Environmental Management. The objective of this action program is to assist the stategovernment and DER-MA to prepare state environmental guidelines for roads, develop institutionalcapabilities to carry out appropriate EAs for all their road programs and projects, and to enforce theenvironmental standards and guidelines for roads. In the course of project preparation, the stategovernment and DER-MA have defined sets of actions to: prepare state environmental guidelines forroads, taking into account the environmental guidelines for the road subsector, which have been preparedby DNER; and to establish or strengthen an environmental uni. in DER-MA with adequately-trained staffto carry out the EAs and to implement the environmental guidelines. The project would provide technicalassistance and training of staff for these purposes, including for carrying out of EAs of the proposed roadprograms (Annex 9, section E).
(b) Rehabilitation and Maintenance Program
6. The rehabilitation andmaintenance program would TiAbUm: Scowof RdgtWumalWnem e Prominclude the rehabilitation and )resurfacing of the paved network, xYar Rehabili"tion Rifi Mainiinans Maimn2Iand the periodic and routine d Unpavedmaintenance of both the paved and 1994 so ISO 1,900 3,200
unpaved networks, as defined on 1995 50 100 1,900 3,000the basis of appropriate network 1mintenmace strategies, economic 1996 50 100 2,100 2,800
criteria, and methodologies. In 1997 100 2,300 2,600
general, the selected maintenance 1998 50 2,500 2,500strategies for the paved networksconsist of carrying out: Total 150 500 10,700 14,100(a) resurfacing works on paveusections which otherwise would soon reach a level of deterioration requiring extensive rehabilitation,through appropriate slurry seal, surface treatment, or asphalt concrete overlay techniques, depending upontraffic levels; (b) pavement rehabilitation works on sections which have already reached or exceeded theirlifetime, through appropriate techniques ranging from asphalt concrete overlays to complete reconstructionof pavement; and (c) routine and periodic maintenance works as needed, including patching of potholes,maintenance of drainage systems, shoulders, and signaling on the entire networks. The selectedmaintenance strategies for the unpaved network consist of carrying out: (d) periodic grading andregraveling works, consistent with traffic loads and the quality of materials; and (e) routine maintenanceworks as needed. The mainenance strategy is discussed in section B, Annex 3. The state intends tocarry out the entire rehabilitation program over a period of about five years. The pluriannual programis summarized in Table 1 above.

- 83 - Annex 10
(c) IJpgrdne -and Paying lEsEam
7. The state upgrading and paving strategy isdefined in Annex 3, section C. The scope of the Taw 2: Scoue of Unmdnor Pamuupgrading and paving program has been defined on (K Uo)the basis of this strategy and of the financial capacity Yar Uadins MMi luof the state. The state pluriannual upgrading and 1994 - ISO 750
paving program is summarized in Table 2 hereafter. 19S 200 20
1995 200 2001996 - 200 200
B. First-Year Program 1997 - 100 100
8. The first-year program, which consists of the 1998 - 100 100
investments which will be initiated during the first TOWi - 750 7S0
year of the subproject are defined in Table 3hereafter. It would consist of the rehabilitation orresurfacing of eight paved road sections totaling 413.5 km and of the upgrading and paving of three roadsections totaling 308 kn. The current traffic and surface condition of the roads and the standard technicalsolutions selected for the proposed investments are summarized in Table 3. The final engineering designsand economic evaluation of the proposed investments have been completed, reviewed by the appraisalmission, and found satisfactory. A summary of the cost estimates and economic evaluation of each ofthese investments is presented in Annex 14.
Tabl. 3: Ey.ar Prous
LIb Tfic Rolugh Csm
Upgtding + MA-135 Psidoote Dutm/CoUb 74.7 251 - 11.8 a 30a0 G + 4cm SA 6.8PaVIAg MA.006 Bob - Tmno F*agaao 143.0 IS6 - 10.0 0 40= G + 2 ST 174
MA-006 Tmo FOSg.-Ako PamaIb 90.3 230 9.2 0 40cm + 3cm SA 12.7
308
u bablIUM10 Of MA-926 Codo - D<mu_ 15.0 603 12 5.0 SA RC + 4 so S Am SA 1.0Pwved Road MA,426 Codo - rumbim MA-008 24.0 154 12 5.5 SA RC + 3 to 4cm SA 1.4
Br-316 - Vizariuo rIec 32.0 443 20 4.7 ST 3ac SA 1.5MA-2301034Bsio -Sao Boardo 56.0 162 12 5.3 SA 4ac SA 3.7MA.23OIOS34Ch%Mh- Bito 72.0 201 12 4.7 S8 4cSA 2.8MA?434Br.316 -Coeho Neto 84.5 272 14 6.4 SA 4cm SA 4.4ML.014 Sao Beat - ViYnn 92.0 50S 6 3.8 SA 3cm SA 4.8MA-014 Pinuiro - Sao Bonmo 38.0 352 6 3.7 SA 3cm SA 0.5
413.5 23.S
0 - Gmv.ISA- S/AspbaSTu Suc. Tre_ahzRC- Recylig of C(

-84 - Annex 10
C. SubWroJect Cost and llnandng
9. The total cost of the subproject isestimated at US$209.5 million equivalent. _The foreign exchange cost component is ( i2 gquivalss)
estimated at US$83.8 million, or 40%, and c _ca Ni ld .M J5athe tax component at about US$31.4 million, 54.0 36.0 90.0
or 15%. Ihe total project cost includesphysical contingencies of US$13.4 million or R a 19.6 13.1 32.7about 79% of base cost, and price sfdiee 5.0 33 8.3
contingencies of US$8.2 million (or about 4% T.A. TnUiIW 1.7 1.2 2.9
of base cost plus physical contingencies),estimated on the basis of the disbursement 32.4 21.6 54.0schedule and of a 2.8% annual price TOW DM Cott 1n.7 752 187.9
escalation for both local and foreign b C . 8.0 5.4 13.4expenditures expressed in US dollars. Theestimated costs of the individual components u C4.are detailed in Table 5 hereafter and are TOa Coa 125 8.9 209S
summarized in Table 4. ^inr
10. The subproject would be fianced sk 79.0 79.0
from the proposed Bank loan of US$79.0 s 125.6 4.9 130.5
million (or 38% of the subproject cost) andfrom the state's own resources for US$131.1million (or 62% of the project cost). The financing plan of the subproject is detailed in Table S hereafter,and is summarized in Table 4. The Borrower will provide the necessary subproject counterpart funds,and retroactve financing in an amomt of not more than 10% of the loan amount for civil works, goods,and consultant and training expenditures incurred not earlier than twelve months before the date of theloan agreement.
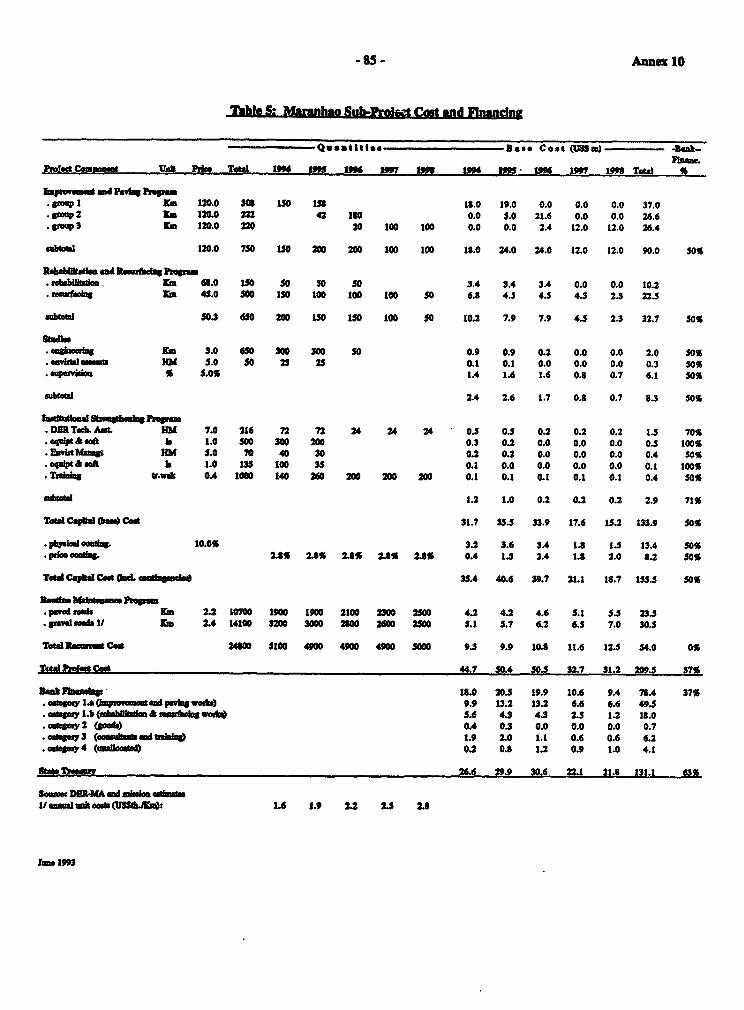
- 85 - Annex 10
able5: __n.Su oI_ Cost and Elnangna
Quanitlies - os Cost IS) - k-
Ptist Cy m U ei TOWl w- p9S am WUT 1me V ff - 1ON 19t _ 19911 TLOW
ImpNovst -d Pawla p aow. UP I X 120.0 30 ISO Ms 18.0 19.0 0.0 0.0 0.0 37.0.oup2 Km 120.0 2 42 It0 0.0 5.0 21.6 0.0 0.0 26.6.ttrowp3 KM 120.0 220 20 t1o 100 0.0 0.0 2.4 12.0 12.0 26.4
sAlowb 120.0 750 150 200 200 100 100 18.0 24.0 24.0 12.0 12.0 90.0 50%
IAsakmgh and Redami&dPt.p.ubab il .. Km 6.0 IO 50 s0 so 3.4 3.4 3.4 0.0 0.0 10.2.rwating KM 45.0 5no 150 100 100 1C0 s0 6.8 44 4.5 4.5 23 22.5
subtol $0.3 650 200 n 150 100 50 10.2 7.9 7.9 44 2.3 32.7 50%
aauisuiig rim 3.0 650 300 300 s0 0.9 0.9 0.2 0.0 0.0 2.0 50%.sm'tammm K_M 5.0 54 25 25 0.1 0.1 0.0 0.0 0.0 0.3 50%.wetvkao 5 5.0% 1.4 1.6 1.6 0.8 0.7 6.1 50%
subtotal 2A4 2.6 1.7 0.8 0.7 8.3 50%
.DU Tb.Aa AI KM 7.0 216 72 72 24 24 24 0.5 0.5 0.2 0.2 0.2 14 70%
.cqdopt a b 1.0 500 300 200 0.3 0.2 0.0 0.0 0.0 0S 100%
.E NI_ f d JKM 5.0 70 40 30 0.2 0.2 0.0 0.0 0.0 0.4 50%
.quiipt ao a 1.0 135 100 3S 0.1 0.0 0.0 0.0 0.0 0.1 100%
.Tht tt.v OA 1000 140 260 200 200 200 0.1 0.1 0.1 0.1 0.1 OA SO%
bal 1.2 1.0 0.2 0.2 0.2 2.9 71%
Tot C al ( Cot 31.7 3.5 33.9 17.6 1S.2 133. 5 0%
ph. ls octa. 10.0% 3.2 3.6 3.4 1.8 1.5 13.4 50%,p -O & 2US% 2.US 2.8% 2as 2US 0.4 1.3 2.4 1.8 2.0 8.2 50%
Tott Capkl C ad t _ 3S.4 40.6 39.7 21.1 18.7 1555 50s%
paved lod Km 2a 10700 1900 1900 2100 2300 25eo 4.2 4.2 4.6 5.1 S.5 23Ssmv l toads/ Km 2.4 14100 3200 3000 2300 2600 2500 S.1 5.7 6.2 6.5 7.0 30.S
TotalltmuCod 2380 5100 4900 4900 4900 SOO 9.3 9.9 10.8 11.6 12.S 54.0 0%
Tod PWalt Cog 44.7 50.4 50. 32.7 31.2 2094 37S
Book Jbsndqi 18.0 204 19.9 10.6 9.4 78.4 37%aotaoIy 1..psovinmtnd pehg woeb) 9.9 13.2 13.2 6.6 6.6 49.5.ssmy Lb (Sabilma A mn41obwot) 5.6 4.3 4.3 2.3 1.2 18.0
.adeg 2 (gos 0.4 0.3 0.0 0.0 0.0 0.7.op_y 3 (00-4h" ad aI t 1.9 2.0 1.1 0.6 0.6 6.2o.*oy 4 (ullloa) 0.2 0.8 1.2 0.9 1.0 4.1
StateTnow 26.6 29.9 30.6 22.1 21.8 131.1 63%
Sou$*Wm DE-M sd 4 mi ti1anmladtUsiltTJ8sIbJK): Ii 1.9 2.2 25 2.
hoo 1993

-86- Annex 11
BRAZI
STATE HIGHWAY MANAGEMENT n PROJECT
Piaui Subgrolect Description. Costs and Financing
A. Subgroject Descripil
1. Objectives. The proposed subproject would check the further deterioration of the state roadnetworks and improve their condition by: (a) ensuring adequate priority and funding for the rehabilitationand maintenance versus the new-construction and upgrading components of the state road programs; and(b) designing and implementing appropriate highway rehabilitation, maintenance and upgrading strategiesand programs, and improving the management of state road maintenance activities. It would also helpto: (c) develop and improve compliance with environmental standards for state roads.
2. Description. The subproject would include:
(a) a policy and institutional development program to: (i) prepare and annually update the state'smulti-year and annual road expenditure and funding programs, in accordance with policies andeconomic criteria satisfactory to the Bank, and, to this effect, strengthen the state road agency'splanning system; (ii) develop and supervise efficient rehabilitation and maintenance strategies andprograms, and strengthen the agency's contract and project management systems; and (iii) developappropriate capability in the Government to implement and monitor environmental standards andguidelines for state roads;
(b) a rebabilitation and maintenance program consisting of the rehabilitation, resurfacing, andperiodic and rouftine maintenance components of the state's 1994-98 road program; and
(c) an upgrading program, consisting of the highest-priority improvement and paving componentof the state's 1994-98 road program.
(a) Poricy and Institutional Derloment Progm
3. Preparation and Review of State Road Programs, Budgets, and Cost Recovery. The objectiveof this action program is to ensure that appropriate priority is given to the rehabilitation and maintenanceof existing networks in the state' annual and multi-year road programs, and that recovery of road costsfrom road users is adequate. DER-PT would annually update the pluriannual and annual road programsto reflect implementation progress and funding expectations, as well as their improved information andanalytical capabilities (para. 4), in accordance with policies and economic criteria satisfactory to the Bank.The project would provide technical assistance and training of agency planning staff for this purpose(Annexes 7 and 8). The Bank would annually review these programs to ensure that the priorities remainadequate. The Bank would also annually review the level of state revenues from road user charges.
4. Design and Implementation of Malntenance and Upgrading Strategies and Programs. Theobjectives of this action program are to help DER-PI to: design and monitor appropriate network

- 87 - Annex 11
maintenance and upgrading strategies and programs; and to effectively manage its contracts and monitorits projects and programs. For that purpose, DER-PI has, in the course of project preparation, definedsets of actions to: carry out regular pavement condition, traffic, axle-weight and accident surveys; designand monitor network maintenance and upgrading strategies and programs based on appropriate technicaland economic analyses; and strengthen their contract management and project and programimplementation monitoring systems. Tbe project would provide technical assistance and training of stafffor these purposes (Annexes 7 and 8).
5. Environmental Management. The objective of this action program is to assist the stategovernment and the road agency to prepare state environmental guidelines for roads, develop institutionalcapabilities to carry out appropriate EAs for all their road programs and projects, and to enforce theenvironmental standards and guidelines for roads. In the course of project preparation, the stategovernment and the agency have defined sets of actions to: prepare state environmental guidelines forroads, taking into account the environmental guidelines for the road subsector, which have been preparedby DNER; and to establish and strengthen an environmental committee in the road agency withadequately-trained staff to carry out the EAs and to implement the environmental guidelines. The projectwould provide technical assistance and training of staff for these purposes, including for carrying out ofEAs of the proposed road programs (Annex 9, section F).
(b) Rebnilitaion and Maintennoe Progm
6. The rehabilitation andmaintenance program would bl 1 Sla of ReMabfItalm md haIaw Zmminclude the rehabiltation and )resurfacing of the paved network, xsRehr b ton RManc o M dn_"
and the periodic and routine Pd Udmaintenance of both the paved and 1994 102 35 1,S00 4,300unpaved networks., as defined on 100 1,500 4,500the basis of appropriate networkmaintenace strategies, economic 1996 86 97 1,S00 4,6S0criteria, and methodologies. In 1997 80 1,550 4,800general, the selected maintenance 1998 - - 1,750 5,000strategies for the paved networksconsist of carrying out: TOtS! 368 232 7,800 232(a) resurfacing works on pavedsections which otherwise would soon reach a level of deterioration requiring extensive rehabilitation,through appropriate slurry seal, surfae treatment, or asphalt concrete overlay techniques, depending upontraffic levels; (b) pavement rehabilitation works on sections which have already reached or exceeded theirlifetime, through appropriate techniques ranging from asphalt concrete overlays to complete reconstructionof pavement; and (c) routine and periodic maintenance works as needed, including patching of potholes,maintenance of drainage systems, shoulders, and signalling on the entire networks. The selectedmaintenance strategies for the unpaved network consist of carrying out: (d) periodic grading andregraveling works, consistent with traffic loads and the quality of materials; and (e) routine maintencworks as needed. The maintenance strategy is discussed in section B, Annex 3. The state intids tocarry out the entire rehabilitation program over a period of about five years. The pluriannual programis summarized in Table 1 above.

-88- Annex 11
(c) Upgrading and Paying Proam
7. The state upgrading and paving strategy isdefined in Annex 3, section C. The scope of the Table 2: Sean. of Un.tn. PM=-
upgrading program has been defined on the basis ofthis strategy and of the financial capacity of the state. £ U'ading frYP TOtIaThe state pluriannual upgrading program is 1994 118 - I1summarized in Table 2 hereafter.
l99S 117 68 185
1996 75 182 257
B. Iilrst-Year Program 1997 7S 100 17S
8. The first-year program, which consists of the 1998 70 t00 170investments which will be initiated during the first ToWl 450 4S0 900year of the subproject are defined in Table 3hereafter. It would consist of the rehabilitation orresurfacing of two paved road sections totaling 137.7 kam, and of the upgrading and gravel surfacing oftwoo road sections totaling 118.3 km. The current traffic and surface condition of the roads and thestandard technical solutions selected for the proposed investments are summarized in Table 3. The finalengineering designs and economic evaluation of the proposed investments have been completed, reviewedby the appraisal mission, and found satisfactory. A summary of the cost estimates and economicevaluation of each of these investments is presented in Annex 14.
TabW. 3: Fi*Yar Pwom
L Tnflic Roughn Cot
Upguding+ H-254UiDiwe/S. Fi1vA I-B 70.4 59 30.8 B E+D+GS 4.7GOavd Sucin M-P1112MigAmI /Petto 47.9 20 30.8 0 E+D+03 2.8
118.3
R dhabilim of P1-140 BaL P-144115. . Nano 102.3 390 i5 8.4 DP K + ST s.0PwvedbRI Hl.12N*wNWGgue1A1ve. 3SA 165 23 7.4 SA Xc + ST 0.S
137.7 5.8
0 0 mw)SA- SviA4*b*ST= Suwre Trat_ntRC- RadcoeSg of Cow

-89 - Annex 11
C. SubproJect Cost and F'nandne
9. The total cost of the subproject isestimated at US$140.9 million equivalent. ITable na4SbmianCobda"mThe foreign exchange cost component is (USs $iion Oequivt)
estimated at US$56.4 million, or 40%, and coaim ntEad,ian hI the tax component at about US$21.1 million, Upndiw . 36.2 22.6 S8.or 15 %. The total project cost includesphysical contingencies of US$9.1 million or RbiiWioO 14.2 9.5 23.7
about 7 % of base cost, and price Sludio. 3.4 2.2 5.6
contingencies of US$6.3 million (or about 4% T.A. & Ttimng 1.7 1.2 2.9
of base cost plus physical contingencies),estimated on the basis of the disbursement intee 20.7 13.8 34.5
schedule and of a 2.8% annual price TOWlBMCoud 76.2 0.3 1253
escalation for both local and foreign Pyd Conlig. 5.5 3.6 9.1expenditures expressed in US dollars. Theestaed costs of the individual components Pike cl. 3.8 2.S 63are detailed in Table 5 hereafter and are Total Cost 85.5 55.4 140.9summarized in Table 4. I Fz?
10. The subproject would be financed Bank - 54.0 S4.0from the proposed Bank loan of US$54.0 Sute 85.5 1.4 86.9
million (or 38% of the subproject cost) andfrom the state's own resources for US$86.9million (or 62 % of the project cost). The financing plan of the subproject is detailed in Table 5 hereafter,and is summarized in Table 4. The Borrower will frovide the necessary subproject counterpart funds,and retroactive financing in an amount of not more than 10% of the loan amount for civil works, goods,and consultant and training expenditures incurred not earlier than twelve months before the date of theloan agreement.

-90- AnneK 11
Table 5: Piaui Sub-Prolect Cost and Flnandng
Quasitstl. -. -. s. Cost (WS ) --
Ptral Com .- U P4M TOW V 994 195 96 1V97 199R 994 1 96 197 t 9 TOWl %
lJp-ams and Pah4n P-g,aohIpovcm_nl KM 64.0 150 1tS 32 7.6 2.0 0.0 0.0 0.0 9.6
. pvui KM 45.0 118 1I8 0.0 0.0 5.3 0.0 0.0 5.3
.1up. ape-vIn KM 95.0 332 68 64 100 10 0.0 64 6.1 94S 9.5 31.Sfaid. rroad Kim 41.0 300 aS 75 70 70 0.0 3.5 3.1 2.9 2.9 12.3
sbtot 65.3 900 1tl 1S5 257 170 170 7.6 12.0 14.5 12.4 12.4 58.6 50%
RebabMadom Pcpm.dtA I Xm S0.0 368 102 100 86 80 5.1 S.0 4.3 4.0 0.0 18.4.utdid 2 KM 23.0 232 35 100 97 0.8 2.3 2.2 0.0 0.0 53
subtoftl 39.6 600 137 200 183 SO 0 5.9 7.3 6.S 4.0 0.0 23.7 50%
00giering KM 3.5 S50 200 250 300 tOO 0.7 0.9 1.1 OA 0.0 3.0.airi. au 1HM 4.0 50 20 20 10 0.1 0.1 0.0 0.0 0.0 0.2
. asaiwviuis S% 3.0% 0.4 0.6 0.6 0.5 0.4 2.5
subeom 1.2 1.5 1.7 0.8 0.4 5.6 50%
hiIaaindo&ftnhobabg lPt.DER-P TA 10 7.0 240 72 72 36 36 24 0. 0.5 0.3 0.3 0.2 1.7 75S
eqv* &oaf* 1.0 503 250 250 0.3 0.3 0.0 0.0 0.0 0's tOO%C.-0 TA Kw 4.0 50 30 20 0.1 0.1 0.0 0.0 0.0 0.2 50%
.quip t& soft b 1.0 125 100 25 0.1 0.0 0.0 0.0 0.0 0.1 100%
.w. iaubdng tr.wk OA 1000 200 200 200 200 200 0.1 0.1 0.1 0.1 0.1 OA 50%
abtag 1.1 0.9 0.3 0.3 0.2 2.9 75%
TOW C ita rn) COb 15.7 21.8 23.0 17.S 13.0 91.0 51%
P. Su coang. 10.0% 1.6 2.2 2.3 1.8 1.3 9.1 50%.0piooo l0 . 2.8% 2.8% 2.8% 2us% 2.8% 0.2 0.9 1.6 I.8 1.7 6.3 50%
TotOl Catal Coi GadL mihgmadu) 17.5 24.9 27.0 21.1 16.0 106.4 51%
Rbabe MUraanmm Panm.prnd mads Km 1.0 7800 1500 1500 15m0 1550 1750 1.1 1.2 1.4 1.7 2.1 7.5.gvol foods if KM 1.2 23250 4300 4500 4650 4800 5000 4.6 5.0 53 5.7 6.4 27.0
Toed lacunR Cast 31050 5S00 6000 6150 63S0 6750 5.6 6.2 6.8 7.4 8.5 34.5 0%
Trn! Prod Ce 23.1 31.1 33.8 28.5 24.5 140.9 as8
Beak lInAndnp 9.0 12.7 13.6 10.6 8.1 54.0 38%auegowy LA (impovamt and pavg wob) 4.2 6.6 8.0 6.8 6.B 32.3
o.dooy lb (rabibawtlan ad t 8uaclag wo) 3.2 4.0 3.6 2.2 0.0 13.1, uoq 2 (goodd) 0.4 0.3 0.0 0.0 0.0 0.6
. esgo 3 (e_ab ai tadaing) 1.2 13 1.2 0.1 0.4 4.8o.egay 4 (Iomalleww 0.1 0.S 0.8 0.9 0.9 3.1
&t.T _amq 14.1 IS.4 20.2 17.8 16.4 86.9 62%
Source: DER-M nd moman a_ ma_e11 _a ___ maimboan oods 0.84 0.98 1.12 1.26 1.4 0.5
1.2 1.30 1.35 1.40 1.50
IUDO 1993

- 91 - Annex 12
STATE HGHWAY MANAGEMENT 11 PROJECT
Tocantins Subgroject Description. Costs and Financini
A. Subgrejlct Desotion
1. Objectives. The proposed subproject would check the fiuther deterioratior the state roadnetworks and Improve their condition by: (a) ensuring adequate priority and funding fox te rehabilitationand maintenance versus the new-construction and upgrading components of the state road programs; and(b) designing and implementing appropriate highway rehabilitation, maintenance and upgrading strategiesand programs, and improving the management of state road maintenance activities. It would also helpto: (c) develop and improve compliance with environmental standards for state roads.
2. Description. The subproject would include:
(a) a policy and institutional development program to: (i) prepare and annually update the state'smulti-year and annual road expenditure and funding programs, in accordance with policies andeconomic criteria satisfactory to the Bank, and, to this effect, strengthen the state road agency'splanning system; (ii) develop and supervise efficient rehabilitation and maintenance strategies andprograms, and strengthen the agency's contract and project management systems; and (iii) developappropriate capability in the Government to implement and monitor environmental standards andguidelines for state roads;
(b) a rehabilitation and maintenance program consisting of the rehabilitation, resurfacing, andperiodic and routine maintenance components of the state's 1994-98 road program; and
(c) an upgrading progam, consisting of the highest-priority improvement and paving componentsof the state's 1994-98 road program.
(a) PoliHy and nstitutional Development Program
3. Preparation and Review of State Road Programs, Budgets, and Cost Recovery. The objectiveof this action program is to ensure that appropriate priority is given to the rehabilitation and maintenanceof existing networks in the states' anmnal and pluriannual road programs, and that recovery of road costsfrom road users is adequate. SEINF-TO would anmually dpdate the plurianmal and annul road programsto reflect implementation progress and funding expectations, as well as their improved information andanalytical capabilities (para. 4), in accordance with policies and economic criteria satisfactory to the Bank.The project would provide technical assistance and training of agency planning staff for this purpose(Annexes 7 and 8). The Bank would annually review these programs to ensure that the priorities remainadequate. The Bank would also annually review the level of state revenues from road user charges.
4. Design and Implementation of Maintenance and Upgrading Strategies and Programs. Theobjectives of this action program are to help the road agency to: design and monitor appropriate network

92- Annex 12
maintenance and upgrading strategies and progrsms; and to effectively manage their contracts and monitortheir projects and programs. For that purpose, the agency has, in the course of project preparation,defined sets of actions to: carry out regular pavement condition, traffic, axle-weight and accident surveys;design and monitor network maintenance and upgrading strategies and programs based on appropriatetechnical and economic analyses; and strengthen their contract management and project and programimplementation monitoring systems. The project would provide technical assistance and training of stafffor these purposes (Annexes 7 and 8).
S. Environmental Management The objective of this action program is to assist the stategovenument and the road agency to prepare state environmental guidelines for roads, develop institutionalcapabilities to carry out appropriate EAs for all their road programs and projects, and to enforce theenvironmental standards and guidelines for roads. In the course of project preparation, the stategovermment and the agency have defined sets of actions to: prepare state environmental guidelines forroads, taking into account the environmental guidelines for the road subsector, which have been preparedby DNER; and to establish or strengthen environmental units in the road agency with adequately-rainedstaff to carry out the EAs and to implement the environmental guidelines. The project would providetechnical assistance and tainig of staff for these purposes, including for carrying out of EAs of theproposed road programs (Annex 9, section G).
(b) Rehabilitation and Maintenance Poam
6. The rehabilitation andmaintenance program would T be 1: Sem of PIabafl atm an ho rine Pminclude the rehabilitation and Iresurfacing of the paved network, Xuz R g _ Mliand the periodic and routine | vgd dmaintenance of both the paved and 1994 30 30 SSO 6,500
unpaved networks, as defined on 199 30 30 9S0 6,200the basis of appropriate networklmainance strategies, economic 1996 so 5o 1,20 6,000criteria, and methodologies. In 1997 40 20 1,SS0 6,000general, the selected mantence 1998 20 l,SS0 6,000
strategies for the paved networksconsist of carrying out: T 150 150 5,8S0 30,700(a) resuracing works on pavedsections which otherwise would soon reach a level of deterioration requiring extensive rehabilitation,through appropriate slurry seal, surface treatment, or asphalt concreteoverlay techniques, dependingupontraffic levels; (b) pavement rehabilitation worls on sections which have already reached or exceeded theirlifetime, through appropria tetchques ranging from asphalt concrete overlays to complete reconstructionof pavement; and (c) routine and periodic maintenance works as needed, including patching of potholes,maintenance of drainage systems, shoulders, and sigalling on the entire networks. The selectedmaintenance strategies for the unpaved network consist of carrying out: (d) periodic grading andregraveling works, consistent with traffic loads and the quality of materials; and (e) routine maintenanceworks as needed. The maintenance strategy is discussed in section B, Annex 3. The state intends tocarry out the entire rehabilitation program over a period of about five years. The plurianmual programis summarized in Table 1 above.

-93 Annex 12
(c) Ilgading and Payin rog ram
7. The etate upgrading and paving strategy isdefined in Annex 5, section C. The scope of the Tab 2: Scow of UmmdN. Poram
upgrading and paving program has been defined on zxil)the basis of this strategy and of the financial capacity Xds P n *& i.a-of the state. The state pluriannl upgrading and - -20 20paving progm is summarized in Table 2 hereafter. 1995 300 300
1996 - 200 200
D. Est-Year Pro=m 1997 - 200 200
8. The first-year program, which consists of the 1998 - 100 100investments which will be inidated during the first TOWal 1.000 1,000year of the subproject are defined in Table 3hereafter. It would consist of the rehabilitation orresurfacing of two paved road sections totaling 62.7 km and of the upgrading and paving of three roadsections totaling 403.7 km. The current traffic and surface condition of the roads and the standardtechnical solutions selected for the proposed investments are summarized in Table 3. The finalengineering designs and economic evaluation of the proposed investments have been completed, reviewedby the appraisal mission, and found satisfactory. A summary of the cost estimates and economicevaluation of each of these investments is presented in Annex 14.
LOW&U Taft RKougme Costan t (a hm WS S Omni
Uppala + 70 45 0.P. 55.8 209 13.9 0 30aL G+ 2.. SA 89PNva T10.080 53.0 197 12.2 O 30cO. 0+2am SA 5.44
S8O 4S 1 81.4 197 - 124 G 30cmG + 2.. LA 7.39TOM222AuPotio 89.3 395 16.0 a 30anO (+2.. SA 15M10-280 OupI-Peox 70.2 191 - 13.5 G 30m G + 2an SA 9.9610-336 1OukCiO-_P.PMO 54.0 341 14.9 (3 30cm 0+ 2m SA 7.20
403.7 54.11
_Ih ebAmof T0-25SHW.BR5-Cdithui 31.0 209 12 63 ST RC + SaAC 0.90Pvmd Rou T-354S Et. BR-153-PIm 31.7 110 12 6.6 ST RC + 8$SS 0.
62.7 1.174
a3- GavelSLA Sm&A%*AST SWAM T,eeonT_R:- RbOW oMfMCAC- Aqbl Coocnt8S Sb'yw Sod

-94 - AnnexU
C. Subproject Cost and Flnandng
9. The total cost of the subproject isestimated at US$252.4 million equivalent. T"ahkL SALEa ietCostsd adeThe foreign exchange cost component is (USs m= equvalen)estimated at US$101.0 mitlion, or 40%, and 5MaI hczuea .I u1the tax component at US$37.9 million, or U9PdiWa 76.8 51.2 128.015%. The total project cost includes physicalcontngencies of US$14.8 million or about Rdbbi 3.5 2.4 5.97% of base cost, and price contingencies Stis 6.0 4.0 10.0of US$9.2 million (or about 4% of base cost T.A. &Tuuaing 2.5 1.7 4.2plus physical contngencies), estimated on thebasis of the disbursement schedule and of a 48.2 32.1 8032.8% annual price escalation for both local TOtalBM co 137.0 9K4 228.4and foreign expenditures expressed in US Physi Coatg. 8.9 S.9 14.8dollars. The estimated costs of the individualcomponents are detailed in Table 5 hereafter caning. 5.5 3.7 9.2and are summarized in Table 4. Tota Cost 151.4 1OL0 252.4
v3nancisPE10. The subproject would be fianced __k 87.0 87.0from the proposed Bank loan of US$87.0 -0
million (or 34% of the subproject cost) and st S1,4 14.0 16S.4from the state's own resources for US$165.6million (or 66% of the project cost). Taefinancing plan of the subproject is detailed in Table 5 hereafter, and is summarized in Table 4. TheBorrower will provide the necessary subproject counterpart funds, and retroactive fmancing in an amountof not more than 10% of the loan amount for civil works, goods, and consultant and training expendituresincurred not earlier than twelve months before the date of the loan agreement.

.95- Ann 12
Table Sain Sub-Polect Cost and ang
-Quantitl.e- -Baa. C.at-(8SS) 4bnk
Pt!gt Compome Unit ba TOWl 19 19_9 199S 1997 19" 1 19 1 1"?9 19" Totl %
* grop I Xm 123.0 400 200 200 25.6 25.6 0.0 0.0 0.0 51.2. gop 2 Km 128.0 200 100 100 0.0 12.8 12.3 0.0 0.0 25.6*wtp 3 Km 121.0 200 1o0 100 0.0 0.0 12. 12. 0.0 25.6.mgup 4 1Cm 128.0 200 100 100 0.0 0.0 0.0 12.1 12.1 25.6
sboaw 121.0 1000 200 300 200 200 100 25.6 3a4 25.6 25.6 12.3 12.0 50
RhtabIidho and Rlrang ngm. b ibbtlo KM 30.0 150 30 30 50 40 0.9 0.9 1.5 1.2 0.0 4.5.nmufaig Kin 9.0 150 30 30 5s 20 20 0.3 03 0 0.2 O. 1.4
tobtol 19.1 300 60 60 10o 60 20 1.2 1.2 2.0 1.4 0.2 5.9 50%
9 0ag-ing Xcm 4.0 750 250 250 25 1.0 1.0 1.0 .0.0 0.0 3.0 50%.m esttassut KM 5.0 60 30 30 0.2 0.2 0.0 0.0 0.0 0.3 50Msupevistion 5.0% 13 2.0 -IA 1.3 0.6 6.7 50%
sua 2.5 3.t 2.4 1.3 0.6 10.0 50S
.rod setTA Nm 6.0 252 72 72 36 36 36 0.4 0.4 0.2 0.2 0.2 1.5 70%*q t & soft b 1.0 400 200 200 0.2 0.2 0.0 0.0 0.0 0.4 100%-mntm_a NM 4.0 400 200 1oo 100 0.8 0.4 0.4 0.0 0.0 1.6 50%*quot& aft a L0 350 200 150 0.2 0.2 0.0 0.0 0 0.4 100%-st tr.wek 0.5 700 100 200 200 0too 10O 0.1 0. 0.1 0. 0.1 04 50
btoa 1.7 13 0.7 03 0.3 4.2 66%
TOW Cq l Gass) Cost 30.9 44.0 30.6 2$.6 13.9 141.1 50
Pbuo"OODS. 10% 3.1 4.4 3.1 2.9 1.4 14.8 50%. b toomBiv 2.8% 2.8% 2.8% 2.8% 28% 0.4 1.9 2.2 2.9 1.3 9.2 50%
TOl Ca*d Coat GD.L t3mb _gmds) 34.5 502 35.9 34.4 17.1 72.1
Rwia MnkmbkPtaaopm.apnd reas Km 1.6 5850 550 950 1250 1550 550 0.9 1.5 1.9 2.4 2.4 9.1
.awd amd KM 1.9 30700 6500 6200 6000 600o 6000 13.0 13a4 13.7 14.1 14.5 61.7.a"muai.p. Km 0.3 10000 200o 2000 200o 2000 200 0.5 0.5 0.5 0.5 0.s 2.5
TOWl RKaena Cast 44550 9050 9150 250 955 950 14.4 15 16.1 17.0 17A.4 8.3 0%
Toa C cost 48.8 65.6 52.0 51.4 34.5 252.4 341
Dank Ilnandap 17.5 25.4 1S.0 17.2 8.6 86 34%osa y I (vlwoka) 14.7 21.8 15.2 14.8 7.1 73.6o. goy 2 (goods) 4 0.4 0.0 0.0 .0 as
gasy 3 (oweauhan d aning) 2.2 2.3 1.7 0.9 0.6 7.7oat* ay 4 (aotiod 0.2 0.9 1.1 1.5 0.9 4.6
*tw _T_1y 313 40.2 34.0 34.1 25.9 165.6 66%
Sam_ SEW and simn onmas
Imo 1993

-96 - AnneS 13
BRAZ
SIATE HIGHWAY MANAGEMENT II PRO.ECT
Environmental Assessment Summary
A. Introduction
1. The investment programs included in the project consist of road works for: (i) the rehabilitationor resurfacing of deteriorated roads; and (ii) the upgrading and/or paving of existing earth or gravelroads. Both types of works have direct impacts on the environment in the right-of-way or vicinity ofthe road. Paving or major upgrading of roads can have indirect impacts in a much broader area ofinfluence of the road, by changing the economic conditions of the area.
2. The direct environmental impacts of road works are primarily related to: quarries and borrowpits; disposal of used pavement materials and other wastes; and the activities of road crews (e.g.hunting, changing lubricants in streams, negative interactions with local people).In the course of project preparation, the road agencies have revised their norms and specifications forroad engneering and works in order to incorporate appropriate requiremerts for environmenalquality of the works, and to make payments to contractors subject to compliance with theserequirements. The Fopraisal mission reviewed these norms and specifications and found themsatsfctory. The revised norms and specifications will be put into effect in the three states andtherefore incorporated to aU future contracts for road engineering and works, and adequatesupervision and control will be carried out. A technical assistance and training program has beendeveloped to strengthen the capabilities of the state road and environmental agencies to effectivelycarry out their environmenWt supervision, control and monitoring functions (Annex 9).
3. The upgrading and paving components of the project could have indirect environmental impactsthrough increased settlement or intensified land use. The states of Tocantins, Maranhao and Piaui arelocated in central and northeastern Brazil (Map No. 23773R1). Their environment consist primarilyof cerrado, or open pasture with brush vegetation, in virtually aUl of the state of Tocantins, southernMaranhao and southwestern Piaui; caatinga, or brush land, in southeastern and north central Piai; anenvironmentally stressed area of pre-Amazon forest, in the western parts of Maranhao and Tocantns,in the Araguaia River valley; and palm tree areas, primarily babassU palm, which appears throughoutnortheastern Maranhao and northern Piaul. The main categories of possible indirect impacts wouldtherefore include: (a) migrations to and increased settlements and use of natural resources in the areasof influence of the roads; (b) destruction of large forest or palm tree areas for intensified agricultureor cattle farming; and (c) invasions of existing or potential natural or indian reserves.
4. The road agencies have, in the course of project preparation: (a) selected the road sectons tobe upgraded and/or paved in the first-year of the project in areas which are already developed, oraway from any environmentally sensitive areas; and (b) carried out environmental assessments (EAs),in accordance with agreed terms of reference, for all such sections to be improved and/or paved inthe first-year of the project. The appraisal mission reviewed the final EAs and found themsatisfactory. A summary of these EAs and of the related mitigatory measures is presented hereafter.

-97- Annex 13
The state road agencies will, in the future, prepare detailed EAs in accordance with the agreed termsof reference, for all their subsequent upgrading, paving ani vew construction investments, forsubmission to the states' environmental agencies which authorize the investments. Summaries of suchassessments, in an agreed format, will be reviewed by the Bank prior to authorizing the financing ofthe specific investments under the project.
B. Mgranhao Subprjc
5. The first year of the Maranhao subproject includes the paving of the following road sections:
(a) BR-135/MA Presidente Dutra-Colinas, 75 kin; and
(b) MA-006 Balsas-Tasso Fragoso-Alto Parnaiba, 235 km.
(a) BR-1351MA, Corinas-Presidente Dutra section
6. This road sectionis primarily used for Table 1. Land Use in the ea of bdluence of Bt-135CMA Collnasm" Dutmlocal connectionsbetween the several TOtal Ptduv. Poductvo Naun NA1_Am Lwd in La Not Voegcia Voa*municipal districts of the MunicAa UsN I U9Nt gathe) V_reion. It would also 1 1 1 26 2provide an alteraive tw o 115,138 65891 19,637 29,610 26route for long distance CdIs 144,840 64,145 36,209 44,486 31
traffic between the Porum 29,893 20,592 3,516 5,755 19cerrado lands of Pimiaand the coast. Human paaol. 202,77s 4,6n2 58,075 SO,28 2Ssettlement and aoaAAadw 68,700 62,565 3,047 3,088 4
agricultral development rD 131,100 81,671 21,493 27,936 21in this area are alreadyconsiderable, as it can be n 406,200 203,403 53,943 148, 37seen in Table 1. As a Sao DomiDn 126,700 64,679 29,144 32,87 26
result, the mainconclusion of the EA isthat the paving of this road section will Improve the profitability of existing economic activities,essentially agricultural production and cattle farming, in the area of influence of the road, as isdesirable. With a view to maximizing the positive impacts and to identify any unforeseen adverseimpacts, SEMATUR will effecdvely monitor the area of influence of the road with technicalassistance and trang resources provided under the project.
(b) MA-006. Bals - Taso Frioso - Alto Panalba section
7. The objective of the paving of this road section is to improve the access of exsting farmsetdements in fte cenrados of southern Maranhao to the main agricultural center of Balsas, and fromthere to the Northern Corridor to Sao Luis. Capitaized farm settlements have developed in theregion for more than a decade. Recently, however, the construction of the North-South railway to

- 98 - Annex 13
Imperatriz and the investments made by CVRD for grain exports through the Northern exportcorridor have significantly increased the interest of agricultural producers to expand their productionand to invest in the development of new land. The agricultural potential of the subregion is veryimportant (Annex 2). It is likely that the paving of this road section will contribute, together with therecent rail investments and logistics, to the facilitation of new investments and the expansion ofagriculture in the micro-region formed by the Municipalities of Balsas, Tasso Fragoso and AltoParnaiba.
8. The typical savannah of the cerrados predominates in the area of influence of the road, inparticular on the plateaus which are of interest to investors. A higher and denser vegetation remainsin very limited areas (veredas) and in particular on the slopes of the plateaus (fiuas). These smallareas are nevertheless important natural shelters for many animal species in the cerrados. At thistime, according to surveys made by the University of Maranhao for the consulting firm whichprepared the EA, human settements cover only about 11% of the area of the three municipalities.Existing legislation limits the clearing of new land areas to 50% of the total area of the property.SEMATUR will be responsible for controlling the clearing of new land areas in the subproject areasof influence. The project will finance the necessary technical assistance, training of staff andequipment for SEMATUR to effectively carry out these responsibilities (Annex 9).
9. The consulting firm hired by DER-MA to prepare the EA for this road section has identifiedall possible environmental impacts stemming from the construction works and made recommenionsto the design engineers for mitigating those impacts. The firm reviewed in details the, final designsand confirmed that its recommendations have been properly incorporated into the projects.
C. Plaui Subor9
10. The first-year program for the state of Piaui includes four road sections, of which tv,o are to befirst upgraded to appropriate standards with gravel surfaing for later paving, and two are existingpaved roads requiring rehabilitation:
(a) PI-112 Porto-Miguel Alves section, 40 ln, upgrading
(b) PI-112 Novo Nilo-Miguel Alves section, 35 kn, rehabilitation
(c) PI-140 junction of PI-141 (Canto do Buriti)-S. Raimundo Nonato, 102 km, rehabilitation
(d) PI-254 BR-135 (Gilbues)-Santa Filomena, 135 km, upgrading
11. The impacts of the rehabilitation works have been identified and the related mitigatingmeasures have been includeci in the projects, either as special projects (e.g. energy absorbers at theends of cuverts to prevent erosion) or as parts of other projects (e.g. recovery of borrow pits for fillmaterial for ground leveling work). The review of the projects made by the environmental teams ofthe consulting firms hired by DER-PI indicated that the measures were all taken by the designengineers. The appraisal mission made some checks and found the engineeing designs satisfactory,including with respect to environmental management. Deted EAs have been prepared for theupgrading projects. The appraisal mission reviewed the final EAs and found them satisfactory. Asummary of these EAs and of the related mitigatory measures is presented hereafter.

- 99 - Annex 13
(a) P1412. Porto - MigueI Alves section
12. The objective of theupgrading of this section in Table 2. Ltnd Use in the Az e of the Poto - Mimic! Ah in othe lower Parnaiba valley TOal Productive Pductive Natrl Natur
to gravol road for later Ara Land in LAd Not Vegation Vegdeto
paving is to improve MM2IIaI;IV Oilt. U use amb Used (ha) Obal 1access to markets, Migul Alves 110,637 34,461 31,980 44,196 40
particularly Teresina, by Porto 37,885 MsM388 5,720 16,777 44
the rice prcducers on thevast iigated lands whichare already in production in that region. Land use, based on the results of the 1985 AgriculturalCensus (IBGE), is as shown in the box.
13. The upgrading of the road, however, could contribute to the already-e'isting pressure tochange the use of extensive areas now in palm trees (primarily babassu palm) for more intensiveagriculture. A small and very poor local community now survives on extraction of babassu coconuts.In order to mitigate these effects, the state government will, by December 31, 1994, complete andpresent to the Bank: (a) a study on the options to mitigate the adverse environmental effects of theroad upgrading, including the establishment by the state of a native palm reserve, aimed at protectingthe activity anJ the revenues of this community; and (b) based on such study, a fime-bound plan ofaction to implement the recommended measures to mitigate such effects. The project will helpfice these studies.
((b) PI-2S4. Gilbues (BR135M - Santa FIlomena
14. The objective of the upgrading cf this road section is to improve access of existing farmsettlements in the ceffados of southwestern Piaui to the main consumer centers, particularly Teresina,and to Balsas, in Maranhao, and from there through the Northern Corridor to Sao Luis. Capitalizedfarm settlements have developed in the region for more than a decade. Recently, however, theconstruction of the North-South railway to Imperatriz and the investments made by CVRD for grainexports through the Northern export corridor have significantly increased the interest of agricuturalproducers to expand their production and to invest in the development of new land. The agricuturalpotential of the subregion is very important (Annex 2). It is likely that the paving of this road sectionwill contribute, together with the recent rail investments and logistics, to facilitate new investmentsand the expansion of agriculture in the micro-region formed by the Municipalities of Gilbues, MonteAlegre do Piaui, and Santa Filomena.
15. The region is presently very thinly populated and the land use is restricted to land-extensivecattle produc-tion. Land use in the three Municipalities, based on the 1985 Agricultural Census, isshown in Table 3.
16. Regarding natural vegetation, the typical savannah of the cerrados predominates in the area ofinfluence of the road, in particular on the plateaus which are of interest to investors. A higher anddenser vegetation remains in very limited areas (veredas) and in particular on the slopes of theplateaus Oi*nzas). These small areas are nevertheless important natural shelters for many animalspecies in the cerrados. The increased human settlements will continue to reduce the area now in

-100 - Annex 13
natural vegetation. _b3____iAA_oIfmoth_bs- __o ___
Existing legislation limits T 3 Lnd Use in d of n e of the e - t F onthe clearing of new land Totl Peodutve Ptodulve Natumi NaUi
areas to 50% of the total Land in Lad Not Vegeaton Vegeatio
area of the property. unt" XbL). Use Jb) Used (eha amha 4CEPRO will be Ollbes 99,172 36,462 31,02S 31,685 32
responsible for Me e doPii 91.231 50,063 20,382 20,786 23
controlling the clearingcofnewoland res cint Sat Falomem 217,648 143,4S6 50,361 24,031 11of new lana areas in the Isubproject areas ofinfluence. The project will finance the necessary te'vhnical assistance, training of staff and equipmentfor CEPRO to effectively carry out these responsibilities (Annex 9).
D. XQ=Uns Subpraject
17. the following road sections will be paved starting in the first year of the program:
(a) TO-080 Divine2olis-Caseara, 134 kn;
(b) TO-222 Aragominas-Pontao, 89 klm;
(c) TO-336 Pequizeiro-Ponte Prof. Bioikino, 54 km;
(d) TO-050 Porto Nacional-Silvanopolis, 56 Ian; and
(e) TO-280 Gurupi-Peixe, 70 km.
The first three road sections are located in the Araguaia river vaUey while the other two sections arein parts of the Tocantins River valley.
18. Since these sections were built more than a decade ago, and the principal economic activity island-extensive cattle farming, human setdement in the areas of influence of the roads generallyexceeds 80%, according to the results of a survey carried out by the EA consultant with the assistanceof satellite images of 1992. The proposed upgrading and paving of road sections will generaRycontribute to facilitate a more intensive use of the land in the roads' areas of influence, with a gradualshif from cattle farming to agriculture, mainly for rice and/or soybean production (Annex 2). Thetypical savannah of the cerrados predominates in the area of influence of most roads. A higher anddenser vegetation, including some forest, remains in limited areas, particularly in the vicinity of theAraguaia river. Although the risk of their being cleared is minimal, considering the availability ofpasture lands, effective control will have to be exercised.
19. The agency responsible for the environment in the state of Tocantins, i.e., the NatureFoundation of Tocantins-NATURATINS, will need to monitor these changes in land use and tocontrol the clearing of the remaining natural vegetation. As discussed in Annex 9, however, it doesnot have the necessary instruments, trained personnel and equipment necessary to effectively carry outthese responsibilities. The State Planning and Coordination agency (ASPLAN) is responsible forcarrying out the economic-ecological zoning of the state. But due to lack of resources, the zoningworks have been paralyzed for some time. The project will therefore provide support to:
-101- Annex 13
(a) complete the economic-ecological macro-zoning of the state (on a scale of 1:1,000,000), which isto be concluded before December 31, 1994; (b) train NATURATINS personnel including for thesupervision and control of the implementation of the related mitigating and maximizing measres;(c) finance the equipment necessary for the monitoring and surveillance systems; and (d) finance thestudies which are necessary to establish the environmental protection reserve of Rio do Peixe rivermouth (Annex 9).
20. The direct impacts of the proposed enstruction and rehibilitation works have been identified.They are generally related to possible erosions, floods, clearing of vegetation, quarries and borrowpits, etc... 'Te related mitigating measures have been included in the projects. The review of theprojects made by the environmental specialists hirl by SEINF-TO indicated that the measures wereall taken by ihe design engineers. The appras31 mission made some checks and found theengineering designs satisfactory, including with respect to environmental management.
(a) TO-080. Divinopols - Caseara section
21. ITe area of influence of this section has already been developed for extensive cattle-farming.Human settlements already account for 80% to 100% of the total useable area. The developmentprocess has been gradual, following the construction of the original access roads, from east to west.Consequently, the regions located close to the Araguaia river have more natural vegetation.However, considering the high proportion of already settled areas, it is very likely that the proposedpaving of the road section will facilitate a graduaRy more intensve use of the land, wihf some areasshifting from cattle farming to agriculture. NATURATINS will therefore need to monitor thesedhanges in land use and to control the clearing of the remaining natural vegetation particularly in theAraguaia river valley.
(b) OQ222. Aragominas - Pontao section
22. Located in the Araguaia river valley, the area of influence of this section has also beendeveloped for extensive cattle-farming. Human settlements already account for almost 100% of thetotal useable area. The proposed paving of the road will facilitate the shifting of some areas fromcattle farming to agriculture. In this area also, NATURATINS will need to monitor these changes inland use and to manage the clearing of the remining natural vegetation in the Araguaia river valley.
(c) T-0336. Pecuizedre - Ponte Prof. Blokino section
23. Located also in the Araguaia river valley, this road linis the state of Para to the main highwayfrom Belem to Brasilia. Human setdements are more important in the vicinity of the Araguaia river,where the setted area accounts for about 80% of the total useable area. They still account for almost70% on the eastern part of the micro-region. The region has a definite potential for agriculture,which is already replacing cattle farming In some areas. The proposed paving of the road willfacilitate this shift. The mitigating or maximizing measures already proposed also apply for this road.

-102 - Annex 13
(d) 3O-OO. Porto Nacional - Silvanopo11s section
24. Located on the right bank of the Tocantins river, this road provides access from the southeastpart of the state to the new capital of Palmas. The naural vegetation in the area of influence is thetypical savannah of the cerrados on the plateaus, and a higher and denser vegetation in limited areas(veredas) and on the slopes 7iunas). These small areas with denser vegetation are important naturalshelters for many animal species in the cerrados. Iheir ecological importance seems well understoodby the local population, who traditionally have mainained them well. Human settlements are alreadycovering 80% to 100% of the aseable area. The shift from cattle farming to capitalized agriculture isalready takdng place in this region. The proposed paving cI the road will contribute to facilitating thischange in the future. The mitigating or maximizing measures already proposed also apply for thisroad.
(e) TO-280. Gurupi - Peixe section
25. Locaed on the left bank of the Tocantins river, this road provides access ftom the southempart of the state to the Belem - Brasilia highway. In the future, it will also be part of the road linkingsouwhern Tocantins to west Bahia, which the state government is proposing to pave to facilitate theexports of rice and soybeans through the Bahia corridor. The natural vegetation in the region is thesavannah of the cerrados, and a higher and denser vegetation in some limited areas (veredas). Thesesmall areas are important shelters for many animal and plant species in the cerrados. Humansetdements are already covering 70% of the useable area in the vicinity of Peixe and almost 100% inthe rest of the area of influence of the road. The shift from cattle farming to capitalized agriculture isalready taking place in this region. The proposed paving of the road will contribute to facilitate thischange in the future. In addition to the mitigating or maximizing measures proposed for the otherroads, the state government agreed during loan negotiations that it will, by December 31, 1994,complete and present to the Bank: (a) a study on the options to mitigate the adverse environmentaleffects of the road upgrading, including the establishment by the state of an environmental protectionarea between the rivers Santa Tereza and Tocantins, aimed at protecting the animal and plant speciesof this region of the cerrados; and (b) based on such study, a time-bound plan of action to implementthe recommended measures to mitigate such effects: The project will help finance these studies.

- 103 - Annex 14
am11 HIGHV, M ANAGEMENT II PROJECT
Economic Analyis of Sub iWects
A. fkhsig
1. The economic analysis of the first year rehabilitation and improvement programs has been carriedout using the HDM-M model and the most recent HDM-M Manager (version 2.0). Ihe program isdesigned to perfo.m. an economic evaluation of a set of construction and maintenance strategies appliedto paved or unpaved roads. It computes the road deterioration and the road agency and vehicle operatingcost streams for each of the strategies being evaluated, as well the economic indicators used to comparethese strategies against a base strategy (do minimum), i.e., present value of benefits and economic rateof return.
2. The program requires information on the current roadway characteristics and traffic, the mcpectedtraffic growth, the vehicle fleet caacteristics and unit costs, the road maintenance operations unit costs,and the definition of the straties being evaluated. The strateies are defined by the characteristics,timing and cost of the proposed project and the future maintenance itventions.
3. The analysis was conducted for eight road segments in the State of Tocantins totaling 466.4 ktm,eleven segents in the State of Maranhao totaling 721.5 km, and four segments in the State of Piauitotaling 256.0 km. An analysis period of 20 years was selected, the rehabilitation and improvement worksbegin evaluated take place the first year of te analysis period, and a conservative approach was takennot to include the time saving or the generated traffic benefits in the analysis. Net present values werecalculated using a discount rate of 12% and all costs are expressed in US$ dollars.
B. Road Characteristics
4. The road characteristics for all the segments were obtained from road condition surveys andtraffic couns undertaken by the DER of each state in 1992. When some item of information was notavailable, it was estimated based on prior Bank experience with economic evaluations in Brazil. Thefollowing information were generally available for each segment:
* geometrical features, including the length, width, curvature and rise plus fall of the roadsections;
* estimated values of roughness in Tocantins and Piaui, and measured values of roughnessin Maranhao;
* pavement constitution, with corresponding present structural number and subgrade CBR;
* environmental features including average altitude and rainfall values; and
* daily traffic volumes and annual growth for each vehicle type.

- 104- Annex 14
C. id Qg=.ngACost
S. The programassesses vehicle rabk 14.t: VehoCle Carotierus ad Unit Costs for Tocagnin
operating costs from Medium Heavy Aicuated
data entered to go Isi aw n mk iaW Iniskcharacterize thetypical vehicle fleet. VehiceChamotoiaec
The program requires own VloWOWig(t) 1.21 .157 8.9 5.07 10.34 2S.20the basic vehicle ESAI Fae per Vah. 0.00 0.01 1.20 ' 1.70 4.00 9.00
chactedsdcs, the Numberof Aides 2 2 2 2 3 5
vehicleutflizationand Number of ena 4 4 6 6 101 18
the vehicle operadonunit costs. Vetilo UtlizaUOn
Appropriate valueswere selected for Se cLifoye ) 16 16 15 19 19 ISHoua Duven per Year 792 860 1739 1481 2355 3283each vehicle class in Km D vm peYear 50324 54586 90417 58336 91173 126460each state. Table Avual nhoest" RAt 12 12 12 12 12 12
14.1 presents the data Iused for the stae of i c UntCTocantins that is New Vehicl priceS 8690 6083 103531 61390 64108 99393
similar to the other New Tre Psie () 37.65 34.64 202.48 152.23 152.53 277.95states. Mainteac Labor (/bhr) 2.32 2.23 2.23 2.23 2.23 2.23
Coew Costb (Sbr) 0.00 0.00 3.29 2.32 2.32 2.81
6. Figure 14.1 presents the resulting vehicle operating costs for each vehicle class as a function ofroad roughness for the State of Tocantins.
Fi= o 14 1: Vehicle Operatig Cot
State of Tocantins
1.20 -
1.00.
060-.
0.40 w--
0.20
0.00 3.0 4.0 5.0 5.0 7.0 8.0 9.0 0.0 I. 12.0
Reod Rawim (A)
_ Ce - PkIp -- 4A-U-- Meiiin Truck -W- Hbevy Truck Artie TIruck

- 105 - Annex 14
D. Finandal and Eoonomic Unilt Costs of Maintenanoe
7. Financial and economic maintenance unit costs were obtained from calculations performed by theDER of each state. The maintenance unit cost introduced in the program are summarized in Table 14.2.The costs of each proposed project were also computed by the states and are given in Table 14.3.
Table 14.2: Maimenance Unit Costs
Financial Cost Economic CotSta of Maranhao
Grading (S per km) 282.00 226.00Gruvel Resuracing (S per cu m) 4.00 3.20Unpaved Routine Maintenance (S per km-yr) 1487.00 1190.00
Pachg ( pera q m) 4.83 3.95Reeal 20 mm ($ per q m) 1.32 1.05Oveday 40 mm (S per aq m) 3.11 2.49Paved Routin Maintence (S per km-yr) 1600.00 1280.00
Staft of Piaui
Grading (S per km) 160.00 140.00Gravel Rercing (S per cu m) 4.00 3.50Unpaved Routine Maintenance (S per kin-yr) 455.00 396.00
PahtcbIg (S per sq m) 9.7S 7.80Reseal 20 mm (S per sq m) 1.90 1.52Overay 30 mm (a per sq m) 9.50 7.60Paved Routine Maintenance (S per km-yr) 1100.00 957.00
State of Tocantins
Gtrding (S per km) 240.00 192.00Gravel Resuaing (S per cu m) 5.20 4.10Unpaved Routin Maintenance (S per kn-y) 700.00 560.00
Patching (S per q m) 3.60 2.90Rescal 7.S mm (S per aq m) 0.70 0.50Oveay 30 mm ( per sq m) 3.40 2.70Paved Roune Mieane (S per km-yr) 1451.00 1161.00
E. Definition of S ees
8. Five strategies were considered for each road segment to be evaluated. With these strategies, itwas possible to perform the economic evaluation of each project and also determine the optimalmaintenance operations that should follow the project in the future.
Strategy I is the base standard and corresponds to routine maintenance including vegetationcontrol and regular maintenance of road drainage, verges and side slopes. Forgravel roads that would be paved, it also includes grading (twice a year for ADT< 175 and three times a year for ADT > 175) and resurfacing of the gravellayer when it falls below 10 mm.

- 106- Annex 14
Stra 2 is composed of the proposed project at the beginning of the analysis period andfuture maintenance intventions. For this strategy, the future maintenanceinterventions are reseals every five years.
S&tr 3 is composed of the proposed project at the beginning of the analysis period andfuture maintenance interventions. For this strategy, the future mainteanceinterventions are reseals every ten years.
strategy 4 is composed of the proposed project at the beginning of the analysis period andfuture maintenance interventions. For this strategy, the future maintenanceinerventions are reseals every fifteen years.
Strategy S is composed of the proposed project at the beginning of the analysis period andfuture mainenance interventions. For this strategy, the future maintenanceinterventions are overlays when the road roughness reaches 5.0 IRI.
F. Ana]Mss Reults
9. From the anal.,ses performed, the consolidated economic rate of return for the first year programis estimated at 28.9% for all three states. For the State of Tocantins the overall rate of return is 33.0 %,for the State of Maranhao 24.7%, and for the State of Piaui 32.9%. Ihe range of values for individualroad segments etends from 13.2% to 68.5%, thus indicating that the proposed investments are timelyand economically justified.
10. The analysis of the future mntenance operations shows that for these roads with low traffic theoptimal maintenac operations that should follow the projects are reseals at ten to fifteen year intervals.Ihe overlay option at 5.0 MI presented lower benefits than the reseal options. Therefore, preventivemainenance would be preferred over future rehabilitation.
11. A sensitivity analysis shows that the investment costs would have to increase by 10% for theinternal rate of return to fall below 12% for the segments with the lower rates of return. If the investmentcosts are increased by 20%, the overall rate of return of the project will be 24.0%, the overall rate ofreturn for the State of Tocantins will be 26.4%, for the State of Maranhao will be 20.7 %, and for theState of Piaui will be 28.5%.
12. The results of the economic evaluation, segment by segment, highlighting, in particular, totalagecy costs, traffic volumes, net present values and interna rates of return, for each individual roadsegment, are presented in Table 14.3 hereafter.

- 107 - Annex 14
Table 14, Rsl Ecowndc Analy&
SrAI OF TOCANINSFnancial Fmacl
Nw hitialnia Projet projectP nogm CompoosntRo*d Deai Leng&h Taffic ltugbna ERR NPV Cold Co/km
lE fp am Ih MDi XM U8 &Aus US$) (US$lnprovemat -+ 7T0450 P.Nado 4ilvancofia 55.S 209 13.9 15.2 1.6 8.91 159,695Pfving TO'SODivno a S3.0 197 122 28.5 4.9 5.44 102,717
TO-4NO mauIopoI-Ca 81.4 197 12.4 38.5 10.7 7.39 90,737TO-222AagoinasPontao 89.3 395 16,0 37.8 25.1 15.21 170,30TO-20 uupi-Pain 702 191 13.5 132 0.6 9.96 141,923TO-U36Pe*airo-P.Piiolno S4.0 341 14.9 68.S 26.0 7.20 133,407
403.7 54.116
tehabllationeOf 70-255 nBtts.lR-53-CrIardal 31.0 209 63 27.1 12 0.90 29,161Ped Road TO-354 ErAtR-153-ftum 31.7 110 6.6 43.9 0.8 027 S,S17
62.7 1.174
ERR 33.0% 466.4 5.29STAIR OF MARANHAO
Fiancil FnaclNew litil ial Project Project
Program Co _ponentRoa Duas m Length Ttaflb Rotuoa ERR NPV Cot CoakmnM_ (AV MD LE cm U8S% 04 U8S$ (lJS
Inias_mat + MA-135 Preidet DuUaColina 74.7 251 11.8 37.1 12.0 6.81 91205Paving MA006 as -Tmo PFagoaso 143.0 156 10.0 22.S 13.4 17.43 121,902
M&.006Tao Pag.-Aho Parub 90.0 130 92 15.7 3.3 12.72 140,897
308.0 36.97:e£abllkStiOf MA426 Codo - D _esae 15.0 603 5.0 37.0 3.0 1.00 66,533
PavdRlod MA.O26Codo-Tlnbia 24.0 154 SS 14.1 0.2 1.49 62,083MA40S Dr-3t6 - Vitoio FPre 32.0 443 4.7 32.0 4.0 1.57 48,906MA-2301034 Chqapanha- Bto 56.0 162 5.3 132 0.3 3.77 67,393MA34 D316 - Codho Neto 72.0 201 4.7 21.9 2.5 2.84 39,S00MA414 So BDeo - Vian 84.5 2 6.4 35.4 9.9 4.48 52,994bL414 Pneio - ao Denbo 92.0 501 3.8 29.0 11.0 4.88 S3,000
38.0 352 3.7 39.8 2.0 0.56 14,605
413.5 20.58
ERR - 24.7% m21s 57.548SrAIR OF PAUI
Finacl FinaialNow hiia Intal Projec Prqject
Prorm CoaponaRoatd Deectin Lao1 Trafric Rougs ERR NPV cost coolkmAML 1AD MOD. f tM US$) w USS (US$)
bmrvenua + PI2S4l GlbuS. P;lonim I-8 70.4 59 30.8 23.6 5.1 4.7 66,761Gave8 SudCing PI-lz2 MIelJ Au I Pot 47.9 20 30.8 28.0 10.6 2.8 58,455
118.3 7.5
RelaabllltalonOf PI-140 Et. P1-141/BooR. Noao 1023 390 8.4 45.9 15.1 5.0 48,S76Paved Road P1-112 Novo NibMIud AMa 35.4 165 7.4 41.9 22 0.8 23,192
137.7 5.8
]ORR - 32.9% 256.0 133sm smim;
Toldl PtcjRt R-28.9%
vbe 193

108 - Annex IS
BRAZL
Maranhao Subnroed; ImRlnetsfon ltrogrm Indicators and TKgarg
A. QOMzafonal ArnanLenmts
1. DER-MA has set up appropriate organizational arrangements to carry out the subprojectSubproject execution responsibilities would be distributed to the permanent organizational units ofDER-MA (Annex 6). DER-MA has established and would maintain an appropriately staffed ProjectManagement Unit (PMU) headed by a qualified and expenenced Project Manager, who reporudiryecty to the Director-General. DER-MA has also established a special task force, withrepresentatives from the various organizational units involved, to coordinate the preparation of thestate road programs. With these arrangements, DER-MA has the capabilities to carry out thesubproject efficiently. During loan negotiations, it was agreed with the state government that DER-MA would maintain organizatinal arragements for subproject execution satisfatry to the Bank,including: (a) a Project Management Unit, with TOR and staffing, and headed by a Project Managerwith qualifications and experience, satisfactory to the Bank; and (b) a special task force, with TORand composition satisfactory to the Bank.
B. ImknDametallon rogam
2. Ihe State Government is committed to carry out the subproject in accrdace with thempnlementation Program (]P) which is presented hereafter and which should be confirmed during loan
negotiations.
(A) Polt and Jtutional DevelopmmtProgmn
1. Preparation and Review of State Road Programs, Budgets and Cost Reovery:
(a) DER-MA will: prepare annual and multi-year road expenditure and fimding programs inaccordance with policies and economic crieria set forth in the OM, satisfactory to the Bank,and with the annual physical implementation and fimding targets set forth in Table 1 hereafter;and, by July 31 each year, present such programs to the Bank for comments; and thereafterimplement the annual programs talkng into account the Bank's comments.
(b) The Borrower will take into account DER-MA's programs and the Bank's comments inpreparing its annual budget proposals with a view to achieve the minimum funding targets formaintenance, and the priority funding targets for rehabilitation-resurfacing versus total roadexpenditures, as set forth in Table 1 hereafter.

-109 - Annex 15
(c) The Borrower will seek to maintain or adjust road user charges to recover each year, as aminimum, the total costs of operation, maintenace and rehabilitation of the road networkunder its jurisdiction, and the percentage of its total road expenditures set forth in Table 1hereafter.
2. Strengthening of Road Planning, Maintenance Mnagement and Monitoring Systems:
(a) DER-MA will each year: carry out surface condition surveys on its entire network, traffic,axie-weight, and accident surveys; organize this data in a computerized database; review itsnetwork maintenance, rehabilitation, and upgrading policies, strategies and programs on thebasis of the results of these surveys, all in accordance with the procedures, criteria andmethodologies set forth in the OM; and reflect the results of these surveys and analyses in theroad expenditure programs to be presented to the Bank annually as specified in section 1.
(b) DER-MA will contract out the maintenance of an annually increasing portion of the networkunder its jurisdicton, in accordance with the annual targets set forth in Table I hereafter.
(c) DER-MA witl have established a computerized project management system to plan, monitorand report on project implemeion, and have strengthened its administratve systems forcontract management, in accordance with guidelines included in the OM, by April 30, 1994.
3. StrenhIng of Engvronmental agement:
(a) DER-MA will: by April 30, 1994, have strengthened its environm unit with twoadequately-trained staff; by July 1, 1994, have prepared emvironmental guidelines for stateroads, taldng into account the environmenal guidelines prepared by DNER and the stateevironmental protection standards, and have put them into effect, including the preparation of
appropriate EAs for all its major road projects.
(b) The Borrower will, by June 30, 1994, have strengthened its environmental agency by trainingstaff responsible for the review of EAs and for the enforcement of the state environmentalstandards and guidelines.
4. Technical Assistance, Persone and Trainng:
(a) DER-MA, in order to carry out the above action programs efficiently, wfll, by April 30, 1994,have contracted one or several consulting firms in accordance with Bank Guidelines for the Useof Consultants (August 1981) and on the basis of terms of reference satisfactory to the Bank.
(b) The Borrower will keep the total number of DER road staff within the annually-decreasingtargets set forth in Table 1 hereafter.
(c) DER-MA will, by October 31 each year, prepare, in consultation with DNER, a trainingprogram for the following year so as to meet the a trainig targets set forth in Table 1hereafter, and present it to the Bank for comments and/or financing approval and, taking intoaccount the comments of the Bank, thereafter implement it.

-110 - Annex 15
(B) Investment Program
S. Selection, Preparation and Economic Evaluation of Investments:
(a) DER-MA will select the road segments to be included in the annual rehabilitation, resurfacing,upgrading and paving programs on the basis of: (i) the agreed network maintenance andupgrading strategies and pluriannual programs, as periodically updated and refined; and(ii) technical and economic criteria and methodologies specified in the OM.
(b) Prior to initiating detailed engineering designs, DER-MA will prepare and submit to the Bank,with a copy to DNER, draft applications in a form specified in the OM providing informationon each proposed investment in the annual program. The Bank will approve the financing ofthe engineering designs under the loan on the basis of the review of the draft applications.
(c) After completing detailed engineering designs and prior to contracting the works, DER-MAwill update and finalize the applications as required to reflect the final engineering designs, costestimates, EAs for upgrading subrojects, and economic evaluation, and present them to theBank, with a copy to DNER. The Bank wiUl approve the financing of the investments underthe loan on the basis of the review of the final application forms.
(d) All the investments included in the subprojects would have estimated economic internal rates ofreturn exceeding 12%.
6. Preparation and Monitoring of Procurement and Execution Mmeschedules:
(a) DER-MA wiUl prepare subproject procurement and execution timeschedules as specified in theOperational Manual, and consistent with its anmn and pluriannual expenditure and fundingprograms; and by October 31 of each year present them to the Bank, with a copy to DNER,for comments.
(b) DER-MA will monitor subproject implementation on the basis of the procurement andexecution timeschedules and inform DNER and the Bank through quarterly progress reports, asspecified in the Operational Manual, and against the implementation indicators and targets setforth in Table 1 hereafter.
7. Monitoring of Road Surface Condition:
(a) The Borrower will monitor the surface condition of the state road network through regularvisual surveys and roughness measurements made in accordance with the procedures andmethodologies set forth in the OM against the aggregated roughness targets set forth in Table 1hereafter, and will present a synthesis of the survey results to the Bank together with the roadexpenditure programs to be presented annually as specified in section 1.
3. The subproject implementation and monitoring indicators and targets referred to in para. 2 arepresented in Table 1 hereafter. The subproject implementation schedule is presented in the chart onthe last page of this annex.

-111- Anne 15
Table 1: Mara=nao Suhbrojedt IMnementsaon Indicators andTargets
'fm- im ma lsss i 2Thaa Iimnaatato
Reabiltadon & Rewfclg Contracted (km) 200 150 1S0 100 so
Executed (km) 200 IS0 1S0 100 so
RiutisaMlenance Patching (n) 2000 IS00 1000 S00 300
arding (tand Kin) S.0 6.0 7.0 7.5 8.0
Regsveling(houndM ) 300 340 380 400 400
UprdgJ & Pavig Contracted (kin) 200 200 200 IS0
Executed(kn) 100 200 200 ISO 100
Fudig and CQm-Recovery
Malntonane mdaaance_udlpetUSSmn) 9.0 9.S 10.0 11.0 11.0
Rebabtatio n&Remurfacing R&Rtotd Budget 30% 25% 25% 2S% 15%
"Coaeolvely % MainenanceE n dire 100% 100% 100% 100% 100%
% Tatalicp.ndizm 50% 50% 50% 50% 50%
IDbe__didop31/
Maintenance % Conad (kn) 30% 40% 50% 60% 70%
StafI Nb. DERMA staff 750 700 650 600 5S0
Trning Nb. Trainee-Week 140 260 200 200 200
Newo*CondCn
Paved % LentIRI < 4.0 7S% 30% 85% 90% 90%
Unpaved 80% Lenth with lRI < 14.0 13.0 12.0 11.0 10.0
1/ In addion, d condon, tffic ad accident suneys ato be caded out each year ath. etiretat k ia accordactopidelinesa forth in the Opetional Mana.

-112- Annexl1
C. Prso nemt Arrangements
4. Procurementarrangements are Table 2: ranbam Snba-oier P rar Mebedsummarized in Table 2 (usS million)hereafter. Civil works Prcumment Mthodcontracts above US$5.0 ProiecEle ment L LC Ot /million would beprocured through ICB civil Wor 68.2 75.0 - 54.0 197.2procedures, using (4.1) (37.5) (71.6)
relevant standard Eq*nmm - .7 - .7bidding documentsissued by the Bank. (.7) £)Civil works contracts Coutan& Tining - 12.3 123
below US$5.0 million, (6. -
up to an aggregateamount of US$75.0 Total 68.2 75.0 13.0 54.0 209.5million, would be (Bank fiad) (34.1) (37.5) (7.4) - (79.0)procured through LCB 1/ riue an perodc mantnane works, not Bank-fiwanced.procedures, based onstandard biddingdocuments which are be included in the OM. Miscellaneous road laboratory and office equipmentand software would be purchased by local shopping on the basis of at least three price quotations, inpackages not exceeding US$50,000, up to an aggregate amount of US$700,000. Consultants fordetailed engineering, construction supervision, tec'.nical assistance and training programs would beselected and engaged following Bank Guidelines for the Use of Consultants (August 1981) and thestandard conteact issued by the Bank would be used for complex, time-based assignments.
D. Disbursemient rangments
5. The Loan amount would be allocated and disbursed in accordance with Table 3 hereafter:
Table 3: ADocatin of Mareabao La Proeese
Loan mavAount ,DisutmRa
1. Civ Woaks 50% of expndit(a) upgtding& Pav"i 49,S00,000(b) habitaton & rur&clcng 18,000,0002. Equipmn 700,000 100% of freiga expenditu
100% of loa expeitur(ox-faty coat)
3. Cla Trininw 6,200,000 50% of localenditur100% of foeign xndtes
4. Un ated 4.6.000ToWl 79,000,000

It -I~~~~~~~~~~~~~~~~~~~~~~~~~~~~~~~~~~~~~~~~-
.i 11 - -{1j _t1i _ _ it i Wi4W1 I li §t21iiIjtl ii7 i1'
I -i
-- * * - 1 -*- j-g-j-I-I. . . .- -.- ................ *... - .-- ....... .. .... .. .... ..... ...
11 j 1 S
_ -~~~~~~~~~~~~~~-

-114 - Aneu 15
WA1MW WIK,AY MANAGOMW I Pr4W=~
O_ _*M I 92 1 X I qz 9 a 1 a I A.C!M9 | 9 1 02 -aX I CM
lid IIM 1214 11-1*_
424"ftd1A4pMW tid tttA tIW4 100_
l4Im daa.IUGoo .ii'g s S U M M S WM Iw -
b1_uI 2Vh 12 $MM __ 1_ __ _ *M o 1W, t

- 115 - Annex 16
bRAM
ATE HIGHWAY M&AGEMMILpOl
Plad Subgroect hnlementsfon h ram, Indicatmr ad Thweq
A. QOnntional AEaanents
1. DER-PI has set up appropriate organizational arrangements to carry out the subproject.Subproject execution responsibilities would be distributed to the permanent organiional units ofDER-PI (Annex 6). DER-PI has established and would maintain an appropriately staffed ProjectManagem ent Unit (PMU) headed by a qualified and experienced Project Manager, who reportsdirecty to the Director-General. DER-PI has established satisfactory processes to coordinate thepreparation of the state road programs, under the responsibility of the Planning Department. Withthese arrangements, DER-PI has the capabilities to carry out the subproject efficiently. During loannegotiations, it was agreed with the state government that DER-PI would maintain organizationalarrangements for subproject execution satisfactory to the Bank, including: (a) a Project ManagementUnit, with TOR and staffing, and headed by a Project Manager with qualifications and experience,satsactory to the Bank; and, in case the Planning Department would fail to effectively coordinate thepreparation of the programs, (b) a special task force, with TOR and composition satisfactory to theBank.
D. iwIuemntaUon lroraIn
2. The Stae Government is committed to carry out the subproject in accordance with themplementation Program (IP) which is presented hercafter and which should be confirmed during loannegotiations.
(A) Polcy and Insttutional Developmen Progrm
1. Preparation and Review of State Road Programs, Budgets and Cost Recovery:
(a) DER-PI will prepare annual and multi-year road expenditure and funding programs inaccordance with policies and economic criteria set forth in the OM, satisfactory to the Bank,and with the annual physical implementation and funding targets set forth in Table 1 hereafter;and, by July 31 each year, present such programs to the Bank for comments; and thereafterimplement the annual programs taking into account the Bank's comments.
(b) The Borrower will take into account DER-PI's programs and the Bank's comments inpreparing its annual budget proposals with a view to achieve the minirmm funding targets formaintenance, and the priority funding targets for rehabilitation-resurfacing versus total roadexpenditures, as set forth in Table I hereafter.

-116- Annex 16
(c) The Borrower will seek to maintain or adjust road user charges to recover each year, as aminimum, tbe total costs of operation, maintenance and rehabilitation of the road networkunder its jurisdiction, and the percentage of its total road expenditures set forth in Table 1hereafter.
2. Strengthening of Road Planning, Maintnance Management, and Monitoring Systems:
(a) DER-PI will each year: carry out surface condition surveys on its entire network, traffic, axle-weight, and accident surveys; organize this data in a computerized database, review its networkmaintenance, rehabilitation, and upgrading policies, strategies and programs on the basis of theresults of these surveys, all in accordance with the procedures, criteria and methodologies setforth in the OM; and reflect the results of these surveys and analyses in the road expenditureprograms to be presented to the Bank annually as specified in section 1.
(b) DER-PI will contract out the maintenance of an annually increasing portion of the networkunder its jurisdiction, in accordance with the amnnal targets set forth in Table 1 hereafter.
(c) DER-PI will, by April 30, 1994, have established a computerized project management systemto plan, monitor and report on project implementation, and have strengthened its administrativesystems for contract management, in accordance with guidelines included in the OM.
3. Strengthening of Environmental Management:
(a) DER-PI will: by April 30, 1994, have established an environmental committee with adequately-tained staff; by October 1, 1994, have prepared environmental guidelines for state roads,taking into account the environmental guidelines prepared by DNER and the stateeavironmental protection standards, and have put them into effect, including the preparation ofappropriate EAs for aU its major road projects.
(b) The Borrower will: by September 30, 1994, have strengthened its environmental agency bytraining staff responsible for the review of EAs and for the enforcement of the stateenvironmental standards and guidelines; and by December 31, 1994, have completed andpresented to the Bank a study of the options to mitigate the effects of the Miguel Alves - Portoroad upgrading, including the establishment of a native palm reserve, and a time-bound actionplan to implement the recommended measuies.
4. Technical Assistance, Personnel and Training:
(a) DER-PI, in order to carry out the above action programs efficiently, will, by April 30, 1994,have contracted one or several consulting firms in accordance with Bank Guidelines for the Useof Consults (August 1981) and on the basis of terms of reference satisfactory to the Bank.
(b) The Borrower will keep the total number of DER road staff within the anmually-decreasingtargets set forth in Table 1 hereafter.
(c) DER-PI will, by October 31 each year, prepare, in consultation with DNER, a trainingprogram for the following year so as to meet the annual training targets set forth in Table 1hereafter, and present it to the Bank for comments and/or financing approval and, taking intoaccount the comments of the Bank, thereafter implement it.

- 117- ̂Annex 16
(B) InvestmnPropam
5. Selection, Preparation and Economic Evaluation of Investments:
(a) DER-PI will select the road segments to be included in the annual rehabilitation, resurfacing,upgrading and paving programs on the basis of: (i) the agreed network maintenance andupgrading strategies and pluriannual programs, as periodically updated and refined; and(ii) technical and economic criteria and methodologies specified in the OM.
(b) Prior to initiating detailed engineering designs, DER-PI will prepare and submit to the Bank,with a copy to DNER, draft applications in a form specified in the OM providing informationon each proposed Investment in the amnual program. The Bank will approve the financing ofthe engineering designs under the loan on the basis of the review of the draft applications.
(c) After completing detailed engineering designs and prior to contacting the works, DER-PI willupdate and finalize the applications as required to reflect the final engineng designs, costsimates, EAs for upgrading investments, and economic evaluation, and present them to theBank, with a copy to DNER. The Bank will approve the fiacing of the investments underthe loan on the basis of the review of the final application forms.
(d) All the investments included in the subprojects would have estmated economic internal rates ofreturn exceeding 12%.
6. Preparation and Monitoring of Procurement and Execution hmneschedules:
(a) DER-PI will prepare subproject procurement and execudon timeschedules as specified in theOperational Manual, and consistent withf its anmnal and plurianu expenditure and fundingprograms; and by October 31 of each year present ihem to the Bank, with a copy to DNER,for comments.
(b) DER-PI will monitor subproject implementation on the basis of the procurement and executiontimeschedules, and inform DNER and the Bank tirough quarterly progress reports, as specifiedin the OM and against the implementation indicators and targets set forth in Table 1 hereafter.
7. Monitoring of Road Surface Condidon:
(a) The Borrower will monitor the surface condition of the state road network through regularvisual surveys and roughness measure made in accordance with the procedures andmethodologies set forth in the OM against the aggregated roughness targets set forth in Table 1hereafter, and will present a synthesis of the survey results to the Bank toget'her with the roadexpenditure programs to be presented anmually as specified in section 1.
3. The subproject implementation and monitoring indicators and targets referred to in para. 2 arepresented in Table 1 hereafter. The subproject implemention schedule is presented in the chart onthe last page of this annex.

- 118- Annae 16
Table 1: Piaui Subgnrect lmgeme ntation Indicators and Targets
Rehabiltation & Rewft Contated (lAm) 100 150 ISO too 100
Snouted (km) 100 1SO SO 100 100
Routwi njme PthIng (m3) 1,200 1,000 800 500 300
Gadig (thouan 1m) 9.5 10.0 10.5 10.5 11.0
Rescaveting (huand m3) 400 450 470 480 S00
Upgsadin & Paig Contre (km) 100 250 2S0 150 150
Executed (km) 100 200 250 200 1S0
F- an Cost-Rmvey
!dalnt_oance X-ainanoeUudgetSVSmin) S.0 6.0 6.5 7.0 8.0
habilutition&ResurRfaing R& oti Bud*gt 35% 30% 25% 20% 1S%
Coat-Recovye % MabcoEpeaondim 100% 100% 100% 100% 100X
X Ttal _oE du 50% S0% S0% 50% S0%
bndutoa Developa 11
Mainteaoce f% Contracted (kin) 25% 30% 35% 40% 40%
Sting Nb. DER-Pt road doff 1,000 900 8oo 700 600
Taini4 Nb. twine-Week 15O 200 250 200 200
Paved % llUIRI < S.0 50% 60% 70% 80% 90%
Unpavd S0% Lam& with lRJ 11.0 10.5 10.0 9.5 9.0
1/ naddo,radconiio,fficdaccidentsurvey to hacadtaea r oanandeenti at.networkinacordantoguden set for in die Opmationa Maa.

- 119 - Anne 16
C. ProJaMent Arrangements
4. Procurementarrangements are ThbI2 lgiLhbggioect <thu eMethdsummarized in Table 2 (S$ WMihereafter. Civil works Pneuens Mtdwd --contracts above US$5.0 ___ .E LO1" 2I .million would beprocured through ICB Civil wor 43.4 50.0 34.5 127.9procedures, using (21.7) (25.0) (46.7)relevant standard - - .7 -.
bidding documents (7)issued by the Bank.Civil works contracts Com & Taini - - 123 - 123
below US$5.0 million, -A -
up to an aggregateamount of US$50.0 Toal 43. 50.0 13.0 34.5 140.9million, would be (kAfin"04 (21.7) (25.0) (73) - (54.0)procured through LCB _1 _ud_. n w, ak-S|mmW.procedures, based onstandard biddingdocuments which are be included in the OM. Miscellaneous road laboratory and office equipmentand software would be purchased by local shopping on the basis of at least three price quotations, inpackages not exceeding US$50,000, up to an aggregate amount of US$700,000. Consultants fordetailed engineering, constuction supervision, technical assistance and training programs would beselected and engaged following Bank Guidelines for the Use of Consultants (August 1981) and thestandard contract issued by the Bank would be used for complex, time-based assignmens.
D. DsurmentsLA &a Mh
5. The Loan amount would be allocated and disbursed in accordance with Table 3 hereafter:
Tble 3: AIk of rAu LoA Proeeds
1. Cli Wods 50so% of oedihm(a) Sain A PaIng 3250,000O0) mbabi & aufacl 13,000,000
2. IqWpsnt 600000 100% of foigp apendhuaI00S of loa avpnduma(ox-6w=7 ot)
3. Conuhan Tning 4,800,000 ooxf pendoma100% of f_in apmidiuu
4. Unao 3100,0Toa 54,000,000

f[f [3|Xi{Ift U W|II f' If pq ' ''pg l ,0fX tiX|'Ii I U IiiIiiIIiihiiiiILItIi
t _ _ _ g g B|§## _ _ _ I, ii | _ § Yi 10 _ _ _11§ 11@ 21 102 il;S~~~~~~~~~~~~~~~~~~~~~~~~~~~~~~~~~~~~~~~~~~~~~~~~~~i
'I1< 1 t2 '1~j : iM
I-f I I aIig:

-121 - Annex 17
SATE HGHWAY MANAGEMENT U PROJECT
Tocantins SubhpWlect hnglementation Prol!ram, Indicators and Tarmets
A. QfgIzaQ onal Arn ngemffta
1. SEINF-TO has set up appropriate organizaional arrangements to carry out the subproject.Subproject execution responsibilities would be distributed to the permanent organizational units ofSEINF-TO (Annex 6). SEINF-TO has established and would n an appropriaty staffedProject Management Unit (PMU) headed by a qualified and experienced Project Mnager, whoreports direcdy to the Secretary. SEINF-TO has also established a specidal task force, withrepreentatves from the various organiional units involved, to coordinate the preparation of thestae road programs. With these arrangemens, SEINF-TO has the capabilities to carry out thesubproject efficiently. During loan negotiations, it was agreed with the state government thatSEINF-TO would maintain organizational arrangements for subproject execution satisfactory to theBank, including: (a) a Project Management Unit, with TOR and staffing, and headed by a ProjectManager with qualifications and experience, satisfactory to the Bank; and (b) a special task force,with TOR and composition satisfactory to the Bank.
B. Jmpinme1 anZrogmn
2. The State Goverment is committed to carry out the subproject in accordance with theImplementation Program (IP) which is presented hereafter and which should be confirmed during loannegotiations.
(A) lfoklx and situtional Davelopiot am
1. Preparation and Review of State Road rogrm, Budgets and Cost Recovery:
(a) SETNF-TO will: prepare annal and multi-year road expenditure and fumding programs inaccordance with policies and economic criteria set forth in the OM, satisfctory to the Bank,and with the ammal physical implementation and funding targets set forth in Table 1 hereafter;and, by July 31 each year, present such programs to the Bank for comments; and thereafterimplement the annual programs taking into account the Bank's comments.
(b) The Borrower will take into account SEINF-TO's programs and the Bank's comments inpreparing its annual budget proposals with a view to achieve the minimum funding targets forroutine mantenance and for rehabilitation and resurficing, as set forth in Table 1 hereafter.
(c) The Borrower will seek to maintain or adjust road user charges to recover each year, as aminimum, the total costs of operation, maintenance and rehabiliation of the road network

- 122 - Annex 17
under its jurisdiction, and the percentage of its total road expenditures set forth in Table 1hereafter.
2. Strengthening of Road Planning, Maintenarice Management, and Monitoring Systems:
(a) SEINF-TO will each year: carry out surface condition surveys on its entire network, traffic,axle-weight, and accident surveys; organize this data in a computerized database; review itsnetwork mainteace, rehabilitation, and upgrading policies, strategies and programs on thebasis of the results of these surveys, all in accordance with the procedures, criteria andmethodologies set forth in the OM; and reflect the results of these surveys and analyses in theroad expenditure programs to be presented to the Bank annually as specified in section 1.
(b) SEINF-TO will contract out the maintenance of an annually increasing portion of the networkunder its jurisdiction, in accordance with the amuial targets set forth in Table 1 hereafter.
(c) SEINF-TO will, by April 30, 1994, have established a computerized project managementsystem to plan, monitor and report on project implementation, and have strengthened its admi-nstrative systems for contract management, in accordance with guidelines included in the OM.
3. Strengthening of Environmental Mangement:
(a) SEINF-TO will: by April 30, 1994, have strengthened its environmental unit with twoadequately-trained staff; by July 1, 1994, have prepared enviromental guidelines for stateroads, taking into account the environmental guidelines prepared by DNER and the stateenvironmental protection standards, and put them into effect, including the preparation ofappropriate EAs for all its major road projects.
(b) The Borrower will: by June 30, 1994, have strengthened its environmental agency by trainingstaff responsible for the review of EAs and for the enforcement of the state environmentalstandards and guidelines; and, by December 31, 1994, have completed and presented to theBank a study on the options to mitigate the adverse environmental effects of the Peixe - Gurupiroad upgrading, including the establishment of an environmental protection area between theSanta Tereza and Tocantins rivers, and a time-bound action plan to implement therecommended measures.
4. Tedcnical Assistance, Personnel and Training:
(a) SEINF-TO, in order to carry out the above action programs efficiently, wil, by April 30,1994, have contracted one or sever consulting firms in accordance with Bank Guidelines forthe Use of Consultants (August 1981) and on the basis of terms of reference satisfactory to theBank.
(1) The Borrower witl keep the tota number of DER road staff within the annually-decreasingtargets set forth in Table 1 hereafter.
(c) SEINF-TO will, by October 31 each year, prepare, in consultation with DNE, a trainingprogram for the following year so as to meet the annual training targets set forth in Table 1hereafter, and present it to the Bank for comments and/or financing approval and, takdng intoaccount the comments of the Bank, thereafter implement it.

- 123 - Annex 17
(B) Invetment Progm
S. Selection, Preparation and Economic Evaluation of Investnents:
(a) SEINF-TO will select the road segments to be included in the annual rehabilitation,resurfacing, upgrading and paving programs on the basis of: (i) the agreed networkmaintenamce and upgrading strategies and multi-year programs, as periodically updated andreflned; and (ii) technical and economic criteria and methodologies specified in the OM.
(b) Prior to initiating detailed engineering designs, SEINF-TO will prepare and submit to the Bank,with a copy to DNER, draft applications in a form specified in the OM providing informationon each proposed investment in the annual program. The Bank will approve the financing ofthe engineering designs under the loan on the basis of the review of the draft applications.
(c) After completing detailed engineering designs and prior to contracting the works, SEINF-TOwill update and finalize the applications as required to reflect final engineering designs, costestimates, EAs for the upgrading investments, and economic evaluation, and present them tothe Bank, with a copy to DNER. The Bank will approve the financing of the investmentsunder the loan on the basis of the review of the final application forms.
(d) All the investments included in the subprojects would have estimated economic internal rates ofreturn exceeding 12%.
6. Ptreparation and Monitoring of Procurement and Execution Tlmeschedules:
(a) SEINF-TO will prepare subproject procurement and execution timeschedules as specified in theOperational Manual, and consistent with its annual and pluriannual expenditure and ftndingprograms; and by October 31 of each year present them to the Bank, with a copy to DNER,for comments.
*b) SEINF-TO will monitor subproject implementation on the basis of the procurement andexecution timeschedules, and inform DNER and the Bank through quarterly progress reports,as specified in the Operational Manual, and against the implementation indicators and targetsset forth in Table 1 hereafter.
7. Monitoring of Road Surface Condition:
(a) The Borrower will monitor the surface condition of the state road network through regularvisual surveys and roughness measurements made in accordance with the procedures andmethodologies set forth in the OM against the aggregated roughness targets set forth in Table 1hereafter, and will present a synthesis of the survey results to the Bank together with the roadexpenditure programs to be presented annually as specified in section 1.
3. The subproject implementation and monitoring indicators and targets referred to in para. 2 arepresented in Table 1 hereafter. The subproject implementation schedule is presented in the chart onthe last page of this annex.

;lfffffiJ[[ § III' Wf I 'I [
11w6 1 .. i Elxa}IrI
It hJi I
°
I x!! L[ Ill 8"*gS
ii lii Fm 111 888> 88So A AA AoS ^ fi8 o 8 S ;

- 125 - Annex 17
C. Procurement Arrangements
4. Procurementarrangements are Table 2: Tocanti,u Suboroiedt Procurement Metaod
summarized in Table 2 (USS amillion)hereafter. Civil works Procurement Metood -
contracts above US$5.0 Proiect Element LE CB Other afb fl/ ToWal
million would beprocured through ICB Civil Works 75.5 80.0 - 80.3 235.8
procedures, using (37.8) (40.0) (77.8)
relevant standard qupma- - .9 .9
bidding documents 9issued by the Bank.Civil works contracts Consultants &Training - - 15.7 - 15.7
below US$5.0 million, (8.3) ____
up to an aggregate Tota 75.5 80.0 16.6 803 252.4
amount of US$80.0million, would be (Bank financed) (37.8) (40.0) (9.2) - (87.0)
procured through LCB l routin and period Maintenance woks, not Bak-financed.
procedures, based onstandard biddingdocuments which are be included in the OM. Miscellaneous road laboratory and office equipmentand software would be purchased by local shopping on the basis of at least three price quotations, inpackages not exceeding US$50,000, up to an aggregate amount of US$900,000. Consultants fordetailed engineering, construction supervision, technical assistance and training programs would beselected and engaged following Bank Guidelines for the Use of Consultants (August 1981) and thestandard contract issued by the Bank would be used for complex, time-based assignments.
D. Disbursement Arrangements
5. Ihe Loan amount would be allocated and disbursed in accordance with Table 3 hereafter:
Table 3: Alocation of Tocanins Loan Proceds
Loan caterorv Amount Disbursement Rate
1. Civil Works 50% of expenditures
(a) upgrading & Paving 70,000,000(b) rehabilitation & resurfacing 3,500,0002. Equipment 800,000 100% of foreign expenditures
100% of local expenditures(ex-factoq coat)
3. Consultants Training 7,700,000 50% of local expenditutes100% of foreign expenditutes
4. Unallocated S.O,OOO
Total 87,000,000

..... ..................................... .............. . ........................ .................. ............................. ... .............................. t ..,................. .............
ffi~~~~~~~~~~~~~~~~~~~~~~~~~~~~~~~~~~~~i
iX _ I .II . .I _ .I | 1§ 1 1 I 3i~~~~I
__ . .2, W 21_ k2 2_2W21 2 2~ 2___
|~~ ~ , I S.-. q SS ~

-127 - Annex 18
BRAZIL
STATE HIGHWAY MANAGEMENT n PROJECT
Monitoring and Suervision Plan
1. The state road agencies (DERs) would, as part of their action programs to strengthen contractmanagement and program monitoring, establish an appropriate system to monitor the implementation ofthe subprojects, incluiing producing adequate information to report to DER management and to the Bank,in accordance with the specifications included in the OM. Each DER will prepare and forward to theBank, with a copy to DNER, quarterly progress reports satisfactory to the Bank, not later than one monthafter the end of the quarter.
2. DNER would perform a first level of project coordination and monitoring functions includingrevew of the following documents: (a) application forms for investments to be included in the annualrehabilitation and resurfacing programs; (b) annual procurement and execution programs; (c) procurementdocumentation for civil works and equipment; (d) terms of reference, invitation letters, short-lists anddraft contract for consultant services; and (e) the DERs' quarterly progress reports. DNER wouldforward their comments on these documents to the Bank. DNER project staff will also participate in theBank's supervision missions, and gradually contribute to the missions' work program.
3. The Bank will retain full responsibility for approving all the above documents and related actionsby the DERs, taking into account DNER comments. Ihe Bank will supervise and monitor theimplementation of the project, with assistance from DNER, in accordance with the Plan presented on thenext page. The estimates of Bank supervision inputs into key activities, which are shown in the table ofthis annex, take into consideration the expected support from DNER, as well as the need for DNER stafftraining to carry out their tasks.
4. The implementation of subprojects will be monitored against the set of actions and timetable, andagainst the physical implementation, funding and cost-recovery, institutional development, and networkcondition targets, which are recorded in the respective Implementation Programs presented in Annexes 15to 17 for the respective states. Mid-Term Reviews of the implementation of the subprojects will becarried out by the end of 1996. The reviews will cover all the agreed actions, targets dates, andmonitoring targets included in the Implementation Programs and the status of compliance with allcovenants of the Loan Agreement. Particular importance will be given to: (a) the Borrowers'commitments to provide adequate funds for maintenance and counterpart funds for the subprojects; and(b) the DERs' performance under the agreed institutional development action plan. The Bank will havethe right to exercise appropriate remedies if the Borrower has defaulted under the funding conditionand/or the DERs' performance under the action plans is not satisfactory.

- 128 - Annex 18
BRAZIL
STATE HIGHWAY MANAGEMENT II PROJECT
Bank Supervision Input into Key Activities
Approx. Key Activities Expected Skill Stf.lnputDates Requirements staff-wks
4/94 Project Launch Workshop Highway Engineer 6.0Disbursement OfficerProcurement Officer
9/94 Supervision Mission: review organizational Highway Engineer 9.0arrangements and monitoring systems, Transport Economistcontracting of TA and 1994 works, and Operations Assistantdiscuss preparation of 1995 programs.
2/95 Supervision Mission: review progress Highway Engineer 9.0under TA, environment, training, engineer- Transport Economisting, procurement and civil works programs, Operations Assistant1995 programs and budgets. Environment Specialist
7/95 Supervision Mission: review progress Highway Engineer 6.0under TA, staff training, engineering, Operations Assistantprocurement and civil works programs.
12/95 Supervision Mission: review progress under Highway Engineer 9.0TA, staff training, engineering, Transport Economistprocurement and civil works programs, and Operations Assistant1996 program and budget proposals. Environment Specialist
5/96 Supervision Mission: review progress on Highway Engineer 9.0institutional and investment programs, and Operations Assistantpreparation of 1997 programs, budgets.
12/96 Supervision Mission: mid-term reviews of Highway Engineer 12.0subprojects, progress on institutional and Transport Economistinvestment programs, and 1997 program Operations Assistantand budget proposals. Environment Specialist
1997 Two Supervision Missions Highway Engineer 12.0Operations Assistant
1998 Two Supervision Missions Highway Engineer 12.0Operations Assistant
1999 Loan Closing Highway Engineer 12.0(Project Completion Report) Operations Assistant

- 129 - Annex 19
BRAZIL
SrATE HIGHWAY MANAGEMENT I PROJECT
Selected Documents and Data Available in the Project File
Bank Mission Documents
1. Maranhao Subproject Preparation Mission Aide-Memoire, November 19922. Piaui Subproject Preparation Mission Aide-Memoire, November 19923. Tocantins Subproject Preparation Mission Aide-Memoire, October 19924. Maranhao Subproject Pro-Appraisal Mission Aide-Memoire, March 19935. Piaui Subproject Pre-Appraisal Mission Aide-Memoire, March 19936. Tocantins Subproject Pre-Appraisal Mission Aide-Memoire, March 19937. Maranhao Subproject Appraisal Mission Aide-Memoire, May 19938. Piaui Subproject Appraisal Mission Aide-Memoire, May 19939. Tocantins Subproject Appraisal Mission Aide-Memoire, May 199310. Final Executive Project Summary Package, April 199311. Environmental Assessment Consultant Report, and translation, April 199312. Maranhao State Environmental Assessment Consultant Report, May 199313. Piaui State Environmental Assessment Consultant Report, May 199314. Tocantins State Environmental Assessment Consultant Report, May 199315. Economic Analysis Project File, June 1993
Borrowers' and Guarantor's Documents
16. Plano Pluriannual do Maranhao, 1992-199517. Balancos Gerais do Estado do Maranhao, 199118. Programa de Consolidacao da Malha Viaria do Estado do Maranhao (8 volumes)19. Estudos e Relatorios de Impacto Ambiental, MA132, MA006, BR135, Maranhao (6 volumes)20. Zoneamento Ecologico-Economico do Estado do MaratLao, December 199221. Diagnostico dos Problemas Ambientais do Maranhao, 199122. Codigo de Protecao do Meio Ambiente do Maranhao, 199223. Normas para o Processo de Licenciamento para o Setor de Rodovias, Maranhao, Feb. 199324. Proposta de Fortalecimento Institucional, SEMATUR, Maranhao, December 199225. Corredor de Exportacao Norte, Uma Visao Retro-prospectiva, Maranhao, December 199226. Servicios Rodoviarios, Caderno de Especificacoes, Maranhao27. Album de Projetos tipos, Maranhao28. Programa de Desenvolvimento Rodoviario, Piaui, Documentos Diversos, May 199329. Programa de Desenvolvimento Rodoviario, Piaui, Plano de Treinanento, May 199330. Programa de Desenvolvimento Rodoviario, Piaui, Programa de Conservacao, May 199331. Prograna de Desenvolvimento Rodoviario, Piaui, Carta Convite Assistancia Tecnica, May 1993

- 130 - Annex 19
32. Programa de Desenvolvimento Rodoviario, Piaui, Edital de Concorrencia Internacional33. Programa de Desenvolvimento Rodoviario, Piaui, Metodologia, March 199334. Programa de Desenvolvimento Rodoviario, Piaui, Estudo de Viabilidade da Soja e Arroz35. Estudos e Relatorios de Impacto Ambiental, PRODER, Piaui (10 volumes)36. Documentos referentes a Aide-Memoire de Nov. 92, PRODER, Piaui, March 199337. Estudo Institucional, PRODER, Piaui, January 199338. Estudo Financeiro, PRODER, Piaui, January 9339. Programa de Desenvolvimento Rodoviario, Piaui, November 1992 (7 volumes)40. Tocantins, Realidade e Perspectiva41. Programa de Gerenciamento da Malha Rodoviaria Estadual, Tocantins (18 volumes)42. Estudos e Relatorios de Impacto Ambiental, Tocantins (10 volumes)43. Proposta Fortalecimento Institucional, Zoneamento Ecologico-Economico, Tocantins, April 9344. Programa de Gerenciamento da Malha Rodoviaria Estadual, Meio Ambiente, CEPRO45. Preservacao Ambiental, Recommendacoes Gerais para o Setor Rodoviario, Tocantins, Jan. 9246. Plano Pluriannual, 1992-1995, Lei Estadual, Tocantins47. Sistema Rodoviario do Estado do Tocantins, December 9148. Especificacoes Gerais para Obras Rodoviarias, Tocantins, 199249. DNER Operational Manual for the Program, revised, October 199350. Cooperation Agreement dated October 19, 1993 between DNER and the DER of Maranhao51. Cooperation Agreement dated October 19, 1993 between DNER and the DER of Piaui52. Cooperation Agreement dated October 19, 1993 between DNER and the DER of Tocantins53. Agreement between DNER and DER-MA re maintenance of federal "transitory" roads54. Agreement between DNER and DER-PI re maintenance of federal "transitory' roads55. Agreement between DNER and SEINF-TO re maintenance of federal "transitory" roads56. Portaria no. 089/92-A establishing DER-MA's Project Management Unit57. Portaria no. 142193 establishing DER-MA's Planning and Coordination Committee58. Extract from Diario OficiaW with 1993 budget of DER-MA for project59. Copy of Planning Secretary's letter with DER-MA's budget proposal for 199460. Decree no. 9031 of the Governor of Piaui, reorganizing the structure of DER-PI61. Legislacao Basica do DER-PI62. Proposta Orcamentaria do DER-PI, 199463. Orcamento do Estado do Piaui, 199364. Orcamento do Estado do Piaui, 1994, Projeto de Lei65. Plano Plurianual 1992-1995 do Estado do Piaui66. Plano Plurianual Revisado 1993-1995 do Estado do Piaui67. Decree no. 8059 of Governor of Tocantins establishing PMU and Project Coordinator68. Extract from Diario Oficial with SEINF-TO 1993 budget69. Decree no 579 of Governor of Tocantins re 1994 Budget70. Secretaria de Estado da Infra-Estrutra, 1994 budget proposal71. Lei Orcamentaria 1993 do Estado do Tocantins

MAP SECTION

IBRD 23773R1
{ ENZUELA - X )' VENE _s TSURINAME FR
COLOMBIA B.o V-e IGU G ,NA
_ S k > 1/ < . a d ~~~~~~~~~~~MdAPA
RO ~ ~ ~ ~ ~ ~ PR
-r ) , r-1 1 - ) ;"'''.
AMA ZONS _ RIO GRANDE D0 NORTE
*PERU/ _
PA RA BA
)' - -< 4 ' u jAT~ROSO M . BRAZIL -t ROOONJI RWA ; 3 ROSSO 0/ ~~~~~~~~~~~~STATE HIGHWAYMANAGEMENTi 1 PROJECT
i Pri' EIy Wd Al.
To ROSSO ESPR/T
k ~~~~~~~~~~~~~~~~~~~~~~~~~~~~~Unde Coicftychoc
po,1,
I 6D~~~~~~~~~~~~~~~~~~~~~~~~~~~~~~~~~~~~ Notiocol Capital
Pacific / State capitals
* J At/I o ~~~~~~~~~~~~~~~~~~~~~~~~~~~~~~Selecte Cities aod Tomn
0 Ce can A ISTACATARJNA ~~~~~~~~~~~~~~~~~~~~~~~~~~~~~~~~~~~Sotat Boundorles
5, ~ ~ ~ ~ ~ ~~~~~~oInemootional Bocodories
ARGE ~~~~~~~~~~~~~~~~~~~~~~~~~~~~~~~~0 SWn
ARGENTINA ~~~~~~~~~~~~~~~~~~~~~~~~~~~~~~~~~~~~~~KILOMETERS
-~~~~~~~~~~~~~ 1 ,.~~~~~~~~~~~~~~~~~~~~~~~~~~~~V-dfl w
80. 60. 50.~~~~~~~~~~RUU
A0.