g 01 kan guide on measurement uncertainty (en)
TRANSCRIPT
1
KAN GUIDE ON THE EVALUAND EXPRESSION OF UNCERTAINTY IN MEASUR
Issue Number : 2 January 2008
Komite Akreditasi Nasional National Accreditation Body of Indonesia Gedung Manggala Wanabakti, Blok IV, Lt. 4 Jl. Jend. Gatot Subroto, Senayan, Jakarta 10270 – Indonesia Tel. : 62 21 5747043, 5747044 Fax. : 62 21 57902948, 5747045 Email : [email protected] : http://www.bsn.or.id
KAN-G-0
ATION
EMENT

KAN-G-01 Issue Number : 2 January 2008
LIST OF AMANDMENT
No. Date Part number revised Brief description of changes
Part revision number
1. 12/06/08 Identification document DPLP 13
Identification document changed to KAN-G-01
2
i
KAN-G-01 Issue Number : 2 January 2008
KAN GUIDE ON THE EVALUATION AND EXPRESSION OF UNCERTAINTY
IN MEASUREMENT 1. INTRODUCTION Compliance testing sometimes involves measured values, which lie close to the zone of uncertainty. A different method of uncertainty evaluation by foreign authority could mean rejection of a container of goods destined for import because of expansion of the recalculated zone of uncertainty. In the era of global marketplace it is imperative that the method for evaluating and expressing uncertainty be uniform throughout the world so that measurements performed in different countries can be easily compared. The internationally accepted guidance for the evaluation of measurement uncertainty is the ISO “Guide to the Expression of Uncertainty in Measurement” This document describes the principles on the evaluation of measurement uncertainty for calibration and testing laboratories to meet the requirement of ISO/IEC 17025 on ‘General Requirements for the Competence of Calibration and Testing Laboratories’ The method of evaluating measurement uncertainty described in this document is in accordance with ISO “Guide to the Expression of Uncertainty in Measurement”. This document gives the recommended method for evaluating measurement uncertainty that is applicable for calibration and testing laboratories which wants to be accredited by National Accreditation Body of Indonesia (KAN) based on ISO/IEC 17025. Regarding one of the important factors in the accreditation of calibration laboratories, that is Best Measurement Capability (BMC), this document also gives general guidance in evaluating BMC. To assist laboratories in implementing the method in this document worked examples on the evaluation of measurement uncertainty for calibration and testing laboratories and the evaluation of Best Measurement capability will be given in Supplements. 2

KAN-G-01 Issue Number : 2 January 2008
3
2. TERMS AND DEFINITIONS The following terms and definitions are given to assist the users in understanding this document. Cross-references to the ISO GUM and ISO VIM are respectively given in the square brackets. Quantity (measurable quantity) [GUM B 2.1; VIM 1.1] Attribute of a phenomenon, body or substance that may be distinguished qualitatively and determined quantitatively Value (of a quantity) [GUM B.2.2; VIM 1.18] Magnitude of a particular quantity generally expressed as a unit of measurement multiplied by a number True value (of a quantity) [GUM B.2.3; VIM 1.19] Value consistent with the definition of a given particular quantity Note that the true value cannot be determined by a measurement as all measurements have uncertainties. Further definition of any measurand is imperfect; therefore the true value is a hypothetical quantity Conventional value (of a quantity) [GUM B.2.4; VIM 1.22] Value attributed to a particular quantity and accepted, sometimes by convention, as having an uncertainty appropriate for a given purpose. Note that this may be a value obtained from a number of measurements taken to establish a conventional true value Measurement [GUM B.2.5; VIM 2.1] Set of operations having the objective of determining a value of a quantity Note that the operations may be performed automatically Measurand [GUM B.2.10; VIM 2.6] Particular quantity subject to measurement E.g. diameter of particular rod under conditions of standardized temperature and pressure Influence quantity [GUM B.2.11; VIM 2.10] Quantity that is not included in the specification of the measurand but that nonetheles affects the results of the measurements E.g. temperature of a micrometer used to measure a length Result of a measurement [GUM B.2.12; VIM 3.1] Value attributed to a measurand, obtained by measurement Note that the value should be accompanied by additional information, including its uncertainty Uncorrected result [GUM B.2.13; VIM 3.3] Result of a measurement before correction for assumed systematic error
KAN-G-01 Issue Number : 2 January 2008
4
Corrected result [GUM B.2.14; VIM 3.4] Result of a measurement after correction for assumed systematic error Accuracy (of a result of a measurement) [GUM B.2.15; VIM 3.5] Closeness of the agreement between the results of measurement and true value of the measurand Note that this is qualitative term and is not the same as precision Repeatability (of a result of a measurement) [GUM B.2.16; VIM 3.6] Closeness of the agreement between the results of successive measurement of the measurand carried out under the same conditions of measurement Note that these conditions must be specified, e.g. time over which tests are made Reproducibility (of a result of a measurement) [GUM B.2.17; VIM 3.7] Closeness of the agreement between the results of measurement of the same measurand carried out under changed conditions of measurement Note that these changed conditions must be specified Error (of a measurement) [GUM B.2.19; VIM 3.10] Result of a measurement minus true value of the measurand Note that since a true value cannot be determined, in practice conventional true value is used. Random error (of a measurement) [GUM B.2.21; VIM 3.13] Result of a measurement minus the mean that would result from an infinite number of measurements of the same measurand carried out under repeatable conditions Systematic error [GUM B.2.22; VIM 3.14] Mean that would result from an infinite number of measurements of the same measurand carried out under repeatable conditions minus a true value of the measurand Correction [GUM B.2.23; VIM 3.15] Value added algebraically to the uncorrected result of a measurement to compensate for estimated systematic error Note that it has the same size but opposite to the estimated systematic error Uncertainty [GUM B 2.18; VIM 3.9] Parameter, associated with the result of a measurement, that characterizes the dispersion of the values that could be reasonably be attributed to the measurand Standard uncertainty [GUM 2.3.1] Uncertainty of the result of a measurement expressed as a standard deviation Type A evaluation (of uncertainty) [GUM2.3.2] Method of evaluation of uncertainty by the statistical analysis of a series of observations Type B evaluation (of uncertainty) [GUM 2.3.3]
KAN-G-01 Issue Number : 2 January 2008
5
Method of evaluation of uncertainty by means other than the statistical analysis of a series of observations Combined standard uncertainty [GUM 2.3.4] Standard uncertainty of the result of a measurement when the result is obtained from the values of a number of other quantities, equal to the positive square root of a sum of terms, the terms being the variances or covariance of these other quantities weighted according to how the measurement result varies with changes in these quantities Coverage factor [GUM 2.3.6] Numerical factor used as a multiplier of the combined standard uncertainty in order to obtained an expanded uncertainty Expanded uncertainty [GUM 2.3.5] Quantity defining an interval about the result of a measurement that may be expected to encompass a large fraction of the distribution of values that could be reasonably be attributed to the measurand
KAN-G-01 Issue Number : 2 January 2008
6
3. GENERAL CONCEPTS The objective of a measurement is to determine the value of the measurand that involve specification of the measurand, the method of measurement and the procedure of measurement. In general, the result of a measurement is only an estimate or approximation of the value of the measurand, therefore the result is complete only when accompanied by the statement of the uncertainty of the estimate. Uncertainty is a measure of the dispersion that may reasonably be associated with the measured value. It gives a range, centered on the measured value, within which, to a stated probability, the true value lies. The uncertainty of the result of a measurement reflects the lack of exact knowledge of the value of the measurand. The result of a measurement after correction for recognized systematic effects is still only an estimate of the value of the measurand because of the uncertainty arising from random effects and from imperfect correction of the systematic effects. The concept of uncertainty is based on the observable quantities obtained by measurement; this differs from the ideal concept of error based on the unknowable quantities. Traditionally, an error of a measurement result is considered as having two components, namely random component and systematic component. Random error presumably arises from unpredictable or stochastic temporal and spatial variations of influence quantities. Systematic error arises from a recognized effect of an influence quantity of a measurement result. The difference between error and uncertainty should always be borne in mind. For example, the result of a measurement after correction can unknowably be very close to the unknown value of the measurand, and thus have negligible error, even though it may have a large uncertainty.

KAN-G-01 Issue Number : 2 January 2008
7
4. SOURCES OF UNCERTAINTY In practice there are many possible sources of measurement uncertainty, including:
Incomplete definition of the measurand
Imperfect realization of the definition of the measurand
Sampling - the sample measured may not represent the defined measurand
Inadequate knowledge of the effects of environmental conditions on the measurement process or imperfect measurement of environmental conditions
Personal bias in reading analogue instruments
Instrument resolution or discrimination threshold
Values assigned to measurement standards and reference materials
Values of constants and other parameters obtained from external sources and
used in the data reduction algorithm
Approximation and assumptions incorporated in the measurement method and procedure
Variations in repeated observations of the measurand under apparently identical
conditions In addition to those general sources of uncertainty, the specific sources of uncertainty in testing may include, but not limited to:
Non-representative sampling
Non-homogeneity nature of the sample
Contamination during sampling and sample preparation
Purity of reagents and solvents
Matrix effects and interference
Blank corrections
KAN-G-01 Issue Number : 2 January 2008
8
5. CLASSIFICATION OF COMPONENTS OF UNCERTAINTY Generally, the uncertainty of a measurement consists of several components which may be classified into two categories in accordance with the method used to estimate their numerical values:
Type A : those which are evaluated by statistical analysis of series of observations
Type B : those which are evaluated by other means other than statistical analysis of series of observations
Classification of uncertainty components into type A and type B does not always have simple correspondence with the commonly used classification of uncertainty components as “random” and “systematic”. The nature of an uncertainty component is conditioned by the use made of the corresponding quantity, that is, on how that quantity appears in the mathematical model that describes the measurement process. When the corresponding quantity is used in a different way, a “random” component may become a “systematic” component and vice versa. Thus the terms “random uncertainty” and “systematic uncertainty” can be misleading when generally applied. An alternative nomenclature that might be used is:
“uncertainty component arising from a random effect,”
“Uncertainty component arising from a systematic effect.” Random effect is one that gives rise to a possible random error in the current measurement process and a systematic effect is one that gives rise to possible systematic error in the current measurement process. In practical measurement, an uncertainty component arising from systematic effect may in some cases be evaluated by type A evaluation while in other cases by type B evaluation, as may be an uncertainty component arising from a random effect.
KAN-G-01 Issue Number : 2 January 2008
9
6. MODELING THE MEASUREMENT In relation with the evaluation of measurement uncertainty, measurement models need the clear statement of measured quantities, and the quantitative expression shows the relation between the value of measurand and independence parameters where the measurand depends on. Those prameters may be other measurand, quantities those are not measured directly or a constant. The function, which relates the measurand and input quantities is called as measurement model. In most of measurement processes a measurand Y is determined from N other quantities i.e. X1, X2,…, XN through a functional relationship:
Y = f (X1, X2, …, XN) The input quantities X1, X2,…, XN upon which the measurand Y may be viewed as other measurands and may themselves depend other quantities, including corrections and correction factors for recognized systematic effects, thereby leading to a complicated functional relationship f that may never be written down explicitly. The input quantities X1, X2,…, XN
may have values and uncertainties those are directly determined in the current measurement process (such as from a single observation, repeated observation, determination of correction to instruments reading and correction from influence quantities) or obtained from external sources (such as quantities associated with calibrated measurement standards, certified reference materials, and reference data from handbook) An estimate of the measurand Y, denoted by y, obtained from equation (1) using the estimates of input quantities x1, x2,…,xN, for the values of the N quantities X1, X2,…, XN, therefore the estimate of measurand y, which is the result or the measurement process, is given by:
y = f(x1, x2, …,xN)
Where it is assumed that each input estimate has been corrected for all recognized systematic effect that is significant for the output estimate. The estimated standard deviation associated with output estimate, termed as combined standard uncertainty (denoted as uc(y)) is obtained by appropriately combining the estimated standard deviation of each input estimate xi that is termed as standard uncertainty (denoted as u(xi)) Each standard uncertainty u(xi) is obtained either from type A or type B evaluation.

KAN-G-01 Issue Number : 2 January 2008
10
7. IDENTIFICATION OF UNCERTAINTY SOURCES When the measurement process has been expressed in the mathematical model, the uncertainty sources related to the measurement processes shall be well identified to avoid the overestimate or underestimate values of uncertainty. To help the identification process, especially for the measurements those involve many input and influence quantities, the use of cause and effect diagram may be able to simplify the processes. The following procedure can be used as the guidance to make cause and effect diagram: 1. Write down the complete equation represent the measurement processes based on
the results of measurement modelling. The parameters shown in the equation build the major branch of the diagram.
example: The measurement of liquid density based on weiging method: Mathematical model: Vmm kosongisi /)( −=ρ where: ρ is the density of liquid misi is the mass of (volumetric flask + liquid) obtained from the balance reading mkosong is the mass of volumetric flask based on the balance reading V is the volume of volumetric flask
V
MemptyMfilled
ρ
2. Look at each step in the methods and add another factors into the diagram, which form branch of the major branch of the diagram.
In the liquid density measurement process, the calibrated balance and calibrated volumetric flask are used. Measurement is repeated n-times In this process the following uncertainty contribution must be considered:
balance calibration repeatability of weighing calibration of valumetric flask repeatability of volume measurement effect of temperatur to the capacity of volumetric flask

KAN-G-01 Issue Number : 2 January 2008
11
By adding those above factors in the diagram, we get:
ρ
Mfilled Mempty
V
repeatabilityrepeatability
temperaturecalibration
calibration calibration
3. For each branches, add another factors those give contribution untill all significant factors included in the diagram.
Based on the uncertainty sources identified in point (2), then we must consider the following:
the calibration certificate of balance: Expanded uncertainty contained in the certificate Drift of the balance indication based on the historical data
the calibration certificate of volumetric flask Expanded uncertainty contained in the certificate Drift of the volumetric flask based on the historical data
measurement of ambient temperature
Expanded uncertainty contained in the calibration certificate of thermometer Distribution of ambient temperature based on the monitoring results
ρ
misi mkosong
V
calibration
calibration
repeatability
driftU95
driftU95drift
repeatability
temperatur
calibration
U95
When the identification process has been finished, the next step is classifying the uncertainty components to determine the evaluation methods.

KAN-G-01 Issue Number : 2 January 2008
12
8. TYPE A EVALUATION OF STANDARD UNCERTAINTY When measurement is repeated several times, the mean value and the standard deviation can be calculated. The standard deviation describes the dispersion of applicable to the whole population of possible measured values. In most cases, the best available estimate of the expectation or expected value of a quantity that varies randomly, and for which n independent repeated observations have been obtained under the same conditions of measurement, is the arithmetic mean or average of the n observations
∑=n
ixn
x1
1
The standard deviation is an estimate of the dispersion of the population from which the n values are taken
1
)()( 1
2
−
−=
∑=
n
xxxs
n
ii
i
After taking one set of n repeated measurements we were to take a second set of n measurements and we could again calculate the mean. It most likely would be slightly different from the first mean. The estimate of the dispersion of the population mean can be calculated as the experimental standard deviation of the mean (ESDM)
nxs
xs i )()( =
The type A standard uncertainty u (xi) for a quantity determined from n independent repeated observations is the ESDM:
)()( xsxu i = Sometimes it is necessary to know the number of degrees of freedomν, for a set of n measurements for which we obtain a mean, the degrees of freedom is:
νi = n - 1 For a well-characterized measurement under statistical control, a pooled experimental standard deviation SP, with degrees of freedom νp based on M series of observations of the same variable may be available. The pooled experimental standard deviation is determined be:
∑
∑
=
== M
1ii
M
1iii
p
v
svs

KAN-G-01 Issue Number : 2 January 2008
13
∑=
=M
1iip vv
Where si is the experimental standard deviation from one series of mi independent repeated observations, and has degrees of freedom:
νi = mi – 1 If the measurement result x of the same variable is determined from n independent observations, the type A standard uncertainty u can be estimated by:
ns
)x(u pi =
There are many methods of determining type A standard uncertainty, the most common calculation is the ESDM, the next most common type evaluation is determination of standard uncertainties from fitted curves. For example suppose we wish to fit a straight line to some data, the straight line is described by the equation:
y = a + bx The difference between an actual data point and the corresponding value calculated from the equation for the curve is called residual. In a curve fitting process the intention is to find values of a and b such that the sum of the squares of residuals (SSR) is minimized.
∑ −−= 2)( ii bxaySSR The scatter of the data points around the fitted curve can be described by an estimate of standard deviation, often called as the standard error of the y values calculated using the curve, which is calculated by:
vSSRs =
Where ν is the number of the degrees of freedom, which can be calculated by:
ν = number of data points – number of coefficients fitted ν = number of data points – 2 for a straight line
As with the mean of repeated observations, for the curve, associated standard uncertainty is obtained from the estimate of standard deviation.
u = s The curve fitting process is not limited to a straight line, generally the fitted curve can be expressed as:
y = f(x)
KAN-G-01 Issue Number : 2 January 2008
14
Although the calculation of coefficients of the fitted curve and evaluating its uncertainty is seem difficult, many of commercial software packages have built in function for the curve fitting (regression) calculation. 9. TYPE B EVALUATION OF STANDARD UNCERTAINTY Type B evaluation of standard uncertainty is obtained by means other than the statistical analysis of a series of observations that usually based on scientific judgment using all relevant information available, which may include:
Previous measurement data
Experience with, or general knowledge of the behavior and property of relevant materials and instruments
Manufacturer’s specification
Data provided in calibration and other reports
Uncertainties assigned to reference data taken from data book
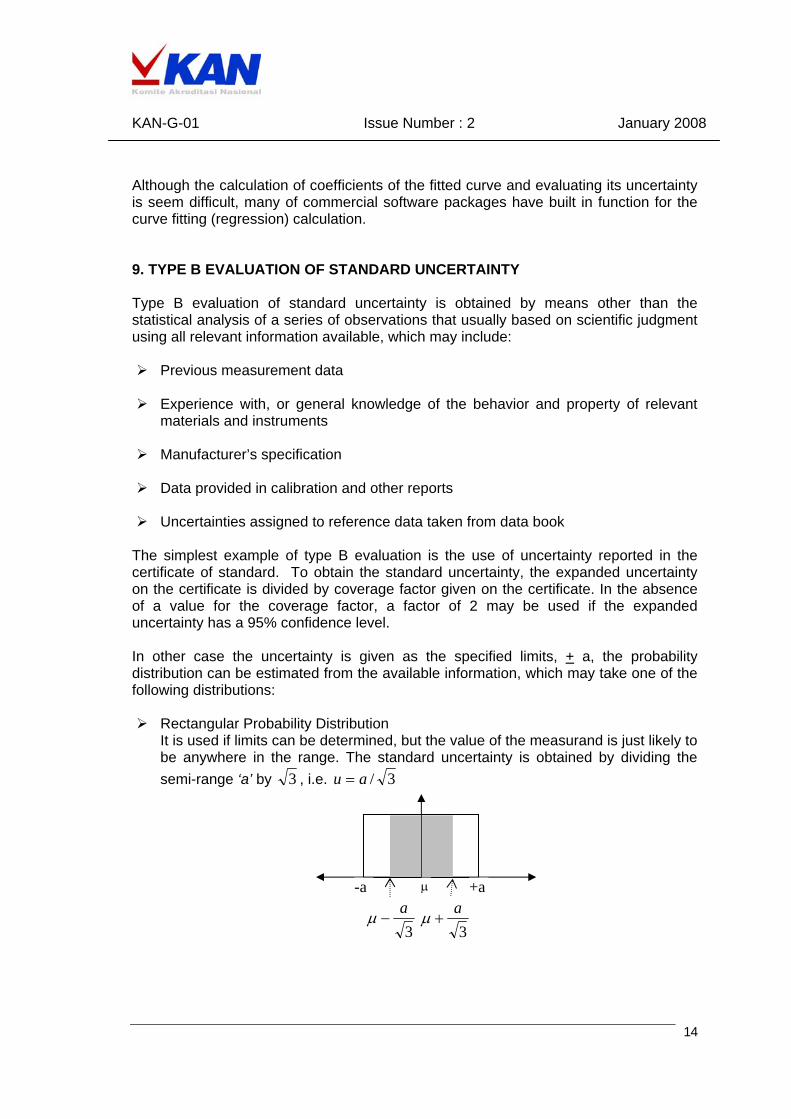
The simplest example of type B evaluation is the use of uncertainty reported in the certificate of standard. To obtain the standard uncertainty, the expanded uncertainty on the certificate is divided by coverage factor given on the certificate. In the absence of a value for the coverage factor, a factor of 2 may be used if the expanded uncertainty has a 95% confidence level. In other case the uncertainty is given as the specified limits, + a, the probability distribution can be estimated from the available information, which may take one of the following distributions:
Rectangular Probability Distribution It is used if limits can be determined, but the value of the measurand is just likely to be anywhere in the range. The standard uncertainty is obtained by dividing the semi-range ‘a’ by 3 , i.e. 3/au =
µ -a +a
3a
−µ3
a+µ

KAN-G-01 Issue Number : 2 January 2008
15
Triangular Probability Distribution It is used when there is evidence that the values near the mean are the most probable value, as the limits decreased, the probabilities decreases to zero. The standard uncertainty is obtained by dividing semi-range ‘a’ by 6 , i.e. 6/au =
µ -a +a
6a
−µ6
a+µ
U-Shape Probability Distribution This distribution occurs in several area of metrology. An example is the distribution for uncertainties arising from the radio frequency connector reflections. It may also be applicable to air temperature variations where the temperature control produce regular temperature excursion between limits. The standard uncertainty is obtained by dividing semi-range ‘a’ by 2 i.e. 2/au =
µ -a +a
2a
−µ2
a+µ
Gaussian or Normal Distribution This distribution form can be assumed for an uncertainty that defines a confidence interval having given level of confidence of say 95% or 99%. The standard uncertainty is obtained by dividing quoted uncertainty by the appropriate coverage factor based on t-distribution table, i.e. u = U / k; where U is the expanded uncertainty for specified confidence level and k is the coverage factor.
µ -U +U
kU
−µkU
+µ
KAN-G-01 Issue Number : 2 January 2008
16
For type B evaluation of standard uncertainty, rectangular distribution is a reasonable default model in the absence of any other information. But if it is known that values of the quantity in question near the center of the limits, a triangular or normal distribution may be a better model. Type B standard uncertainty is obtained from a priori probability distributions. It is simplicity assumed that the probability distribution is exactly known. In most cases, we can assume that the degrees of freedom for such standard uncertainty as infinite. This is reasonable assumption as it is a common in practice to choose a type B uncertainty that the probability of the concerned quantity lying outside the uncertainty band is extremely small.
KAN-G-01 Issue Number : 2 January 2008
17
10. SENSITIVITY COEFFICIENTS The sensitivity coefficient is one of the aspects in evaluating measurement uncertainty that causes difficulty. The sensitivity coefficients convert all uncertainty components to the same unit as the measurand. This is necessary precondition to combining uncertainty components having different units. The sensitivity coefficients also give a scaling of weighing function for each uncertainty component; those describe how the output estimate varies with the changes in the value of the input estimates Evaluations of the sensitivity coefficients can be done based on the partial differentiation of a function represent the mathematical model of a measurement.
ii xfc ∂∂= / The sensitivity coefficients sometimes determined experimentally, by varying specified input quantity while holding the remaining input quantities constant. Sensitivity coefficients sometimes can be determined experimentally by varying specified input quantities and keep constant another input quantities. If y = f(x1, x2, x3,...) and uncertainty of each input quantity expressed as u(xi), contribution of an input quantity ui(y) to the uncertainty of the measurand uc(y)can also be obtained by using the following equation:
u1(y) = c1u(x1) = f( x1+u(x1), x2, x3, ...) - f(x1, x2, x3,...) u2(y) = c2u(x2) = f( x1, x2+u(x2), x3, ...) - f(x1, x2, x3,...)
Etc. At this time much software has built in mathematical function, this makes calculation of uncertainty contribution using the above equation can be easier than evaluate the partial differentiation of the measurand for each input quantities.
KAN-G-01 Issue Number : 2 January 2008
18
11. COMBINED STANDARD UNCERTAINTY The combined standard uncertainty of a measurement, denoted by uc(y), is taken to represent the estimated standard deviation of the result. It is obtained by combining the individual standard uncertainties of input estimate based on a first order Taylor series approximation of the measurement model. The method for combining standard uncertainty is often called the law of propagation of uncertainty. For uncorrelated input quantities, the combined standard uncertainty of input estimate y can be written as
)]([)]([)(N
1i1
2 ∑∑==
== yuxucyu i
N
iiic
Where: ci= ixf ∂∂ / and ciu(xi)=ui(y) In measurement processes, there some occasions where two or more input quantities are interdependent. The appropriate expression for the combined standard uncertainty associated with the result of measurement is:
∑ ∑ ∑=
−
= +=
+=N
i
N
i
N
ijjijijiiic xxrxuxuccxucyu
1
1
1 1
2 ),()()(2)]([)(
The interdependence of two variables is characterized by their correlation coefficients, which can be expressed as:
)()(),(
),(ji
jiji xuxu
xxuxxr =
Correlation can occur if the same measurement is used more than once in the same measurement process, however, its effect of the combined uncertainty may be positive, i.e. the uncertainty is increased of negative, which will lead to a reduction in the uncertainty If a positive correlation is suspected but the correlation coefficient cannot be calculated simply, it is reasonable to assume a correlation coefficient of +1. If all of the input estimates are correlated with correlation coefficients of +1, the combined standard uncertainty of output estimate can be expressed as:
2
1
)()( ⎥⎦
⎤⎢⎣
⎡= ∑
=
N
iiic xucyu
For practical purpose in testing area, the following simple’s rules for combining standard uncertainty are given:
If models involving only a sum or difference of quantities,
KAN-G-01 Issue Number : 2 January 2008
19
e.g. ...)( +++= rqpy
...)()()()( 222 +++= ruqupuyuc
If models involving only a product or quotient, e.g. ...)./(or ..... rqpyrqpy ==
...)/)(()/)(()/)(()( 222 +++= rruqquppuyyuc
If models involving only n-order function,
e.g, y = an
uc(y) = ny u(a) / a
KAN-G-01 Issue Number : 2 January 2008
20
12. EFFECTIVE DEGREES OF FREEDOM To need of the calculation of the effective degrees of freedom associated with an uncertainty component is to allow correct selection of the value Student’s t, and also gives an indication on the reliability of the uncertainty estimation. A high number of degrees of freedom represent the large number of measurement, low dispersion, and high confidence of the value, in other hand, a low number of degrees of freedom correspond to a large dispersion or poorer confidence in the value. Every component of uncertainty have an appropriate number of the degrees of freedom, ν, assigned to it. For the mean value of n measurement the degrees of freedom is
ν = n-1 For the value associate with a fitted curve or regression, the number of degrees of freedom is
ν = number of data points – number of coefficients fitted For the uncertainty components estimate based on the knowledge of limits + a, the ISO GUM gives a formula that is applicable to all distributions, that is:
2
)()(
21
−
⎥⎦
⎤⎢⎣
⎡∆≈
i
i
xuxu
ν
Where:
)()(
i
i
xuxu∆
Is the relative uncertainty of estimated limits
If all the uncertainty components have been combined, the number of degrees of freedom of the combined standard uncertainty need to be estimated, that is the effective degrees of freedom for the combined standard uncertainty which can be calculated using Welch-Satterthwaite formula:
∑=
n
i
i
ceff yu
u
1
4
4
)(ν
ν
where: νeff is the effective number of degrees of freedom for combined standard uncertainty νi is the number of degrees of freedom of the i-the uncertainty components ui(y) is the product ciu(xi) Based on the effective number of degrees of freedom of the combined standard uncertainty, the coverage factor needed in obtaining expanded uncertainty for desired

KAN-G-01 Issue Number : 2 January 2008
21
confidence level can be obtained from the t-distribution table, for 95% confidence level, it may be calculated by the formula:
k = 1.95996 +2.37356/ν+2.818745/ν2 +2.546662/ν3 +1.761829/ν4 +0.245458/ν5 +1.000764/ν6
13. EXPANDED UNCERTAINTY In order to have an adequate probability that the value of the measurand lies within the range given by the uncertainty. The measure of uncertainty intended to meet adequate probability is termed as expanded uncertainty, denoted by symbol U, and is obtained by multiplying uc(y) by a coverage factor, denoted by symbol k.:
U = k × uc(y) International practice is to give a level of confidence of approximately 95% (95.45%). For the specified level of confidence, the k value varies with effective degrees of freedom. In many cases, k equal to 2 can be used where the effective degrees of freedom is reasonably large, that is greater or equal to 30. If the effective degrees of freedom is relatively small, the value of k can be obtained from the t-distribution table.

KAN-G-01 Issue Number : 2 January 2008
22
14. REPORTING UNCERTAINTY In practice, the amount of information necessary given in the testing and calibration report or certificate depends on its intended use In reporting measurement result, the following information should be provided:
Result of measurement
Expanded uncertainty with coverage factor and level of confidence specified
Description of measurement method used to calculate the results and its uncertainty
Values and sources of all corrections and constants used in both the calculation and the uncertainty analysis
Functional relationship Y=f(X1, X2, …) and any such sensitivity coefficients determined experimentally should be given.
In reporting calibration or test results and their uncertainies, the following should be considered:
The numerical value of measurement uncertainty should be given at most two significant figures.
During the stage of the estimation and combination of uncertainty components, at
least one more figure should be used to minimize rounding errors.
If the rounding brings the numerical value of measurement uncertainty down by more than 5 %, the rounding up value should be used.
The numerical value of the measurement result should in the final statement
normally be rounded to the least significant figure in the value of the expanded uncertainty assigned to the measurement result.
KAN-G-01 Issue Number : 2 January 2008
23
15. STATEMENT OF COMPLIANCE WITH SPECIFICATION Clause 5.10.3.1 of ISO/IEC 17025 on test report state: ”... if necessary, for the interpretation of test report, include: ... b) when relevan, the statement of compliance/non-compliance with specification...”. For the calibration report, clause of ISO/IEC 17025 states: “... if statement of compliance was made, uncertainty of measurement shall be taken into accout” In harmony with those clauses of ISO/IEC 17025, when a test and/or calibration is carried out to a stated specification and the client or the specification requires the statement of compliance, the reports must contain a statement indicating whether the test and/or calibration results show compliance with the specification. Where the measurement uncertainty is relevant to the validity or application of the test and/or calibration results, or when a client’s instruction requires so, or shen the uncertainty affects compliance to a specification limits, the expanded uncertainty of measurement shall be taken into account. In addition level of confidence and coverage factor for the uncertainty shall be reported. When a specification describes an interval with an upper and lower limit, the ratio of the uncertainty of measurement to the specified interval should be reasonably small. For an uncertainty of measurement U and a specified interval 2T (2T=upper limit-lower limit), the ratio U:T is a measure of the test or calibration method in distinguishing compliance from non-compliance. The simplest case is where the specification clearly states that the test and/or calibration result, extended by the uncertainty at a given confidence level shall not fall outside or within a defined specification limits or limits. More often, the specification requires a statement of compliance in the certificate of report but makes no reference to taking into account the effect of uncertainty on the assessment of compliance. In such cases it may be appropriate for the user to make judgement of cmpliance, based on whether the test and/or calibration result is within the specified limits with no account taken of the uncertainty. illustration: the measured result for the diameter of a rod is 0.50 mm while the specification limit is between 0.45 mm to 0.55 mm, the user may conclude that the rod meets the requirement without considering the uncertainty of measurement. This often referred to as shared risk since the end user takes some of the risk that the product may not meet the specification after being tested with an agreed measurement method. In this case there is an implicit assumption that the uncertainty of the agreed measurement method is acceptable and it is important that it can be evaluated when
KAN-G-01 Issue Number : 2 January 2008
24
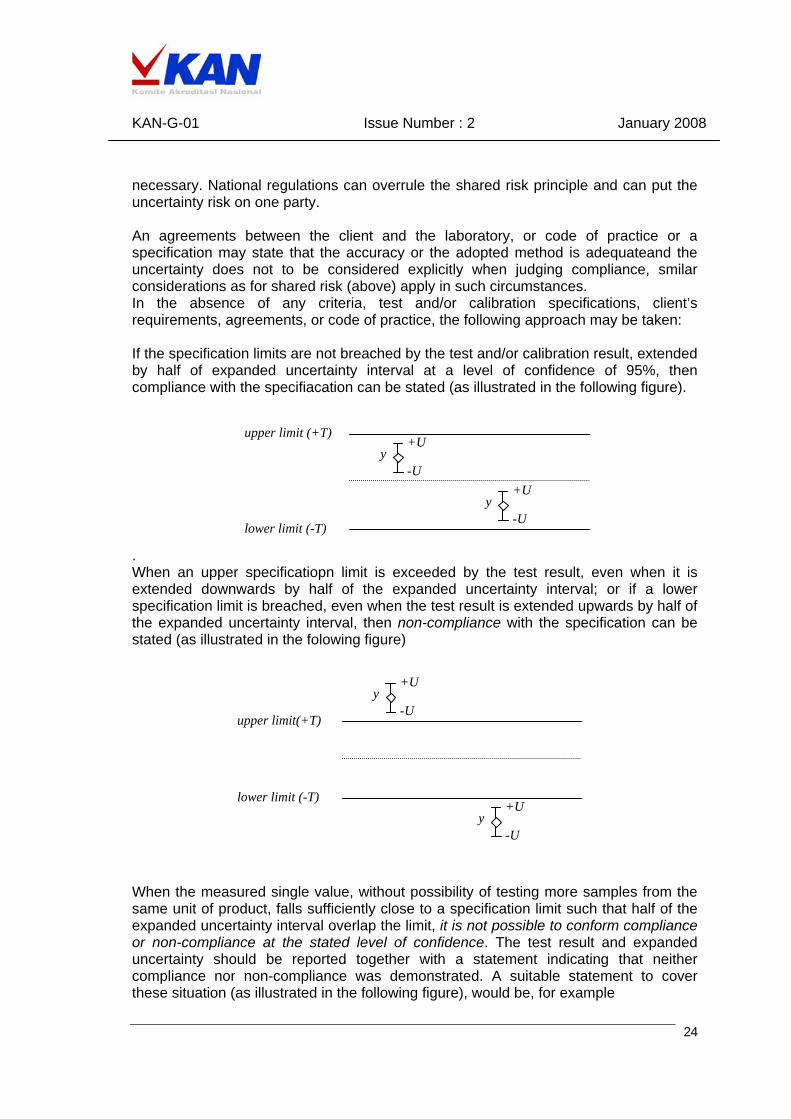
necessary. National regulations can overrule the shared risk principle and can put the uncertainty risk on one party. An agreements between the client and the laboratory, or code of practice or a specification may state that the accuracy or the adopted method is adequateand the uncertainty does not to be considered explicitly when judging compliance, smilar considerations as for shared risk (above) apply in such circumstances. In the absence of any criteria, test and/or calibration specifications, client’s requirements, agreements, or code of practice, the following approach may be taken: If the specification limits are not breached by the test and/or calibration result, extended by half of expanded uncertainty interval at a level of confidence of 95%, then compliance with the specifiacation can be stated (as illustrated in the following figure).
upper limit (+T) y
-U
+U +U
y -U lower limit (-T)
. When an upper specificatiopn limit is exceeded by the test result, even when it is extended downwards by half of the expanded uncertainty interval; or if a lower specification limit is breached, even when the test result is extended upwards by half of the expanded uncertainty interval, then non-compliance with the specification can be stated (as illustrated in the folowing figure) +U y -U
upper limit(+T) lower limit (-T)
+U y
-U When the measured single value, without possibility of testing more samples from the same unit of product, falls sufficiently close to a specification limit such that half of the expanded uncertainty interval overlap the limit, it is not possible to conform compliance or non-compliance at the stated level of confidence. The test result and expanded uncertainty should be reported together with a statement indicating that neither compliance nor non-compliance was demonstrated. A suitable statement to cover these situation (as illustrated in the following figure), would be, for example
KAN-G-01 Issue Number : 2 January 2008
25
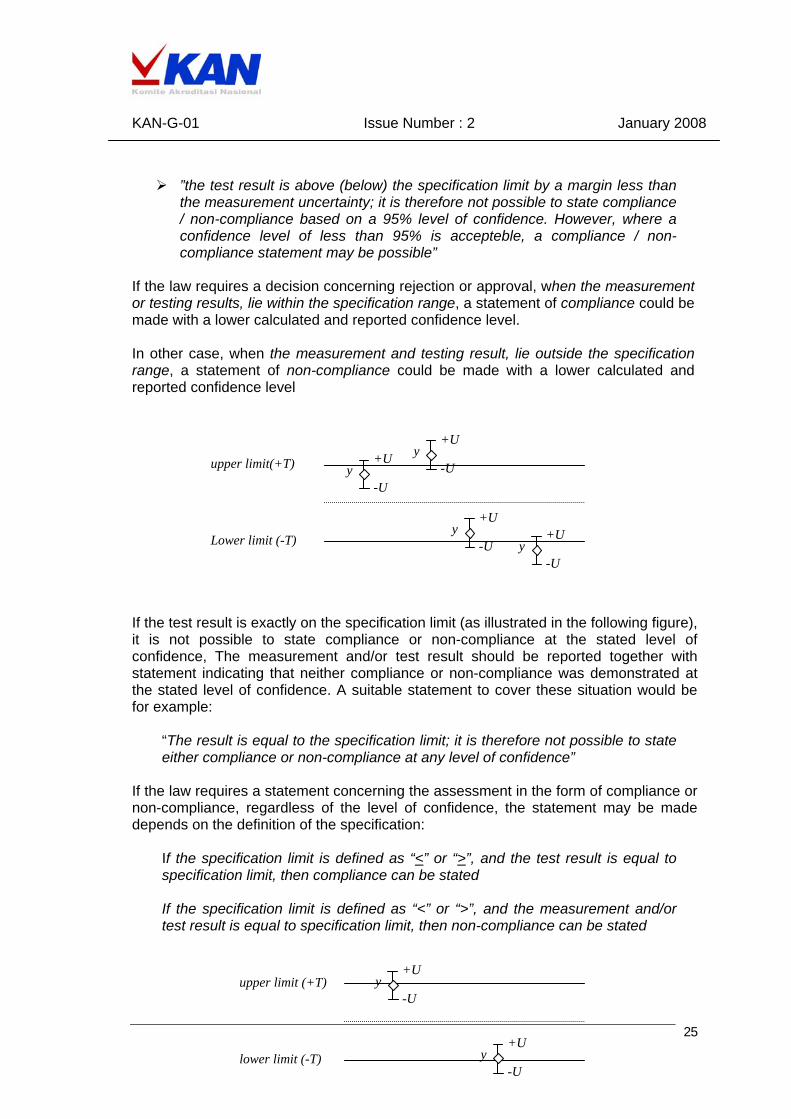
”the test result is above (below) the specification limit by a margin less than the measurement uncertainty; it is therefore not possible to state compliance / non-compliance based on a 95% level of confidence. However, where a confidence level of less than 95% is accepteble, a compliance / non-compliance statement may be possible”
If the law requires a decision concerning rejection or approval, when the measurement or testing results, lie within the specification range, a statement of compliance could be made with a lower calculated and reported confidence level. In other case, when the measurement and testing result, lie outside the specification range, a statement of non-compliance could be made with a lower calculated and reported confidence level
-U y -U
+U +U
y upper limit(+T)
y -U
+U y -U
+U Lower limit (-T) If the test result is exactly on the specification limit (as illustrated in the following figure), it is not possible to state compliance or non-compliance at the stated level of confidence, The measurement and/or test result should be reported together with statement indicating that neither compliance or non-compliance was demonstrated at the stated level of confidence. A suitable statement to cover these situation would be for example:
“The result is equal to the specification limit; it is therefore not possible to state either compliance or non-compliance at any level of confidence”
If the law requires a statement concerning the assessment in the form of compliance or non-compliance, regardless of the level of confidence, the statement may be made depends on the definition of the specification:
If the specification limit is defined as “<” or “>”, and the test result is equal to specification limit, then compliance can be stated If the specification limit is defined as “<” or “>”, and the measurement and/or test result is equal to specification limit, then non-compliance can be stated
y -U
+U upper limit (+T)
y -U
+U lower limit (-T)

KAN-G-01 Issue Number : 2 January 2008
26
16. SUMMARY OF EVALUATION PROCEDURE The following is guide to use these documents in practice:
Derive or estimate the mathematical model of measurement process
Determine the estimated value of input quantity,
List all sources of uncertainty in the form of an uncertainty analysis
Evaluate the type A standard uncertainty for repeatedly measured quantities
Estimate the type B standard uncertainty based on the available information
Evaluate the sensitivity coefficients for each input quantities
Calculate the combined standard uncertainty
Evaluate the effective degrees of freedom
Calculate the expanded uncertainty of measurement result
Report the result of the measurement and the associate expanded uncertainty and the coverage factor in calibration/testing report/certificate.
If the statement of compliance with specification is necessary, evaluate compliance
with specification based on the requirement of the standard and/or clients.

KAN-G-01 Issue Number : 2 January 2008
27
17. EVALUATION OF BEST MEASUREMENT CAPABILITY Best Measurement Capability (BMC) is defined as, “the smallest uncertainty of measurement that a laboratory can achieve within scope of accreditation, when performing more or less routine calibrations of nearly ideal measurement standards intended to define, realize, conserve of reproduce a unit of that quantity of one or more of its values, or when performing more or less routine calibration of nearly ideal measuring instruments designed for the measurement of that quantity.” Based on the definition, it must be concerned, that BMC assigned for a laboratiry must reflect the capability of the respective laboratory in carrying out routine calibration to the nearly ideal measuring instrument or measurement standards, which can be calibrated by the laboratory using their own resources. Therefore, in practice, BMC is the uncertainty values, which often can be achieved by the laboratory in carrying out routine services. Uncertainty reported by the laboraotry may be smaller than their BMC, if in this case the laboratory calibrate measuring instruments or measurement standards, those have better characteristic than the nearly ideal condition used in the evaluation of BMC. In certain condition, uncertainty reported by the laboratory may be larger than their BMC, if in thiscase laboratory calibrate measuring instruments or measurements standards those have worse characteristic than the nearly ideal condition used in the evaluation of BMC.. The cases, those need investigation seriously are when laboratory report much larger or much smaller uncertainty than their BMC for the calibration of measuring instruments or measurement standards those have equal or nearly equal characteristc with the nearly ideal condition used in the evaluation of BMC. In practice BMC may be evaluated by measurement audit using nearly ideal artifacts or bay asssessing uncertainty badget that usually used by the laboraroty in carrying out routine services to their clients. BMC consist of some components those depend on any factors needed by laboratory to demonstrate their competence. Those factors may include:
Education, training and technical knowledge of personnel
Environmental condition of calibration laboratory
Maintenance of equipments, including calibration intervals and verificationsi
KAN-G-01 Issue Number : 2 January 2008
28
To get adequate evidence in assessing BMC, observation to the laboratory condition must be done by considering :
Calibration Method Calibration method will affect BMC of the laboratory, because it usually states specification of unit under test, environmental condition requirements, calibrator, observation schemes, etc. The method used in the calibration processes will yield the different BMC values for the same reference standards or measuring equipments. For example, the BMC for the weight calibration based on the direct comparison method would be different from those based on the closed cycle or decade methods.
Reference standard and measuring equipment Reference standards and measuring equipments used in the calibration processes are the major uncertainty sources in the evaluation of BMC. Their uncertainty will define the type of unit under test, which can be calibrated by the respective laboratory. In particular cases, laboratories those have same reference standard will have different BMC because of difference measuring equipment used. For example, mass calibration laboratories those have mass standards of E2 classes will have different BMC if a laboratory used mass comparator of 0.1 mg resolution and the other use 0.01 mg mass comparator. Beside the uncertainty stated in the calibration certificate, one important uncertainty source is drift of those reference standard and measuring equipments. It must be understood that the value stated in the certificates are only valid in the time of calibration. For the routine condition, the drift may occur, and it can be estimated based on the historical data.
Ancillary equipments In the calibration processes, type and accuration of ancillary equipment used to monitor influence quantities for the respective calibration will affect BMC values, as well as the data processing system for the data analysis. For example, in the weight calibration, ancillary equipments used to monitor the air density during calibration will give smaller BMC than the laboratory, which carry out weight calibration without air density monitoring system, and the uncertainty due to this factor estimated based on the worst condition of air density variation.
Measurement techniques Different measurement techniques may cause the different BMC values, for example BMC for calibration of weight based on direct comparison method Standard-Test-Test-Standard carried once will give larger BMC than that carried out three series. If measurement carried out once, uncertainty due to repeatability will be (stdev of balance / 21/2), and for three series of measurement will be (stdev of balance / 61/2)
Influence quantities
Influence quantity is the quantity, which is not included in the definition of the measurand but affect the result of measurement. Thee quantities often cannot be
KAN-G-01 Issue Number : 2 January 2008
29
eliminated perfectly so that the contribution must be taken into account in the uncertainty evaluation. For examples: for the calibration of mass standards based on the conventional weighing, the deviation of the laboratory condition from the air density of 1.2 kg/m3 shall be taken into account.
Personnel
Personnel carry out cvalibration processes will contribute significant effect for the BMC evaluation. For example, different personnel in the weight calibration using the same mass standards and balance may get different result, because repeatability of balance obtained by two personnels may be different. In the calibration of weights, the capability of personnel in observing the standard deviation balance will affect the routine calibration done by the laboratory.
Specification of nearly ideal UUT, whic can be calibrated by the laboratory
The Definition of BMC stated that BMC assigned for the routine calibration of nearly ideal measurement standards or measuring instruments which can be calibrated by the respective laboratory. Based on the definition, contribution of the unit under test can not be neglected in the BMC evaluation. For example, in the weight calibration, laboratory, which has mass standard of E2 class will has best capability to calibrate weight of F1 class, specification of mass standards give the specified densities range for each class of mass standards, in the BMC evaluation it mass be taken into account.
Different illustration may be given for the micrometer calibration using gauge block as reference standards based on JIS B 7502, in this case best condition of micrometer given by the standard must be taken into account.
Based on the observation results, the uncertainty sources for BMC evaluation may include, but not limited to: 1. Standard uncertainty due to the reference standard used in the respective
calibration. These may include: standard uncertainty of the calibration (based on the uncertainty reported in the
calibration certificate) drift of the reference standard (based on the historical data) working condition of the reference standard
2. Standard uncertainty due to the ancillary equipment, which have significant effect
to the calibration results. These may include: standard uncertainty of the calibration (based on the uncertainty reported in the
calibration certificate) drift of the ancillary equipment (based on the historical data) working condition of the ancillary equipment
3. Type A standard uncertainty observed during the routine calibration processes in
the respective laboratory, include the estimated type uncertainty of the nearly ideal unit under test.
4. Standard uncertainty due to the resolution, division or discrimination, include those
come from the nearly ideal unit under test.
KAN-G-01 Issue Number : 2 January 2008
30
5. Standard uncertainty due to the other influence quantities and characteristics of the
nearly ideal unit under test.
18. REFERENCES 1. ISO Guide to The Expression of Uncertainty in Measurement, 1993, International
Organization for Standardization, Geneva, Switzerland 2. ISO/IEC 17025 General Requirements for the Competence of Testing and
Calibration laboratories, first edition, 1999 3. International Vocabulary of Basic and General Terms in Metrology, 1993 4. SNI-19-17025-2000 Persyaratan Umum Kompetensi Laboratorium Penguji dan
Kalibrasi, 2000 5. Taylor, B N, Kuyatt, C E, Guideline for Evaluating and Expressing the Uncertainty
of NIST Measurement Results, NIST Technical Note 1297, 1993 6. SAC-SINGLAS Technical Guide 1, Guidelines of The Evaluation and Expression of
Measurement Uncertainty, 2nd edition, 2001 7. SAC-SINGLAS Technical Guide 2, Guidelines of The Evaluation and Expression of
Uncertainty in Chemical Analysis, 1st edition, 2000 8. EA-4/02 Expression of The Uncertainty of Measurement in Calibration, European
Accreditation, 1999 9. Cook, R R, Assessment of Uncertainty of Measurement for Calibration and Testing
Laboratories, 1998 10. EURACHEM/CITAC Guide Quantifying Uncertainty in Analytical Measurement,
2000 11. Cook, R R, Giardini, W J, Guide to the ISO Guide to the Expression of Uncertainty
in Measurement, CSIRO-NML 1993