fy2021 budget · maryland and washington d.c. sixty-three percent of metroaccess trips are provided...
TRANSCRIPT

FY2021BudgetStrengthening Metro to Better Serve the Region M
metro
Effective July 1, 2020
WASHINGTON METROPOLITAN AREA TRANSIT AUTHORITY
Chapter Title
1

Table of Contents
General Manager and Chief Executive Officer’s Message .......................................................................... i
Board of Directors ....................................................................................................................................... iii
Chapter 1 – Budget Summary ..................................................................................................................... 1
Chapter 2 - Metro Officers ........................................................................................................................ 17
Chapter 3 - Operating Budget ................................................................................................................... 25
Chapter 4 - Capital Budget ....................................................................................................................... 83
Appendix A - Metro Profile ........................................................................................................................ 89
Appendix B - Budget Process ................................................................................................................... 97
Appendix C - Human Capital Summary ................................................................................................... 101
Appendix D - Capital Projects ................................................................................................................. 105
Appendix E - Sustainability, Energy and Resiliency ............................................................................... 243
Appendix F - Financial Standards ........................................................................................................... 247
Appendix G - Debt Service ..................................................................................................................... 253
Appendix H - Operating Statistics ........................................................................................................... 259
Appendix I - Performance Data ............................................................................................................... 277
Appendix J - Board Budget Resolution ................................................................................................... 305
Appendix K - Glossary of Terms .............................................................................................................. 353
Appendix L - Glossary of Acronyms and Abbreviations ........................................................................... 357
How to Contact Metro ............................................................................................................................. 360

GOVERNMENT FINANCE OFFICERS ASSOCIATION
Distinguished Budget Presentation
AwardPRESENTED TO
Washington Metropolitan Area Transit AuthorityDistrict of ColumbiaFor the Fiscal Year Beginning
July 1, 2019
Christopher P. Morrill
Executive Director

THIS PAGE INTENTIONALLY LEFT BLANK

General Manager and Chief Executive Officer’s Message
i
General Manager and Chief Executive Officer’s Message
We begin this fiscal year with unprecedented challenges in the world and the national capital region. In responding to the global pandemic, we temporarily modified our services and reinforced our commitment to ensuring the health and safety of employees and customers. Supported by nearly a billion dollars in federal relief funding to provide essential bus and rail service, we are sustaining public confidence in transit through service restoration and carefully, managed re-entry with stakeholder coordination and customer feedback. The Board-approved FY2021 Budget funds our service recovery and
resiliency plans in support of re-energizing the region’s economy after months-long stay-at-home orders. The budget positions Metro and the region to successfully rebound from this extraordinary period. We remain in close coordination with our regional stakeholders and are working with elected officials, business leaders and community organizations to determine how to emerge from the crisis more resilient through improved mobility, sustainability, in a more fair and equitable way. While maintaining fiscal accountability, the budget includes productivity improvements that begin to pay for new safety protocols and include new service for Silver Line Phase 2. However, the pandemic caused some planned initiatives to be deferred: including service and fare changes, more weekend service, late-night Metrorail hours, MetroExtra service, fare simplification and greater transfer discount for riders transferring between bus and rail. The budget includes $2.1 billion in operating expenses and $1.8 billion of capital investment to pay for Metro’s commitment to service reliability and enhancing the customer experience. This includes a one-time subsidy credit of $135 million to funding jurisdictions and $546 million of Coronavirus Aid, Relief and Economic Security (CARES) Act funding to help Metro balance the budget. The capital program continues to invest in safety and reliability improvements, accelerating work while ridership is lower and construction is less impactful for communities. As we enter the fiscal year with our first-ever bonded, dedicated capital program, we are making steady progress reducing our investment backlog by $2 billion in three years, extending the life of our capital assets and improving operating performance. Prior to the pandemic, ridership was rebounding to budget levels. Capital investments such as platform reconstruction and railcar procurement have delivered tangible improvements to safety, comfort, and service reliability. To maintain the progress, we need continued federal and regional support through renewal of the federal dedicated funding that has been championed by our regional congressional delegation and matched equally by Virginia, Maryland and the District of Columbia. The region’s commitment to Metro has never been stronger, as we find new ways to serve our communities and keep the region moving. We are all working together toward a more mobile, healthy, equitable and sustainable future for all riders in the region. Sincerely, Paul J. Wiedefeld General Manager and Chief Executive Officer

Dates are only tentative; actual dates of service change will be based on regional readiness, with 2 month lead time
Stepping Up Service in Three Levels
A Multi-Phase Approach
ii
General Manager and Chief Executive Officer’s Message
Covid-19 Recovery Planning Metro has implemented a Covid-19 recovery plan that includes flexible guidelines for restoring service while protecting customers and employees. Metro’s plan is closely aligned with steps planned by local governments and employers, including the Federal Government. It is designed to phase in actions that position Metro to emerge stronger and more resilient for post-pandemic operations. As part of the revisions to the operating budget approved by Metro’s Board of Directors on May 28, 2020, service and fare enhancements as presented in Metro’s FY2021 Budget are effective January 2021, although Metro’s Board of Directors has reserved the right to make further adjustments as conditions warrant. The unprecedented situation presented by Covid-19 calls for continuous monitoring and evaluation and will be revisited regularly throughout FY2021.
Note: The ridership trend is illustrative only and intended to convey an uncertain trajectory through the presented phases of recovery.

Board of Directors
iii
Board of Directors The Washington Metropolitan Area Transit Authority is governed by a 16-member Board of Directors composed of eight Principal Directors and eight Alternate Directors. The District of Columbia, Maryland, Virginia and the federal government each appoint two Principal and two Alternate members. Below are the members currently serving on the Board.
Paul C. Smedberg, Chair
Paul Smedberg was elected Chairman of the Board in June 2019. He was first appointed to the Board as an Alternate Director in 2016 and appointed Principal Director in January 2019 representing the Commonwealth of Virginia. He served on the Alexandria City Council from 2003 to 2018, the Virginia Railway Express (VRE) Operations Board from 2006 to 2018 and has served on the Northern Virginia Transportation Commission (NVTC) since 2006. Mr. Smedberg currently serves as Chair of Metro’s Executive Committee and is a member of the Finance and Capital Committee.
Stephanie Gidigbi, First Vice Chair
Stephanie Gidigbi was appointed to the Board in December 2019 as First Vice Chair representing the District of Columbia. As Director of Policy & Partnerships for the Natural Resources Defense Council (NRDC) Healthy People, Thriving Communities Program, Gidigbi serves as part of the senior leadership team for the Resilient Communities division and Federal Climate Management Team. She previously served as the Director for Strategic Initiatives at the U.S. Department of Transportation under Secretary Anthony Foxx. Prior to working for President Obama, she served as Chief of Staff for the City of Orange in New Jersey. Ms. Gidigbi is a member of Metro’s Safety and Operation Committee.
Michael Goldman, Second Vice Chair
Michael Goldman was appointed to the Board as a Principal Director in June 2013 representing the State of Maryland. Mr. Goldman has practiced in the areas of international, antitrust and transportation law since 1972. Mr. Goldman serves as Chair of Metro’s Safety and Operations Committee and Second Vice Chair of the Executive Committee. Mr. Goldman is currently an active member of the District of Columbia Bar, the American Bar Association sections on antitrust and administrative law, and the Forum on Air & Space Law.
David Horner, Executive Committee Member
David Horner was appointed to the Board as a Principal Director in July 2017 representing the federal government. David is a partner with the law firm of Hunton Andrews Kurth LLP. He also served at the US Department of Transportation as Deputy Assistant Secretary for Transportation Policy and Chief Counsel of the Federal Transit Administration. Mr. Horner currently serves as Vice Chair of Metro’s Safety and Operations Committee in addition to his service on the Executive Committee.

iv
Board of Directors
Matt Letourneau
Matt Letourneau joined the Board as an Alternate Director in January 2019 and was appointed Principal Director representing NVTC in March 2020. He was elected to represent the Dulles District on the Loudoun County Board of Supervisors in 2011 and re-elected in 2015 and 2019. Mr. Letourneau serves as Chairman of the Loudoun Board's Finance, Government Operations and Economic Development Committee. He represents Loudoun on NVTC and is its Immediate Past Chair. Mr. Letourneau serves on Metro’s Safety and Operations Committee.
Gregory Slater
Gregory Slater was appointed to the WMATA Board of Directors as a Principal Director representing the State of Maryland in January of 2020. Mr. Slater began serving as the Secretary of the Maryland Department of Transportation (MDOT) in December 2019 after more than two decades of public service at the MDOT State Highway Administration (MDOT SHA). Mr. Slater leads a transportation department with more than 10,000 employees and an operating budget of nearly $5.4 billion. He oversees every aspect of state transportation, from its highways, roadways, transit systems/services and toll facilities to motor vehicles, the BWI Thurgood Marshall Airport and the Helen Delich Bentley Port of Baltimore. Mr. Slater currently serves as a member of Metro’s Finance and Capital Committee.
Steve McMillin
Steve McMillin was appointed to the Board as a Principal Director in July 2017 representing the Federal Government. Mr. McMillin is a partner in the economic and public policy consulting firm US Policy Metrics LLC. He spent 19 years in federal government service as a fiscal policy specialist, in both the legislative and executive branches. From 2006 through 2009, he was Deputy Director of the Office of Management and Budget (OMB), and previously served as the OMB Associate Director responsible for transportation matters. Mr. McMillin serves as Chair of Metro’s Finance and Capital Committee.
Canek Aguirre
Canek Aguirre was appointed to WMATA Board of Directors in March 2020. He was appointed to the NVTC in January 2019 and is currently serving as its vice-chair. Mr. Aguirre was elected in November 2018 to serve a three-year term on the Alexandria City Council, the first Latino elected to that body. He is a past chair of the Economic Opportunities Commission, past president of the Tenants and Workers United (TWU) Board of Directors, and past vice-chairman of the Health Systems Agency of Northern Virginia (HSANV) Board of Directors. In 2016, Mr. Aguirre was appointed to the Virginia Board of Social Work by Governor Terry McAuliffe.
Tom Bulger
Tom Bulger was appointed to the Board as an Alternate Director in July 2011 representing the District of Columbia. He is President of Government Relations Inc. and has been a federal advocate and policy consultant who represents private and public clients before Congress and the Administration. After spending the first few years of his career in the Office of Management and Budget in Fairfax County, VA, Mr. Bulger was an environmental policy director and legislative representative at the National Association of Counties.

Board of Directors
v
Devin Rouse
Devin Rouse was appointed to the Board as an Alternate Director in December 2018 representing the federal government. Mr. Rouse is the Director of the Passenger Rail Division within the Federal Railroad Administration’s (FRA) Office of Railroad Safety. Prior to joining FRA, Mr. Rouse served in numerous roles for Bechtel Corporation in the design, engineering and construction of railway infrastructure, and began his railroad career at Norfolk Southern’s Roanoke Locomotive Shops.
Walter L. Alcorn
Walter L. Alcorn was appointed to the Board in January 2020 as an Alternate Director representing Fairfax County when he began his first term as the Hunter Mill District Supervisor on the Fairfax County Board of Supervisors. Mr. Alcorn’s focus is on transit-oriented development, pedestrian/bicyclist mobility and safety, affordable housing and diversifying the local economy. Previously, Mr. Alcorn served on the county’s Planning Commission for 16 years and also served on the Park Authority Board. Professionally, he has worked on environmental issues in the tech industry and is a nationally recognized expert on electronics recycling systems.
Jeff Marootian
Jeff Marootian was appointed to the Board as an Alternate Director in September 2017 representing the District of Columbia. He joined the District Department of Transportation from the US Department of Transportation, where he served under Transportation Secretary Anthony Foxx from 2013 to 2017. Mr. Marootian was appointed by President Barack Obama to serve as the White House Liaison from 2013 to 2015 where he worked to promote President Obama's transportation agenda. Mr. Marootian serves as Interim Vice Chair of the Finance and Capital Committee.
Thomas Graham
Thomas H. Graham was appointed to the Metro Board of Directors in May 2019 as an Alternate Director representing Prince George’s County. Mr. Graham is the founder of T.H. Graham and Associates, a strategic consulting firm. Prior to his work as a consultant, Mr. Graham served in several leadership positions at Pepco Holdings, Inc. before retiring in 2016. Mr. Graham currently serves on the board of the Center of Energy Workforce Development and Maryland Chamber of Commerce, in addition to several other boards.
Anthony E. Costa
Anthony Costa was appointed to the Board as an Alternate Director in July 2014 representing the federal government. Mr. Costa is currently Associate Executive Director for Real Property and Planning for the US Department of Veterans Affairs (VA), where he is leading VA efforts to ensure the agency's real estate assets support the provision of services to our nation's veterans.

THIS PAGE INTENTIONALLY LEFT BLANK

Chapter 1 – Budget Summary
1
Chapter 1 – Budget Summary
Executive Summary Metro is committed to improving the safety, reliability, and affordability of its system by substantially improving its assets — from rail stations, tracks and traction power infrastructure to the vehicles, maintenance facilities and cooling systems — and providing a better transit experience for hundreds of thousands of riders each day.
Metro’s FY2021 Operating Budget is greatly impacted by the region’s response to and anticipated aftermath of the Covid-19 pandemic. These impacts are most notable in the ridership and revenue forecasts for FY2021.
Beginning in March 2020, the Washington Metropolitan Region began implementing stay at home orders to slow the spread of the novel coronavirus. Within just a few weeks, Metro’s overall ridership dropped nearly 88 percent. In late March 2020, Metro implemented rear door only boarding for bus passengers to support the United States Center for Disease Control’s (CDC) social distancing recommendation and protect the health of both Metro’s bus operators and the riding public. Due to the configuration of bus fare equipment and the considerable
cost to retrofit buses to allow for fare collection at the rear door, Metro’s Board made the decision to suspend bus fare collection while rear door boarding was in place. This decision, coupled with greatly reduced Metrorail and MetroAccess ridership, resulted in a nearly 95 percent reduction in fare revenue in April and May 2020.
On March 27, 2020, the President signed into law the Coronavirus Aid, Relief, and Economic Security (CARES) Act which authorized $25 billion to help transit agencies prevent, prepare for and respond to the Covid-19 pandemic. This resulted in a total of $1.02 billion in funding for the Washington D.C. Urbanized Area of which $876.8 million was made available to Metro to assist with lost revenue and additional costs incurred due to the pandemic.
Metro has identified a five-phase recovery plan which includes: crisis response, stabilization, managed re-entry, recovery and resilience. Recognizing both Metro and the region find themselves in an unprecedented situation, this plan allows for flexibility in response while assuming the return to full service and ridership levels will be gradual.

2
Chapter 1 – Budget Summary
Metro will begin FY2021 in the stabilization phase which assumes continued focus on social distancing and other preventive measures to control the spread of Covid-19. The continuation of these measures is expected to continue greatly reducing Metro’s ridership and farebox revenues.
The FY2021 operating revenue budget assumes managed re-entry will begin in quarter two (Q2) and gradually increase ridership on the system. The recovery phase, in which Metro begins to return to normal service and ridership levels, is not anticipated until quarter four (Q4) or spring 2021. As a result, operating revenue is anticipated to be $428.5 million less than in the FY2020 Budget.
Despite the anticipated impacts of Covid-19 to the new operating reality, Metro’s FY2021 Operating Budget continues to look toward the future and focus on services and initiatives that will support the region’s long term livability and economic growth.
Operating Budget The $2.1 billion approved operating budget for FY2021 is funded with $385.9 million of projected operating revenues, primarily from passenger fares, parking fees, and advertising revenues, $1.2 billion in jurisdictional operating subsidies and reimbursements, and $546.3 million in Coronavirus Aid, Relief, and Economic Security (CARES) Act funds.
The FY2021 Operating Budget includes the base budget, limited to three percent annual growth as mandated by dedicated funding legislation; costs exempt from this cap on annual subsidy growth; and the projected fiscal impacts of Covid-19 partially offset by additional management actions.
Nearly 67 percent of Metro’s total operating budget is personnel costs. In FY2021, labor costs are projected to increase by $56.9 million or 4.3 percent. This includes additional funding to support Metro’s safety and security goals for a safe riding experience for customers and funding of Silver Line Phase 2 operations. The FY2021 Budget supports 12,903 positions, funded under operating and capital.
Total non-personnel costs increase by $47.0 million, or 7.5 percent, driven primarily by cost escalations, including MetroAccess paratransit contracts and propulsion to deliver additional rail service, and costs for Silver Line Phase 2 implementation.
The Base Budget funds legacy commitments and mandates, such as contractually required wage and step increases for labor resulting from collective bargaining agreements (CBAs), and inflationary costs on non-personnel expenses while remaining within the cap on annual subsidy growth.
In recent years, Metro has reduced expenses and staffing levels to limit growth in operating subsidies. The FY2021
Budget will see a growth in operating positions driven by the opening of the Silver Line Phase II extension in Q4, as well as a growth in capital and janitorial positions, as Metro continues to focus on improving system safety, reliability and state of good repair.
In FY2018, Metro eliminated 800 positions, a six percent reduction in total budgeted headcount, by cutting non-essential positions and adjusting bus and rail services. Over the past three years, Metro has reduced the operating budget by $186 million. To meet the 3 percent cap with this budget, Metro identified $13 million in subsidy savings through revenue initiatives and enhanced contract management. Further, in order to mitigate fiscal impacts of Covid-19, Metro has also saved an additional $45 million through management actions and the service recovery plan
On the revenue side, Metro’s primary FY2021 budget challenges will be recovery from the Covid-19 pandemic. In addition, Metro anticipates a continuation of previous year trends including declining bus ridership, increased fare evasion and continued low off-peak rail ridership.
New Customer Initiatives are part of the base budget and make transit more attractive and cost competitive with transportation alternatives during off-peak periods, weekends, and for single trips involving both the bus and rail systems. These initiatives add bus and rail service to shorten headways in high demand areas, lower rail fares on weekends, and decrease the cost of multi-modal trips. The budget includes the following new customer initiatives in FY2021 which will be implemented at the beginning of quarter three (Q3):
• Extend late-night Metrorail hours of operation to provide four more hours of service per week without jeopardizing needed maintenance hours. These hours are, Monday through Thursday 5:00 a.m. to midnight and to 2:00 a.m. on Fridays and from 7:00 a.m. to 2:00 a.m. on Saturdays
• Improved Sunday Metrorail service by operating Saturday headway schedules on Sundays
• Additional weekday service on high-demand MetroExtra routes
• Increased weekend service on Metrobus routes with strong ridership, focusing on routes with connections to rail stations
• $2.00 weekend flat fare on Metrorail
• Senior/Disabled fare of half the peak or off-peak fare depending on time of day instead of peak only
• Increased transfer discount between Metrorail and Metrobus systems from $0.50 to $1.00, which reduces the cost of intermodal trips and enables price sensitive riders with more transit options
• Price reduction of the 7-Day Regional Bus Pass from $15.00 to $12.00

Chapter 1 – Budget Summary
3
The budget does not increase Metrobus fares, the MetroAccess maximum fare, or prices on all Rail + Bus unlimited passes which remains valid for the same distance of travel.
In total, these customer initiatives increase operating subsidy by $29.7 million which is offset by restructuring or eliminating less productive bus service, eliminating bus service that becomes redundant with the extension of late-night Metrorail service, adjusting early morning rail headways before 6:00 a.m and increasing the following Metrorail fares:
• Raise base peak fare ten cents from $2.25 to $2.35
• Simplify the mileage tiers by charging a single per mile rate after mile three up to the max fare
• Increase the maximum peak fare from $6.00 to $6.50
Overall, these initiatives add new services, improve weekend and late-night services, and lower fares during off-peak periods in order to grow ridership.
Legislatively Excluded Costs are mandated costs Metro incurs that are excluded from the base budget and not subject to a mandated three percent annual growth limit. The FY2021 Budget includes $87.1 million of exclusions for:
• Compliance with expanded safety training certification and occupational health exam requirements
• Support for Americans with Disabilities Act (ADA) mandated paratransit services that exceed the base budget subsidy growth cap
• Silver Line Phase 2, operating costs for six new Metrorail stations and one rail yard facility.
Capital Budget The $1.8 billion FY2021 Capital Budget and $9.8 billion FY2021-2026 CIP focuses Metro's capital investment on
safety, state of good repair, and reliability of Metrorail, Metrobus, and MetroAccess assets.
The six-year CIP investment priorities include completion of the multi-year rebuilding of platforms at 20 outdoors stations that began in the summer of 2019, beginning the acquisition of new 8000-Series railcars, establishment of radio and wireless communications infrastructure, replacement of buses and paratransit vehicles, rehabilitation and maintenance of railcars and buses to improve and maintain service reliability and continued investment in Metrorail, Metrorail stations, and Metrobus system infrastructure to improve safety and address state of good repair backlogs.
Metro’s CIP is grouped into six major investment categories: Railcars, Rail Systems, Track & Structures, Stations & Passenger Facilities, Bus & Paratransit, and Business Support. These investment categories are further subdivided into 17 program areas.
Within these CIP categories and programs are four types of capital investments: Safety, State of Good Repair & Minor Projects; Major Active Capital Projects; Development & Evaluation; and Future Major Projects. Details can be found in Chapter 4.
The FY2021-2026 CIP assumes federal formula funding will continue at current levels, but federal PRIIA funding is not reauthorized past FY2021. The funding assumptions include continuation of the state and local portion of PRIIA funding, despite the expiration of the federal portion. The $9.8 billion capital program will require $10.3 billion of funding, due to an expected $143.2 million cost for revenue loss from service shutdowns for capital projects, and more than $390 million dedicated funding debt service for the capital program.
Of the total $10.3 billion in funding required over the six years, $8.2 billion will come in the form of state and local contributions, including dedicated funding, local match for federal grants, continuation of state PRIIA contributions, system performance funding, reimbursable project funding, and debt.

4
Chapter 1 – Budget Summary
FY2021 Sources of Funds Metro’s operating and capital budgets are funded through a variety of system generated, state, local and federal funding sources.
• State and local funding of $2.4 billion, consisting of:
$1.2 billion of jurisdictional operating contribution, which includes $1.2 billion of net operating subsidy, $72.2 million of debt service contributions and excludes a subsidy credit of $134.7 million
$1.3 billion in state/local funding for the capital program, consisting of these funding sources:
o $148.5 million in PRIIA grants
o $268.4 million in system performance funds, of which $17.0 million is expected to offset revenue loss from service shutdowns for the platform rehabilitation project
o $0.9 million in other state and local contributions
o $500.0 million of dedicated funding
o $342.2 million of dedicated funding debt proceeds
• Metrorail, Metrobus, and MetroAccess revenue funding of $385.9 million includes:
Passenger fares and parking fees of $301.4 million
Other revenue totaling $84.5 million, including business revenues of $58.8 million (advertising, joint development, and fiber optics) and other sources of $25.6 million.
• Federal funding of $489.6 million consists of $148.5 million in PRIIA funding and $341.1 million in Federal Transit Administration (FTA) formula grants and other federal grants, including Congestion Mitigation and Air Quality (CMAQ) funds.
• Reimbursable project funding consisting of $7.8 million for operating and $88.7 million in jurisdictional requested capital projects, including $26.6 million from the Metropolitan Washington Airports Authority (MWAA) for the Silver Line extension and $59.1 million from the City of Alexandria for the new Potomac Yards Station

Chapter 1 – Budget Summary
5
Please note: the chart and table totals throughout this publication may not add up due to rounding.
Summary of Funds by Source
FY2020 FY2021 Variance to FY2020
(Dollars in Millions) Budget Budget $ Change % Change
Operating Budget Passenger Fares & Parking $723.1 $301.4 ($421.7) (58.3%) State and Local Funds 1,125.5 1,111.6 (13.9) (1.2%) Business Revenues 54.7 58.8 4.1 7.5% Reimbursable Funds 9.0 7.8 (1.3) (13.9%) CARES Act - 546.3 546.3 - Other Sources 36.5 25.6 (10.9) (29.8%)
Subtotal $1,948.9 $2,051.5 $102.7 5.3%
Contributions for Debt Service $72.1 $72.2 $0.1 0.1% Subtotal Including Debt Service $2,021.0 $2,123.7 $102.7 5.1%
Capital Budget Federal Formula/Other Grants $361.0 $341.1 ($19.9) (5.5%) Federal Dedicated Funds (PRIIA) 148.5 148.5 - - State and Local Funds 410.0 417.8 7.8 1.9% Dedicated Funding/Debt Utilization 500.0 500.0 - - Reimbursable Funds 58.0 88.7 30.7 52.9% Debt Strategy/Other Debt1 285.0 342.2 57.2 20.1%
Subtotal $1,762.5 $1,838.2 $75.7 4.3%
Grand Total2 $3,783.5 $3,961.9 $178.4 4.7% 1. Debt service schedule updated to reflect actuals after FY20 Dedicated Funding Debt issuance. 2. WMATA Compact requires Metro to have a balanced budget (i.e. projected funding equals planned expense). See Appendix A for additional discussion.

6
Chapter 1 – Budget Summary
Ridership and Revenue The FY2021 revenue budget is greatly impacted by the Covid-19 pandemic and includes $546.3 million in CARES Act funds to offset the anticipated revenue losses and fund additional expenses incurred due to the Covid-19 pandemic.
The total FY2021 operating revenue budget, excluding CARES Act and other reimbursable projects, is $385.9 million. Passenger fares and parking fees of $301.4 million make up 78 percent of the total revenue budget.
Total ridership is projected at 150.6 million trips, 55 percent on rail, 44 percent on bus and the remainder on MetroAccess. Non-passenger business revenues from advertising, joint development and fiber optic leases are budgeted at $58.8 million while other non-transit revenues total $25.6 million.
Passenger and parking revenues are $421.7 million less than FY2020 Budget. Non-passenger revenues are expected to be $6.8 million lower.
Ridership
Metrorail Unlike previous years in which Metro modeled ridership growth based on past year trends, ridership forecasts in FY2021 are uncertain due to the impacts of the Covid-19 pandemic and rely heavily on the recovery plan. Metrorail anticipates 83.1 million total riders in FY2021 which represents a 51 percent reduction over FY2020 Budget ridership levels. As the region continues to recover from the pandemic, Metro anticipates Metrorail ridership may begin to return to historic levels in spring 2021. As such, the FY2021 Budget continues with projects that will position Metro to deliver safe and reliable rail service into the future.
Metro plans to open Silver Line Phase 2 in spring 2021. The addition of Silver Line Phase 2 will add six new stations in Virginia; three stations in Fairfax County and three stations in Loudoun County. The six stations are expected to generate $5.2 million in revenue in FY2021.
After several years of decline, rail ridership stabilized at 175.3 million trips in FY2019 with customers responding positively to better on-time performance that has reduced crowding at stations, more evenly spaced trains, and improved service reliability.
The Platform Improvement Project is a multi-year campaign to rebuild platforms at 20 of Metro’s 45 outdoor stations. While disruptive to customers, Metro is closing stations to complete platform reconstruction in fewer days
compared to running single-tracking service for longer periods through stations undergoing platform repairs. These station improvement projects are essential to the maintenance and rehabilitation of the system to ensure riders’ long-term safety.
Ridership by Service
FY2018 FY2019 FY2020 FY2021 Variance to FY2020
(Trips in Thousands) Actual Actual Budget Budget Change % Change
Metrorail 175,817 175,255 170,157 83,102 (87,055) (51.2%) Metrobus1 119,681 124,854 128,343 66,284 (62,060) (48.4%) MetroAccess 2,331 2,348 2,350 1,253 (1,097) (46.7%)
Total Ridership2 297,829 302,457 300,850 150,639 (150,211) (49.9%)
1. Prior to FY2021 Budget, Metrobus ridership was reported based on farebox data.
2. Metrorail ridership is based on linked trips; Metrobus ridership is based on unlinked trips from automatic passenger counter (APC) data; MetroAccess ridership is based on total passengers. Unlinked trips are total boardings, while linked trips are total number of complete trips from origin to destination, including transfers.

Chapter 1 – Budget Summary
7
Though important for customer safety and service reliability, the Platform Improvement Project was expected to significantly impact ridership in spring and summer of 2020 because platform rebuilding at stations on the periphery of the rail system in Northern Virginia and Maryland. Due to the events associated with the Covid-19 pandemic, including stay-at-home orders, though, Metro utilized the time to further the Platform Project with less of an impact to ridership.
Though Metro’s ridership models do not project a net increase in rail ridership in FY2021, they do anticipate a long term positive ridership response to Metrorail improvement initiatives, including service enhancements, a weekend flat fare and $1.00 transfer credit, after factoring ridership losses from increasing peak rail fares.
Though Metro is taking steps to improve service delivery to ensure passengers see Metrorail as a reliable travel option, other external factors will impact future ridership growth.
These include:
• The number of residents and jobs in the “walk-shed” or within a half-mile walking distance from Metrorail stations.
• Metro is sensitive to the contraction of the federal government workforce since many agencies are located near stations. Local governments in the region are working to attract more private industry to reduce dependence on the Federal government for jobs.
• Metro’s joint development office, one of the most active in the transit industry, enters into ground leases or sells Metro properties adjacent to Metrorail stations to foster residential and commercial development, which show potential to increase passenger trips.
• Number of alternative modes of transportation, particularly ride-hailing. Use of these services have coincided with steep declines in weekend and off-peak ridership when these options are more attractive as Metro reduces service to address maintenance needs.
• Increased use of telecommuting and alternative work schedules results in lower ridership, particularly on Fridays and Mondays, compared to mid-week.
• Price of automobile gasoline influences customer transportation choices. Ridership modeling indicates increased public transit ridership when the gasoline price exceeds $3.00 per gallon. Gasoline prices averaged $2.78 per gallon in the Washington D.C. Metropolitan Area during summer 2019 and are not expected to increase dramatically in the near term.
• Price and availability of parking near a destination influences the decision to drive or ride Metrorail.

8
Chapter 1 – Budget Summary
Metrobus
The Federal Transit Administration (FTA) has approved Metro to report Metrobus ridership based on data collected using Automatic Passenger Counters (APCs), which the transit industry considers a more accurate means of recording ridership than data acquired through the farebox. Accordingly, starting with FY2020, bus ridership is reported using APC figures unless otherwise noted.
Though the ridership decline due to Covid-19 on Metrobus is not as significant as Metrorail, Metrobus ridership is forecasted at 66.3 million trips in FY2021, a decrease of 62.1 million trips, or 48.4 percent, from 128.3 million trips in the FY2020 budget.
Unrelated to the pandemic, Metrobus ridership has been declining since 2015. Metrobus ended FY2019 under budget forecasts by 4.0 million trips, or 3.6 percent. Ridership in FY2020 was even lower due to both the downward trend and significant impacts of the pandemic.
The long term declining Metrobus ridership trend has several contributing factors:
• Metrorail service disruptions appear to impact Metrobus ridership as intermodal transfers have decreased each year since FY2016.
• As is the case with rail, gasoline prices and alternative transportation options impact bus ridership. The continued low price of gasoline adversely affects customers use of Metrobus. Increased use of alternative transportation services, particularly ride-hailing, overlaps with multiple years of significant Metrobus ridership losses.
• Average bus speeds have steadily declined in recent years due to increased traffic congestion and roadwork, impacting the on-time performance and quality of service.
Metro forecasting models have shown the average speed of a bus significantly impacts a customer’s choice to ride. Unfortunately, worsening road congestion in the Washington D.C. Metropolitan Area has increased travel times for Metro buses operating without dedicated lanes.
To this end, Metro is a leading partner in the Washington Area Bus Transformation Project focused on making bus service in the region faster and more reliable. The project’s five goals seek to address the following areas:
• Increase regional connectivity and improve mobility;
• Enhance rider experience;
• Long term financial sustainability;
• Encourage sustainable communities; and
• Promote affordable and equitable systems.
Ridership remained strong in FY2020 on major corridors where continued investments are improving the customer experience. The popular limited-stop MetroExtra service continues to attract riders as customers seek improved travel times, while Route NH2, connecting Oxon Hill and National Harbor in Maryland with the Metrorail Stations in Alexandria, Virginia, continues to have strong ridership since service commenced in 2016.
Metrobus ridership gains in specific corridors reflect the value of bus service as an alternative transit option to Metrorail and driving when either is affected by capital projects. For example, ridership on MetroExtra Route G9 increased as it served as a link to and from Rhode Island Avenue station during that station’s closure. Ridership also remained strong where trips funded by a grant on routes 18J, 18P, and 21D were added to mitigate I-395 Express Lanes construction in Virginia.
In addition, adding unlimited Metrobus trips to the Monthly Unlimited Pass and other multi-day passes starting in FY2020 had a positive impact on bus ridership. In FY2021, Metro will continue to encourage riders to use passes by lowering the price of the 7-Day Bus Pass. Finally, under the Kids Ride Free program in partnership with Washington D.C., Metrobus transports nearly 30,000 student riders on average on weekdays.

Chapter 1 – Budget Summary
9
MetroAccess
Much like Metrorail and Metrobus, MetroAccess saw a decline in overall ridership following the pandemic. Metro anticipates the ridership will return gradually as the region moves toward recovery.
MetroAccess is projected to provide 1.3 million trips in FY2021, or 47 percent lower than FY2020 budget. Metro maintains ridership levels by shifting growing demand for paratransit services to alternative partnership programs in Maryland and Washington D.C.
Sixty-three percent of MetroAccess trips are provided in Montgomery and Prince George’s counties in Maryland, 23 percent in Washington D.C., and the remaining 14 percent of trips in the combined Virginia jurisdictions.
MetroAccess trip volumes are relatively low in Virginia due to a multitude of alternate service providers. Metro has managed growth in the other jurisdictions by shifting 230,000 eligible MetroAccess trips to taxicabs under the Washington D.C., TransportDC program and 139,000 trips to Maryland’s Abilities-Ride program in FY2019, equivalent to 16 percent of MetroAccess ridership
Passenger Revenue
In keeping with the Board’s policy of assessing fare changes on a biennial basis, Metro was slated to reassess fares in FY2020. The agency elected to hold fares steady in FY2020 to stimulate ridership.
Because, Metro’s operating subsidy growth is limited by a three percent legislative cap, for FY2021 the Metro Board of Directors approved changes to Metrorail peak fares and simplification of the mileage tiers to partially address the budget gap and fund customer initiatives to boost ridership.
Operating Revenue
FY2018 FY2019 FY2020 FY2021 Variance to FY2020
(Dollars in Millions) Actual Actual Budget² Budget² $ Change % Change
Metrorail $541.3 $533.5 $528.3 $249.1 ($279.2) (52.8%) Metrobus 138.1 124.0 137.9 27.7 (110.3) (79.9%) MetroAccess 9.7 8.8 9.9 4.6 (5.3) (53.6%) Parking 43.1 44.4 47.0 20.0 (26.9) (57.4%) Subtotal, Passenger Revenue $732.2 $710.7 $723.1 $301.4 ($421.7) (58.3%)
Non-Passenger Revenue¹ $54.8 $73.9 $91.3 $84.5 (6.8) (7.4%) Total Revenue2 $787.0 $784.6 $814.4 $385.9 ($428.5) (52.6%)
1. Other non-transportation revenue includes interest on investments, property disposal sales, vending machine sales, and miscellaneous revenues. 2. FY2020 and FY2021 include funding of $28.0 million and $17.0 million, respectively, from capital to compensate for service disruptions due to major capital projects.

10
Chapter 1 – Budget Summary
Metrorail
Metrorail passenger revenue is budgeted at $249.1 million for FY2021, a 52.8 percent decrease or $279.2 million lower than the FY2020 budget. This assumes a slow recovery of Metrorail ridership throughout FY2021 following a period of regional quarantine in late FY2020 and an anticipation that public health officials will continue to recommend social distancing in response to Covid-19. Metro will utilize CARES Act funds to replace this lost revenue.
The revenue also includes a net loss of $0.8 million from implementing the following fare changes at the beginning of Q3:
• Raise peak base fare $0.10 from $2.25 to $2.35.
• Simplify the mileage fare:
Charge $0.326 per mile after mile three during peak; customers currently pay $0.326 from miles three to six, and $0.288 per mile after mile six until reaching the maximum fare.
Charge $0.216 per mile after mile three during off-peak; this is a fare decrease as customers currently pay $0.244 from miles three to six.
• Raise maximum peak fare $0.50 from $6.00 to $6.50.
• Implement a $2.00 weekend flat fare. For trips on Saturday and Sunday, customers will pay up to $1.85, or 48 percent, less than current off-peak max fares.
• Increase transfer credit from $0.50 to $1.00. The credit is applied when transferring to regular Metrobus routes after a trip on Metrorail using the same SmarTrip® card within two hours of the initial boarding. It reduces fares by $1.00 on Metrorail, Metrobus Express, and Airport routes after transferring from Metrobus regular routes.
Metrorail service enhancements are expected to increase passenger revenue in total by $1.6 million through the following initiatives:
• Adding a half-hour of service each evening Monday through Thursday extending service until midnight, and adding an hour of service on Fridays and Saturdays extending service to 2:00 a.m.
• Operate Saturday headway schedules on Sundays to reduce headways from 15 to 12 minutes on all rail lines and from 8 to 6 minutes in the multi-line core.
• Widen headways for the first hour of service (5:00 a.m. to 6:00 a.m.) from 8 minutes to 12 minutes, which is a period with low ridership. This service adjustment enables a smoother transition for the start-up of revenue service from the overnight period, including track inspections and maintenance.
• Eliminate four “tripper” trains per day, which supplement the scheduled weekday service but are no longer needed due to recent service adjustments.
Silver Line Phase 2 is expected to open in Q4 of FY2021 with six additional rail stations and $5.2 million in revenue.
While ridership declines due to Covid-19 events have accelerated revenue losses, Metro’s budget includes a $14.0 million loss in rail fare revenue from closing stations for major capital improvement projects similar in scope to the shutdown south of the Ronald Reagan Washington National Airport station in the summer of 2019.
In addition to fares from customers, Metrorail revenue includes $9.0 million for the Kids Ride Free program. In partnership with the District Department of Transportation (DDOT), District of Columbia Public Schools (DCPS), and the District of Columbia Public Charter School Board, Metro is reimbursed for District K-12 students riding Metrorail and Metrobuses for free. Students can take unlimited trips on Metrorail and Metrobus using program specific SmarTrip cards.
Metrobus
Metrobus passenger revenue for the FY2021 Budget is $27.7 million, a 79.9 percent decrease or $110.3 million less than the $137.9 million in the FY2020 budget. This assumes a slow recovery of Metrobus ridership throughout FY2021 due to the pandemic. Additionally, the decrease factors in steep declines in farebox revenue in FY2019 from declining ridership, particularly full fare riders, significant growth in fare evasion, and customers shifting to passes.
This amount includes a net loss of $3.7 million in passenger revenue from the following fare changes:
• Reduce the 7-Day Regional Bus Pass from $15.00 to $12.00, which is the equivalent of traveling round trip for three days and having four days of free travel on regular routes.
• Increase the transfer credit between rail and bus from $0.50 to $1.00 as previously detailed.
Bus service changes are projected to further decrease passenger revenue by a net $0.8 million. The changes will increase bus efficiency while minimizing customer impact:
• Improve service on four MetroExtra routes by extending the hours and increasing frequency.
• Add weekend service on high ridership routes with a focus on those that serve rail stations.
• Reduce or eliminate service on routes where other transit service is available or there is low utilization.
• Restructure service to streamline routes which will increase efficiency and right-size service levels.

Chapter 1 – Budget Summary
11
MetroAccess
MetroAccess passenger revenue for FY2021 is $4.6 million, or $5.3 million less than in FY2020. Paratransit is expected to experience a slow recovery due to the pandemic. The budget also accounts for late trip credits issued to customers.
As the population continues to age, and disability rates continue to rise, the utilization of MetroAccess is expected to grow.
Parking
Total parking revenue for the FY2021 Budget is projected at $20.0 million, a $26.9 million decrease from the FY2020 budget, reflecting the anticipated slow return to full rail ridership levels.
In FY2021, all Metrorail stations scheduled to close for platform repairs have parking facilities. As a result, Metro is projecting a revenue loss of $3.0 million during the station closures.
The following parking programs initiated in recent fiscal years are expected to generate up to $3.0 million in additional revenue once ridership returns following the Covid-19 pandemic to help offset losses:
• Lowering daily fees at low-utilization garages to spur higher utilization and revenue;
• Assessing non-rider fees for special events such as festivals, concerts and other similar activities; and
• Increasing parking spaces leased to non-transit users, as well as permitting commercial uses of Metro parking facilities for a fee.
Passes
To make riding more affordable and encourage ridership, Metro offers customers monthly, weekly, three-day and daily passes that eliminate the need for daily fare calculations and reward high volume users with a reduced cost per trip.
All passes, except the 7-Day Regional Bus Pass, are “combo passes” that allow riders access to Metrorail and Metrobus service under a single pass product.
In accord with the GM/CEO’s FY2021 budget priority to make Metro affordable, the cost of combo passes will remain the same as FY2020, despite increased peak Metrorail fares in FY2021. This will make combo passes even more cost effective for frequent riders. Also, Metro will maintain the same travel distance on unlimited passes before a customer must pay the fare difference from stored value.
The following details each pass product:
• Monthly Unlimited Pass (formerly ‘SelectPass’): Customers select a price point based on the distance of their normal one-way commute trip, making this pass customizable to an individual’s travel needs.
Because the price of the pass will not increase with the fare changes this fiscal year, the monthly pass will be priced based on 36 trips (18 days) times the FY2020 fare for their one-way commute trip.
Any trip with a distance equal to or less than the normal commute trip is covered, and any longer trip requires payment of the fare difference from the stored value on the SmarTrip® card.
Customers will get even more savings with passes in FY2021. For example, customers purchasing the $144 monthly unlimited pass, priced at 36 trips times $4.00, will be able to take unlimited Metrorail trips up to 8.7 miles, whereas customers paying full fare will pay $4.20 per peak period trip. This is a five percent savings when using the monthly pass. For a monthly unlimited pass of $216, a customer gets unlimited travel on rail and bus, saving a minimum of $92 per month, or $1,104 annually, compared to a person paying max fare per peak period trip.
• 1-Day / 3-Day / 7-Day Unlimited Pass offer unlimited travel on rail and bus. The short duration is ideal for tourists and other visitors.
• 7-Day Short Trip Unlimited Pass offers unlimited rail trips under a fare value of $3.85 per trip and free bus trips. Similar to the monthly unlimited pass, customers pay the fare difference for longer trips from the stored value on their SmarTrip® card.
• 7-Day Regional Bus Pass: To encourage bus ridership, Metro is reducing the price of the 7-Day Regional Bus Pass from $15.00 to $12.00 in FY2021. The pass is priced to save customers money after the sixth weekly trip, the equivalent of three commuting days, with the remaining four days free.
• University Pass (U-Pass): Metro has agreements with 25 colleges and universities in the region to offer full-time students unlimited rides on Metrorail and Metrobus. Metro prices the service at $1.00 per student per day to offer students an affordable means of travel to classes, internships, jobs and other activities.

12
Chapter 1 – Budget Summary
Non-Passenger Revenue Advertising
Total advertising revenue in FY2021 is budgeted at $33.3 million, an $5.7 million increase over the FY2020 budget. This increase in primarily driven by $6.3 million in digital advertising revenue following the installation of more digital panels in stations.
Joint Development
Joint development revenues are estimated to reach $11.4 million, an increase of $0.4 million over FY2020. This growth is driven by increasing ground lease payments to reflect market value and Metro property sales. Generally, joint development revenue increases during periods of economic growth as ground leases increase in value and as areas walkable to Metrorail stations develop.
Fiber Optics
The Metro Fiber Optic Program, initiated in September 1986, allows for the installation, operation, and maintenance of fiber optic cables in Metro's right-of-way. Under these lease agreements, Metro receives revenue from telecommunications companies as well as fiber optic lines for its own use. For FY2021, the fiber optic revenue budget is $14.1 million.
Other Revenue
Other revenues total $25.6 million in FY2021 and include proceeds from agreements with cellular service providers, vending machine companies, surplus property disposal, and employee parking. It also includes Board approved funding of up to $17 million from the Capital program as reimbursement for revenue losses from station closures due to major capital projects. The reimbursement will be adjusted to reflect lower ridership due to Covid-19.

Chapter 1 – Budget Summary
13
Operating Budget Revenues
FY2018 FY2019 FY2020 FY2021
(Dollars in Thousands) Actual Actual Budget Budget $ Change
MetroBus Passenger $138,075 $124,011 $137,936 $27,683 ($110,253) Parking - - - - - Advertising 15,136 9,023 9,150 8,326 ($825) Joint Development - - - - - Fiber Optics - - - - - Other Nontransit Sources 3,194 3,043 6,064 2,584 ($3,480)
Subtotal $156,405 $136,078 $153,150 $38,593 ($114,558)
MetroRail Passenger $541,318 $533,518 $528,279 $249,085 ($279,193) Parking 43,064 44,376 46,968 20,031 ($26,937) Advertising 7,455 20,018 18,523 25,016 $6,493 Joint Development 9,252 14,865 11,062 11,423 $361 Fiber Optics 15,959 16,876 15,992 14,083 ($1,909) Other Nontransit Sources 3,630 10,123 30,464 23,046 ($7,418)
Subtotal $620,678 $639,777 $651,288 $342,683 ($308,605)
MetroAccess Passenger $9,700 $8,781 $9,940 $4,607 ($5,333) Parking - - - - - Advertising - - - - - Joint Development - - - - - Fiber Optics - - - - - Other Nontransit Sources 174 - - - -
Subtotal $9,874 $8,781 $9,940 $4,607 ($5,333)
Total Passenger $689,093 $666,310 $676,155 $281,376 ($394,779) Parking 43,064 44,376 46,968 20,031 ($26,937) Advertising 22,590 29,042 27,673 $33,342 $5,669 Joint Development 9,252 14,865 11,062 11,423 $361 Fiber Optics 15,959 16,876 15,992 14,083 ($1,909) Other Nontransit Sources 6,997 13,166 36,528 25,630 ($10,898)
Grand Total $786,956 $784,636 $814,378 $385,883 ($428,495)

14
Chapter 1 – Budget Summary
Operating Subsidy The FY2021 operating subsidy totals $1.2 billion, an increase of $120.8 million or 10.7 percent over the FY2020 Budget. The base budget increased by $33.8 million, equal to three percent annual growth of operating subsidies, which complies with the 2018 dedicated funding legislation.
The remaining growth of $87.1 million includes $78.4 million for the opening of Silver Line Phase 2 and $8.6 million in legislatively excluded costs consisting of contractually obligated cost increases to ADA paratransit service providers and occupational safety and health costs.
Jurisdiction contributions for debt service payments equal $72.2 million, like FY2020 levels. Additional information about debt service is included in Appendix - G of this publication.
For the FY2021 Budget, the Board authorized a one-time subsidy credit of $134.7 million to the funding jurisdictions to help offset local revenue loss due to Covid-19 bringing the effective FY2021 subsidy to $1.2 billion, including debt service.
FY2021 Approved Budget - Summary of State and Local Operating Requirements
(Dollars in Millions)
FY2020¹ Base
FY20212,3
Capped %
Change
FY2021 Legislative Exclusions
Silver Line
Phase 24
FY2021 Total
Subsidy Subsidy
Credit
FY2021 Net
Subsidy Debt
Service Jurisdictional Contribution
District of Columbia $407.8 $420.0 3.0% $2.1 $25.9 $448.0 ($48.8) $399.2 $33.3 $432.4
Montgomery County 189.1 190.4 0.7% 1.6 13.7 205.7 (22.1) 183.6 15.4 199.0 Prince George's County 242.6 254.3 4.8% 3.5 12.3 270.1 (29.6) 240.6 15.8 256.4
Maryland $431.7 $444.7 3.0% $5.1 $26.1 $475.9 ($51.7) $424.2 $31.2 $455.4
City of Alexandria 45.8 47.9 4.5% 0.1 3.7 51.7 (5.6) 46.1 1.8 47.9 Arlington County 78.2 79.0 1.1% 0.2 7.3 86.5 (9.2) 77.3 0.0 77.3 City of Fairfax 2.5 2.7 9.7% 0.0 0.2 3.0 (0.3) 2.7 0.1 2.8 Fairfax County 156.0 158.4 1.5% 1.1 12.7 172.3 (18.4) 153.9 5.6 159.5 City of Falls Church 3.4 3.3 (3.9%) 0.0 0.2 3.5 (0.4) 3.1 0.2 3.3 Loudoun County 0.0 3.2 100.0% 0.0 2.3 5.5 (0.4) 5.1 0.0 5.1
Virginia $286.0 $294.6 3.0% $1.4 $26.5 $322.5 ($34.2) $288.2 $7.7 $295.9
Total Contribution $1,125.5 $1,159.2 3.0% $8.6 $78.4 $1,246.3 ($134.7) $1,111.6 $72.2 $1,183.7
1. FY2020 approved base amount includes $1.19 million for the Fraternal Order of Police Collective Bargaining Agreement approved on September 26, 2019 in Board Resolution 2019-31.
2. FY2021 capped amounts are calculated by taking the FY2020 base allocations and adding three percent to each Signatory's (DC, MD and VA) allocation and then allocating the Signatory amounts by calculating each jurisdiction's percentage share of the applicable Signatory's amount using the Board-approved subsidy formulae, as described in Board Resolution 2019-09 (Appendix J). The FY2021 capped subsidy was adjusted to prorate Loudoun County for one quarter of Silver Line Operations. 3. Applicable costs for Metrobus Routes 16E, B29 and B30 are funded by management actions; The costs are not included in calculation of the subsidy allocation.
4. FY2021 Silver Line Phase 2 costs assume revenue operations start in Q4 of FY2021.

Chapter 1 – Budget Summary
15
FY2021-26 Capital Funding Metro’s six-year Capital Improvement Program (CIP) of $9.8 billion requires funding totaling $10.3 billion from the federal government, state and local government partners and other sources due to an expected $143.2 million cost for revenue loss from service shutdowns for capital projects and more than $390 million of debt service.
Within the $10.3 billion six-year funding plan, Metro is projecting:
• $2.1 billion from federal grant funding, with the assumption that federal PRIIA funding will not be extended past FY2021
• State and local contributions for matching of federal grants and system performance funds of $2.6 billion,
of which $143.2 million is expected to fund revenue losses from long-term service shutdowns due to major capital projects
• State dedicated funding of $3.0 billion, of which $261.3 million is projected to be used for debt service
• Debt, secured by dedicated funding, of $2.2 billion
• Other local sources, primarily Metropolitan Washington Airports Authority (MWAA) funding for the Silver Line extension and new rail cars, and the City of Alexandria for the new Potomac Yards station, totaling $333 million
Additional information about capital funding sources is included in Chapter 4 – FY2021 Capital Budget
Financial Plan by Investment Category
FY2021 FY2022 FY2023 FY2024 FY2025 FY2026 6-Year
(Dollars in Millions) Budget Plan Plan Plan Plan Plan Total
Railcar $279.8 $257.3 $332.8 $346.6 $454.1 $565.2 $2,235.7 Rail Systems 164.7 131.2 162.8 153.3 146.5 132.4 $890.8 Track and Structure Rehabilitation 148.1 175.7 166.4 192.9 160.9 170.1 $1,014.0 Stations and Passenger Facilities 545.5 550.6 416.2 252.0 191.9 179.2 $2,135.3 Bus and Paratransit 207.8 225.4 292.5 313.2 284.3 215.7 $1,538.9 Business Support 475.4 550.2 217.5 235.5 242.9 227.3 $1,948.8 Total $1,821.2 $1,890.3 $1,588.2 $1,493.4 $1,480.6 $1,489.8 $9,763.5
Revenue Loss from Capital Projects $17.0 $23.8 $24.5 $25.2 $26.0 $26.7 $143.2 Debt Service - Dedicated Funding1 - 11.8 42.6 87.7 117.9 138.1 $398.1 Total Capital Program Cost $1,838.2 $1,925.8 $1,655.3 $1,606.3 $1,624.5 $1,654.6 $10,304.8 1. FY2021 debt service schedule updated to reflect actuals after 2020 Dedicated Funding debt issuance. FY2022-2026 debt service schedule for planning purposes only.

16
Chapter 1 – Budget Summary
Financial Plan - Allocation of State and Local Contributions
FY2021 FY2022 FY2023 FY2024 FY2025 FY2026 6-Year
(Dollars in Millions) Budget Plan Plan Plan Plan Plan Total
Federal Funding Federal Formula Programs $321.1 $321.1 $321.1 $321.1 $321.1 $321.1 $1,926.6 Federal PRIIA 148.5 - - - - - $148.5 Other Federal Grants 20.0 4.4 2.8 3.0 2.8 2.8 $35.8
Total - Federal Grants $489.6 $325.5 $323.9 $324.1 $323.9 $323.9 $2,111.0
State and Local Funding Contributions: District of Columbia
Formula Match and System Performance $95.1 $99.2 $101.4 $105.2 $107.4 $108.8 $617.1 PRIIA 49.5 49.5 49.5 49.5 49.5 49.5 $297.0 Dedicated Funding Pay-Go 178.5 178.5 178.5 178.5 178.5 178.5 $1,071.0
Subtotal - District of Columbia $323.1 $327.2 $329.4 $333.2 $335.4 $336.8 $1,985.1
State of Maryland Montgomery County $45.0 $45.9 $47.6 $48.7 $50.5 $52.7 $290.4 Prince George's County 45.2 46.9 48.2 49.9 51.1 52.0 $293.2 Maryland PRIIA 49.5 49.5 49.5 49.5 49.5 49.5 $297.0 Maryland Dedicated Funding Pay-Go 167.0 167.0 167.0 167.0 167.0 167.0 $1,002.0
Subtotal - Maryland $306.7 $309.3 $312.2 $315.1 $318.1 $321.3 $1,882.6
Virginia City of Alexandria $12.4 $12.8 $13.1 $13.5 $13.9 $14.4 $80.2 Arlington County 22.6 23.0 23.9 24.4 25.4 26.6 $145.8 City of Fairfax 0.7 0.7 0.8 0.8 0.8 0.9 $4.6 Fairfax County 40.8 41.5 43.0 44.0 45.7 47.8 $262.8 City of Falls Church 0.8 0.8 0.8 0.8 0.9 0.9 $4.9 Loudoun County 5.8 5.6 6.0 6.0 6.4 7.1 $36.9 Virginia PRIIA 49.5 49.5 49.5 49.5 49.5 49.5 $297.0 Virginia Dedicated Funding Pay-Go 154.5 154.5 154.5 154.5 154.5 154.5 $927.0 Congestion Mitigation and Air Quality (CMAQ) 0.9 0.9 0.9 1.0 1.0 1.0 $5.7
Subtotal - Virginia $288.0 $289.3 $292.6 $294.5 $298.0 $302.6 $1,764.9
Jurisdictional Reimbursable
Jurisdiction Planning Projects $3.0 $3.0 $3.0 $3.0 $3.0 $3.0 $18.0 Silver Line - Metropolitan Washington Airports Authority (MWAA) 26.6 17.7 - - - - $44.3 Potomac Yard (Alexandria) 59.1 113.9 58.9 38.6 - - $270.4 Purple Line - Maryland Department of Transportation (MDOT) 0.1 0.2 - - - - $0.3
Subtotal - Jurisdictional Reimbursable $88.7 $134.8 $61.9 $41.6 $3.0 $3.0 $333.0 Total - State and Local $1,006.4 $1,060.7 $996.0 $984.3 $954.5 $963.6 $5,965.6
Debt $342.2 $539.6 $335.3 $298.0 $346.0 $367.0 $2,228.1
Grand Total Funding $1,838.2 $1,925.8 $1,655.3 $1,606.3 $1,624.5 $1,654.6 $10,304.8

Board of Directors
Board Corporate Secretary
General Manager / Chief Executive
Officer
Inspector General
Chapter 2 – Metro Officers 17
Chapter 2 - Metro Officers
Board Reporting Structure The Metro Board of Directors Bylaws designate three Metro officers as direct reports to the Board: the General Manager and Chief Executive Officer (GM/CEO), the Inspector General and the Board Corporate Secretary. The latter two officers are appointed by, and may be removed only by, the Metro Board of Directors and operate independently of the GM/CEO.
This chapter includes budget information for the departments that support the Board Corporate Secretary, Inspector General and GM/CEO. The Authority-wide operating figures in Chapter 3 include the costs of these three departments in order to present a complete budget for the Authority.
Please note: the chart and table totals throughout this publication may not add up due to rounding

Board CorporateSecretary
Assistant Board Board Secretary Program Manager
18
Chapter 2 – Metro Officers
Board Corporate Secretary
The Office of the Board Corporate Secretary (SECT) is an independent office that reports to the Metro Board of Directors. SECT serves as a resource to advance the Board’s goals and policies, and strategic plan.
SECT works with the Board to research policy issues and provide consultation, represents the Board in policy matters, and advises on governance best practices. SECT works proactively with management to carry out the policies, goals and initiatives of the Board; and serves as liaison between the Board, the Authority, Board advisory
bodies and customers. SECT is responsible for managing the Board’s activities across the Authority in support of executive decision-making.
Other responsibilities include the coordination, review and distribution of Metro Board materials; maintaining official records of Board actions and resolutions; publishing legal notices and arranging public hearings approved by the Board, as well as representing the Board on a variety of issues relating to stakeholder groups.
FY2018 FY2019 FY2020 FY2021 (Dollars in Thousands) Actual Actual Budget Budget $ Change % Change Personnel1 $781 $686 $704 $803 $99 14.0% Non-Personnel $161 $120 $199 $201 $2 1.2% Total2 $943 $806 $903 $1,004 $101 11.2% Authorized Positions3 4 4 4 4 - - 1. Personnel figures include the department's share of total fringe expenses. 2. Total operating budget cost for each fiscal year is based on Metro's organizational structure at the time of budget approval.
3. Authorized Positions include total positions funded under the operating and capital budgets, based on Metro's organizational structure at the time of budget approval.

Chapter 2 – Metro Officers
19
FY2021 Business Plan The Office of the Board Corporate Secretary will:
• Serve as the vital bridge between the Board, the public and management
• Support the Board to fulfill requirements of dedicated funding legislation
• Ensure Board materials and operations maintain a strategic focus
• Host a Board retreat to address strategic priorities
• Ensure the Board’s committee work plans align with the Board’s priorities
• Provide recommendations regarding Board initiatives and policies
• Ensure Compact requirements are met, along with Board directives, including the implementation of the Public Participation Plan
• Develop and lead Board orientation for new members when appointed
FY2020 Major Accomplishments Milestones reached over the last year included:
• Drafted and approved new Board Code of Ethics
• Implemented video streaming for Board and committee meetings
• Conducted first virtual Board/committee meetings and public hearings
• Revised Board Procedures
• Conducted a facilitated Board retreat to establish Board priorities for the year
• Drafted and implemented Board committee work plans
• Onboarded four new Board members
• Facilitated numerous public hearings in accordance with the Metro Compact and Public Participation Plan

InspectorGeneral
Deputy Inspector General Deputy Inspector
Counsel to the Deputy Inspector Inspections, General Inspector General General Audits Evaluations & Investigations
Special Projects
20
Chapter 2 – Metro Officers
Office of Inspector General
InspectorGeneral
Deputy Inspector General Audits
Deputy Inspector General
Inspections, Evaluations &
Special Projects
Deputy Inspector General
Investigations
Counsel to the Inspector General
The Office of Inspector General (OIG) is an independent office that reports to the Metro Board of Directors. Under the WMATA Compact the OIG is an independent and objective unit of the Authority that conducts and supervises audits, program evaluations, and investigations relating to Authority activities; promotes
economy, efficiency, and effectiveness in Authority activities; detects and prevents fraud and abuse in Authority activities; and keeps the Board fully and currently informed about deficiencies in Authority activities as well as the necessity for and progress of corrective action.
FY2018 FY2019 FY2020 FY2021
(Dollars in Thousands) Actual Actual Budget Budget $ Change % Change
Personnel1 $5,041 $6,037 $6,940 $7,807 $867 12.5% Non-Personnel $1,527 $1,630 $2,921 $2,676 ($245) (8.4%) Total2 $6,568 $7,667 $9,861 $10,484 $623 6.3%
Authorized Positions3 35 38 40 44 4 10.0% 1. Personnel figures include the department's share of total fringe expenses.
2. The total operating budget cost for each fiscal year is based on Metro's organizational structure at the time of budget approval.
3. Authorized positions include total positions funded under the operating and capital budgets, based on Metro's organizational structure at the time of budget approval.

Chapter 2 – Metro Officers
21
FY2021 Business Plan OIG’s Office of Investigations and Special Projects will:
• Conduct criminal investigations and refer them for prosecution.
• Handle and issue confidential reports of investigations involving fraud, waste, abuse, gross mismanagement, or any investigation of Authority activities deemed necessary or desirable by the Inspector General.
• Provide all oversight and administration of the OIG hotline.
• Oversee and administer Metro’s whistleblower/ retaliation program, as well as provide confidential and timely investigative reports to the Whistleblower Panel.
• Issue management alerts to the GM/CEO for issues with time sensitivity and those requiring management action.
• Provide fraud awareness training to Metro departments and offices.
• Initiate special projects and inspections that address concerns related to Metro’s operations.
• OIG’s Office of Audits will:
• Conduct risk-based performance audits and evaluations to promote economy, efficiency and effectiveness of Metro programs, operations, and activities.
• Perform reviews and analyses of contractor proposals to determine reasonableness of cost/ pricing information and compliance with the Buy America Act.
• Oversee the independent public accounting firm conducting Metro’s annual financial statement audit.
FY2020 Major Accomplishments Milestones reached over the last year included:
• Conducted the review, referral or subsequent investigation of over 334 complaints made to the OIG hotline.
• Issued three Reports of Investigation involving fraud, waste and abuse.
• Investigations into fraud, bribery and theft resulted in one criminal indictment and one arrest.
• Issued four Management Alerts and one Management Assistance Report that provided insight into issues of concern.
• Issued a Special Project Report on the status of the Silver Line.
• Issued an Evaluation on Inventory Practices.
• Provided internal controls and fraud awareness training to WMATA departments and offices, including New Employee Orientation.
• Issued eight performance and financial audit reports identifying $70.6 million of funds that could be used more efficiently by implementing recommended actions.
• Issued 50 contract audit reports that identified $10.7 million in possible savings.
• Oversaw WMATA’s annual independent financial statement audit.

General Manager /Chief Executive
Officer
Internal Strategy, Financial Internal Business Planning & Capital Delivery Operations Compliance Operations Program Mgmt.
External General Operations Safety Relations Counsel
22
Chapter 2 – Metro Officers
General Manager & Chief Executive Officer
The General Manager and Chief Executive Officer (GM/CEO) guides Metro’s strategic direction to ensure passenger and employee safety, increased service reliability, create and innovate efficient operations management approaches, enhance fiscal accountability, and regulatory compliance. In FY2021, the GM/CEO will continue to move the agency toward improvements in the safety and reliability of service on Metrorail and Metrobus
networks, as well as MetroAccess. Through the GM/CEO’s direction and leadership, the agency will focus its efforts on becoming the regional transportation provider of choice, as well as an employer of choice in the region. In addition, Metro’s CIP, which is critical to the long-term safety and reliability of the system, will strengthen its focus on strategy, development and project implementation.
FY2018 FY2019 FY2020 FY2021
(Dollars in Thousands) Actual Actual Budget Budget $ Change % Change
Personnel1 $930 $1,155 $1,140 $1,130 ($10) (0.9%) Non-Personnel ($39) $95 $640 $652 $12 1.9% Total2,3 $891 $1,250 $1,780 $1,782 $2 0.1%
Authorized Positions4 4 3 3 3 - - 1. Personnel figures include the department's share of total fringe expenses. 2. Total operating budget cost for each fiscal year is based on Metro's organizational structure at the time of budget approval.
3. FY2018 Non-Personnel cost is offset in the Office of General Counsel. 4. Authorized Positions include total positions funded under the operating and capital budgets, based on Metro's organizational structure at the time of budget approval.

Chapter 2 – Metro Officers
23
FY2021 Business Plan The GM/CEO’s business actions are designed to build a strong foundation for achieving best in class status among transit systems.
Major initiatives in the approved FY2021 budget include:
• Oversee the implementation of WMATA’s recovery pandemic plan to both restore service in support of the region’s recovery plans and ensure the safety and transition of WMATA’s own workforce
• Continuing to focus on improving safety and reliability of the rail system, including track and power upgrades, train control systems, advancing the 8000-Series railcar procurement, and escalator and elevator replacements/ rehabilitations
• Improving the speed and reliability of buses, including advancing transit signal priority with the jurisdictions, building new bus garages to create modern maintenance facilities, and advancing the procurement of Metrobus’ next generation vehicle
• Enhancing the customer experience through fare payment upgrades and full deployment of a new customer mobile app, continued rail station amenities and upgraded platforms, along with new bus shelters
• Making Metro the region’s “employer of choice” with enhancements such as the agency’s first paid parental leave policy, a new employee emergency fund, and renovated office facilities, including the development of a new a Metro headquarters building in Washington D.C. and new offices in Virginia and Maryland
FY2020 Major Accomplishments Milestones reached over the last year included:
• Working in close coordination with regional leaders, oversaw the successful activation of the agency’s
Pandemic Response Plan on January 29, 2020, which ensured the safety of WMATA’s workforce and customers, while offering reduced service that was vital to the region for essential travel
• Completed multi-year capital project that delivered 145 new escalators
• Completed Bus Transformation Study
• Opened Andrews Federal Center bus garage
• Broke ground at new L’Enfant Plaza and Alexandria headquarters and entered into agreement for New Carrollton headquarters site
• 90 percent of customers are getting to their destinations on time – fewer offloads and delays thanks to the new 7000-Series railcars and improved track conditions
• Successfully completed first phase of a Platform Improvement Project – critical safety repairs and customer improvements including non-slip tile, larger information displays, and station lighting improvements
• Ridership grew 6 percent through February over FY2019, pre-Covid-19
• Underground cell service now available in 80 percent of Metro tunnels. This project will be completed in late 2020 making free wifi available at all 91 stations
• Increased rush-hour service at 12 stations on the Red, Green and Yellow lines, cutting wait times in half for 100,000 daily trips
• Supported major regional events with extra service, including Washington Mystics and Nationals’ championship seasons
• Focused on sustainability to adopt more “green” practices that protect the environment and save money

24
Chapter 2 – Metro Officers
THIS PAGE INTENTIONALLY LEFT BLANK

Chapter 3 – Operating Budget
25
Chapter 3 - Operating Budget
Introduction The operating budget funds expenses associated with Metrobus, Metrorail, and MetroAccess operations. In total the operating budget is $2.0 billion, a 5.4 percent increase from the FY2020 budget. In addition, the reimbursable budget is $7.8 million.

26
Chapter 3 – Operating Budget
Sources of Funds Metro has three primary funding sources for the operating budget: passenger revenue including parking, non-fare revenue including advertising, and local subsidy. In FY2021, Metro will also utilize $546.3 million in CARES Act funds to cover additional expenses incurred and to replace passenger revenue lost during the Covid-19 pandemic.
• The largest source of operating funding is the net operating subsidy totaling $1.1 billion (excluding Debt Service), or 54.4 percent of total operating funds.
• The second largest source of funding is CARES Act funds of $546.3 million or 26.7 percent of operating funds.
• Passenger fare and parking revenues of $301.4 million (14.7 percent of total expenses) is the third largest source of funds.
• The remaining $84.5 million of operating revenue comes from advertising, joint development projects, fiber optic and property leases, and other revenues.
Please note that chart and table totals throughout this publication may not add due to rounding.

Chapter 3 – Operating Budget
27
FY2018-FY2021

28
Chapter 3 – Operating Budget
Uses of Funds
• Personnel expenses are the largest operating budget expense category at $1,368.0 million or 66.9 percent of total expenses, followed by Services at $397.9 million or 19.5 percent of total.
• Services budget consists primarily of expenses related to professional and technical services contract maintenance, and temporary labor services. The largest service expense is in support of paratransit, which is projected to be $162.9 million in FY2021.
• Materials and Supplies budget consist primarily of maintenance parts for buses and railcars, track and
structure maintenance, elevator and escalator, and general fleet repair for non-revenue vehicles.
• Metro’s energy budget (fuel, utilities and propulsion) consists of propulsion usage by the Metrorail system; diesel, CNG and gasoline for Metrobus, MetroAccess and non-revenue vehicles; and utilities (i.e. electricity, water, phone and refuse collection) at Metro facilities.
• Other expenses include casualty and liability insurance, leases, capital overhead allocation credit and miscellaneous costs.
FY2018-FY2021
• FY2021 operating personnel expenses, inclusive of labor, fringe benefits and capital overhead allocation, are $1.4 billion, an increase of $56.9 million or 4.3 percent over FY2020. This increase includes contractually required pay increases mandated by CBA agreements and Silver Line Phase 2 personnel costs. The personnel budget also reflects savings from management actions to decrease the fiscal impacts of the Covid-19 pandemic.
• FY2021 services budget is $397.9 million, an increase of $50.3 million, or 14.5 percent over FY2020. This increase is due largely to the start of
Silver Line Phase 2 operations and increased paratransit costs resulting from contract cost escalations for the service providers.
• Materials and supplies are $100.3 million, a decrease of $9.0 million or 8.2 percent from FY2020, which is the result of savings initiatives to optimize material usage.
• FY2021 energy costs are projected to increase by $6.5 million or 5.1 percent in comparison to the FY2020 budget primarily due to Silver Line Phase 2 opening and increased propulsion costs associated with 7000-Series railcar service.

Chapter 3 – Operating Budget
29
Operating Budget - Revenue and Expenses
FY2018 FY2019 FY2020 FY2021
(Dollars in Thousands) Actual Actual Budget Budget $ Change
Revenues: Passenger $689,093 $666,310 $676,155 $281,376 ($394,779) Parking 43,064 44,376 46,968 20,031 ($26,937) Advertising 22,590 29,042 27,673 33,342 $5,669 Joint Development 9,252 14,865 11,062 11,423 $361 Fiber Optics 15,959 16,876 15,992 14,083 ($1,909) Other Nontransit Sources 6,997 13,166 36,528 25,630 ($10,898)
Total Revenues $786,956 $784,636 $814,378 $385,883 ($428,495)
Expenses: Personnel $1,262,144 $1,242,333 $1,311,121 $1,368,019 $56,898 Services 269,733 325,743 347,598 397,912 $50,314 Materials & Supplies 103,493 120,333 109,316 100,317 ($8,999) Fuel (Gas / Diesel / CNG) 24,094 28,911 32,073 26,939 ($5,133) Utilities and Propulsion Power 83,381 88,578 89,133 100,793 $11,661 Casualty and Liability 33,865 44,860 33,880 32,260 ($1,620) Leases and Rental 7,818 9,298 10,036 11,036 $1,000 Miscellaneous 6,169 5,134 6,697 6,505 ($192)
Total Expenses $1,790,697 $1,865,190 $1,939,854 $2,043,783 $103,928
Gross Subsidy $1,003,740 $1,080,554 $1,125,476 $1,657,899 $532,423
CARES Act - - - ($546,315) ($546,315) Net Subsidy $1,003,740 $1,080,554 $1,125,476 $1,111,584 ($13,892)
Cost Recovery Ratio 43.9% 42.1% 42.0% 18.9%

30
Chapter 3 – Operating Budget
Operating Budget - Expenses
FY2021 FY2021 FY2021 FY2021
(Dollars in Thousands) Budget Metrobus Metrorail MetroAccess
Salaries $355,409 $98,855 $248,008 $8,546 Wages 519,558 234,935 283,261 1,363 Overtime 90,632 36,716 53,671 246 Total Salaries and Wages $965,600 $370,506 $584,940 $10,154
Fringes $467,367 $182,828 $279,710 $4,829
Fringe Health 185,563 72,153 111,484 1,926 Fringe Pension 171,873 68,313 101,774 1,785 Other Fringe Benefits 78,671 30,136 47,744 791 Workers Compensation 31,260 12,226 18,708 326
Capital Allocation ($64,947) ($19,244) ($44,424) ($1,279)
Total Personnel Cost $1,368,019 $534,090 $820,226 $13,704
Services $397,912 $70,342 $158,209 $169,361
Professional and Technical 77,612 20,370 52,745 4,497 Contract Maintenance 77,728 38,824 38,184 721 Paratransit 162,897 - - 162,897 Other 79,674 11,149 67,281 1,245
Materials and Supplies $100,317 $27,463 $72,092 $762
Parts 44,122 14,071 29,851 199 Other 56,195 13,391 42,240 563
Fuel (Gas / Diesel / CNG) $26,939 $17,553 $3,684 $5,702
Diesel Fuel 13,552 11,588 1,948 17 Gasoline 8,174 752 1,737 5,685 Clean Natural Gas 5,213 5,213 - -
Utilities and Propulsion $100,793 $11,645 $88,378 $770
Propulsion 55,704 - 55,704 - Electricity 31,803 8,837 22,383 583 Utilities - Other 13,287 2,808 10,291 187
Casualty and Liability $32,260 $8,786 $22,890 $584
Insurance 19,582 5,030 14,218 334 Claims 12,679 3,757 8,672 250
Leases $11,036 $2,657 $7,394 $985
Property 6,105 1,773 3,407 926 Equipment 4,931 884 3,987 60
Miscellaneous $6,505 $780 $5,589 $136
Business / Meeting / Subscriptions 1,550 445 1,066 39 Advertising 5,200 1,410 3,696 94 Reimbursements / Other (245) (1,075) 827 3
Total Non-Personnel Cost $675,763 $139,227 $358,236 $178,300
Total Cost $2,043,783 $673,317 $1,178,462 $192,004
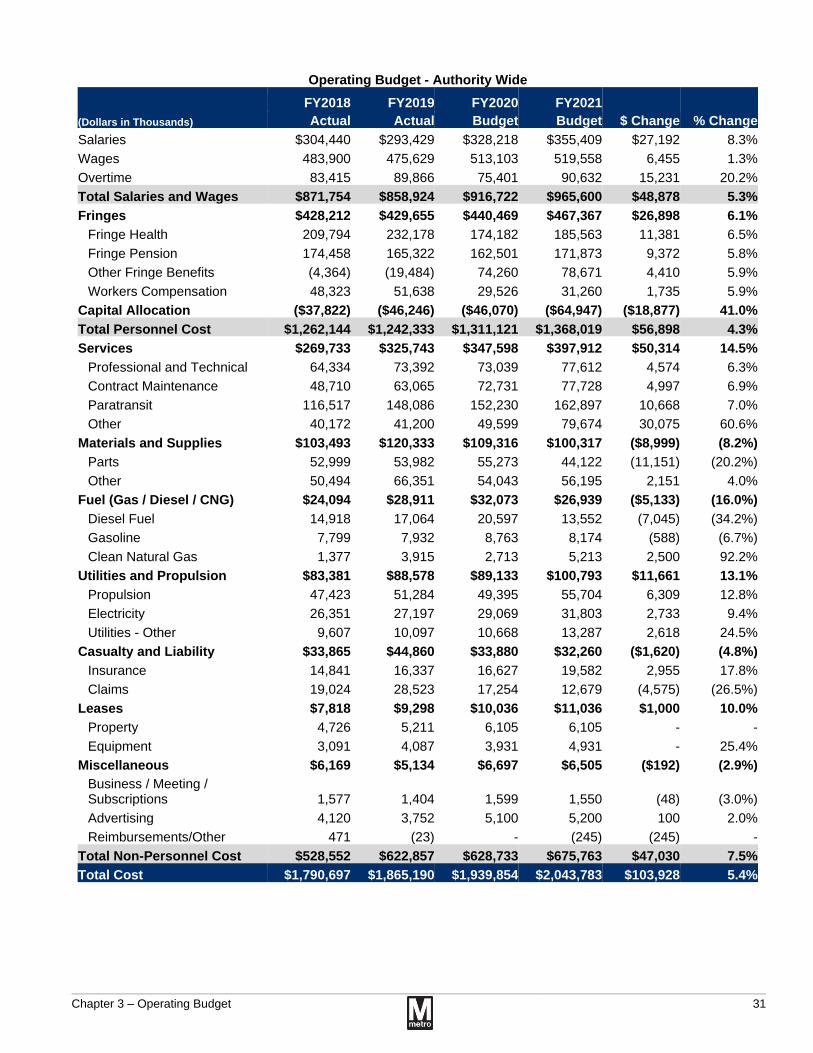
Chapter 3 – Operating Budget
31
Operating Budget - Authority Wide
FY2018 FY2019 FY2020 FY2021
(Dollars in Thousands) Actual Actual Budget Budget $ Change % Change
Salaries $304,440 $293,429 $328,218 $355,409 $27,192 8.3% Wages 483,900 475,629 513,103 519,558 6,455 1.3% Overtime 83,415 89,866 75,401 90,632 15,231 20.2% Total Salaries and Wages $871,754 $858,924 $916,722 $965,600 $48,878 5.3%
Fringes $428,212 $429,655 $440,469 $467,367 $26,898 6.1%
Fringe Health 209,794 232,178 174,182 185,563 11,381 6.5% Fringe Pension 174,458 165,322 162,501 171,873 9,372 5.8% Other Fringe Benefits (4,364) (19,484) 74,260 78,671 4,410 5.9% Workers Compensation 48,323 51,638 29,526 31,260 1,735 5.9%
Capital Allocation ($37,822) ($46,246) ($46,070) ($64,947) ($18,877) 41.0%
Total Personnel Cost $1,262,144 $1,242,333 $1,311,121 $1,368,019 $56,898 4.3%
Services $269,733 $325,743 $347,598 $397,912 $50,314 14.5%
Professional and Technical 64,334 73,392 73,039 77,612 4,574 6.3% Contract Maintenance 48,710 63,065 72,731 77,728 4,997 6.9% Paratransit 116,517 148,086 152,230 162,897 10,668 7.0% Other 40,172 41,200 49,599 79,674 30,075 60.6%
Materials and Supplies $103,493 $120,333 $109,316 $100,317 ($8,999) (8.2%)
Parts 52,999 53,982 55,273 44,122 (11,151) (20.2%) Other 50,494 66,351 54,043 56,195 2,151 4.0%
Fuel (Gas / Diesel / CNG) $24,094 $28,911 $32,073 $26,939 ($5,133) (16.0%)
Diesel Fuel 14,918 17,064 20,597 13,552 (7,045) (34.2%) Gasoline 7,799 7,932 8,763 8,174 (588) (6.7%) Clean Natural Gas 1,377 3,915 2,713 5,213 2,500 92.2%
Utilities and Propulsion $83,381 $88,578 $89,133 $100,793 $11,661 13.1%
Propulsion 47,423 51,284 49,395 55,704 6,309 12.8% Electricity 26,351 27,197 29,069 31,803 2,733 9.4% Utilities - Other 9,607 10,097 10,668 13,287 2,618 24.5%
Casualty and Liability $33,865 $44,860 $33,880 $32,260 ($1,620) (4.8%)
Insurance 14,841 16,337 16,627 19,582 2,955 17.8% Claims 19,024 28,523 17,254 12,679 (4,575) (26.5%)
Leases $7,818 $9,298 $10,036 $11,036 $1,000 10.0%
Property 4,726 5,211 6,105 6,105 - - Equipment 3,091 4,087 3,931 4,931 - 25.4%
Miscellaneous $6,169 $5,134 $6,697 $6,505 ($192) (2.9%)
Business / Meeting / Subscriptions 1,577 1,404 1,599 1,550 (48) (3.0%) Advertising 4,120 3,752 5,100 5,200 100 2.0% Reimbursements/Other 471 (23) - (245) (245) -
Total Non-Personnel Cost $528,552 $622,857 $628,733 $675,763 $47,030 7.5%
Total Cost $1,790,697 $1,865,190 $1,939,854 $2,043,783 $103,928 5.4%

32
Chapter 3 – Operating Budget
Operating Budget by Mode: Metrobus
Sources of Funds
• Metrobus sources of funds consist of revenue primarily from fares and advertising and subsidy from Metro’s jurisdictional partners. Subsidy is $484.5 million or 72.0 percent of the total funding need for Metrobus. In addition, CARES Act funding contributes $150.2 million or 22.3 percent of operating bus funds.
• Total Metrobus revenue in FY2021 is projected at $38.6 million. The largest revenue source is passenger revenues estimated at $27.7 million,
which includes fares and passes. Passenger revenue is expected to decline 79.9 percent from FY2020 to FY2021 primarily due to the ridership impact of Covid-19 and increased fare evasion.
• Metrobus is projected to receive advertising revenue of $8.3 million, remaining nearly flat when compared to FY2020 budget.
• Other Metrobus revenue, which includes interest, property disposals, and other miscellaneous revenue, is projected to total $2.6 million.

Chapter 3 – Operating Budget
33
Uses of Funds
• Personnel expenses are the largest portion of the Metrobus budget. For FY2021, personnel cost is estimated at $534.1 million or 79.4 percent of the Metrobus budget, which represents an increase of $12.2 million from the FY2020 budget. This increase is primarily due to collectively bargained wage increases and healthcare expenses.
• Services are budgeted at $70.3 million, which is $4.8 million more than the FY2020 budget due to contract cost escalation.
• Materials and Supplies are budgeted at $27.5 million, which is $4.0 million less than the FY2020 budget.
• Fuel costs, which include diesel, Clean Natural Gas (CNG) and gasoline, are budgeted at $17.6 million, a decrease of $6.4 million from FY2020.
• Utilities costs of $11.6 million decline $2.1 million versus the FY2020 budget.
• Other expenses total $12.2 million for FY2021, a decline of $1.1 million compared to the FY2020 budget.

34
Chapter 3 – Operating Budget
FY2018 - FY2021
• Personnel expenses declined by $3.6 million or 0.7 percent from FY2018 actuals to FY2019 and are projected to increase by $12.2 million or 2.3 percent from FY2020 budget to FY2021 due to collectively bargained wage increases partially offset by service modifications.
• Services increased by $2.2 million or 4.2 percent from FY2018 actuals to FY2019 and are projected to increase by $4.8 million or 7.3 percent from FY2020 budget to FY2021. The increase can be
attributed in part to outsourcing for additional bus cleaning as part of the service recovery plan.
• Materials and Supplies increased by $1.5 million or 3.5 percent from FY2018 actuals to FY2019 and are projected to decrease by $4.0 million or 12.8 percent from FY2020 budget to FY2021.
• Energy costs, inclusive of fuel and utilities, increased by $4.0 million or 16.2 percent from FY2018 actuals to FY2019 and are projected to decrease $8.5 million from FY2020 budget to FY2021.
Metrobus - Revenue and Expenses
FY2018 FY2019 FY2020 FY2021
(Dollars in Thousands) Actual Actual Budget Budget $ Change
Revenues: Passenger $138,075 $124,011 $137,936 $27,683 ($110,253) Parking - - - - - Advertising 15,136 9,023 9,150 8,326 ($825) Joint Development - - - - - Fiber Optics - - - - - Other Nontransit Sources 3,194 3,043 6,064 2,584 ($3,480)
Total Revenues $156,405 $136,078 $153,150 $38,593 ($114,558)
Expenses: Personnel $522,523 $518,929 $521,892 $534,090 $12,198 Services 52,086 54,285 65,553 70,342 $4,789 Materials & Supplies 42,843 44,364 31,490 27,463 ($4,027) Fuel (Gas / Diesel / CNG) 16,973 21,791 23,993 17,553 ($6,439) Utilities and Propulsion Power 7,795 6,987 13,746 11,645 ($2,101) Casuality and Liability 13,139 13,386 10,039 8,786 ($1,253) Leases and Rental 2,052 1,942 2,118 2,657 $539 Miscellaneous 769 791 1,151 780 ($371)
Total Expenses $658,181 $662,475 $669,982 $673,317 $3,335
Gross Subsidy $501,776 $526,398 $516,832 $634,724 $117,893
CARES Act - - - (150,248) ($150,248) Net Subsidy $501,776 $526,398 $516,832 $484,476 ($32,355)
Cost Recovery Ratio 31.2% 25.9% 29.6% 6.1%

Chapter 3 – Operating Budget
35
Metrobus - Operating Budget
FY2018 FY2019 FY2020 FY2021 (Dollars in Thousands) Actual Actual Budget Budget $ Change % Change
Salaries $100,133 $88,865 $96,784 $98,855 $2,071 2.1% Wages 228,171 230,399 232,915 234,935 2,020 0.9% Overtime 38,122 40,859 32,112 36,716 4,604 14.3% Total Salaries and Wages $366,426 $360,123 $361,811 $370,506 $8,694 2.4%
Fringes $173,407 $176,467 $172,880 $182,828 $9,949 5.8%
Fringe Health 87,377 94,217 66,466 72,153 5,688 8.6% Fringe Pension 72,693 67,262 65,551 68,313 2,762 4.2% Other Fringe Benefits (5,809) (5,451) 29,603 30,136 533 1.8% Workers Compensation 19,146 20,439 11,261 12,226 965 8.6%
Capital Allocation ($17,310) ($17,660) ($12,799) ($19,244) ($6,444) 50.4%
Total Personnel Cost $522,523 $518,929 $521,892 $534,090 $12,198 2.3%
Services $52,086 $54,285 $65,553 $70,342 $4,789 7.3%
Professional and Technical 19,264 16,468 16,148 20,370 4,222 26.1% Contract Maintenance 21,037 28,283 39,399 38,824 (575) (1.5%) Paratransit - 11 - - - - Other 11,785 9,523 10,007 11,149 1,142 11.4%
Materials and Supplies $42,843 $44,364 $31,490 $27,463 ($4,027) (12.8%)
Parts 23,175 21,832 12,018 14,071 2,054 17.1% Other 19,669 22,532 19,473 13,391 (6,081) (31.2%)
Fuel (Gas / Diesel / CNG) $16,973 $21,791 $23,993 $17,553 ($6,439) (26.8%)
Diesel Fuel 14,907 17,060 19,849 11,588 (8,261) (41.6%) Gasoline 689 816 1,431 752 (679) (47.4%) Clean Natural Gas 1,377 3,915 2,713 5,213 2,500 92.2%
Utilities and Propulsion $7,795 $6,987 $13,746 $11,645 ($2,101) (15.3%)
Propulsion - - - - - - Electricity 3,964 3,513 10,497 8,837 (1,659) (15.8%) Utilities - Other 3,831 3,474 3,249 2,808 (441) (13.6%)
Casualty and Liability $13,139 $13,386 $10,039 $8,786 ($1,253) (12.5%)
Insurance 5,758 4,875 4,926 5,030 103 2.1% Claims 7,381 8,511 5,112 3,757 (1,356) (26.5%)
Leases $2,052 $1,942 $2,118 $2,657 $539 25.4%
Property 973 746 1,199 1,773 574 47.9% Equipment 1,080 1,195 919 884 (35) (3.8%)
Miscellaneous $769 $791 $1,151 $780 ($371) (32.2%)
Business / Meeting / Subscriptions 552 358 402 445 42 10.6% Advertising 1,599 1,120 1,408 1,410 3 0.2% Reimbursements / Other (1,382) (687) (659) (1,075) (416) 63.1%
Total Non-Personnel Cost $135,658 $143,546 $148,090 $139,227 ($8,863) (6.0%)
Total Cost $658,181 $662,475 $669,982 $673,317 $3,335 0.5%

36
Chapter 3 – Operating Budget
Operating Budget by Mode: Metrorail
Sources of Funds
• Metrorail sources of funds consist of revenue primarily from passenger fares and parking fees, as well as advertising and lease revenues and subsidy from Metro’s jurisdictional partners. Subsidy is $464.7 million or 39.4 percent of the rail funding need. In addition, CARES Act funding contributes $371.0 million.
• Total Metrorail revenue in FY2021 is projected at $342.7 million. Passenger revenues, including fares and passes, are projected at $249.1 million. Passenger revenue is expected to decline 52.8 percent from FY2020 to FY2021 due to the ridership impact of Covid-19. Prior to the pandemic, rail passenger revenues were projected to increase due to a rebound in ridership related to improved reliability, expanded fare products, customer
service initiatives and a partial restoration of late-night hours.
• Parking revenue at Metrorail facilities will contribute $20.0 million in revenue. This is a 57.4 percent decrease from FY2020 to FY2021 due the impact of Covid-19 and planned capital projects.
• Advertising revenue applied to Metrorail is projected to generate $25.0 million in FY2021. This is $6.5 million more than the FY2020 budget and is attributable to sales in the new in-station digital advertising program.
• Other revenue, which includes joint development, fiber optics, and credits from the Capital Improvement Program to compensate for anticipated passenger and parking revenue losses resulting from scheduled track and platform work, is projected to contribute $48.6 million in FY2021.

Chapter 3 – Operating Budget
37
Uses of Funds
• Personnel expenses are the largest portion of the FY2021 Metrorail budget. Personnel costs are estimated at $820.2 million, or 69.6 percent of total Metrorail expenses, which represents an increase of $40.1 million from the FY2020 budget. Expenses increase primarily due to the addition of costs to support Silver Line Phase 2 operations, as well as obligated annual wage increases and growth in pension costs.
• Services are budgeted at $158.2 million, which is $34.4 million more than the FY2020 budget due to Silver Line Phase 2 costs, facility cleaning costs related to Covid-19, and contract cost escalations.
• Materials and Supplies are budgeted at $72.1 million, which is $4.5 million lower than the FY2020 budget.
• Fuel costs are budgeted at $3.7 million, or $1.1 million higher than the FY2020 budget.
• Utilities and Propulsion expenses of $88.4 million are $13.7 million higher than the FY2020 budget due to Silver line operations, the extra power requirements of the 7000-Series railcar fleet, and new service changes.
• Other expenses consisting of Casualty and Liability insurance, lease and miscellaneous expenses total $35.9 million, which is nearly flat compared to the FY2020 budget.

38
Chapter 3 – Operating Budget
FY2018 - FY2021
• Personnel expenses decreased by $15.3 million or 2.1 percent from FY2018 actuals to FY2019 actuals and are projected to increase $40.1 million or 5.1 percent from the FY2020 budget to FY2021 budget.
• Services increased from FY2018 actuals to FY2019 actuals by $22.3 million or 23.1 percent due to outsourcing and are projected to increase by $34.4
million or 27.8 percent from FY2020 budget to FY2021 budget.
• Materials and Supplies increased $15.0 million from FY2018 actuals to FY2019 actuals and are projected to decrease $4.5 million or 5.8 percent from FY2020 budget to FY2021 budget.
• Utilities and Propulsion are projected to increase $13.7 million or 18.3 percent in FY2021.
Metrorail
FY2018 FY2019 FY2020 FY2021
(Dollars in Thousands) Actual Actual Budget Budget $ Change
Revenues: Passenger $541,318 $533,518 $528,279 $249,085 ($279,193) Parking 43,064 44,376 46,968 20,031 ($26,937) Advertising 7,455 20,018 18,523 25,016 $6,493 Joint Development 9,252 14,865 11,062 11,423 $361 Fiber Optics 15,959 16,876 15,992 14,083 ($1,909) Other Nontransit Sources 3,630 10,123 30,464 23,046 ($7,418)
Total Revenues $620,678 $639,777 $651,288 $342,683 ($308,605)
Expenses: Personnel $731,453 $716,117 $780,096 $820,226 $40,130 Services 96,345 118,621 123,768 158,209 $34,441 Materials & Supplies 60,098 75,129 76,555 72,092 ($4,464) Fuel (Gas / Diesel / CNG) 1,253 1,380 2,610 3,684 $1,074 Utilities and Propulsion Power 75,056 81,061 74,676 88,378 $13,703 Casuality and Liability 20,082 30,675 23,174 22,890 ($284) Leases and Rental 5,085 7,229 6,937 7,394 $456 Miscellaneous 5,290 4,238 5,411 5,589 $177
Total Expenses $994,661 $1,034,450 $1,093,228 $1,178,462 $85,234
Gross Subsidy $373,983 $394,673 $441,940 $835,779 $393,838
CARES Act - - - (371,034) ($371,034) Net Subsidy $373,983 $394,673 $441,940 $464,745 $22,804
Cost Recovery Ratio 62.4% 61.8% 59.6% 29.1%

Chapter 3 – Operating Budget
39
Operating Budget - Metrorail
FY2018 FY2019 FY2020 FY2021 (Dollars in Thousands) Actual Actual Budget Budget $ Change % Change
Salaries $198,695 $199,350 $225,220 $248,008 $22,789 10.1% Wages 255,511 245,015 279,315 283,261 3,946 1.4% Overtime 45,268 48,980 43,270 53,671 10,401 24.0% Total Salaries and Wages $499,474 $493,346 $547,804 $584,940 $37,135 6.8%
Fringes $251,599 $250,493 $264,272 $279,710 $15,437 5.8%
Fringe Health 119,218 130,479 106,384 111,484 5,100 4.8% Fringe Pension 100,624 97,054 95,714 101,774 6,060 6.3% Other Fringe Benefits 1,575 (7,861) 44,135 47,744 3,609 8.2% Workers Compensation 28,403 30,821 18,040 18,708 669 3.7%
Capital Allocation ($19,620) ($27,722) ($31,981) ($44,424) ($12,443) 38.9%
Total Personnel Cost $731,453 $716,117 $780,096 $820,226 $40,130 5.1%
Services $96,345 $118,621 $123,768 $158,209 $34,441 27.8%
Professional and Technical 41,811 54,557 52,791 52,745 (46) (0.1%) Contract Maintenance 27,199 33,380 32,260 38,184 5,924 18.4% Paratransit - 25 - - - - Other 27,335 30,659 38,718 67,281 28,563 73.8%
Materials & Supplies $60,098 $75,129 $76,555 $72,092 ($4,464) (5.8%)
Parts 29,815 32,127 42,796 29,851 (12,944) (30.2%) Other 30,283 43,002 33,760 42,240 8,481 25.1%
Fuel (Gas/Diesel/CNG) $1,253 $1,380 $2,610 $3,684 $1,074 41.2%
Diesel Fuel 11 4 748 1,948 1,200 160.3% Gasoline 1,242 1,376 1,862 1,737 (125) (6.7%) Clean Natural Gas - - - - - -
Utilities & Propulsion $75,056 $81,061 $74,676 $88,378 $13,703 18.3%
Propulsion 47,423 51,284 49,395 55,704 6,309 12.8% Electricity 21,994 23,285 18,053 22,383 4,330 24.0% Utilities - Other 5,639 6,492 7,228 10,291 3,064 42.4%
Casualty & Liability $20,082 $30,675 $23,174 $22,890 ($284) (1.2%)
Insurance 8,801 11,171 11,373 14,218 2,845 25.0% Claims 11,281 19,504 11,802 8,672 (3,129) (26.5%)
Leases $5,085 $7,229 $6,937 $7,394 $456 6.6%
Property 3,117 4,392 3,980 3,407 (573) (14.4%) Equipment 1,968 2,837 2,957 3,987 1,030 34.8%
Miscellaneous $5,290 $4,238 $5,411 $5,589 $177 3.3%
Business/Meeting/Subscriptions 994 1,020 1,157 1,066 (91) (7.9%) Advertising 2,443 2,566 3,599 3,696 97 2.7% Reimbursements/Other 1,853 652 655 827 172 26.2%
Total Non-Personnel Cost $263,208 $318,333 $313,132 $358,236 $45,104 14.4%
Total Cost $994,661 $1,034,450 $1,093,228 $1,178,462 $85,234 7.8%

40
Chapter 3 – Operating Budget
Operating Budget by Mode: MetroAccess
Sources of Funds
• MetroAccess sources of funds include passenger revenue and net subsidy from Metro’s jurisdictional partners. MetroAccess passenger revenues are projected at $4.6 million and cover 2.4 percent of Metro’s paratransit costs; jurisdictional subsidies of $162.4 million and $25.0 million in funds from the CARES Act support the remaining 97.6 percent.
• MetroAccess passenger revenues are expected to decline 53.6 percent when compared to FY2020 budget due to the application of late trip credits.

Chapter 3 – Operating Budget
41
Uses of Funds
• Personnel costs are budgeted at $13.7 million, which is a $4.6 million increase in comparison to the FY2020 budget. This is primarily due to application of multi-modal overhead costs.
• Services are budgeted at $169.4 million and represent an increase of $11.1 million in
comparison to the FY2020 budget. This is primarily due to cost escalation in paratransit contract rates. Contracts to provide Paratransit service account for 84.8 percent of the total MetroAccess budget. Other contract spending brings total Services costs to 88.2 percent of total Access expenses.

42
Chapter 3 – Operating Budget
FY2018 - FY2021
• Services expense increased by $31.5 million or 26.0 percent from FY2018 to FY2019 and are projected to increase by $11.1 million or 7.0 percent from FY2020 budget to FY2021.
• Energy costs, consisting of fuel and utilities, are projected to increase by $0.3 million or 4.7 percent from FY2020 to FY2021. The increase is primarily due to inflation in gasoline price.
Revenue and Expenses - MetroAccess
FY2018 FY2019 FY2020 FY2021
(Dollars in Thousands) Actual Actual Budget Budget $ Change
Revenues: Passenger $9,700 $8,781 $9,940 $4,607 ($5,333) Parking - - - - - Advertising - - - - - Joint Development - - - - - Fiber Optics - - - - - Other Nontransit Sources 174 - - - -
Total Revenues $9,874 $8,781 $9,940 $4,607 ($5,333)
Expenses: Personnel $8,169 $7,287 $9,134 $13,704 $4,570 Services 121,302 152,838 158,277 169,361 $11,084 Materials & Supplies 552 839 1,270 762 ($508) Fuel (Gas/Diesel/CNG) 5,868 5,740 5,470 5,702 $232 Utilities & Propulsion Power 531 530 711 770 $59 Casuality and Liability 643 799 667 584 ($83) Leases & Rental 681 128 981 985 $5 Miscellaneous 110 105 134 136 $1
Total Expenses $137,855 $168,265 $176,644 $192,004 $15,360
Gross Subsidy $127,981 $159,484 $166,704 $187,396 $20,692
CARES Act - - - (25,034) ($25,034) Net Subsidy $127,981 $159,484 $166,704 $162,363 ($4,341)
Cost Recovery Ratio 7.2% 5.2% 5.6% 2.4%

Chapter 3 – Operating Budget
43
Operating Budget - MetroAccess
FY2018 FY2019 FY2020 FY2021 $ %
(Dollars in Thousands) Actual Actual Budget Budget Change Change
Salaries $5,612 $5,214 $6,214 $8,546 $2,332 37.5% Wages 218 215 873 1,363 489 56.0% Overtime 24 26 19 246 227 1203.9% Total Salaries and Wages $5,854 $5,456 $7,106 $10,154 $3,048 42.9%
Fringes $3,206 $2,696 $3,317 $4,829 $1,512 45.6%
Fringe Health 1,420 1,368 1,333 1,926 593 44.5% Fringe Pension 1,142 1,007 1,236 1,785 549 44.4% Other Fringe Benefits (129) (58) 523 791 268 51.2% Workers Compensation 774 379 225 326 101 44.8%
Capital Allocation ($892) ($865) ($1,290) ($1,279) $10 (0.8%)
Total Personnel Cost $8,169 $7,287 $9,134 $13,704 $4,570 50.0%
Services $121,302 $152,838 $158,277 $169,361 $11,084 7.0%
Professional and Technical 3,259 2,367 4,100 4,497 397 9.7% Contract Maintenance 475 1,402 1,072 721 (351) (32.8%) Paratransit 116,517 148,050 152,230 162,897 10,668 7.0% Other 1,052 1,018 875 1,245 370 42.4%
Materials & Supplies $552 $839 $1,270 $762 ($508) (40.0%)
Parts 10 23 459 199 (260) (56.6%) Other 542 816 811 563 (248) (30.6%)
Fuel (Gas/Diesel/CNG) $5,868 $5,740 $5,470 $5,702 $232 4.2%
Diesel Fuel - - - 17 17 - Gasoline 5,868 5,740 5,470 5,685 215 3.9% Clean Natural Gas - - - - - -
Utilities & Propulsion $531 $530 $711 $770 $59 8.3%
Propulsion - - - - - - Electricity 393 399 520 583 63 12.1% Utilities - Other 138 131 191 187 (4) (2.1%)
Casualty & Liability $643 $799 $667 $584 ($83) (12.5%)
Insurance 282 291 328 334 7 2.1% Claims 361 508 340 250 (90) (26.5%)
Leases $681 $128 $981 $985 $5 0.5%
Property 637 73 926 926 (1) (0.1%) Equipment 44 55 54 60 5 10.0%
Miscellaneous $110 $105 $134 $136 $1 1.0%
Business/Meeting/Subscriptions 31 26 39 39 1 1.7% Advertising 78 67 94 94 - 0.2% Reimbursements/Other - 12 2 3 - 23.4%
Total Non-Personnel Cost $129,686 $160,978 $167,511 $178,300 $10,790 6.4%
Total Cost $137,855 $168,265 $176,644 $192,004 $15,360 8.7%

44
Chapter 3 – Operating Budget
Reimbursable Budget Reimbursable projects are those unique services, programs and projects for which separate funding is provided by a jurisdiction or third-party entity. Metro is reimbursed on a dollar-for-dollar basis to provide the arranged services.
DC Circulator The DC Circulator, is a District Department of Transportation (DDOT) service. In FY2019 and prior, this service was operated by a WMATA contractor and funded by a reimbursable project agreement between DDOT and WMATA. Beginning October 2018, operations, management and oversight of the DC Circulator have been provided solely by DDOT.
Safety and Security Grants Metro receives several security grants through the Transit Security Grant Program (TSGP) and National Explosive Detection Canine Team Program (NEDCTP) under the Department of Homeland Security (DHS).
The grants provide funding for capital and operational security activities. The funding enhances the ability of the Metropolitan Transit Police Department (MTPD) to detect and deter potential attacks of terrorism through increased visibility, unpredictable presence, security assessments, and employee/public awareness. As Federal appropriations become available, Metro continues to pursue new funding to further enhance security activities.
Joint Development and Adjacent Construction Projects Metro’s Office of Joint Development and Adjacent Construction (JDAC) reviews and approves construction activities for projects adjacent to
Metrorail and Metrobus property, facilities, and operational right of way to ensure that:
• Metro facilities and operations are not damaged or affected during and after the project construction
• JDAC expenditures are reimbursed by the requesting private entity or jurisdiction. JDAC performs the following activities for the entities:
• Provides internal Authority departmental coordination with project’s owner/developer/ contractor (ODC) including external agencies, jurisdictions, property owners, consultants, developers, utilities and/ or anyone who has an impact on Metro property, facilities and/or operations
• Prepares project agreements in conjunction with Real Estate and Station Area Planning and General Counsel
• Provides coordination/oversight for all aspects of a project including design, safety, operations, constructability, assuring compliance with Metro standards, monitoring/coordinating construction activities and acceptance of on-site installations and facilities
• Provides oversight and acceptance for Joint Development and Jurisdictional Reimbursable projects that will ultimately be owned and operated by Metro
Funding Sources for Reimbusable Projects
FY2019 FY2020 FY2021
Budget Budget Budget $ Change
State & Local Funding1 DC Circulator $21,132 - - -
Federal Grant Funding Safety and Security Grants $4,174 $5,714 $3,106 ($2,608)
Other Sources of Funding DC Circulator - Passenger Fare Revenue $2,868 - - - Neutral Host Agreement $1,422 $1,184 $684 ($500) Joint Development and Adjacent Construction Projects $1,972 $2,124 $3,977 $1,853
Total $31,568 $9,022 $7,766 ($1,256)
1. Local Funding equals expenditures less passenger revenue.

Chapter 3 – Operating Budget
45
Neutral Host The Authority issues master license contract agreements with telecommunications providers to design, build, operate, and maintain a wireless communication infrastructure throughout Metro’s underground stations and tunnels. The agreements for neutral host projects are at no cost to Metro and enable wireless cellular phone and data services throughout the underground infrastructure. Metro seeks to provide an open, comprehensive wireless communication infrastructure, in order to achieve the following objectives:
• Establish reliable, seamless wireless communications coverage in all of Metro’s 47 underground stations and 50.5 miles of tunnels
• Improve the safety, security, and information opportunities for Metro riders
• Maximize the revenue to Metro with minimal operational complexity and impact to transit operations
• Leverage the economic value of Metro’s facilities, infrastructure, ridership, and presence within the Washington metropolitan area
• Allow Metro to use wireless communications for its operational and administrative needs

Gen
eral
Man
ager
I C
hief
Exe
cutiv
e O
ffice
r
Inte
rnal
Bu
sine
ss
Ope
ratio
ns
Fina
ncia
l O
pera
tions
Stra
tegy
, Pl
anni
ng &
Pr
ogra
m M
gmt,
Inte
rnal
C
ompl
ianc
e C
apita
l Del
iver
y
Exte
rnal
R
elat
ions
O
pera
tions
Sa
fety
G
ener
al
Cou
nsel
orga
niza
tion
char
t
46 Chapter 3 – Operating Budget

External Relations
Customer Service, Government Communications & Relations Marketing
Chapter 3 – Operating Budget
47
External Relations
The Department of External Relations (EXRL) is responsible for building and maintaining strong relationships with Metro’s stakeholders, partners, and customers to include regional elected officials, business, community groups, and the Board of Directors. Key priorities include:
• Work with jurisdictions and Congress to ensure needed operating and capital funding support
• Engage stakeholders in support of Metro’s business goals and objectives, as well as coordinate with federal agencies and safety oversight organizations
• Improve customer experience and public confidence through customer surveys, media relations, and marketing channels
2018 2019 2020 2021 (Dollars in Thousands) Actual Actual Budget Budget $ Change % Change
Personnel $9,622 $9,710 $10,941 $11,334 $393 3.6% Non-Personnel $6,578 $7,273 $8,965 $9,057 $92 1.0% Total Cost $16,201 $16,983 $19,906 $20,391 $485 2.4%
Authorized Positions 115 112 112 111 (1) (0.9%)

48
Chapter 3 – Operating Budget
Key Performance Indicators
Actual Actual Target Target
Performance Indicator 2018 2019 2020 2021
Renew partner funding commitments Renew federal dedicated funding commitment
Obtained PRIIA $150M
appropriation
Obtained PRIIA $150M
appropriation
Seek $150M appropriation and
funding reauthorization; Obtain funding
needed to cover Covid-19 operating
costs
Seek $150M appropriation and
funding reauthorization; Obtain funding
needed to cover Covid-19 operating
costs
Ensure jurisdictional funding to meet budget requirements
DC Mayor and VA and MD
Governors signed 1st time dedicated
capital funding
Obtain commitment to
fund FY2020 Budget
Obtain commitment to fund
FY2021 Budget
Obtain commitment to fund
FY2022 Budget
Continual customer satisfaction increases
Rail Customer Satisfaction1 73% 79% Maintain or Increase Maintain or Increase Bus Customer Satisfaction1 72% 76% Maintain or Increase Maintain or Increase Call Center Customer Satisfaction1 86% 84% Maintain or Increase Maintain or Increase Outreach and communications efficacy
Anti-Harassment PSA Campaign Awareness2
47% n/a 51% (March 2020) Maintain or Increase
Rush Hour Promise (RHP) Campaign Awareness3
63% (June 2018) 62% (November 2019)
Maintain or Increase Maintain or Increase
Customer Awareness of Major Planned Capital Work4
RD 85% to 93%;
BL/YL 70% to 96%
Maintain or Increase Maintain or Increase
1. Calendar Year averages 2. 2018 and 2020 data are taken from the 2018 and 2020 Sexual Harassment surveys 3. From SmarTrip sample surveys
4. Change in awareness measures among registered SmarTrip® users from samples taken several weeks/months before the shutdowns to samples taken a week before the shutdowns. "RD" refers to actual responses among registered SmarTrip® users at affected stations prior to July-September 2018 Red Line Shutdown. "BL/YL" refers to actual responses among registered SmarTrip® users at affected stations prior to May-September 2019 Blue/Yellow Line Platforms Project.

Chapter 3 – Operating Budget
49
FY2021 Business Plan In FY2021, External Relations will continue to integrate the efforts of several functional areas to further develop and enhance its comprehensive program to strengthen Metro’s brand. Key enhancements include:
• Continue the communication and outreach program in support of WMATA’s Pandemic Recovery Program, and advocate for local and federal funding necessary to continue services
• Lead customer communication, jurisdiction collaboration and stakeholder involvement in support of the expanded capital program
• Continuing to build trust and confidence among key stakeholders to invest in Metro while highlighting Metro’s progress (ridership retention and growth, promote fiscal stewardship, build internal morale and improve safety)
• Implement a strategy, in collaboration with the Regional Congressional delegation, business, regional and elected leaders, in support of the reauthorization of the Passenger Rail Investment and Improvement Act
• Maintain a productive Board-management relationship to achieve business goals and ensure effective policymaking
• Provide strategic leadership metrics in support of public relations, community relations and government relations Authority objectives
• Communicate leadership objectives to build a sustainable business model that meets the mandated subsidy cap, improves service delivery and enhances employee pride
• Engage employees in delivering business objectives and improve pride in Metro
• Increase non-fare revenue through expanded digital advertising, new commercial and retail opportunities, and special event cost recovery
FY2020 Major Accomplishments
• Implemented an integrated communications and outreach program that kept employees, customers and stakeholders informed of Covid-19 safety measures and rail and bus services
• Obtained federal CARES Act funding that enabled Metro to provide essential service during the pandemic, as well as continue employment of its workforce during the economic crisis
• Implemented a communications and outreach program to raise awareness among customers and stakeholders about the Platform Improvement Program south of National Airport, which resulted in a ridership rebound consistent with systemwide improvement trends
• Contributed to a resurgence of customer confidence of 20 points (measured by a third party) through customer communications, outreach and stakeholder engagement programs based on transparency, candor and a focus on Metro improvements
• Developed and conducted successful communications and marketing programs that supported ridership growth, despite a federal shutdown and closure of six stations for the platform program
• Obtained PRIIA annual funding and gained the introduction of reauthorization legislation in both the U.S. House and Senate
• Produced and hosted 1,200 managers at the annual meeting focused on promoting a deeper understanding of historic diversity and current regional gentrification trends and impact
• Implemented Metro’s authority-wide second day of service, Fill-A-Bus, which delivered 11,340 pounds of employee donated non-perishable food to the Capital Area Food Bank
• Supported the successful Board leadership and member transition, with responsiveness, meeting preparation and proactive work by management team

Internal Business Operations
Occupational Fair Human Information Labor Procurement Health &Practice Resources Technology Relations Wellness
50
Chapter 3 – Operating Budget
Internal Business Operations
The Department of Internal Business Operations (IBOP) consists of six business functions that play integral roles in supporting all operating components of Metro: Human Resources, Information Technology, Labor Relations, Occupational Health and Wellness (OHAW), Procurement, and Fair Practices.
IBOP provides administrative, technical and operational solutions to all Metro departments and offices. IBOP implements and supports information management solutions, provides acquisition services, manages unionized employment matters, provides clinical services (drug screening, sleep apnea, etc.) to employees and prospective employees, as well as health and wellness
offerings to current employees to ensure compliance with Title I of the Americans with Disabilities Act (ADA).
IBOP also sources and supports the selection of highly qualified talent, provides employee performance management programs, employee development and training opportunities, and promotes an engaged, diverse and inclusive organization free from discrimination. The department is focused on business innovation through organizational transformation and integrating strategic priorities across functions with the goal of establishing a culture of high performance at all levels of the organization.
2018 2019 2020 2021 (Dollars in Thousands) Actual Actual Budget Budget $ Change % Change
Personnel $57,672 $59,117 $63,360 $61,226 ($2,134) (3.4%) Non-Personnel $54,703 $60,016 $53,338 $66,874 $13,536 25.4% Total Cost $112,375 $119,133 $116,698 $128,100 $11,402 9.8%
Authorized Positions 542 542 583 616 33 5.7%
Key Performance Indicators
Actual Actual Target Target
Performance Indicator 2018 2019 2020 2021
Overall vacancy rate 7.0% 6.4% 6.0% 6.0% Attrition rate N/A 7.5% 15.0% 10.0%

Chapter 3 – Operating Budget
51
FY2021 Business Plan
• Lead Metro's Talent (People) Strategy as an integral part of Metro's Strategic Business Planning process. This initiative aims to prepare Metro to fulfill their objectives by conducting workforce planning that identifies knowledge, skills and competencies required of the workforce of the future
• Expand metrics and measures reporting to enable data driven decision making across the IBOP enterprise. Integrate measures and metrics across WMATA where IBOP directly supports a key metric tracked outside of IBOP
• In compliance with Federal Regulations, implement a re-engineered business process supported by technology such as an electronic health record (EHR) to track patients (employees), coordinate their care and status, and provide information to stakeholders (COO, Labor, etc.) which promotes operational efficiency
• Provide leadership, direction and policy guidance that promotes equal employment opportunities
• Institute information technology innovations, automation capabilities, and system software to deliver significant enterprise efficiencies such as SmartBenefits, Accessible Trip Planning, technology solutions for Silver Line Phase 2, and Enterprise Data Management
• Increase transparency into the procurement process through technology. Develop enterprise wide contracts to maximize economies of scale through strategic sourcing. Strengthen training programs for internal and external customers related to procurement business processes. Develop training programs for DBE and Small business to encourage participation in the Authority’s contracts
• Continue to conduct outreach events to enhance partnerships with the vendor community
• Improve data protection and management: ensuring intellectual property, personally identifiable information (PII), and other sensitive information is properly stored, classified and managed
FY2020 Major Accomplishments
• Cybersecurity risk management, developed the foundation documents for the risk management framework, including control baselines, assessment and authorization workflow, minimum security control standards, and roles and responsibilities. Future action will include gaining organizational approval of the RMF baselines and standards
• Cybersecurity Operations- implemented a 24x7 Security Operations Center Managed Service Provider for monitoring Tier 1 and Tier 2 security incidents
• Deployed 542 (approximately 25 percent) new smart/diagnostic ETS phones
• Replaced existing copiers with new multi-function printers, increasing service and security and saving Metro an average of $1.0 million per year
• Migrated Metroweb to the Cloud and activated IT activated multi-factor authentication (MFA) for all Metro accounts. MFA, also known as two-step verification, is an extra layer of security to further protect Metro’s information systems and data. It is used when accessing Microsoft cloud applications such as Outlook, Metroweb, and OneDrive from outside of Metro's network
• Implemented changes to healthcare programs resulting in projected savings of $9.1 million
• Worked with cross-functional team to revamp the sourcing, recruitment, and development of Bus Operators (the first 12 months of a Bus Operator); including implementation of assessment tools and enhanced hiring strategies
• Improved security of access to JGB by working with MTPD, IT and other stakeholders to enhance Prowatch and PeopleSoft integration that provides a view to verify employee status
• Enhanced processes to improve tracking of required licenses and certifications of employees required to perform their jobs
• Collaborated with CSCM and other stakeholders to update and roll out internal customer service training for the workforce
• Implemented and deployed Phases I and II of a new ePerformance tool and Phase I of new eCompensation tool
• Improved service to the non-represented, Local 2 and MTPD workforce by outsourcing benefits administration to a vendor with improved access to information and extended hours of availability to employees
• Developed plans to rollout Employee Opinion Survey results and support leaders in action planning
• Assessed High-Potential (Hi-Po) Pilot Program in COO and expanded across the organization
• Multiple successful wellness campaigns to include, flu vaccinations, breast cancer awareness and fitness programs
• Implemented and upgraded EAP program management software

52
Chapter 3 – Operating Budget
• Met and exceeded FTA 50 percent random testing requirement and successfully completed FTA Drug & Alcohol audit
• Metro received recognition by Victory Media as a Military Friendly Employer for the fifth consecutive year, having earned their Gold Status Top Ten Employers and Employer Support of the Guard and Reserve Award; Hispanic Network Magazine’s Best of the Best Award; and Latina Style Magazine’s Top 50 Best Companies Designation for Latinas in the U.S
• Finalized collective bargaining agreements for FOP, Local 639, Local 922 and Local 689
• Implemented the embedded strategy to increase labor relations presence in the field to work its client groups to provide guidance and increased dispute resolutions
• Implemented the Grievance Management System (GMS), the investigative and electronic monitoring and reporting program developed to track grievances and identify trends from all collective bargaining units
• Collaborated with Office of Procurement to develop and implement tool to prevent safety sensitive contracts from being awarded without proper review by Drug and Alcohol Compliance
• Significant increase in investigation and resolution of grievances and arbitrations. Grievance resolution timely reporting increased from six percent to 61 percent and rising. Arbitration resolutions from 12 percent to 14 percent and rising
• Received the Achievement of Excellence in Procurement Award – the National Procurement Institute
• Received Corporation of the Year Award – Capital Region Minority Supplier Development Council
• Sponsored Metro Procurement Fair – 314 regional small and disadvantaged business attendees
• Trained over 200 prime contractors and DBE subcontractors on Mandatory Prompt Payment Reporting
• In FY2020 sourced more than 6,100 purchase orders totaling $1.8 billion

FinancialOperations
Office of Office of Office of Office of RealManagement Accounting Treasury Estate & Parking& Budget
Chapter 3 – Operating Budget
53
Financial Operations
Financial Operations
Office of Management
& Budget
Office of Treasury
Office ofAccounting
Office of Real Estate & Parking
The Department of Financial Operations plans, allocates, manages and invests the Authority’s financial resources, policies and priorities to ensure fiscal integrity and alignment with Metro’s overarching vision to move the region forward by connecting communities and improving mobility for our customers.
Financial Operations facilitates fiscal responsibility and sound investment of funds through active management, rigorous monitoring and timely, transparent reporting.
The Office of Management and Budget (OMB) is responsible for the development and formulation of the
annual operating budget, long-range financial planning and revenue management. The Office of Accounting (ACCT) manages payroll operations, accounts payable, accounts receivable and financial reporting. The Office of the Treasurer (TRES) is responsible for risk management, revenue collection, liquidity management, corporate investments, and debt management as well as fare media sales and distribution. The Office of Real Estate and Parking (LAND) optimizes Metro’s real estate and parking portfolio.
2018 2019 2020 2021 (Dollars in Thousands) Actual Actual Budget Budget $ Change % Change
Personnel $25,190 $22,954 $23,280 $24,313 $1,033 4.4% Non-Personnel $72,255 $102,514 $54,248 $50,789 ($3,458) (6.4%) Total Cost $97,445 $125,468 $77,528 $75,102 ($2,426) (3.1%)
Authorized Positions 252 248 253 244 (9) (3.6%)
Key Performance Indicators
Actual Actual Target Target
Performance Indicator 2018 2019 2020 2021
Maintain Credit Rating AA- AA- AA AA Timely issuance of annual financial statements on-time on-time on-time on-time Balance Budget 2% 0% 0%+ 0%+

54
Chapter 3 – Operating Budget
FY2021 Business Plan The Department of Financial Operations will continue to lead corporate efforts to strengthen the organization’s fiscal accountability, including identifying non-fare revenue opportunities, capital investments, and initiatives focused on enhancing the customer experience. These efforts improve customer service through effective and efficient resource allocation and utilization; thereby maintaining safe, reliable and affordable transit services
Key areas of focus will include:
• Robust budget management, and enhanced reporting on the allocation and results of investments and budget performance
• A suite of modern systems to support customers in all phases of their journey across the region and across multiple transit systems, from trip planning to payment
• Improvements to the customer experience while enhancing service through simplified fares, more attractive passes, a wider array of retail locations for loading SmarTrip cards and implementation of mobile applications such as the ParkMobile reservation application
• Assistance on customer service advancements, cost recovery and technologies such as Transit Signal Prioritization (TSP) and continuation of our partnership with jurisdictions and other transportation service providers to enhance Metro’s support for regional mobility..
FY2020 Major Accomplishments
• Board approved a debt management policy based on industry best practices to guide the use of debt for financing Metro’s capital plan
• Board approved $1.6 billion debt Issuance, to be repaid with $500 million of additional guaranteed annual funding from jurisdictional partners, to support capital program needs
• WMATA sold its inaugural Dedicated Revenue Bonds, Series 2020A, generating over $7.7 million in savings for the region over the life of the bonds
• Initiated construction of three new buildings for Metro staff in the District of Columbia, Maryland and Virginia as part of Office Consolidation initiative
• Negotiated and executed a 99-year ground lease at Metro’s current headquarters (the Jackson Graham Building) for a mixed-use commercial development
• Developed and announced plans for a new “town center” development around New Carrollton Metrorail station including Metro’s new Maryland office building
• Clean audit opinion on Metro’s FY2019 Financial Statements for the fifth straight year and an unmodified opinion on Metro’s FY2019 Single Audit for the fourth straight year.

Internal Compliance
Quality Assurance, Management SpecialInternal Compliance Audits, Risk & Projects & Oversight Compliance
Chapter 3 – Operating Budget
55
Internal Compliance
The Office of Internal Compliance (INCP) is an internal management function, reporting to the General Manager. Committed to driving improvement Authority-wide, INCP ensures departments are fulfilling business objectives, addressing corrective actions and complying with federal, state and local requirements and recommendations by deploying planned oversight and compliance activities.
Through its Offices of Quality Assurance, Internal Compliance and Oversight (QICO), Management Audits, Risk & Compliance (MARC), and Special Projects Office (SPEC), INCP performs internal reviews, audits and compliance assessments, and coordinates their related corrective action plans (CAPs). The department’s activities comprise a key component of Metro’s safety, risk and quality assurance frameworks, promoting improved safety, better business practices and greater service reliability across the organization.
• QICO provides unbiased internal reviews and quality assurance assessments of service delivery, engineering & maintenance, capital program management and safety, and security functions
• QICO coordinates and oversees the closure of corrective/preventive actions that address regulatory safety recommendations and required actions. QICO also manages Metro’s Policy Instruction Manual and leads the development and implementation of Metro’s Quality Management System Plan (QMSP)
• MARC is Metro's Internal Audit function and provides objective internal auditing and advisory services to Metro’s management that add value and enable change for strong organizational governance, internal controls and effective risk management. MARC is also responsible for facilitating enterprise risk management (ERM) across the organization and facilitates organizational wide training on internal controls, risk management and compliance
• Special Projects Office (SPEC) leads and manages special and strategic projects at the direction of the General Manager/CEO and other senior management
2018 2019 2020 2021 (Dollars in Thousands) Actual Actual Budget Budget $ Change % Change
Personnel $5,745 $6,057 $6,509 $6,228 ($281) (4.3%) Non-Personnel $7,381 $8,126 $4,956 $7,568 $2,612 52.7% Total Cost $13,126 $14,183 $11,465 $13,796 $2,331 20.3%
Authorized Positions 60 64 64 74 10 15.6%

56
Chapter 3 – Operating Budget
FY2021 Business Plan
• Conduct quality assurance internal reviews and risk-based assessments of service delivery, engineering, maintenance and capital programs inclusive of safety-oriented internal business functions
• Conduct internal audits and special purpose reviews and assessments in line with the risk-based annual audit plan. Expand scope to include Program & Vendor Oversight Audits, to provide reasonable assurance over capital programs and related projects and vendor and contract compliance
• Implement the QMSP and ERM frameworks to ensure quality standards are met and risk is managed consistently and effectively
• Collaborate with departments and offices to strengthen internal controls, identify key business process areas for improvement, and improve data integrity to mitigate and close corrective/preventive actions in response to federal oversight inquiries and external auditors
• Improve processes and tools for the central tracking and monitoring of corrective action plans
• Support the implementation of the Safety Risk Management component of Metro’s Public Transit Agency Safety Plan (PTASP) - a Federal Transit Administration (FTA) requirement for all Rail Transit Agencies under 49 CFR 673
• Represent Metro at strategy, policy, finance, jurisdiction/stakeholder meetings related to Silver Line Phase 2
• Coordinate with executive management and senior staff to ensure appropriate consideration to timelines and keep the GM/CEO informed of any major issues including items for the monthly stakeholder/CEO meetings
• Actively participate in Silver Line project meetings related to Phase 2 to ensure policy level issues related to implementation, acceptance, and start up are discussed and WMATA interests accurately conveyed. Provide assistance and coordination as requested by OIG in their review of ongoing/emerging issues with Silver Line Phase 2
• Continue to assist the two counties, as requested, on matters related to coordination with Metro on parking and access facilities at proposed Phase 2 stations, including associated agreements
• Assist the local government stakeholders and provide internal coordination on land use proposals adjacent to Phase 1 and Phase 2 stations
• Provide as requested, guidance/input on policy and strategic initiatives and projects
• Continue to support requested and needed coordination on VDOT Mega Project.
Key Performance Indicators
Actual Actual Target Target
Performance Indicator 2018 2019 2020 2021
Improve Safety and Security and Restore Public Trust RWP Compliance/ Safety Stand Down Participation 100% 100% 100% 100% % of Employee Injury Investigation Completed to Standard 100% 100% 100% 100%
Improve reliability and win back riders Implement QICO Internal Review Schedule 14 14 17 17 Implement Follow-up Improvement Program Schedule 75 72 6 6
7000 Series Railcar - Reduce Conditional Acceptance Open Items from CY2016
10 8 8 8
Identification and Monitoring of CAP items (WMSC & NTSB Recommendations)
202 110 50 50
Alter fiscal trajectory and renew jurisdictional confidence Implement MARC Audit Schedule 19 22 20 20 Percentage of Certified risk and audit professionals 86% 80% 80% 80% Percentage of identified high risk areas addressed by advisory or assurance services 100% 100% 100% 100%
Calendar year figures

Chapter 3 – Operating Budget
57
FY2020 Major Accomplishments QICO
• Successfully facilitated transition of Safety Oversight of Corrective Action Plans (CAP) from the Federal Transit Administration (FTA) to the Washington Metrorail Safety Commission (WMSC) by the federally mandated deadline. Managed the submission and closure of 78 safety CAPs and 57 internal Corrective and Preventive Actions (iCAPA)
• Administered the creation of 3 new P/Is and revision of 38 existing P/Is, reducing by 50 percent the number of P/Is that were more than 10 years overdue for update, while at the same time exceeding the 2019 established goal for P/I revisions by more than 40 percent
• Completed and published 14 scheduled internal reviews, resulting in 20 iCAPAs to address the identified unacceptable risks and/or deficient quality management practices
• Continued implementation of Metro’s Quality Management System Plan (QMSP), which included: training over 500 employees, review of 800 departmental procedure documents, approval of 200 documents and completion of Internal Compliance’s (INCP) Quality Management Plan (QMP), the first of nine department QMPs
• Provided Quality Assurance (A) oversight for the assembly, inspection and commissioning of 120 new 7000 series railcars, as well on-going assessment of the engineering Field Modification Program for 7K fleet, issuing nearly 80 weekly and bi-weekly reports on status and quality of the 7K Program
MARC
• Audit and review activities resulted in 85 actionable recommendations to management
• Supported external audits activities including management responses to 15 Metro OIG Audits and 21 Investigations, Special Projects, Management Alerts and Assistance Reports, 2 jurisdictional audits, 5 FTA Reviews, and a GAO review
• Independently validated and confirmed closure of 140 corrective action plans (CAPs) from MARC, OIG and other external auditors and actively tracked approximately 235 CAPs
• Supported cost analysis activities for $46 million in procurements which resulted in approximately $15 million in identified savings
• Expanded audit universe to include Capital Project and Program Oversight compliance – in response to management concerns. MARC developed and implemented a program to monitor over $2 billion in budgeted capital expense
• Outlined benefits of implementing a Strategic Sourcing program with potential savings of more than $100 million
• Facilitated the identification and assessment of over 1,000 risk records across seven risk categories and aligned to GM Priorities as part of the ERM implementation plan
• Initial deployment of the Governance, Risk and Compliance (GRC) Tool – RSA Archer for Issues Management (Corrective Action Plans)
• Rolled out the Fraud Awareness and Detection and Internal Control training completed by 678 employees with financial management responsibilities across the organization and conducted 12 Internal Control training sessions for contracting officer’s technical representatives (COTRs)
• Automated Dashboard Reports for the Purchase Card Oversight Program to enable effective decision making in support of compliance
SPEC
• Continued participation and aggressive monitoring related to the Silver Line Phase 2 project as required by the Metro-MWAA project agreement
• Provided regular and continuing information to senior management on emerging issues
• Initiated discussions and negotiations with Loudoun and Fairfax Counties on various agreements related to maintenance, parking, and paratransit for Silver Line Phase 2.
• Provided assistance to the OIG in their review of various critical issues affecting the project
• Prepared project briefings for the Board of Directors

General Counsel
Deputy General Deputy General Senior Counsel II Senior Counsel II Counsel Senior Counsel IICounsel Finance Real Estate Regulatory & IBOP & ITLitigation Administrative
58
Chapter 3 – Operating Budget
General Counsel
The Office of General Counsel (COUN) is responsible for all legal affairs of Metro and provides high quality legal advice and counsel to the Board of Directors, executive management, and all Metro departments and offices.
FY2021 Business Plan
• Defend Metro in all disputes and litigation, including providing legal advice and counsel to all Metro departments and offices to mitigate the risk of exposure
• Provide legal advice and counsel to obtain jurisdictional and federal funding and financing, including jurisdictional operating and capital contributions
• Provide legal support to facilitate delivery of capital projects
• Provide legal support for Silver Line Phase 2
• Provide legal support for Metrorail station Wi-Fi and cellular projects
FY2020 Major Accomplishments
• Provided legal support for new collective bargaining agreement with ATU, Local 689
• Provided legal support and technical review in preparation for acceptance of Silver Line Phase 2
• Provided legal support for dedicated funding agreements for Maryland and Virginia
• Completed end user license, third-party payment provider, and operating and maintenance agreements for launch of mobile payment application
• Updated and improved employee Code of Ethics and launch new and improved computer-based employee ethics training
2018 2019 2020 2021 (Dollars in Thousands) Actual Actual Budget Budget $ Change % Change
Personnel $5,914 $5,942 $6,450 $6,814 $364 5.6% Non-Personnel $14,041 $8,485 $7,218 $7,361 $143 2.0% Total Cost $19,955 $14,426 $13,668 $14,176 $508 3.7%
Authorized Positions 48 48 46 44 (2) (4.3%)

Safety & Environmental Management
Occupational Safety Operations, Safety, Fire Life
Certification & Investigations & SafetySafety &Construction Performance Operations Environmental Safety Monitoring Management
Chapter 3 – Operating Budget
59
Safety and Environmental Management
Safety & Environmental Management
Safety Certification & Construction
Safety
Occupational Safety, Fire Life
Safety & Environmental Management
Operations, Investigations &
Performance Monitoring
Safety Operations
The Department of Safety & Environmental Management (SAFE) ensures Metrobus, Metrorail, MetroAccess and Metro’s facilities are operationally safe and environmentally sound for all employees, customers and surrounding communities. The overall goal is zero accidents, injuries and fatalities.
SAFE, in collaboration with all other departments, promotes Metro’s safety culture throughout the organization, from the Board of Directors to every employee regardless of position or location.
SAFE is responsible for the management and compliance of policies and procedures in the following areas:
• System safety training
• Corporate safety programs
• Hazard identification and mitigation
• Incident and accident investigation
• Fire life safety
• Safety and security certification
• Oversight of construction safety
• Occupational safety and health
• Environmental management and compliance
2018 2019 2020 2021 (Dollars in Thousands) Actual Actual Budget Budget $ Change % Change
Personnel $7,294 $7,774 $8,281 $9,108 $827 10.0% Non-Personnel $6,577 $7,827 $7,198 $7,885 $687 9.5% Total Cost $13,871 $15,601 $15,479 $16,992 $1,513 9.8%
Authorized Positions 76 74 73 87 14 19.2%

60
Chapter 3 – Operating Budget
FY2021 Business Plan
• Communicate safety as a Core Value to employees and customers
• Implement the Agency Safety Plan
• Enhance workplace safety programs
• Incorporate data-driven assessment for safety risk management
• Enhance existing employee-driven hazard identification programs
FY2020 Major Accomplishments
• A Construction Safety group was established that allows construction project activity to be monitored during multiple shifts
• The Safety Certification group was enhanced to broaden the scope of projects that undergo safety certification
• Provided Certificates of Compliance Obtained for three significant WMATA projects, including the Rehabilitation of Rail Yard Facilities, Phase I Project, the Orange/Blue Line Rehabilitation, Phase I Project and the Andrews Federal Center Bus Garage Project. Each project was completed through a multi-year contract and received Level I Safety Certification which included design, construction, testing, training and procedural verification steps
• Improved Roadway Worker Protection (RWP) program by supporting the pilot for bi-directional technology to create redundant protections for wayside workers
• Investigated at least 200 incidents and accidents and introduced a new Investigation Report format to protect sensitive personal and security information
• Received and mitigated at least 475 Safety Hotline entries received through WMATA’s employee safety reporting programs
• Reviewed over 15,500 reports and records to analyze hazard trends in safety data
• Championed the procurement and distribution of new safety helmets to provide better protection from falls or impacts to the head
• Developed Metro’s Compressed Gas Cylinder Management Program and Fire Department Connection Signage Design and Installation Manual
• Expanded industrial hygiene activities by conducting air and workplace noise surveys to support WMATA’s Silica Exposure Control, Hearing Conservation and Respiratory Protection Programs
• Conducted over 200 field-level job hazard analyses and trained managers and supervisors to be aware of hazards and develop appropriate mitigations
• Provided occupational safety training and roadway worker protection training to nearly 9,000 employees and contractors
• Reviewed over 500 safety data sheets for chemical products prior to purchase and use
• Led Pandemic Task Force and supported Operations for COVID-19 response
Key Performance Indicators
Actual Actual Target Target
Performance Indicator 2018 2019 2020 2021
Improve Safety and Security and Restore Public Trust WMATA Employee Injury Rate (per 200,000 work hours) 7.10 N/A N/A N/A EIR - Rail N/A 3.40 3.50 3.50 EIR - Bus N/A 10.90 9.40 11.20 Customer Injury Rate (per million passengers) 2.10 N/A N/A N/A CIR - Rail N/A 1.38 1.40 1.40 CIR - Bus N/A 3.28 2.45 2.20 CIR - MACS N/A 2.17 2.85 2.50 Percentage of Employee Injury & NTD Investigations Completed in SMS Within 30 days
N/A 56% 95% 95%
Percentage of Safety Data Sheet reviews completed in a timely manner (within 15 working days)
96% 96% 93% 93%

Strategy, Planning & Program
Management
Office of Office of Office of Capital Office of Office ofBusiness Capital Financial Planning Sustainability Transformation Programming Management
Chapter 3 – Operating Budget
61
Strategy, Planning and Program Management
The Department of Strategy, Planning and Program Management (SPPM) drives Metro’s strategy and transforms how Metro does business and serves its customers. SPPM builds and oversees Metro’s prioritized capital program and is the lead organization responsible for (1) business transformation, (2) planning, (3) sustainability, (4) capital programming and project development, evaluation and accountability, and (5) capital budgeting and funds management. SPPM also provides oversight and reporting, ensuring Metro’s capital program advances safety, service reliability and financial stability and invests federal, jurisdictional, and dedicated funding wisely.
FY2021 Business Plan SPPM’s business plan will help Metro progress towards its strategic goals and implement the GM/CEO’s priorities with a specific focus on the following:
• Drive transformation of Metro’s business and operations by sponsoring and ensuring delivery of initiatives that improve safety, customer service, and sustainability
• Formulate Metro’s capital budget, manage capital funds and grants, and lead capital financial reporting
• Develop and report on capital program-wide performance metrics
• Improve capital planning and programming practices, building capacity to plan and execute an expanded capital program and accelerate the execution of priority projects, as well as implementing Development & Evaluation program that establishes a pipeline of projects to address priority capital needs and ensures project readiness for programming and execution
• Make Metro more environmentally sustainable, resilient and fiscally responsible by driving programs and partnerships that support regional sustainability, mobility, and livability goals
• Drive the Energy Action Plan implementation, zero-emissions fleet strategy, waste management program, and initiate the incorporation of resiliency into strategic planning efforts
• Facilitate delivery of a regional strategy and roadmap for the future of bus service in the region through the Bus Transformation Project
• Deliver system and service improvement recommendations based on data and analysis for rail, bus, and paratransit, including identifying
2018 2019 2020 2021 (Dollars in Thousands) Actual Actual Budget Budget $ Change % Change
Personnel $5,123 $6,340 $4,886 $5,902 $1,016 20.8% Non-Personnel $1,257 $1,944 $4,637 $4,726 $89 1.9% Total Cost $6,380 $8,285 $9,523 $10,628 $1,104 11.6%
Authorized Positions - - - 115 115

62
Chapter 3 – Operating Budget
necessary rail flexibility, reliability and service and station capacity investments
FY2020 Major Accomplishments
• Completed testing of Transit Signal Prioritization (TSP) software with the District, and advanced District and Alexandria TSP implementation programs
• Identified additional bus Queue Jump locations for the District and agreed to coordinate a deployment schedule
• Completed hardware and software for the new Driver Control Units (DCU) display interface with Bus farebox software, and executed contract enabling WMATA and its Regional Partners to procure and deploy the solution
• Completed final design of new faregates
• Implemented new employee contractor crew support processes to increase efficiency of capital delivery
• Completed ‘Tagging Relay’ pilot to remotely control third rail power, improving track access time and safety
• Developed and disseminated a process to link customer on-time performance variances to asset failures and rail operations decisions, guiding both rail service improvements and capital investment prioritization
• Completed design and implementation support for a new station entrance at Crystal City, aligning construction timeline with the anticipated opening of Amazon’s HQ2
• Developed Programs and Projects for FY2021-2026 Capital Improvement Program (CIP), to address challenges in customer safety, comfort, and service reliability through projects such as platform reconstruction, track rehabilitation, railcar procurement and bus garage construction
• Completed the FY2021-FY2030 capital programming process and produced Metro’s Capital Program Strategy and Metro’s 10-Year Capital Needs Forecast (CNF)
• Created and launched the Capital Systems Intelligence (CSI) group to better understand, process, and correlate big data as it pertains to Metrorail and Metrobus performance
• Updated the Capital Needs Early Warning System (CNEWS) report to assess current and future crowding of the Metrorail system
• Metro has upgraded over 22,000 lightbulbs to LEDs to date. These upgrades reduce maintenance
requirements and improve lighting quality and safety for employees and customers. Energy savings exceed the original goal by 33 percent and have already yielded $200,000 claimed in utility rebates and over $600,000 in annual energy savings:
Passenger Stations – upgraded to LED lighting in 48 underground stations, within two years of launching the program. LED lighting reduces energy use by approximately 60 percent – each station saves enough electricity to power 40 homes each year
Parking lots/bus loops – partnered with DC Sustainable Energy Utility to upgrade lighting at select bus loops and surface parking lots in the District
Tunnels – upgraded tunnel lighting across the rail system to improve safety and visibility while reducing energy use and maintenance requirements
Facilities – launched Phase 2 of facility lighting upgrades
• Received a clean audit opinion of Metro’s FY2019 Capital Budget Financial Statements
• Received an unmodified opinion on Metro’s FY2019 Single Audit in compliance with federal grant requirements for capital project funds management
• Launched the Fine-Grained Bus AVL Analysis study to better understand bus movement, including detailed vehicle location to gain business intelligence
• Launched an online Ridership Data Portal on WMATA's external website, publishing valuable data to stakeholders
• Led the Weekend Headway Improvement Team to improve weekend rail service, delivered the Rail Flexible Operations Study, and supported Metrorail's transition from Headway-based to Schedule-based operations
• Developed and disseminated a replacement data source on bus ridership and performance during the Covid-19 pandemic
• Gained consensus and endorsement on the Bus Transformation Project with 26 actions to transform in the region into a fast, frequent, reliable, affordable and unified system
• Developed Covid-19 Recovery Plan, including phasing, service plan, and actions for workforce, customers, operations, capital, and finance

CapitalDelivery
Office of Project Office of Office of Project Office of Signal Office of Technical Development & Engineering & Implementation & Systems Renewal Services & Portfolio Implementation Architecture Construction Programs Management Planning
Chapter 3 – Operating Budget
63
Capital Delivery
Capital Delivery
Office of Project Development & Implementation
Planning
Office of Technical Services & Portfolio
Management
Office of Project Implementation &
Construction
Office of Engineering & Architecture
Office of Signal Systems Renewal
Programs
The Department of Capital Delivery (CAPD) is a new organization that assumes the responsibilities of the former Office of Design and Construction (DECO) as well as additional functions. The department provides leadership and expertise in management and delivery of capital projects in support of Metro’s overall mission to deliver safe, reliable and affordable transportation options throughout the region.
CAPD’s new organization structure consists of five main divisions: Office of Project Development and Implementation Planning (PDIP), Office of Engineering and Architecture (ENGA), Office of Project Implementation and Construction (PICO), Office of Signal Systems Renewal Programs (SSRP), and Office of Technical Services and Portfolio Management (TSPM).
PDIP’s core function is to generate the solution set for major projects to enable informed decisions, maximize project outcomes, and develop the delivery strategy for each project to maximize value for the Authority, considering scope bundling, impact to operations and optimal contracting strategies for design, construction and owner’s side responsibilities.
ENGA is responsible for providing Authority-wide engineering and project management services, including the development of design criteria and standards. ENGA works closely with maintenance and operations departments to ensure that the transit system is maintained, and that any engineering issues on existing systems are properly evaluated and remediated.
PICO’s program delivery arm consists of Passenger Facilities (PFAC), New & Non-revenue Facilities (NNRF), Infrastructure Renewal Program (IRPG), Adjacent and Task Order Construction (ATOC), and the Dulles Extension Project (DULS). These divisions assure projects comprising Metro’s Capital Improvement Program are completed within scope, schedule and budget.
SSRP leads the renewal of Metro's signaling system through the development and delivery of projects to address the unique and complex problems associated with the existing Automatic Train Control (ATC) system, while simultaneously identifying the next generation signaling solutions for WMATA.
TSPM provides a wide range of technical services and strategic portfolio management to the capital program through improvement and standardization of project management and business operations processes.
FY2021 Business Plan In support of Metro’s strategic goals, CAPD’s core services are to advance capital projects approved by the Authority from concept to an implementation ready phase; provide design, engineering and architectural services for capital improvement projects and operations; complete capital improvement projects within scope, schedule, and budget; and ensure full transparency for the capital investments in support of safe operations.
2018 2019 2020 2021 (Dollars in Thousands) Actual Actual Budget Budget $ Change % Change
Personnel $12,632 $10,025 $10,596 $11,174 $577 5.4% Non-Personnel $705 $1,080 $819 $1,136 $318 38.8% Total Cost $13,337 $11,105 $11,415 $12,310 $895 7.8%
Authorized Positions - - - 357 357

64
Chapter 3 – Operating Budget
CAPD is focused on advancing the GM/CEO’s agenda of keeping Metro safe, reliable, and affordable through the following actions. PDIP
• Formalize and document contract delivery methodology for capital projects given risk consideration and project parameters.
• Create a packaging strategy that optimizes capital resources, capitalizes on project integration and minimizes customer impacts.
• Establish key performance metrics that quantify and qualify capital project delivery decisions.
ENGA
• Continue designs for Traction Power and A/C Power gear replacements on all lines in accordance with prioritization.
• Design replacement solutions for Train Control Rooms.
• Complete designs and specifications for Pedestrian Bridges, segmental bridges, and bridge repair work.
• Continue design work on Tunnel Fan upgrades at various locations.
• Provide engineering support for projects in the implementation phase.
• Verify conditions of assets and provide design and engineering solutions for assets around the system found to be in critical states.
• Continue updating the Design and Construction Manual, Standard Drawings, Directive Drawings, and Standard Specification set.
• Lead and guide studies as needed to gain knowledge and a better understanding of system improvement needs.
PICO
• Commence construction for the rebuild and replacement of Northern and Bladensburg bus facilities.
• Continue design for the construction of the Heavy Repair and Overhaul Facility.
• Continue the construction of new Potomac Yard Station.
• Finish construction for cellular service availability in below ground stations and continue upgrade of the radio infrastructure.
• Complete platform level lighting and continue upgrades of lighting in underground and above ground stations as well as site lighting.
• Advertise first contract for the Station Modernization program.
• Continue and complete Platform 2 rehabilitation program at four stations West of Orange Line.
• Award contract, complete design, and commence construction of the Platform 3 Rehabilitation Program.
• Continue fire alarm systems upgrade, standpipe replacement of E Line, drainage pump systems.
• Complete planning and award contract for the implementation of the pilot tunnel ventilation upgrade program.
• Award contract for the implementation of tunnel leak mitigation on the selected sections of the Red Line.
• Replace air conditioning units at Dupont, Pentagon, and Crystal City.
• Begin rehabilitation of segmental and pedestrian bridges.
• Install additional high-definition CCTV cameras across rail stations, bus stations, and other Metro facilities.
• Complete rehabilitation of Largo Town Center South, West Falls Church, and White Flint Parking Garages and award new contracts for the parking garage and surface parking lot programs.
• Complete installation of pneumatic logic control (PLC) panel boxes.
• Complete construction of escalator canopies at DuPont North entrance and stair installation at Judiciary Square South entrance Metrorail stations. Award next phase escalator canopies contract, to include remaining nine Station Entrance Escalator canopies at Judiciary Square North, Arlington Cemetery, Smithsonian North, Archives/Navy Memorial, U Street East, Tenleytown, Capitol South and Potomac Avenue, and stairs at Bethesda, Judiciary North, and College Park Metrorail stations.
• Award new contract for AC Switchgear replacement at nine locations and continue installation of AC Switchgear at five locations.
• Continue UPS replacements at Passenger Stations, Yards, and Traction Power locations.
• Award new contract for Traction Power and SCADA System Upgrades. Continue replacement and installation of cable and traction power system for car efficiency upgrades.

Chapter 3 – Operating Budget
65
SSRP
• Finish installation of power supply upgrades in train control rooms.
• Complete Automatic Train Control upgrade project at Alexandria Yard .
• Continue switch machine power supply upgrades throughout the system.
• Complete the construction of WMATA’s new train control system training lab.
• Initiate the train control room replacement project
• Continue state of good repair activities.
• Advertise the first Train Control Room Rehabilitation contract.
• Complete design and initiate copper to fiber installation at Rhode Island Ave to Takoma Park Metrorail stations.
TSPM
• Improve and increase collaboration with other Metro departments to achieve capital program delivery transparency, increase efficiency of program delivery methods, and benefit from institutional knowledge and expertise.
• Streamline recruitment processes and develop outsourcing mechanisms to address staffing shortages to provide project delivery and reduce workload over-allocation.
• Continue provision of Scheduling and Estimating services for projects including Platform Rehab Phase II & Phase III, Potomac Yard Metro Rail station project, Northern Bus Garage project, Radio Project, Dulles Phase 2 project, Station Lighting, and Purple Line project.
• Update Estimating and Scheduling Guidelines.
• Continue management and oversight of General Engineering Contracts (GECs) and Project Management / Construction Management Contract (PMCM).
• Complete contract and task order closeout of predecessor General Engineering and Architectural Consultants (GEAC) services contracts.
• Collaborate with WMATA’s Safety department (SAFE) to ensure quality data collection and reporting on key safety metrics across all CAPD projects.
• Continue to streamline Capital Reporting by monitoring and reporting on KPIs.
• Complete and implement new enterprise Change Order Management solution (E-COM).
FY2020 Major Accomplishments PDIP
• Established new WMATA Office responsible for planning, managing and coordinating the development of capital projects; and achieving best practices in planning, design, construction, project and program management, and project delivery methods. PDIP is also responsible for ensuring that all policies, procedures, and standards comply with various legal, safety, and other requirements, particularly FTA project management oversight.
• Established the project delivery methods and completed comprehensive implementation plans for several of Metro’s mission critical assets. These high-priority capital projects improve system safety, increase asset reliability, enhance the customer experience and have the potential to generate new revenue streams. Projects include state of good repair efforts; equipment obsolescence abatement; system upgrades and modernization; and the rehabilitation of key infrastructure facilities. Specific projects and/or programs are as follows:
Fire Alarm and Control Systems Upgrade
Automatic Train Control Room Replacements
Platform 3 Rehabilitation
Station Modernization
Cheverly Aerial Structure Rehabilitation
Tunnel Leak Mitigations
Tunnel Ventilation Repair and Rehabilitation ENGA
• Provided engineering support for the Platform I project.
• Supported ongoing Radio project as well as provided daily support of existing operations of communications.
• Provided engineering support for several planned and ongoing major projects including Platforms II and III, Potomac Yards Metro rail station, Northern Bus Garage, and Bladensburg Bus Garage.
PICO
• Advertised construction contracts for the new Metrorail Heavy Repair and Overhaul facility and for the rebuild and replacement of Bladensburg Bus Garage.
• Awarded and started preconstruction of Northern Bus Garage.
• Started construction of foundation for new Potomac Yard Station.

66
Chapter 3 – Operating Budget
• Completed installation of cellular availability on the green line. Continued upgrade of radio infrastructure.
• Continued installation of platform level lighting throughout the system, completion of Greenbelt site lighting, commenced work for station downlighting at 14 stations.
• Continued design of advertising digital displays infrastructure.
• Continued rehabilitation of Largo Town Center North and Vienna North parking garages and Greenbelt Surface Parking Lot.
• Completed the Connecticut Ave Chiller Line Replacement, continued replacement of air conditioner units at Friendship Heights, Tenleytown, Cleveland Park, and Van Ness, and replacement of chillers at Tenleytown, Woodley Park, Union Station, Benning Rd, and Pentagon.
• Completed major work on the Platform 1 rehabilitation program at stations South of National Airport.
• Awarded Platform 2 rehabilitation program at four stations west of Orange Line and began preparation for summer shutdown rehabilitation work.
• Continued Farragut North Metro station vent shaft grating repair at 17th street.
• Continued replacement of standpipe on the E Line.
• Continued installation of pneumatic logic control (PLC) panel boxes.
• Continued construction of escalator canopies at Gallery Place, Judiciary Square, Smithsonian, and Huntington. Continued installation of new stairs at Judiciary Square South.
• Advertised next escalator canopies contract for nine canopies and three stairs.
• Completed construction and renovation of the warehouse at Good Luck Rd.
• Continued AC Switchgear replacement throughout the system and completed 14 UPS replacements at passenger stations.
• Advertised new AC Switchgear replacement contract for five locations.
• Continued replacement and installation of cable and traction power system for 8 car efficiency upgrades while taking advantage of planned shutdowns.
SSRP
• 60 percent Design completion of ATC training lab.
• 80 percent Completion of train control room power supply replacement.
• 30 percent Completion of Automatic Train Control upgrade project at Alexandria Yard.
• 35 percent Completion of Mainline switch replacement installations.
• 75 percent Completion of EMI design for fiber replacements at Rhode Island Ave to Takoma Park Metrorail stations.
TSPM
• Provided scheduling and estimating services for Platform Rehab Phase 1.
• Continued provision of Scheduling and Estimating services for projects including Platform Rehab Phase II, Potomac Yard project, Northern Bus Garage project, Radio Project, Dulles Phase 2 project, Station Lighting, and Purple Line project.
• Developed and implemented new format for capital reporting (CAPStat).
• Began development of new E-COM prototype for change order management. Began work on change order root cause analysis across CAPD projects.
• Streamlined and documented procurement processes for management of technical Indefinite Delivery Indefinite Quantity (IDIQ) contracts.
• Awarded new GEAC contract and first task order under this contract for upgrades to the Revenue Collection Facility. Continued management and oversight of the GEC and PMCM contracts, providing specific technical direction and guidance to include exploration of new requests, scope definition, claims and change order support and liaising with other departments to ensure requests are met.
• Developed and implemented task order closeout procedures.

Chief OperatingOfficer
Facilities, Systems Operations Budget,Metro Transit Police & Vertical Bus Services Performance &Department Transportation Planning Maintenance
Reliability Supply Chain Rail Services Access Services Engineering Management& Asset Mgmt
Chapter 3 – Operating Budget
67
Chief Operating Officer
The Chief Operating Officer’s (COO) mission is to move the region through safe, reliable, and cost- effective public transportation. COO staff operate buses and trains; maintain Metro vehicle fleets, facilities, and rail infrastructure; execute certain capital programs; and ensure a safe and secure environment for passengers and employees.
The department consists of COO – Administration, Rail Services (RAIL), Bus Services (BUS), Access Services (ACCS), Metro Transit Police (MTPD), the Office of Budget, Planning, and Performance (OBPP), Reliability Engineering and Asset Management (REAM), Supply Chain Management (SCM), and Facilities, Systems and Vertical Transportation (FSVT).
FY2021 Business Plan The GM/CEO has set two goals for Metro: to become the employer of choice and the mobility provider of choice for the region. The COO's business plan is organized around advancing these goals through three lines of effort, with safety integrated throughout:
• Focus on customers to deliver excellence
• Focus on employees, empowering our people to drive bold changes in our business
• Invest to renew and modernize the system
FY2020 Major Accomplishments
• Supported the region through the 2020 Covid-19 global pandemic by maintaining critical lifeline transportation services for essential employees
• Reversed the seven-year trend of declining ridership, with every month between July 2019–February 2020 outperforming the same month the prior year (Covid-19 response interrupted the ridership growth)
• Introduced the Certified Metro Manager Program to support front-line management through training and career development
• Signed a new, four-year agreement between Metro and Amalgamated Transit Union 689, which represents nearly 8,000 Metro employees across bus, rail, and operational support offices, cementing the decision to not contract out operations or maintenance of the Silver Line extension
2018 2019 2020 2021 (Dollars in Thousands) Actual Actual Budget Budget $ Change % Change
Personnel $806,715 $791,856 $826,227 $893,180 $66,953 8.1% Non-Personnel $364,534 $423,739 $424,920 $476,105 $51,186 12.0% Total Cost $1,171,249 $1,215,594 $1,251,146 $1,369,285 $118,139 9.4%
Authorized Positions 11,052 11,052 10,974 11,204 230 2.1%

68
Chapter 3 – Operating Budget
• Completed reconstruction on six rail station platforms in the largest and most complex capital project since Metro’s original construction, and re-opened rail services on schedule
• Opened the new Andrews Bus Garage, serving Southern Prince George’s County and Southeast DC
• Centralized asset management and maintenance analytics under a new Office of Reliability Centered Maintenance Planning

Chapter 3 – Operating Budget
69
Rail Services
The Rail Services (RAIL) department operates and maintains Metro’s rail system in a safe, reliable and efficient manner 24-hours a day, 7 days a week, providing service across 118 miles of track and 91 stations, 40 of which are in Washington, D.C., 26 in Maryland and 25 in Virginia. RAIL is responsible for all facets of rail operations including station operations, train operations, the rail operations control center and the maintenance of all assets necessary to move customers through the system including railcars, track, traction power and the automatic train control system.
The Rail department is composed of the following groups:
• Rail Administration (RAIL ADM)
• Rail Transportation (RTRA)
• Chief Mechanical Officer (CMOR), which includes Car Maintenance (CMNT) and Chief Engineer Vehicles (CENV)
• Rail Infrastructure Maintenance and Engineering (RIME), which includes:
Track and Structures (TRST)
Automatic Train Control Maintenance (ATCM)
Traction Power Maintenance (TRPM), and
Maintenance of Way Engineering (MOWE) FY2021 Business Plan
FY2021 Business Plan In FY2021, RAIL will focus on increasing Metrorail ridership and customer satisfaction by: continuing to prioritize safety, making Rail service faster and more comfortable for customers, shifting to forward-looking asset maintenance, executing track work as efficiently as possible, and improving customer service.
Specifically, RAIL will focus on the following actions:
• Continue to reduce infrastructure-related delays by evaluating data, condition reports, and operational
outcomes to determine and implement appropriate preventive maintenance strategies
• Advance 8000-Series railcar procurement to replace the 2000 and 3000 series railcars by 2024, when they exceed their useful life
• Improve operations at the Rail Operations Control Center (ROCC) by strengthening its safety culture, management, and work flow while reducing training time for critical positions
• Work to minimize impact of capital work on customers through improved planning and execution
2018 2019 2020 2021 (Dollars in Thousands) Actual Actual Budget Budget $ Change % Change
Personnel $269,533 $254,327 $279,216 $322,444 $43,228 15.5% Non-Personnel $125,307 $139,895 $128,880 $170,374 $41,494 32.2% Total Cost $394,839 $394,223 $408,097 $492,818 $84,722 20.8%
Authorized Positions 4,056 4,072 4,118 4,341 223 5.4%
Key Performance Indicators
Actual Actual Target Target
Performance Indicator 2018 2019 2020 2021
Improve Safety & Security and Restore Public Trust ROW Fire Rate per fixed revenue guideway mile N/A N/A N/A 0.55 Rail Collision Rate per million railcar revenue miles N/A N/A N/A 0.30 Derailment Rate per million railcar revenue miles N/A N/A N/A 0.10 NTD Rail Fatality Rate per million railcar revenue miles N/A N/A N/A 0.00 MyTripTime: Rail Customer On-Time Peformance* 87% 88% 88% 88% Trains in Service* 99% 98% 98% 98% Railcar Reliability (Mean Distance Between Failure) 10,408 14,211 10,000 18,000 Railcar Offloads* 719 425 240 240
*Preliminary targets for FY2021; targets will be published in the Metro Performance Report.

70
Chapter 3 – Operating Budget
• Continue to increase track access efficiency by increasing the percentage of time spent executing tasks
• Administer the ATC Safe Signals Initiative to replace ATC assets until a full system upgrade is possible
• Improve the quality of asset-related data to provide the intelligence needed to adjust maintenance intervals, diagnose problems, design appropriate interventions, monitor and improve performance
• Ensure operational preparedness to open Silver Line Phase 2
• Shift to greater customer service mindset through preparation, training, and enhanced supervision, including auxiliary station managers
FY2020 Major Accomplishments
• Successfully implemented service adjustments in response to Covid-19, implementing protocols to protect employees and customers
• On-time performance reached record highs, with several months recording over 90 percent of customer trips completed on-time best railcar performance recorded, including a single-month record in February 2020 of traveling over 416,000 miles before causing a customer delay—beating the previous single-month record by 42 percent
• Accepted the 748th and final 7000-series railcar, marking the end of a 10-year process in upgrading the rail fleet
• Directly supported the Platform Improvement Project, a major capital project to reconstruct platforms at six rail stations
• Rail offloads were down six percent compared to FY2019 and down 57 percent since FY2017
• Rail customer satisfaction reached 83 percent, its highest level in six years

Chapter 3 – Operating Budget
71
Bus Services
The Department of Bus Services (BUS) is committed to ensuring safe, clean, reliable, cost effective and responsive bus service to promote regional mobility and contribute to the social, economic and environmental well-being of the communities in the Washington region.
Bus Services is the transportation provider for more than 120 million customer trips each year, and handles the
operation, maintenance, and scheduling of Metrobus service in the District of Columbia, Maryland, and Virginia.
Metrobus is responsible for over 1,580 buses. Additionally, Bus Services maintains Metro’s service vehicles and equipment.
2018 2019 2020 2021 (Dollars in Thousands) Actual Actual Budget Budget $ Change % Change
Personnel $310,777 $316,262 $297,454 $309,036 $11,582 3.9% Non-Personnel $66,836 $77,715 $79,648 $74,286 ($5,362) (6.7%) Total Cost $377,613 $393,976 $377,102 $383,322 $6,220 1.6%
Authorized Positions 3,892 3,880 3,739 3,731 (8) (0.2%)
Key Performance Indicators
Actual Actual Target Target
Performance Indicator 2018 2019 2020 2021
Improve Safety & Security and Restore Public Trust NTD Bus Collision Rate per million miles 3.50 4.60 3.70 3.70 Bus Fleet Reliability 6,925 6,335 7,000 7,000

72
Chapter 3 – Operating Budget
FY2021 Business Plan In support of Metro’s strategic goals, BUS’ core services are to deliver safe, quality and reliable transportation to the riding public; provide a safe work environment to bus employees; manage the workforce effectively; and balance departmental budgets wisely.
In FY2021, Bus Services is focused on increasing Metrobus ridership and improving customer satisfaction through increasingly safe and reliable high-quality bus service. In so doing, the ongoing Business Plan activities include:
• Enhance the overall customer experience through active and dedicated field supervisors and Bus Operations Control Center monitoring and headway-based (evenly-spaced) route scheduling
• Complete a study to develop recommendations to transform the bus network, including creation of a more efficient and customer-focused system
• Install video displays on new buses to increase deterrent value of on-board cameras, displaying Closed Circuit Television feeds to remind customers their actions are recorded
• Continue the development of Secure Bus Access as an innovative, secure solution that allows Metro to guard against unauthorized users of its fleet of fixed route vehicles
• Continue installation of electronic signs at bus stop shelters to provide accurate and concise information to our customers. Increase the utilization of real-time technology to monitor service and provide direct adjustments as needed and ensure that operational changes, detour notifications, and general alerts are provided in a timely manner
• Recruit and train highly qualified bus operator candidates and provide FTA mandated in-house training
• Work with CAPD and SPPM in replacing/ rehabilitating the Northern and Bladensburg bus facilities
• Continue the deployment of “SmartYard” vehicle management software at all divisions, ensuring on-time departures from bus garages
In addition to improving service and reliability for our customers, Bus Services is focused on the following actions to improve operational safety and efficiency:
• Investigate all employee injuries and safety incidents to identify and address root causes
• Employ job hazard analysis within Bus Maintenance to identify and mitigate potential hazards before a job starts
• Increase employee availability through reducing active employee absenteeism and the number of inactive employees
• Assess, streamline and improve day to day operations and activities at bus divisions to reduce administrative burden on managers and supervisors
FY2020 Major Accomplishments
• Successfully implemented service adjustments in response to Covid-19, implementing protocols to protect employees and customers
• Participated in the regional Bus Transformation Project to develop a bold, new vision and a collaborative action plan for the future of bus service in the region.
• Launched GTFS-Real Time to provide customers with accurate, real-time bus arrival information.
• Partnered with DDOT to launch and make permanent the H & I Streets bus lanes, improving the reliability and speed of buses.
• Adjusted the schedules of 16 Metrobus routes to right-size run-time for operators and improve on-time performance for the riding public.
• Provided weekend shuttle service and additional weekday supplemental service on five routes in support of the Summer 2019 Platform Improvement Project.
• Deployed Secure Bus Access to all capable buses to guard against unauthorized use.
• Completed Midlife Overhauls on 100 buses and received 110 replacement buses to ensure the fleet remains in a state of good repair.
• Purchased over 70 replacement nonrevenue vehicles to meet targets for state of good repair.
• Issued request for proposal for Zero-Emission Bus Analysis and completed the phase 1 study.
• Pioneered the first Certified Metro Manager (CMM) Program—helping to drive performance through improved leadership, communication and problem-solving—with eight Bus Transportation Superintendents graduating from the program.
• Completed research activities in support of improving day to day operations and activities at bus divisions, with work now underway to implement tools to foster efficiency.
• Recruited almost 200 bus operator candidates and successfully graduated 85 percent of them.
• Improved employee availability through the reduction of employee injuries, reduced NTD reportable collisions and LWOP days.

Chapter 3 – Operating Budget
73
Access Services
The Department of Access Services (ACCS) ensures that Metro remains in compliance with the provisions of the Americans with Disabilities Act (ADA) and other federal, state, and local laws and regulations related to providing equitable access to transportation services by people with disabilities.
ACCS is responsible for:
• Regulatory compliance with ADA and all other applicable accessibility-related laws, regulations and standards.
• Accessibility planning, design review, and quality assurance for all Metro services, facilities, and equipment.
• Budgeting, planning, and management of MetroAccess ADA paratransit service delivery.
• Eligibility assessments for MetroAccess service and the Reduced Fare Program.
• Ombudsman service for issues related to accessibility.
• Accessibility Advisory Committee administrative and policy support.
• Community engagement to ensure that existing and prospective customers are aware of and know how to use the full array of accessible transportation choices available to them.
ACCS supports accessibility through its three offices: ADA Policy & Planning (ADAP), Eligibility Certification and Outreach (ELIG), and MetroAccess Service (MetroAccess). ADAP ensures Metro’s compliance with the ADA and all other applicable laws, regulations, and standards; interacts with operations departments to ensure that existing and future fleets and facilities continue to be both ADA compliant and optimally accessible; and engages regional organizations and policy makers to ensure that funding and resources are effectively channeled to sustain accessibility for a growing constituency. ELIG responds directly to those customers with disabilities who approach Metro seeking accessible transportation options to navigate the region. ELIG matches the customer with the service or product that most effectively meets the customer’s needs (with an emphasis on bus and rail wherever possible, augmented by proactive community outreach and travel training functions) while conserving the highest level of assistance, for those customers whose disabilities prevent them from using bus and/or rail for at least some of their travel. MetroAccess manages the delivery of the region’s paratransit service of record, MetroAccess service. MetroAccess management, contract staff, and compliance staff work in conjunction with MetroAccess contractors; service delivery, call center operations, and quality assurance, to facilitate safe, efficient, and customer friendly paratransit service.
2018 2019 2020 2021 (Dollars in Thousands) Actual Actual Budget Budget $ Change % Change
Personnel $4,707 $4,101 $4,706 $4,831 $125 2.6% Non-Personnel $126,555 $157,854 $162,020 $172,868 $10,848 6.7% Total Cost $131,262 $161,955 $166,725 $177,698 $10,973 6.6%
Authorized Positions 50 50 49 47 (2) (4.1%)
Key Performance Indicators
Actual Actual Target Target
Performance Indicator 2018 2019 2020 2021
Improve Safety and Security and Restore Public Trust Customer Injury Rate (per 100,000 passengers) 2.10 2.17 <2.85 <2.5 On-time performance 92% 90% 90% 90%

74
Chapter 3 – Operating Budget
FY2021 Business Plan The ACCS Business Plan is centered on five strategic objectives:
• Metro’s new facilities, equipment, and services are designed and built, or procured in complete compliance with the provisions of the ADA and all other applicable accessibility-related laws, regulations, and standards
• Metro’s existing accessible features are maintained in good working order
• MetroAccess paratransit service is delivered safely, efficiently, and in compliance with the ADA
• Eligibility determinations maximize customers’ ability to travel independently, matching them to the appropriate service or program, and offering travel training to ensure they receive the maximum benefit
• Incentivize MetroAccess customers to increase use of established paratransit alternatives
Growing MetroAccess ridership requires a regional strategy emphasizing demand management. MetroAccess ridership has increased from just under a million trips in 2003 to 2.35 million trips in FY2019. The
increase was driven largely by an aging population and reductions in transportation services offered by human service agencies. Metro has facilitated the establishment of lower cost paratransit alternatives as a means of addressing the growing demand for MetroAccess service, projected to be 1.25 million trips in FY2021, while attempting to lower overall cost.
FY2020 Major Accomplishments
• For the fiscal year through February, the MetroAccess customer injury rate was down 13 percent compared to FY2019 and down 29 percent since FY2017
• Facilitated project initiation to make all rail station restrooms fully accessible to individuals using mobility devices
• Implemented the MetroAccess Mystery Rider Quality Assurance Plan to promote positive customer experiences and driver adherence to safety protocol
• Expanded the Abilities-Ride paratransit alternative program to all MetroAccess customers throughout the entire MetroAccess service area

Chapter 3 – Operating Budget
75
Metro Transit Police
The Metro Transit Police Department (MTPD) is responsible for the safety of Metro customers, personnel, and transit facilities over a 1,500 square mile transit zone, comprised of three jurisdictions.
MTPD is composed of both uniformed and plain clothes sworn police officers charged with the duty of enforcing the laws of the signatories; the laws, ordinances and regulations of the political subdivisions; and the rules and regulations of Metro. Additionally, Special Police Officers
are responsible for the physical security at rail yards, bus divisions, and other Metro properties. MTPD is responsible for digital video management of cameras throughout the Metro system. Finally, MTPD is responsible for crime analysis and police records management, police radio communications and various administrative support functions.
FY2021 Business Plan In support of Metro’s strategic goals, the MTPD is investing in technologies to improve security across the Metro system. Metro’s investment in security technologies aims to deter crime before it happens and to assist Metro Transit Police quickly and effectively respond to incidents when they occur. While only five Part I crimes (murder and non-negligent homicide, rape, robbery, aggravated assault, burglary, motor vehicle theft, larceny-theft, and arson) are committed per million passenger trips, all customers deserve a safe journey.
In addition, assaults are a significant driver of employee injuries, especially for bus operators. With Metro Transit Police already making use of data analytics through MetroStat to set strategy and tactics, investing in security technology is the most promising approach for further reductions in crime. Investments include expanded closed-circuit television (CCTV), tactical equipment for officers, and access control equipment:
2018 2019 2020 2021 (Dollars in Thousands) Actual Actual Budget Budget $ Change % Change
Personnel $54,386 $56,489 $63,972 $69,672 $5,699 8.9% Non-Personnel $6,832 $7,248 $8,089 $8,732 $642 7.9% Total Cost $61,218 $63,737 $72,062 $78,403 $6,341 8.8%
Authorized Positions 694 694 694 731 37 5.3%
Key Performance Indicators
Actual Actual Target Target
Performance Indicator 2018 2019 2020 2021
Improve Safety & Security and Restore Public Trust Safety Measurement System Compliance N/A N/A 95% 95% Part I Crimes 1,173 1,114 1,550 1,550
Preliminary targets for FY2021; targets will be published in the Metro Performance Report.

76
Chapter 3 – Operating Budget
• Expand the scope and quality of CCTV coverage. Building on the substantial progress in developing real-time monitoring and retrieval capabilities at the Security Operational Control Center, install additional CCTV cameras at rail stations and other Metro facilities to improve coverage and video quality
• Create a Tactical Enforcement Unit to respond to high-risk emergency situations
• Deploy new equipment and radios
• Enhance investigative abilities of the Criminal Investigations Division through innovative technological advancements and partnerships
• Install video displays on new buses to increase deterrent value of bus cameras, displaying CCTV feeds to remind customers their actions are recorded, and continue bus operator assault reduction campaign
• Harden facilities by installing barrier gates, removing camera obstructions and training on capabilities of One Badge and Pro-Watch systems
• Institute leadership training program for sergeants and above. Strengthen community policing orientation through training and community outreach (21st Century Policing, Blue Courage, Respect Your Ride, De-escalation training re: youth)
• Complete deployment of tasers, smartphones, and firearms replacement.
FY2020 Major Accomplishments
• TSA SSI Training in March 2020
• Created new/fourth bureau – Internal Oversight and Youth Services Bureau in April 2020
• Created Youth Services Unit in April 2020
• Officers saved a patron’s life at COLH providing CPR and AED – received award from local Fire Department
• Sergeant apprehended murder suspect from Pentagon Station stabbing
• Assisted with the implementation of the Station Manager Assault Reduction Training in January 2020
• Trained 100 bus operators in Bus Assault Reduction Training with new format in March 2020
• Created Youth Resource Officer position in March 2020
• Covid-19 response: Adjusted BUS High Intensity Targeted Enforcements (HITES) at SILS and ANAC
• Covid-19 response: Adjusted post locations to implement proper distance measures
• Expanded Blue Team tracking platform to front line supervisors and Use of Force reporting
• Trained several members in Facial Recognition Software in January 2020
• Launched Officer Mentoring Program in March 2020
• Approved and ratified a new collective bargaining agreement with the FOP and SPD divisions
• Introduced MTPD Cultural Diversity and Awareness Classes
• Conducted the First Annual Skill Competition to MTPD members
• Implemented two plain clothes firearms class/courses for members
• Summer Crime Initiative Community BBQ’s
• MTPD-Summer Crime Initiative (SCI) Community Outreach Event held at Anacostia Metro station
• MTPD-SCI and Youth Advisory Council Appreciation Community Outreach Event at Congress Heights
• Suitland Unity in the Community Joint MTPD-Summer Crime Initiative (SCI) Community Outreach Event at Suitland
• Held over 60 events with Deputy Mayor of Education, DC Public School system, and DC Charter Schools
• MTPD and Juvenile Probations Back To School Joint High Visibility Details at Gallery Place and L’Enfant Metro stations
• High Visibility Joint Crime Reduction details with Prince George’s County District IV Special Assignment Team (SAT)
• Managed Nationals World Series parade crowd control details/posts in November 2019
• Coordinated with DC Public Schools on the “Shop with a Cop” event on December 3, 2019
• Transitioned to interoperable radios and encrypted radios

Chapter 3 – Operating Budget
77
Facilities, Systems, and Vertical Transportation Maintenance
The mission of the Office of Facilities, Systems, and Vertical Transportation Maintenance (FSVT) is to support Metrobus and Metrorail operations and maintain infrastructure and equipment systems in a state of good repair by providing a coordinated approach to maintain elevators and escalators, electro-mechanical equipment systems, infrastructure, facilities, and grounds. FSVT includes:
• Office of Elevators and Escalators (ELES), which manages and maintains all vertical transportation equipment within the auspices of the Authority.
• Office of Plant Maintenance (PLNT), which manages and maintains Metro’s facilities, grounds, and mechanical equipment systems in support of Metrorail and Metrobus operations.
• Facilities Asset Management Office (FAMO), which ensures effective implementation and stewardship of a facilities asset management program and compliance with Metro's adopted regulatory framework and requirements.
• Office of Systems Maintenance (SMNT), which manages the electrical maintenance activities related to operations; SMNT is composed of the following:
Office of Automatic Fare Collection Section (AFCS) manages the installation, maintenance, and repairs of fare collection and parking lot equipment
Office of Communications Sections (COMM) maintains Metro’s communications systems in support of Metrobus, Metrorail and Metro Transit Police Department operations, as well as fire/life safety systems to help ensure public safety
Office of Low Voltage Electrical Maintenance (LVEM) maintains and distributes all 480-volt electrical systems for Metro’s facilities
• Office of Shops and Material Support (SAMS) provides component-level repair and supports procurement actions for all SMNT
FY2021 Business Plan In FY2021, FSVT is focused on enhancing the customers’ experience through a variety of initiatives:
• Play a pivotal role in the successful implementation of the Materials/Supplies Management Transformation Initiative.
• Continue a strategic station cleaning program to pressure wash entrances, mezzanines, and platforms; and general cleaning of surfaces at high volume stations.
• Continue Platform Improvement Projects.
• Partner with REAM to develop asset lifecycle plans for assets maintained by FSVT.
• Restore station lighting and bathrooms: in partnership with CAPD, tunnel and platform level lighting in underground stations will be upgraded with new energy efficient LED technology and platform edge lights at 24 stations; additionally, bathroom renovations will be completed at multiple stations.
2018 2019 2020 2021 (Dollars in Thousands) Actual Actual Budget Budget $ Change % Change
Personnel $123,897 $116,895 $127,620 $131,426 $3,806 3.0% Non-Personnel $34,700 $36,073 $37,790 $40,203 $2,413 6.4% Total Cost $158,597 $152,968 $165,411 $171,629 $6,219 3.8%
Authorized Positions 1,602 1,602 1,594 1,811 217 13.6%
Key Performance Indicators
Actual Actual Target Target
Performance Indicator 2018 2019 2020 2021
Improve Safety & Security and Restore Public Trust Safety Measurement System Compliance N/A N/A 95% 95% ELES - Elevator Availability 97% 96% 97% 97% ELES - Escalator Availability 94% 94% 92% 92%
Preliminary targets for FY2021; targets will be published in the Metro Performance Report.

78
Chapter 3 – Operating Budget
• Sustain high levels of escalator availability by advancing the escalator rehabilitation and replacement program.
• Perform rehabilitation work in 24 stations (12 major and 12 minor).
FY2020 Accomplishments
• Created the Facilities Asset Management Office (FAMO), which will bring centralized organization and expertise to a critical area of need for the Authority.
• Played a critical role in the successful completion of Platform Improvement Project Phase 1.
• Responded quickly and thoroughly to challenges presented by Covid-19 by significantly increasing the frequency and rigor of station sanitizing, helping to keep Metro employees and customers safe.
• Advanced the aggressive Elevator/Escalator rehab and replacement program, completing a $176 million multi-year capital investment that delivered 145 new escalators for rail customers since 2011.
• Conducted quarterly FacilitiesSTAT meetings, expanding the information reported and reviewed to drive performance improvement.
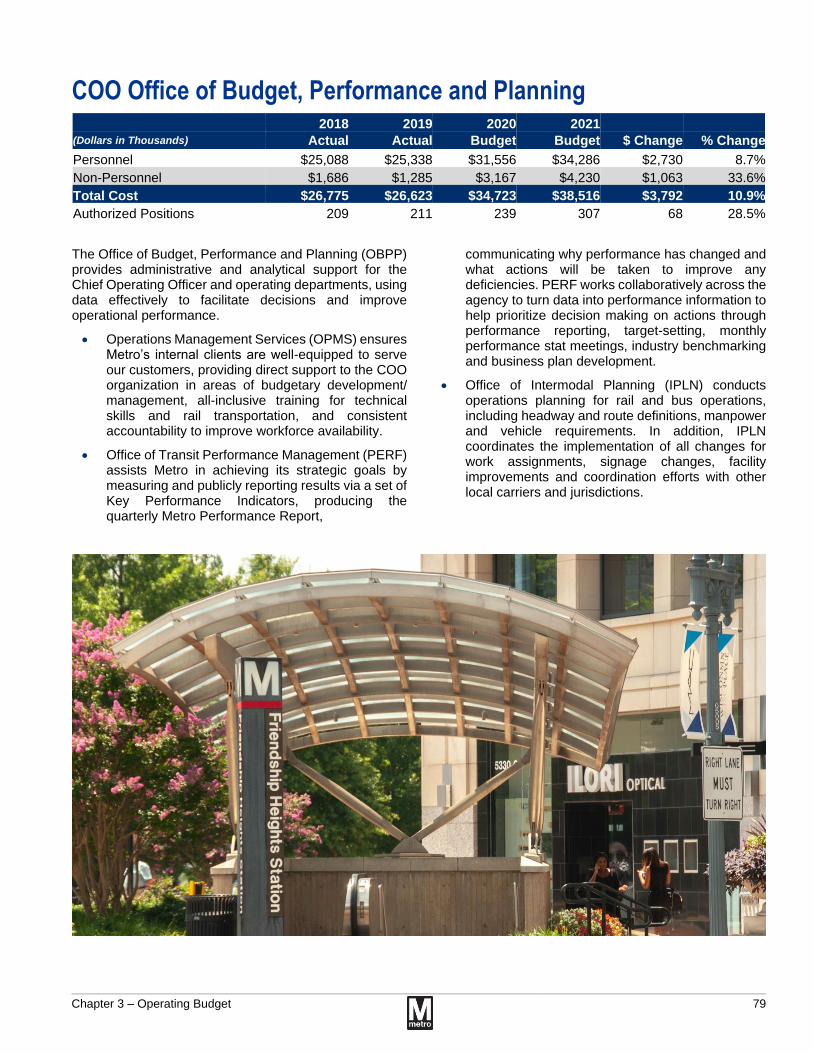
Chapter 3 – Operating Budget
79
COO Office of Budget, Performance and Planning
The Office of Budget, Performance and Planning (OBPP) provides administrative and analytical support for the Chief Operating Officer and operating departments, using data effectively to facilitate decisions and improve operational performance.
• Operations Management Services (OPMS) ensures Metro’s internal clients are well-equipped to serve our customers, providing direct support to the COO organization in areas of budgetary development/ management, all-inclusive training for technical skills and rail transportation, and consistent accountability to improve workforce availability.
• Office of Transit Performance Management (PERF) assists Metro in achieving its strategic goals by measuring and publicly reporting results via a set of Key Performance Indicators, producing the quarterly Metro Performance Report,
communicating why performance has changed and what actions will be taken to improve any deficiencies. PERF works collaboratively across the agency to turn data into performance information to help prioritize decision making on actions through performance reporting, target-setting, monthly performance stat meetings, industry benchmarking and business plan development.
• Office of Intermodal Planning (IPLN) conducts operations planning for rail and bus operations, including headway and route definitions, manpower and vehicle requirements. In addition, IPLN coordinates the implementation of all changes for work assignments, signage changes, facility improvements and coordination efforts with other local carriers and jurisdictions.
2018 2019 2020 2021 (Dollars in Thousands) Actual Actual Budget Budget $ Change % Change
Personnel $25,088 $25,338 $31,556 $34,286 $2,730 8.7% Non-Personnel $1,686 $1,285 $3,167 $4,230 $1,063 33.6% Total Cost $26,775 $26,623 $34,723 $38,516 $3,792 10.9%
Authorized Positions 209 211 239 307 68 28.5%
80
Chapter 3 – Operating Budget
FY2021 Business Plan
• Implement MetroBus Transformation Program priorities, including updating WMATA’s Metrobus service guidelines, studying the restructuring of the MetroBus network to create an efficient and customer-focused system, and supporting the implementation of bus priority projects.
• Improve performance management and business processes. Produce quarterly customer-focused Metro Performance Report to demonstrate progress toward Metro’s strategic goals and deploy performance review tools to assist department leadership and superintendents in identifying business process improvement areas
• Optimize workforce size and structure to operate efficiently and effectively, and actively monitor use of overtime
• Ensure training plans are in place for all operational and mechanical classifications and deliver timely, high quality training with qualified instructors and the latest technology
• Assist operational departments in meeting manpower requirements through oversight of Absenteeism Policy and providing at-risk, transitional duty and long-term absence management support
• Revise bus and rail operating schedules using data to ensure that service matches demand and operating conditions, and is equitably distributed, conforming to applicable rules, guidelines, and collective bargaining agreements. Improve operating efficiencies, safety, speed, reliability; serve new markets, and in general improve service where possible
• Manage shuttle bus operations supporting MetroRail rebuilding efforts
• Plan and maintain bus stops and intermodal facilities
FY2020 Major Accomplishments
• Adjusted rail and bus schedules, absence tracking, training protocols, and performance measures to support Metro operations through the Covid-19 pandemic
• Expanded the apprentice program to include railcar mechanics, traction power personnel, and automatic train control personnel to support offices in filling vacancies that require unique skillsets
• Enhanced the COO Dashboard and launched four additional internal dashboards to support operational offices in using data to enhance service delivery
• Held monthly RailSTAT, BusSTAT, and Budget STAT meetings; held quarterly Facilities STAT meetings, and established quarterly Supply Chain STAT meetings to monitor performance and develop strategies to improve service for customers
• Supported schedule adjustment through the Platform Improvement Project, including bus shuttles, and weekend track work
• Continued to maintain >99 percent RWP compliance, exceeding the 95 percent performance measure
• Participated in the Bus Transformation Program, working to advance service standards and start planning for a bus network redesign

Chapter 3 – Operating Budget
81
Supply Chain Management
In February 2019, WMATA reorganized and centralized the supply chain management functions (formerly spread across RAIL, BUS, and Support Services), under a new Department of Supply Chain Management (SCM) to improve effectiveness and efficiency. The following offices, designed to provide excellent supply chain solutions to their respective internal customers, comprise the SCM:
• Office of Supply Chain Planning and Analytics: Develops and provides supply chain business intelligence and supply chain data governance to the Authority, enhancing asset availability and service delivery
• Office of Supply Chain Contract Management: Provides advanced acquisition planning, contract management, and procurement compliance services for all inventory materials/supplies across the Authority, enhancing asset availability and service delivery
• Office of Supply Chain Warehousing and Logistics: Provides timely and quality warehousing and logistical solutions for the Authority to ensure that the right parts are in the right place at the right time, enhancing asset availability and service delivery
FY2021 Business Plan The following are SCM’s key objectives for FY2021:
• Continually review processes and revise/create as required to improve the efficiency and effectiveness of SCM operations
• Partner with key internal stakeholders to develop a strategy for Master Data Management cleanup for the Item Master and Vendor Master
• Reduce purchase card spending on inventory
• Establish a Supply Chain Governance Committee. This cross-functional committee will include representatives from all key SCM stakeholders who will discuss strategic Supply Chain initiatives
• Clearly define all roles, responsibilities, accountabilities, and key dependencies of the SCM organization
• Learn, pilot, and roll out new data forecasting methods until all SCM leadership achieves a base-level of understanding and comfortability
• Select and onboard a vendor for Vendor Managed Inventory program in a manner that allows SCM to transition from highly tactical to strategic
• Conclude integrated training for Maximo demand planning among SCM staff and select maintenance staff members
FY2020 Major Accomplishments
• Implemented inventory forecasting algorithm in Maximo across all storerooms, which resulted in nearly $1 million in cost savings after just the first 10 weeks. This represents a faster and deeper cost savings than projected; thus, boosting and expediting WMATA's ability to right-size its inventory footprint
• Advanced the Vendor Managed Inventory (VMI) RFP to solicitation, with intention to award
• Executed safety critical, timely actions to ensure adequate levels of globally high-in-demand PPE items were obtained for the Authority in response to Covid-19 challenges
• Staffed the recently created Office of Supply Chain Planning and Analytics (SCPA) through 3 levels; thus, enhancing SCM's ability to provide supply chain business intelligence across COO
• Actively engaged in BudgetSTAT, RailSTAT, BusSTAT and FacilitySTAT meetings to ensure supply chain solutions were in place to meet operational need
2018 2019 2020 2021 (Dollars in Thousands) Actual Actual Budget Budget $ Change % Change
Personnel $15,170 $15,296 $17,135 $16,897 ($237) (1.4%) Non-Personnel $1,515 $1,189 $2,161 $2,187 $26 1.2% Total Cost $16,685 $16,485 $19,296 $19,085 ($211) (1.1%)
Authorized Positions 169 181 180 193 13 7.2%

82
Chapter 3 – Operating Budget
Reliability Engineering and Asset Management
In October 2019, WMATA’s Executive Management Team decided to realign asset management and reliability engineering under the Chief Operations Officer. In doing so, they formed a new group called Reliability Engineering and Asset Management (REAM).
REAM’s formation centralizes the former Office of Reliability Centered Maintenance Planning and Transit Asset Management Office under a single functional group. A newly formed Vice President position will lead REAM, reporting directly to the Chief Operating Officer.
The creation of REAM captures the many synergies and efficiencies of closing and coordinating these individual elements and centralizing them under one function. The following offices designed to provide subject matter expertise will make up REAM:
• Reliability Engineering and Performance Analysis (REPA): Serves as the central office for reporting on reliability performance as well as facilitating Reliability Centered Maintenance analyses.
• Maintenance Planning and Scheduling (MPLN): Serves as the central office for providing maintenance planning and scheduling services.
• Transit Asset Management Office (TAMO): Serves as the central office for driving Asset Management initiatives and ensuring the Authority remains compliant with our federally mandated obligations.
FY2021 Business Plan The following are REAM’s key objectives over the coming two years:
• Establish the REAM group and ensure it has the resources required to function effectively
• Define all the roles, responsibilities, accountabilities, and key dependencies of the REAM organization
• Re-establish the Asset Management Steering Committee to communicate all Asset Management
initiatives as well as gain buy-in, prioritize and provide guidance on new requirements
• Set the foundations for introducing Industrial Internet of Things capability to WMATA
• Drive maintenance efficiency improvements through the targeted use of reliability centered maintenance analyses as well as improving the maintenance planning functions throughout operations
• Develop a training continuum for WMATA’s Enterprise Asset Management System (Maximo)
• Lead the effort to close all outstanding CAPs that are currently under TAMO’s responsibility
FY2020 Major Accomplishments
• Reorganized Metro’s various asset management and maintenance analytics functions under a centralized department Supported railcar maintenance in achieving the best railcar performance ever recorded, including a single-month record in February 2020 of traveling over 416,000 miles before causing a customer delay—beating the previous single-month record by 42 percent
• Established new asset-driven failure analysis methods for rail infrastructure groups, using Mean Time Between Failure and Mean Time Between Delay metrics to measure system reliability
• Delivered three courses on maintenance planning & scheduling, as well as Reliability Centered Maintenance (RCM3) technology to support reliability centered maintenance
• Continued progressing procurement of the 8000 series railcars, which will replace the almost 250 2000 and 3000 series railcars that are nearing the end of their useful life
2018 2019 2020 2021 (Dollars in Thousands) Actual Actual Budget Budget $ Change % Change
Personnel $2,390 $2,578 $3,652 $3,698 $46 1.3% Non-Personnel $159 $139 $287 $292 $5 1.7% Total Cost $2,549 $2,717 $3,939 $3,990 $50 1.3%
Authorized Positions - - - 38 38

Chapter 4 – Capital Projects
83
Chapter 4 - Capital Budget
Overview
Metro’s FY2021-2026 Capital Improvement Program (CIP) totals $9.8 billion with funding from the federal government, state and local contributions, and other sources. Of this amount, $1.8 billion is planned for investment in FY2021.
The six-year CIP is focused on system preservation and attainment of the state of good repair goals outlined in the Capital Needs Forecast (CNF). The plan also includes targeted investments to achieve the safety objectives described in Metro’s System Safety Program, drive operating efficiency, and enhance service reliability and the customer experience.
Metro’s capital program is grouped into six major Investment Categories: Railcar, Rail Systems, Track & Structures Rehabilitation, Stations & Passenger Facilities,
Bus & Paratransit, and Business Support. Each Investment Category is a group of Programs, which in turn includes groups of projects. Appendix D contains a page for each project in the capital program. Capital investments are organized within these categories into four functional classifications: Safety, State of Good Repair (SGR) & Minor Projects; Major Active Capital Projects; Development & Evaluation (D&E) Projects; and Future Major Projects.
These programs also include those initiated through oversight recommendations or identified as capital maintenance needs. Minor Projects that are not part of an on-going SGR program, but do not rise to the level of major projects in terms of scope and expenses, also fall into this investment type.

84
Chapter 4 – Capital Projects
Safety, State of Good Repair & Minor Projects Safety, SGR & Minor Projects are the largest investment types in the capital program. These categories include recurring and ongoing investments in the replacement, rehabilitation, and maintenance of existing assets to ensure the safety of Metro’s infrastructure and to improve the reliability of the system. Prioritization of assets for replacement or rehabilitation is accomplished using the age and condition of specific assets. Examples of ongoing investments include:
• Railcar component maintenance and rehabilitation
• New Metrobuses and paratransit vehicles
• Rail crosstie and track fastener replacement
• Track circuit replacement
• Power cable replacement
• Parking garage rehabilitation
• Station lighting and cooling programs
• Elevator and escalator repair, rehabilitation, and replacement
Major Active Capital Projects Major Active Capital Projects are large, multi-year construction and acquisition projects, such as the construction of a new maintenance facility or the acquisition of railcars. Several major capital projects are currently underway, including the following:
• New 8000–Series railcars
• Radio and wireless infrastructure upgrades
• Traction power upgrades to support additional 8-car trains
• Fare collection modernization
• Completion of the Silver Line extension
• Construction of a new station at Potomac Yard
• Replacement of Bladensburg and Northern Bus Facilities
• Metro office consolidation
• Rehabilitation of station platforms and other adjacent infrastructure
Financial Plan by Investment Category
FY2021 FY2022 FY2023 FY2024 FY2025 FY2026 6-Year
(Dollars in Millions) Budget Plan Plan Plan Plan Plan Total
Railcar $279.8 $257.3 $332.8 $346.6 $454.1 $565.2 $2,235.7 Rail Systems 164.7 131.2 162.8 153.3 146.5 132.4 $890.8 Track and Structure Rehabilitation 148.1 175.7 166.4 192.9 160.9 170.1 $1,014.0 Stations and Passenger Facilities 545.5 550.6 416.2 252.0 191.9 179.2 $2,135.3 Bus and Paratransit 207.8 225.4 292.5 313.2 284.3 215.7 $1,538.9 Business Support 475.4 550.2 217.5 235.5 242.9 227.3 $1,948.8 Total $1,821.2 $1,890.3 $1,588.2 $1,493.4 $1,480.6 $1,489.8 $9,763.5
Revenue Loss from Capital Projects $17.0 $23.8 $24.5 $25.2 $26.0 $26.7 $143.2 Debt Service - Dedicated Funding1 - 11.8 42.6 87.7 117.9 138.1 $398.1 Total Capital Program Cost $1,838.2 $1,925.8 $1,655.3 $1,606.3 $1,624.5 $1,654.6 $10,304.8 1. FY2021 debt service schedule updated to reflect actuals after 2020 Dedicated Funding debt issuance. FY2022-2026 debt service schedule for planning purposes only.

Chapter 4 – Capital Projects
85
Development & Evaluation
Metro’s D&E programs include activities that support the Authority’s capital investments which are still under evaluation or in planning and development as either a Major Capital Project or SGR program. The D&E process ensures capital investments are efficient and effective and project risks are mitigated prior to initiation or commitment. The D&E process also helps to ensure projects have clearly defined scopes, schedules, and cost estimates with appropriate consideration for risks and alternative solutions. Additional funding is allocated when initiatives are sufficiently developed to advance to the next stage.
For the FY2021-2026 CIP, Metro has included D&E funding for a wide range of initiatives that are planned to bolster the system beyond its current capital improvement projects. Full cost estimates for these prospective projects will be identified when the needs are fully developed into Major Projects. The following needs are highlighted examples of activities that are included in the FY2021-2026 program:
• Core station passenger circulation improvements
• Blue/Orange/Silver line corridor reliability and throughput evaluation
• Train control modernization
• Bus transformation strategy
• Station passenger circulation improvements
• Bus facility rehabilitation
• Transit signal prioritization
Future Major Projects Future Major Projects are those that advance past the D&E process and will be executed in the future.
Projects in this category include those that have advanced through D&E and are planned for future implementation or are deemed to be essential and will require additional investment once D&E process has completed.
Capital Priorities, Goals, and Strategy Metro has developed a more structured methodology for capital project prioritization to focus on addressing longstanding capital needs and targeting critical assets before they are in danger of failure. This process assigns priorities to proposed capital projects based on the investment’s impact on safety, performance, and alignment with Metro’s strategic goals.
Projects submitted for inclusion in the program are reviewed by purpose, scope, projected schedule, and cost. They are ranked against four factors: primary strategic goals, supplemental strategic goals, project
readiness for execution, and a review of available resources.
Alignment with Metro’s primary strategic goals are determined by current performance indicators impacting the following:
• Ridership
• Fire, life and safety and regulatory compliance
• Customer satisfaction
• Reliability
• Operational support
Projects or project elements that do not clearly address Metro’s primary strategic goals are reviewed to assess their alignment with the following supplemental strategic drivers:
• Repairing existing assets
• Public commitments
• Contracts issued to vendor
• Employee satisfaction
• Ease of access to Metro services
• Energy management and conservation
• Inspection and maintenance efficiency
• Ongoing preventive maintenance of assets
• Studies of current assets for improved efficiency

86
Chapter 4 – Capital Projects
Proposed projects are then reviewed to determine whether they are ready to move forward and begin execution in the near term (FY2021 or FY2022). Specifically, Metro considers whether the appropriate procurement requirements are in place to provide for near term mobilization, as well as adequate resources being available for project execution.
Once the preliminary capital program is established based on the above criteria, all projects are subject to a final review for alignment with projected budgetary resources, as well as conflicts or duplication of efforts across programs or investment categories.
As Metro implements one of the largest capital investment programs in the transit industry, the efficient use of funding is vital. Economical investment of capital funds means ensuring that Metro remains an affordable service provider, while promoting effective and efficient resource allocation and utilization. As important are Metro’s commitments to financial accountability and transparency in capital program management. Metro continues to refine its organizational structure and enhance internal procedures to ensure attainment of these principles.
Funding Sources The six-year capital funding plan for FY2021-2026 assumes Federal grant funding totaling $2.1 billion over six years, with $490 million in FY2021. This projection assumes formula programs remain at FY2019 levels and does not assume congressional reauthorization of the Passenger Rail Investment and Improvement Act (PRIIA), or any Federal PRIIA funding past FY2021. The State match to PRIIA, totaling $148.5 million per year, is assumed to continue, even if the federal program is not extended or replaced.
Excluding jurisdictional reimbursable projects and debt service paid in the Operations Budget, state and local direct capital contributions total $5.6 billion from FY2021-2026, with $918 million in FY2021. Dedicated funding of $500 million per year is planned, along with $148.5 million of State PRIIA. Formula match and system performance are limited to three percent growth annually and total $1.7 billion over the six-year period, with $268.4 million programmed in FY2021.
The capital budget also includes $88.7 million in locally requested reimbursable projects in FY2021, with $333 million in capital expenditure planned for the six-year period.
From FY2021-2026, $2.2 billion in debt will be issued for capital projects, with $342.2 million planned for issuance in FY2021.
Dedicated Funding was used solely for direct funding (pay-go) in FY2020. In FY2021, an estimated $500 million of Dedicated Funding will be used for pay-go.

Chapter 4 – Capital Projects
87
Financial Plan - Allocation of State and Local Contributions
FY2021 FY2022 FY2023 FY2024 FY2025 FY2026 6-Year
(Dollars in Millions) Budget Plan Plan Plan Plan Plan Total
Federal Funding Federal Formula Programs $321.1 $321.1 $321.1 $321.1 $321.1 $321.1 $1,926.6 Federal PRIIA 148.5 - - - - - $148.5 Other Federal Grants 20.0 4.4 2.8 3.0 2.8 2.8 $35.8
Total - Federal Grants $489.6 $325.5 $323.9 $324.1 $323.9 $323.9 $2,111.0
State and Local Funding Contributions: District of Columbia
Formula Match and System Performance $95.1 $99.2 $101.4 $105.2 $107.4 $108.8 $617.1 PRIIA 49.5 49.5 49.5 49.5 49.5 49.5 $297.0 Dedicated Funding Pay-Go 178.5 178.5 178.5 178.5 178.5 178.5 $1,071.0
Subtotal - District of Columbia $323.1 $327.2 $329.4 $333.2 $335.4 $336.8 $1,985.1
State of Maryland Montgomery County $45.0 $45.9 $47.6 $48.7 $50.5 $52.7 $290.4 Prince George's County 45.2 46.9 48.2 49.9 51.1 52.0 $293.2 Maryland PRIIA 49.5 49.5 49.5 49.5 49.5 49.5 $297.0 Maryland Dedicated Funding Pay-Go 167.0 167.0 167.0 167.0 167.0 167.0 $1,002.0
Subtotal - Maryland $306.7 $309.3 $312.2 $315.1 $318.1 $321.3 $1,882.6
Virginia City of Alexandria $12.4 $12.8 $13.1 $13.5 $13.9 $14.4 $80.2 Arlington County 22.6 23.0 23.9 24.4 25.4 26.6 $145.8 City of Fairfax 0.7 0.7 0.8 0.8 0.8 0.9 $4.6 Fairfax County 40.8 41.5 43.0 44.0 45.7 47.8 $262.8 City of Falls Church 0.8 0.8 0.8 0.8 0.9 0.9 $4.9 Loudoun County 5.8 5.6 6.0 6.0 6.4 7.1 $36.9 Virginia PRIIA 49.5 49.5 49.5 49.5 49.5 49.5 $297.0 Virginia Dedicated Funding Pay-Go 154.5 154.5 154.5 154.5 154.5 154.5 $927.0 Congestion Mitigation and Air Quality (CMAQ) 0.9 0.9 0.9 1.0 1.0 1.0 $5.7
Subtotal - Virginia $288.0 $289.3 $292.6 $294.5 $298.0 $302.6 $1,764.9
Jurisdictional Reimbursable
Jurisdiction Planning Projects $3.0 $3.0 $3.0 $3.0 $3.0 $3.0 $18.0 Silver Line - Metropolitan Washington Airports Authority (MWAA) 26.6 17.7 - - - - $44.3 Potomac Yard (Alexandria) 59.1 113.9 58.9 38.6 - - $270.4 Purple Line - Maryland Department of Transportation (MDOT) 0.1 0.2 - - - - $0.3
Subtotal - Jurisdictional Reimbursable $88.7 $134.8 $61.9 $41.6 $3.0 $3.0 $333.0 Total - State and Local $1,006.4 $1,060.7 $996.0 $984.3 $954.5 $963.6 $5,965.6
Debt $342.2 $539.6 $335.3 $298.0 $346.0 $367.0 $2,228.1
Grand Total Funding $1,838.2 $1,925.8 $1,655.3 $1,606.3 $1,624.5 $1,654.6 $10,304.8

88
Chapter 4 – Capital Projects
THIS PAGE INTENTIONALLY LEFT BLANK

Appendix A – Metro Profile
89
Appendix A - Metro Profile
Metro Introduction The Washington Metropolitan Area Transit Authority or Metro, was created in 1967 through an interstate compact among Washington, D.C. Maryland and Virginia. Construction of the Metrorail system began in 1969 and the first phase of Metrorail operation began in 1976.
Metro added a second transit service to its network in 1973 when, under direction from the United States Congress, it acquired four Washington-area bus systems and merged them to create Metrobus.
In 1994, as mandated by the Americans with Disabilities Act (ADA), Metro began providing MetroAccess paratransit service for people with disabilities who are unable to use the fixed route transit service.
Metro completed the originally planned 103-mile Metrorail system in 2001.
In 2004, Metro expanded the rail system, opening the Blue Line extension to Largo Town Center Station, as well as the NoMa-Gallaudet U station on the Red Line. These expansions increased the Metrorail system to 86 stations and 106 miles.
In March 2009, Metropolitan Washington Airports Authority (MWAA) started construction on the Silver Line, a 23-mile rail extension in Fairfax and Loudoun Counties in Virginia. Supported by a Full-Funding Grant Agreement from the Federal Transit Administration (FTA), toll and other revenues from funding partners, Phase 1 opened in 2014 with 11.6 miles and five new stations extending service to Tysons Corner and Reston. Phase 2, an additional 11.4 miles with six new stations, will provide service to Dulles International Airport and Loudoun County. Metro is actively ramping up to launch revenue service in spring 2021.

90
Appendix A – Metro Profile
Key Metro Facts • Metro’s service area size is approximately 1,500
square miles with a population of approximately four million people.
• Metro’s transit zone consists of the Washington D.C., the Maryland counties of Prince George’s and Montgomery, and the Northern Virginia counties of Arlington, Fairfax and Loudoun and the cities of Alexandria, Fairfax and Falls Church.
• Metrorail integrates approximately 118 miles of track, six rail lines, 91 stations and 1,284 railcars. Metrobus includes 10,687 bus stops throughout the region and 1,583 buses.
• Metro is the second busiest heavy rail transit system and the sixth largest bus network in the country.
• More than a quarter of the region’s property tax base is located within a half mile of a Metrorail station.
• More than half of the region’s jobs are located within a half mile of a Metro station or a Metrobus stop.
• More than half of Metrorail stations serve federal facilities and approximately one third of Metrorail’s peak period commuters are federal employees.
• Metro moves more than three times the amount of people each year as the region’s three major airports combined.
With the opening of revenue service for Silver Line Phase 2, Metro will welcome Loudoun County as a contributing jurisdiction. The Silver Line is Metro’s largest rail expansion project since the opening of the National Airport to Stadium-Armory segment in 1977.

Appendix A – Metro Profile
91
Oversight Oversight of Metro is provided by a variety of internal and external offices, committees, and administrations. These oversight entities include, but are not limited to, the FTA, the Washington Metrorail Safety Commission (WMSC), the Office of Inspector General (OIG), the Office of Internal Compliance (INCP), and various advisory entities.
Federal Transit Administration The FTA is the agency of the United States Department of Transportation that provides financial and technical assistance to local public transit systems. The FTA also oversees safety measures and helps develop next-generation technology research.
The Federal Government, through the FTA, provides financial assistance to develop new transit systems and improve, maintain, and operate existing systems. FTA provides and monitors grants to state and local transit providers.
Washington Metrorail Safety Commission (WMSC) The WMSC serves as Metro’s State Safety Oversight Agency (SSOA) and is responsible for enforcing transit safety requirements for WMATA’s Metrorail system. The creation of an SSOA was required by the Moving Ahead for Progress in the 21st Century Act (MAP-21).
In 2017, Washington D.C., Maryland and Virginia passed legislation to create the WMSC, which then received required Congressional consent and approval by the President through Public Law No: 115-54. The WMSC began directly overseeing the safety of the Metrorail system on March 18, 2019 upon its oversight program receiving federal certification.
Office of the Inspector General The OIG, authorized by the WMATA Board of Directors in April 2006 as an independent office that reports directly to the Board, supervises and conducts independent audits, investigations and reviews of Metro programs and operations to promote efficiency and financial integrity as well as to prevent and detect fraud, waste and abuse in such programs and operations.
Office of Internal Compliance INCP is a proactive business partner that assures Metro carries out its mission with integrity and in accordance with rules, regulations and policies. INCP reports directly to the General Manager/CEO and consists of two compliance offices, Quality Assurance, Internal Compliance and Oversight (QICO) and Management Audits, Risk and Compliance Office (MARC).
QICO provides independent reviews of Metro’s operational and engineering processes and assets to
promote compliance with internal and external regulatory requirements and advance quality improvement initiatives.
MARC provides independent, objective assessments and reviews of Metro's system of internal controls and underlying business processes with a focus on financial management and internal business operations.
Advisors Metro has four primary advisory groups: the Riders’ Advisory Council (RAC), the Accessibility Advisory Committee (AAC), the Amplify community and the Joint Coordinating Committee (JCC). These advisory entities focus on specific issues as described below:
Riders’ Advisory Council In September 2005, the Metro Board of Directors established RAC. The Council provides Metro customers a forum to give input on Metrobus, Metrorail and paratransit services. The 11-member council includes six representatives from the Washington D.C., Maryland and Virginia, four at-large members, and the chair of Metro’s Accessibility Advisory Committee.
Accessibility Advisory Committee Metro’s AAC was created to address the needs of senior citizens and customers with disabilities. Its efforts have resulted in numerous service upgrades including gap reducers, which make it easier for customers who use wheelchairs or are visually impaired to board Metrorail trains.
Amplify by Metro Metro is leveraging a new web-based platform called Amplify to engage and get input from riders in the community. Metro's first ever customer community, Amplify is designed to bring together riders, transit advocates, and transit experts in an on-going digital forum. Through a structured environment of online surveys, polls, and discussion forums, Amplify community members share their experience as riders and influence how Metro responds to issues affecting those who use the system. People who live in the national capital region and (at least once a month) ride any bus, train, or on paratransit can sign up to participate at amplifybymetro.com.
Joint Coordinating Committee The JCC consists of staff members from the jurisdictions supporting Metro. The JCC was established by the Metro Board of Directors to facilitate the exchange of information between jurisdictions and Metro staff. Meeting agendas are developed by Metro staff and the JCC chair and include items referred by the Board or Metro staff, as well as items requested by JCC members.

92
Appendix A – Metro Profile
Metrorail
The Metrorail system is a rapid transit system that consists roughly of 118 route miles, 91 passenger stations and a fleet of over 1,200 railcars. Starting in FY2021, service will operate 5:00 am to 12:00 am Monday through Thursday, 5:00 am to 2:00 am on Fridays, 7:00 am to 2:00 am on Saturdays, and 8:00 am to 11:00 pm on Sundays.
The system is composed of three main types of structures: underground, surface and elevated. The underground sections consist of 50.5 route miles and 47 stations, the surface sections comprise 58 miles and 38 stations, and the elevated sections consist of 9.2 route miles and six stations. While there are three types of structures, they operate as one unified system providing seamless service to passengers. All Metrorail stations and railcars are accessible to disabled passengers and compliant with ADA standards.
The first Metrorail line opened was the Red Line consisting of 4.6 miles from Farragut North to Rhode Island Avenue. By July 1977, the Blue and Orange Lines were added with service between National Airport and the Stadium-Armory. This added 11.8 miles and 17 new stations to Metro’s rail operation. With continued development the Yellow Line was added in 1983 with service from Gallery Place-Chinatown to the Pentagon, adding 3.3 miles and one station. In 1991, the Green Line was added providing service from Gallery Place to U St / African-American Civil War Memorial / Cardozo. In 2001, the Green Line was extended to Branch Avenue, and in 2004, the Blue Line was extended to Largo Town Center and the NoMa-Gallaudet station on the Red Line opened to passengers. The table below provides a list of all openings.
The system is equipped with communication systems that facilitate the flow of information to and from passengers. The Metrorail operations control center is equipped with two-way radios for communication with all train operators in service, as well as hotlines to the police and fire departments in all the jurisdictions served by Metro. Public address systems on all trains and platforms facilitate communications from Metrorail train operators and station managers. All stations are also equipped with digital signs that show next train arrival times and system status.
Passenger-to-train operator intercoms are located inside all rail cars, one at each end, and there are passenger-to- station manager intercoms on all station platforms, landings, and in all elevators. The ongoing radio infrastructure renewal and cellular communications project will upgrade Metro’s radio system for Metro workers and first responders and provide cellular capability throughout the tunnels and in stations for customers.
Metrorail’s design requires high reliance on vertical mobility through the utilization of elevators and escalators. Most customers access Metrorail via escalators to the train platform, while elevators provide accessibility for persons with disabilities, seniors, customers with strollers, travelers carrying luggage and other riders.
Metro operates more than 900 vertical transportation assets (618 escalators and 317 elevators) which carry approximately two million passengers each weekday. The Wheaton station on the Red Line has the longest escalator (230 feet) in the Western Hemisphere. The Forest Glen station, also on the Red Line, is the deepest station in the system (196 feet or 21 stories below street level) with high speed elevators that take less than 20 seconds to travel from the street to the platform.

Appendix A – Metro Profile
93
Sequence of Metrorail Openings
Line Segment Stations Miles Date Red Farragut North to Rhode Island Ave 5 4.6 03/29/1976 Red Gallery Place - Chinatown 1 0 12/15/1976 Red To DuPont Circle 1 1.1 01/17/1977 Blue/Orange National Airport to Stadium-Armory 17 11.8 07/01/1977 Red To Silver Spring 4 5.7 02/06/1978 Orange To New Carrollton 5 7.4 11/20/1978 Orange To Ballston - MU 4 3 12/01/1979 Blue To Addison Road 3 3.6 11/22/1980 Red To Van Ness - UDC 3 2.1 12/05/1981 Yellow Gallery Place - Chinatown to Pentagon 1 3.3 04/30/1983 Blue To Huntington 4 4.2 12/17/1983 Red To Grosvenor 5 6.8 08/25/1984 Red To Shady Grove 4 7 12/15/1984 Orange To Vienna/Fairfax-GMU 4 9.1 06/07/1986 Red To Wheaton 2 3.2 09/22/1990 Green To U St/African-Amer Civil War Memorial/Cardozo 3 1.7 05/11/1991 Blue To Van Dorn Street 1 3.9 06/15/1991 Green To Anacostia 3 2.9 12/28/1991 Green To Greenbelt 4 7 12/11/1993 Blue To Franconia-Springfield 1 3.3 06/29/1997 Red To Glenmont 1 1.4 07/25/1998 Green Columbia Heights to Fort Totten 2 2.9 09/18/1999 Green To Branch Ave 5 6.5 01/13/2001 Red NoMa-Gallaudet U 1 0 11/20/2004 Blue To Largo Town Center 2 3.2 12/18/2004 Silver To Wiehle-Reston East 5 11.6 07/26/2014
Metrobus
Metrobus provides safe, reliable and effective service across the Washington region. Metrobus operates 159 lines with 245 routes covering over 2,396 street miles of service throughout the region. Service is provided on a combination of local, limited-stop (MetroExtra) and express routes connecting the region to Metrorail; employment, medical and activity centers; schools, colleges and universities; airports; military installations; and commuter rail. Metro utilizes 10,649 bus stops supported by 2,554 shelters owned by 15 separate agencies.
The fleet is comprised of 1,583 buses to meet peak weekday service requirements of 1,278 buses with varying sizes and capacities, and to support maintenance of the fleet.
All buses are accessible to people with disabilities, and bike racks are available for use on all buses. Service is provided from ten operating divisions located throughout the service area in Washington D.C. and Virginia.
The BusETA service provides customers information on Metrobus arrival times at a particular bus stop. It uses satellite technology to find specific locations of a bus and sends the estimated arrival time of the bus to customers via mobile devices.
The entire bus fleet is equipped with two- way radio links to the operations control center, emergency radio silent
alarms, passenger counters, and automatic vehicle locators. In addition, security cameras are installed on all Metro buses. Metrobus is working to install operator safety shields on all legacy Metro fleet; safety shields are included on all new buses.

94
Appendix A – Metro Profile
MetroAccess MetroAccess ensures the ongoing accessibility of Metrobus and Metrorail for customers with disabilities, and in accordance with ADA standards, provides MetroAccess paratransit service for those who are unable to use Metrobus and Metrorail. MetroAccess, a shared-ride, door-to-door service, is offered for the same days, hours, and locations as fixed-route transit, utilizing a fleet of 775 vehicles in FY2021. Service contractors operate the van service and manage the operations control center and quality assurance functions. MetroAccess provides over two million trips each year.
Demand for paratransit service is increasing, as the population of people with disabilities is growing in the region and nationwide. For this reason, it is critical for Metro to accommodate as many customers as possible. Metro provides travel training to assist customers with disabilities in navigating the Metrobus and Metrorail system, while encouraging customers to take full advantage of the many accessibility and safety features. MetroAccess partners with Metrobus and Metrorail to provide group orientations and workshops to educate organizations on how to provide travel training to their clients.
Additionally, Metro has partnered with the jurisdictions to improve the accessibility of bus stops in the region, further enhancing customers’ ability to make use of the fixed-route system. Because of these initiatives and Metro’s free ride benefit, MetroAccess customers take over 2.3 million fixed-route trips each year.
To keep MetroAccess sustainable for future years, Metro has embarked on a campaign to facilitate the establishment of lower-cost alternatives to MetroAccess. Metro is helping to facilitate the following programs:
• Coordinated Alternatives to Paratransit Services (CAPS), established in 2013, provides transportation service for clients of two human services agencies (HSA) in Maryland between the HSAs main facilities and clients’ homes. Service provided under the CAPS project costs Metro 32 percent less per trip than a comparable trip on MetroAccess.
• TransportDC, a taxi alternative to MetroAccess for Washington D.C. residents was set up in 2014. Under TransportDC, a jurisdiction-run service, the District is paying 44 percent less per trip than they would have paid Metro for providing the same trips on MetroAccess.
• Abilities-Ride, which started in the first quarter of FY2018, is a public-private partnership between Metro and two vendors to provide generally available on-demand and reserve trip service to MetroAccess customers for trips beginning and ending in Maryland. The program is designed to be
an alternative for a portion of Maryland-to-Maryland MetroAccess trips. Trips provided by the program are expected to cost Metro up to 60 percent less than comparable MetroAccess trips.
Regional Transit Planning The Washington Metropolitan Area encompasses over 4,000 square miles in Washington D.C., suburban Maryland and Northern Virginia; the region is home to almost six million people and over three million jobs. As the primary transit provider in the region, Metro is integral to the regional transportation planning process. The WMATA Compact gives the Authority the power to adopt a Mass Transit Plan as part of the region’s continuous, comprehensive transportation planning process. Metro’s regional planning function encompasses the preparation of transit system plans in partnership with other regional transit providers, conducting system planning analysis and transportation studies, communication of transit needs to regional planning bodies, and participation in planning processes at the regional and sub-regional levels. Metro has a special responsibility to ensure that the needs of the region’s transit providers, both capital and operating, are reflected during the establishment of the Mass Transit Plan and that the region achieves a balanced system of transportation.
Metro coordinates with its regional partners to determine transit-based priorities and projects. The Metro Board of Directors, composed of members from the Compact jurisdictions and federal government, helps determine those priorities and provides policy direction. The JCC brings together jurisdictional staff to coordinate on various budget and operational issues in conjunction with Board Committee meetings. Internal planning and programming are designed to work within this institutional framework.
The National Capital Region Transportation Planning Board (TPB) is the federally designated Metropolitan Planning Organization (MPO) to coordinate transportation planning and funding for the Washington region. The TPB serves as a forum for the region to develop transportation plans, policies and actions, and to set regional transportation priorities through the Constrained Long-Range Plan (CLRP) and the six-year Transportation Improvement Plan (TIP). The TPB also provides technical resources for planning and policy making. WMATA is one of the implementing agencies in the TPB planning process and is a voting member of the TPB. WMATA is also an active member of the TPB Technical Committee and several subcommittees such as Travel Forecasting, Bicycle and Pedestrian, Regional Bus, Regional Transportation Demand Management Marketing, and Human Services Subcommittee.
The Northern Virginia Transportation Commission (NVTC) administers transit finance and operations in Northern Virginia and coordinates transit service across jurisdictional boundaries. The Northern Virginia Transportation Authority (NVTA) is responsible for

Appendix A – Metro Profile
95
developing a Northern Virginia Regional Transportation Plan which provides long range planning and inter-agency coordination in Northern Virginia. Metro works with both NVTC and NVTA on important transit funding and corridor development initiatives to enhance public transit service and ensure integration of transit in highway investments and the Department of Transportation (DOT). Metro also works with Washington D.C., Maryland, and Virginia on important local plans and project development initiatives to enhance public transit service and ensure integration of transit with roadway investments.
Demographics Based on the 2010 Census, the population of the Compact jurisdictions currently served by Metro is 3.9 million people across four counties (Montgomery and Prince George’s in Maryland, Fairfax and Arlington in Virginia), three cities (Alexandria, Falls Church, and Fairfax in Virginia), and one federal district, which is the ninth largest metropolitan area of the country.
Based on the 2014 American Community Survey (ACS), the demographic profile of the Washington Metropolitan area is as follows:
• 41.1 percent of the population is non-Hispanic white
• 29.3 percent is black or African American
• 15.5 percent is Hispanic or Latino
• 10.9 percent is Asian
• 3.2 percent is Mixed-Other
Economy Metro’s ridership and overall financial outlook are directly influenced by the population, economic conditions, and employment growth in Washington D.C. and the surrounding jurisdictions in Maryland and Virginia. Covid-19 has had significant global, national and regional impacts, and the full extent and duration of these impacts remains uncertain.
Job Growth in Metropolitan Washington According to a May 2016 study by the Metropolitan Washington Council of Governments (COG) Trends in Workforce Demand, while metropolitan Washington has a skilled and educated workforce, there have been concerns in the last few years about the region’s economic performance. As other regional economies
began to recover from the Great Recession, job growth in metropolitan Washington began to slow. Between the elimination of federal jobs with the enactment of the Budget Control Act of 2011 and loss of federal contracts in the first year of the sequester in 2013, an estimated thirty-six thousand jobs were lost.
According to data from the Bureau of Labor Statistics' Current Employment Statistics (CES) program, employment growth in metropolitan Washington lagged the nation from 2012 through 2015 and was equal to the national average in 2016 and 2017. The 2018 CES estimates indicate that metropolitan Washington employment growth (1.1 percent) has again fallen below the national average.
The 2015 estimates from the Bureau of Labor Statistics’ Current Employment Statistics program indicate that while employment increased at the greatest rate (1.9 percent) in a decade in metropolitan Washington, performance is still lagging the nation.
Changing Federal Presence The Federal Government is the largest employer in the region; since 2000, between 11 and 13 percent of employment in metropolitan Washington has been federal. But the structure of the regional economy is changing. COG’s regional econometric model projects that the portion of federal employment will decline from twelve percent of employment in 2015 to eight percent in 2045. The Center for Regional Analysis at George Mason University projects that while federal salaries and procurement comprised almost 40 percent of the region’s economy in 2010, it is forecast to decline to just under 30 percent by 2020.
Where is Metropolitan Washington’s Economy headed? The economic factors of slow job growth and the future outlook of federal government spending impact Metro’s forecast for Metrorail and Metrobus ridership. Significant effort is currently underway to diversify metropolitan Washington’s economy. Due to slow growth in federal jobs, the Roadmap for the Washington Region’s Economic Future identified industrial clusters beyond the federal government with the potential to drive metropolitan Washington’s economic growth over the next decade. Two of these drivers are professional and business services, which have dominated the region’s economy for a long time.

96
Appendix A – Metro Profile
THIS PAGE INTENTIONALLY LEFT BLANK

Appendix B – Budget Process
97
Appendix B - Budget Process Metro’s annual budget serves as the foundation for its financial planning and control. The General Manager/Chief Executive Officer (GM/CEO), Chief Financial Officer, and staff prepare and submit the budget to the Metro Board of Directors for consideration and approval. The annual budget consists of two components: operating and capital. It is the responsibility of each department to administer its operations in such a manner to ensure the use of the funds is consistent with the goals and programs authorized by the Board and approved spending levels are not exceeded. Metro’s budget planning begins in August of the preceding fiscal year with the development of budget priorities and assumptions for the plan year.
The budget must be adopted and implemented by June 30th for the fiscal year beginning on July 1st. The budget process consists of six major phases:
1. Development of key assumptions and drivers, model preparation, and budget formulation which includes department submissions;
2. Budget review/justification;
3. GM/CEO’s presentation of the proposed budget to the Board;
4. Board discussions, public hearings and outreach;
5. Budget adoption by the Board; and
6. Budget implementation.

98
Appendix B – Budget Process
Budget Development and Departmental Submissions Metro began the process of developing the FY2021 budget shortly after the adoption of the FY2020 Approved Budget. As part of the budget development process, FY2020 Budget with specific programmatic changes were used as the FY2021 baseline for budgeted non-personnel related costs. Current position data and benefits obligations were used as the baseline for budgeted personnel related costs. The FY2020 Approved Budget and the FY2019 actuals were then analyzed, and relevant assumptions were modified, including contractually obligated union wages and benefits, fuel prices and revenues. Based on the analysis of the data, Metro assigned targets to each department.
Using the Strategic Plan framework, the GM/CEO’s Business Plan further guides both the Operating and Capital budget development processes. It identifies priorities for Metro, provides the foundation for department-specific work plans and keeps the agency focused on the long-term goals as outlined in the Strategic Plan. The GM/CEO’s Business Plan outlines necessary actions to achieve priorities; provides measures to monitor success and provides the Board and public with a transparent and accountable framework. The priorities are reflected in the resulting proposed budget and multi-year operating and capital investment plans.
The Office of Management and Budget (OMB) staff develops guidelines and assumptions in line with the General Manager’s priorities and plans that drive the budget process. These guidelines and assumptions are incorporated into the department budgets.
• The initial planning, development of assumptions, and preparation of instructions and training materials are conducted in August.
• The annual budget kickoff meeting is held in September with department leaders and budget preparers. New budget initiative requests are developed.
• The department’s operating and capital budget requests are developed, reviewed, approved at the department level and submitted to OMB and the Department of Strategy, Planning and Program Management (SPPM) in mid-October.
The annual budget is developed on the basis of two budget methodologies – continuation-level and zero- based. Continuation-level budgeting is used to develop the funding and resources necessary to sustain multi-year critical operating, special programs, and previously approved capital projects.
The agency utilized a hybrid zero-based budgeting approach for the development of the FY2021 operating budget. The zero-based approach was used to determine
resources for on-going general and administrative expenses, new programs and capital projects.
Budget Review and Proposal • The proposed CIP is developed concurrently with
the proposed operating budget. Starting in July, project managers are asked to initiate project requests for the upcoming fiscal year. Initiation requests come from the CNF, fleet management and asset management plans, among other documents. In the fall, the Capital Program Advisory Committee (CPAC) reviews project initiation requests and creates a prioritized program of projects. Funding constraints are then applied to the prioritized program of projects and presented to the Executive Management Team (EMT) and GM/CEO for their review.
• Operating and capital budget requests are reviewed by OMB, SPPM and the EMT. The proposed budget recommendations are presented to the GM/CEO in the second quarter of the fiscal year.
• Once the GM/CEO finalizes the annual budget proposal and multi-year plans, they are presented to the Board of Directors and the public through the Finance and Capital Committee.
Budget Discussion and Adoption • The proposed budget is presented and reviewed in
the Finance and Capital Committee and the Board deliberates through early spring.
• Metro undertakes significant outreach efforts regarding the budget, particularly for any proposed service and fare changes, prior to adoption. The outreach occurs in three key areas:
• Public hearings: During the budget process, Metro holds at least one public hearing to review any proposed service or fare changes, as well as the proposed use of federal funding in the CIP.
• The comments and feedback received from residents throughout the region are presented to the Board for consideration.
• Public participation: Metro’s Public Participation Plan guides substantial additional outreach efforts beyond the public hearings through open houses, station pop-ups, and community events. The outreach provide specific and convenient opportunities for riders and local organizations to provide input and discuss their views. It ensures full and fair participation for all potentially affected communities, including minority, low-income, and limited English proficient populations.

Appendix B – Budget Process
99
• Rider survey: Also, Metro periodically conducts online surveys to solicit rider input on key questions regarding the budget.
• Metro staff summarizes data collected from these efforts, as well as all public comments/feedback received during the outreach process in a staff report that is delivered to the Board for review.
• Collectively, Metro’s outreach efforts meet or exceed the requirements of both the WMATA Compact and the Federal Transit Administration’s Title VI guidelines.
Amendments When necessary, amendments to the budget are presented to the Finance and Capital Committee. The committee then advances the amendments to the Board for review and adoption.
Budget Implementation • Implementation of the Approved Budget occurs
between May and June.
• The FY2021 Approved Budget is effective July 1, 2020.
• Monthly budget variance reports are prepared by OMB to enable management to monitor and control expenses and revenues.
• Quarterly financial reports are prepared by OMB and presented by Metro management to the Board of Directors.
• These reports are used to monitor financial performance and ensure compliance with the approved budget.
The underlying financial statements that inform this budget process have been prepared in accordance with Generally Accepted Accounting Principles (GAAP) per the Governmental Accounting Standards Board (GASB) Statement No. 34 (Basic Financial Statements and Management’s Discussion and Analysis - for State and Local Governments). All financial information is consolidated into business-type activities that make up Metro’s Enterprise Fund. These businesses-type activities include transit operating and capital costs, infrastructure construction and debt activities. The budget is based on the provisions of GAAP, as applicable to government entities in the United States of America. Annual budgets are adopted in accordance with GAAP with the following exceptions:
• Depreciation and amortization are excluded.
• Net actuarial determined post-employment benefit obligation recognized under GASB Statement No. 45, which was implemented by Metro in FY2008, has been excluded from the budget expenses; such
costs are included in operating expenses in the annual financial statements but are not budgeted.
In accordance with the Financial Standards, OMB monitors revenues and budget expenditures throughout the fiscal year.
Enterprise Fund The Enterprise Fund is the sole fund for Metro. Within this Fund, income sources are classified in one of seven categories: passenger fares and parking fees, federal funds, state and local funds, dedicated funding, business revenues, other sources and debt. Passenger fares and parking fees support the operating budget. Federal funds consist of federal grants and funds to support the capital program. State and local funds support the capital program, as well as jurisdictional contributions for debt service and the operating budget subsidy. Annual dedicated capital funding of $500 million was established in 2018 under legislation passed by Washington D.C. Maryland and, Virginia. Business revenues include advertising and joint development, among other funding sources.
Balanced Operating Budget Metro is required to adopt an operating budget, annually, where operating revenues and subsidies equal expected operating expenses for the fiscal year. In accordance with Article VIII of WMATA’s Compact, the Board annually adopts a current expense budget for each fiscal year. Based on the Compact, the budget includes the Board's estimated expenditures for administration, operation, maintenance and repairs, debt service requirements and payments into any required funds.
The total expenditures are balanced with estimated revenues and receipts from all sources, excluding funds included in the capital budget or otherwise earmarked for other purposes. In Board Resolution 2020-09, which adopted the FY2021 Budget, the Board revised its policy regarding budget surplus and shortfall in order to comply with Dedicated Funding legislation. As such, WMATA will retain any surplus and will be responsible to address any shortfall in funding.
The focus of the operating budget is on the personnel, material/supplies and services necessary to operate Metrobus, Metrorail, and MetroAccess. Budgetary issues for the operating budget pertain to the cost of continuing operations, expanding services to meet growing demand, and improving efficiency of service.
Capital Budget In accordance with Article VIII, paragraph 26 of WMATA’s Compact, the Board adopts an annual capital budget. This budget identifies capital investments by category that are expected to commence or continue during the budget

100
Appendix B – Budget Process
period. The budget provides the planned funding sources for the program.
The primary focus of the capital budget is safety and the condition of Metro’s current assets and infrastructure, and what is needed to maintain them in a state of good repair. The capital budget makes the reliable, continuous and safe operation of each mode (Metrobus, Metrorail and MetroAccess) possible.
Capital Expenditures Capital expenditures are those that will lead to a future benefit beyond the current fiscal year. Expenditures are classified as capital when an entity spends money either to procure or construct fixed assets, or to improve and extend the useful life of an existing fixed asset.
The capital programming process assists Metro’s leadership in making decisions regarding the assets and infrastructure required to support and/or grow the bus, rail, and paratransit operations. Metro’s assets and infrastructure include, but are not limited to:
• Buses
• Railcars
• Stations and tunnels
• Track and wayside
• Signal and power systems
• Administration and maintenance facilities

Appendix C – Human Capital Summary
101
Appendix C - Human Capital Summary
Human capital management defines and categorizes employees' skills and abilities to ensure they are optimized to the objectives of the organization. At Metro, the management of human capital involves workforce planning and investment and is aligned with Metro's strategic plan and core mission of operating and maintaining a safe, reliable, and affordable transit system.
One measure of human capital is the number of positions to be employed and the various costs associated with such employment, referred to as personnel costs. Metro's personnel costs fall into three categories: labor, fringe benefits, and capital allocation. Capital allocation is a net zero between operating and capital.
Labor costs, which include regular wage and overtime pay for operations employees and salary expense for management, professional, and administrative personnel, make up approximately 67 percent of total personnel costs. The Authority-wide FY2021 labor budget for operating and capital is $1.2 billion.
Fringe benefit costs are personnel-related expenses that are above and beyond the direct cost of employee wages and salaries. Metro's fringe benefits are comprised of health insurance and pension plan costs, as well as government mandated expenses including unemployment insurance and payroll taxes. The Authority-wide FY2021 fringe benefit budget for operating and capital is $564.1 million. The FY2021 fringe benefit budget is $33.2 million or 6.2 percent more than the FY2020 budget primarily due to fringe associated with additional positions for Silver Line Phase 2 and capital programs, as well as increased costs for union pensions and health care.
The following tables provide a detailed, four-year comparison of total human capital staffing levels for Metro. The staffing requirement for FY2021 is 12,903, consisting of 11,297 operating positions and 1,606 capital positions.

102
Appendix C – Human Capital Summary
Human Capital by Department
FY2019 FY2020 FY2021 Budget Budget Budget² Change
General Manager/CEO 3 3 3 - Inspector General 38 40 44 4 Board Secretary 4 4 4 - External Relations 112 112 111 (1) Internal Business Operations 542 583 616 33 Chief Financial Officer 248 253 244 (9) Internal Compliance 64 64 74 10 General Counsel 48 46 44 (2) Safety & Environmental Management 74 73 87 14 Capital Planning and Program Management 75 73 - (73) Capital Delivery - - 357 357 Strategy Planning and Program Management - - 115 115 Chief Operating Officer 11,052 10,974 11,204 230 Chief Operating Officer - Administration 10 10 5 (5) Rail Services 4,072 4,118 4,341 223 Bus Services 3,880 3,739 3,731 (8) Access Services 50 49 47 (2) Metro Transit Police 694 694 731 37 Facilities, Systems & Vertical Transportation Maintenance 1,602 1,594 1,811 217 Design and Construction 352 351 - (351) Office of Budget, Performance and Planning 211 239 307 68 Supply Change Management 181 180 193 13 Reliability Engineering and Asset Management - - 38 38 Total1 12,260 12,225 12,903 678
1. Authorized positions include total positions funded under the operating and capital budgets based on Metro's organizational structure at the time of the presented budget.
2. Authorized positions in FY2021 include 493 positions to support Silver Line Phase 2 operations.

Appendix C – Human Capital Summary
103
A three-year comparison of total human capital costs in the operating and capital budgets is presented below.
Human Capital Summary - All Modes, Fringe Data
FY2019 FY2020 FY2021
(Dollars in Millions) Budget Budget Budget Change
Positions 12,260 12,225 12,903 678 Labor $1,109.9 $1,109.0 $1,168.3 $59.2 Fringe
Taxes - FICA $83.8 $83.7 $88.4 $4.8 Pension - Defined Benefits 163.3 184.8 195.8 11.0 Pension - Defined Contributions 12.1 11.1 11.8 0.7 Health Care 227.8 207.3 220.9 13.6 Life Insurance 2.1 1.8 1.9 0.1 Long Term Disability Insurance 1.2 1.2 1.2 0.1 Taxes - Unemployment 1.2 1.2 2.1 0.8 Workers' Compensation Reserve and Assessment 32.6 35.6 37.7 2.0 Allowances (Uniform, Clothing, Tools, etc.) 4.6 4.2 4.3 0.1
Total Fringe Benefits $528.9 $530.9 $564.1 $33.2
Human Capital Summary - Rates
FY2019 FY2020 FY2021
Budget Budget Budget $ Change
Average Annual Pay $90,532 $90,719 $90,540 ($179) Average Full Fringe Cost 43,142 43,429 43,717 288 Full Fringe Rate 47.7% 47.9% 48.3%

104
Appendix C – Human Capital Summary
THIS PAGE INTENTIONALLY LEFT BLANK

Appendix D – Capital Projects
105
Appendix D - Capital Projects The capital project pages in Appendix D are in sequential numerical order. The tables below indicate how the capital projects are grouped by Investment Category and Program.
Program/Project # Project Name
Investment Category: Railcar
Acquisition CIP0059 8000 Series Railcar Procurement CIP0256 7000 Series Railcars Procurement CIP8001 D&E Rail Car Replacement CRB0019_19 Silver Line Phase 1 Railcars CRB0020_01 Silver Line Phase 2 Railcars
Maintenance & Overhaul CIP0063 Railcar Rehabilitation Program CIP0067 Rail Car Safety & Reliability Improvements CIP0142 Railcar Preventive Maintenance
Maintenance Facilities CIP0145 Station and Yard Security Upgrades CIP0204 Railcar Rooftop Access Platforms CIP0225 Railcar Heavy Repair and Overhaul Facility CIP0283 Railcar Maintenance Facility SGR Program CIP0284 Yard Facility Rehabilitation CIP8005 D&E Rail Yard Improvements
Investment Category: Rail Systems
Propulsion CIP0076 Rail Power Infrastructure Upgrades CIP0252 Alternating Current (AC) Power Systems SOGR CIP0253 Traction Power SOGR CIP0286 Generator System Replacement
Signals & Communications CIP0136 Radio Infrastructure Replacement CIP0251 Automatic Train Control SOGR CIP0257 Emergency Trip Station Infrastructure CIP0260 Track Inspector Location Pilot CIP0350 Remote Terminal Unit (RTU) Reliability Project CIP8009 D&E ATC & Communications Improvements CIP8010 Automatic Train Control (ATC) Next Generation Implementation
Investment Category: Track and Structures Rehabilitation
Fixed Rail CIP0024 Track and Structures Rehabilitation CIP0025 Track Maintenance Equipment CIP0246 General Engineering Support CIP0247 Emergency Construction Support CIP0261 Tunnel Light Improvements CIP8011 D&E Fixed Rail Improvements
Structures CIP0262 Tunnel Water Leak Mitigation CIP0291 Tunnel Ventilation CIP0294 Bridge Rehabilitation CIP0348 Minnesota Avenue Aerial Structure Rehabilitation CIP0349 Grosvenor Aerial Structure Improvements CIP8013 D&E Track Structures Improvements CIP8014 Yellow Line Portal Tunnel Remediation
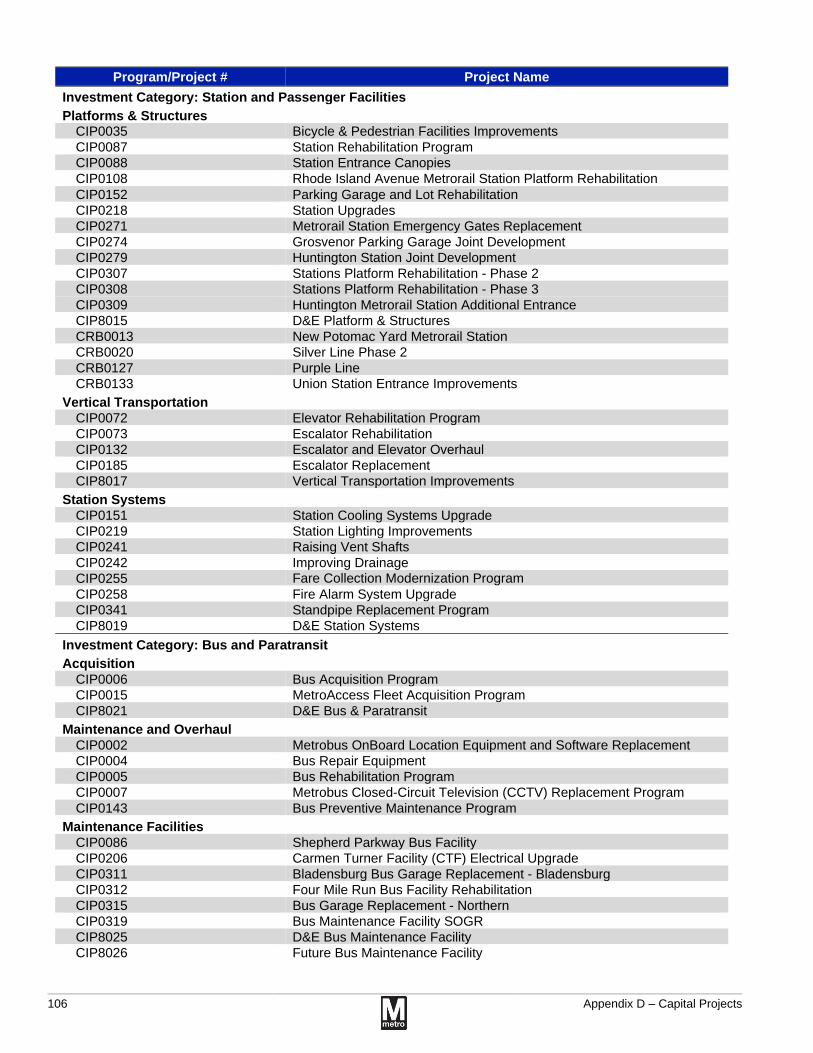
106
Appendix D – Capital Projects
Program/Project # Project Name
Investment Category: Station and Passenger Facilities Platforms & Structures
CIP0035 Bicycle & Pedestrian Facilities Improvements CIP0087 Station Rehabilitation Program CIP0088 Station Entrance Canopies CIP0108 Rhode Island Avenue Metrorail Station Platform Rehabilitation CIP0152 Parking Garage and Lot Rehabilitation CIP0218 Station Upgrades CIP0271 Metrorail Station Emergency Gates Replacement CIP0274 Grosvenor Parking Garage Joint Development CIP0279 Huntington Station Joint Development CIP0307 Stations Platform Rehabilitation - Phase 2 CIP0308 Stations Platform Rehabilitation - Phase 3 CIP0309 Huntington Metrorail Station Additional Entrance CIP8015 D&E Platform & Structures CRB0013 New Potomac Yard Metrorail Station CRB0020 Silver Line Phase 2 CRB0127 Purple Line CRB0133 Union Station Entrance Improvements
Vertical Transportation CIP0072 Elevator Rehabilitation Program CIP0073 Escalator Rehabilitation CIP0132 Escalator and Elevator Overhaul CIP0185 Escalator Replacement CIP8017 Vertical Transportation Improvements
Station Systems CIP0151 Station Cooling Systems Upgrade CIP0219 Station Lighting Improvements CIP0241 Raising Vent Shafts CIP0242 Improving Drainage CIP0255 Fare Collection Modernization Program CIP0258 Fire Alarm System Upgrade CIP0341 Standpipe Replacement Program CIP8019 D&E Station Systems
Investment Category: Bus and Paratransit
Acquisition CIP0006 Bus Acquisition Program CIP0015 MetroAccess Fleet Acquisition Program CIP8021 D&E Bus & Paratransit
Maintenance and Overhaul CIP0002 Metrobus OnBoard Location Equipment and Software Replacement CIP0004 Bus Repair Equipment CIP0005 Bus Rehabilitation Program CIP0007 Metrobus Closed-Circuit Television (CCTV) Replacement Program CIP0143 Bus Preventive Maintenance Program
Maintenance Facilities CIP0086 Shepherd Parkway Bus Facility CIP0206 Carmen Turner Facility (CTF) Electrical Upgrade CIP0311 Bladensburg Bus Garage Replacement - Bladensburg CIP0312 Four Mile Run Bus Facility Rehabilitation CIP0315 Bus Garage Replacement - Northern CIP0319 Bus Maintenance Facility SOGR CIP8025 D&E Bus Maintenance Facility CIP8026 Future Bus Maintenance Facility

Appendix D – Capital Projects
107
Program/Project # Project Name
Passenger Facilities and Systems CIP0220 Metrobus Planning Program CIP0221 Bus Customer Facility Improvements CIP0266 Historic Bus Terminal Rehabilitation CIP0275 New Carrollton Bus Bays Joint Development CIP0322 Bus Passenger Fac./Systems Future Major Projects CIP0326 Real-Time Bus and Rail Data Feed Development
Investment Category: Business Support
Information Technology CIP0042 Product Lifecycle Software Decommissioning CIP0043 Bus and Scheduling System Improvements CIP0049 Management Support Software CIP0056 Rail Operations Support Software CIP0259 Timecard Software Integration and Analysis CIP0269 Enterprise Asset Management Systems CIP0330 New Data Center IT Infrastructure and Equipment CIP0331 Enterprise Resource Planning (ERP) Replacement CIP0332 Fiber Installation CIP0342 IT Hardware Replacement Program CIP0343 Operating and Maintenance Applications CIP0344 IT Program Management and Quality Assurance CIP8029 D&E IT
MTPD
CIP0102 Metro Transit Police Department (MTPD) District III Substation Construction
CIP8031 D&E MTPD CIP8032 Future MTPD Major Projects
Support Equipment and Services CIP0009 Service Vehicle Replacement Program CIP0010 Environmental Compliance Program CIP0029 Warehouse Vertical Store Unit CIP0034 Revenue Collection Facility Improvements CIP0036 Procurement Program Support CIP0039 Core & System Development Program CIP0131 Capital Program Financing CIP0170 Roof Rehabilitation and Replacement CIP0210 Pollution Prevention at Track Fueling Areas CIP0211 Stormwater Facility Assessment CIP0212 Environmental Sustainability Lab CIP0213 Capital Program Development Support CIP0270 Capital Delivery Program Support CIP0272 Station Commercialization Project CIP0273 Facility Improvements CIP0277 Supply Chain Modernization CIP0324 Capital Program Financial Support CIP0335 Headquarters - District of Columbia CIP0336 Energy Management Upgrades CIP0337 Headquarters - Virginia CIP0338 Headquarters - Maryland CIP0339 First Responders Signs Updates CIP0340 Administration Facility Rehabilitation Program CIP0347 Accounting Capital Program Support CIP8033 D&E Support Equipment/Services CRB0005 Project Development Program - DC CRB0009 Project Development Program - MD CRB0018 Project Development Program - VA

108
Appendix D – Capital Projects
(CIP0002) Metrobus Onboard Location Equipment and Software Replacement
Initiative Type: Project Mode: Bus Invest. Category: Bus and Paratransit Investments Invest. Program: Bus Maintenance/Overhaul
Description
The design and equipment replacement of automatic vehicle location (AVL) units for buses. This equipment is vital to bus communications for location (GPS) and bus diagnostics. The replacements are bus state of good repair items that are critical to maintaining fleet reliability.
Strategic Objectives Supported
Safety Cust. Sat. Reliability Ridership Op. Impact
Location
Systemwide
Outcome
FY2021 is the second year of the 5 year replacement program which will conclude in FY2024. FY2021 includes design, acceptance and installation on the first group of buses. This project supports Metro's state of good repair and reliablity metrics.
Cost ($M) Fiscal Year Budget Actual
LTD Expenses 41.8 FY2020 1.4 FY2021 2.0 FY2022 4.0 FY2023 12.0 FY2024 15.0 FY2025 0.0 FY2026 0.0 FY2021-2026 Total 33.0 Total Cost 76.2
Anticipated Funding Sources Funding Source(s) for FY2021 Amount ($M)
Formula Programs 2.0 Total Project Cost 2.0
Fiscal Year FY20 FY21 FY22 FY23 FY24 FY25 FY26 FY27 FY28 FY29 FY30
PLANNING
Needs Identification
Development and Evaluation
EXECUTION
Project Development ✔ ✔ ✔ ✔ ✔ ✔ ✔
Implementation
✔ ✔ ✔ ✔ ✔ ✔ ✔

Appendix D – Capital Projects
109
(CIP0004) Bus Repair Equipment
Initiative Type: Program Mode: Bus Invest. Category: Bus and Paratransit Investments Invest. Program: Bus Maintenance/Overhaul
Description
This program replaces existing equipment that is past its useful life and provides new equipment for the repair and maintenance of the bus and non-revenue fleets. Additionally, this project supports construction of minor garage improvements.
Strategic Objectives Supported
Safety Cust. Sat. Reliability Ridership Op. Impact
Location
Systemwide
Outcome
The replacement of bus maintenance equipment related to parts washers, fork lifts, tool box kits, bus diagnostic equipment, and mechanic training equipment. Additionally, the replacement of 2 Engine and Transmission Dynameters, and the installation of 3 Bus Simulators are planned. This program supports Metro's State of Good Repair and reliability metrics.
Cost ($M) Fiscal Year Budget Actual
FY2020 2.5 FY2021 3.0 FY2022 2.5 FY2023 2.5 FY2024 2.5 FY2025 2.5 FY2026 2.5 FY2021-2026 Total 15.5 Total Cost 18.0
Anticipated Funding Sources Funding Source(s) for FY2021 Amount ($M)
Formula Programs 3.0 Total Project Cost 3.0
Fiscal Year FY20 FY21 FY22 FY23 FY24 FY25 FY26 FY27 FY28 FY29 FY30
PLANNING
Needs Identification
Development and Evaluation ✔
EXECUTION
Project Development ✔ ✔ ✔ ✔ ✔ ✔ ✔ ✔ ✔ ✔ ✔
Implementation
✔ ✔ ✔ ✔ ✔ ✔ ✔ ✔ ✔ ✔ ✔

110
Appendix D – Capital Projects
(CIP0005) Bus Rehabilitation Program
Initiative Type: Program Mode: Bus Invest. Category: Bus and Paratransit Investments Invest. Program: Bus Maintenance/Overhaul
Description
This program performs rehabilitations at approximately 7.5 years of age and provides for the complete rehabilitation of bus mechanical, electrical and structural systems. Additionally, the project supports the procurement of components to replace those that can no longer be overhauled.
Strategic Objectives Supported
Safety Cust. Sat. Reliability Ridership Op. Impact
Location
Andrews Federal Bus Garage - Suitland; Carmen Turner Facility - Landover
Outcome
The overhaul of 100 buses is scheduled for FY2021, to include 100 engine and 120 transmission assemblies being rebuilt. 100 energy storage systems will be replaced along with the rehabilitation of 105 fare boxes. Various other components will be rebuilt as well to include axles, HVAC units, pro-heat units and steering boxes. This program supports Metro's State of Good Repair and reliablity metrics.
Cost ($M) Fiscal Year Budget Actual
FY2020 49.2 FY2021 69.9 FY2022 70.0 FY2023 75.2 FY2024 67.9 FY2025 61.9 FY2026 61.9 FY2021-2026 Total 406.9 Total Cost 456.0
Anticipated Funding Sources Funding Source(s) for FY2021 Amount ($M)
Formula Programs 47.0 System Perform 22.9 Total Project Cost 69.9
Fiscal Year FY20 FY21 FY22 FY23 FY24 FY25 FY26 FY27 FY28 FY29 FY30
PLANNING
Needs Identification
Development and Evaluation
EXECUTION
Project Development
Implementation
✔ ✔ ✔ ✔ ✔ ✔ ✔ ✔ ✔ ✔ ✔

Appendix D – Capital Projects
111
(CIP0006) Bus Acquisition Program
Initiative Type: Program Mode: Bus Invest. Category: Bus and Paratransit Investments Invest. Program: Bus and Paratransit
Acquisition
Description
Acquisition and replacement of standard 30-foot and 40-foot buses and the longer articulated buses to ensure customers are provided with safe, reliable, and modern buses, and maintain an average fleet age of approximately 7.5 years, which is in accordance with the MetroBus Fleet Management Plan. Project also includes training and spare parts. The Fleet Management Plan adds buses for bus replacement as well as fleet expansion.
Strategic Objectives Supported
Safety Cust. Sat. Reliability Ridership Op. Impact
Location
Post-Delivery inspections occur at Landover Bus Division - Landover
Outcome
In FY2021, Metro will acquire 122 buses. This is to replace 100-40 foot Clean Diesel buses, and 22 Articulated Clean Diesel buses. This program supports Metro's State of Good Repair and reliablity metrics.
Cost ($M) Fiscal Year Budget Actual
FY2020 69.9 FY2021 74.0 FY2022 74.0 FY2023 74.0 FY2024 74.0 FY2025 74.0 FY2026 75.5 FY2021-2026 Total 445.5 Total Cost 515.4
Anticipated Funding Sources Funding Source(s) for FY2021 Amount ($M)
Formula Programs 64.4 Other Federal 9.6 Total Project Cost 74.0
Fiscal Year FY20 FY21 FY22 FY23 FY24 FY25 FY26 FY27 FY28 FY29 FY30
PLANNING
Needs Identification
Development and Evaluation
EXECUTION
Project Development ✔ ✔
Implementation
✔ ✔ ✔ ✔ ✔ ✔ ✔ ✔ ✔ ✔ ✔

112
Appendix D – Capital Projects
(CIP0007) Metrobus Closed-Circuit Television (CCTV) Replacement Program
Initiative Type: Program Mode: Bus Invest. Category: Bus and Paratransit Investments Invest. Program: Bus Maintenance/Overhaul
Description
Replace Metrobus closed-circuit television (CCTV) camera systems on-board all Metrobus vehicles to maintain a state of good repair on a lifecycle basis.
Strategic Objectives Supported
Safety Cust. Sat. Reliability Ridership Op. Impact
Location
Systemwide
Outcome
In FY2021, Metro will begin life cycle replacement of Close-Circuit TV (CCTV) units for the entire bus fleet (1,583 buses). FY2021 will be year 1, of a 3 year program to replace CCTV units. This program supports Metro's safety and customer satisfaction metrics.
Cost ($M) Fiscal Year Budget Actual
FY2020 0.5 FY2021 9.0 FY2022 9.0 FY2023 7.0 FY2024 0.0 FY2025 0.0 FY2026 0.0 FY2021-2026 Total 25.0 Total Cost 25.5
Anticipated Funding Sources Funding Source(s) for FY2021 Amount ($M)
Formula Programs 9.0 Total Project Cost 9.0
Fiscal Year FY20 FY21 FY22 FY23 FY24 FY25 FY26 FY27 FY28 FY29 FY30
PLANNING
Needs Identification
Development and Evaluation
EXECUTION
Project Development ✔ ✔ ✔
Implementation
✔ ✔ ✔ ✔ ✔ ✔

Appendix D – Capital Projects
113
(CIP0009) Service Vehicle Replacement Program
Initiative Type: Program Mode: Bus Invest. Category: Business Support Investments Invest. Program: Support
Equipment/Services
Description
Replace service vehicles that are past their useful life.
Strategic Objectives Supported
Safety Cust. Sat. Reliability Ridership Op. Impact
Location
Systemwide
Outcome
In FY2021, Metro has scheduled the replacement of service vehicles based on a prioritized list of mileage and need. Service vehicles include Passenger, Street Operation; Service Support, and Metro Transit Police vehicles. This program improves Metro's state of good repair.
Cost ($M) Fiscal Year Budget Actual
FY2020 13.3 FY2021 6.5 FY2022 6.5 FY2023 6.5 FY2024 6.5 FY2025 6.5 FY2026 6.5 FY2021-2026 Total 39.0 Total Cost 52.3
Anticipated Funding Sources Funding Source(s) for FY2021 Amount ($M)
Dedicated Funding 6.5 Total Project Cost 6.5
Fiscal Year FY20 FY21 FY22 FY23 FY24 FY25 FY26 FY27 FY28 FY29 FY30
PLANNING
Needs Identification
Development and Evaluation
EXECUTION
Project Development
Implementation
✔ ✔ ✔ ✔ ✔ ✔ ✔ ✔ ✔ ✔ ✔
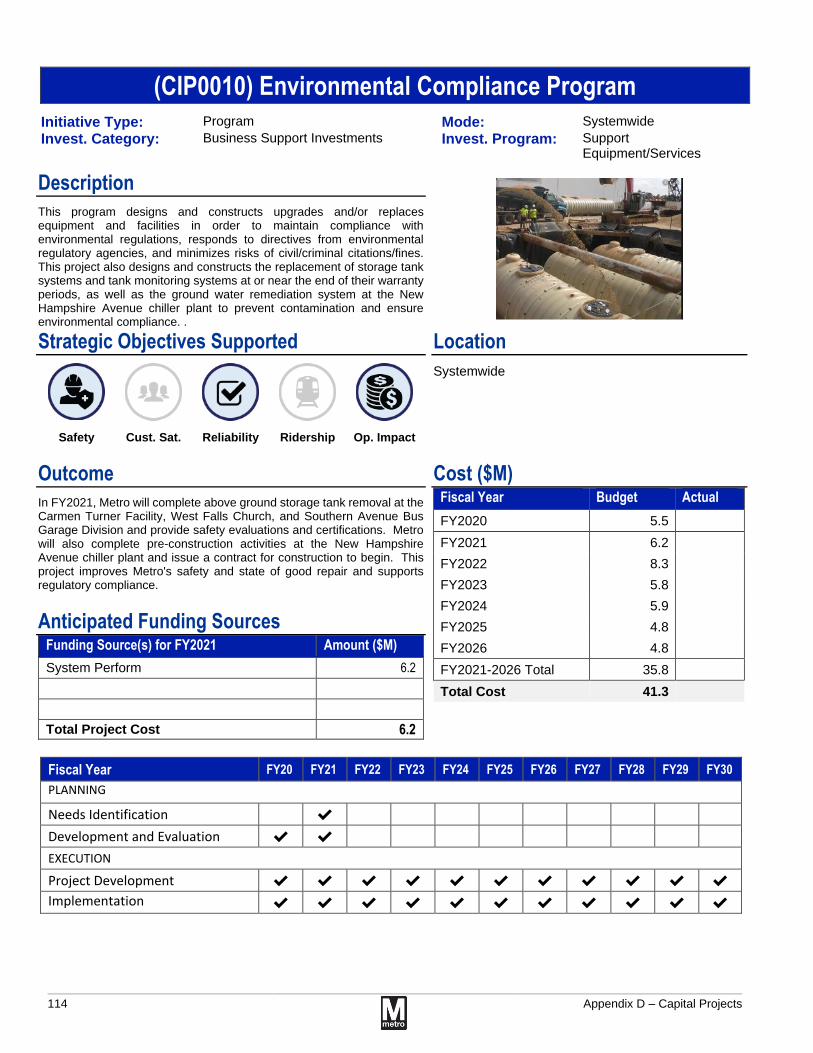
114
Appendix D – Capital Projects
(CIP0010) Environmental Compliance Program
Initiative Type: Program Mode: Systemwide Invest. Category: Business Support Investments Invest. Program: Support
Equipment/Services
Description
This program designs and constructs upgrades and/or replaces equipment and facilities in order to maintain compliance with environmental regulations, responds to directives from environmental regulatory agencies, and minimizes risks of civil/criminal citations/fines. This project also designs and constructs the replacement of storage tank systems and tank monitoring systems at or near the end of their warranty periods, as well as the ground water remediation system at the New Hampshire Avenue chiller plant to prevent contamination and ensure environmental compliance. .
Strategic Objectives Supported
Safety Cust. Sat. Reliability Ridership Op. Impact
Location
Systemwide
Outcome
In FY2021, Metro will complete above ground storage tank removal at the Carmen Turner Facility, West Falls Church, and Southern Avenue Bus Garage Division and provide safety evaluations and certifications. Metro will also complete pre-construction activities at the New Hampshire Avenue chiller plant and issue a contract for construction to begin. This project improves Metro's safety and state of good repair and supports regulatory compliance.
Cost ($M) Fiscal Year Budget Actual
FY2020 5.5 FY2021 6.2 FY2022 8.3 FY2023 5.8 FY2024 5.9 FY2025 4.8 FY2026 4.8 FY2021-2026 Total 35.8 Total Cost 41.3
Anticipated Funding Sources Funding Source(s) for FY2021 Amount ($M)
System Perform 6.2 Total Project Cost 6.2
Fiscal Year FY20 FY21 FY22 FY23 FY24 FY25 FY26 FY27 FY28 FY29 FY30
PLANNING
Needs Identification ✔
Development and Evaluation ✔ ✔
EXECUTION
Project Development ✔ ✔ ✔ ✔ ✔ ✔ ✔ ✔ ✔ ✔ ✔
Implementation
✔ ✔ ✔ ✔ ✔ ✔ ✔ ✔ ✔ ✔ ✔

Appendix D – Capital Projects
115
(CIP0015) MetroAccess Fleet Acquisition Program
Initiative Type: Program Mode: Access Invest. Category: Bus and Paratransit Investments Invest. Program: Bus and Paratransit
Acquisition
Description
Replace vehicles in the paratransit fleet (MetroAccess) on a lifecycle basis, consistent with the MetroAccess Fleet Plan. Vehicle replacement includes purchase of base vehicles and necessary retrofits to add paratransit equipment and features.
Strategic Objectives Supported
Safety Cust. Sat. Reliability Ridership Op. Impact
Location
Systemwide
Outcome
In FY2021, Metro will purchase 100 paratransit vans and continue to install CCTV, mobile data terminals and drive cam units on all new vehicles. Metro will also evaluate the performance of the sedans added to the fleet in FY2020, along with route efficiencies to determine the future mix of vans and sedans in the fleet replacement plan. This program supports Metro's state of good repair, reliablity, and customer satisfaction goals.
Cost ($M) Fiscal Year Budget Actual
FY2020 12.2 FY2021 12.0 FY2022 12.0 FY2023 12.0 FY2024 12.0 FY2025 12.0 FY2026 12.0 FY2021-2026 Total 72.0 Total Cost 84.2
Anticipated Funding Sources Funding Source(s) for FY2021 Amount ($M)
Formula Programs 12.0 Total Project Cost 12.0
Fiscal Year FY20 FY21 FY22 FY23 FY24 FY25 FY26 FY27 FY28 FY29 FY30
PLANNING
Needs Identification
Development and Evaluation
EXECUTION
Project Development
Implementation
✔ ✔ ✔ ✔ ✔ ✔ ✔ ✔ ✔ ✔ ✔

116
Appendix D – Capital Projects
(CIP0024) Track and Structures Rehabilitation
Initiative Type: Program Mode: Rail Invest. Category: Track and Structures Rehabilitation
Investments Invest. Program: Fixed Rail
Description
This program rehabilitates the track structure by replacing deteriorated fixed rail and structural components in addition to providing stabilization and tamping of track, along with improvements to the electrical and signal conductivity of running rail.
Strategic Objectives Supported
Safety Cust. Sat. Reliability Ridership Op. Impact
Location
Systemwide
Outcome
Metro will continue the systemwide state of good repair program, including stabilization and tamping of track, welding joints, and renewing crossties, fasteners, grout pads, drains, switches and sections of third rail. This program will deliver improved service and safety based on Metro-established key performance indicators (KPIs) that include MyTripTime, Derailments, and Rail Collisions.
Cost ($M) Fiscal Year Budget Actual
FY2020 114.4 FY2021 95.1 FY2022 97.5 FY2023 98.3 FY2024 88.0 FY2025 87.0 FY2026 87.0 FY2021-2026 Total 552.9 Total Cost 667.3
Anticipated Funding Sources Funding Source(s) for FY2021 Amount ($M)
Formula Programs 94.5 System Perform 0.6 Total Project Cost 95.1
Fiscal Year FY20 FY21 FY22 FY23 FY24 FY25 FY26 FY27 FY28 FY29 FY30
PLANNING
Needs Identification ✔ ✔ ✔
Development and Evaluation ✔ ✔ ✔ ✔ ✔
EXECUTION
Project Development ✔ ✔ ✔ ✔
Implementation
✔ ✔ ✔ ✔ ✔ ✔ ✔ ✔ ✔ ✔ ✔

Appendix D – Capital Projects
117
(CIP0025) Track Maintenance Equipment
Initiative Type: Program Mode: Rail Invest. Category: Track and Structures Rehabilitation
Investments Invest. Program: Fixed Rail
Description
This program replaces heavy-duty track equipment that has reached the end of its useful life and is no longer feasible to maintain. Track equipment is essential to the safe and efficient execution of track rehabilitation and maintenance work. Timely replacement of self-propelled track equipment maximizes equipment availability and reliability, and reduces delays due to equipment breakdowns which allows for efficient use of track outages.
Strategic Objectives Supported
Safety Cust. Sat. Reliability Ridership Op. Impact
Location
Commissioning for equipment will occur at Greenbelt Rail Yard
Outcome
Metro will take delivery of Dual Rail e-clip Installers, Ride-on Plate Inserters, and Swing Loaders. This program supports the Track and Rehabilitation Program and helps deliver improved service and safety based on Metro-established key performance indicators (KPIs) that include MyTripTime, Derailments, and Rail Collisions.
Cost ($M) Fiscal Year Budget Actual
FY2020 8.8 FY2021 3.9 FY2022 9.7 FY2023 24.7 FY2024 27.1 FY2025 14.3 FY2026 8.1 FY2021-2026 Total 87.7 Total Cost 96.5
Anticipated Funding Sources Funding Source(s) for FY2021 Amount ($M)
System Perform 1.6 Dedicated Funding 2.3 Total Project Cost 3.9
Fiscal Year FY20 FY21 FY22 FY23 FY24 FY25 FY26 FY27 FY28 FY29 FY30
PLANNING
Needs Identification ✔
Development and Evaluation ✔ ✔ ✔
EXECUTION
Project Development ✔ ✔ ✔ ✔ ✔ ✔ ✔ ✔ ✔ ✔ ✔
Implementation
✔ ✔ ✔ ✔ ✔ ✔ ✔ ✔ ✔ ✔ ✔

118
Appendix D – Capital Projects
(CIP0029) Warehouse Vertical Store Unit
Initiative Type: Project Mode: Systemwide Invest. Category: Business Support Investments Invest. Program: Support
Equipment/Services
Description
This project installs and reorganizes vertical and horizontal storage units, shelving and racking for storage of repair parts in order to allow greater storage capacity, inventory accuracy and enhanced safety. This project also upgrades parts storage systems with bar code systems for better parts location features.
Strategic Objectives Supported
Safety Cust. Sat. Reliability Ridership Op. Impact
Location
Metro Supply Facility
Various Storerooms at Railyards and Bus Garages
Outcome
In FY2021, this project will fund the procurement and replacement of vertical and horizontal storage units, warehouse security systems, and inventory control systems at the Metro Supply Facility and various storerooms located at railyards and bus garages. This project supports Metro's state of good repair.
Cost ($M) Fiscal Year Budget Actual
LTD Expenses 9.0 FY2020 0.2 FY2021 1.8 FY2022 0.0 FY2023 0.0 FY2024 0.0 FY2025 0.0 FY2026 0.0 FY2021-2026 Total 1.8 Total Cost 11.0
Anticipated Funding Sources Funding Source(s) for FY2021 Amount ($M)
Dedicated Funding 1.8 Total Project Cost 1.8
Fiscal Year FY20 FY21 FY22 FY23 FY24 FY25 FY26 FY27 FY28 FY29 FY30
PLANNING
Needs Identification
Development and Evaluation ✔
EXECUTION
Project Development ✔ ✔
Implementation
✔ ✔

Appendix D – Capital Projects
119
(CIP0034) Revenue Collection Facility Improvements
Initiative Type: Project Mode: Systemwide Invest. Category: Business Support Investments Invest. Program: Support
Equipment/Services
Description
Assess, upgrade or replace structures, equipment, and systems, as needed, in the high security facility where Metro processes cash revenue.
Strategic Objectives Supported
Safety Cust. Sat. Reliability Ridership Op. Impact
Location
Alexandria
Outcome
In FY2021, Metro will complete the building assessment of the revenue collection facility and continue design of facility improvements. This project supports Metro's financial responsibility and state of good repair.
Cost ($M) Fiscal Year Budget Actual
LTD Expenses 2.7 FY2020 0.5 FY2021 2.5 FY2022 2.5 FY2023 2.8 FY2024 0.0 FY2025 0.0 FY2026 0.0 FY2021-2026 Total 7.8 Total Cost 10.9
Anticipated Funding Sources Funding Source(s) for FY2021 Amount ($M)
System Perform 2.5 Total Project Cost 2.5
Fiscal Year FY20 FY21 FY22 FY23 FY24 FY25 FY26 FY27 FY28 FY29 FY30
PLANNING
Needs Identification
Development and Evaluation
EXECUTION
Project Development ✔
Implementation
✔ ✔ ✔

120
Appendix D – Capital Projects
(CIP0035) Bicycle & Pedestrian Facilities Improvements
Initiative Type: Project Mode: Rail Invest. Category: Station and Passenger Facilities
Investments Invest. Program: Platforms & Structures
Description
This project will increase bicycle parking capacity at Metrorail stations and improve bicycle and pedestrian connections to stations from local communities. Additionally, this project replaces bike racks and lockers that are structurally damaged.
Strategic Objectives Supported
Safety Cust. Sat. Reliability Ridership Op. Impact
Location
Systemwide
Outcome
In FY2021, Metro will begin replacing existing bike lockers and racks with new automated lockers and racks securable through a mobile application. Metro will also begin planning activities for new pedestrian walkways throughout the system. This project enhances customer satisfaction and security, measured by the Crime Rate key performance indicator (KPI).
Cost ($M) Fiscal Year Budget Actual
LTD Expenses 10.2 FY2020 1.5 FY2021 0.5 FY2022 1.5 FY2023 1.5 FY2024 1.5 FY2025 1.5 FY2026 1.5 FY2021-2026 Total 8.0 Total Cost 19.7
Anticipated Funding Sources Funding Source(s) for FY2021 Amount ($M)
Dedicated Funding 0.5 Total Project Cost 0.5
Fiscal Year FY20 FY21 FY22 FY23 FY24 FY25 FY26 FY27 FY28 FY29 FY30
PLANNING
Needs Identification ✔
Development and Evaluation ✔ ✔
EXECUTION
Project Development ✔ ✔
Implementation
✔ ✔ ✔ ✔ ✔ ✔ ✔ ✔ ✔

Appendix D – Capital Projects
121
(CIP0036) Procurement Program Support
Initiative Type: Program Mode: Systemwide Invest. Category: Business Support Investments Invest. Program: Support
Equipment/Services
Description
Staff support for capital program procurement activity.
Strategic Objectives Supported
Safety Cust. Sat. Reliability Ridership Op. Impact
Location
Systemwide
Outcome
In FY2021, Metro will continue to provide procurement support to facilitate planned capital projects. This project improves Metro's financial responsibility and capital project delivery.
Cost ($M) Fiscal Year Budget Actual
FY2020 1.1 FY2021 1.1 FY2022 1.1 FY2023 1.1 FY2024 1.1 FY2025 1.1 FY2026 1.1 FY2021-2026 Total 6.6 Total Cost 7.7
Anticipated Funding Sources Funding Source(s) for FY2021 Amount ($M)
System Perform 1.1 Total Project Cost 1.1
Fiscal Year FY20 FY21 FY22 FY23 FY24 FY25 FY26 FY27 FY28 FY29 FY30
PLANNING
Needs Identification
Development and Evaluation
EXECUTION
Project Development
Implementation
✔ ✔ ✔ ✔ ✔ ✔ ✔ ✔ ✔ ✔ ✔

122
Appendix D – Capital Projects
(CIP0039) Core & System Development Program
Initiative Type: Program Mode: Systemwide Invest. Category: Business Support Investments Invest. Program: Support
Equipment/Services
Description
This program conducts near-term and long-range planning studies and produces plans for station enhancements that improve pedestrian flow, travel time, customer experience, vertical transportation, line or route operations, and station access. Funding for future year implementation of adopted plans is included in the future fiscal years.
Strategic Objectives Supported
Safety Cust. Sat. Reliability Ridership Op. Impact
Location
Systemwide
Outcome
In FY2021, Metro will continue to provide planning, review, and implementation of facility and passenger improvements systemwide. This project supports Metro's state of good repair and customer service.
Cost ($M) Fiscal Year Budget Actual
FY2020 3.1 FY2021 2.6 FY2022 5.6 FY2023 61.0 FY2024 97.3 FY2025 107.7 FY2026 80.3 FY2021-2026 Total 354.6 Total Cost 357.6
Anticipated Funding Sources Funding Source(s) for FY2021 Amount ($M)
Dedicated Funding 2.6 Total Project Cost 2.6
Fiscal Year FY20 FY21 FY22 FY23 FY24 FY25 FY26 FY27 FY28 FY29 FY30
PLANNING
Needs Identification ✔ ✔ ✔ ✔ ✔
Development and Evaluation ✔ ✔ ✔ ✔ ✔
EXECUTION
Project Development ✔ ✔ ✔ ✔ ✔ ✔
Implementation
✔ ✔ ✔ ✔ ✔ ✔ ✔ ✔ ✔ ✔ ✔
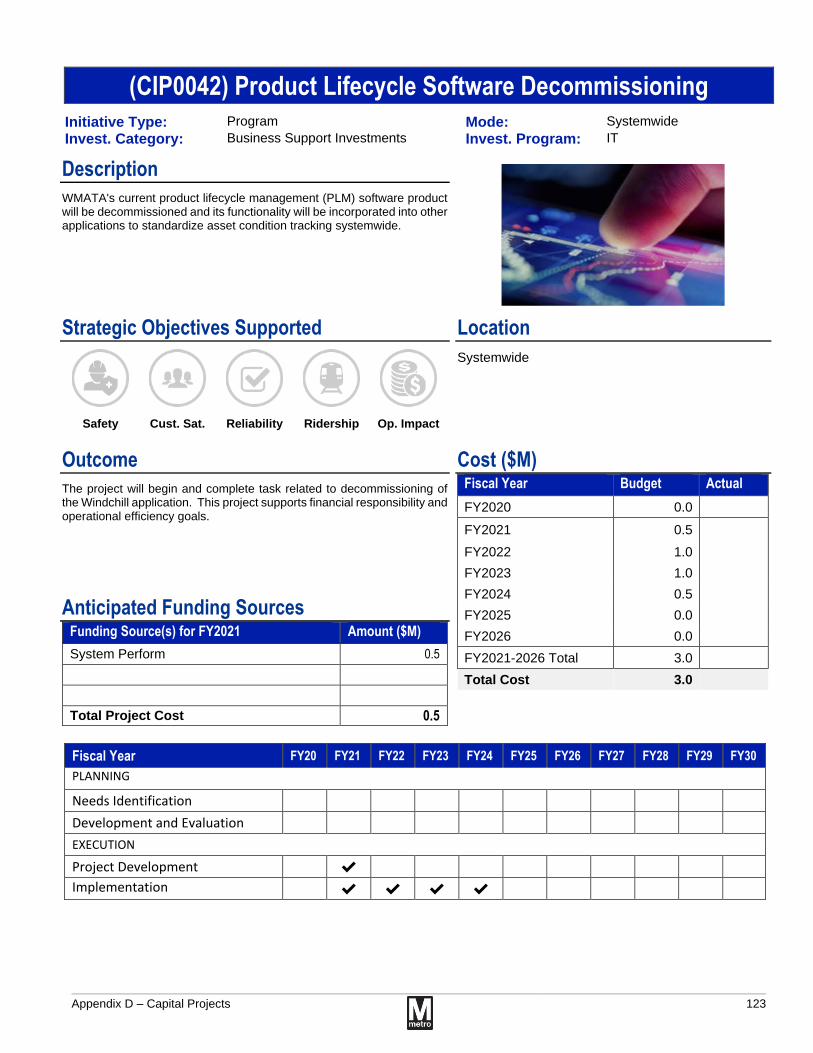
Appendix D – Capital Projects
123
(CIP0042) Product Lifecycle Software Decommissioning
Initiative Type: Program Mode: Systemwide Invest. Category: Business Support Investments Invest. Program: IT
Description
WMATA's current product lifecycle management (PLM) software product will be decommissioned and its functionality will be incorporated into other applications to standardize asset condition tracking systemwide.
Strategic Objectives Supported
Safety Cust. Sat. Reliability Ridership Op. Impact
Location
Systemwide
Outcome
The project will begin and complete task related to decommissioning of the Windchill application. This project supports financial responsibility and operational efficiency goals.
Cost ($M) Fiscal Year Budget Actual
FY2020 0.0 FY2021 0.5
FY2022 1.0 FY2023 1.0 FY2024 0.5 FY2025 0.0 FY2026 0.0 FY2021-2026 Total 3.0 Total Cost 3.0
Anticipated Funding Sources Funding Source(s) for FY2021 Amount ($M)
System Perform 0.5 Total Project Cost 0.5
Fiscal Year FY20 FY21 FY22 FY23 FY24 FY25 FY26 FY27 FY28 FY29 FY30
PLANNING
Needs Identification
Development and Evaluation
EXECUTION
Project Development ✔
Implementation
✔ ✔ ✔ ✔

124
Appendix D – Capital Projects
(CIP0043) Bus and Rail Scheduling System Improvements
Initiative Type: Project Mode: Bus Invest. Category: Business Support Investments Invest. Program: IT
Description
Replace bus scheduling system and upgrade rail scheduling system, so that both modes are scheduled in the same software package.
Strategic Objectives Supported
Safety Cust. Sat. Reliability Ridership Op. Impact
Location
Systemwide
Outcome
In FY2021, Metro will begin project planning, design and development for Phase 1 of the scheduling Bus and Rail system and complete MetroAccess scheduling system product implementation. This project supports Metro's customer service and service delivery goals.
Cost ($M) Fiscal Year Budget Actual
LTD Expenses 9.6 FY2020 2.1 FY2021 5.2 FY2022 2.0 FY2023 0.0 FY2024 0.0 FY2025 0.0 FY2026 0.0 FY2021-2026 Total 7.2 Total Cost 18.9
Anticipated Funding Sources Funding Source(s) for FY2021 Amount ($M)
System Perform 5.2 Total Project Cost 5.2
Fiscal Year FY20 FY21 FY22 FY23 FY24 FY25 FY26 FY27 FY28 FY29 FY30
PLANNING
Needs Identification
Development and Evaluation
EXECUTION
Project Development ✔
Implementation
✔ ✔ ✔

Appendix D – Capital Projects
125
(CIP0049) Management Support Software
Initiative Type: Project Mode: Systemwide Invest. Category: Business Support Investments Invest. Program: IT
Description
This project will update software for the Metro access control system. The access control software will support the technical architecture communication with physical badge readers and allow badge holders access to Metro facilities based on the approved permissions configured in the software.
Strategic Objectives Supported
Safety Cust. Sat. Reliability Ridership Op. Impact
Location
Systemwide
Outcome
In FY2021, Metro will complete the One Badge project by upgrading access software and adding badge readers, integrating Human Capital Model, and finalizing security protocols. This project supports Metro's security goals.
Cost ($M) Fiscal Year Budget Actual
LTD Expenses 5.6 FY2020 10.6 FY2021 0.8 FY2022 0.0 FY2023 0.0 FY2024 0.0 FY2025 0.0 FY2026 0.0 FY2021-2026 Total 0.8 Total Cost 17.0
Anticipated Funding Sources Funding Source(s) for FY2021 Amount ($M)
System Perform 0.8 Total Project Cost 0.8
Fiscal Year FY20 FY21 FY22 FY23 FY24 FY25 FY26 FY27 FY28 FY29 FY30
PLANNING
Needs Identification
Development and Evaluation
EXECUTION
Project Development ✔
Implementation
✔ ✔ ✔

126
Appendix D – Capital Projects
(CIP0056) Rail Operations Support Software
Initiative Type: Program Mode: Rail Invest. Category: Business Support Investments Invest. Program: IT
Description
This program will provide software updates and system integration between the Rail Operations Control Center (ROCC) and Passenger Information Display System (PIDS) at each station, ensuring real time train information is accurate and available to customers. This program will include implementation at new stations as they become operational.
Strategic Objectives Supported
Safety Cust. Sat. Reliability Ridership Op. Impact
Location
Systemwide
Outcome
In FY2021 Metro will perform upgrades to enhance Passenger Information Display Systems (PIDS). These upgrades include software to support digital media for Silver Line Phase II stations, integration of the Potomac Yard station, and new 55 inch PIDS displays being installed systemwide. The program will also implement performance dashboard software to monitor and report on the status of each PIDS in Metro's rail stations. This project supports Metro's customer service and operational reliability goals.
Cost ($M) Fiscal Year Budget Actual
FY2020 3.0 FY2021 7.9 FY2022 6.0 FY2023 5.4 FY2024 6.2 FY2025 5.9 FY2026 5.4 FY2021-2026 Total 36.8 Total Cost 39.8
Anticipated Funding Sources Funding Source(s) for FY2021 Amount ($M)
Dedicated Funding 7.9 Total Project Cost 7.9
Fiscal Year FY20 FY21 FY22 FY23 FY24 FY25 FY26 FY27 FY28 FY29 FY30
PLANNING
Needs Identification
Development and Evaluation
EXECUTION
Project Development ✔ ✔ ✔ ✔ ✔ ✔ ✔ ✔ ✔ ✔ ✔
Implementation
✔ ✔ ✔ ✔ ✔ ✔ ✔ ✔ ✔ ✔ ✔

Appendix D – Capital Projects
127
(CIP0059) 8000 Series Railcar Procurement
Initiative Type: Project Mode: Rail Invest. Category: Railcar Investments Invest. Program: Railcar Acquisition
Description
This project acquires 360 new railcars to replace the 2000 and 3000 Series fleets, and includes unfunded options for future railcar fleet expansion.
Strategic Objectives Supported
Safety Cust. Sat. Reliability Ridership Op. Impact
Location
Systemwide
Outcome
In FY2021, Metro will begin mobilization and kickoff meetings with the selected 8000 Series Railcar manufacturer, and initiate the conceptual and then the preliminary railcar design.
Cost ($M) Fiscal Year Budget Actual
LTD Expenses 3.7 FY2020 7.2 FY2021 73.2 FY2022 54.9 FY2023 106.3 FY2024 104.9 FY2025 167.7 FY2026 237.6 FY2021-2026 Total 744.6 Total Cost 755.5
Anticipated Funding Sources Funding Source(s) for FY2021 Amount ($M)
Dedicated Funding 73.2 Total Project Cost 73.2
Fiscal Year FY20 FY21 FY22 FY23 FY24 FY25 FY26 FY27 FY28 FY29 FY30
PLANNING
Needs Identification
Development and Evaluation
EXECUTION
Project Development ✔ ✔ ✔ ✔ ✔
Implementation
✔ ✔ ✔ ✔ ✔ ✔ ✔ ✔ ✔ ✔ ✔

128
Appendix D – Capital Projects
(CIP0063) Railcar Rehabilitation Program
Initiative Type: Program Mode: Rail Invest. Category: Railcar Investments Invest. Program: Railcar
Maintenance/Overhaul
Description
This program will support scheduled overhauls in order to maintain railcar state of good repair, improve lifecycle safety and railcar reliability. Approximately one-fifth of the fleet (225 cars), are overhauled annually.
Strategic Objectives Supported
Safety Cust. Sat. Reliability Ridership Op. Impact
Location
Greenbelt Rail Yard; Brentwood Rail Yard
Outcome
In FY2021, Metro will overhaul and conduct Scheduled Maintenance Service (SMS) of about 242 Railcars. The schedule will include 100 of the 2000/3000 Series, 78 of the 6000 Series, and 64 of the 7000 Series. This project supports Metro's state of good repair, reliabilty, and customer statisfaction goals.
Cost ($M) Fiscal Year Budget Actual
FY2020 52.3 FY2021 64.5 FY2022 49.2 FY2023 49.2 FY2024 48.3 FY2025 46.2 FY2026 71.7 FY2021-2026 Total 329.1 Total Cost 381.4
Anticipated Funding Sources Funding Source(s) for FY2021 Amount ($M)
PRIIA 60.6 System Perform 3.8 Total Project Cost 64.5
Fiscal Year FY20 FY21 FY22 FY23 FY24 FY25 FY26 FY27 FY28 FY29 FY30
PLANNING
Needs Identification ✔
Development and Evaluation ✔
EXECUTION
Project Development ✔ ✔
Implementation
✔ ✔ ✔ ✔ ✔ ✔ ✔ ✔ ✔ ✔ ✔

Appendix D – Capital Projects
129
(CIP0067) Rail Car Safety & Reliability Improvements
Initiative Type: Program Mode: Rail Invest. Category: Railcar Investments Invest. Program: Railcar
Maintenance/Overhaul
Description
This program performs engineering analysis, diagnosis, testing and resolution of safety, maintenance and operational issues relating to the railcar fleet and its interaction with track, automatic train control, communication and power systems, resolving compatibility issues across the various fleets and infrastructure related to changes and aging technology which improves the safety and reliability of railcars.
Strategic Objectives Supported
Safety Cust. Sat. Reliability Ridership Op. Impact
Location
Systemwide
Outcome
In FY2021, Metro will make final payments for Precision Station Stop, Converter Function Module, and Stop & Proceed software updates for 2000 /3000 and 6000 Series Railcars. Metro also plans to receive the remaining Bench Testing equipment units for Converter Function Modules for Railcar Maintenance/Overhaul Shops. This program supports Metro's safety and reliablity metrics.
Cost ($M) Fiscal Year Budget Actual
FY2020 5.3 FY2021 2.4 FY2022 2.2 FY2023 2.2 FY2024 2.2 FY2025 2.2 FY2026 2.2 FY2021-2026 Total 13.4 Total Cost 18.7
Anticipated Funding Sources Funding Source(s) for FY2021 Amount ($M)
PRIIA 2.4 Total Project Cost 2.4
Fiscal Year FY20 FY21 FY22 FY23 FY24 FY25 FY26 FY27 FY28 FY29 FY30
PLANNING
Needs Identification
Development and Evaluation
EXECUTION
Project Development ✔
Implementation
✔ ✔ ✔ ✔ ✔ ✔ ✔ ✔ ✔ ✔ ✔

130
Appendix D – Capital Projects
(CIP0072) Elevator Rehabilitation Program
Initiative Type: Program Mode: Rail Invest. Category: Station and Passenger Facilities
Investments Invest. Program: Vertical Transportation
Description
Rehabilitate elevators at Metrorail stations across the system to improve performance and availability. Project includes the replacement of internal elevator components and upgrade of associated lighting while ensuring that code requirements are met and a state of good repair is achieved or maintained.
Strategic Objectives Supported
Safety Cust. Sat. Reliability Ridership Op. Impact
Location
Systemwide
Outcome
In FY2021, Metro will rehabilitate fourteen hydraulic elevators units. Locations for FY2021 are under review. This program provides upgraded safety for customers entering and exiting the station, increased station accessibility for all potential customers, and improved station circulation. This will improve service based on the Elevator Availability key performance indicator (KPI).
Cost ($M) Fiscal Year Budget Actual
FY2020 6.6 FY2021 9.0 FY2022 9.5 FY2023 8.5 FY2024 8.5 FY2025 8.5 FY2026 8.5 FY2021-2026 Total 52.5 Total Cost 59.1
Anticipated Funding Sources Funding Source(s) for FY2021 Amount ($M)
PRIIA 9.0 Total Project Cost 9.0
Fiscal Year FY20 FY21 FY22 FY23 FY24 FY25 FY26 FY27 FY28 FY29 FY30
PLANNING
Needs Identification
Development and Evaluation
EXECUTION
Project Development
Implementation
✔ ✔ ✔ ✔ ✔ ✔ ✔ ✔ ✔ ✔ ✔

Appendix D – Capital Projects
131
(CIP0073) Escalator Rehabilitation
Initiative Type: Program Mode: Rail Invest. Category: Station and Passenger Facilities
Investments Invest. Program: Vertical Transportation
Description
This program rehabilitates and replaces escalators as necessary to maintain escalator availability, safety and reliability. The escalators are rehabilitated with energy saving devices.
Strategic Objectives Supported
Safety Cust. Sat. Reliability Ridership Op. Impact
Location
Systemwide
Outcome
In FY2021, Metro will complete the rehabilitation of eight to ten units under the new 5-year Escalator Rehabilitation contract which totals 89 units. FY2021 will be the first year of new contract. This program provides upgraded safety for customers entering and exiting the station, increased station accessibility for customers, and improved station circulation. This will improve service based on the Escalator Availability key performance indicator (KPI).
Cost ($M) Fiscal Year Budget Actual
FY2020 6.1 FY2021 17.4 FY2022 21.2 FY2023 21.3 FY2024 22.6 FY2025 22.7 FY2026 18.7 FY2021-2026 Total 123.9 Total Cost 130.0
Anticipated Funding Sources Funding Source(s) for FY2021 Amount ($M)
PRIIA 14.4 System Perform 3.0 Total Project Cost 17.4
Fiscal Year FY20 FY21 FY22 FY23 FY24 FY25 FY26 FY27 FY28 FY29 FY30
PLANNING
Needs Identification
Development and Evaluation
EXECUTION
Project Development
Implementation
✔ ✔ ✔ ✔ ✔ ✔ ✔ ✔ ✔ ✔ ✔

132
Appendix D – Capital Projects
(CIP0076) Rail Power Infrastructure Upgrades
Initiative Type: Project Mode: Rail Invest. Category: Rail Systems Investments Invest. Program: Propulsion
Description
This project will upgrade and replace electrical infrastructure equipment to improve performance of the rail power system and accommodate additional eight-car trains. Upgrades to the rail power infrastructure include Traction Power Substations, Tie Breaker Stations, cabling, and transformers to both increase system capacity and reliability.
Strategic Objectives Supported
Safety Cust. Sat. Reliability Ridership Op. Impact
Location
Franconia-Springfield, King St., Pentagon City, Greenbelt, West Hyattsville, Tenleytown, Takoma Park, PG Plaza
Outcome
This project plans to complete Traction Power Substation equipment upgrades at Franconia-Springfield, Pentagon City, Greenbelt, West Hyattsville, Tenleytown, and Takoma Park. Tie Breaker Station equipment will be installed at King St. and PG Plaza. Systemwide cable meggering and cable replacement are on-going efforts throughout the year. Improved rail power infrastructure allows Metro to increase the number of eight-car trains it can run on the system. This will improve service and reliability measured by the MyTripTime key performance indicator (KPI).
Cost ($M) Fiscal Year Budget Actual
LTD Expenses 104.8 FY2020 54.7 FY2021 17.5 FY2022 17.9 FY2023 17.9 FY2024 17.9 FY2025 17.9 FY2026 17.9 FY2021-2026 Total 106.8 Total Cost 266.2
Anticipated Funding Sources Funding Source(s) for FY2021 Amount ($M)
Dedicated Funding 17.5 Total Project Cost 17.5
Fiscal Year FY20 FY21 FY22 FY23 FY24 FY25 FY26 FY27 FY28 FY29 FY30
PLANNING
Needs Identification
Development and Evaluation
EXECUTION
Project Development
Implementation
✔ ✔ ✔ ✔ ✔ ✔ ✔ ✔ ✔ ✔ ✔

Appendix D – Capital Projects
133
(CIP0086) Shepherd Parkway Bus Facility
Initiative Type: Project Mode: Bus Invest. Category: Bus and Paratransit Investments Invest. Program: Bus Maintenance Facilities
Description
This project will perform the design and construction of the Compressed Natural Gas (CNG) facility at Shephard Parkway.
Strategic Objectives Supported
Safety Cust. Sat. Reliability Ridership Op. Impact
Location
Shephard Parkway Bus Garage - Blue Plains
Outcome
In FY2021, Metro will complete design and construction of new CNG facility. This project supports state of good repair of Metro's infrastructure.
Cost ($M) Fiscal Year Budget Actual
LTD Expenses 2.1 FY2020 0.1 FY2021 3.2 FY2022 0.0 FY2023 0.0 FY2024 0.0 FY2025 0.0 FY2026 0.0 FY2021-2026 Total 3.2 Total Cost 5.3
Anticipated Funding Sources Funding Source(s) for FY2021 Amount ($M)
Formula Programs 3.2 Total Project Cost 3.2
Fiscal Year FY20 FY21 FY22 FY23 FY24 FY25 FY26 FY27 FY28 FY29 FY30
PLANNING
Needs Identification
Development and Evaluation
EXECUTION
Project Development
Implementation
✔ ✔

134
Appendix D – Capital Projects
(CIP0087) Station Rehabilitation Program
Initiative Type: Program Mode: Rail Invest. Category: Station and Passenger Facilities
Investments Invest. Program: Platforms & Structures
Description
Twenty-four stations are scheduled for rehabilitation every year which results in each station receiving rehabilitation every four years. This program consists of evaluation of station condition, replacement of worn materials, and a thorough cleaning and power washing of all concrete and architectural features.
Strategic Objectives Supported
Safety Cust. Sat. Reliability Ridership Op. Impact
Location
Systemwide
Outcome
In FY2021, full rehabilitations of stations will consist of cleaning and power washing of all concrete and architectural features and repair of worn interior fixtures. The schedule of stations for FY2021 is still being determined. This program improves the quality of rail service provided for customers at stations and keeps features in a state of good repair.
Cost ($M) Fiscal Year Budget Actual
FY2020 11.0 FY2021 19.8 FY2022 19.0 FY2023 23.5 FY2024 19.6 FY2025 17.6 FY2026 18.0 FY2021-2026 Total 117.4 Total Cost 128.5
Anticipated Funding Sources Funding Source(s) for FY2021 Amount ($M)
System Perform 9.2 Dedicated Funding 10.6 Total Project Cost 19.8
Fiscal Year FY20 FY21 FY22 FY23 FY24 FY25 FY26 FY27 FY28 FY29 FY30
PLANNING
Needs Identification ✔
Development and Evaluation ✔ ✔
EXECUTION
Project Development ✔
Implementation
✔ ✔ ✔ ✔ ✔ ✔ ✔ ✔ ✔ ✔ ✔

Appendix D – Capital Projects
135
(CIP0088) Station Entrance Canopies
Initiative Type: Project Mode: Rail Invest. Category: Station and Passenger Facilities
Investments Invest. Program: Platforms & Structures
Description
This project provides for installation of canopies over the remaining eleven stations with exposed escalators to protect both riders and escalators from weather. Canopies will aid in maintaining the State of Good Repair.
Strategic Objectives Supported
Safety Cust. Sat. Reliability Ridership Op. Impact
Location
Systemwide
Outcome
In FY2021, Metro will award the contract for station canopies and fixed stairwells at nine locations. This project enhances customer satisfaction and reliability based on the Escalator Availability key performance indicator (KPI).
Cost ($M) Fiscal Year Budget Actual
LTD Expenses 29.3 FY2020 9.0 FY2021 7.3 FY2022 5.6 FY2023 5.7 FY2024 3.0 FY2025 1.0 FY2026 1.0 FY2021-2026 Total 23.5 Total Cost 61.8
Anticipated Funding Sources Funding Source(s) for FY2021 Amount ($M)
Formula Programs 7.3 Total Project Cost 7.3
Fiscal Year FY20 FY21 FY22 FY23 FY24 FY25 FY26 FY27 FY28 FY29 FY30
PLANNING
Needs Identification ✔
Development and Evaluation ✔ ✔
EXECUTION
Project Development ✔ ✔ ✔
Implementation
✔ ✔ ✔ ✔ ✔ ✔ ✔ ✔ ✔ ✔ ✔

136
Appendix D – Capital Projects
(CIP0102) Metro Transit Police Department (MTPD) District III Substation Construction
Initiative Type: Project Mode: Systemwide Invest. Category: Business Support Investments Invest. Program: MTPD
Description
Renovate existing child care facility at Morgan Boulevard station to serve as a police substation with administrative office workspace, locker rooms, break room, gym, interview rooms, and other workspaces.
Strategic Objectives Supported
Safety Cust. Sat. Reliability Ridership Op. Impact
Location
Prince George's County
Outcome
This project will design and construct a new police substation in the vicinity of the Morgan Boulevard station in Maryland to provide adequate police coverage. This project helps maintain Metro's security and state of good repair.
Cost ($M) Fiscal Year Budget Actual
LTD Expenses 1.0 FY2020 1.0 FY2021 2.0 FY2022 0.0 FY2023 0.0 FY2024 0.0 FY2025 0.0 FY2026 0.0 FY2021-2026 Total 2.0 Total Cost 3.9
Anticipated Funding Sources Funding Source(s) for FY2021 Amount ($M)
Dedicated Funding 2.0 Total Project Cost 2.0
Fiscal Year FY20 FY21 FY22 FY23 FY24 FY25 FY26 FY27 FY28 FY29 FY30
PLANNING
Needs Identification
Development and Evaluation ✔
EXECUTION
Project Development ✔
Implementation
✔ ✔

Appendix D – Capital Projects
137
(CIP0108) Rhode Island Avenue Metrorail Station Platform Rehabilitation
Initiative Type: Project Mode: Rail Invest. Category: Station and Passenger Facilities
Investments Invest. Program: Platforms & Structures
Description
This project will rehabilitate the Rhode Island Avenue station platform structure, as well as life-safety systems and station ammenities to improve the customer experience.
Strategic Objectives Supported
Safety Cust. Sat. Reliability Ridership Op. Impact
Location
Rhode Island Ave. Station
Outcome
Previously, each side of the platform and portions of the structure that cross over the roadway below were repaired under single-track conditions, focusing on concrete spalling and structural repair. A future year effort will address all other station systems and customer improvements to align this station with other Station Platform Rehabilitation Programs. No planned deliverables in FY21. Project will commence between FY2022 and FY2026. This project increases the lifespan of assets, reduces future maintenance requirements and improves the quality of rail service provided for customers.
Cost ($M) Fiscal Year Budget Actual
LTD Expenses 18.7 FY2020 0.0 FY2021 0.0 FY2022 0.0 FY2023 1.0 FY2024 9.0 FY2025 0.0 FY2026 0.0 FY2021-2026 Total 10.0 Total Cost 28.7
Anticipated Funding Sources Funding Source(s) for FY2021 Amount ($M)
Total Project Cost
Fiscal Year FY20 FY21 FY22 FY23 FY24 FY25 FY26 FY27 FY28 FY29 FY30
PLANNING
Needs Identification
Development and Evaluation
EXECUTION
Project Development ✔
Implementation
✔ ✔

138
Appendix D – Capital Projects
(CIP0131) Capital Program Financing
Initiative Type: Program Mode: Systemwide Invest. Category: Business Support Investments Invest. Program: Support
Equipment/Services
Description
Availability fees and interest expense for Metro's short-term line of credit used for capital program expenditures.
Strategic Objectives Supported
Safety Cust. Sat. Reliability Ridership Op. Impact
Location
Systemwide
Outcome
In FY2021, Metro will continue to fund the lines of credit and interim financing costs necessary to finance capital program cash flow needs. This project supports Metro's financial responsibility.
Cost ($M) Fiscal Year Budget Actual
FY2020 0.8 FY2021 1.0 FY2022 1.0 FY2023 1.0 FY2024 1.0 FY2025 1.0 FY2026 1.0 FY2021-2026 Total 6.0 Total Cost 6.8
Anticipated Funding Sources Funding Source(s) for FY2021 Amount ($M)
System Perform 1.0 Total Project Cost 1.0
Fiscal Year FY20 FY21 FY22 FY23 FY24 FY25 FY26 FY27 FY28 FY29 FY30
PLANNING
Needs Identification
Development and Evaluation
EXECUTION
Project Development
Implementation
✔ ✔ ✔ ✔ ✔ ✔ ✔ ✔ ✔ ✔ ✔

Appendix D – Capital Projects
139
(CIP0132) Escalator and Elevator Overhaul
Initiative Type: Program Mode: Rail Invest. Category: Station and Passenger Facilities
Investments Invest. Program: Vertical Transportation
Description
Rehabilitate or replace escalator and elevator components based on WMATA asset management criteria.
Strategic Objectives Supported
Safety Cust. Sat. Reliability Ridership Op. Impact
Location
Systemwide
Outcome
In FY2021, Metro will replace speed reducer motors, and rack and axle units; refurbish gearboxes, brake board and escalator steps. Additionally, production of 10,000 steps for replacement will begin. This program improves service based on the Escalator and Elevator key performance indicators (KPIs).
Cost ($M) Fiscal Year Budget Actual
FY2020 11.6 FY2021 6.0 FY2022 6.6 FY2023 6.6 FY2024 6.6 FY2025 6.6 FY2026 6.6 FY2021-2026 Total 39.2 Total Cost 50.8
Anticipated Funding Sources Funding Source(s) for FY2021 Amount ($M)
Dedicated Funding 6.0 Total Project Cost 6.0
Fiscal Year FY20 FY21 FY22 FY23 FY24 FY25 FY26 FY27 FY28 FY29 FY30
PLANNING
Needs Identification
Development and Evaluation
EXECUTION
Project Development ✔ ✔ ✔ ✔ ✔ ✔ ✔ ✔ ✔ ✔ ✔
Implementation
✔ ✔ ✔ ✔ ✔ ✔ ✔ ✔ ✔ ✔ ✔

140
Appendix D – Capital Projects
(CIP0136) Radio Infrastructure Replacement
Initiative Type: Project Mode: Rail Invest. Category: Rail Systems Investments Invest. Program: Signals & Communications
Description
This project will replace the existing Metro Comprehensive Radio Communications System (CRCS) operating in 450-490 MHz frequency band (also referred to as T-Band) with a new system operating in the 700 MHz band, as required by the Federal Communications Commission (FCC) T-Band relocation requirement that affects the Metro's Ultra High Frequency radio system. The project will also install wireless signal communications throughout the tunnel system allowing customers to utilize cellular and data service while underground.
Strategic Objectives Supported
Safety Cust. Sat. Reliability Ridership Op. Impact
Location
Systemwide
Outcome
In FY2021, Metro plans to continue the 700/800 MHz Station installation, to order additional subscriber units in vehicles and handheld radios, and to install the remaining Metro box enclosures that support the Distributed Antenna System (DAS) to cover Metro's above and underground system for both radio and cellular use. Increasing communications supports customer service and safety.
Cost ($M) Fiscal Year Budget Actual
LTD Expenses 179.6 FY2020 74.5 FY2021 60.5 FY2022 22.1 FY2023 19.1 FY2024 15.5 FY2025 16.3 FY2026 0.3 FY2021-2026 Total 133.9 Total Cost 387.9
Anticipated Funding Sources Funding Source(s) for FY2021 Amount ($M)
PRIIA 60.0 System Perform 0.5 Total Project Cost 60.5
Fiscal Year FY20 FY21 FY22 FY23 FY24 FY25 FY26 FY27 FY28 FY29 FY30
PLANNING
Needs Identification
Development and Evaluation
EXECUTION
Project Development
Implementation
✔ ✔ ✔ ✔ ✔ ✔ ✔

Appendix D – Capital Projects
141
(CIP0142) Railcar Preventive Maintenance
Initiative Type: Program Mode: Rail Invest. Category: Railcar Investments Invest. Program: Railcar
Maintenance/Overhaul
Description
Provide preventive maintenance of the railcar fleet.
Strategic Objectives Supported
Safety Cust. Sat. Reliability Ridership Op. Impact
Location
Systemwide
Outcome
Cost to inspect and perform scheduled maintenance on railcars. This program supports state of good repair and reliability.
Cost ($M) Fiscal Year Budget Actual
FY2020 59.0 FY2021 59.0 FY2022 59.0 FY2023 59.0 FY2024 59.0 FY2025 59.0 FY2026 59.0 FY2021-2026 Total 354.0 Total Cost 413.0
Anticipated Funding Sources Funding Source(s) for FY2021 Amount ($M)
Formula Programs 59.0 Total Project Cost 59.0
Fiscal Year FY20 FY21 FY22 FY23 FY24 FY25 FY26 FY27 FY28 FY29 FY30
PLANNING
Needs Identification
Development and Evaluation
EXECUTION
Project Development
Implementation
✔ ✔ ✔ ✔ ✔ ✔ ✔ ✔ ✔ ✔ ✔

142
Appendix D – Capital Projects
(CIP0143) Bus Preventive Maintenance Program
Initiative Type: Program Mode: Bus Invest. Category: Bus and Paratransit Investments Invest. Program: Bus Maintenance/Overhaul
Description
Inspect and service buses and bus components to preserve and extend functionality of the vehicle.
Strategic Objectives Supported
Safety Cust. Sat. Reliability Ridership Op. Impact
Location
Systemwide
Outcome
Cost to inspect and perform scheduled maintenance on the bus fleet. This program supports state of good repair and reliablity
Cost ($M) Fiscal Year Budget Actual
FY2020 1.0 FY2021 1.0 FY2022 1.0 FY2023 1.0 FY2024 1.0 FY2025 1.0 FY2026 1.0 FY2021-2026 Total 6.0 Total Cost 7.0
Anticipated Funding Sources Funding Source(s) for FY2021 Amount ($M)
Formula Programs 1.0 Total Project Cost 1.0
Fiscal Year FY20 FY21 FY22 FY23 FY24 FY25 FY26 FY27 FY28 FY29 FY30
PLANNING
Needs Identification
Development and Evaluation
EXECUTION
Project Development
Implementation
✔ ✔ ✔ ✔ ✔ ✔ ✔ ✔ ✔ ✔ ✔

Appendix D – Capital Projects
143
(CIP0145) Station and Yard Security Upgrades
Initiative Type: Program Mode: Rail Invest. Category: Railcar Investments Invest. Program: Railcar Maintenance
Facilities
Description
This program will provide for the hardening and enhancement of security at various rail yards, stations, and facilities by installing CCTV surveillance and additional security measures.
Strategic Objectives Supported
Safety Cust. Sat. Reliability Ridership Op. Impact
Location
Systemwide
Outcome
In FY2021, Metro plans to evaluate current parking facility cameras and continue multi-system Life Safety and Security upgrades at various stations. Metro will also complete CCTV and security upgrades at Shady Grove, Greenbelt, and Glenmont yard facilities. This project supports Metro's security and customer satisfaction goals.
Cost ($M) Fiscal Year Budget Actual
FY2020 9.9 FY2021 10.8 FY2022 12.5 FY2023 15.9 FY2024 17.9 FY2025 15.6 FY2026 9.2 FY2021-2026 Total 81.8 Total Cost 91.7
Anticipated Funding Sources Funding Source(s) for FY2021 Amount ($M)
Other Federal 0.3 Dedicated Funding 10.5 Total Project Cost 10.8
Fiscal Year FY20 FY21 FY22 FY23 FY24 FY25 FY26 FY27 FY28 FY29 FY30
PLANNING
Needs Identification
Development and Evaluation
EXECUTION
Project Development ✔ ✔ ✔ ✔ ✔ ✔ ✔ ✔ ✔ ✔ ✔
Implementation
✔ ✔ ✔ ✔ ✔ ✔ ✔ ✔ ✔ ✔ ✔

144
Appendix D – Capital Projects
(CIP0151) Station Cooling Systems Upgrade
Initiative Type: Program Mode: Rail Invest. Category: Station and Passenger Facilities
Investments Invest. Program: Station Systems
Description
This program funds the rehabilitation of station air conditioning systems including, but not limited to, rehabilitation/replacement of chiller plants, cooling towers, ventilation systems, air handling units and ductwork.
Strategic Objectives Supported
Safety Cust. Sat. Reliability Ridership Op. Impact
Location
Systemwide
Outcome
In FY2021, Metro plans to design and replace chillers at Rosslyn, Stadium Armory, Van Ness-UDC, and L'Enfant Plaza. Station air conditioning units are planned for replacement at Pentagon, DuPont Circle, and Crystal City. Designs to be completed for station air conditioning units at Metro Center, Smithsonian, Judiciary Square, Gallery Place-Chinatown, Federal Triangle, Farragut West, Farragut North, Capitol South, and Potomac Avenue. This program enhances customer satisfaction.
Cost ($M) Fiscal Year Budget Actual
FY2020 20.0 FY2021 11.6 FY2022 12.8 FY2023 16.8 FY2024 10.7 FY2025 10.9 FY2026 11.1 FY2021-2026 Total 74.0 Total Cost 94.0
Anticipated Funding Sources Funding Source(s) for FY2021 Amount ($M)
Formula Programs 11.6 Total Project Cost 11.6
Fiscal Year FY20 FY21 FY22 FY23 FY24 FY25 FY26 FY27 FY28 FY29 FY30
PLANNING
Needs Identification
Development and Evaluation
EXECUTION
Project Development
Implementation
✔ ✔ ✔ ✔ ✔ ✔ ✔ ✔ ✔ ✔ ✔

Appendix D – Capital Projects
145
(CIP0152) Parking Garage and Lot Rehabilitation
Initiative Type: Program Mode: Systemwide Invest. Category: Station and Passenger Facilities
Investments Invest. Program: Platforms & Structures
Description
This program will rehabilitate parking structures including repair of horizontal concrete surfaces, slabs, soffits, beams, columns, walls; repair or replacement of post-tensioning anchorages, tendons, sheathing and expansion joints; application of traffic markings and traffic bearing membrane.
Strategic Objectives Supported
Safety Cust. Sat. Reliability Ridership Op. Impact
Location
Systemwide
Outcome
In FY2021, Metro will complete the rehabilitation of the parking garage located at Addison Road. Begin the rehabilitation of four parking garages to include Wheaton, PG Plaza, Anacostia and Glenmont. Complete rehabilitation of three surface lots located at Landover, Naylor Road, and Capitol Heights. This program helps keep assets in a state of good repair and provides enhanced customer satisfaction.
Cost ($M) Fiscal Year Budget Actual
FY2020 9.4 FY2021 11.8 FY2022 9.0 FY2023 10.0 FY2024 10.0 FY2025 13.0 FY2026 13.0 FY2021-2026 Total 66.8 Total Cost 76.2
Anticipated Funding Sources Funding Source(s) for FY2021 Amount ($M)
Formula Programs 11.6 Dedicated Funding 0.2 Total Project Cost 11.8
Fiscal Year FY20 FY21 FY22 FY23 FY24 FY25 FY26 FY27 FY28 FY29 FY30
PLANNING
Needs Identification
Development and Evaluation
EXECUTION
Project Development ✔ ✔ ✔ ✔ ✔ ✔ ✔ ✔ ✔ ✔ ✔
Implementation
✔ ✔ ✔ ✔ ✔ ✔ ✔ ✔ ✔ ✔ ✔

146
Appendix D – Capital Projects
(CIP0170) Roof Rehabilitation and Replacement
Initiative Type: Program Mode: Systemwide Invest. Category: Business Support Investments Invest. Program: Support
Equipment/Services
Description
Roof rehabilitation or replacement, as needed, at approximately 660 Metro locations. Project includes preparation of assessment report, sampling, removal, and installation of new roofing system.
Strategic Objectives Supported
Safety Cust. Sat. Reliability Ridership Op. Impact
Location
Systemwide
Outcome
In FY2021, Metro will complete roof replacements at Carmen Turner Facility Building D and Landover Bus Maintenance Building. Also, Metro will begin replacements at Metro Supply Facility and Open Material Storage Facility for completion in FY22. This project improves Metro's state of good repair.
Cost ($M) Fiscal Year Budget Actual
FY2020 22.0 FY2021 9.3 FY2022 5.8 FY2023 6.0 FY2024 4.9 FY2025 4.6 FY2026 4.6 FY2021-2026 Total 35.3 Total Cost 57.3
Anticipated Funding Sources Funding Source(s) for FY2021 Amount ($M)
Formula Programs 9.3 Total Project Cost 9.3
Fiscal Year FY20 FY21 FY22 FY23 FY24 FY25 FY26 FY27 FY28 FY29 FY30
PLANNING
Needs Identification
Development and Evaluation
EXECUTION
Project Development ✔ ✔ ✔ ✔ ✔ ✔ ✔ ✔ ✔ ✔ ✔
Implementation
✔ ✔ ✔ ✔ ✔ ✔ ✔ ✔ ✔ ✔ ✔

Appendix D – Capital Projects
147
(CIP0185) Escalator Replacement
Initiative Type: Program Mode: Rail Invest. Category: Station and Passenger Facilities
Investments Invest. Program: Vertical Transportation
Description
Replacement of escalators that have reached the end of their useful life.
Strategic Objectives Supported
Safety Cust. Sat. Reliability Ridership Op. Impact
Location
Systemwide
Outcome
The replacement of eight units are planned for FY21, specific locations to be determined.Modernized units are as much as 30% more energy efficient than the old units due to premium efficiency motors and adjustable frequency drives. This program improves service based on the Escalator Reliability key performance indicator (KPI).
Cost ($M) Fiscal Year Budget Actual
FY2020 11.4 FY2021 22.0 FY2022 33.7 FY2023 33.7 FY2024 33.7 FY2025 30.4 FY2026 20.4 FY2021-2026 Total 173.8 Total Cost 185.2
Anticipated Funding Sources Funding Source(s) for FY2021 Amount ($M)
PRIIA 22.0 Total Project Cost 22.0
Fiscal Year FY20 FY21 FY22 FY23 FY24 FY25 FY26 FY27 FY28 FY29 FY30
PLANNING
Needs Identification
Development and Evaluation
EXECUTION
Project Development ✔ ✔ ✔ ✔ ✔ ✔ ✔ ✔ ✔ ✔ ✔
Implementation
✔ ✔ ✔ ✔ ✔ ✔ ✔ ✔ ✔ ✔ ✔
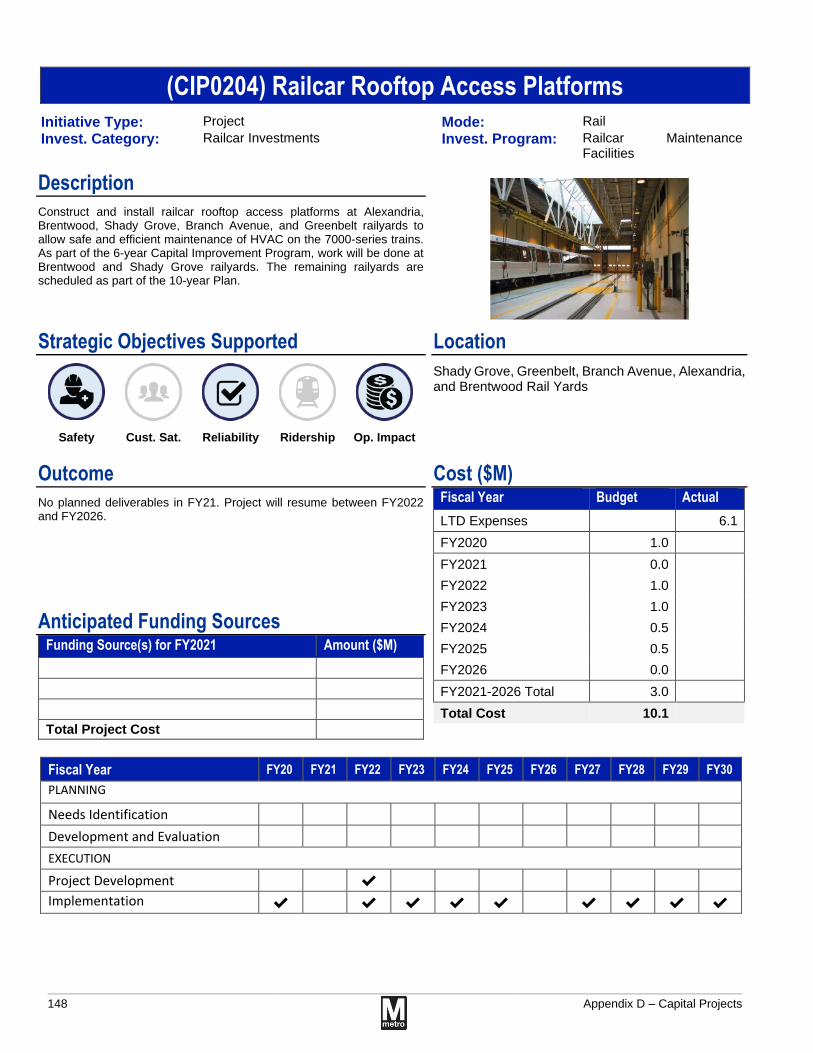
148
Appendix D – Capital Projects
(CIP0204) Railcar Rooftop Access Platforms
Initiative Type: Project Mode: Rail Invest. Category: Railcar Investments Invest. Program: Railcar Maintenance
Facilities
Description
Construct and install railcar rooftop access platforms at Alexandria, Brentwood, Shady Grove, Branch Avenue, and Greenbelt railyards to allow safe and efficient maintenance of HVAC on the 7000-series trains. As part of the 6-year Capital Improvement Program, work will be done at Brentwood and Shady Grove railyards. The remaining railyards are scheduled as part of the 10-year Plan.
Strategic Objectives Supported
Safety Cust. Sat. Reliability Ridership Op. Impact
Location
Shady Grove, Greenbelt, Branch Avenue, Alexandria, and Brentwood Rail Yards
Outcome
No planned deliverables in FY21. Project will resume between FY2022 and FY2026.
Cost ($M) Fiscal Year Budget Actual
LTD Expenses 6.1 FY2020 1.0 FY2021 0.0 FY2022 1.0 FY2023 1.0 FY2024 0.5 FY2025 0.5 FY2026 0.0 FY2021-2026 Total 3.0 Total Cost 10.1
Anticipated Funding Sources Funding Source(s) for FY2021 Amount ($M)
Total Project Cost
Fiscal Year FY20 FY21 FY22 FY23 FY24 FY25 FY26 FY27 FY28 FY29 FY30
PLANNING
Needs Identification
Development and Evaluation
EXECUTION
Project Development ✔
Implementation
✔ ✔ ✔ ✔ ✔ ✔ ✔ ✔ ✔

Appendix D – Capital Projects
149
(CIP0206) Carmen Turner Facility (CTF) Electrical Upgrade
Initiative Type: Project Mode: Bus Invest. Category: Bus and Paratransit Investments Invest. Program: Bus Maintenance Facilities
Description
This project will provide a more reliable power source for Metro-critical functions at CTF. The project also reconfigures and realigns portions of the electrical distribution system for more efficient distribution.
Strategic Objectives Supported
Safety Cust. Sat. Reliability Ridership Op. Impact
Location
Carmen Turner Facility - Landover
Outcome
No planned deliverables in FY2021. Project will resume between FY2022 and FY2026.
Cost ($M) Fiscal Year Budget Actual
LTD Expenses 5.5 FY2020 0.0 FY2021 0.0 FY2022 0.0 FY2023 0.0 FY2024 0.3 FY2025 0.0 FY2026 2.5 FY2021-2026 Total 2.8 Total Cost 8.2
Anticipated Funding Sources Funding Source(s) for FY2021 Amount ($M)
Total Project Cost
Fiscal Year FY20 FY21 FY22 FY23 FY24 FY25 FY26 FY27 FY28 FY29 FY30
PLANNING
Needs Identification
Development and Evaluation ✔
EXECUTION
Project Development ✔ ✔
Implementation
✔

150
Appendix D – Capital Projects
(CIP0210) Pollution Prevention at Track Fueling Areas
Initiative Type: Program Mode: Systemwide Invest. Category: Business Support Investments Invest. Program: Support
Equipment/Services
Description
Modify railyard equipment fueling areas to contain fuel spills and comply with environmental regulations.
Strategic Objectives Supported
Safety Cust. Sat. Reliability Ridership Op. Impact
Location
Systemwide
Outcome
In FY2021, Metro will modify track fueling areas at two yard locations. This project supports safety, state of good repair, and regulatory compliance goals.
Cost ($M) Fiscal Year Budget Actual
FY2020 0.5 FY2021 0.5 FY2022 0.2 FY2023 1.5 FY2024 2.0 FY2025 1.5 FY2026 1.5 FY2021-2026 Total 7.2 Total Cost 7.7
Anticipated Funding Sources Funding Source(s) for FY2021 Amount ($M)
System Perform 0.5 Total Project Cost 0.5
Fiscal Year FY20 FY21 FY22 FY23 FY24 FY25 FY26 FY27 FY28 FY29 FY30
PLANNING
Needs Identification
Development and Evaluation ✔
EXECUTION
Project Development ✔ ✔ ✔
Implementation
✔ ✔ ✔ ✔ ✔

Appendix D – Capital Projects
151
(CIP0211) Stormwater Facility Assessment
Initiative Type: Program Mode: Systemwide Invest. Category: Business Support Investments Invest. Program: Support
Equipment/Services
Description
This project identifies, evaluates, designs and implements modifications to Metro's existing storm water management infrastructure and facilities to provide best management practices which comply with federal, state, and local storm water management requirements.
Strategic Objectives Supported
Safety Cust. Sat. Reliability Ridership Op. Impact
Location
Systemwide
Outcome
In FY2021, Metro will provide design, rehabilitate and maintain storm water systems, including ponds and pretreatment structures, based on a comprehensive plan currently in development. Metro will also install underground utilities to convey storm water runoff to pretreatment structures and make necessary connections to the storm sewer system. This project supports safety, state of good repair, and regulatory compliance goals.
Cost ($M) Fiscal Year Budget Actual
FY2020 0.4 FY2021 0.9 FY2022 1.6 FY2023 2.4 FY2024 2.4 FY2025 1.3 FY2026 0.6 FY2021-2026 Total 9.1 Total Cost 9.5
Anticipated Funding Sources Funding Source(s) for FY2021 Amount ($M)
System Perform 0.9 Total Project Cost 0.9
Fiscal Year FY20 FY21 FY22 FY23 FY24 FY25 FY26 FY27 FY28 FY29 FY30
PLANNING
Needs Identification ✔
Development and Evaluation ✔
EXECUTION
Project Development ✔ ✔ ✔ ✔ ✔ ✔ ✔ ✔ ✔ ✔ ✔
Implementation
✔ ✔ ✔ ✔ ✔ ✔ ✔ ✔ ✔ ✔ ✔

152
Appendix D – Capital Projects
(CIP0212) Environmental Sustainability Lab
Initiative Type: Program Mode: Systemwide Invest. Category: Business Support Investments Invest. Program: Support
Equipment/Services
Description
Develops and pilots projects to reduce consumption of energy and water, and to reduce waste.
Strategic Objectives Supported
Safety Cust. Sat. Reliability Ridership Op. Impact
Location
Systemwide
Outcome
In FY2021, Metro will support the development of four parking sites, as identified in the solar development plan currently underway, for future lease to third parties to install and use solar panels and power equipment. Metro will also continue making improvements to the waste management and recycling processes throughout the system. This project improves Metro's financial responsibility and supports our sustainability efforts.
Cost ($M) Fiscal Year Budget Actual
FY2020 1.0 FY2021 1.0 FY2022 1.0 FY2023 1.0 FY2024 1.0 FY2025 1.0 FY2026 1.0 FY2021-2026 Total 6.0 Total Cost 7.0
Anticipated Funding Sources Funding Source(s) for FY2021 Amount ($M)
System Perform 1.0 Total Project Cost 1.0
Fiscal Year FY20 FY21 FY22 FY23 FY24 FY25 FY26 FY27 FY28 FY29 FY30
PLANNING
Needs Identification
Development and Evaluation
EXECUTION
Project Development ✔ ✔ ✔ ✔ ✔ ✔ ✔ ✔ ✔ ✔ ✔
Implementation
✔ ✔ ✔ ✔ ✔ ✔ ✔ ✔ ✔ ✔ ✔

Appendix D – Capital Projects
153
(CIP0213) Capital Program Development Support
Initiative Type: Program Mode: Systemwide Invest. Category: Business Support Investments Invest. Program: Support
Equipment/Services
Description
Staff to support project development, strategic planning, asset management, and sustainability.
Strategic Objectives Supported
Safety Cust. Sat. Reliability Ridership Op. Impact
Location
Systemwide
Outcome
Continuation of business services and support of Metro's development of capital planning, programming, and transit asset management functions. This project improves Metro's financial responsibility and supports our state of good repair efforts.
Cost ($M) Fiscal Year Budget Actual
FY2020 8.0 FY2021 9.9 FY2022 10.1 FY2023 10.1 FY2024 11.1 FY2025 11.1 FY2026 11.1 FY2021-2026 Total 63.4 Total Cost 71.4
Anticipated Funding Sources Funding Source(s) for FY2021 Amount ($M)
System Perform 9.9 Total Project Cost 9.9
Fiscal Year FY20 FY21 FY22 FY23 FY24 FY25 FY26 FY27 FY28 FY29 FY30
PLANNING
Needs Identification
Development and Evaluation
EXECUTION
Project Development
Implementation
✔ ✔ ✔ ✔ ✔ ✔ ✔ ✔ ✔ ✔ ✔

154
Appendix D – Capital Projects
(CIP0218) Station Upgrades
Initiative Type: Project Mode: Systemwide Invest. Category: Station and Passenger Facilities
Investments Invest. Program: Platforms & Structures
Description
This project provides upgrades to stations throughout the system to improve passenger flow and customer experience.
Strategic Objectives Supported
Safety Cust. Sat. Reliability Ridership Op. Impact
Location
Systemwide
Outcome
By FY2021, Metro will complete the installation of bi-fold gates with emergency exit doors at five stations - Farragut North, Farragut West, Judiciary Square, Smithsonian, and L'Enfant plaza. Metro will also begin upgrades of wayfinding information and Passenger Information Displays (PIDS) at stations throughout the rail system. This project improves station access, increases display visibility, and advances real-time information sharing and supports customer service goals.
Cost ($M) Fiscal Year Budget Actual
LTD Expenses 1.2 FY2020 1.6 FY2021 0.4 FY2022 1.7 FY2023 0.0 FY2024 0.0 FY2025 0.0 FY2026 3.1 FY2021-2026 Total 5.2 Total Cost 8.0
Anticipated Funding Sources Funding Source(s) for FY2021 Amount ($M)
System Perform 0.4 Total Project Cost 0.4
Fiscal Year FY20 FY21 FY22 FY23 FY24 FY25 FY26 FY27 FY28 FY29 FY30
PLANNING
Needs Identification ✔ ✔
Development and Evaluation ✔ ✔ ✔
EXECUTION
Project Development ✔ ✔ ✔
Implementation
✔ ✔ ✔

Appendix D – Capital Projects
155
(CIP0219) Station Lighting Improvements
Initiative Type: Program Mode: Rail Invest. Category: Station and Passenger Facilities
Investments Invest. Program: Station Systems
Description
This program improves the lighting and illumination levels at mezzanines, lower level platforms, and track beds of Metrorail stations.
Strategic Objectives Supported
Safety Cust. Sat. Reliability Ridership Op. Impact
Location
Systemwide
Outcome
Metro will upgrade stations platform edge lights, above ground station lighting, and station site lights. In addition will upgrade ceiling systems, pylon locations, parapet lighting fixture installations, and center platform track beds at various locations. This program reduces Metro's operational expenses and provides additional safety benefits for customers and employees.
Cost ($M) Fiscal Year Budget Actual
FY2020 35.8 FY2021 22.9 FY2022 26.1 FY2023 43.3 FY2024 23.2 FY2025 28.1 FY2026 27.8 FY2021-2026 Total 171.4 Total Cost 207.2
Anticipated Funding Sources Funding Source(s) for FY2021 Amount ($M)
Formula Programs 22.9 Total Project Cost 22.9
Fiscal Year FY20 FY21 FY22 FY23 FY24 FY25 FY26 FY27 FY28 FY29 FY30
PLANNING
Needs Identification ✔
Development and Evaluation ✔
EXECUTION
Project Development ✔ ✔
Implementation
✔ ✔ ✔ ✔ ✔ ✔ ✔ ✔ ✔ ✔ ✔

156
Appendix D – Capital Projects
(CIP0220) Metrobus Planning Program
Initiative Type: Program Mode: Bus Invest. Category: Bus and Paratransit Investments Invest. Program: Bus Passenger
Facilities/Systems
Description
Perform a broad range of Metrobus planning studies necessary to sustain the network of services and facilities. Efforts focus on service plans, customer information, facilities management, bus stop accessibility, transit operations, traffic management and service delivery.
Strategic Objectives Supported
Safety Cust. Sat. Reliability Ridership Op. Impact
Location
Systemwide
Outcome
In FY2021, Metro will complete four studies related to (1) Purple Line/Silver Line Connection Service Evaluation; (2) Service Evaluation Study for G2, D1, and D2 Routes; (3) Service Study/Review of Metro Extra Network Service; and (4) Update to the 5-Year Service Plan. This prorgram supports customer service goals.
Cost ($M) Fiscal Year Budget Actual
FY2020 1.6 FY2021 1.3 FY2022 1.3 FY2023 1.3 FY2024 1.3 FY2025 1.3 FY2026 1.3 FY2021-2026 Total 7.5 Total Cost 9.1
Anticipated Funding Sources Funding Source(s) for FY2021 Amount ($M)
System Perform 1.3 Total Project Cost 1.3
Fiscal Year FY20 FY21 FY22 FY23 FY24 FY25 FY26 FY27 FY28 FY29 FY30
PLANNING
Needs Identification
Development and Evaluation
EXECUTION
Project Development ✔ ✔ ✔ ✔ ✔ ✔ ✔ ✔ ✔ ✔ ✔
Implementation
✔ ✔ ✔ ✔ ✔ ✔ ✔ ✔ ✔ ✔ ✔

Appendix D – Capital Projects
157
(CIP0221) Bus Customer Facility Improvements
Initiative Type: Program Mode: Bus Invest. Category: Bus and Paratransit Investments Invest. Program: Bus Passenger
Facilities/Systems
Description
Project to sustain, replace or renovate Metrobus facilities and amenities to achieve a State of Good Repair and improve delivery of customer information. Additionally, this project will implement industry best practices and improve customer safety at the bus stops.
Strategic Objectives Supported
Safety Cust. Sat. Reliability Ridership Op. Impact
Location
Systemwide
Outcome
In FY2021, Metro will replace (80) identified bus shelter locations, (20) Digital Bus Signs, (113) bus map updates, and bus stop infrastructure improvements (route/sign poles, bus stop decals, wayfinding signage). Additionally, (110) Customer Electronic Information Displays will also be replaced. This program supports customer serivce metrics.
Cost ($M) Fiscal Year Budget Actual
FY2020 4.0 FY2021 5.2 FY2022 11.1 FY2023 11.5 FY2024 3.5 FY2025 2.7 FY2026 1.2 FY2021-2026 Total 35.1 Total Cost 39.1
Anticipated Funding Sources Funding Source(s) for FY2021 Amount ($M)
Formula Programs 5.2 Total Project Cost 5.2
Fiscal Year FY20 FY21 FY22 FY23 FY24 FY25 FY26 FY27 FY28 FY29 FY30
PLANNING
Needs Identification
Development and Evaluation
EXECUTION
Project Development ✔ ✔
Implementation
✔ ✔ ✔ ✔ ✔ ✔ ✔ ✔ ✔ ✔ ✔

158
Appendix D – Capital Projects
(CIP0225) Railcar Heavy Repair and Overhaul Facility
Initiative Type: Project Mode: Rail Invest. Category: Railcar Investments Invest. Program: Railcar Maintenance
Facilities
Description
This project will build a new Heavy Railcar Repair and Overhaul (HRO) Facility in Landover, MD in vicinity of CTF and Main Supply Facility. This will consolidate all Railcar Overhaul functions into a dedicated facility. Currently, Railcar rehabilitation and overhaul are split between Brentwood and Greenbelt Rail Yards.
Strategic Objectives Supported
Safety Cust. Sat. Reliability Ridership Op. Impact
Location
Pennsy Dr. Landover
Outcome
Metro will complete acquisition and relocation, and begin design of new HRO facility and New Carrollton Yard Improvements. When completed the project will support state of good repair and reliablity metrics.
Cost ($M) Fiscal Year Budget Actual
LTD Expenses 1.2 FY2020 60.0 FY2021 10.0 FY2022 25.0 FY2023 25.0 FY2024 45.0 FY2025 98.0 FY2026 133.0 FY2021-2026 Total 336.0 Total Cost 397.2
Anticipated Funding Sources Funding Source(s) for FY2021 Amount ($M)
Dedicated Funding 10.0 Total Project Cost 10.0
Fiscal Year FY20 FY21 FY22 FY23 FY24 FY25 FY26 FY27 FY28 FY29 FY30
PLANNING
Needs Identification ✔
Development and Evaluation ✔ ✔ ✔ ✔
EXECUTION
Project Development ✔ ✔ ✔ ✔ ✔ ✔
Implementation
✔ ✔ ✔ ✔ ✔ ✔ ✔ ✔ ✔

Appendix D – Capital Projects
159
(CIP0241) Raising Vent Shafts
Initiative Type: Project Mode: Rail Invest. Category: Station and Passenger Facilities
Investments Invest. Program: Station Systems
Description
This project will elevate surface barriers of vent shafts which will protect stations from flood waters entering into the rail system.
Strategic Objectives Supported
Safety Cust. Sat. Reliability Ridership Op. Impact
Location
Systemwide
Outcome
This project will continue to assess the effectiveness of previously raised vent shafts and evaluate more comprehensive flood mitigation solutions at stations. The project improves both service and safety key performance indicators (KPIs)
Cost ($M) Fiscal Year Budget Actual
LTD Expenses 4.9 FY2020 0.2 FY2021 2.4 FY2022 1.0 FY2023 1.0 FY2024 1.0 FY2025 1.0 FY2026 0.0 FY2021-2026 Total 6.4 Total Cost 11.4
Anticipated Funding Sources Funding Source(s) for FY2021 Amount ($M)
Other Federal 2.4 Total Project Cost 2.4
Fiscal Year FY20 FY21 FY22 FY23 FY24 FY25 FY26 FY27 FY28 FY29 FY30
PLANNING
Needs Identification ✔
Development and Evaluation ✔ ✔ ✔ ✔ ✔ ✔
EXECUTION
Project Development ✔ ✔ ✔ ✔ ✔
Implementation
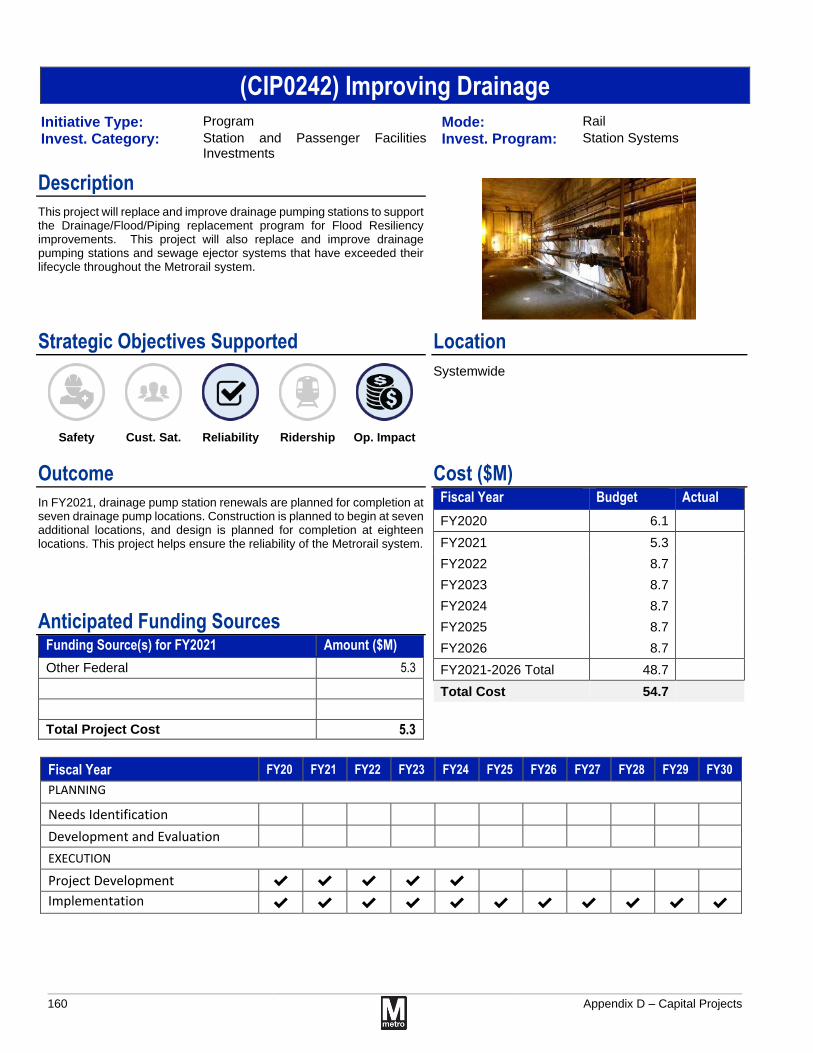
160
Appendix D – Capital Projects
(CIP0242) Improving Drainage
Initiative Type: Program Mode: Rail Invest. Category: Station and Passenger Facilities
Investments Invest. Program: Station Systems
Description
This project will replace and improve drainage pumping stations to support the Drainage/Flood/Piping replacement program for Flood Resiliency improvements. This project will also replace and improve drainage pumping stations and sewage ejector systems that have exceeded their lifecycle throughout the Metrorail system.
Strategic Objectives Supported
Safety Cust. Sat. Reliability Ridership Op. Impact
Location
Systemwide
Outcome
In FY2021, drainage pump station renewals are planned for completion at seven drainage pump locations. Construction is planned to begin at seven additional locations, and design is planned for completion at eighteen locations. This project helps ensure the reliability of the Metrorail system.
Cost ($M) Fiscal Year Budget Actual
FY2020 6.1 FY2021 5.3 FY2022 8.7 FY2023 8.7 FY2024 8.7 FY2025 8.7 FY2026 8.7 FY2021-2026 Total 48.7 Total Cost 54.7
Anticipated Funding Sources Funding Source(s) for FY2021 Amount ($M)
Other Federal 5.3 Total Project Cost 5.3
Fiscal Year FY20 FY21 FY22 FY23 FY24 FY25 FY26 FY27 FY28 FY29 FY30
PLANNING
Needs Identification
Development and Evaluation
EXECUTION
Project Development ✔ ✔ ✔ ✔ ✔
Implementation
✔ ✔ ✔ ✔ ✔ ✔ ✔ ✔ ✔ ✔ ✔

Appendix D – Capital Projects
161
(CIP0246) General Engineering Support
Initiative Type: Program Mode: Rail Invest. Category: Track and Structures Rehabilitation
Investments Invest. Program: Fixed Rail
Description
General engineering support services for the development of architectural/engineering concept designs to help define capital projects needed to resolve priority operational and maintenance problems.
Strategic Objectives Supported
Safety Cust. Sat. Reliability Ridership Op. Impact
Location
Systemwide
Outcome
Activities planned include on-call survey support, computer-aided design (CAD), and LiDAR scanning. This program supports Metrorail operations and maintenance and identifies state of good repair needs.
Cost ($M) Fiscal Year Budget Actual
FY2020 3.1 FY2021 2.5 FY2022 2.6 FY2023 2.6 FY2024 2.6 FY2025 2.6 FY2026 2.6 FY2021-2026 Total 15.3 Total Cost 18.3
Anticipated Funding Sources Funding Source(s) for FY2021 Amount ($M)
System Perform 2.5 Total Project Cost 2.5
Fiscal Year FY20 FY21 FY22 FY23 FY24 FY25 FY26 FY27 FY28 FY29 FY30
PLANNING
Needs Identification
Development and Evaluation
EXECUTION
Project Development
Implementation
✔ ✔ ✔ ✔ ✔ ✔ ✔ ✔ ✔ ✔ ✔

162
Appendix D – Capital Projects
(CIP0247) Emergency Construction Support
Initiative Type: Program Mode: Rail Invest. Category: Track and Structures Rehabilitation
Investments Invest. Program: Fixed Rail
Description
Supports emergency construction across the system.
Strategic Objectives Supported
Safety Cust. Sat. Reliability Ridership Op. Impact
Location
Systemwide
Outcome
This program will address emergency construction needs as they arise, helping to keep the Metrorail system safe and reliable for customers.
Cost ($M) Fiscal Year Budget Actual
FY2020 0.8 FY2021 11.0 FY2022 1.0 FY2023 1.0 FY2024 1.0 FY2025 1.0 FY2026 1.0 FY2021-2026 Total 16.0 Total Cost 16.8
Anticipated Funding Sources Funding Source(s) for FY2021 Amount ($M)
System Perform 1.0 Dedicated Funding 10.0 Total Project Cost 11.0
Fiscal Year FY20 FY21 FY22 FY23 FY24 FY25 FY26 FY27 FY28 FY29 FY30
PLANNING
Needs Identification
Development and Evaluation
EXECUTION
Project Development
Implementation
✔ ✔ ✔ ✔ ✔ ✔ ✔ ✔ ✔ ✔ ✔

Appendix D – Capital Projects
163
(CIP0251) Automatic Train Control SOGR
Initiative Type: Program Mode: Rail Invest. Category: Rail Systems Investments Invest. Program: Signals & Communications
Description
The Automatic Train Control (ATC) rooms and associated Train Control Room (TCR) and wayside equipment are aging. Obsolete and failing equipment must be replaced at intervals ranging from 20 to 40 years.
Strategic Objectives Supported
Safety Cust. Sat. Reliability Ridership Op. Impact
Location
Systemwide
Outcome
In FY2021, Metro plans to complete the switch machine power supply replacements and continue the state of good repair program for high current bonds, interlocking, signals, circuit cable, switch machines, control cable insulation, and train control rooms. This program will increase system reliability and safety key performance indicators (KPIs).
Cost ($M) Fiscal Year Budget Actual
FY2020 30.0 FY2021 25.9 FY2022 34.3 FY2023 45.5 FY2024 33.9 FY2025 24.6 FY2026 19.3 FY2021-2026 Total 183.5 Total Cost 213.6
Anticipated Funding Sources Funding Source(s) for FY2021 Amount ($M)
PRIIA 25.5 System Perform 0.4 Total Project Cost 25.9
Fiscal Year FY20 FY21 FY22 FY23 FY24 FY25 FY26 FY27 FY28 FY29 FY30
PLANNING
Needs Identification ✔ ✔
Development and Evaluation ✔ ✔
EXECUTION
Project Development ✔ ✔ ✔
Implementation
✔ ✔ ✔ ✔ ✔ ✔ ✔ ✔ ✔ ✔ ✔

164
Appendix D – Capital Projects
(CIP0252) Alternating Current (AC) Power Systems SOGR
Initiative Type: Program Mode: Rail Invest. Category: Rail Systems Investments Invest. Program: Propulsion
Description
This program consists of continuously improving and maintaining existing AC power systems in a State of Good Repair (SOGR) in order to deliver safe and reliable Metrorail operations. Obsolete and failing equipment must be replaced at intervals ranging from eighteen to forty years.
Strategic Objectives Supported
Safety Cust. Sat. Reliability Ridership Op. Impact
Location
Farragut West, Foggy Bottom, Arlington Cemetary, Crystal City, Deanwood, East Falls Church, Vienna, Gallery Place, Silver Spring
Outcome
This program will complete installation of new AC switchgear, transformers, cabling, and electrical panels for five station locations. AC switchgear upgrades which began in FY2020 at four locations will be completed. Uninterruptible Power Supplies (UPS), will be replaced systemwide at a rate of 20 units annually. Programmable Logic Control (PLC) panels will continue a three year replacement effort at various AC rooms systemwide where current technology has reached the end of its useful life and will conclude in FY2022. This program will improve service and reliability based on the Metro-established MyTripTime key performance indicator (KPI).
Cost ($M) Fiscal Year Budget Actual
FY2020 24.8 FY2021 19.5 FY2022 20.2 FY2023 26.6 FY2024 26.6 FY2025 26.6 FY2026 26.6 FY2021-2026 Total 146.1 Total Cost 171.0
Anticipated Funding Sources Funding Source(s) for FY2021 Amount ($M)
Formula Programs 7.9 System Perform 0.1 Dedicated Funding 11.5 Total Project Cost 19.5
Fiscal Year FY20 FY21 FY22 FY23 FY24 FY25 FY26 FY27 FY28 FY29 FY30
PLANNING
Needs Identification
Development and Evaluation
EXECUTION
Project Development ✔ ✔ ✔ ✔ ✔ ✔ ✔ ✔ ✔ ✔ ✔
Implementation
✔ ✔ ✔ ✔ ✔ ✔ ✔ ✔ ✔ ✔ ✔

Appendix D – Capital Projects
165
(CIP0253) Traction Power SOGR
Initiative Type: Program Mode: Rail Invest. Category: Rail Systems Investments Invest. Program: Propulsion
Description
This program replaces traction power related components which are beyond or nearing the end of their useful life to maintain a reliable traction power system. This work includes equipment in both traction power substations and tie break stations, cabling, current and resistance testing, transformer replacements, and other ancillary components.
Strategic Objectives Supported
Safety Cust. Sat. Reliability Ridership Op. Impact
Location
Rosslyn, West Falls Church, Cleveland Park
Outcome
This program will replace cable tray at Rosslyn which has degraded. Traction Power Substation equipment will be replaced at West Falls Church and Cleveland Park. Priority transformer replacement at eight locations will be performed. Approximately 600 cables will be meggered and 6,800 linear feet of cable will be replaced per quarter. This program will improve service and reliability based on the Metro-established MyTripTime key performance indicator (KPI) through improving rail infrastructure condition.
Cost ($M) Fiscal Year Budget Actual
FY2020 43.7 FY2021 38.5 FY2022 31.1 FY2023 39.1 FY2024 37.8 FY2025 34.1 FY2026 31.1 FY2021-2026 Total 211.7 Total Cost 255.4
Anticipated Funding Sources Funding Source(s) for FY2021 Amount ($M)
Formula Programs 30.5 System Perform 3.6 Dedicated Funding 4.4 Total Project Cost 38.5
Fiscal Year FY20 FY21 FY22 FY23 FY24 FY25 FY26 FY27 FY28 FY29 FY30
PLANNING
Needs Identification ✔
Development and Evaluation ✔ ✔ ✔
EXECUTION
Project Development ✔ ✔ ✔ ✔ ✔ ✔
Implementation
✔ ✔ ✔ ✔ ✔ ✔ ✔ ✔ ✔ ✔ ✔

166
Appendix D – Capital Projects
(CIP0255) Fare Collection Modernization Program
Initiative Type: Project Mode: Systemwide Invest. Category: Station and Passenger Facilities
Investments Invest. Program: Station Systems
Description
Replacement of Metro's Fare Collection systems in rail stations and aboard Metrobuses.
Strategic Objectives Supported
Safety Cust. Sat. Reliability Ridership Op. Impact
Location
Systemwide
Outcome
Metro has begun systemwide replacement of the entire fare collection system. In FY2021, Metro will continue development and engineering of the new rail faregates and supporting systems and will begin installing the new gates. Procurement of new bus fareboxes and support equipment will also continue. Additionally Metro will continue development to provide customers the flexibility to pay for trips, purchase monthly passes, and manage SmarTrip accounts from a mobile application. This project both enhances the customer experience and mitigates fare evasion.
Cost ($M) Fiscal Year Budget Actual
LTD Expenses 17.7 FY2020 26.0 FY2021 22.4 FY2022 48.9 FY2023 59.3 FY2024 35.8 FY2025 15.7 FY2026 8.5 FY2021-2026 Total 190.7 Total Cost 234.3
Anticipated Funding Sources Funding Source(s) for FY2021 Amount ($M)
Dedicated Funding 22.4 Total Project Cost 22.4
Fiscal Year FY20 FY21 FY22 FY23 FY24 FY25 FY26 FY27 FY28 FY29 FY30
PLANNING
Needs Identification ✔ ✔
Development and Evaluation ✔ ✔
EXECUTION
Project Development ✔ ✔ ✔
Implementation
✔ ✔ ✔ ✔ ✔ ✔ ✔

Appendix D – Capital Projects
167
(CIP0256) 7000 Series Railcars Procurement
Initiative Type: Project Mode: Rail Invest. Category: Railcar Investments Invest. Program: Railcar Acquisition
Description
This project procures 620 of the 7000 Series railcars to replace the 1000, 4000, 5000 Series fleets, plus 28 additional railcars.
Strategic Objectives Supported
Safety Cust. Sat. Reliability Ridership Op. Impact
Location
Systemwide
Outcome
In FY2021, Metro will make milestone payments for 130 railcars which completed two-year warranty period, complete enhanced troubleshooting on 7000 series vehicles , make software modifications related the Auto Train Control functions, and begin 7000 series railcar cab simulator production. This project supports safety and state of good repair metrics.
Cost ($M) Fiscal Year Budget Actual
LTD Expenses 933.5 FY2020 140.0 FY2021 44.8 FY2022 44.0 FY2023 43.6 FY2024 36.5 FY2025 35.7 FY2026 30.0 FY2021-2026 Total 234.5 Total Cost 1,308.0
Anticipated Funding Sources Funding Source(s) for FY2021 Amount ($M)
PRIIA 44.8 Total Project Cost 44.8
Fiscal Year FY20 FY21 FY22 FY23 FY24 FY25 FY26 FY27 FY28 FY29 FY30
PLANNING
Needs Identification
Development and Evaluation
EXECUTION
Project Development ✔
Implementation
✔ ✔ ✔ ✔ ✔ ✔ ✔ ✔ ✔

168
Appendix D – Capital Projects
(CIP0257) Emergency Trip Station Infrastructure
Initiative Type: Project Mode: Rail Invest. Category: Rail Systems Investments Invest. Program: Signals & Communications
Description
The existing ETS system has an aging, deteriorating infrastructure and utilizes obsolete electrical components and communications technology. This project funds upgrades to the Rail Right-Of-Way (ROW) Emergency Trip Station (ETS) telephones. The new ETS Telephone system will replace the existing ETS telephone instruments with intelligent telephones that can perform self-diagnosis.
Strategic Objectives Supported
Safety Cust. Sat. Reliability Ridership Op. Impact
Location
Systemwide
Outcome
No planned deliverables in FY21. Project will commence between FY2022 and FY2026. This project will provide customers and Metro employees with more reliable communications in the event of emergencies supporting Metro's safety metrics.
Cost ($M) Fiscal Year Budget Actual
LTD Expenses 2.0 FY2020 2.4 FY2021 0.0 FY2022 3.9 FY2023 7.8 FY2024 10.5 FY2025 10.3 FY2026 16.5 FY2021-2026 Total 49.0 Total Cost 53.4
Anticipated Funding Sources Funding Source(s) for FY2021 Amount ($M)
Total Project Cost
Fiscal Year FY20 FY21 FY22 FY23 FY24 FY25 FY26 FY27 FY28 FY29 FY30
PLANNING
Needs Identification
Development and Evaluation ✔ ✔
EXECUTION
Project Development ✔ ✔
Implementation
✔ ✔ ✔ ✔ ✔ ✔ ✔ ✔ ✔

Appendix D – Capital Projects
169
(CIP0258) Fire Alarm System Upgrade
Initiative Type: Program Mode: Rail Invest. Category: Station and Passenger Facilities
Investments Invest. Program: Station Systems
Description
This program will upgrade fire alarm systems in the tunnels and stations.
Strategic Objectives Supported
Safety Cust. Sat. Reliability Ridership Op. Impact
Location
Systemwide
Outcome
In FY2021, Metro will continue drawings and design for tunnel fan supporting infrastructure. Completion of the Tunnel Smoke detection system pilot. Metro will also evaluate alternatives to improve alarm systems in administrative operations and maintenance facilities. This program improves customer and employee safety by accurately measuring and responding to Fire Incidents, a Metro key performance indicator (KPI).
Cost ($M) Fiscal Year Budget Actual
FY2020 3.5 FY2021 1.0 FY2022 1.5 FY2023 3.0 FY2024 3.5 FY2025 4.4 FY2026 7.5 FY2021-2026 Total 20.9 Total Cost 24.4
Anticipated Funding Sources Funding Source(s) for FY2021 Amount ($M)
System Perform 0.5 System Perform 0.5 Total Project Cost 1.0
Fiscal Year FY20 FY21 FY22 FY23 FY24 FY25 FY26 FY27 FY28 FY29 FY30
PLANNING
Needs Identification ✔ ✔
Development and Evaluation ✔ ✔ ✔ ✔
EXECUTION
Project Development ✔ ✔ ✔ ✔ ✔
Implementation
✔ ✔ ✔ ✔ ✔ ✔ ✔ ✔ ✔

170
Appendix D – Capital Projects
(CIP0259) Timecard Software Integration and Analysis
Initiative Type: Project Mode: Systemwide Invest. Category: Business Support Investments Invest. Program: IT
Description
Implement new automated time and attendance system for Metro employees.
Strategic Objectives Supported
Safety Cust. Sat. Reliability Ridership Op. Impact
Location
Systemwide
Outcome
Metro plans to complete the testing phase of the project by the first quarter of FY21 and then transition into the training and deployment phase of the timekeeping solution which enables monitoring employee time and attendance, labor tracking, and data collection. This project supports Metros financial responsiblity goals.
Cost ($M) Fiscal Year Budget Actual
LTD Expenses 22.1 FY2020 8.8 FY2021 5.0 FY2022 3.0 FY2023 0.0 FY2024 0.0 FY2025 0.0 FY2026 0.0 FY2021-2026 Total 8.0 Total Cost 38.9
Anticipated Funding Sources Funding Source(s) for FY2021 Amount ($M)
System Perform 5.0 Total Project Cost 5.0
Fiscal Year FY20 FY21 FY22 FY23 FY24 FY25 FY26 FY27 FY28 FY29 FY30
PLANNING
Needs Identification
Development and Evaluation
EXECUTION
Project Development
Implementation
✔ ✔

Appendix D – Capital Projects
171
(CIP0260) Track Inspector Location Pilot
Initiative Type: Project Mode: Rail Invest. Category: Rail Systems Investments Invest. Program: Signals & Communications
Description
This project develops and pilots technology that will allow for accurate tracking and location of workers within the right-of-way. The solution will be evaluated for effectiveness and a determination will be made to move forward with the remainder of the system.
Strategic Objectives Supported
Safety Cust. Sat. Reliability Ridership Op. Impact
Location
Systemwide
Outcome
In FY2021, Metro will complete the installation of Wayside Worker Protection units and evaluate the effectiveness of the technology. This project has the potential to reduce Roadway Worker Protection Incidents and enhance safety.
Cost ($M) Fiscal Year Budget Actual
LTD Expenses 9.2 FY2020 1.8 FY2021 0.5 FY2022 0.0 FY2023 0.0 FY2024 0.0 FY2025 0.0 FY2026 0.0 FY2021-2026 Total 0.5 Total Cost 11.5
Anticipated Funding Sources Funding Source(s) for FY2021 Amount ($M)
System Perform 0.5 Total Project Cost 0.5
Fiscal Year FY20 FY21 FY22 FY23 FY24 FY25 FY26 FY27 FY28 FY29 FY30
PLANNING
Needs Identification ✔
Development and Evaluation ✔
EXECUTION
Project Development ✔ ✔
Implementation
✔ ✔ ✔ ✔ ✔ ✔

172
Appendix D – Capital Projects
(CIP0261) Tunnel Light Improvements
Initiative Type: Program Mode: Rail Invest. Category: Track and Structures Rehabilitation
Investments Invest. Program: Fixed Rail
Description
Replace tunnel lights and fixtures with LED lamps instead of fluorescents. These improvements will provide a safe environment for employees and create a more efficient operational environment. This investment is a recommendation from the 2017 agency wide energy audit and a safety corrective action plan.
Strategic Objectives Supported
Safety Cust. Sat. Reliability Ridership Op. Impact
Location
Systemwide
Outcome
In FY2021, Metro will complete lighting upgrades on tunnel segments throughout the rail system. This program reduces Metro's operational expenses and provides additional safety benefits for employees.
Cost ($M) Fiscal Year Budget Actual
FY2020 4.0 FY2021 0.3 FY2022 0.0 FY2023 0.0 FY2024 0.0 FY2025 0.0 FY2026 0.0 FY2021-2026 Total 0.3 Total Cost 4.3
Anticipated Funding Sources Funding Source(s) for FY2021 Amount ($M)
System Perform 0.3 Total Project Cost 0.3
Fiscal Year FY20 FY21 FY22 FY23 FY24 FY25 FY26 FY27 FY28 FY29 FY30
PLANNING
Needs Identification
Development and Evaluation
EXECUTION
Project Development
Implementation
✔ ✔

Appendix D – Capital Projects
173
(CIP0262) Tunnel Water Leak Mitigation
Initiative Type: Program Mode: Rail Invest. Category: Track and Structures Rehabilitation
Investments Invest. Program: Structures
Description
This program will address the water infiltration into the tunnel system through epoxy injection into the surrounding rock surface. Mitigating water intrusion reduces deterioration of assets and improves the safety and reliability of rail service.
Strategic Objectives Supported
Safety Cust. Sat. Reliability Ridership Op. Impact
Location
Systemwide
Outcome
In FY2019, a segment of tunnel originating at Medical Center, including the rail crossover tunnel cavern, and extending to the tunnel portal at I-495 on the Red Line, was completed. In FY2021, the effectiveness of this technology and solution will be evaluated for use in other tunnel segments systemwide. This program will improve service based on the Metro-established Rail Infrastructure Availability key performance indicator (KPI).
Cost ($M) Fiscal Year Budget Actual
FY2020 8.0 FY2021 1.4 FY2022 8.5 FY2023 15.5 FY2024 45.0 FY2025 45.0 FY2026 45.0 FY2021-2026 Total 160.4 Total Cost 168.4
Anticipated Funding Sources Funding Source(s) for FY2021 Amount ($M)
Dedicated Funding 1.4 Total Project Cost 1.4
Fiscal Year FY20 FY21 FY22 FY23 FY24 FY25 FY26 FY27 FY28 FY29 FY30
PLANNING
Needs Identification ✔
Development and Evaluation ✔ ✔
EXECUTION
Project Development ✔ ✔ ✔
Implementation
✔ ✔ ✔ ✔ ✔ ✔ ✔ ✔ ✔ ✔ ✔

174
Appendix D – Capital Projects
(CIP0266) Historic Bus Terminal Rehabilitation
Initiative Type: Project Mode: Bus Invest. Category: Bus and Paratransit Investments Invest. Program: Bus Passenger
Facilities/Systems
Description
Design and rehabilitate three historic bus terminals: Calvert Street, Chevy Chase, and Colorado Avenue. This will ensure terminals are in a State of Good Repair. All three facilities are obsolete and in failing condition.
Strategic Objectives Supported
Safety Cust. Sat. Reliability Ridership Op. Impact
Location
Chevy Chase, Calvert St. and Colorado Ave.
Outcome
In FY2021, Metro will begin the rehabilitation of three historic bus passenger facilities located at Chevy Chase, Calvert Street, and Colorado Avenue within the District of Columbia. The construction phase of the project will begin in FY2021 and are expected to be completed in FY2022. This project supports Metro's state of good repair goals.
Cost ($M) Fiscal Year Budget Actual
LTD Expenses 0.0 FY2020 0.5 FY2021 1.4 FY2022 2.8 FY2023 0.6 FY2024 0.0 FY2025 0.0 FY2026 0.0 FY2021-2026 Total 4.7 Total Cost 5.2
Anticipated Funding Sources Funding Source(s) for FY2021 Amount ($M)
Dedicated Funding 1.4 Total Project Cost 1.4
Fiscal Year FY20 FY21 FY22 FY23 FY24 FY25 FY26 FY27 FY28 FY29 FY30
PLANNING
Needs Identification
Development and Evaluation ✔
EXECUTION
Project Development ✔
Implementation
✔ ✔ ✔ ✔

Appendix D – Capital Projects
175
(CIP0269) Enterprise Asset Management Systems
Initiative Type: Project Mode: Systemwide Invest. Category: Business Support Investments Invest. Program: IT
Description
This project develops an Asset Management System, using Metro's existing inventory software applications, that will create an asset hierarchy, structure, asset definitions and a standard protocol for inducting, maintaining, retiring and replacement of assets.
Strategic Objectives Supported
Safety Cust. Sat. Reliability Ridership Op. Impact
Location
Systemwide
Outcome
Metro will continue to refine the systemwide asset hierarchy and ranking system, as well as data management support. Purchase of barcode scanners to continue as needed. This project supports Metro's administrative efficiency goals.
Cost ($M) Fiscal Year Budget Actual
LTD Expenses 0.6 FY2020 1.9 FY2021 0.5 FY2022 0.5 FY2023 0.5 FY2024 0.5 FY2025 0.5 FY2026 0.5 FY2021-2026 Total 3.0 Total Cost 5.5
Anticipated Funding Sources Funding Source(s) for FY2021 Amount ($M)
System Perform 0.5 Total Project Cost 0.5
Fiscal Year FY20 FY21 FY22 FY23 FY24 FY25 FY26 FY27 FY28 FY29 FY30
PLANNING
Needs Identification
Development and Evaluation
EXECUTION
Project Development ✔
Implementation
✔ ✔ ✔ ✔ ✔ ✔ ✔ ✔ ✔ ✔ ✔

176
Appendix D – Capital Projects
(CIP0270) Capital Delivery Program Support
Initiative Type: Program Mode: Systemwide Invest. Category: Business Support Investments Invest. Program: Support
Equipment/Services
Description
Project administration, planning, scheduling, and management support for the portfolio of major construction projects.
Strategic Objectives Supported
Safety Cust. Sat. Reliability Ridership Op. Impact
Location
Systemwide
Outcome
In FY2021, Metro will provide project planning, scheduling, and management services to the current portfolio of major capital construction projects. This project improves Metro's financial responsibility and supports state of good repair efforts.
Cost ($M) Fiscal Year Budget Actual
FY2020 12.3 FY2021 19.7 FY2022 15.5 FY2023 10.5 FY2024 10.5 FY2025 10.5 FY2026 10.5 FY2021-2026 Total 77.2 Total Cost 89.5
Anticipated Funding Sources Funding Source(s) for FY2021 Amount ($M)
System Perform 19.7 Total Project Cost 19.7
Fiscal Year FY20 FY21 FY22 FY23 FY24 FY25 FY26 FY27 FY28 FY29 FY30
PLANNING
Needs Identification
Development and Evaluation
EXECUTION
Project Development ✔
Implementation
✔ ✔ ✔ ✔ ✔ ✔ ✔ ✔ ✔ ✔ ✔

Appendix D – Capital Projects
177
(CIP0271) Metrorail Station Emergency Gates Replacement
Initiative Type: Project Mode: Rail Invest. Category: Station and Passenger Facilities
Investments Invest. Program: Platforms & Structures
Description
Replace Metrorail station emergency gates.
Strategic Objectives Supported
Safety Cust. Sat. Reliability Ridership Op. Impact
Location
Systemwide
Outcome
Metro plans to complete the replacement of swing-gates at station elevators and to begin architectural evaluation for swing gates at stations where space constrains present potential ADA issues. In conjunction with the deployment and reconfiguration of the new fare gates, the remaining emergency gates will be replaced with new gates equipped with access control card readers, magnetic locks and panic hardware. This projects helps secure the rail system and reduce fare evasion.
Cost ($M) Fiscal Year Budget Actual
LTD Expenses 6.5 FY2020 2.0 FY2021 0.5 FY2022 0.5 FY2023 0.0 FY2024 0.0 FY2025 0.0 FY2026 0.0 FY2021-2026 Total 1.0 Total Cost 9.5
Anticipated Funding Sources Funding Source(s) for FY2021 Amount ($M)
System Perform 0.5 Total Project Cost 0.5
Fiscal Year FY20 FY21 FY22 FY23 FY24 FY25 FY26 FY27 FY28 FY29 FY30
PLANNING
Needs Identification
Development and Evaluation
EXECUTION
Project Development ✔
Implementation
✔ ✔

178
Appendix D – Capital Projects
(CIP0272) Station Commercialization Project
Initiative Type: Project Mode: Systemwide Invest. Category: Business Support Investments Invest. Program: Support
Equipment/Services
Description
This project will make investments in new equipment and space improvements designed to increase non-fare revenue in stations. Investments include addition of retail vendor space, upgrading digital displays, and improving signage and wayfinding, as well as other customer amenities.
Strategic Objectives Supported
Safety Cust. Sat. Reliability Ridership Op. Impact
Location
Systemwide
Outcome
In FY2021, Metro will install new digital displays and improved station signage at 8 Metrorail station. This project improves customer service and state of good repair while supporting financial responsibility.
Cost ($M) Fiscal Year Budget Actual
LTD Expenses 9.5 FY2020 10.0 FY2021 10.0 FY2022 0.0 FY2023 0.0 FY2024 0.0 FY2025 0.0 FY2026 0.0 FY2021-2026 Total 10.0 Total Cost 29.5
Anticipated Funding Sources Funding Source(s) for FY2021 Amount ($M)
Dedicated Funding 10.0 Total Project Cost 10.0
Fiscal Year FY20 FY21 FY22 FY23 FY24 FY25 FY26 FY27 FY28 FY29 FY30
PLANNING
Needs Identification ✔ ✔
Development and Evaluation ✔
EXECUTION
Project Development ✔ ✔ ✔ ✔
Implementation
✔ ✔ ✔ ✔ ✔
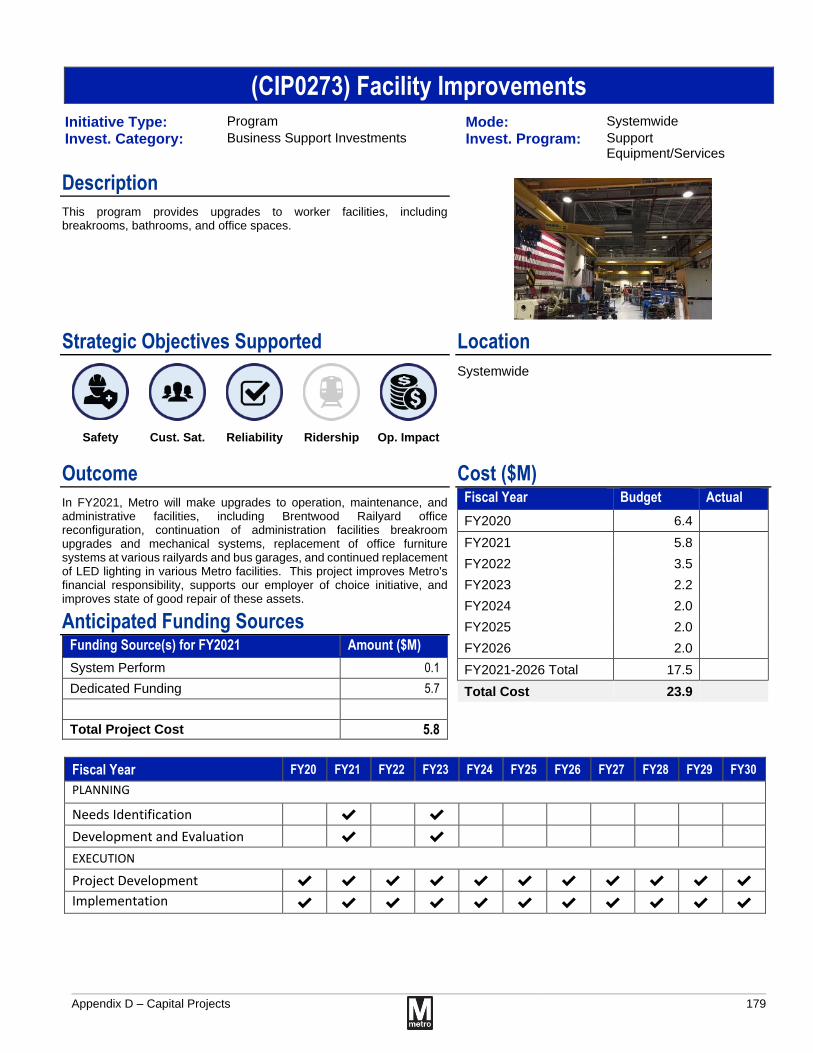
Appendix D – Capital Projects
179
(CIP0273) Facility Improvements
Initiative Type: Program Mode: Systemwide Invest. Category: Business Support Investments Invest. Program: Support
Equipment/Services
Description
This program provides upgrades to worker facilities, including breakrooms, bathrooms, and office spaces.
Strategic Objectives Supported
Safety Cust. Sat. Reliability Ridership Op. Impact
Location
Systemwide
Outcome
In FY2021, Metro will make upgrades to operation, maintenance, and administrative facilities, including Brentwood Railyard office reconfiguration, continuation of administration facilities breakroom upgrades and mechanical systems, replacement of office furniture systems at various railyards and bus garages, and continued replacement of LED lighting in various Metro facilities. This project improves Metro's financial responsibility, supports our employer of choice initiative, and improves state of good repair of these assets.
Cost ($M) Fiscal Year Budget Actual
FY2020 6.4 FY2021 5.8 FY2022 3.5 FY2023 2.2 FY2024 2.0 FY2025 2.0 FY2026 2.0 FY2021-2026 Total 17.5 Total Cost 23.9
Anticipated Funding Sources Funding Source(s) for FY2021 Amount ($M)
System Perform 0.1 Dedicated Funding 5.7 Total Project Cost 5.8
Fiscal Year FY20 FY21 FY22 FY23 FY24 FY25 FY26 FY27 FY28 FY29 FY30
PLANNING
Needs Identification ✔ ✔
Development and Evaluation ✔ ✔
EXECUTION
Project Development ✔ ✔ ✔ ✔ ✔ ✔ ✔ ✔ ✔ ✔ ✔
Implementation
✔ ✔ ✔ ✔ ✔ ✔ ✔ ✔ ✔ ✔ ✔

180
Appendix D – Capital Projects
(CIP0274) Grosvenor-Strathmore Parking Garage Joint Development
Initiative Type: Project Mode: Rail Invest. Category: Station and Passenger Facilities
Investments Invest. Program: Platforms & Structures
Description
Replace surface parking lot at Grosvenor-Strathmore Parking Garage with approximately 400 garage spaces.
Strategic Objectives Supported
Safety Cust. Sat. Reliability Ridership Op. Impact
Location
Grosvenor - Strathmore Station
Outcome
In FY2021, Metro will complete the construction of the parking garage expansion at Grosvenor-Strathmore station. This project will increase access to the Metrorail system and promote additional development.
Cost ($M) Fiscal Year Budget Actual
LTD Expenses 2.1 FY2020 12.0 FY2021 1.5 FY2022 1.5 FY2023 0.0 FY2024 0.0 FY2025 0.0 FY2026 0.0 FY2021-2026 Total 3.0 Total Cost 17.1
Anticipated Funding Sources Funding Source(s) for FY2021 Amount ($M)
Dedicated Funding 1.5 Total Project Cost 1.5
Fiscal Year FY20 FY21 FY22 FY23 FY24 FY25 FY26 FY27 FY28 FY29 FY30
PLANNING
Needs Identification
Development and Evaluation
EXECUTION
Project Development ✔
Implementation
✔ ✔ ✔

Appendix D – Capital Projects
181
(CIP0275) New Carrollton Bus Bays Joint Development
Initiative Type: Project Mode: Bus Invest. Category: Bus and Paratransit Investments Invest. Program: Bus Passenger
Facilities/Systems
Description
This joint development project will complete roadwork and the bus loop at the New Carrollton station.
Strategic Objectives Supported
Safety Cust. Sat. Reliability Ridership Op. Impact
Location
New Carrollton Rail Station
Outcome
In FY2021, Metro will continue evaluation of additional bus loop improvements for joint development project at New Carrollton rail station.
Cost ($M) Fiscal Year Budget Actual
LTD Expenses 2.6 FY2020 2.4 FY2021 3.2 FY2022 4.3 FY2023 0.0 FY2024 0.0 FY2025 0.0 FY2026 0.0 FY2021-2026 Total 7.5 Total Cost 12.6
Anticipated Funding Sources Funding Source(s) for FY2021 Amount ($M)
Dedicated Funding 3.2 Total Project Cost 3.2
Fiscal Year FY20 FY21 FY22 FY23 FY24 FY25 FY26 FY27 FY28 FY29 FY30
PLANNING
Needs Identification
Development and Evaluation
EXECUTION
Project Development ✔ ✔
Implementation
✔ ✔ ✔ ✔ ✔

182
Appendix D – Capital Projects
(CIP0277) Supply Chain Modernization
Initiative Type: Project Mode: Rail Invest. Category: Business Support Investments Invest. Program: Support
Equipment/Services
Description
Initial phase of multi-year project to modernize the supply chain for logistics, warehousing, planning, and ordering of inventory.
Strategic Objectives Supported
Safety Cust. Sat. Reliability Ridership Op. Impact
Location
Systemwide
Outcome
In FY2021, this project will provide a business process evaluation of modern technologies to improve WMATA's supply chain management of parts and supplies used by various maintenance employees. This project improves Metro's financial responsibility and increases availability of parts and supplies.
Cost ($M) Fiscal Year Budget Actual
LTD Expenses 1.2 FY2020 1.0 FY2021 4.0 FY2022 4.0 FY2023 0.0 FY2024 0.0 FY2025 0.0 FY2026 0.0 FY2021-2026 Total 8.0 Total Cost 10.3
Anticipated Funding Sources Funding Source(s) for FY2021 Amount ($M)
System Perform 4.0 Total Project Cost 4.0
Fiscal Year FY20 FY21 FY22 FY23 FY24 FY25 FY26 FY27 FY28 FY29 FY30
PLANNING
Needs Identification
Development and Evaluation ✔
EXECUTION
Project Development ✔ ✔ ✔
Implementation
✔ ✔ ✔ ✔

Appendix D – Capital Projects
183
(CIP0279) Huntington Station Joint Development
Initiative Type: Project Mode: Rail Invest. Category: Station and Passenger Facilities
Investments Invest. Program: Platforms & Structures
Description
Joint development program to assess and determine possible future investment at Huntington station and adjacent properties.
Strategic Objectives Supported
Safety Cust. Sat. Reliability Ridership Op. Impact
Location
Huntington Station
Outcome
In FY2021, Metro will begin to work with a selected Master Developer for the Huntington Station area. Metro and the Master Developer will create a Master Plan for the station area, determine replacement parking needs, and work with Fairfax County to obtain approval of a Comprehensive Plan Amendment. This project will increase access to the Metrorail system by increasing transit oriented development.
Cost ($M) Fiscal Year Budget Actual
LTD Expenses 0.0 FY2020 0.0 FY2021 1.3 FY2022 0.0 FY2023 0.0 FY2024 0.0 FY2025 0.0 FY2026 0.0 FY2021-2026 Total 1.3 Total Cost 1.3
Anticipated Funding Sources Funding Source(s) for FY2021 Amount ($M)
Dedicated Funding 1.3 Total Project Cost 1.3
Fiscal Year FY20 FY21 FY22 FY23 FY24 FY25 FY26 FY27 FY28 FY29 FY30
PLANNING
Needs Identification
Development and Evaluation ✔
EXECUTION
Project Development ✔ ✔
Implementation
✔
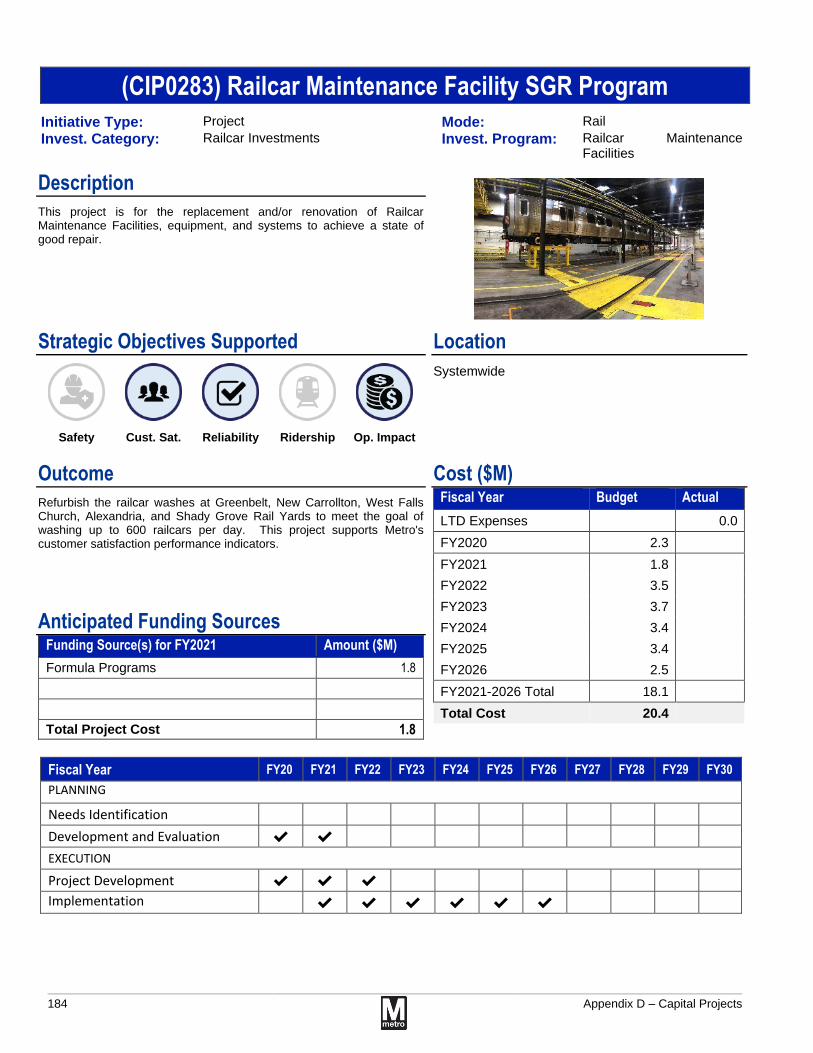
184
Appendix D – Capital Projects
(CIP0283) Railcar Maintenance Facility SGR Program
Initiative Type: Project Mode: Rail Invest. Category: Railcar Investments Invest. Program: Railcar Maintenance
Facilities
Description
This project is for the replacement and/or renovation of Railcar Maintenance Facilities, equipment, and systems to achieve a state of good repair.
Strategic Objectives Supported
Safety Cust. Sat. Reliability Ridership Op. Impact
Location
Systemwide
Outcome
Refurbish the railcar washes at Greenbelt, New Carrollton, West Falls Church, Alexandria, and Shady Grove Rail Yards to meet the goal of washing up to 600 railcars per day. This project supports Metro's customer satisfaction performance indicators.
Cost ($M) Fiscal Year Budget Actual
LTD Expenses 0.0 FY2020 2.3 FY2021 1.8 FY2022 3.5 FY2023 3.7 FY2024 3.4 FY2025 3.4 FY2026 2.5 FY2021-2026 Total 18.1 Total Cost 20.4
Anticipated Funding Sources Funding Source(s) for FY2021 Amount ($M)
Formula Programs 1.8 Total Project Cost 1.8
Fiscal Year FY20 FY21 FY22 FY23 FY24 FY25 FY26 FY27 FY28 FY29 FY30
PLANNING
Needs Identification
Development and Evaluation ✔ ✔
EXECUTION
Project Development ✔ ✔ ✔
Implementation
✔ ✔ ✔ ✔ ✔ ✔

Appendix D – Capital Projects
185
(CIP0284) Yard Facility Rehabilitation
Initiative Type: Project Mode: Rail Invest. Category: Railcar Investments Invest. Program: Railcar Maintenance
Facilities
Description
This project is for Rail Yard facility (eight locations) rehabilitation to maintain buildings and equipment in a state of good repair.
Strategic Objectives Supported
Safety Cust. Sat. Reliability Ridership Op. Impact
Location
Systemwide
Outcome
Metro will begin replacement of non-metallic handrails and swing gates in Rail Yard Service and Inspection Shops to address safety issues. Additionally, will install a 25-ton overhead crane at the Shady Grove Rail Yard Service and Inspection Shop to replace existing unit. This project improves worker safety.
Cost ($M) Fiscal Year Budget Actual
LTD Expenses 1.3 FY2020 7.0 FY2021 1.7 FY2022 6.0 FY2023 26.5 FY2024 28.0 FY2025 25.5 FY2026 20.0 FY2021-2026 Total 107.7 Total Cost 115.9
Anticipated Funding Sources Funding Source(s) for FY2021 Amount ($M)
Dedicated Funding 1.7 Total Project Cost 1.7
Fiscal Year FY20 FY21 FY22 FY23 FY24 FY25 FY26 FY27 FY28 FY29 FY30
PLANNING
Needs Identification ✔
Development and Evaluation ✔ ✔
EXECUTION
Project Development ✔ ✔ ✔ ✔ ✔ ✔ ✔ ✔
Implementation
✔ ✔ ✔ ✔ ✔ ✔ ✔ ✔ ✔ ✔ ✔

186
Appendix D – Capital Projects
(CIP0286) Generator System Replacement
Initiative Type: Project Mode: Rail Invest. Category: Rail Systems Investments Invest. Program: Propulsion
Description
This project provides traction power supply reinforcement through the acquisition of mobile traction power substations as well as the replacement of permanent generators throughout system.
Strategic Objectives Supported
Safety Cust. Sat. Reliability Ridership Op. Impact
Location
Systemwide
Outcome
In FY2021, Metro plans to conduct surveys for the prioritization of permanent generator replacement. This project will improve service and reliability based on the Metro-established MyTripTime key performance indicator (KPI) through improving rail inrastructure condition.
Cost ($M) Fiscal Year Budget Actual
LTD Expenses 0.0 FY2020 0.0 FY2021 0.7 FY2022 0.7 FY2023 0.7 FY2024 0.7 FY2025 0.7 FY2026 0.7 FY2021-2026 Total 4.2 Total Cost 4.2
Anticipated Funding Sources Funding Source(s) for FY2021 Amount ($M)
System Perform 0.7 Total Project Cost 0.7
Fiscal Year FY20 FY21 FY22 FY23 FY24 FY25 FY26 FY27 FY28 FY29 FY30
PLANNING
Needs Identification ✔
Development and Evaluation
EXECUTION
Project Development ✔
Implementation
✔ ✔ ✔ ✔ ✔ ✔ ✔ ✔ ✔

Appendix D – Capital Projects
187
(CIP0291) Tunnel Ventilation
Initiative Type: Project Mode: Rail Invest. Category: Track and Structures Rehabilitation
Investments Invest. Program: Structures
Description
The tunnel ventilation and fan shaft rehabilitation project will upgrade components in vent shafts including, but not limited to: all electric, lighting, fans, communications, equipment, ladders, steps, smoke detectors, alarms and information technology infrastructure.
Strategic Objectives Supported
Safety Cust. Sat. Reliability Ridership Op. Impact
Location
Cleveland Park
Woodley Park
Van Ness
Outcome
Metro will begin the Red Line pilot installation of tunnel ventilation systems at Cleveland Park, Woodley Park, and Van Ness stations which include upgrading and replacing fans, motors, supporting structure, and ancillary control systems. At the conclusion of the pilot and evaluation of its effectiveness, additional locations may be identified. Metro will also complete installation of new Programmable Logic Control (PLC) panels in all vent shafts throughout the system. This project will improve service based on the Fire Incidents key performance indicator (KPI).
Cost ($M) Fiscal Year Budget Actual
LTD Expenses 0.1 FY2020 4.2 FY2021 16.2 FY2022 18.1 FY2023 3.0 FY2024 3.0 FY2025 3.0 FY2026 3.0 FY2021-2026 Total 46.3 Total Cost 50.6
Anticipated Funding Sources Funding Source(s) for FY2021 Amount ($M)
PRIIA 0.5 Dedicated Funding 15.7 Total Project Cost 16.2
Fiscal Year FY20 FY21 FY22 FY23 FY24 FY25 FY26 FY27 FY28 FY29 FY30
PLANNING
Needs Identification ✔
Development and Evaluation ✔ ✔ ✔
EXECUTION
Project Development ✔ ✔ ✔ ✔ ✔ ✔
Implementation
✔ ✔ ✔ ✔ ✔ ✔ ✔ ✔ ✔ ✔ ✔

188
Appendix D – Capital Projects
(CIP0294) Bridge Rehabilitation
Initiative Type: Program Mode: Rail Invest. Category: Track and Structures Rehabilitation
Investments Invest. Program: Structures
Description
This program will rehabilitate bridge and aerial structures that have reached the end of their useful life.
Strategic Objectives Supported
Safety Cust. Sat. Reliability Ridership Op. Impact
Location
Systemwide
Outcome
Metro will begin rehabilitation of high priority bridges and aerial structures to replace anchor bolts, drains, bearings, expansion joints, checkered walkway/railings, grout pads, and concrete spalling. Additionally, will continue to advance design for next phase of bridge and aerial structure rehabilitation. This program helps ensure the safety and reliability of the Metrorail system.
Cost ($M) Fiscal Year Budget Actual
FY2020 2.5 FY2021 10.6 FY2022 18.8 FY2023 15.6 FY2024 25.8 FY2025 8.0 FY2026 3.5 FY2021-2026 Total 82.3 Total Cost 84.8
Anticipated Funding Sources Funding Source(s) for FY2021 Amount ($M)
Dedicated Funding 10.6 Total Project Cost 10.6
Fiscal Year FY20 FY21 FY22 FY23 FY24 FY25 FY26 FY27 FY28 FY29 FY30
PLANNING
Needs Identification ✔ ✔ ✔ ✔
Development and Evaluation ✔ ✔ ✔ ✔
EXECUTION
Project Development ✔ ✔ ✔ ✔ ✔
Implementation
✔ ✔ ✔ ✔ ✔ ✔ ✔ ✔ ✔ ✔ ✔

Appendix D – Capital Projects
189
(CIP0307) Stations Platform Rehabilitation - Phase 2
Initiative Type: Project Mode: Rail Invest. Category: Station and Passenger Facilities
Investments Invest. Program: Platforms & Structures
Description
Rehabilitation and repair of platforms at the following stations along the Orange Line in Virginia to address unsafe and deteriorating conditions: East Falls Church, West Falls Church, Dunn Loring, and Vienna. Customer experience improvements include slip-resistant tile, improved LED lighting, upgraded passenger shelters, new passenger information displays (PIDs), improved public address (PA) system, new closed-circuit television (CCTV) system, renovated bathrooms, and new bus shelters.
Strategic Objectives Supported
Safety Cust. Sat. Reliability Ridership Op. Impact
Location
East Falls Church, West Falls Church, Dunn Loring, Vienna
Outcome
In FY2021, a summer shutdown (Memorial Day to Labor Day 2020) for Orange Line Stations (Vienna to East Falls Church) will encompass thirty-six systems that include, concrete platform repair, granite edges, paver tile, signage, shelters, PA systems, fire protection, sprinklers, CCTV, drainage, sewage ejector pumps, paint, and bathrooms. New platforms and other new/rehabilitated station assets will increase the lifespan of these assets, reducing future maintenance requirements and improving the quality of rail service provided for customers accessing these stations.
Cost ($M) Fiscal Year Budget Actual
LTD Expenses 0.0 FY2020 154.1 FY2021 183.5 FY2022 20.0 FY2023 0.0 FY2024 0.0 FY2025 0.0 FY2026 0.0 FY2021-2026 Total 203.5 Total Cost 357.6
Anticipated Funding Sources Funding Source(s) for FY2021 Amount ($M)
PRIIA 57.8 Dedicated Funding 125.7 Total Project Cost 183.5
Fiscal Year FY20 FY21 FY22 FY23 FY24 FY25 FY26 FY27 FY28 FY29 FY30
PLANNING
Needs Identification
Development and Evaluation
EXECUTION
Project Development ✔ ✔
Implementation
✔ ✔ ✔

190
Appendix D – Capital Projects
(CIP0308) Stations Platform Rehabilitation - Phase 3
Initiative Type: Project Mode: Rail Invest. Category: Station and Passenger Facilities
Investments Invest. Program: Platforms & Structures
Description
Rehabilitation and repair of platforms at the following stations along the Yellow, Blue, and Orange Lines in Virginia and Maryland to address unsafe and deteriorating conditions: Cheverly, Landover, New Carrollton, Addison Road, Ronald Reagan Washington National Airport, and Arlington Cemetery. Customer experience improvements include slip-resistant tile, improved LED lighting, upgraded passenger shelters, new passenger information displays (PIDs), improved public address (PA) system, new closed-circuit television (CCTV) system, renovated bathrooms, and new bus shelters.
Strategic Objectives Supported
Safety Cust. Sat. Reliability Ridership Op. Impact
Location
Cheverly, Landover, New Carrollton, Addison Rd., National Airport, Arlington Cemetary
Outcome
In FY2021, a summer shutdown (Memorial Day to Labor Day 2021) for Orange and Blue Line Stations in Maryland and two stations in Virginia will encompass thirty-six systems that include, concrete platform repair, granite edges, paver tile, signage, shelters, PA systems, fire protection, sprinklers, CCTV, drainage, sewage ejector pumps, paint, and bathrooms. New platforms and other new/rehabilitated station assets will increase the lifespan of these assets, reducing future maintenance requirements and improving the quality of rail service provided for customers accessing these stations.
Cost ($M) Fiscal Year Budget Actual
LTD Expenses 0.0 FY2020 0.0 FY2021 110.0 FY2022 172.1 FY2023 86.7 FY2024 0.0 FY2025 0.0 FY2026 0.0 FY2021-2026 Total 368.8 Total Cost 368.8
Anticipated Funding Sources Funding Source(s) for FY2021 Amount ($M)
Formula Programs 8.3 System Perform 2.6 DEBT 99.1 Total Project Cost 110.0
Fiscal Year FY20 FY21 FY22 FY23 FY24 FY25 FY26 FY27 FY28 FY29 FY30
PLANNING
Needs Identification ✔
Development and Evaluation ✔
EXECUTION
Project Development ✔
Implementation
✔ ✔ ✔

Appendix D – Capital Projects
191
(CIP0309) Huntington Metrorail Station Additional Entrance
Initiative Type: Project Mode: Rail Invest. Category: Station and Passenger Facilities
Investments Invest. Program: Platforms & Structures
Description
This project will construct an additional pedestrian entrance to the Huntington Metrorail station to improve station circulation. It will also provide ADA access to the station during the demolition and reconstruction of the South Parking Garage.
Strategic Objectives Supported
Safety Cust. Sat. Reliability Ridership Op. Impact
Location
Huntington Station
Outcome
This project began by installing footers for the new entrance structure during the South of National Summer Shutdown in FY2020. Construction of the new entrance is projected for future fiscal years. This project will enhance customer satisfaction by improving station access.
Cost ($M) Fiscal Year Budget Actual
LTD Expenses 0.0 FY2020 14.5 FY2021 0.0 FY2022 0.0 FY2023 0.0 FY2024 0.0 FY2025 5.0 FY2026 10.0 FY2021-2026 Total 15.0 Total Cost 29.5
Anticipated Funding Sources Funding Source(s) for FY2021 Amount ($M)
Total Project Cost
Fiscal Year FY20 FY21 FY22 FY23 FY24 FY25 FY26 FY27 FY28 FY29 FY30
PLANNING
Needs Identification ✔
Development and Evaluation
EXECUTION
Project Development ✔
Implementation
✔ ✔ ✔ ✔ ✔

192
Appendix D – Capital Projects
(CIP0311) Bus Garage Replacement - Bladensburg
Initiative Type: Project Mode: Bus Invest. Category: Bus and Paratransit Investments Invest. Program: Bus Maintenance Facilities
Description
Demolition and replacement of the existing bus maintenance and operations facility in Bladensburg, Maryland, to improve use and capacity of limited facility space. The new facility, designed to meet LEED Platinum certification, will have an on-site employee parking lot, multiple access points, parking for up to 300 buses, 25 maintenance bays, and a compressed natural gas (CNG) fueling station. The construction will take into account the needs of a potential future electric bus fleet.
Strategic Objectives Supported
Safety Cust. Sat. Reliability Ridership Op. Impact
Location
Bladensburg Bus Division site
Outcome
In FY2021, Metro will complete pre-construction activities, final design and demolition packages for new Bus Operations Building, as well as to complete the demolition of existing Bladensburg facilities. This project supports Metro's state of good repair metrics.
Cost ($M) Fiscal Year Budget Actual
LTD Expenses 0.0 FY2020 14.5 FY2021 7.5 FY2022 13.3 FY2023 53.8 FY2024 70.3 FY2025 42.2 FY2026 18.6 FY2021-2026 Total 205.7 Total Cost 220.2
Anticipated Funding Sources Funding Source(s) for FY2021 Amount ($M)
Formula Programs 7.5 Total Project Cost 7.5
Fiscal Year FY20 FY21 FY22 FY23 FY24 FY25 FY26 FY27 FY28 FY29 FY30
PLANNING
Needs Identification
Development and Evaluation
EXECUTION
Project Development ✔
Implementation
✔ ✔ ✔ ✔ ✔ ✔

Appendix D – Capital Projects
193
(CIP0312) Four Mile Run Bus Facility Rehabilitation
Initiative Type: Project Mode: Bus Invest. Category: Bus and Paratransit Investments Invest. Program: Bus Maintenance Facilities
Description
Rehabilitate interior and exterior elements of the bus facility to maintain a State of Good Repair. Identify solutions to achieve operational requirements to meet short-term fleet capacity needs due to other bus facility rehabilitation projects.
Strategic Objectives Supported
Safety Cust. Sat. Reliability Ridership Op. Impact
Location
Arlington
Outcome
The project will complete design for the renovation of bus service lanes at the four Mile Run Bus Garage. This project supports operational efficiency.
Cost ($M) Fiscal Year Budget Actual
LTD Expenses 0.0 FY2020 0.4 FY2021 1.5 FY2022 4.5 FY2023 7.5 FY2024 3.3 FY2025 1.5 FY2026 0.0 FY2021-2026 Total 18.3 Total Cost 18.6
Anticipated Funding Sources Funding Source(s) for FY2021 Amount ($M)
Formula Programs 1.5 Total Project Cost 1.5
Fiscal Year FY20 FY21 FY22 FY23 FY24 FY25 FY26 FY27 FY28 FY29 FY30
PLANNING
Needs Identification ✔
Development and Evaluation ✔
EXECUTION
Project Development ✔ ✔
Implementation
✔ ✔ ✔ ✔ ✔
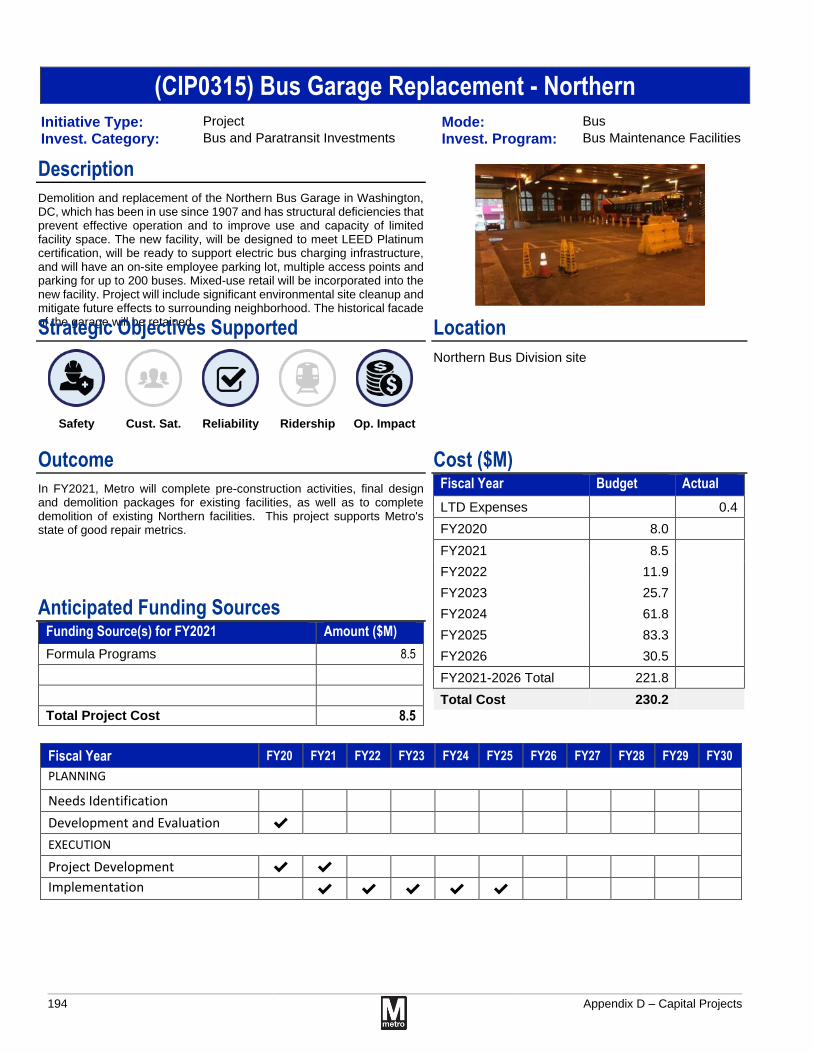
194
Appendix D – Capital Projects
(CIP0315) Bus Garage Replacement - Northern
Initiative Type: Project Mode: Bus Invest. Category: Bus and Paratransit Investments Invest. Program: Bus Maintenance Facilities
Description
Demolition and replacement of the Northern Bus Garage in Washington, DC, which has been in use since 1907 and has structural deficiencies that prevent effective operation and to improve use and capacity of limited facility space. The new facility, will be designed to meet LEED Platinum certification, will be ready to support electric bus charging infrastructure, and will have an on-site employee parking lot, multiple access points and parking for up to 200 buses. Mixed-use retail will be incorporated into the new facility. Project will include significant environmental site cleanup and mitigate future effects to surrounding neighborhood. The historical facade of the garage will be retained.
Strategic Objectives Supported
Safety Cust. Sat. Reliability Ridership Op. Impact
Location
Northern Bus Division site
Outcome
In FY2021, Metro will complete pre-construction activities, final design and demolition packages for existing facilities, as well as to complete demolition of existing Northern facilities. This project supports Metro's state of good repair metrics.
Cost ($M) Fiscal Year Budget Actual
LTD Expenses 0.4 FY2020 8.0 FY2021 8.5 FY2022 11.9 FY2023 25.7 FY2024 61.8 FY2025 83.3 FY2026 30.5 FY2021-2026 Total 221.8 Total Cost 230.2
Anticipated Funding Sources Funding Source(s) for FY2021 Amount ($M)
Formula Programs 8.5 Total Project Cost 8.5
Fiscal Year FY20 FY21 FY22 FY23 FY24 FY25 FY26 FY27 FY28 FY29 FY30
PLANNING
Needs Identification
Development and Evaluation ✔
EXECUTION
Project Development ✔ ✔
Implementation
✔ ✔ ✔ ✔ ✔

Appendix D – Capital Projects
195
(CIP0319) Bus Maintenance Facility SOGR
Initiative Type: Program Mode: Bus Invest. Category: Bus and Paratransit Investments Invest. Program: Bus Maintenance Facilities
Description
Renovation of Bus Maintenance facilities and equipment to achieve a state of good repair.
Strategic Objectives Supported
Safety Cust. Sat. Reliability Ridership Op. Impact
Location
Montgomery, Landover, Western, Four Mile, Bladensburg
Outcome
Replacement of Bus vaults for farebox collections at various Bus Garages. This program supports Metro's state of good repair metrics.
Cost ($M) Fiscal Year Budget Actual
FY2020 0.5 FY2021 1.1 FY2022 0.0 FY2023 0.0 FY2024 0.0 FY2025 0.0 FY2026 0.0 FY2021-2026 Total 1.1 Total Cost 1.6
Anticipated Funding Sources Funding Source(s) for FY2021 Amount ($M)
Formula Programs 1.1 Total Project Cost 1.1
Fiscal Year FY20 FY21 FY22 FY23 FY24 FY25 FY26 FY27 FY28 FY29 FY30
PLANNING
Needs Identification ✔
Development and Evaluation ✔
EXECUTION
Project Development ✔
Implementation
✔ ✔

196
Appendix D – Capital Projects
(CIP0322) Bus Passenger Fac./Systems Future Major Projects
Initiative Type: Project Mode: Bus Invest. Category: Bus and Paratransit Investments Invest. Program: Bus Passenger
Facilities/Systems
Description
This project will make improvements to bus passenger accessibility at revenue facilities.
Strategic Objectives Supported
Safety Cust. Sat. Reliability Ridership Op. Impact
Location
Systemwide
Outcome
Begin systemwide bus stop accessibility survey to ensure Metrobus stops meet ADA accessibility requirements. Survey will include plans and prioritization for proposed improvements at deficient facilities. This project improves customer satisfaction.
Cost ($M) Fiscal Year Budget Actual
LTD Expenses 0.0 FY2020 0.1 FY2021 0.5 FY2022 0.0 FY2023 3.5 FY2024 0.0 FY2025 0.0 FY2026 0.0 FY2021-2026 Total 3.9 Total Cost 4.0
Anticipated Funding Sources Funding Source(s) for FY2021 Amount ($M)
System Perform 0.5 Total Project Cost 0.5
Fiscal Year FY20 FY21 FY22 FY23 FY24 FY25 FY26 FY27 FY28 FY29 FY30
PLANNING
Needs Identification ✔ ✔
Development and Evaluation ✔ ✔ ✔
EXECUTION
Project Development ✔ ✔ ✔
Implementation
✔ ✔ ✔ ✔

Appendix D – Capital Projects
197
(CIP0324) Capital Program Financial Support
Initiative Type: Program Mode: Systemwide Invest. Category: Business Support Investments Invest. Program: Support
Equipment/Services
Description
Provide financial support services for the capital program management of capital funds and grants.
Strategic Objectives Supported
Safety Cust. Sat. Reliability Ridership Op. Impact
Location
Systemwide
Outcome
Provide services that manage the funding of the capital program including management of grants, maintenance of financial systems, and alignment of capital cost to appropriate funding. This project improves Metro's financial responsibility and compliance efforts.
Cost ($M) Fiscal Year Budget Actual
FY2020 3.1 FY2021 3.1 FY2022 3.1 FY2023 3.1 FY2024 3.1 FY2025 3.1 FY2026 3.1 FY2021-2026 Total 18.6 Total Cost 21.7
Anticipated Funding Sources Funding Source(s) for FY2021 Amount ($M)
System Perform 3.1 Total Project Cost 3.1
Fiscal Year FY20 FY21 FY22 FY23 FY24 FY25 FY26 FY27 FY28 FY29 FY30
PLANNING
Needs Identification
Development and Evaluation
EXECUTION
Project Development
Implementation
✔ ✔ ✔ ✔ ✔ ✔ ✔ ✔ ✔ ✔ ✔

198
Appendix D – Capital Projects
(CIP0326) Real-Time Bus and Rail Data Feed Development
Initiative Type: Project Mode: Bus Invest. Category: Bus and Paratransit Investments Invest. Program: Bus Passenger
Facilities/Systems
Description
Develop General Transit Feed Specifications (GTFS) real-time data feeds for bus and rail service.
Strategic Objectives Supported
Safety Cust. Sat. Reliability Ridership Op. Impact
Location
Systemwide
Outcome
This project will begin working towards delivering a real-time bus on-time performance and travel speed management dashboard and provide communications with a tool to communicate real time service times. This project supports customer statisfaction metrics.
Cost ($M) Fiscal Year Budget Actual
LTD Expenses 0.0 FY2020 0.0 FY2021 1.1 FY2022 0.0 FY2023 0.0 FY2024 0.0 FY2025 0.0 FY2026 0.0 FY2021-2026 Total 1.1 Total Cost 1.1
Anticipated Funding Sources Funding Source(s) for FY2021 Amount ($M)
System Perform 1.1 Total Project Cost 1.1
Fiscal Year FY20 FY21 FY22 FY23 FY24 FY25 FY26 FY27 FY28 FY29 FY30
PLANNING
Needs Identification ✔
Development and Evaluation ✔
EXECUTION
Project Development ✔
Implementation

Appendix D – Capital Projects
199
(CIP0330) New Data Center IT Infrastructure and Equipment
Initiative Type: Project Mode: Systemwide Invest. Category: Business Support Investments Invest. Program: IT
Description
As part of Metro's office consolidation initiative, a new data center will be constructed to replace the existing data center at the Jackson Graham building that is being vacated.
Strategic Objectives Supported
Safety Cust. Sat. Reliability Ridership Op. Impact
Location
Systemwide
Outcome
In FY2021, the design and construction planning for the new data center will begins along with the purchase of servers, racks, and networking equipment. This project supports Metro's state of good repair goals.
Cost ($M) Fiscal Year Budget Actual
LTD Expenses 0.2 FY2020 6.6 FY2021 36.1 FY2022 69.5 FY2023 0.0 FY2024 0.0 FY2025 0.0 FY2026 0.0 FY2021-2026 Total 105.6 Total Cost 112.4
Anticipated Funding Sources Funding Source(s) for FY2021 Amount ($M)
Dedicated Funding 36.1 Total Project Cost 36.1
Fiscal Year FY20 FY21 FY22 FY23 FY24 FY25 FY26 FY27 FY28 FY29 FY30
PLANNING
Needs Identification
Development and Evaluation ✔
EXECUTION
Project Development ✔ ✔
Implementation
✔ ✔ ✔

200
Appendix D – Capital Projects
(CIP0331) Enterprise Resource Planning (ERP) Replacement
Initiative Type: Project Mode: Systemwide Invest. Category: Business Support Investments Invest. Program: IT
Description
Metro’s current Enterprise Resource Planning (ERP) system is being retired and will not be supported beyond FY2028. It is necessary to identify and implement a replacement for the current ERP to maintain business operations.
Strategic Objectives Supported
Safety Cust. Sat. Reliability Ridership Op. Impact
Location
Systemwide
Outcome
In FY 2021, the current ERP will receive upgrades and support needed to maintain operations. In addition, Metro will begin the needs assessment and planning required to select a ERP replacement. This project supports Metro's financial responsibility objectives.
Cost ($M) Fiscal Year Budget Actual
LTD Expenses 0.0 FY2020 3.0 FY2021 6.6 FY2022 12.9 FY2023 18.6 FY2024 16.0 FY2025 24.0 FY2026 28.5 FY2021-2026 Total 106.6 Total Cost 109.5
Anticipated Funding Sources Funding Source(s) for FY2021 Amount ($M)
System Perform 6.6 Total Project Cost 6.6
Fiscal Year FY20 FY21 FY22 FY23 FY24 FY25 FY26 FY27 FY28 FY29 FY30
PLANNING
Needs Identification ✔
Development and Evaluation ✔ ✔ ✔ ✔ ✔
EXECUTION
Project Development ✔ ✔ ✔ ✔ ✔ ✔ ✔
Implementation
✔ ✔ ✔ ✔ ✔ ✔ ✔ ✔ ✔ ✔ ✔

Appendix D – Capital Projects
201
(CIP0332) Fiber Installation
Initiative Type: Project Mode: Systemwide Invest. Category: Business Support Investments Invest. Program: IT
Description
Metro will install fiber optic cable along its Right-of-Way (ROW) to 590 ancillary locations in support of Supervisory Control and Data Acquisition (SCADA) and MetroNET services.
Strategic Objectives Supported
Safety Cust. Sat. Reliability Ridership Op. Impact
Location
Systemwide
Outcome
The project will complete the fiber optical cable strategy study in FY2021. Completion of the study will provide the organization the guidance to future develop the fiber solution scope and project schedule. This project supports Metro's financial responsibility objectives.
Cost ($M) Fiscal Year Budget Actual
LTD Expenses 1.2 FY2020 0.9 FY2021 0.5 FY2022 4.0 FY2023 6.7 FY2024 1.5 FY2025 4.7 FY2026 9.0 FY2021-2026 Total 26.4 Total Cost 28.6
Anticipated Funding Sources Funding Source(s) for FY2021 Amount ($M)
System Perform 0.5 Total Project Cost 0.5
Fiscal Year FY20 FY21 FY22 FY23 FY24 FY25 FY26 FY27 FY28 FY29 FY30
PLANNING
Needs Identification ✔
Development and Evaluation ✔ ✔ ✔
EXECUTION
Project Development ✔ ✔ ✔
Implementation
✔ ✔ ✔ ✔ ✔ ✔ ✔ ✔ ✔

202
Appendix D – Capital Projects
(CIP0335) Headquarters - District of Columbia
Initiative Type: Project Mode: Systemwide Invest. Category: Business Support Investments Invest. Program: Support
Equipment/Services
Description
This project is for the design and construction of the new Metro administrative office building at L'Enfant Plaza in the District of Columbia. The new building allows for Metro to consolidate operations from 10 locations to 4 locations.
Strategic Objectives Supported
Safety Cust. Sat. Reliability Ridership Op. Impact
Location
L'Enfant Plaza
Outcome
In FY2021, Metro will continue construction of the new administrative office building located at L'Enfant Plaza in the District of Columbia. The DC location will have major construction with demolition of facade and interior, adding three floor to existing structure, reinforcement of concrete shear walls, adding structural concrete columns, and renovation of parking garage structure. This project improves Metro's financial responsibility and supports our employer of choice initiative.
Cost ($M) Fiscal Year Budget Actual
LTD Expenses 54.3 FY2020 48.5 FY2021 62.0 FY2022 55.0 FY2023 1.0 FY2024 1.0 FY2025 0.0 FY2026 0.0 FY2021-2026 Total 119.0 Total Cost 221.8
Anticipated Funding Sources Funding Source(s) for FY2021 Amount ($M)
Dedicated Funding 7.2 DEBT 54.8 Total Project Cost 62.0
Fiscal Year FY20 FY21 FY22 FY23 FY24 FY25 FY26 FY27 FY28 FY29 FY30
PLANNING
Needs Identification
Development and Evaluation ✔ ✔
EXECUTION
Project Development ✔ ✔ ✔ ✔
Implementation
✔ ✔ ✔ ✔ ✔

Appendix D – Capital Projects
203
(CIP0336) Energy Management Upgrades
Initiative Type: Project Mode: Systemwide Invest. Category: Business Support Investments Invest. Program: Support
Equipment/Services
Description
This project will facilitate upgrades to energy use and management at Metro facilities based on the data gathered from the Energy Management System.
Strategic Objectives Supported
Safety Cust. Sat. Reliability Ridership Op. Impact
Location
Systemwide
Outcome
Metro will begin installing water or electric smart meters in Metro facilities to assess energy and water usage. Additionally, the smart meters will be integrated with the Enterprise Energy Monitoring Software (EEMS) to enable analysis and improved energy and water management practices. This project enhances Metro's financial responsibility and sustainability efforts.
Cost ($M) Fiscal Year Budget Actual
LTD Expenses 0.0 FY2020 1.3 FY2021 0.2 FY2022 0.0 FY2023 0.0 FY2024 1.3 FY2025 2.3 FY2026 2.4 FY2021-2026 Total 6.2 Total Cost 7.5
Anticipated Funding Sources Funding Source(s) for FY2021 Amount ($M)
System Perform 0.2 Total Project Cost 0.2
Fiscal Year FY20 FY21 FY22 FY23 FY24 FY25 FY26 FY27 FY28 FY29 FY30
PLANNING
Needs Identification
Development and Evaluation ✔ ✔
EXECUTION
Project Development ✔
Implementation
✔ ✔ ✔ ✔ ✔

204
Appendix D – Capital Projects
(CIP0337) Headquarters Construction - Virginia
Initiative Type: Project Mode: Systemwide Invest. Category: Business Support Investments Invest. Program: Support
Equipment/Services
Description
As part of Metro's regional office consolidation plan, a new office building will be constructed near the Eisenhower Avenue Metrorail station and adjacent to the Hoffman Town Center in Alexandria, Virginia. The building will be designed with the goal of achieving LEED Platinum certification and is part of the larger redevelopment of the Eisenhower Avenue corridor.
Strategic Objectives Supported
Safety Cust. Sat. Reliability Ridership Op. Impact
Location
Eisenhower Avenue
Outcome
In FY2021, Metro will continue construction of the new administrative office building located at Eisenhower Avenue in Virginia. The VA location will have base building core and shell construction completed. This project improves Metro's financial responsibility and supports our employer of choice initiative.
Cost ($M) Fiscal Year Budget Actual
LTD Expenses 0.0 FY2020 56.5 FY2021 84.9 FY2022 152.6 FY2023 3.3 FY2024 2.0 FY2025 0.0 FY2026 0.0 FY2021-2026 Total 242.8 Total Cost 299.3
Anticipated Funding Sources Funding Source(s) for FY2021 Amount ($M)
Dedicated Funding 7.0 DEBT 77.9 Total Project Cost 84.9
Fiscal Year FY20 FY21 FY22 FY23 FY24 FY25 FY26 FY27 FY28 FY29 FY30
PLANNING
Needs Identification
Development and Evaluation
EXECUTION
Project Development ✔ ✔
Implementation
✔ ✔ ✔

Appendix D – Capital Projects
205
(CIP0338) Headquarters Construction - Maryland
Initiative Type: Project Mode: Systemwide Invest. Category: Business Support Investments Invest. Program: Support
Equipment/Services
Description
New office in Maryland to consolidate employees near New Carrollton Metrorail station in Prince George's County, Maryland. The station is one of the region’s most significant transit hubs and is served by Metro, MARC, multiple local and regional buses, Amtrak, Greyhound, and the future Maryland MTA Purple Line. The building will be designed with the goal of achieving LEED Platinum certification and is part of the continued development of New Carrollton.
Strategic Objectives Supported
Safety Cust. Sat. Reliability Ridership Op. Impact
Location
New Carrollton
Outcome
In FY2021, Metro will continue construction of the new administrative office building located at New Carrollton in Maryland. The MD location will complete pre-construction activities related to design, environmental assessment, land surveying, and general site work preparation. This program improves Metro's financial responsibility and supports our employer of choice initiative.
Cost ($M) Fiscal Year Budget Actual
LTD Expenses 0.0 FY2020 10.8 FY2021 108.3 FY2022 115.8 FY2023 2.0 FY2024 2.0 FY2025 0.0 FY2026 0.0 FY2021-2026 Total 228.1 Total Cost 238.9
Anticipated Funding Sources Funding Source(s) for FY2021 Amount ($M)
Dedicated Funding 7.0 DEBT 101.3 Total Project Cost 108.3
Fiscal Year FY20 FY21 FY22 FY23 FY24 FY25 FY26 FY27 FY28 FY29 FY30
PLANNING
Needs Identification
Development and Evaluation
EXECUTION
Project Development ✔ ✔
Implementation
✔ ✔ ✔
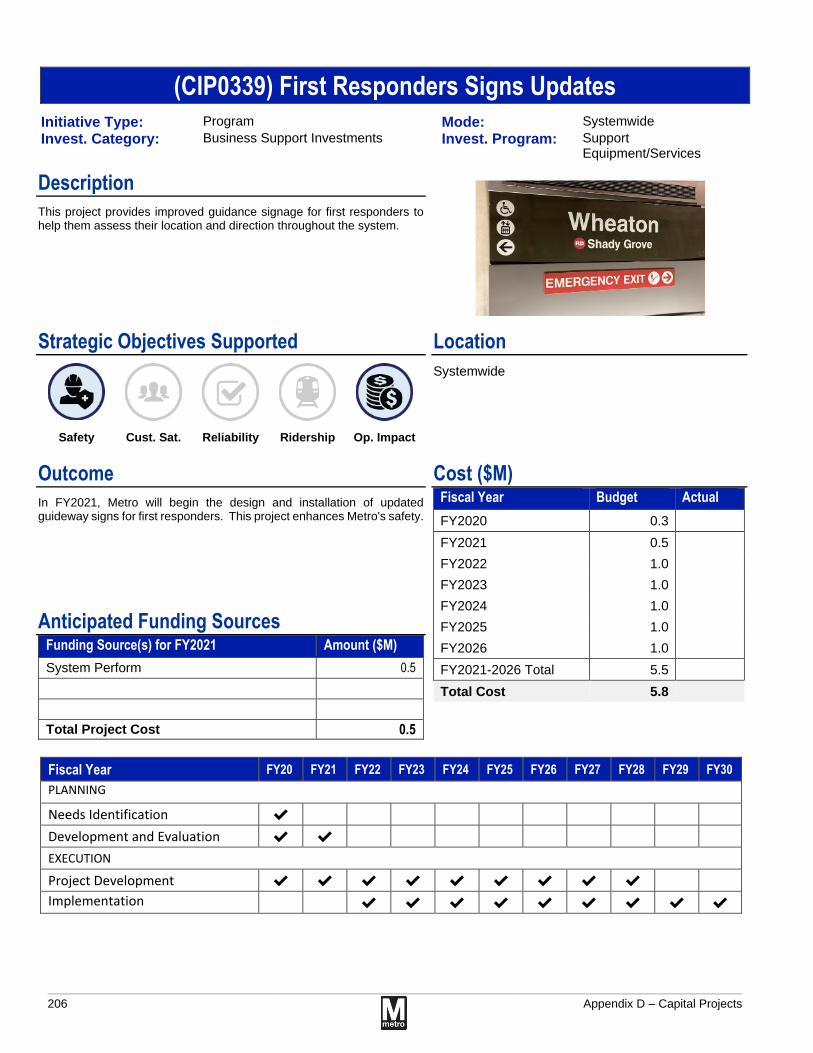
206
Appendix D – Capital Projects
(CIP0339) First Responders Signs Updates
Initiative Type: Program Mode: Systemwide Invest. Category: Business Support Investments Invest. Program: Support
Equipment/Services
Description
This project provides improved guidance signage for first responders to help them assess their location and direction throughout the system.
Strategic Objectives Supported
Safety Cust. Sat. Reliability Ridership Op. Impact
Location
Systemwide
Outcome
In FY2021, Metro will begin the design and installation of updated guideway signs for first responders. This project enhances Metro's safety.
Cost ($M) Fiscal Year Budget Actual
FY2020 0.3 FY2021 0.5 FY2022 1.0 FY2023 1.0 FY2024 1.0 FY2025 1.0 FY2026 1.0 FY2021-2026 Total 5.5 Total Cost 5.8
Anticipated Funding Sources Funding Source(s) for FY2021 Amount ($M)
System Perform 0.5 Total Project Cost 0.5
Fiscal Year FY20 FY21 FY22 FY23 FY24 FY25 FY26 FY27 FY28 FY29 FY30
PLANNING
Needs Identification ✔
Development and Evaluation ✔ ✔
EXECUTION
Project Development ✔ ✔ ✔ ✔ ✔ ✔ ✔ ✔ ✔
Implementation
✔ ✔ ✔ ✔ ✔ ✔ ✔ ✔ ✔
Appendix D – Capital Projects
207
(CIP0340) Administrative Facility Rehabilitation Project
Initiative Type: Project Mode: Systemwide Invest. Category: Business Support Investments Invest. Program: Support
Equipment/Services
Description
This project provides for the rehabilitation of administration buildings at various locations.
Strategic Objectives Supported
Safety Cust. Sat. Reliability Ridership Op. Impact
Location
Systemwide
Outcome
In FY2021, Metro will evaluate current options for building rehabilitation of the Telegraph Road maintenance and administrative facility and prioritize options regarding use of the facility. Additionally, Metro will plan and schedule required near term improvements after evaluation. This project supports Metro's state of good repair objectives.
Cost ($M) Fiscal Year Budget Actual
LTD Expenses 0.0 FY2020 0.0 FY2021 0.5 FY2022 1.0 FY2023 2.0 FY2024 0.0 FY2025 0.0 FY2026 0.0 FY2021-2026 Total 3.5 Total Cost 3.5
Anticipated Funding Sources Funding Source(s) for FY2021 Amount ($M)
System Perform 0.5 Total Project Cost 0.5
Fiscal Year FY20 FY21 FY22 FY23 FY24 FY25 FY26 FY27 FY28 FY29 FY30
PLANNING
Needs Identification ✔
Development and Evaluation ✔ ✔ ✔
EXECUTION
Project Development ✔ ✔
Implementation
✔

208
Appendix D – Capital Projects
(CIP0341) Standpipe Replacement Program
Initiative Type: Program Mode: Rail Invest. Category: Station and Passenger Facilities
Investments Invest. Program: Station Systems
Description
This program will address the replacement of dry standpipes throughout the system that have reached the end of their useful life or need to be replaced based on asset condition.
Strategic Objectives Supported
Safety Cust. Sat. Reliability Ridership Op. Impact
Location
Systemwide
Outcome
In FY2021, Metro will complete about twenty-nine dry standpipe replacements across various lines and in tunnels. This program improves the safety of the Metrorail system by mitigating fire incidents and helping to improve service as measured by the key performance indicator (KPI).
Cost ($M) Fiscal Year Budget Actual
FY2020 4.7 FY2021 6.8 FY2022 7.0 FY2023 9.5 FY2024 6.5 FY2025 7.5 FY2026 5.5 FY2021-2026 Total 42.8 Total Cost 47.5
Anticipated Funding Sources Funding Source(s) for FY2021 Amount ($M)
Dedicated Funding 6.8 Total Project Cost 6.8
Fiscal Year FY20 FY21 FY22 FY23 FY24 FY25 FY26 FY27 FY28 FY29 FY30
PLANNING
Needs Identification
Development and Evaluation
EXECUTION
Project Development
Implementation
✔ ✔ ✔ ✔ ✔ ✔ ✔ ✔ ✔ ✔ ✔

Appendix D – Capital Projects
209
(CIP0342) IT Hardware Replacement Program
Initiative Type: Program Mode: Systemwide Invest. Category: Business Support Investments Invest. Program: IT
Description
This program is focused on implementation of data center infrastructure technologies which can achieve higher operational efficiencies, increase service availability and reduce risk to the underlying business service networks. The communication networks enable resource and information sharing for business functions such as voice communications, email, internet access, rail and bus operations and monitoring, surveillance systems and administrative business systems.
Strategic Objectives Supported
Safety Cust. Sat. Reliability Ridership Op. Impact
Location
Systemwide
Outcome
In FY2021, Metro will upgrade or replace outdated hardware and software assets, perform network maintenance and expansion to support operational needs, and continue ongoing Authority-wide PC Desktop, laptop and tablet replacements. This program supports Metro's state of good repair efforts and employer of choice goals.
Cost ($M) Fiscal Year Budget Actual
FY2020 10.4 FY2021 18.3 FY2022 14.9 FY2023 14.9 FY2024 14.9 FY2025 11.7 FY2026 15.1 FY2021-2026 Total 89.7 Total Cost 100.1
Anticipated Funding Sources Funding Source(s) for FY2021 Amount ($M)
Dedicated Funding 18.3 Total Project Cost 18.3
Fiscal Year FY20 FY21 FY22 FY23 FY24 FY25 FY26 FY27 FY28 FY29 FY30
PLANNING
Needs Identification
Development and Evaluation
EXECUTION
Project Development ✔ ✔ ✔ ✔ ✔ ✔ ✔ ✔ ✔ ✔ ✔
Implementation
✔ ✔ ✔ ✔ ✔ ✔ ✔ ✔ ✔ ✔ ✔

210
Appendix D – Capital Projects
(CIP0343) Operating and Maintenance Applications
Initiative Type: Program Mode: Systemwide Invest. Category: Business Support Investments Invest. Program: IT
Description
This program provides software and security updates, corrections to software codes and maintains a state of good repair for critical systems including: Geographic Information System (GIS), Financial, Human Resources, security and safety, operational application for Rail, Bus, and Metro Access.
Strategic Objectives Supported
Safety Cust. Sat. Reliability Ridership Op. Impact
Location
Systemwide
Outcome
In FY2021, Metro will continue to complete improvements and ensure applications are maintaining a State of Good Repair for all applications Metro utilizes. The program will provide user support, database maintenance, user administration, system patching, and overhaul the organization's website with new platforms and user interfaces. Will continue to develop an enterprise-level service-oriented architecture (SOA) design to integrate various software platforms. This program supports Metro's state of good repair efforts.
Cost ($M) Fiscal Year Budget Actual
FY2020 21.9 FY2021 28.1 FY2022 28.9 FY2023 30.8 FY2024 29.8 FY2025 30.2 FY2026 31.0 FY2021-2026 Total 178.7 Total Cost 200.7
Anticipated Funding Sources Funding Source(s) for FY2021 Amount ($M)
System Perform 28.1 Total Project Cost 28.1
Fiscal Year FY20 FY21 FY22 FY23 FY24 FY25 FY26 FY27 FY28 FY29 FY30
PLANNING
Needs Identification
Development and Evaluation
EXECUTION
Project Development ✔ ✔ ✔ ✔ ✔ ✔ ✔ ✔ ✔ ✔ ✔
Implementation
✔ ✔ ✔ ✔ ✔ ✔ ✔ ✔ ✔ ✔ ✔

Appendix D – Capital Projects
211
(CIP0344) IT Program Management and Quality Assurance
Initiative Type: Program Mode: Systemwide Invest. Category: Business Support Investments Invest. Program: IT
Description
This program provides audit support, the establishment of improved IT process support model, standardization of change management and support services.
Strategic Objectives Supported
Safety Cust. Sat. Reliability Ridership Op. Impact
Location
Systemwide
Outcome
In FY2021, Metro will continue to support WMATA enterprise applications application in order to deliver IT capital investment that meets business needs efficiently. By developing and providing Quality Assurance support, creating testing environments, audit support, improved IT process support model, and standardization of change management. This project supports Metro's financial responsibility measures.
Cost ($M) Fiscal Year Budget Actual
FY2020 2.2 FY2021 1.9 FY2022 1.6 FY2023 1.6 FY2024 1.6 FY2025 1.6 FY2026 1.6 FY2021-2026 Total 9.9 Total Cost 12.0
Anticipated Funding Sources Funding Source(s) for FY2021 Amount ($M)
System Perform 1.9 Total Project Cost 1.9
Fiscal Year FY20 FY21 FY22 FY23 FY24 FY25 FY26 FY27 FY28 FY29 FY30
PLANNING
Needs Identification
Development and Evaluation
EXECUTION
Project Development
Implementation
✔ ✔ ✔ ✔ ✔ ✔ ✔ ✔ ✔ ✔ ✔

212
Appendix D – Capital Projects
(CIP0347) Accounting Capital Program Support
Initiative Type: Program Mode: Systemwide Invest. Category: Business Support Investments Invest. Program: Support
Equipment/Services
Description
Accounting services for the capital program to facilitate planned capital projects.
Strategic Objectives Supported
Safety Cust. Sat. Reliability Ridership Op. Impact
Location
Systemwide
Outcome
In FY2021, Metro will continue to provide Accounting services to the capital program, including review and control of charges to the capital program. This program enhances Metro's financial responsibility.
Cost ($M) Fiscal Year Budget Actual
FY2020 0.8 FY2021 0.8 FY2022 0.8 FY2023 0.8 FY2024 0.8 FY2025 0.8 FY2026 0.8 FY2021-2026 Total 4.5 Total Cost 5.3
Anticipated Funding Sources Funding Source(s) for FY2021 Amount ($M)
System Perform 0.8 Total Project Cost 0.8
Fiscal Year FY20 FY21 FY22 FY23 FY24 FY25 FY26 FY27 FY28 FY29 FY30
PLANNING
Needs Identification
Development and Evaluation
EXECUTION
Project Development
Implementation
✔ ✔ ✔ ✔ ✔ ✔ ✔ ✔ ✔ ✔ ✔

Appendix D – Capital Projects
213
(CIP0348) Minnesota Avenue Aerial Structure Rehabilitation
Initiative Type: Project Mode: Rail Invest. Category: Track and Structures Rehabilitation
Investments Invest. Program: Structures
Description
This project will retrofit hammerhead pier caps which support aerial guideways on Minnesota Avenue Bridge on the Orange Line. This retrofit construction will add a concrete pier cap box to each of the 60 bridge hammerheads to reinforce structures and extend the useful life of the structures by 75 years.
Strategic Objectives Supported
Safety Cust. Sat. Reliability Ridership Op. Impact
Location
DC
Outcome
Metro will begin construction to retrofit the hammerhead pier caps on the Minnesota Avenue Bridge with concrete pier caps to reinforce existing bridge structure. This project helps keep the Metrorail system in a state of good repair.
Cost ($M) Fiscal Year Budget Actual
LTD Expenses 0.0 FY2020 1.0 FY2021 6.0 FY2022 6.0 FY2023 4.8 FY2024 0.0 FY2025 0.0 FY2026 0.0 FY2021-2026 Total 16.8 Total Cost 17.8
Anticipated Funding Sources Funding Source(s) for FY2021 Amount ($M)
Dedicated Funding 6.0 Total Project Cost 6.0
Fiscal Year FY20 FY21 FY22 FY23 FY24 FY25 FY26 FY27 FY28 FY29 FY30
PLANNING
Needs Identification
Development and Evaluation ✔
EXECUTION
Project Development ✔ ✔
Implementation
✔ ✔ ✔ ✔ ✔ ✔
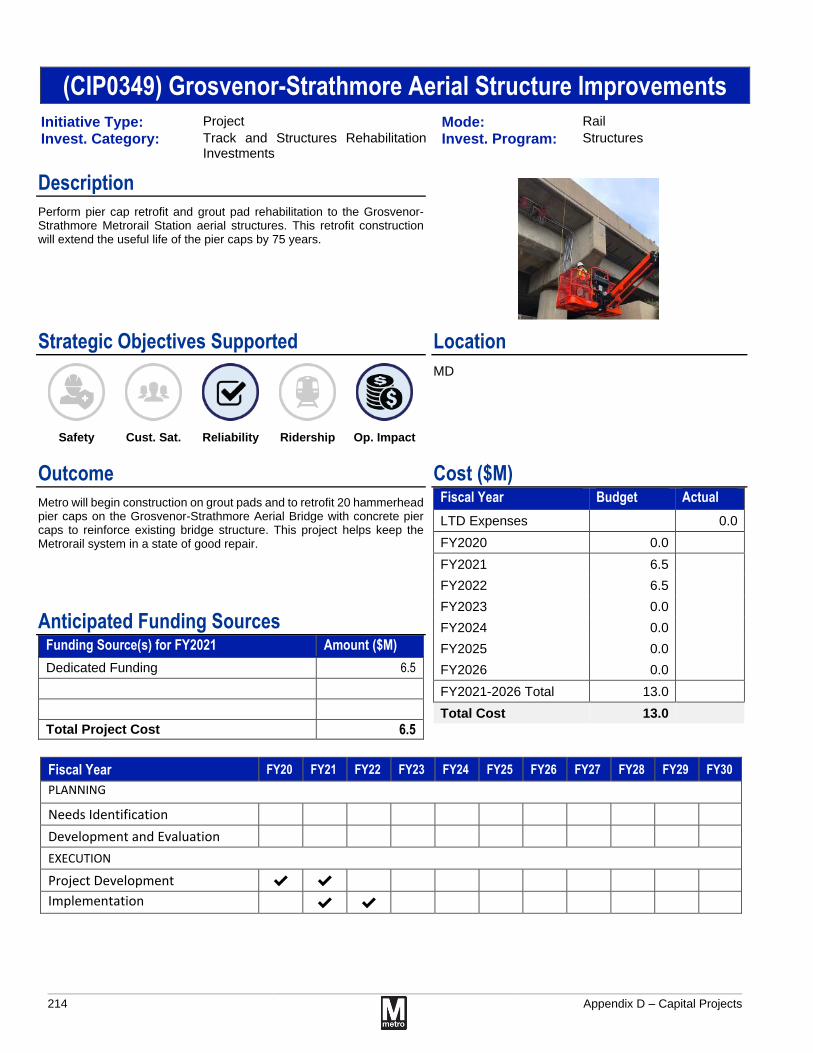
214
Appendix D – Capital Projects
(CIP0349) Grosvenor-Strathmore Aerial Structure Improvements
Initiative Type: Project Mode: Rail Invest. Category: Track and Structures Rehabilitation
Investments Invest. Program: Structures
Description
Perform pier cap retrofit and grout pad rehabilitation to the Grosvenor-Strathmore Metrorail Station aerial structures. This retrofit construction will extend the useful life of the pier caps by 75 years.
Strategic Objectives Supported
Safety Cust. Sat. Reliability Ridership Op. Impact
Location
MD
Outcome
Metro will begin construction on grout pads and to retrofit 20 hammerhead pier caps on the Grosvenor-Strathmore Aerial Bridge with concrete pier caps to reinforce existing bridge structure. This project helps keep the Metrorail system in a state of good repair.
Cost ($M) Fiscal Year Budget Actual
LTD Expenses 0.0 FY2020 0.0 FY2021 6.5 FY2022 6.5 FY2023 0.0 FY2024 0.0 FY2025 0.0 FY2026 0.0 FY2021-2026 Total 13.0 Total Cost 13.0
Anticipated Funding Sources Funding Source(s) for FY2021 Amount ($M)
Dedicated Funding 6.5 Total Project Cost 6.5
Fiscal Year FY20 FY21 FY22 FY23 FY24 FY25 FY26 FY27 FY28 FY29 FY30
PLANNING
Needs Identification
Development and Evaluation
EXECUTION
Project Development ✔ ✔
Implementation
✔ ✔

Appendix D – Capital Projects
215
(CIP0350) Remote Terminal Unit (RTU) Replacement Project
Initiative Type: Project Mode: Systemwide Invest. Category: Business Support Investments Invest. Program: IT
Description
Replace Remote Terminal Units (RTUs) in Train Control Rooms (TCRs), signal communication rooms, and power rooms as they reach the end of their lifecycle with new technology that allows the remote monitoring of equipment.
Strategic Objectives Supported
Safety Cust. Sat. Reliability Ridership Op. Impact
Location
Systemwide
Outcome
Begin to gather business requirements, technology selection and create implementation schedule to replace Remote Terminal Units (RTUs). This project will increase system reliability, safety, and operations by improving technician communications.
Cost ($M) Fiscal Year Budget Actual
LTD Expenses 0.0 FY2020 0.3 FY2021 0.5 FY2022 1.1 FY2023 4.5 FY2024 7.0 FY2025 8.0 FY2026 10.0 FY2021-2026 Total 31.1 Total Cost 31.4
Anticipated Funding Sources Funding Source(s) for FY2021 Amount ($M)
System Perform 0.5 Total Project Cost 0.5
Fiscal Year FY20 FY21 FY22 FY23 FY24 FY25 FY26 FY27 FY28 FY29 FY30
PLANNING
Needs Identification ✔
Development and Evaluation ✔ ✔
EXECUTION
Project Development ✔ ✔ ✔
Implementation
✔ ✔ ✔ ✔ ✔ ✔ ✔ ✔

216
Appendix D – Capital Projects
(CIP8001) D&E Rail Car Replacement
Initiative Type: Project Mode: Rail Invest. Category: Railcar Investments Invest. Program: Railcar Acquisition
Description
This project will address surveys, studies, engineering, and design tasks related to new Railcar acquisition efforts that may lead to future capital projects or programs.
Strategic Objectives Supported
Safety Cust. Sat. Reliability Ridership Op. Impact
Location
Systemwide
Outcome
No planned deliverables in FY21. Project will resume between FY2022 and FY2026.
Cost ($M) Fiscal Year Budget Actual
LTD Expenses 0.0 FY2020 0.5 FY2021 0.0 FY2022 0.0 FY2023 0.0 FY2024 0.5 FY2025 0.3 FY2026 0.0 FY2021-2026 Total 0.8 Total Cost 1.3
Anticipated Funding Sources Funding Source(s) for FY2021 Amount ($M)
Total Project Cost
Fiscal Year FY20 FY21 FY22 FY23 FY24 FY25 FY26 FY27 FY28 FY29 FY30
PLANNING
Needs Identification ✔ ✔
Development and Evaluation ✔ ✔ ✔ ✔
EXECUTION
Project Development ✔ ✔ ✔
Implementation

Appendix D – Capital Projects
217
(CIP8005) D&E Rail Yard Improvements
Initiative Type: Project Mode: Rail Invest. Category: Railcar Investments Invest. Program: Railcar Maintenance
Facilities
Description
This project will provide surveys, studies, engineering, and designs related to new Rail Yard Improvements which may lead to future capital projects or programs.
Strategic Objectives Supported
Safety Cust. Sat. Reliability Ridership Op. Impact
Location
Systemwide
Outcome
Begin the surveys, studies, engineering, and design tasks related to new Rail Yard Improvements.
Cost ($M) Fiscal Year Budget Actual
LTD Expenses 1.7 FY2020 0.8 FY2021 1.0 FY2022 0.0 FY2023 0.5 FY2024 0.5 FY2025 0.0 FY2026 0.0 FY2021-2026 Total 2.0 Total Cost 4.5
Anticipated Funding Sources Funding Source(s) for FY2021 Amount ($M)
System Perform 1.0 Total Project Cost 1.0
Fiscal Year FY20 FY21 FY22 FY23 FY24 FY25 FY26 FY27 FY28 FY29 FY30
PLANNING
Needs Identification ✔
Development and Evaluation ✔ ✔ ✔ ✔
EXECUTION
Project Development ✔
Implementation

218
Appendix D – Capital Projects
(CIP8009) D&E ATC & Communications Improvements
Initiative Type: Program Mode: Rail Invest. Category: Rail Systems Investments Invest. Program: Signals & Communications
Description
This program provides surveys, studies, engineering, and designs related to new Signals and Communications Program efforts that may lead to future capital projects or programs.
Strategic Objectives Supported
Safety Cust. Sat. Reliability Ridership Op. Impact
Location
Systemwide
Outcome
In FY2021, Metro will continue studies to determine the feasibility of making significant long term investments in a next generation train control system as the current system reaches the end of its useful life.
Cost ($M) Fiscal Year Budget Actual
FY2020 1.1 FY2021 0.5 FY2022 0.0 FY2023 0.0 FY2024 0.0 FY2025 0.0 FY2026 0.0 FY2021-2026 Total 0.5 Total Cost 1.6
Anticipated Funding Sources Funding Source(s) for FY2021 Amount ($M)
System Perform 0.5 Total Project Cost 0.5
Fiscal Year FY20 FY21 FY22 FY23 FY24 FY25 FY26 FY27 FY28 FY29 FY30
PLANNING
Needs Identification ✔
Development and Evaluation ✔ ✔
EXECUTION
Project Development ✔
Implementation
✔
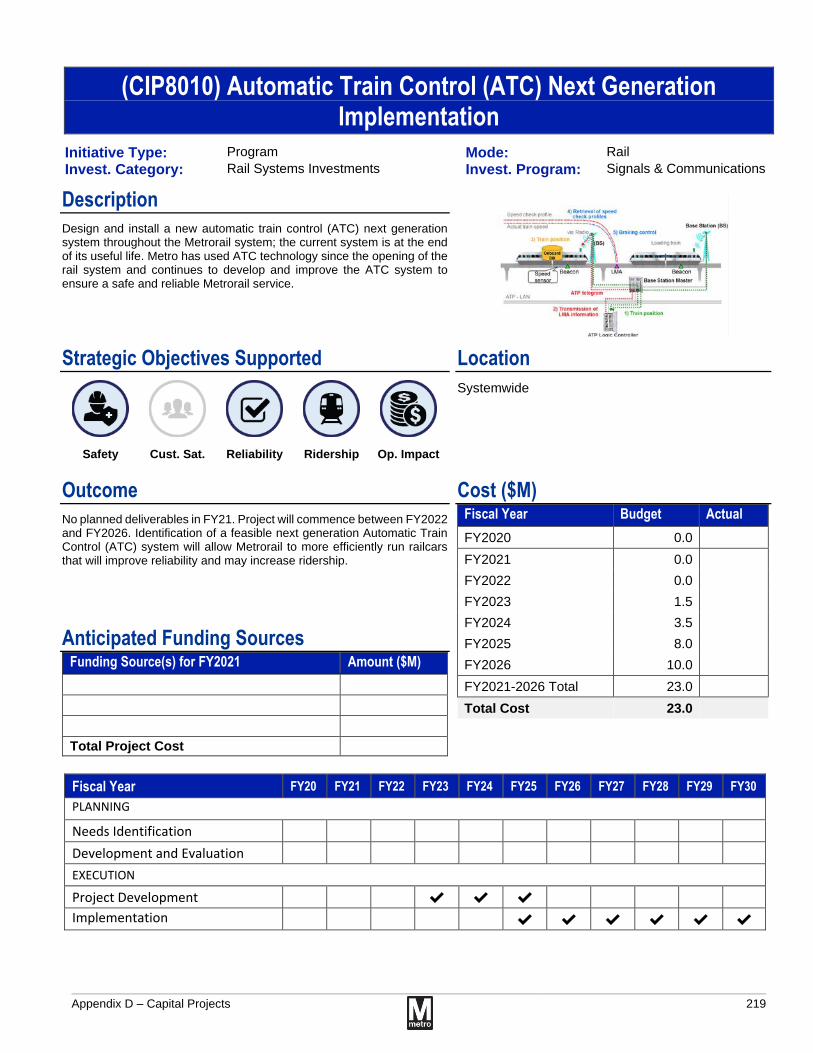
Appendix D – Capital Projects
219
(CIP8010) Automatic Train Control (ATC) Next Generation Implementation
Initiative Type: Program Mode: Rail Invest. Category: Rail Systems Investments Invest. Program: Signals & Communications
Description
Design and install a new automatic train control (ATC) next generation system throughout the Metrorail system; the current system is at the end of its useful life. Metro has used ATC technology since the opening of the rail system and continues to develop and improve the ATC system to ensure a safe and reliable Metrorail service.
Strategic Objectives Supported
Safety Cust. Sat. Reliability Ridership Op. Impact
Location
Systemwide
Outcome
No planned deliverables in FY21. Project will commence between FY2022 and FY2026. Identification of a feasible next generation Automatic Train Control (ATC) system will allow Metrorail to more efficiently run railcars that will improve reliability and may increase ridership.
Cost ($M) Fiscal Year Budget Actual
FY2020 0.0 FY2021 0.0 FY2022 0.0 FY2023 1.5 FY2024 3.5 FY2025 8.0 FY2026 10.0 FY2021-2026 Total 23.0 Total Cost 23.0
Anticipated Funding Sources Funding Source(s) for FY2021 Amount ($M)
Total Project Cost
Fiscal Year FY20 FY21 FY22 FY23 FY24 FY25 FY26 FY27 FY28 FY29 FY30
PLANNING
Needs Identification
Development and Evaluation
EXECUTION
Project Development ✔ ✔ ✔
Implementation
✔ ✔ ✔ ✔ ✔ ✔

220
Appendix D – Capital Projects
(CIP8011) D&E Fixed Rail Improvements
Initiative Type: Program Mode: Rail Invest. Category: Track and Structures Rehabilitation
Investments Invest. Program: Fixed Rail
Description
This project supports the development and evaluation of new initiatives associated with fixed rail improvements.
Strategic Objectives Supported
Safety Cust. Sat. Reliability Ridership Op. Impact
Location
Systemwide
Outcome
In FY2021, design is planned for a 110-foot extension of a pocket track at the Orange and Blue/Silver Line junction near Minnesota Avenue. In addition, an assessment of the recently eliminated turn-backs on the Red and Yellow Lines will conclude and will determine the level of infrastructure investment and terminal/railyard operational adjustments required to support increased service and turnaround frequencies.
Cost ($M) Fiscal Year Budget Actual
FY2020 4.5 FY2021 1.2 FY2022 2.0 FY2023 0.0 FY2024 0.0 FY2025 0.0 FY2026 0.0 FY2021-2026 Total 3.2 Total Cost 7.7
Anticipated Funding Sources Funding Source(s) for FY2021 Amount ($M)
System Perform 1.2 Total Project Cost 1.2
Fiscal Year FY20 FY21 FY22 FY23 FY24 FY25 FY26 FY27 FY28 FY29 FY30
PLANNING
Needs Identification ✔ ✔
Development and Evaluation ✔ ✔ ✔
EXECUTION
Project Development ✔ ✔ ✔
Implementation
✔ ✔ ✔ ✔ ✔

Appendix D – Capital Projects
221
(CIP8013) D&E Track Structures Improvements
Initiative Type: Program Mode: Rail Invest. Category: Track and Structures Rehabilitation
Investments Invest. Program: Structures
Description
This project will address surveys, studies, engineering, and design tasks related to new Structures Program efforts that may lead to future capital projects or programs.
Strategic Objectives Supported
Safety Cust. Sat. Reliability Ridership Op. Impact
Location
Systemwide
Outcome
In FY2021, Metro will continue engineering and design initiatives to improve the management and prioritization of track infrastructure maintenance activities. These include analysis of alternatives for the Blue, Orange, and Silver Lines to address crowding in trains and stations, as well as the installation of track heater control modules that would reduce unnecessary run time for third rail heaters.
Cost ($M) Fiscal Year Budget Actual
FY2020 0.9 FY2021 4.0 FY2022 5.0 FY2023 1.0 FY2024 0.5 FY2025 0.0 FY2026 0.0 FY2021-2026 Total 10.5 Total Cost 11.4
Anticipated Funding Sources Funding Source(s) for FY2021 Amount ($M)
System Perform 4.0 Total Project Cost 4.0
Fiscal Year FY20 FY21 FY22 FY23 FY24 FY25 FY26 FY27 FY28 FY29 FY30
PLANNING
Needs Identification ✔
Development and Evaluation ✔ ✔ ✔
EXECUTION
Project Development ✔ ✔ ✔ ✔
Implementation
✔ ✔ ✔ ✔ ✔ ✔

222
Appendix D – Capital Projects
(CIP8014) Yellow Line Portal Tunnel Remediation
Initiative Type: Project Mode: Systemwide Invest. Category: Track and Structures Rehabilitation
Investments Invest. Program: Structures
Description
Project to address water intrusion issues at the Yellow Line Portal. Significant repairs to the steel lining after the L'Enfant Plaza Metrorail station are needed to mitigate water infiltration into the tunnel.
Strategic Objectives Supported
Safety Cust. Sat. Reliability Ridership Op. Impact
Location
Systemwide
Outcome
No planned deliverables in FY21. Project will commence between FY2022 and FY2026. This project will imprce safety and reliability based on Metro-established key performance indicators (KPIs) such as MyTripTime and Rail Infrastructure Reliability.
Cost ($M) Fiscal Year Budget Actual
LTD Expenses 0.0 FY2020 0.0 FY2021 0.0 FY2022 0.0 FY2023 0.0 FY2024 0.0 FY2025 0.0 FY2026 20.0 FY2021-2026 Total 20.0 Total Cost 20.0
Anticipated Funding Sources Funding Source(s) for FY2021 Amount ($M)
Total Project Cost
Fiscal Year FY20 FY21 FY22 FY23 FY24 FY25 FY26 FY27 FY28 FY29 FY30
PLANNING
Needs Identification
Development and Evaluation
EXECUTION
Project Development ✔
Implementation
✔ ✔ ✔ ✔ ✔

Appendix D – Capital Projects
223
(CIP8015) D&E Platform & Structures
Initiative Type: Project Mode: Rail Invest. Category: Station and Passenger Facilities
Investments Invest. Program: Platforms & Structures
Description
This project will provide surveys, studies, engineering, and designs related to the new Platform & Structures Program efforts that may lead to future capital projects or programs.
Strategic Objectives Supported
Safety Cust. Sat. Reliability Ridership Op. Impact
Location
Systemwide
Outcome
In FY2021, Metro will continue design and evaluation efforts for a proposed second entrance at Foggy Bottom-GWU, analyze proposed improvements to elevators and escalators in Metro Center to improve passenger flow within the station, analyze passenger circulation improvements at L'Enfant Plaza and McPherson Square. In additional to the listed projects, Metro will continue to evaluate platforms and structures in DC, Maryland, and Virginia to develop a prioritized list of projects.
Cost ($M) Fiscal Year Budget Actual
LTD Expenses 12.8 FY2020 7.1 FY2021 2.3 FY2022 1.3 FY2023 4.0 FY2024 0.0 FY2025 0.0 FY2026 0.0 FY2021-2026 Total 7.5 Total Cost 27.4
Anticipated Funding Sources Funding Source(s) for FY2021 Amount ($M)
System Perform 2.3 Total Project Cost 2.3
Fiscal Year FY20 FY21 FY22 FY23 FY24 FY25 FY26 FY27 FY28 FY29 FY30
PLANNING
Needs Identification ✔ ✔ ✔ ✔
Development and Evaluation ✔ ✔ ✔ ✔
EXECUTION
Project Development ✔ ✔ ✔ ✔ ✔
Implementation
✔ ✔ ✔ ✔ ✔

224
Appendix D – Capital Projects
(CIP8017) Vertical Transportation Improvements
Initiative Type: Project Mode: Rail Invest. Category: Station and Passenger Facilities
Investments Invest. Program: Vertical Transportation
Description
This project will retrofit select Metrorail station elevators with fire alarm detection devices that will allow the elevator to be recalled in the event of an emergency.
Strategic Objectives Supported
Safety Cust. Sat. Reliability Ridership Op. Impact
Location
Systemwide
Outcome
Evaluate elevator recall fire alarm functions in Metrorail stations to ensure fire code adherence. Code compliance enhances the safety of the Metrorail System.
Cost ($M) Fiscal Year Budget Actual
LTD Expenses 0.0 FY2020 0.0 FY2021 0.2 FY2022 0.2 FY2023 0.2 FY2024 0.2 FY2025 0.0 FY2026 0.0 FY2021-2026 Total 0.6 Total Cost 0.6
Anticipated Funding Sources Funding Source(s) for FY2021 Amount ($M)
Dedicated Funding 0.2 Total Project Cost 0.2
Fiscal Year FY20 FY21 FY22 FY23 FY24 FY25 FY26 FY27 FY28 FY29 FY30
PLANNING
Needs Identification ✔
Development and Evaluation ✔
EXECUTION
Project Development ✔
Implementation
✔ ✔ ✔

Appendix D – Capital Projects
225
(CIP8019) D&E Station Systems
Initiative Type: Program Mode: Rail Invest. Category: Station and Passenger Facilities
Investments Invest. Program: Station Systems
Description
This project identifies improvements needed for Station System designs and evaluates potential solutions.
Strategic Objectives Supported
Safety Cust. Sat. Reliability Ridership Op. Impact
Location
Systemwide
Outcome
In FY2021, designs will continue for systemwide upgrades to Passenger Information Display System (PIDS) and Public Address (PA) System. This program improves service by increasing display visibility, advancing real-time informaiton sharing, and enhancing overall customer experience.
Cost ($M) Fiscal Year Budget Actual
FY2020 0.5 FY2021 3.0 FY2022 8.5 FY2023 10.1 FY2024 9.3 FY2025 9.3 FY2026 9.3 FY2021-2026 Total 49.5 Total Cost 50.0
Anticipated Funding Sources Funding Source(s) for FY2021 Amount ($M)
System Perform 3.0 Total Project Cost 3.0
Fiscal Year FY20 FY21 FY22 FY23 FY24 FY25 FY26 FY27 FY28 FY29 FY30
PLANNING
Needs Identification ✔
Development and Evaluation
EXECUTION
Project Development ✔ ✔ ✔ ✔ ✔ ✔ ✔ ✔ ✔ ✔ ✔
Implementation
✔ ✔ ✔ ✔ ✔ ✔ ✔ ✔ ✔ ✔

226
Appendix D – Capital Projects
(CIP8021) D&E Bus & Paratransit
Initiative Type: Project Mode: Bus Invest. Category: Bus and Paratransit Investments Invest. Program: Bus and Paratransit
Acquisition
Description
This project will provide surveys, studies, engineering, and designs related to new Bus and Paratransit efforts that may lead to future capital projects or programs.
Strategic Objectives Supported
Safety Cust. Sat. Reliability Ridership Op. Impact
Location
Systemwide
Outcome
In FY21, Metro will develop the requirements necessary to launch a pilot of Battery Electric Bus with operation beginning in FY22. This project supports Metro's sustainability and financial responsibility goals.
Cost ($M) Fiscal Year Budget Actual
LTD Expenses 0.0 FY2020 0.7 FY2021 1.9 FY2022 3.8 FY2023 4.3 FY2024 0.0 FY2025 0.8 FY2026 0.3 FY2021-2026 Total 10.9 Total Cost 11.6
Anticipated Funding Sources Funding Source(s) for FY2021 Amount ($M)
System Perform 1.9 Total Project Cost 1.9
Fiscal Year FY20 FY21 FY22 FY23 FY24 FY25 FY26 FY27 FY28 FY29 FY30
PLANNING
Needs Identification ✔ ✔ ✔
Development and Evaluation ✔ ✔ ✔ ✔ ✔ ✔ ✔
EXECUTION
Project Development ✔ ✔ ✔ ✔ ✔ ✔ ✔
Implementation
✔ ✔ ✔ ✔ ✔ ✔ ✔

Appendix D – Capital Projects
227
(CIP8025) D&E Bus Maintenance Facility
Initiative Type: Project Mode: Bus Invest. Category: Bus and Paratransit Investments Invest. Program: Bus Maintenance Facilities
Description
This project will provide surveys, studies, engineering, and designs related to new Bus Maintenance Facilities that may lead to future capital projects or programs.
Strategic Objectives Supported
Safety Cust. Sat. Reliability Ridership Op. Impact
Location
Systemwide
Outcome
Conceptual design and programming for replacement of the Western bus facility. This project supports Metro's state of good repair goals.
Cost ($M) Fiscal Year Budget Actual
LTD Expenses 1.1 FY2020 0.4 FY2021 0.8 FY2022 0.0 FY2023 0.7 FY2024 0.0 FY2025 0.0 FY2026 0.0 FY2021-2026 Total 1.5 Total Cost 2.9
Anticipated Funding Sources Funding Source(s) for FY2021 Amount ($M)
System Perform 0.8 Total Project Cost 0.8
Fiscal Year FY20 FY21 FY22 FY23 FY24 FY25 FY26 FY27 FY28 FY29 FY30
PLANNING
Needs Identification ✔ ✔ ✔
Development and Evaluation ✔ ✔ ✔
EXECUTION
Project Development ✔ ✔ ✔
Implementation

228
Appendix D – Capital Projects
(CIP8026) Future Bus Maintenance Facility
Initiative Type: Project Mode: Bus Invest. Category: Bus and Paratransit Investments Invest. Program: Bus Maintenance Facilities
Description
This project will begin construction of new Bus Maintenance Facilities that are identified for replacement by the Bus Maintenance Facility D&E program.
v
Strategic Objectives Supported
Safety Cust. Sat. Reliability Ridership Op. Impact
Location
Systemwide
Outcome
No planned deliverables in FY21. Project expected to commence between FY2022 and FY2026.
Cost ($M) Fiscal Year Budget Actual
LTD Expenses 0.0 FY2020 0.0 FY2021 0.0 FY2022 0.0 FY2023 0.0 FY2024 0.5 FY2025 1.2 FY2026 8.5 FY2021-2026 Total 10.2 Total Cost 10.2
Anticipated Funding Sources Funding Source(s) for FY2021 Amount ($M)
Total Project Cost
Fiscal Year FY20 FY21 FY22 FY23 FY24 FY25 FY26 FY27 FY28 FY29 FY30
PLANNING
Needs Identification
Development and Evaluation
EXECUTION
Project Development ✔ ✔ ✔ ✔
Implementation
✔ ✔ ✔ ✔ ✔ ✔
Appendix D – Capital Projects
229
(CIP8029) D&E IT
Initiative Type: Project Mode: Systemwide Invest. Category: Business Support Investments Invest. Program: IT
Description
This project identifies emerging Information Technology needs and develops proposed solutions for evaluation to become potential future capital projects.
Strategic Objectives Supported
Safety Cust. Sat. Reliability Ridership Op. Impact
Location
Systemwide
Outcome
In FY21 Metro will develop proposed solutions to support regulatory and reporting requirements of Metro’s Occupational Health and Wellness (OHAW) department, deliver train arrival prediction timelines to Passenger Information Display Signs (PIDS), and evaluate technology options for Metro Transit Police needs. This program supports Metro's financial responsibilty objectives.
Cost ($M) Fiscal Year Budget Actual
LTD Expenses 6.0 FY2020 5.6 FY2021 2.8 FY2022 5.2 FY2023 9.0 FY2024 3.7 FY2025 0.0 FY2026 0.0 FY2021-2026 Total 20.6 Total Cost 32.2
nticipated Funding Sources Funding Source(s) for FY2021 Amount ($M)
System Perform 2.8 Total Project Cost 2.8
Fiscal Year FY20 FY21 FY22 FY23 FY24 FY25 FY26 FY27 FY28 FY29 FY30
PLANNING
Needs Identification ✔ ✔ ✔
Development and Evaluation ✔ ✔ ✔ ✔ ✔
EXECUTION
Project Development ✔ ✔ ✔ ✔ ✔ ✔ ✔
Implementation
✔ ✔ ✔ ✔ ✔ ✔ ✔ ✔

230
Appendix D – Capital Projects
(CIP8031) D&E MTPD
Initiative Type: Project Mode: Systemwide Invest. Category: Business Support Investments Invest. Program: MTPD
Description
This project supports the development and evaluation of new potential MTPD initiatives.
Strategic Objectives Supported
s
Safety Cust. Sat. Reliability Ridership Op. Impact
Location
Systemwide
Outcome
In FY2021, Metro will continue studies on the development of a Law Enforcement Mobile Application, as well as a potential future consolidated training facility to include canine, emergency management, tunnel and first responder training. This project helps maintain Metro's security.
Cost ($M) Fiscal Year Budget Actual
LTD Expenses 0.1 FY2020 1.0 FY2021 0.7 FY2022 0.3 FY2023 0.0 FY2024 0.0 FY2025 0.0 FY2026 0.0 FY2021-2026 Total 1.0 Total Cost 2.1
Anticipated Funding Sources Funding Source(s) for FY2021 Amount ($M)
System Perform 0.7 Total Project Cost 0.7
Fiscal Year FY20 FY21 FY22 FY23 FY24 FY25 FY26 FY27 FY28 FY29 FY30
PLANNING
Needs Identification ✔ ✔ ✔
Development and Evaluation ✔ ✔ ✔ ✔
EXECUTION
Project Development ✔ ✔ ✔ ✔
Implementation
✔ ✔ ✔
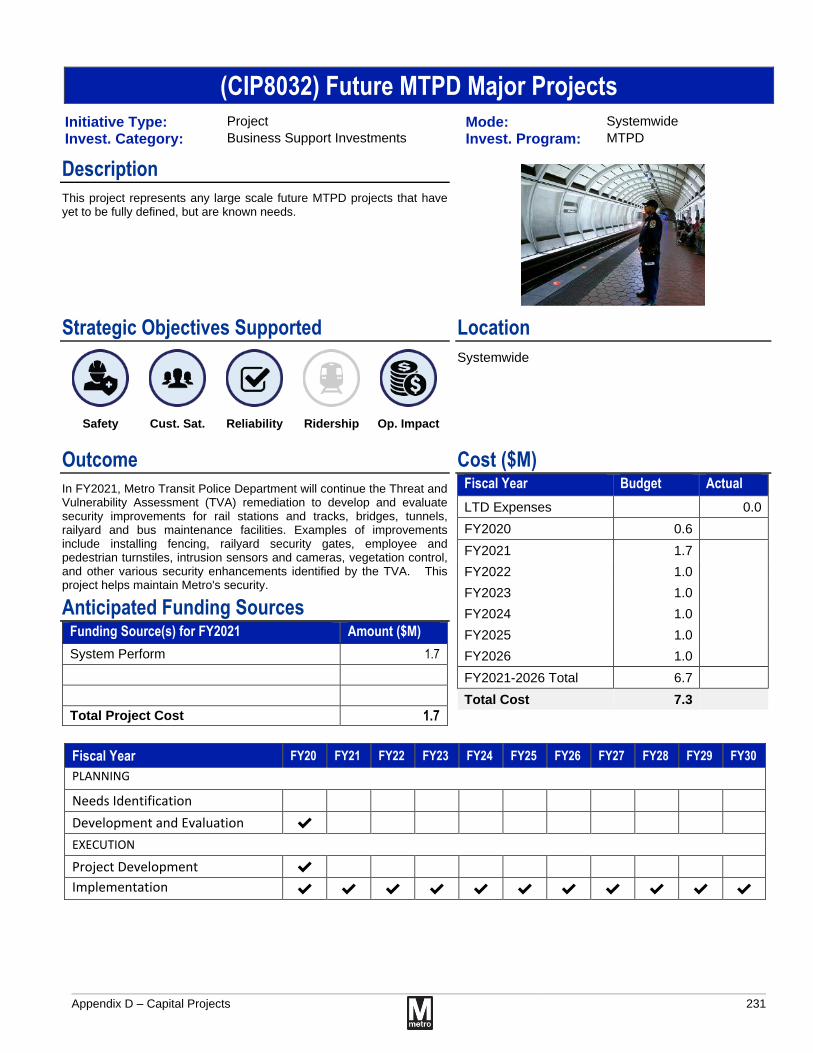
Appendix D – Capital Projects
231
(CIP8032) Future MTPD Major Projects
Initiative Type: Project Mode: Systemwide Invest. Category: Business Support Investments Invest. Program: MTPD
Description
This project represents any large scale future MTPD projects that have yet to be fully defined, but are known needs.
Strategic Objectives Supported
Safety Cust. Sat. Reliability Ridership Op. Impact
Location
Systemwide
Outcome
In FY2021, Metro Transit Police Department will continue the Threat and Vulnerability Assessment (TVA) remediation to develop and evaluate security improvements for rail stations and tracks, bridges, tunnels, railyard and bus maintenance facilities. Examples of improvements include installing fencing, railyard security gates, employee and pedestrian turnstiles, intrusion sensors and cameras, vegetation control, and other various security enhancements identified by the TVA. This project helps maintain Metro's security.
Cost ($M) Fiscal Year Budget Actual
LTD Expenses 0.0 FY2020 0.6 FY2021 1.7 FY2022 1.0 FY2023 1.0 FY2024 1.0 FY2025 1.0 FY2026 1.0 FY2021-2026 Total 6.7 Total Cost 7.3
Anticipated Funding Sources Funding Source(s) for FY2021 Amount ($M)
System Perform 1.7 Total Project Cost 1.7
Fiscal Year FY20 FY21 FY22 FY23 FY24 FY25 FY26 FY27 FY28 FY29 FY30
PLANNING
Needs Identification
Development and Evaluation ✔
EXECUTION
Project Development ✔
Implementation
✔ ✔ ✔ ✔ ✔ ✔ ✔ ✔ ✔ ✔ ✔

232
Appendix D – Capital Projects
(CIP8033) D&E Support Equipment/Services
Initiative Type: Project Mode: Systemwide Invest. Category: Business Support Investments Invest. Program: Support
Equipment/Services
Description
This project is for the purchase of equipment, services, and systems that provide support to Metro's operation.
Strategic Objectives Supported
Safety Cust. Sat. Reliability Ridership Op. Impact
Location
Systemwide
Outcome
Metro will provide engineering services to survey replacement of non-revenue facility rooftop HVAC units beyond useful life. Additionally, will assess use of digital technology to create more efficient ways to utilize the corporate website, improve mobile access, expand wifi marketing, develop touch screen wayfinding, improve voice commanded devices, and enhance self-service communications to improve business operations and customer experience. The D&E program enhances Metro's financial responsibility.
Cost ($M) Fiscal Year Budget Actual
LTD Expenses 1.9 FY2020 0.3 FY2021 0.3 FY2022 0.5 FY2023 0.0 FY2024 0.0 FY2025 0.0 FY2026 0.0 FY2021-2026 Total 0.8 Total Cost 3.0
Anticipated Funding Sources Funding Source(s) for FY2021 Amount ($M)
System Perform 0.3 Total Project Cost 0.3
Fiscal Year FY20 FY21 FY22 FY23 FY24 FY25 FY26 FY27 FY28 FY29 FY30
PLANNING
Needs Identification ✔ ✔ ✔
Development and Evaluation ✔ ✔
EXECUTION
Project Development ✔ ✔ ✔
Implementation
✔ ✔

Appendix D – Capital Projects
233
(CRB0005) Project Development Program - DC
Initiative Type: Program Mode: Bus Invest. Category: Business Support Investments Invest. Program: Support
Equipment/Services
Description
This program is supported by the District of Columbia to facilitate the planning and designing of transit oriented development and other projects that are of priority interest to the District of Columbia.
Strategic Objectives Supported
Safety Cust. Sat. Reliability Ridership Op. Impact
Location
Washington, DC
Outcome
Metro will continue planning for Transit Oriented Development at Brookland and Fort Totten. Development and evaluation of station improvements will continue at Navy Yard-Ballpark. As well as, planning requirements for other station passenger circulation improvements, joint developments, and bus facilities as requested by the District of Columbia.
Cost ($M) Fiscal Year Budget Actual
FY2020 0.8 FY2021 1.0 FY2022 1.0 FY2023 1.0 FY2024 1.0 FY2025 1.0 FY2026 1.0 FY2021-2026 Total 6.0 Total Cost 6.8
Anticipated Funding Sources Funding Source(s) for FY2021 Amount ($M)
Other Local 1.0 Total Project Cost 1.0
Fiscal Year FY20 FY21 FY22 FY23 FY24 FY25 FY26 FY27 FY28 FY29 FY30
PLANNING
Needs Identification
Development and Evaluation
EXECUTION
Project Development
Implementation
✔ ✔ ✔ ✔ ✔ ✔ ✔ ✔ ✔ ✔ ✔

234
Appendix D – Capital Projects
(CRB0009) Project Development Program - MD
Initiative Type: Program Mode: Rail Invest. Category: Business Support Investments Invest. Program: Support
Equipment/Services
Description
This program is supported by the State of Maryland to facilitate the planning and designing of transit oriented development and other projects that are of priority interest to the State of Maryland.
Strategic Objectives Supported
Safety Cust. Sat. Reliability Ridership Op. Impact
Location
Maryland
Outcome
Metro will continue planning for Transit Oriented Development at West Hyattsville, Morgan Boulevard, and Addison Road. Development and evaluation of station improvements will continue at Rockville. As well as, planning requirements for other station passenger circulation improvements, joint developments, and bus facilities as requested by localities in Maryland.
Cost ($M) Fiscal Year Budget Actual
FY2020 0.9 FY2021 1.0 FY2022 1.0 FY2023 1.0 FY2024 1.0 FY2025 1.0 FY2026 1.0 FY2021-2026 Total 6.0 Total Cost 6.9
Anticipated Funding Sources Funding Source(s) for FY2021 Amount ($M)
Other Local 1.0 Total Project Cost 1.0
Fiscal Year FY20 FY21 FY22 FY23 FY24 FY25 FY26 FY27 FY28 FY29 FY30
PLANNING
Needs Identification
Development and Evaluation
EXECUTION
Project Development
Implementation
✔ ✔ ✔ ✔ ✔ ✔ ✔ ✔ ✔ ✔ ✔

Appendix D – Capital Projects
235
(CRB0013) New Potomac Yard Metrorail Station
Initiative Type: Project Mode: Rail Invest. Category: Station and Passenger Facilities
Investments Invest. Program: Platforms & Structures
Description
Design and construction of a new Metrorail Station between the Ronald Reagan Washington National Airport and Braddock Road Stations along the existing Blue and Yellow Lines.
Strategic Objectives Supported
Safety Cust. Sat. Reliability Ridership Op. Impact
Location
Alexandria
Outcome
In FY2021, Metro plans to begin the construction of buildings that will house train control, power and communication systems; install information technology equipment; and complete the track double cross-over and track cut-over installations between National Airport and Braddock Road stations. A new Metrorail station will help to accommodate the growing transportation demand in the Route 1 corridor, serve as an economic anchor for the Potomac Yards corridor, and will provide benefits for Alexandria and the surrounding community.
Cost ($M) Fiscal Year Budget Actual
LTD Expenses 43.1 FY2020 27.5 FY2021 59.1 FY2022 113.9 FY2023 58.9 FY2024 38.6 FY2025 0.0 FY2026 0.0 FY2021-2026 Total 270.4 Total Cost 341.1
Anticipated Funding Sources Funding Source(s) for FY2021 Amount ($M)
Potomac Yard (Alexandria) 59.1 Total Project Cost 59.1
Fiscal Year FY20 FY21 FY22 FY23 FY24 FY25 FY26 FY27 FY28 FY29 FY30
PLANNING
Needs Identification
Development and Evaluation
EXECUTION
Project Development
Implementation
✔ ✔ ✔ ✔ ✔

236
Appendix D – Capital Projects
(CRB0018) Project Development Program - VA
Initiative Type: Program Mode: Rail Invest. Category: Business Support Investments Invest. Program: Support
Equipment/Services
Description
This program is supported by the Commonwealth of Virginia to facilitate the planning and designing of transit oriented development and other projects that are of priority interest to the state of Virginia.
Strategic Objectives Supported
Safety Cust. Sat. Reliability Ridership Op. Impact
Location
Virginia
Outcome
Metro will continue planning for Transit Oriented Development at West Falls Church, East Falls Church Transit Facilities, and Eisenhower Avenue Public Space Improvements. Metro will coordinate and begin planning the Huntington Bus Rapid Transit initiative, as well as, planning requirements for other station passenger circulation improvements, joint developments, and bus facilities as requested by localities in Virginia.
Cost ($M) Fiscal Year Budget Actual
FY2020 1.8 FY2021 1.6 FY2022 1.1 FY2023 1.1 FY2024 1.1 FY2025 1.1 FY2026 1.0 FY2021-2026 Total 6.8 Total Cost 8.5
Anticipated Funding Sources Funding Source(s) for FY2021 Amount ($M)
System Perform 0.6 Other Local 1.0 Total Project Cost 1.6
Fiscal Year FY20 FY21 FY22 FY23 FY24 FY25 FY26 FY27 FY28 FY29 FY30
PLANNING
Needs Identification ✔
Development and Evaluation ✔
EXECUTION
Project Development ✔ ✔
Implementation
✔ ✔ ✔ ✔ ✔ ✔ ✔ ✔ ✔ ✔ ✔
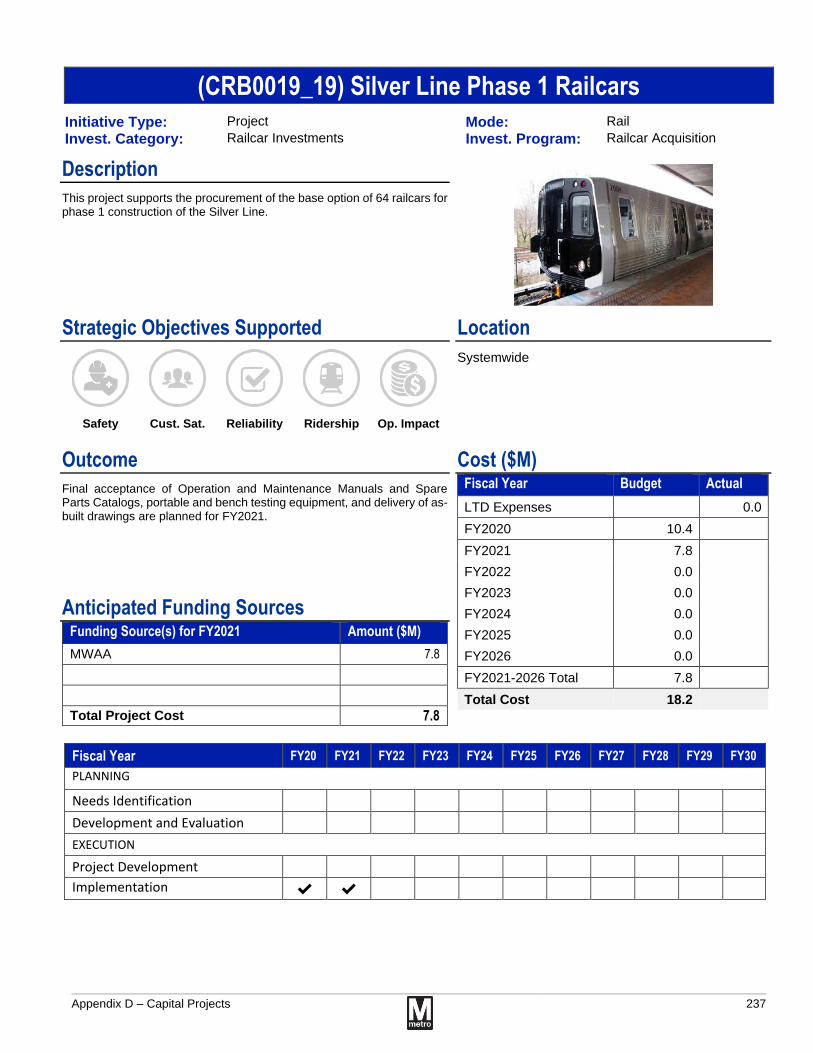
Appendix D – Capital Projects
237
(CRB0019_19) Silver Line Phase 1 Railcars
Initiative Type: Project Mode: Rail Invest. Category: Railcar Investments Invest. Program: Railcar Acquisition
Description
This project supports the procurement of the base option of 64 railcars for phase 1 construction of the Silver Line.
Strategic Objectives Supported
Safety Cust. Sat. Reliability Ridership Op. Impact
Location
Systemwide
Outcome
Final acceptance of Operation and Maintenance Manuals and Spare Parts Catalogs, portable and bench testing equipment, and delivery of as-built drawings are planned for FY2021.
Cost ($M) Fiscal Year Budget Actual
LTD Expenses 0.0 FY2020 10.4 FY2021 7.8 FY2022 0.0 FY2023 0.0 FY2024 0.0 FY2025 0.0 FY2026 0.0 FY2021-2026 Total 7.8 Total Cost 18.2
Anticipated Funding Sources Funding Source(s) for FY2021 Amount ($M)
MWAA 7.8 Total Project Cost 7.8
Fiscal Year FY20 FY21 FY22 FY23 FY24 FY25 FY26 FY27 FY28 FY29 FY30
PLANNING
Needs Identification
Development and Evaluation
EXECUTION
Project Development
Implementation
✔ ✔

238
Appendix D – Capital Projects
(CRB0020) Silver Line Phase 2
Initiative Type: Project Mode: Rail Invest. Category: Station and Passenger Facilities
Investments Invest. Program: Platforms & Structures
Description
This project supports Phase II construction, integration, and infrastructure improvements for the Silver Line expansion.
Strategic Objectives Supported
Safety Cust. Sat. Reliability Ridership Op. Impact
Location
All new Phase II stations in Virginia - 3 in Fairfax County and 3 in Loudoun County
Outcome
Metro will complete signage and graphics installation at six new stations, and are expected to begin revenue service in FY2021. Customers will have a direct Metrorail connection to Dulles International Airport as well as key economic and population centers in Fairfax and Loudoun Counties, Virginia.
Cost ($M) Fiscal Year Budget Actual
LTD Expenses 49.2 FY2020 30.1 FY2021 15.9 FY2022 17.7 FY2023 0.0 FY2024 0.0 FY2025 0.0 FY2026 0.0 FY2021-2026 Total 33.6 Total Cost 113.0
Anticipated Funding Sources Funding Source(s) for FY2021 Amount ($M)
MWAA 15.9 Total Project Cost 15.9
Fiscal Year FY20 FY21 FY22 FY23 FY24 FY25 FY26 FY27 FY28 FY29 FY30
PLANNING
Needs Identification
Development and Evaluation
EXECUTION
Project Development
Implementation
✔ ✔ ✔

Appendix D – Capital Projects
239
(CRB0020_01) Silver Line Phase 2 Railcars
Initiative Type: Project Mode: Rail Invest. Category: Railcar Investments Invest. Program: Railcar Acquisition
Description
This project supports procurement of 64 railcars for phase 2 construction of the Silver Line.
Strategic Objectives Supported
Safety Cust. Sat. Reliability Ridership Op. Impact
Location
Systemwide
Outcome
In FY2021, Metro will continue reliability testing for 64 railcars associated with software and engineering modifications to improve overall reliability.
Cost ($M) Fiscal Year Budget Actual
LTD Expenses 133.6 FY2020 12.5 FY2021 2.9 FY2022 0.0 FY2023 0.0 FY2024 0.0 FY2025 0.0 FY2026 0.0 FY2021-2026 Total 2.9 Total Cost 149.0
Anticipated Funding Sources Funding Source(s) for FY2021 Amount ($M)
MWAA 2.9 Total Project Cost 2.9
Fiscal Year FY20 FY21 FY22 FY23 FY24 FY25 FY26 FY27 FY28 FY29 FY30
PLANNING
Needs Identification
Development and Evaluation
EXECUTION
Project Development
Implementation
✔ ✔ ✔

240
Appendix D – Capital Projects
(CRB0127) Purple Line
Initiative Type: Project Mode: Rail Invest. Category: Station and Passenger Facilities
Investments Invest. Program: Platforms & Structures
Description
The Purple Line is a planned 16-mile light rail transit line extending from Bethesda to New Carrollton. The Maryland Transit Administration (MTA), is managing the development of the line, which will connect to four Metrorail station locations - Bethesda, Silver Spring, College Park, and New Carrollton. This project includes design and engineering support to plan for and manage the impacts of the Purple Line on Metro facilities.
Strategic Objectives Supported
Safety Cust. Sat. Reliability Ridership Op. Impact
Location
Bethesda, Silver Spring, College Park, and New Carrollton.
Outcome
In FY2021, Metro will continue design on the Bethesda South Mezzanine, which is to start in late FY2020, with construction to begin in early FY2022. Metro will also continue engineering support efforts at the three other Metrorail Stations connecting to the Purple Line. This project supports future multi-modal connections that will increase transit access in the region.
Cost ($M) Fiscal Year Budget Actual
LTD Expenses 4.4 FY2020 4.2 FY2021 0.1 FY2022 0.2 FY2023 0.0 FY2024 0.0 FY2025 0.0 FY2026 0.0 FY2021-2026 Total 0.3 Total Cost 8.9
Anticipated Funding Sources Funding Source(s) for FY2021 Amount ($M)
Other Local 0.1 Total Project Cost 0.1
Fiscal Year FY20 FY21 FY22 FY23 FY24 FY25 FY26 FY27 FY28 FY29 FY30
PLANNING
Needs Identification
Development and Evaluation
EXECUTION
Project Development
Implementation
✔ ✔ ✔ ✔

Appendix D – Capital Projects
241
(CRB0133) Union Station Entrance Improvements
Initiative Type: Project Mode: Rail Invest. Category: Station and Passenger Facilities
Investments Invest. Program: Platforms & Structures
Description
Provide congestion relief to the First St NE entrance at Union Station. The project will increase customer safety and improve customer circulation by providing additional space in the mezzanine, adding stairs and faregates, and relocating fare card vendors.
Strategic Objectives Supported
Safety Cust. Sat. Reliability Ridership Op. Impact
Location
Union Station
Outcome
In FY2021, Metro will begin to implement the designed improvements of the Union Station Metrorail station First Street NE entrance, the expansion will include additional stairs in the north mezzanine, additional fare gates and the relocation of existing fare vending machines. This project will enhance customer satisfaction by improving station access.
Cost ($M) Fiscal Year Budget Actual
LTD Expenses 0.0 FY2020 0.6 FY2021 1.7 FY2022 1.2 FY2023 3.0 FY2024 0.0 FY2025 0.0 FY2026 0.0 FY2021-2026 Total 5.9 Total Cost 6.5
Anticipated Funding Sources Funding Source(s) for FY2021 Amount ($M)
Other Local 1.7 Total Project Cost 1.7
Fiscal Year FY20 FY21 FY22 FY23 FY24 FY25 FY26 FY27 FY28 FY29 FY30
PLANNING
Needs Identification
Development and Evaluation
EXECUTION
Project Development ✔ ✔
Implementation
✔ ✔ ✔

242
Appendix D – Capital Projects
THIS PAGE INTENTIONALLY LEFT BLANK

Appendix E – Sustainability, Energy and Resiliency
243
Appendix E - Sustainability, Energy and Resiliency A sustainable transit system is designed, constructed, and operated in a way that fosters environmental stewardship, economic prosperity, and social wellbeing across the region. Sustainability is at the core of both the service Metro provides and how Metro provides it.
Sustainability is a fundamental business approach that makes Metro operations more resilient and fiscally responsible while also seeking to reduce environmental impacts.
Metro is a keystone of a prosperous region and we are excited to work with partners to create a more sustainable future.
Sustainable Transportation People choose Metro not only because it is affordable, fast, easy and pleasant, but also because it is a sustainable way to travel. Metro is the easiest choice each of us can make to support regional sustainability – choosing to ride the bus and train instead of driving reduces CO2 emissions and supports compact development and healthy livable communities.
Transit agencies are largely funded by transit users and local jurisdictions. Sustainability is one of the fundamental functions of Metro and a value that sets it apart from other transportation options.
Metro is a major contributor to the region’s efforts to meet its climate action goals. By providing nearly one million passenger trips each weekday, Metro not only keeps cars off the road but avoids emissions of approximately 1,110 metric tons of CO2 each day—equal to about 40 million gallons of gasoline annually.
Investing in the Region Metro enhances the region’s prosperity by investing in people, businesses, and neighborhoods.
Metro helps the region’s residents lead happy, healthy, and productive lives. Metro provides approximately one million trips by bus and rail each day, connecting residents to employment, entertainment, school, recreation, and health and human services. Metro supports active lifestyles, cleaner air, compact mixed-use development, and environmental stewardship.
Metro is a powerful economic engine that drives the region's economy and helps create activity centers while ensuring residents and visitors can access all that the region has to offer. Metro is one of the largest green employers in the region and spurs business development by contracting with local businesses across all sectors.
Metro pursues sustainable business practices not just because it is the right thing to do but because these practices generate long-term cost savings that give the region the best return on its investment. These investments increase safety and improve the customer experience while supporting regional sustainability, mobility, and livability goals.
In 2014, Metro established a target to reduce energy consumption by 15 percent per vehicle mile by 2025. By FY2019, Metro was already 5.5 percent more efficient per vehicle mile compared to 2014. Metro’s Energy Action Plan further increases Metro’s investment in energy efficiency and commitment as a responsible steward of the region’s dedicated funding.
Sustainability Targets Metro's Sustainability Initiative, launched in 2014, set three regional and seven internal targets to achieve by 2025. The initiative was started to provide measurable and manageable progress toward aggressive but achievable targets.
In 2014, Metro created the Sustainability Lab and Sustainability Awards to promote and recognize cost effective innovation and best practice adoption across the Authority.
In 2020, Metro began the process of updating its sustainability targets to expand beyond traditional environmental targets and include targets related to prosperity, livability, and accessibility.
Innovation Since its inception, the Sustainability Lab has sponsored several business case analyses, test and evaluation periods, and project refinements. These investments have resulted in agency-wide adoption of new practices

244
Appendix E – Sustainability, Energy and Resiliency
and technology that were identified by staff open to innovation and supportive of change.
Metro promotes cost effective innovation and best practice adoption through:
• Researching and bringing in best practices to match areas of opportunity (capital and operational);
• Recognizing, supporting and rewarding existing efforts and staff innovation;
• Communicating the importance of and progress made toward sustainability targets;
• Integrating and highlighting the importance of data driven lifecycle cost analysis and sustainability best practices;
• Developing staff capacity to maximize benefits, and
• Utilizing innovative financing, rebates, and leveraging external partnerships.
Energy Management Every day, Metro reduces the carbon footprint of the National Capital Region by providing public transit to approximately one million riders. To provide this public good, Metro consumes a significant amount of energy.
Energy costs, approximately $109 million in FY2019, are one of Metro’s largest non-personnel operating expenses. Managing these costs is paramount to controlling overall operating expenses, reducing exposure to budget risk, and continuing to provide efficient public transit for the region. Without actively managing its energy use and investing in energy saving technologies, Metro's energy costs are projected to grow to $136 million annually by 2025.
In 2017, Metro conducted an Authority-wide energy audit to forecast energy use and costs and identify opportunities for investments and best practices to support a significant reduction in energy use by 2025.
At current usage rages, energy costs are expected to increase by 34 percent between 2017 and 2025. This increase is primarily due to a projected increase in energy consumption (e.g. the extension of the Silver Line Phase 2 to Dulles International Airport and Loudoun County) and increasing utility costs and commodity prices.
In FY2019, Metro released its first Energy Action Plan. The Plan transforms the way Metro does business to ensure a greener, safer, more reliable ride. The Plan is helping Metro reach environmental goals through reduced energy consumption and is generating long-term cost savings to ensure responsible stewardship of the region’s dedicated funding.
This Plan has three main pillars: 1. Implementation of energy audit identified
capital investments;
2. Modernize design, construction, and operations; and
3. Engage dynamically in the energy market.
The Energy Action Plan includes a one-time $65 million capital investment in energy efficiency projects between now and 2025 that will realize approximately $29 million in ongoing annual energy and operations/maintenance cost savings. Targeted investments made between now and 2025 are projected to realize an additional $16 million in annual energy cost savings by 2025. This represents a return on investment in less than five years, on average, from energy savings alone.
When fully implemented by 2025, the Energy Action Plan is expected to reduce energy use by 750,000 MMBTUs annually and avoid emissions of approximately 160,000 metric tons of CO2 annually – the equivalent of taking an additional 35,000 cars of the road each year.
In addition to the steps outlined in the Plan, Metro commits to educating and engaging employees to promote innovation and continuous improvement.
Resiliency Public transit is critical infrastructure that enables mobility and livability across the region. Severe weather is already impacting the region’s public transit and puts vulnerable populations, businesses, and city services at risk. A more resilient Metro system helps the region meet sustainability goals and protect against flooding, heat waves, and other impacts of severe weather.
Metro has historically addressed resiliency on a project level (including raising and securing vent shafts, sealing tunnels, and upgrading drainage pumping stations).
In FY2021, Metro will initiate the incorporation of resiliency into strategic planning efforts. Metro looks forward to working closely with jurisdictions to mitigate risks to and enhance resiliency of Metro’s assets over the coming years.

Appendix E – Sustainability, Energy and Resiliency
245
FY2020 Major Accomplishments
• Produced first annual update to the Energy Action Plan. As of FY2019, Metro is 21 percent of the way towards achieving the 2025 energy savings target.
• Successfully engaged in the energy market to support renewable energy and reduce operating costs:
Crafted innovative design, build, and maintain contract to secure third party that will provide estimated 12 MW of solar power at the Anacostia parking garage and Cheverly, Naylor, and Southern surface parking lots. Project is estimated to capture enough energy to power over 1,500 single family homes each year.
Partnered with GSA to award a cost competitive three-year natural gas contract, which will save $750 million annually.
• Successfully implemented and trained staff on a new Enterprise Energy Management System (EEMS) that promotes operational energy management by allowing data analytics, accountability and internal transparency.
• Released Zero-Emission Bus Update to lay out the opportunities for the region. Reviewed Metro actions to date and identified market, infrastructure and policy prerequisites for success.
• Initiated procurement for renewable natural gas (RNG) for compressed natural gas (CNG) busses which could shift 30 percent of Metro’s bus fleet to low carbon fuel.
• Incorporated “electric bus ready” features into the design of two bus garages and two end-of-line bus turnarounds.
• Funded contracts to rebuild Bladensburg and Northern bus garages to LEED standards, bringing the total number of bus garages designed to LEED standards to five.
• Planted 365 trees through a in funding and maintenance partnership with the Anacostia Watershed Society and American University at four Metrorail stations in Maryland and the District of Columbia.
• To date, Metro has made substantial progress across our asset portfolio to reduce maintenance requirements while improving lighting quality and safety for employees and customers:
Passenger Stations—upgraded to LED lighting in 48 underground stations, within two years of launching the program. LED lighting reduces energy use by approx. 60 percent—each
station saves enough electricity to power 40 homes each year.
Parking lots/bus loops—partnered with DC Sustainable Energy Utility, to initiate upgrade of lighting to LED in FY21 at select bus loops and surface parking lots in Washington, D.C.
Tunnels— achieved substantial progress in upgrading tunnel lighting across the rail system to improve safety and visibility while reducing energy use and maintenance requirements.
Facilities—launched Phase 2 of facility LED lighting upgrades. Estimated energy savings exceeded the original goal by 33 percent, yielded $400,000 claimed in utility rebates, and avoided over $600,000 in annual energy costs.
FY2021 Major Activities
• Continue implementation of Metro’s first Energy Action Plan.
• Integrate wayside braking energy recovery technology into traction power project in order to capture brake heat as a renewable energy source
• Integrate sustainability into capital program to improve fiscal responsibility and environmental quality of the capital contracting and planning process
• Launch agency-wide strategic resiliency planning efforts
• Expand Sustainability reporting and targets to communicate Metro’s value to the region
• Initiate fleet plan revision to incorporate emerging zero-emission bus technologies
• Issue request-for-proposals for test and evaluation of up to 14 electric buses and chargers at up to three locations.
• Engage on policy and rate structures in coordination with utilities
• Continue energy market engagement including opportunities for renewable energy

246
Appendix E – Sustainability, Energy and Resiliency
THIS PAGE INTENTIONALLY LEFT BLANK

Appendix F – Financial Standards
247
Appendix F - Financial StandardsMetro’s Financial Standards can be grouped into three major areas: general, business planning, and debt policy. The purpose of the general standards is to ensure that Metro prudently manages its daily financial operations and establishes appropriate cash reserves.
The business directives from the General Manager provide management with a set of parameters for developing the upcoming year’s budget and other longer-term financial plans, as well as establishing future business targets for management to achieve.
The purpose of debt policy standards is to limit the level of debt that may be incurred and to ensure that debt assumptions are based on financial parameters that are similar or more conservative than those that would be placed on Metro by the financial marketplace. Actual debt covenants may differ from these standards, and in accordance with the debt policy, the actual covenants will be disclosed in any Board report supporting a debt issuance.
Also, this Appendix provides an explanation for how state and local funding support is allocated among the jurisdictions.
Financial Standards – General
GAAP
• Complete and accurate accounting records are maintained in accordance with accounting principles generally accepted in the United States of America (US GAAP) as applicable to governmental entities. The standard setting body establishing governmental accounting and financial reporting standards is the Government Accounting Standards Board.
Revenue and Expenditure Recognition
• Revenues are recognized in the period that they are earned, and expenses are recognized in the period in which they are incurred. Metro distinguishes between operating and non-operating revenues and expenses in its financial statements.
• The principal source of operating revenues (not including state or local operating subsidy contributions) is passenger fares and parking fees, which makes up approximately 90 percent of such revenues.
Fiscal Year
• The fiscal year-end for financial reporting purposes is June 30th of each year. The Board approves the budget for each fiscal year by June 30th of the previous year.
Comprehensive Annual Financial Report (CAFR)
• An independent certified public accounting firm performs an examination of Metro’s consolidated financial statements. The goal is for Metro to receive an unmodified (“clean”) opinion on its financial statements and to receive the Government Finance Officers Association (GFOA) award for excellence in financial reporting for its CAFR.
Other Financial Policies and Guidelines
• Funds are invested within the guidelines of the Board’s approved investment policies and in compliance with the investment guidelines in Metro’s Compact.
• In accordance with Board Resolution No. 81-36, designated Metro officials are empowered to open, close, or authorize changes to accounts and are authorized to appoint individuals as official signatories for financial accounts.
• An annual actuarial analysis is performed on all Metro-administered pension plans. Based on the results of such analysis, Metro makes contributions as required in agreement with the terms of each plan.
• Appropriate insurance coverage is maintained to mitigate the risk of material loss. For self-insured retentions, Metro records the liabilities, including losses incurred but not reported, at 100 percent of the net present value.
• The budget includes the operating and capital resources necessary to implement the policy directions set by the Board. The budget is prepared in a fashion to clearly describe the projects and programs for the period.
• WMATA engages in regional long-range transportation planning for the Washington metropolitan area in conjunction with the National Capital Region Transportation Planning Board (TPB) and other jurisdictional partners.
• Staff provide transit system inputs to TPB for the Constrained Long-Range Plan (CLRP) and identify changes affecting the major financial assumptions of the plan and progress toward the implementation of new projects and programs.

248
Appendix F – Financial Standards
• WMATA also engages in short-range transit planning for the Washington metropolitan area. Staff provide inputs to the region's six-year Transportation Improvement Program (TIP) and identify the capital investment needs to support the existing regional transit system and regional service expansion.
• The Office of Inspector General (OIG) develops an annual work plan each year. The Board’s Executive Committee provides input on the work plan, which covers audits, evaluations and investigations. Furthermore, finalized complete audit and evaluation reports are submitted to the Board via the Executive Committee.
• Recommendations for improvements are based on audits and evaluations performed by the OIG. Audits are performed in accordance with Government Auditing Standards, while evaluations are performed in accordance to the Council of the Inspectors General on Integrity and Efficiency’s Quality Standards for Inspection and Evaluation. These recommendations, management action plans, and progress toward implementation are periodically reported directly to the Board. Semi- annual reports to the Board and significant stakeholders provide an overview of work performed by the OIG as related to the annual work plan.
Financial Standards – Business Planning • Passenger revenue forecasts are derived from
historical ridership and revenue trends as well as forecasts of regional growth in population and employment. Since ridership may be affected by actual or proposed fare policy change, the impacts on ridership and average fare forecasts are based on conservative estimates.
• The Board reviews and updates the fare policy on a regular cycle. Management may propose fare modifications to achieve transit ridership improvements and to maintain financial sustainability.
• Service plan assumptions are based on demonstrated needs as defined through short- range planning.
• Capital programs are funded according to the terms of the laws, regulations and/or discretionary procedures approved by the Board. The capital program covers Metro’s assets, including major transportation projects, and is included in each annual budget.
• From time to time, Metro applies for and receives discretionary federal and state funding. Discretionary funding is requested for major system expansion projects or extraordinary transit capital needs. Discretionary funding levels are estimated by project, based on federal and state criteria, and the likelihood of obtaining approvals.
Financial Standards – Debt Policy • Metro may not enter into a debt or financing
arrangement unless the transaction is in full compliance with all applicable provisions of WMATA’s Compact.
• Pursuant to WMATA’s Compact (Article IX paragraph 27), Metro may borrow money in pursuit of its mission. All such bonds and evidences of indebtedness are authorized by resolution of the Board and are payable solely out of the revenues of Metro. The bonds and other debt obligations of Metro, except as may be otherwise provided in the indenture under which they are issued, are direct and general obligations of Metro and the full faith and credit of Metro are pledged for the prompt payment of the debt service.
• There is no dollar borrowing limit set in WMATA’s Compact.
• Long-term debt may be included in the budget or long-range plans; however, no such debt is incurred without the specific approval of the Board.
• The average life of debt instruments is matched to the average economic lives of the assets financed.
• Reserve funds that may be required by the financial markets for each debt issuance are maintained. Cash and securities, insurance or surety bonds may fund these reserves. For financial planning purposes, reserve requirements are included in the face value of debt issued.
• Further guidelines beyond the Compact are included in the Board adopted debt management policy that provides additional guidance for the use of debt for financing the Authority’s infrastructure and capital projects (Resolution No. 2020-04). The principles outlined in the policy are to (a) identify transactions that utilize debt in the most efficient manner, (b) make timely debt service payments, and (c) achieve the lowest possible cost of capital and maintain high credit ratings and access to the capital markets.

Appendix F – Financial Standards
249
Allocation of State and Local Support State and local funds to support Metro’s annual operating and capital budgets are based on Board-approved subsidy calculations described below.
The operating budget subsidy is allocated to the jurisdictional funding partners using six subsidy allocation formulas:
1. Regional bus subsidy allocation
2. Non-regional bus subsidy allocation
3. Rail maximum fare subsidy allocation
4. Rail base subsidy allocation
5. Paratransit subsidy allocation
6. Debt service allocation
Formulas 1 and 2: Regional and Non-Regional Bus Subsidy Allocations The Metrobus subsidy is allocated using two distribution formulas. All bus routes are classified as being either regional or non-regional, based on route characteristics.
Regional bus routes generally provide transportation between jurisdictions. Regional bus routes may also include bus routes serving major activity centers that operate on major arterial streets and carry high volumes of riders in one or multiple jurisdictions. The following criteria, based on Board approved resolutions, are used in the classification of bus routes:
• Inter-jurisdictional routes are defined as regional. Defining characteristics of inter-jurisdictional routes:
Cross a jurisdictional (independent city, county, state) boundary
Penetrate at least two jurisdictions by more than one-half mile in each, and
Operate “open door” (allows boarding and alighting) over at least a portion of the line in two or more jurisdictions
• If a route does not qualify as regional under the inter-jurisdictional definition, then it must meet at least two of the following three criteria to be regional:
Arterial Streets: Operates for a considerable distance on an arterial street and a substantial portion (usually a majority) of riders use stops
on the arterial street. Routes that operate for a short distance on an arterial incidental to their service area are not included.
Regional Activity Center: Serves one or more regional activity centers. A conservative definition of regional activity centers is used, including only those where there is virtually universal agreement as to their regional character. Routes connecting to Metrorail stations, but that do not directly serve any regional activity center, are not considered to be regional.
Cost Effectiveness: 30 or more boarding’s per platform hour.
Routes not meeting the criteria described above are classified as non-regional. Regional and non-regional bus subsidies are allocated to the jurisdictions using the following formulas.
• Regional Bus Subsidy Allocation: The distribution of regional bus subsidy to the jurisdictions is based on a weighted, four-factor formula in the following proportions:
1. Density weighted population 25%
2. Revenue hours 25%
3. Revenue miles 35%
4. Average weekday ridership 15%
Density weighted population for each jurisdiction is determined by taking the average of:
the jurisdiction’s share of the urbanized population in the compact area
the jurisdiction’s share of “density weighted” population (i.e. population times density)
The revenue hours factor is determined by taking the annual regional revenue hours assigned to each jurisdiction divided by the total regional revenue hours.
The revenue miles factor is determined by dividing total annual regional revenue miles assigned to each jurisdiction by the total regional revenue miles.
Ridership used is the average weekday ridership on regional buses by residents of each jurisdiction based on the Metrobus Passenger Survey.
• Non-Regional Bus Subsidy Allocation: The distribution of non-regional bus subsidy to the jurisdictions is computed as follows:
1. Identify the cost of all Metrobus service, regional and non-regional.

250
Appendix F – Financial Standards
2. Identify the costs which would accrue for regional Metrobus service if no non-regional bus service were provided.
3. Determine the costs of non-regional service by subtracting the regional Metrobus costs, as calculated in step two, from the costs of all Metrobus service.
4. Divide the costs of non-regional service as computed in step three by total platform hours for non-regional service.
5. Identify the non-regional platform hours for each jurisdiction.
6. Multiply the platform hours for each jurisdiction by the hourly rate.
7. Determine the revenue of the non-regional service for each jurisdiction.
8. Subtract the revenue as determined in step seven from the costs of step six.
Formulas 3 and 4: Rail Maximum Fare and Base Subsidy Allocations The rail subsidy consists of two components: the maximum fare component and the base rail component. The total maximum fare subsidy is deducted from the total rail subsidy, and the result is allocated based on the base subsidy formula.
• Maximum Fare Subsidy Allocation: The maximum fare portion of the rail subsidy is designed to recognize the “taper” and “cap” features of the Metrorail fare structure. The taper feature is reflected in the diminishing cost per mile for trips greater than six miles, and the cap is reflected in the maximum fare on rail. The subsidy for the maximum fare is calculated as the difference between the regular fare that would have been paid if the taper and cap features were not available, and the actual fare paid with the taper and cap.
Once the maximum fare subsidy is calculated, the benefiting jurisdictions are allocated one-half the calculated amount, based on the percent of riders from the individual jurisdiction who benefit from the taper and cap. These percentages are calculated from the data taken from the Metrorail Passenger Survey. The remaining half of the maximum fare subsidy is incorporated into the rail base subsidy.
• Rail Base Subsidy Allocation. The base subsidy allocation for Metrorail service is based on three elements in equal proportions:
1. Density weighted population 33.3%
2. Number of rail stations 33.3%
3. Average weekly ridership 33.3%
Density weighted population is the same for the regional bus subsidy allocation as it is for the rail base subsidy allocation.
The rail stations factor is calculated by taking the number of stations, or portions of stations, assigned to each jurisdiction, divided by the total number of stations in the system.
Ridership is calculated by taking the average weekday ridership in each jurisdiction as determined by the rail passenger survey. Only persons who reside in the compact area are included in the distribution.
Formula 5: Paratransit Subsidy Allocation Paratransit subsidy is allocated to the jurisdictions using a two-factor formula with sub-allocations used for the Virginia jurisdictions.
1. Direct Costs - The contract carriers’ actual per trip, reservation and eligibility charges will be allocated directly to the jurisdictions.
2. Overhead Costs - All other (non-direct) costs of the paratransit program will be allocated in proportion to the direct costs.
Virginia sub-allocations of direct costs require that per trip charges be adjusted to reflect the average time of trips provided for each jurisdiction. Overhead costs assigned to Virginia jurisdictions will be sub-allocated based on the direct cost allocation as calculated above.
Formula 6: Debt Service Allocation Planned Gross Revenue debt service charges are allocated to the jurisdictions based on the long-term debt strategy plan and in the same proportion as each jurisdiction’s share of local match and system performance funding in the capital budget. The allocation of local match and system performance funding is determined in accordance with the Capital Funding Agreement (CFA). For new debt issuance shown in the CIP, allocated debt service is shown for all jurisdictions; however, jurisdictions are given the opportunity to “opt out” of new debt by providing their total principal contribution upfront rather than participate in the new debt issuance. Gross Revenue debt service for a given debt issue is not allocated to a jurisdiction that has opted out of the given debt issue.
Dedicated Revenue Bonds debt service is paid by WMATA from the available dedicated revenue proceeds.

Appendix F – Financial Standards
251
FY2021 Operating Subsidy An alternate formula was approved by the Board of Directors in FY2020 to comply with Dedicated Funding legislation reflecting a base subsidy component and a legislatively excluded subsidy component. This alternate formula will continue to be applied in FY2021.
A mandated growth cap of three percent was applied to WMATA’s base subsidy, as well as to total individual contributions from the District of Columbia, the State of Maryland and the Commonwealth of Virginia. For the State of Maryland and the Commonwealth of Virginia, the intrastate subsidy allocations are based on a jurisdiction’s percentage share of the applicable Signatory’s amount using the Board approved subsidy formula.
The Legislatively Excluded Subsidy contains additional costs for any service, equipment, or facility required by state or federal law such as paratransit cost increases, occupational safety and health cost increases, approved capital projects, and legal disputes (including litigation). The legislatively excluded subsidy was allocated to all jurisdictions, per the applicable formula.
Costs associated with Silver Line Phase 2 are included in FY2021’s subsidy allocation. Loudoun County is included with one quarter of the calculated base subsidy calculation and the full annual amount of legislative exclusions and Silver Line Phase II costs which includes 9 months of start-up and 3 months of operating. All costs removed from Loudoun County’s base subsidy was redistributed amongst the other Virginia jurisdictions.

252
Appendix F – Financial Standards
THIS PAGE INTENTIONALLY LEFT BLANK

Appendix G – Debt Service
253
Appendix G - Debt Service Debt Policy/Borrowing Powers WMATA’s Compact allows the Authority to borrow money in pursuit of its mission. All such bonds and evidences of indebtedness are payable solely out of Metro’s properties and revenues. The bonds and other obligations, except as may be otherwise provided in the indenture under which they were issued, are direct and general obligations of the Authority. The full faith and credit of Metro is pledged for the prompt payment of the debt service.
Metro is required to make semi-annual payments of principal and interest on each series of bonds. There are certain covenants associated with these outstanding bonds with which the Authority must comply. The most significant are:
• Metro is to punctually pay principal and interest according to provisions in the bond document.
• Except for certain instances, Metro cannot sell, mortgage, lease or otherwise dispose of transit system assets without filing a certification by the General Manager/Chief Executive Officer and Treasurer with the Trustee that such action will not impede or restrict the operation of the transit system.
• Metro must maintain certain insurance or self-insurance covering the assets and operations of the transit system at all times.
Existing Gross Revenue Transit Bonds
2009A and B Bonds In June 2009, Metro issued $243.0 million of Gross Revenue Transit Bonds, Series 2009-A, and $55.0 million of Build America Bonds, Series 2009-B. Bond proceeds net of premiums/discounts totaled $309.9 million. These bonds were retired in July 1, 2019 and replaced with the Series 2017A refunding bonds.
2017A Bonds In July 2017 WMATA issued bonds (2017A-1) as an advance refunding of the series 2009A bonds, and advance crossover refunding bonds (2017A-2) for the 2009B series bonds. The 2009A and the 2009B series bonds were refunded and retired on July 1, 2019.
2017B Bonds On August 17, 2017 Metro issued new money Gross Revenue Transit Bonds, series 2017-B bonds in the principal amount of $496.5 million. Net bond proceeds
with premiums totaled $588.9 million. The bonds provide for semi-annual payments of interest and annual payments of principal, with final maturity in July 2042. $21.7 million was placed in a capitalized interest fund to service interest on the debt through July 2018. The annual jurisdictional debt service payment on the bonds is $35.8 million. One jurisdiction fully opted out of the bond issuance and two jurisdictions partially opted out of the bond issuance. In all, the three jurisdictions provided $78.7 million in funding to bring the total capital project fund related to the bond issuance to $575.2 million.
2018 Bonds On December 18, 2018 Metro issued new money Gross Revenue Transit Bonds, series 2018 bonds in the principal amount of $239.9 million. Net bond proceeds with premiums total $269.1 million. The bonds provide for semi-annual payments of interest and annual payments of principal, with final maturity in July 2043. $6.4 million was placed in a capitalized interest fund to service interest on the debt through July 2019. The annual jurisdictional debt service payment on the bonds is approximately $17.3 million. Five jurisdictions opted fully out of the bond issuance.
New Dedicated Revenue Bonds
2020A Bonds On June 11, 2020 Metro issued new money Dedicated Revenue Bonds. This sale, in the principal amount of $545.0 million, is the inaugural issue under the dedicated revenue credit. Net bond proceeds with premium totaled $635.3 million. The bonds provide for semi-annual payments of interest and annual payments of principal, with final maturity in July 2045. $55.4 million was placed in a capitalized interest fund to service interest on the debt through July 2022. Principal payments are deferred until July 2023. The annual debt service payment on the bonds is $39.1 million. Debt service is paid from dedicated capital revenue proceeds.
Lines of Credit Metro has access to $350 million in short-term lines of credit. The lines of credit support Metro’s capital program and are available to manage cash flow needs. The lines of credit renewed in May 2020 and have a one-year maturity.

254
Appendix G – Debt Service
Gross Revenue Transit Bonds
FY2021 Jurisdiction Funding
Principal Interest Total Due
Debt Service Payments Funded by FY2021 Jurisdictional Contributions
Series 2017A-1 - Due Bondholders 1/1/21 - $ 3,483,750 $ 3,483,750 Series 2017A-1 - Due Bondholders 7/1/21 $ 9,615,000 3,483,750 13,098,750 Series 2017A-2 - Due Bondholders 1/1/21 - 1,221,375 1,221,375 Series 2017A-2 - Due Bondholders 7/1/21 - 1,221,375 1,221,375 Series 2017B - Due Bondholders 1/1/21 - 11,849,875 11,849,875 Series 2017B - Due Bondholders 7/1/21 12,125,000 11,849,875 23,974,875 Series 2018 - Due Bondholders 1/1/21 - 5,865,500 5,865,500 Series 2018 - Due Bondholders 7/1/21 5,575,000 5,865,500 11,440,500
Grand Total $ 27,315,000 $ 44,841,000 $ 72,156,000

Appendix G – Debt Service
255
Gross Revenue Transit Bonds - Detail
Date Interest Principal Total Funding
Required Total Fiscal Year
Funding Required 1/1/2021 22,420,500 - 22,420,500 7/1/2021 22,420,500 27,315,000 49,735,500 72,156,000 1/1/2022 21,737,625 - 21,737,625 7/1/2022 21,737,625 28,695,000 50,432,625 72,170,250 1/1/2023 21,020,250 - 21,020,250 7/1/2023 21,020,250 30,155,000 51,175,250 72,195,500 1/1/2024 20,266,375 - 20,266,375 7/1/2024 20,266,375 31,680,000 51,946,375 72,212,750 1/1/2025 19,474,375 - 19,474,375 7/1/2025 19,474,375 33,290,000 52,764,375 72,238,750 1/1/2026 18,642,125 - 18,642,125 7/1/2026 18,642,125 34,980,000 53,622,125 72,264,250 1/1/2027 17,767,625 - 17,767,625 7/1/2027 17,767,625 36,760,000 54,527,625 72,295,250 1/1/2028 16,848,625 - 16,848,625 7/1/2028 16,848,625 38,620,000 55,468,625 72,317,250 1/1/2029 15,883,125 - 15,883,125 7/1/2029 15,883,125 40,585,000 56,468,125 72,351,250 1/1/2030 14,868,500 - 14,868,500 7/1/2030 14,868,500 42,650,000 57,518,500 72,387,000 1/1/2031 13,802,250 - 13,802,250 7/1/2031 13,802,250 44,820,000 58,622,250 72,424,500 1/1/2032 12,681,750 - 12,681,750 7/1/2032 12,681,750 47,120,000 59,801,750 72,483,500 1/1/2033 11,503,750 - 11,503,750 7/1/2033 11,503,750 49,500,000 61,003,750 72,507,500 1/1/2034 10,266,250 - 10,266,250 7/1/2034 10,266,250 51,980,000 62,246,250 72,512,500 1/1/2035 8,966,750 - 8,966,750 7/1/2035 8,966,750 35,645,000 44,611,750 53,578,500 1/1/2036 8,075,625 - 8,075,625 7/1/2036 8,075,625 37,470,000 45,545,625 53,621,250 1/1/2037 7,138,875 - 7,138,875 7/1/2037 7,138,875 39,395,000 46,533,875 53,672,750 1/1/2038 6,154,000 - 6,154,000 7/1/2038 6,154,000 41,410,000 47,564,000 53,718,000 1/1/2039 5,118,750 - 5,118,750 7/1/2039 5,118,750 43,535,000 48,653,750 53,772,500 1/1/2040 4,030,375 - 4,030,375 7/1/2040 4,030,375 45,770,000 49,800,375 53,830,750 1/1/2041 2,886,125 - 2,886,125 7/1/2041 2,886,125 48,115,000 51,001,125 53,887,250 1/1/2042 1,683,250 - 1,683,250 7/1/2042 1,683,250 50,585,000 52,268,250 53,951,500 1/1/2043 418,625 - 418,625 7/1/2043 418,625 16,745,000 17,163,625 17,582,250 Total $ 563,311,000 $ 896,820,000 $ 1,460,131,000 $ 1,460,131,000

256
Appendix G – Debt Service
Dedicated Revenue Bonds - Detail
Date Principal Interest Total Principal &
Interest Total Fiscal Year
Principal & Interest
Less Capitalized
Interest Net Debt
Service 1/15/2021 - $15,721,153 $15,721,153 $15,721,153 $15,721,153 - 7/15/2021 - 13,223,400 13,223,400 - 13,223,400 - 1/15/2022 - 13,223,400 13,223,400 26,446,800 13,223,400 - 7/15/2022 - 13,223,400 13,223,400 - 13,223,400 - 1/15/2023 - 13,223,400 13,223,400 26,446,800 13,223,400 7/15/2023 13,025,000 13,223,400 26,248,400 - 26,248,400 1/15/2024 - 12,897,775 12,897,775 39,146,175 12,897,775 7/15/2024 13,690,000 12,572,150 26,587,775 - 26,587,775 1/15/2025 - 12,555,525 12,555,525 39,143,300 12,555,525 7/15/2025 14,390,000 12,555,525 26,945,525 - 26,945,525 1/15/2026 - 12,195,775 12,195,775 39,141,300 12,195,775 7/15/2026 15,130,000 12,195,775 27,325,775 - 27,325,775 1/15/2027 - 11,817,525 11,817,525 39,143,300 11,817,525 7/15/2027 15,905,000 11,817,525 27,722,525 - 27,722,525 1/15/2028 - 11,419,900 11,419,900 39,142,425 11,419,900 7/15/2028 16,720,000 11,419,900 28,139,900 - 28,139,900 1/15/2029 - 11,001,900 11,001,900 39,141,800 11,001,900 7/15/2029 17,580,000 11,001,900 28,581,900 - 28,581,900 1/15/2030 - 10,562,400 10,562,400 39,144,300 10,562,400 7/15/2030 18,480,000 10,562,400 29,042,400 - 29,042,400 1/15/2031 - 10,100,400 10,100,400 39,142,800 10,100,400 7/15/2031 19,430,000 10,100,400 29,530,400 - 29,530,400 1/15/2032 - 9,614,650 9,614,650 39,145,050 9,614,650 7/15/2032 20,425,000 9,614,650 30,039,650 - 30,039,650 1/15/2033 - 9,104,025 9,104,025 39,143,675 9,104,025 7/15/2033 21,470,000 9,104,025 30,574,025 - 30,574,025 1/15/2034 - 8,567,275 8,567,275 39,141,300 8,567,275 7/15/2034 22,575,000 8,567,275 31,142,275 - 31,142,275 1/15/2035 - 8,002,900 8,002,900 39,145,175 8,002,900 7/15/2035 23,730,000 8,002,900 31,732,900 - 31,732,900 1/15/2036 - 7,409,650 7,409,650 39,142,550 7,409,650 7/15/2036 24,950,000 7,409,650 32,359,650 - 32,359,650 1/15/2037 - 6,785,900 6,785,900 39,145,550 6,785,900 7/15/2037 26,230,000 6,785,900 33,015,900 - 33,015,900 1/15/2038 - 6,130,150 6,130,150 39,146,050 6,130,150 7/15/2038 27,575,000 6,130,150 33,705,150 - 33,705,150 1/15/2039 - 5,440,775 5,440,775 39,145,925 5,440,775 7/15/2039 28,985,000 5,440,775 34,425,775 - 34,425,775 1/15/2040 - 4,716,150 4,716,150 39,141,925 4,716,150 7/15/2040 30,320,000 4,716,150 35,036,150 - 35,036,150 1/15/2041 - 4,109,750 4,109,750 39,145,900 4,109,750 7/15/2041 31,670,000 4,109,750 35,779,750 - 35,779,750 1/15/2042 - 3,363,400 3,363,400 39,143,150 3,363,400 7/15/2042 33,200,000 3,363,400 36,563,400 - 36,563,400 1/15/2043 - 2,581,000 2,581,000 39,144,400 2,581,000 7/15/2043 34,800,000 2,581,000 37,381,000 - 37,381,000 1/15/2044 - 1,760,875 1,760,875 39,141,875 1,760,875 7/15/2044 36,480,000 1,760,875 38,240,875 - 38,240,875 1/15/2045 - 901,175 901,175 39,142,050 901,175 7/15/2045 38,240,000 901,175 39,141,175 - 39,141,175 1/15/2046 - - - 39,141,175 - Total $ 545,000,000 $ 423,590,278 $ 968,915,903 $ 968,915,903 $ 55,391,353 $ 913,524,550

Appendix G – D
ebt Service
257
Debt Service by Jurisdiction by Fiscal Year
Date District of Columbia
Montgomery County
Prince George's County
Arlington County City of Fairfax Fairfax County
City of Falls Church
Total Jurisdictional Debt Service
City of Alexandria
FY2021 $33,267,125 $15,406,871 $15,806,488 $1,774,830 — $111,451 $5,613,058 $176,178 $72,156,000 FY2022 33,273,091 15,409,645 15,809,086 1,775,511 — 111,494 5,615,212 176,211 72,170,250 FY2023 33,284,167 15,414,850 15,814,275 1,776,390 — 111,549 5,617,993 176,276 72,195,500 FY2024 33,291,548 15,418,272 15,817,542 1,777,133 — 111,595 5,620,343 176,316 72,212,750 FY2025 33,302,581 15,423,569 15,822,797 1,778,161 — 111,660 5,623,594 176,387 72,238,750 FY2026 33,313,773 15,428,725 15,827,808 1,779,128 — 111,721 5,626,650 176,446 72,264,250 FY2027 33,327,676 15,435,058 15,834,002 1,780,193 — 111,788 5,630,018 176,515 72,295,250 FY2028 33,337,396 15,439,511 15,838,326 1,781,010 — 111,839 5,632,604 176,565 72,317,250 FY2029 33,352,212 15,446,491 15,845,262 1,782,236 — 111,916 5,636,481 176,652 72,351,250 FY2030 33,368,409 15,454,022 15,852,903 1,783,252 — 111,980 5,639,693 176,740 72,387,000 FY2031 33,385,308 15,461,774 15,860,591 1,784,453 — 112,055 5,643,493 176,827 72,424,500 FY2032 33,412,702 15,474,561 15,873,921 1,785,717 — 112,134 5,647,488 176,976 72,483,500 FY2033 33,422,117 15,479,009 15,877,877 1,787,166 — 112,225 5,652,071 177,035 72,507,500 FY2034 33,421,855 15,478,973 15,876,833 1,788,664 — 112,320 5,656,811 177,045 72,512,500 FY2035 23,880,065 11,046,816 10,960,058 1,790,076 — 112,408 5,661,276 127,801 53,578,500 FY2036 23,899,085 11,055,628 10,968,802 1,791,513 — 112,498 5,665,820 127,903 53,621,250 FY2037 23,921,693 11,066,221 10,979,331 1,793,321 — 112,612 5,671,539 128,032 53,672,750 FY2038 23,941,864 11,075,551 10,988,588 1,794,832 — 112,707 5,676,318 128,140 53,718,000 FY2039 23,966,205 11,086,791 10,999,737 1,796,641 — 112,820 5,682,036 128,269 53,772,500 FY2040 23,992,271 11,098,809 11,011,655 1,798,560 — 112,941 5,688,108 128,406 53,830,750 FY2041 24,016,643 11,110,399 11,023,199 1,800,654 — 113,072 5,694,728 128,556 53,887,250 FY2042 24,045,588 11,123,668 11,036,347 1,802,722 — 113,202 5,701,269 128,703 53,951,500 FY2043 10,153,130 3,794,875 3,634,245 1,774,830 — 111,451 5,613,058 176,178 17,582,250 Total $668,576,504 $308,630,088 $313,359,672 $39,302,164 $0 $2,467,987 $124,296,604 $3,497,981 $1,460,131,000

258
Appendix G – Debt Service
THIS PAGE INTENTIONALLY LEFT BLANK

Appendix H – Operating Statistics
259
Appendix H - Operating Statistics Metrobus Revenue Vehicle Fleet Management Plan The Metrobus Revenue Vehicle Fleet Management Plan is a statement of the processes and practices by which Metro establishes its current and projected Metrobus revenue vehicle fleet and facilities requirements. It includes a description of revenue service planned to accommodate Metrobus ridership demand, service adjustments, as well as an assessment and projection of needs for Metrobus maintenance programs and facilities.
Regional and non-regional Metrobus routes exclude service adjustments related to Covid-19, and major Metrorail construction projects and assume FY2021 Board approved service level changes effective July 1, 2020.
Metrobus Statistics
FY2018 Budget
FY2019 Budget
FY2020 Budget
FY2021 Approved
Statistics: Bus Miles (000s)1 48,661 48,326 48,885 46,966 Revenue Bus Miles (000s)1 37,675 36,958 37,009 36,818 Passengers (000s) 119,681 124,854 128,343 66,284 Bus Fleet Size (Year End) 1,583 1,583 1,583 1,583 Passenger Revenue ($000s) $138,075 $124,011 $137,936 $27,683 Operating Revenue ($000s) $156,405 $136,077 $153,150 $38,592 Operating Expenses ($000s) $658,181 $668,748 $669,511 $673,317 Gross Subsidy (000s)² $501,776 $532,671 $516,361 $634,724 Ratios: Cost Per Bus Mile $13.53 $13.84 $13.70 $14.34 Passengers Per Bus 75.60 78.87 81.08 41.87 Passengers Per Scheduled Bus Miles $2.53 $2.65 $2.77 $1.41 Cost Per Passenger $5.50 $5.36 $5.22 $10.16 Subsidy Per Passenger $4.19 $4.27 $4.02 $9.58 Average Passenger Fare³ $1.15 $0.99 $1.07 $0.42 Percentage of Cost Recovered from Passenger Revenues 21.0% 18.5% 20.6% 4.1% Percentage of Cost Recovered from Operating Revenues 23.8% 20.4% 22.9% 5.7% 1. Bus miles and revenue bus miles are scheduled and not actual. 2. FY2021 Gross Subsidy includes $150.2 million in CARES Act funds. 3. Average fare is lower than base fare due to the impact of the transfer discount, senior and student discounts, and passes.

260
Appendix H – Operating Statistics
Active Fleet
Manufactured (End of Year) Maximum Scheduled Fleet Total Active Fleet
Fiscal 2017 1,281 1,583 Fiscal 2018 1,284 1,583 Fiscal 2019 1,289 1,583 Fiscal 2020 1,278 1,583 Fiscal 2021 1,278 1,583
Age of Fleet
Manufacturer Fiscal Year
Entered Service Number of
Buses Average Age
Hybrid Electric 2006 50 14 Clean Diesel 2006 116 14 New Flyer - Compressed Natural Gas (CNG) 2007 12 13 North American Bus Industries (NABI) 2008 22 12 New Flyer - Hybrid 2008 102 12 New Flyer - Hybrid 2009 98 11 New Flyer - Hybrid 2010 147 10 New Flyer - Xcelsior 2011 100 9 New Flyer - Xcelsior 2012 67 8 Orion VII - Hybrid 2012 25 8 Orion VII - Clean Diesel 2012 27 8 New Flyer - Xcelsior 2013 105 7 NAIB - Bus Rapid Transit (BRT) 2014 105 6 New Flyer Xcelsior Hybrid 2015 21 5 New Flyer Xcelsior Hybrid 2015 56 5 New Flyer Xcelsior CNG 2015 164 5 New Flyer Xcelsior Hybrid 2016 54 4 New Flyer Xcelsior CNG 2018 100 2 New Flyer Xcelsior Hybrid 2018 12 2 New Flyer Xcelsior CNG 2019 75 1 New Flyer Xcelsior Diesel 2019 25 1 New Flyer Xcelsior CNG 2020 75 - New Flyer Xcelsior Diesel 2020 25 - Total 1,583 7.3

Appendix H – Operating Statistics
261
Bus Fleet Size by Garage
Garage
FY2021 Maximum
Scheduled Fleet1 Total Fleet Space Ratio
Bladensburg 216 269 24.5% Shepherd Parkway 172 223 29.7% Western 101 118 16.8% Southern Avenue 72 84 16.7% Four Mile Run 184 218 18.5% Landover 146 202 38.4% Montgomery 190 241 26.8% West Ox 57 66 15.8% Cinder Bed 69 80 15.9% Andrews Federal Center 71 82 15.5% Total 1,278 1,583 23.9%
1. Maximum scheduled fleet includes 400 strategic buses, which are placed in multiple locations to provide relief in case of unforeseen events.
Comparison of Bus Miles
FY2018 Actual
FY2019 Actual
FY2020 Budget
FY2021 Approved
Total Scheduled 47,360,806 47,026,674 46,393,535 46,966,443
Bus Bridges 592,801 592,801 570,887 583,843 Special Service 98,800 98,800 95,148 97,307 Change-Offs 265,604 265,604 255,786 258,945 Yard Work 446,003 446,003 423,457 428,686 Missed Trips (103,413) (103,413) (99,590) (100,820)
Total Unscheduled 1,299,795 1,299,795 1,245,687 1,267,961 Total 48,660,601 48,326,469 47,639,222 48,234,404
Included Estimated Miles of Articulated Bus 1,628,570 1,628,570 1,628,570 1,628,570

262
Appendix H – Operating Statistics
Bus Operator Payhours
FY2021 Bus Operator Wages
Category Payhours Average Hourly Rate Budget ($000s)
Scheduled1 5,132,284 $28.74 $147,502
Non-Scheduled2 OT/Special Event 250,222 28.74 7,191,384 Standing Extra 47,867 28.74 1,375,704 Utility 63,331 28.74 1,820,122 Training 271,077 16.96 4,597,738 Miscellaneous 182,327 28.74 5,240,078 Guarantees 23,571 28.74 677,425 Funeral Leave 6,090 28.74 175,025 Jury Duty 438 28.74 12,575 Vacation 366,909 28.74 10,544,966 Sick 300,361 28.74 8,632,381 Holiday 236,985 28.74 6,810,950
Subtotal, Non-Scheduled 1,749,177 $47,078
Total 6,881,461 $194,580
1. Scheduled includes straight time plus overtime.
2. Non-Scheduled includes overtime and special events.

Appendix H – Operating Statistics
263
Regional and Non-Regional Metrobus Routes Metrobus routes are designated as either regional or non-regional. The cost of providing Metrobus service on regional routes is allocated between all of the Metro’s jurisdictions. Direct costs associated with non-regional routes are allocated to the jurisdiction receiving the benefit of the non-regional route.
The Metro Board of Directors approves the designation of regional or non-regional Metrobus routes. The factors used in making the determination of regional and non-regional routes are:
• Alignment of inter-jurisdictional routes
• Routes operating on arterial streets
• Routes that serve specific regional activity centers and
• Route cost effectiveness
Metrobus operating costs can be expressed in terms of cost per platform hour. Platform hours include both revenue and non-revenue (sometimes called “deadhead”) service, which measures the total time between a bus leaving its storage and maintenance facility and its return at the end of the day. For the FY2021 budget, the average cost per platform hour for all routes is $158.27. For the allocation of the FY2021 operating subsidy, the budgeted cost per platform hour for non-regional routes (which has certain overhead and administrative expenses removed) is $119.32.
Regional and non-regional Metrobus routes assume FY2021 deferred service adjustments to take effect on or about January 1, 2021, in accordance to approved Board Resolution 2020-09 approved on April 2, 2020 and amended on May 28th, 2020.
Metro Regional and Non-Regional Bus Route Summary - Planned Platform Hours
FY2014 Total
Service
FY2015 Total
Service
FY2016 Total
Service
FY2017 Total
Service
FY2018 Total
Service
FY2019 Total
Service
FY2020 Total
Service
FY2021 Total
Service
Regional Routes 3,360,324 3,465,643 3,508,023 3,486,645 3,508,905 3,474,302 3,540,089 3,456,647
District of Columbia 1,691,338 1,755,539 1,783,989 1,756,066 1,768,469 1,759,288 1,810,279 1,797,960 Maryland 868,570 886,898 893,716 892,750 912,623 908,861 918,490 882,331 Virginia 800,416 823,206 830,318 837,830 827,814 806,153 811,490 776,356 Non-Regional Routes 872,367 890,847 888,413 887,383 869,590 858,720 882,346 873,995
District of Columbia 380,811 381,898 368,793 368,025 346,502 381,414 409,953 407,331 Maryland 379,565 379,118 387,432 387,121 388,031 357,137 356,771 346,592 Virginia 111,991 129,831 132,187 132,237 135,056 120,168 115,623 120,072 Total 4,232,691 4,356,490 4,396,435 4,374,028 4,378,495 4,333,021 4,422,435 4,330,642
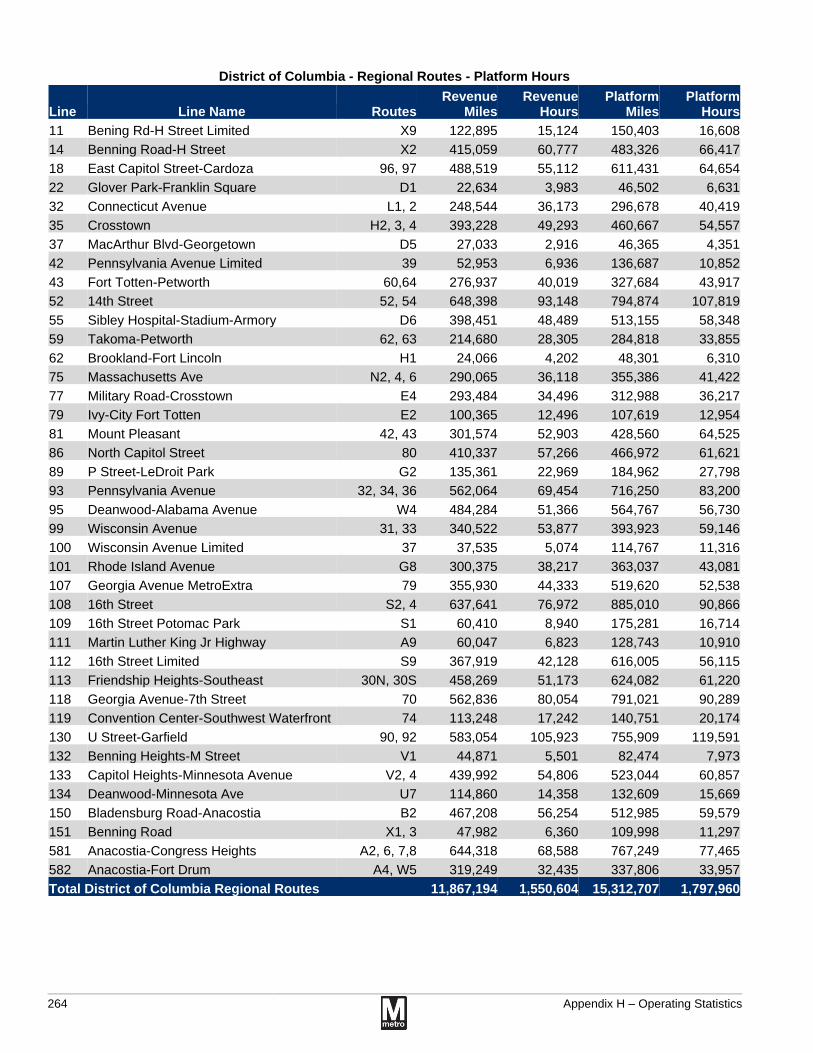
264
Appendix H – Operating Statistics
District of Columbia - Regional Routes - Platform Hours
Line Line Name Routes Revenue
Miles Revenue
Hours Platform
Miles Platform
Hours
11 Bening Rd-H Street Limited X9 122,895 15,124 150,403 16,608 14 Benning Road-H Street X2 415,059 60,777 483,326 66,417 18 East Capitol Street-Cardoza 96, 97 488,519 55,112 611,431 64,654 22 Glover Park-Franklin Square D1 22,634 3,983 46,502 6,631 32 Connecticut Avenue L1, 2 248,544 36,173 296,678 40,419 35 Crosstown H2, 3, 4 393,228 49,293 460,667 54,557 37 MacArthur Blvd-Georgetown D5 27,033 2,916 46,365 4,351 42 Pennsylvania Avenue Limited 39 52,953 6,936 136,687 10,852 43 Fort Totten-Petworth 60,64 276,937 40,019 327,684 43,917 52 14th Street 52, 54 648,398 93,148 794,874 107,819 55 Sibley Hospital-Stadium-Armory D6 398,451 48,489 513,155 58,348 59 Takoma-Petworth 62, 63 214,680 28,305 284,818 33,855 62 Brookland-Fort Lincoln H1 24,066 4,202 48,301 6,310 75 Massachusetts Ave N2, 4, 6 290,065 36,118 355,386 41,422 77 Military Road-Crosstown E4 293,484 34,496 312,988 36,217 79 Ivy-City Fort Totten E2 100,365 12,496 107,619 12,954 81 Mount Pleasant 42, 43 301,574 52,903 428,560 64,525 86 North Capitol Street 80 410,337 57,266 466,972 61,621 89 P Street-LeDroit Park G2 135,361 22,969 184,962 27,798 93 Pennsylvania Avenue 32, 34, 36 562,064 69,454 716,250 83,200 95 Deanwood-Alabama Avenue W4 484,284 51,366 564,767 56,730 99 Wisconsin Avenue 31, 33 340,522 53,877 393,923 59,146 100 Wisconsin Avenue Limited 37 37,535 5,074 114,767 11,316 101 Rhode Island Avenue G8 300,375 38,217 363,037 43,081 107 Georgia Avenue MetroExtra 79 355,930 44,333 519,620 52,538 108 16th Street S2, 4 637,641 76,972 885,010 90,866 109 16th Street Potomac Park S1 60,410 8,940 175,281 16,714 111 Martin Luther King Jr Highway A9 60,047 6,823 128,743 10,910 112 16th Street Limited S9 367,919 42,128 616,005 56,115 113 Friendship Heights-Southeast 30N, 30S 458,269 51,173 624,082 61,220 118 Georgia Avenue-7th Street 70 562,836 80,054 791,021 90,289 119 Convention Center-Southwest Waterfront 74 113,248 17,242 140,751 20,174 130 U Street-Garfield 90, 92 583,054 105,923 755,909 119,591 132 Benning Heights-M Street V1 44,871 5,501 82,474 7,973 133 Capitol Heights-Minnesota Avenue V2, 4 439,992 54,806 523,044 60,857 134 Deanwood-Minnesota Ave U7 114,860 14,358 132,609 15,669 150 Bladensburg Road-Anacostia B2 467,208 56,254 512,985 59,579 151 Benning Road X1, 3 47,982 6,360 109,998 11,297 581 Anacostia-Congress Heights A2, 6, 7,8 644,318 68,588 767,249 77,465 582 Anacostia-Fort Drum A4, W5 319,249 32,435 337,806 33,957 Total District of Columbia Regional Routes 11,867,194 1,550,604 15,312,707 1,797,960

Appendix H – Operating Statistics
265
DC Non-Regional Routes - Platform Hours
Line Line Name Routes Revenue
Miles Revenue
Hours Platform
Miles Platform
Hours
15 Garfield-Anacostia Loop W6, 8 225,734 25,906 261,394 28,544 25 Maryland Ave X8 59,467 8,177 66,498 8,826 34 Brookland-Fort Lincoln H6 196,520 19,181 205,509 19,973 44 Benning Heights-Alabama Ave V7, 8 164,049 23,061 198,995 26,059 45 Hospital Center D8 271,860 37,125 339,705 43,644 46 Fairfax Village M6 129,688 13,052 175,092 16,714 49 Fort Lincoln Shuttle B8, 9 56,176 5,246 60,207 5,694 51 Glover Park-Dupont Circle D2 141,693 16,561 166,873 18,389 56 Ivy City-Franklin Square D4 118,509 17,441 142,176 19,249 71 Chevy Chase E6 56,498 5,790 56,962 5,928 78 Sheriff Road-River Terrace U4 110,662 10,570 125,616 12,090 82 Shipley Terrace-Fort Drum W1 103,238 10,752 119,856 12,203 84 Nebraska Ave M4 103,827 9,867 109,330 10,322 91 Park Road-Brookland H8, 9 227,433 29,868 255,071 32,446 135 Marshall Heights U5, 6 221,881 25,333 248,527 27,722 158 United Medical Center-Anacostia W2 3 334,552 34,718 371,299 37,613 159 14th Street Limited 59 73,500 9,833 113,977 13,146 174 Rhode Island Avenue Limited G9 63,009 8,793 80,471 10,320 504 Minnesota Ave-Anacostia A31, 32, 33 1,638 167 5,233 440
517 16th Street-Tenleytown D31, 32, 33,
34 10,625 1,043 33,193 3,003 539 Fort Dupont Shuttle S35 1,571 158 4,967 379 540 Rhode Island Ave-Carver Terrace S41 1,237 124 2,713 287 544 Anacostia-Eckington P6 310,606 43,841 399,857 48,703 549 Congress Heights-Gerorgetown D51 2,115 158 2,752 215 550 Mt. Pleasant-Tenleytown W45, 47 2,377 215 7,675 601 583 Takoma-Fort Totten K2 29,184 3,715 44,163 4,821 Total District of Columbia Non-Regional Routes 3,017,649 360,695 3,598,109 407,331

266
Appendix H – Operating Statistics
Maryland Regional Routes - Platform Hours
Line Line Name Routes Revenue
Miles Revenue
Hours Platform
Miles Platform
Hours
9 Annapolis Road T18 286,234 25,557 317,243 28,714 13 Greenbelt-Twinbrook C2,4 917,410 83,525 1,146,602 95,727 16 Bethesda-Silver Spring J1,2 550,319 50,968 710,154 59,381 17 National Harbor-Alexandria NH2 259,908 18,148 317,341 20,881 28 Chillum Road F1,2 216,195 17,671 285,178 20,550 29 Clinton C11,13 43,566 2,774 48,134 3,401 41 Eastover-Addison Road P12 466,359 41,061 584,065 46,325 47 Forestville K12 199,415 16,354 226,746 19,258 53 Georgia Ave-Maryland Y2,7,8 675,976 49,096 837,349 68,447 63 Hillcrest Heights C12,14 96,688 9,106 110,696 10,522 73 Marlow Heights-Temple Hills H11,12,13 144,650 13,499 172,011 15,556 74 College Park 83,83X,86 524,727 44,547 693,544 52,756 83 New Hampshire Ave-Maryland Limited K9 58,005 5,918 113,801 8,848 85 New Hampshire Ave-Maryland K6 380,753 38,889 518,985 45,058 88 Oxen Hill-Fort Washington P18,19 222,466 15,601 318,489 20,861 90 Martin Luther King Jr Highway A12 420,178 31,353 477,645 34,795 97 New Carrollton-Silver Spring F4 452,067 44,026 531,119 50,199 98 New Carrollton-Fort Totten F6 202,071 16,010 236,364 19,008 103 College Park-White Flint C8 367,167 26,609 391,293 28,268 123 Viers Mill Road Q1,2,4,5,6 661,006 59,933 774,807 66,145 147 Fairland Z8 292,860 24,860 378,792 28,560 542 Rhode Island Ave-New Carrollton T14 187,487 15,886 210,876 17,655 580 Bock Road W14 106,225 8,309 159,052 11,175 584 Oxon Hill-Suitland D12,13,14 612,990 46,470 674,612 52,903 629 College Park-Bethesda Limited J4 94,251 9,149 162,615 12,153 790 District Heights-Suitland V12 192,768 16,172 245,286 19,039 800 Riggs Road R1,2 275,031 22,720 343,671 26,149 Total Maryland Regional Routes 8,906,774 754,210 10,986,471 882,331

Appendix H – Operating Statistics
267
Maryland Non-Regional Routes - Platform Hours
Line Line Name Routes Revenue
Miles Revenue
Hours Platform
Miles Platform
Hours
7 National Harbor-Southern Ave NH1 206,722 15,101 252,507 18,178 10 Ardwick Industrial Park Shuttle F12 83,798 6,214 94,870 6,800 19 Bowie-Belair B24 157,386 9,842 177,635 11,308 20 Bowie State University B21, 22 174,287 6,817 200,088 7,789 26 Pointer Ridge C28 122,641 5,235 148,021 6,268 30 Colesville-Ashton Z2 144,837 9,040 180,755 10,655 33 Connecticut Ave-Maryland L8 225,278 18,076 257,808 19,958 36 Kenilworth Avenue R12 195,958 14,835 245,630 16,988 38 District Heights-Seat Pleasant V14 214,947 15,216 285,592 18,776 65 Bowie-New Carrollton B27 58,429 3,196 62,529 3,588 72 Marlboro Pike J12 141,608 10,756 160,529 11,741 96 Langley Park-Cheverly F8 184,989 15,098 256,156 18,091 102 River Road T2 258,632 16,237 268,750 16,915 104 Laurel-Burtonsville Express Z7 78,861 5,059 166,652 7,809 105 Sheriff Road-Capitol Heights F14 238,628 18,831 264,405 20,153 146 Calverton-Westfarm Z6 275,377 22,840 372,787 27,216 149 Cheverly-Washington Business Park F13 117,361 8,688 128,378 9,298
152 Central Avenue C21, 22, 26,
29 377,816 23,570 460,810 27,283 525 Laurel 89, 89M 144,292 9,140 192,583 10,794 526 Laurel Express 87 135,229 7,220 188,043 8,995 527 Greenbelt-New Carrollton G12, 14 426,961 33,254 483,382 36,885
531 Greencastle-Briggs Chaney Express Z11 61,292 4,630 115,276 6,886 634 Crofton-New Carrollton B29 64,346 2,560 80,054 3,104
647 Greenbelt-BWI Thurgood Marshall Airport Express B30 192,765 7,649 216,585 8,483
802 Queens Chapel Road R4 108,584 11,309 127,671 12,630 Total Maryland Non-Regional Routes 4,391,027 300,414 5,387,496 346,592

268
Appendix H – Operating Statistics
Virginia Regional Routes - Platform Hours
Line Line Name Routes Revenue
Miles Revenue
Hours Platform
Miles Platform
Hours
2 Alexandria-Pentagon 10A,E,N 231,084 30,510 490,126 34,474 3 Landmark-Ballston 25B 239,399 25,540 291,598 28,378 4 Alexandria-Fairfax 29K,N 385,179 29,988 385,179 32,374 5 Leesburg Pike 28A 598,563 55,869 700,946 63,925 8 Annandale 29C,G 144,920 8,756 233,259 13,406 12 Ballston-Farragut Square 38B 224,343 34,422 419,521 43,565 27 Chain Bridge Road 15K 41,714 3,179 79,740 4,271 54 McLean-Crystal City 23A,B,T 510,261 48,566 599,470 53,170 58 Braeburn Drive-Pentagon Express 29W 84,838 3,238 84,838 4,505 69 Annandale Road 3A 111,939 10,270 166,120 12,382 70 Lincolnia-North Fairlington 7A,F,Y 340,477 28,971 499,859 37,120 76 Lincolnia-Pentagon 7W 40,416 3,445 71,975 4,859 94 Pershing Dr-Arlington Blvd 4A,B 203,174 23,041 260,921 26,726 106 Foxchase-Seminay Valley 8S,W,Z 139,083 9,250 165,470 10,840 110 Skyline City 28F,G 72,943 5,138 86,745 5,895 121 Pimmit Hills 3T 118,234 8,710 162,802 10,498 126 Washington-Dunn Loring 2A 279,369 25,260 420,220 35,118 128 Fair Oaks-Jermantown Road 2B 189,495 15,484 223,774 16,735 129 DC-Dulles 5A 429,161 15,440 452,828 17,386 131 Richmond Highway Express REX (R99) 500,424 36,477 500,424 39,807 137 Wilson Blvd-Vienna Line 1A,B 461,070 41,998 613,381 48,368 138 Lee Highway-Farragut Square 3Y 17,281 1,641 34,456 3,481 139 Fair Oaks-Fairfax Blvd 1C 257,127 20,609 302,559 22,357 142 Columbia Pike 16A,C,E 513,331 52,940 629,867 60,359 143 Columbia Pike-Pentagon City 16G,H 308,190 36,140 377,239 40,180 156 Hunting Point-Ballston 10B 294,418 31,561 342,782 34,599 157 Mt. Vernon Express 11Y 59,318 3,688 73,348 6,908 176 Park Center-Pentagon 7C,P 42,302 3,022 48,929 3,485 512 Barcroft-South Fairlington 22A,C,F 295,227 25,606 355,082 28,866 521 Annandale-Skyline City Pentagon 16L 44,013 2,941 97,318 5,325 522 Columbia Pike-Farragut Square 16Y 80,104 9,078 164,516 14,499 692 Annandale-East Falls Church 26A 131,035 10,249 187,178 12,496 Total Virginia Regional Routes 7,388,430 661,025 9,522,468 776,356

Appendix H – Operating Statistics
269
Virginia Non-Regional Routes - Platform Hours
Line Line Name Routes Revenue
Miles Revenue
Hours Platform
Miles Platform
Hours
61 Kings Park Express 17G,H,K,L 307,192 13,608 396,122 24,978 66 Kings Park 17B,M 65,209 3,298 94,711 6,232 68 Landmark-Bren Mar Pk-Pentagon 21A,D 93,338 5,875 153,533 8,813 80 Mark Center-Pentagon 7M 156,300 7,756 178,983 9,567 87 Orange Hunt 18G,H,J 142,517 6,666 218,194 10,812 121 Pimmit Hills 3T 16,932 1,469 27,339 1,772 138 Lee Highway-Farragut Square 3Y 13,803 2,055 43,140 4,358 148 Metroway - Potomac Yard MW1 284,054 31,535 298,830 32,834 541 Burke Centre 18P 134,620 5,918 233,071 11,241 640 Springfield Circulator TAGS (S80,91) 32,890 8,480 56,419 9,466 Total Virginia Non-Regional Routes 1,246,855 86,659 1,700,340 120,072

270
Appendix H – Operating Statistics
Metrorail Revenue Vehicle Fleet Management Plan The Metrorail Revenue Vehicle Fleet Management Plan is a statement of the processes and practices by which Metro establishes its current and projected Metrorail revenue vehicle fleet size requirements and operating spare ratio. It documents how service goals are applied to existing and forecast levels of ridership to establish fleet requirements for Metrorail service, as well as how these requirements are affected by vehicle maintenance needs, expansions of the Metrorail system, and other factors affecting the operation of the system. Additionally, it documents the key challenges Metro faces in meeting its service and maintenance goals.
FY2021 Metrorail service statistics exclude adjustments related to Covid-19 and major Metrorail construction projects and assume Board approved service level changes effective July 1, 2020. The FY2021 budget numbers reflect Covid-19 budget adjustments as well as Silver Line Phase 2 costs.
Metrorail Operating Statistics
FY2018 Budget
FY2019 Budget
FY2020 Budget
FY2021 Approved
Statistics1 (000s): Railcar Miles 88,380 90,015 101,355 102,924 Revenue Service Miles 86,780 88,415 99,755 101,324 Passengers 175,817 175,255 170,157 83,102 Passenger Revenue $541,318 $533,518 $528,279 $249,085 Operating Revenue $620,678 $639,777 $651,288 $342,683 Operating Expense $994,661 $1,034,450 $1,092,507 $1,178,461 Gross Subsidy² $373,983 $394,673 $441,220 $835,779
Ratios: Passengers Per Revenue Service Mile 2.03 1.98 1.71 0.82 Cost Per Total Railcar Mile $11.25 $11.49 $10.78 $11.45 Cost Per Passenger $5.66 $5.90 $6.42 $14.18 Gross Subsidy Per Passenger $2.13 $2.25 $2.59 $10.06 Average Passenger Fare $3.08 $3.04 $3.10 $3.00 Percentage of Operating Cost Recovered from Passenger Revenues 54.4% 51.6% 48.4% 21.1% Percentage of Operating Cost Recovered from all Operating Revenues 62.4% 61.8% 59.6% 29.1%
1. Railcar miles and revenue service miles are scheduled and not actual. 2. FY2021 Gross Subsidy includes $371 million in CARES Act funds.

Appendix H – Operating Statistics
271
Railcar Miles
Metrorail Line
FY2018 Total Service
FY2019 Total Service
FY2020 Total Service
FY2021 Total Service
Red Line 24,343,000 24,509,200 28,955,200 28,819,794 Blue Line 15,158,000 15,153,900 14,626,400 14,834,625 Orange Line 13,192,900 13,265,300 13,674,900 13,828,635 Yellow Line 5,712,400 6,033,600 11,396,700 12,468,398 Green Line 11,429,300 12,176,600 13,098,400 13,043,699 Silver Line 14,387,600 14,719,400 15,307,300 15,632,980 Scheduled Revenue Service Miles 84,223,200 85,858,000 97,058,900 98,628,131
Capital One Arena 1,711,283 1,711,283 1,711,283 1,711,283 Gap Trains 360,000 360,000 450,000 450,000 National Baseball 486,000 486,000 534,600 534,600 Sub-Total Revenue Service Miles 86,780,483 88,415,283 99,754,783 101,324,014
Start-Up/Car Testing 200,000 200,000 200,000 200,000 Revenue Collection 700,000 700,000 700,000 700,000 Other 700,000 700,000 700,000 700,000 Total1,2 88,380,483 90,015,283 101,354,783 102,924,014
1. Service Plan for FY2018, 2019 and 2020 is based on the following hours of service: Monday - Thursday from 5:00 a.m. - 11:30 p.m.; Friday from 5:00 a.m. - 1:00 a.m.; Saturday from 7:00 a.m. - 1:00 a.m.; and Sunday from 8:00 a.m. - 11:00 p.m.
2. Service Plan for FY2021 is based on the following hours of service: Monday - Thursday from 5:00 a.m. - 12:00 a.m., Friday from 5.00 a.m. - 2:00 a.m.; Saturday from 7:00 a.m. - 2:00 a.m.; and Sunday from 8:00 a.m. - 11:00 p.m.
Pay Hours for Rail Operators
Category Payhours Average Hourly Budget
Scheduled Full Time 1,175,244 $33.58 $39,464,694 Car Testing / Start Up 24,960 $33.58 $838,157 Interlocking Pay Hours 71,478 $39.19 $2,801,223 Subtotal 1,271,682 $43,104,073 Non-Scheduled Overtime / Special Event 200,525 $50.37 $10,100,447 Standing Extra 10,481 $33.58 $351,953 Utility 25,561 $33.58 $858,327 Training / Retraining 17,339 $33.58 $582,238 Miscellaneous 25,876 $33.58 $868,928 Funeral / Other 1,101 $33.58 $36,963 Vacation 41,749 $33.58 $1,401,916 Sick 33,834 $33.58 $1,136,141 Holiday 24,541 $33.58 $824,092 Subtotal 381,006 $16,161,005
Total 1,652,688 $59,265,078

272
Appendix H – Operating Statistics
Pay Hours for Station Managers
Payhour Average Hourly Rate Budget
Scheduled Full Time 1,001,410 $35.19 $35,239,618 Subtotal 1,001,410 $35,239,618
Non-Scheduled Overtime / Special Event 109,658 $52.79 $5,788,838 Standing Extra 8,414 $35.19 $296,093 Utility 25,493 $35.19 $897,100 Training / Retraining 14,938 $35.19 $525,675 Miscellaneous 13,190 $35.19 $464,161 Funeral / Other 911 $35.19 $32,074 Vacation 35,547 $35.19 $1,250,905 Sick 28,137 $35.19 $990,150 Holiday 20,525 $35.19 $722,258 Subtotal 256,814 $10,967,255
Total 1,258,224 $46,206,873
Grand Total - Rail Operators and Station Managers $105,471,951
Rail Peak Period Service Levels
Metrorail Line
FY2018 Total Service
FY2019 Total Service
FY2020 Total Service
FY2021 Total Service
Red Line Glenmont /
Shady Grove Glenmont /
Shady Grove Glenmont /
Shady Grove Glenmont /
Shady Grove
Silver Spring /
Grosvenor Silver Spring /
Grosvenor
Blue Line Franconia-Springfield /
Largo Town Center Franconia-Springfield /
Largo Town Center Franconia-Springfield /
Largo Town Center Franconia-Springfield /
Largo Town Center Orange Line New Carrollton / Vienna New Carrollton / Vienna New Carrollton / Vienna New Carrollton / Vienna
Yellow Line Huntington /
Mt Vernon Sq Huntington /
Mt Vernon Sq Huntington /
Greenbelt Huntington /
Greenbelt Green Line Branch Ave / Greenbelt Branch Ave / Greenbelt Branch Ave / Greenbelt Branch Ave / Greenbelt
Silver Line Wiehle-Reston East /
Largo Town Center Wiehle-Reston East /
Largo Town Center Wiehle-Reston East /
Largo Town Center Wiehle-Reston East /
Largo Town Center Rush Hour Trains1
Red Line 34 34 38 38 Blue Line 19 19 19 19 Orange Line 20 20 20 18 Yellow Line 9 9 15 15 Green Line 17 17 17 15 Silver Line 20 20 20 20 Gap 6 6 6 6 Total 125 125 135 131
1. FY2021 peak Metrorail service includes removal of two Orange Line AM/PM rush tripper trains and two Green Line AM/PM rush tripper trains.

Appendix H – Operating Statistics
273
Rail Scheduled Headways
FY2018 Total Service
FY2019 Total Service
FY2020 Total Service
FY2021 Total Service
Rush Hour Headways1
Red Line Glenmont / Shady Grove 8 8 4 4
Silver Spring to Grosvenor Strathmore 8 8 - -
Orange Line2 Vienna / New Carrollton 8 8 8 8
Blue Line Largo Town Center / Franconia Springfield 8 8 8 8
Green Line2 Greenbelt / Branch Ave 8 8 8 8 Yellow Line Huntington / Greenbelt - - 8 8
Huntington to Mt Vernon Sq 8 8 - -
Greenbelt to Franconia-Springfield - - - -
Silver Line Wiehle-Reston East / Largo Town Center 8 8 8 8
Non-Rush Hour Headways3 Weekday-Mid-day / Saturday / Sunday / Late Night
Red Line Glenmont / Shady Grove 12 / 12 / 15 / 15 12 / 12 / 15 / 15 6 / 6 / 7.5 / 15 6 / 6 / 6 / 15
Silver Spring to Shady Grove 12 / 12 / 15 / 15 12 / 12 / 15 / 15 - -
Orange Line Vienna / New Carrollton 12 / 12 / 15 / 20 12 / 12 / 15 / 20 12 / 12 / 15 / 20 12 / 12 / 12 / 20
Blue Line Largo Town Center / Franconia Springfield 12 / 12 / 15 / 20 12 / 12 / 15 / 20 12 / 12 / 15 / 20 12 / 12 / 12 / 20
Green Line Greenbelt / Branch Ave 12 / 12 / 15 / 20 12 / 12 / 15 / 20 12 / 12 / 15 / 20 12 / 12 / 12 / 20
Yellow Line Huntington to Fort Totten 12 / 12 / 15 / 20 12 / 12 / 15 / 20 - -
Silver Line Wiehle-Reston East to Largo Town Center 12 / 12 / 15 / 20 12 / 12 / 15 / 20 12 / 12 / 15 / 20 12 / 12 / 12 / 20
Average Combined Headways for Key Segments for FY2021
Rush Hour Headways
Weekday Mid-day Saturday Sunday
Red Line Silver Spring to Grosvenor Strathmore 4 6 6 6
Orange / Blue / Silver Lines
Rosslyn to Stadium-Armory 2 to 4 4 4 4
Green / Yellow Lines
L'Enfant Plaza to Greenbelt 4 6 6 6
Blue / Yellow Lines
King St-Old Town to Pentagon 4 6 6 6
1. Headways are defined as the distance between Metrorail trains and are measured in minutes. 2. Additional Metrorail trains called trippers, are deployed to mitigate crowding during observed peaks in ridership. 3. Non-rush hour headways by line operate Monday through Friday during mid-day, Saturday, Sunday and late night and are listed respectively.

274
Appendix H – Operating Statistics
Rail Service Levels
FY2018 Total Service
FY2019 Total Service
FY2020 Total Service
FY2021 Total Service
Peak Scheduled Railcars Red Line 240 240 264 264 Orange Line 138 138 144 132 Blue Line 136 128 128 128 Green Line 130 136 136 120 Yellow Line 58 72 120 120 Silver Line 124 130 130 130 Gap 36 36 44 52 Total Scheduled Railcars 862 880 966 946
Spares1 174 176 196 190 Revenue Collections 4 4 4 4 Total Car Requirement 1,040 1,060 1,166 1,140
Hours of Operation Weekday 18.5 18.5 18.5 19.0 Friday 20.0 20.0 20.0 21.0 Saturday 18.0 18.0 18.0 19.0 Sunday 15.0 15.0 15.0 15.0 Days of Operation Weekday 250 250 252 251 Saturday 58 57 57 57 Sunday 57 58 57 57
1. Spares represent 20 percent of scheduled railcars.
Railcar Fleet Profile
Manufacturer Series Purchase
Years Original Number
Purchased Number Owned
Number for
Service1
Rohr Industries 1000 1974 - 1978 300 2 - Breda Construzioni Ferroviarie 2000 1983 - 1984 76 76 74 Breda Construzioni Ferroviarie 3000 1984 - 1988 290 282 282 Breda Construzioni Ferroviarie 4000 1992 -1994 100 2 - Construcciones y Auxiliar de Ferrocarriles, S.A. (CAF) 5000 2001 - 2004 192 2 - Alstom 6000 2006 - 2008 184 184 182 Kawasaki 7000 2014 - Present 748 748 748 Total 1,890 1,296 1,286
1. Eight vehicles are dedicated for revenue collection. All 1000-Series and 4000-Series vehicles have been decommissioned.

Appendix H – Operating Statistics
275
Rail Service Levels
FY2018 FY2019 FY2020 FY2021 Total Service Total Service Total Service Total Service
Cars per Train - Rush Hour1 Six-Car / Eight Car
Red Line 16 / 18 16 / 18 20 / 18 20 / 18 Orange Line 8 / 12 8 / 12 8 /12 6 / 12 Blue Line 8 / 11 12 / 7 12 / 7 12 / 7 Green Line 3 / 14 - / 17 - / 17 - / 15 Yellow Line 7 / 2 - / 9 - / 15 - / 15 Silver Line 18 / 2 15 / 5 15 / 5 15 / 5 Gap 6 / - 6 / - 6 / 2 6 / 2 Cars per Train - Weekday Base / Night2
Red Line 6.75 / 6 6.75 / 6 7 / 6.50 7 / 6.50 Orange Line 6.75 / 6 6.75 / 6 6.75 / 6.25 6.75 / 6.25 Blue Line 6.75 / 6 6.75 / 6 6.75 /6.25 6.75 / 6.25 Green Line 6.75 / 6 6.75 / 6 8 / 8 8 / 8 Yellow Line 6 / 6 6.25 / 6 8 / 8 8 / 8 Silver Line 6 / 6 6 / 6 6.25 / 6.25 6.25 / 6.25 1. This is based on December pick for each fiscal year. 2. Night is after 8:00 p.m.
Railcar Fleet Storage Capacity
Location
Existing Storage
Capacity1
Current Fleet Requirement
Net Storage Capacity
Alexandria 176 184 (8) Branch Ave 174 122 52 Brentwood 90 70 20 Glenmont 132 132 - Greenbelt 270 250 20 Largo 38 38 - New Carrollton 120 126 (6) Shady Grove 166 166 - West Falls Chruch 188 198 (10) Total2 1,354 1,286 68
1. A new railyard including an inspection shop at Dulles is part of Silver Line Phase 2. The facility will have the capacity to store 168 railcars.
2. Rail fleet storage capacity and current fleet requirements reflect reflect the fleet size at the end of FY2020 with the completion of 7000-Series deliveries. The vehicles above the current total scheduled car requirement include expansion vehicles to operate Silver Line Phase 2 and increase the share of trains operated as eight-car trainsets to 75 percent in subsequent years.
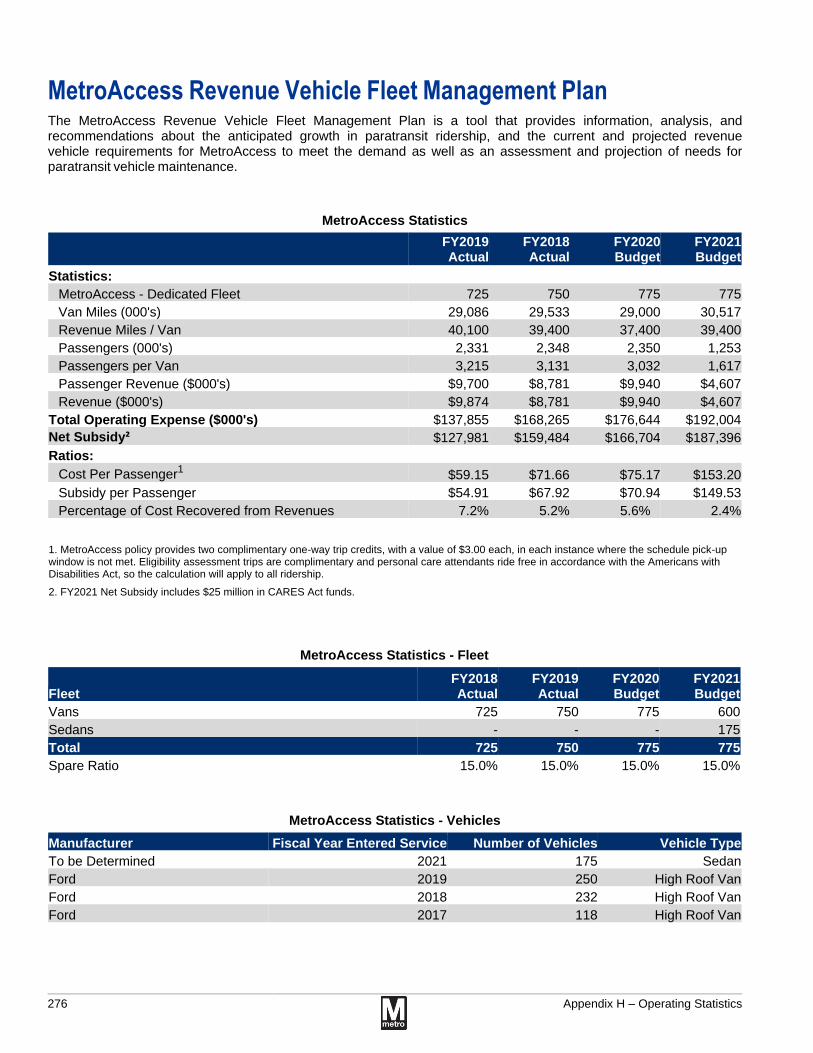
276
Appendix H – Operating Statistics
MetroAccess Revenue Vehicle Fleet Management Plan The MetroAccess Revenue Vehicle Fleet Management Plan is a tool that provides information, analysis, and recommendations about the anticipated growth in paratransit ridership, and the current and projected revenue vehicle requirements for MetroAccess to meet the demand as well as an assessment and projection of needs for paratransit vehicle maintenance.
MetroAccess Statistics
FY2019 Actual
FY2018 Actual
FY2020 Budget
FY2021 Budget
Statistics: MetroAccess - Dedicated Fleet 725 750 775 775 Van Miles (000's) 29,086 29,533 29,000 30,517 Revenue Miles / Van 40,100 39,400 37,400 39,400 Passengers (000's) 2,331 2,348 2,350 1,253 Passengers per Van 3,215 3,131 3,032 1,617 Passenger Revenue ($000's) $9,700 $8,781 $9,940 $4,607 Revenue ($000's) $9,874 $8,781 $9,940 $4,607
Total Operating Expense ($000's) $137,855 $168,265 $176,644 $192,004 Net Subsidy² $127,981 $159,484 $166,704 $187,396 Ratios:
Cost Per Passenger1 $59.15 $71.66 $75.17 $153.20 Subsidy per Passenger $54.91 $67.92 $70.94 $149.53 Percentage of Cost Recovered from Revenues 7.2% 5.2% 5.6% 2.4%
1. MetroAccess policy provides two complimentary one-way trip credits, with a value of $3.00 each, in each instance where the schedule pick-up window is not met. Eligibility assessment trips are complimentary and personal care attendants ride free in accordance with the Americans with Disabilities Act, so the calculation will apply to all ridership. 2. FY2021 Net Subsidy includes $25 million in CARES Act funds.
MetroAccess Statistics - Fleet
Fleet FY2018 Actual
FY2019 Actual
FY2020 Budget
FY2021 Budget
Vans 725 750 775 600 Sedans - - - 175 Total 725 750 775 775
Spare Ratio 15.0% 15.0% 15.0% 15.0%
MetroAccess Statistics - Vehicles
Manufacturer Fiscal Year Entered Service Number of Vehicles Vehicle Type
To be Determined 2021 175 Sedan Ford 2019 250 High Roof Van Ford 2018 232 High Roof Van Ford 2017 118 High Roof Van

RIDERSHIPRIDERSHIP^ BUDGET FORECAST 303.0 MILLION
Jul Aug Sep Oct Nov Dec Jan Feb Mar Apr May Jun FYTD
FY2018 26.2 26.4 25.2 26.5 23.8 21.7 22.6 21.7 24.9 25.9 26.4 26.6 219.0
FY2019 26.5 25.7 24.4 27.8 23.6 22.1 22.1 21.9 26.0 27.4 27.5 26.4 220.2
FY2020 27.0 25.7 26.3 28.9 24.4 24.5 25.4 24.3 11.1 217.6
^ FY2020 Ridership results reported for the full first three quarters (July 1 - March 31), however, March results are skewed due to the pandemic and subject to change.
RIDERSHIP^ BUDGET FORECAST 303.0 MILLION
FY2020 Jul Aug Sep Oct Nov Dec Jan Feb Mar Apr May Jun FYTD
Forecast 15,075,900 13,906,700 14,106,700 15,720,200 13,758,600 13,110,900 11,911,200 12,053,600 14,410,800 15,666,000 15,082,700 15,354,000 124,054,600RAIL
Actual 16,452,435 15,132,103 15,338,075 17,447,889 14,559,802 13,524,283 15,076,151 14,161,023 7,634,931 129,326,692
Forecast 10,849,269 11,469,189 11,326,425 11,625,175 10,444,157 9,927,622 9,965,643 9,643,624 10,106,493 10,579,810 11,798,874 10,607,196 95,357,598
Actual: Farebox 9,090,090 9,177,875 9,142,845 9,575,126 8,186,014 7,933,904 8,570,118 8,088,484 4,791,051 74,555,507
BUS Actual: Metro Operated Shuttle
23,465 22,940 44,061 9,106 92,046 7,896 57,818 54,790 24,281 336,403
Actual: APC 10,339,106 10,330,911 10,684,278 11,260,590 9,609,526 10,796,145 10,066,403 9,898,718 3,324,992 86,310,669
Actual: APC+ Metro Shuttle
10,362,571 10,353,851 10,728,339 11,269,696 9,701,572 10,804,041 10,124,221 9,953,508 3,349,273 86,647,072
ACCESS Forecast 192,100 209,500 190,400 211,500 192,600 182,500 181,000 179,600 199,100 205,100 209,400 197,200 1,738,300
< Actual 200,694 202,883 193,106 207,995 182,853 173,403 177,112 169,575 116,081 1,623,702
Forecast 26,117,269 25,585,389 25,623,525 27,556,875 24,395,357 23,221,022 22,057,843 21,876,824 24,716,393 26,450,910 27,090,974 26,158,396 221,150,498
TOTAL Actual: Farebox +Metro Shuttle
25,766,684 24,535,801 24,718,087 27,240,116 23,020,715 21,639,486 23,881,199 22,473,872 12,566,344 205,842,304
Actual: APC + Metro Shuttle 27,015,700 25,688,837 26,259,520 28,925,580 24,444,227 24,501,727 25,377,484 24,284,106 11,100,285 217,597,466
Q3/FY2020 METRO PERFORMANCE REPORTM
Appendix I – Performance D
ata
277
Ap
pen
dix I - P
erform
ance D
ata

QUALITY SERVICEMYTRIPTIME RAIL CUSTOMER ON-TIME PERFORMANCE* TARGET 88%
MYTRIPTIME RAILCUSTOMER ON-TIME PERFORMANCE* | BY LINE
Jul Aug Sep Oct Nov Dec Jan Feb Mar Apr May Jun FYTD
FY2018 86% 89% 87% 88% 87% 86% 86% 87% 88% 88% 87% 88% 87%
FY2019 86% 79% 90% 89% 87% 89% 90% 90% 89% 91% 90% 90% 88%
FY2020 89% 90% 89% 90% 90% 89% 92% 92% 92% 90%
Jul Aug Sep Oct Nov Dec Jan Feb Mar Apr May Jun FYTD
Red Line 88% 90% 91% 91% 90% 87% 92% 92% 90% 90%
Blue Line 88% 88% 86% 87% 89% 87% 89% 90% 92% 88%
Orange Line 88% 89% 85% 86% 86% 85% 89% 89% 91% 87%
Green Line 90% 90% 91% 92% 90% 91% 93% 92% 93% 91%
Yellow Line 89% 88% 87% 91% 90% 90% 92% 92% 93% 90%
Silver Line 90% 90% 89% 88% 90% 88% 92% 91% 93% 90%
*FY2020 MyTripTime results were evaluated for the period beginning July 1 and ending the day before Metrorail service was adjusted due to the pandemic - March 16.
MYTRIPTIME RAIL CUSTOMER ON-TIME PERFORMANCE* | BY TIME PERIOD
Jul Aug Sep Oct Nov Dec Jan Feb Mar Apr May Jun FYTD
AM Rush [5AM-9:30AM] 90% 92% 90% 90% 90% 88% 92% 93% 92% 91%
Midday [9:30AM-3PM] 90% 92% 90% 90% 91% 90% 92% 93% 92% 91%
PM Rush [3PM-7PM] 88% 90% 89% 90% 90% 87% 92% 91% 94% 90%
Evening [7PM-9:30PM] 93% 93% 93% 94% 94% 93% 95% 94% 96% 94%
Late Night [9:30PM-12AM] 92% 93% 94% 94% 94% 92% 94% 94% 93% 93%
Weekend 80% 82% 87% 87% 87% 89% 86% 87% 82% 86%
Q3/FY2020 METRO PERFORMANCE REPORTmmetro
278
Appendix I – Performance D
ata

QUALITY SERVICEMETROBUS ONTIME PERORMANCE* | PILOT KPI
Jul Aug Sep Oct Nov Dec Jan Feb Mar Apr May Jun FYTD
FY2020 78% 78% 74% 75% 76% 77% 78% 78% 78% 77%
METROBUS ONTIME PERORMANCE* | BY TIME PERIOD
Jul Aug Sep Oct Nov Dec Jan Feb Mar Apr May Jun FYTD
AM Early [4AM-6AM] 76% 78% 76% 75% 78% 77% 86% 86% 86% 80%
AM Peak [6AM-9AM] 82% 82% 77% 78% 79% 80% 81% 80% 81% 80%
Midday [9AM-3PM] 78% 77% 75% 76% 76% 78% 78% 78% 78% 77%
PM Peak [3PM-7PM] 74% 74% 69% 68% 69% 72% 73% 74% 74% 72%
Early Night [7PM-11PM] 78% 78% 77% 78% 80% 80% 81% 80% 80% 79%
Late Night [11PM-4AM] 80% 80% 80% 81% 83% 83% 82% 82% 82% 81%
METROBUS ONTIME PERORMANCE* | BY SERVICE TYPE
Jul Aug Sep Oct Nov Dec Jan Feb Mar Apr May Jun FYTD
Headway Service 66% 66% 63% 66% 66% 66% 65% 66% 66% 66%
All Other Service 79% 79% 75% 76% 77% 78% 79% 79% 79% 78%
Early 7% 7% 6% 6% 7% 8% 7% 7% 7% 7%
Late 15% 15% 19% 18% 16% 14% 14% 14% 14% 15%
*FY2020 Bus On-Time Performance and MetroAccess results were evaluated for the period beginning July 1 and before service was adjusted due to the pandemic - March 16 for Metrobus and March 18 for MetroAccess.
METROACCESS ON-TIME PERFORMANCE* | TARGET 90%
Jul Aug Sep Oct Nov Dec Jan Feb Mar Apr May Jun FYTD
FY2018 89% 91% 90% 93% 93% 94% 94% 92% 93% 92% 93% 92% 92%
FY2019 92% 92% 92% 92% 90% 91% 90% 89% 89% 89% 86% 88% 91%
FY2020 89% 89% 87% 88% 90% 91% 91% 91% 92% 90%
M Q3/FY2020 METRO PERFORMANCE REPORT
Appendix I – Performance D
ata
279

QUALITY SERVICERAIL FLEET RELIABILITY: MEAN DISTANCE BETWEEN DELAY* | TARGET 130,000
Jul Aug Sep Oct Nov Dec Jan Feb Mar Apr May Jun FYTD
FY2018 92,927 84,111 84,278 104,128 80,687 85,310 61,004 95,119 113,361 103,228 125,658 117,519 86,831
FY2019 124,123 119,755 145,352 141,878 161,039 162,407 134,683 146,531 238,078 198,102 265,139 194,907 147,763
FY2020 144,510 188,206 292,729 192,718 211,038 237,499 244,666 416,767 951,822 230,127
RAIL FLEET RELIABILITY: MEAN DISTANCE BETWEEN DELAY* | BY RAILCAR SERIES
Jul Aug Sep Oct Nov Dec Jan Feb Mar Apr May Jun FYTD
2000 series 92,529 41,268 188,914 181,630 315,178 300,146 101,646 124,132 119,134 122,170
3000 series 100,691 93,781 152,396 82,935 78,083 131,524 97,057 403,078 392,082 115,381
6000 series 150,850 125,455 283,153 211,946 933,218 202,605 960,708 465,048 490,182 258,700
7000 series 174,545 436,424 429,369 310,590 305,472 314,362 426,973 466,173 2,413,809 343,116
RAIL FLEET RELIABILITY: MEAN DISTANCE BETWEEN FAILURE* | TARGET 10,000
Jul Aug Sep Oct Nov Dec Jan Feb Mar Apr May Jun FYTD
FY2018 7,430 8,227 9,711 10,881 10,376 10,496 10,021 11,280 11,202 13,699 11,755 12,850 9,786
FY2019 10,073 10,671 11,092 14,010 14,075 15,929 14,019 14,397 19,737 19,810 16,752 16,418 13,311
FY2020 15,344 19,374 20,799 20,998 20,784 23,425 26,760 24,142 26,812 21,253
*FY2020 Rail Fleet Reliability results were evaluated for the period beginning July 1 and ending the day before service was adjusted due to the pandemic - March 16.
RAIL FLEET RELIABILITY: MEAN DISTANCE BETWEEN FAILURE* | BY RAILCAR SERIES
Jul Aug Sep Oct Nov Dec Jan Feb Mar Apr May Jun FYTD
2000 series 8,046 6,878 10,495 11,718 11,673 21,439 16,049 11,822 7,942 10,708
3000 series 7,821 9,743 10,297 9,424 9,450 10,182 14,805 15,210 18,236 10,688
6000 series 10,170 10,977 11,177 13,414 14,582 13,690 19,214 12,741 18,853 13,126
7000 series 28,598 39,675 42,937 44,021 37,152 46,381 41,734 40,062 41,617 39,556
Q3/FY2020 METRO PERFORMANCE REPORTMlmetro
280
Appendix I – Performance D
ata

QUALITY SERVICEBUS FLEET RELIABILITY: MEAN DISTANCE BETWEEN FAILURE* | TARGET 7,000
Jul Aug Sep Oct Nov Dec Jan Feb Mar Apr May Jun FYTD
FY2018 7,555 7,764 7,571 6,923 7,492 7,776 6,221 6,164 7,485 6,124 6,209 6,515 7,174
FY2019 6,192 5,961 5,806 6,644 6,670 6,806 6,422 6,661 6,796 6,622 5,680 6,111 6,417
FY2020 6,166 6,001 6,066 7,006 7,788 8,527 8,533 7,785 10,643 7,204
BUS FLEET RELIABILITY: MEAN DISTANCE BETWEEN FAILURE* | BY FUEL TYPE
Jul Aug Sep Oct Nov Dec Jan Feb Mar Apr May Jun FYTD
CNG 7,802 9,636 8,832 8,452 12,094 9,015 9,397 9,091 14,228 9,330
HYBRID 6,162 5,814 5,908 6,953 7,147 8,615 8,456 7,565 10,082 7,025
CLEAN DIESEL 3,590 2,945 3,109 4,877 5,163 6,842 6,794 6,260 7,581 4,625
DIESEL 3,662 3,952 8,390 3,972 2,640 277 5,238 5,371 0 4,738
ELEVATOR AVAILABILITY* | TARGET 97%
Jul Aug Sep Oct Nov Dec Jan Feb Mar Apr May Jun FYTD
FY2018 97% 97% 97% 97% 97% 98% 97% 97% 97% 96% 96% 96% 97%
FY2019 95% 96% 95% 97% 96% 97% 96% 96% 97% 97% 97% 97% 96%
FY2020 96% 97% 97% 98% 97% 97% 97% 97% 96% 97%
ESCALATOR AVAILABILITY* | TARGET 92%
Jul Aug Sep Oct Nov Dec Jan Feb Mar Apr May Jun FYTD
FY2018 95% 94% 95% 94% 94% 94% 93% 93% 93% 93% 91% 93% 94%
FY2019 93% 93% 92% 92% 94% 94% 94% 94% 94% 95% 94% 95% 93%
FY2020 94% 94% 94% 95% 95% 96% 96% 96% 97% 95%
*FY2020 Bus Fleet Reliability and Elevator & Escalator Availability results were evaluated for the period beginning July 1 and ending the day before service was adjusted due to the pandemic - March 16.
Appendix I – Performance D
ata
281

QUALITY SERVICERAIL GUIDEWAY CONDITION: FTA REPORTABLE SPEED RESTRICTIONS | TARGET 3.8%
TRAIN ON-TIME PERFORMANCE: HEADWAY ADHERENCE* | TARGET 91%
Jul Aug Sep Oct Nov Dec Jan Feb Mar Apr May Jun FYTD
FY2018 9.5% 12.9% 9.8% 9.5% 11.8% 14.0% 9.5% 9.5% 9.9% 9.6% 9.6% 0.1% 10.7%
FY2019 0.2% 2.1% 0.3% 1.8% 1.6% 3.6% 0.3% 0.2% 0.0% 0.0% 0.0% 9.1% 1.1%
FY2020 9.7% 10.4% 10.4% 0.5% 2.2% 2.0% 0.1% 0.1% 0.1% 4.0%
TRAIN ON-TIME PERFORMANCE: HEADWAY ADHERENCE* | BY LINE
Jul Aug Sep Oct Nov Dec Jan Feb Mar Apr May Jun FYTD
FY2018 90% 92% 89% 92% 89% 88% 89% 91% 91% 92% 92% 93% 90%
FY2019 90% 78% 93% 93% 91% 93% 91% 92% 92% 93% 92% 91% 91%
FY2020 91% 92% 91% 92% 92% 91% 94% 94% 94% 92%
*FY2020 Train On-Time Performance results were evaluated for the period beginning July 1 and ending the day before service was adjusted due to the pandemic - March 16.
Jul Aug Sep Oct Nov Dec Jan Feb Mar Apr May Jun FYTD
Red Line 93% 95% 94% 95% 94% 93% 96% 95% 94% 94%
Blue Line 87% 88% 87% 88% 89% 88% 91% 91% 93% 89%Orange Line 91% 92% 90% 90% 91% 90% 93% 93% 93% 91%
Green Line 93% 94% 93% 95% 94% 93% 96% 96% 97% 94%
Yellow Line 91% 91% 91% 93% 92% 91% 94% 95% 96% 93%
Silver Line 89% 91% 89% 91% 91% 90% 92% 93% 93% 91%
282
Appendix I – Performance D
ata

QUALITY SERVICETRAIN ON-TIME PERFORMANCE: HEADWAY ADHERENCE* | BY TIME PERIOD
TRAINS IN SERVICE* | TARGET 98%
Jul Aug Sep Oct Nov Dec Jan Feb Mar Apr May Jun FYTD
AM Rush [5AM-9:30AM] 87% 88% 87% 88% 88% 87% 90% 91% 91% 88%
Midday [9:30AM-3PM] 95% 97% 95% 95% 96% 95% 97% 97% 97% 96%
PM Rush [3PM-7PM] 88% 90% 89% 91% 90% 89% 93% 92% 93% 90%
Evening [7PM-9:30PM] 97% 97% 97% 99% 98% 96% 98% 98% 97% 97%
OFFLOADS* | TARGET <80 PER MONTH
Jul Aug Sep Oct Nov Dec Jan Feb Mar Apr May Jun FYTD
FY2018 99% 99% 98% 101% 99% 99% 97% 98% 98% 99% 98% 98% 100%
FY2019 97% 98% 98% 97% 97% 98% 96% 97% 98% 98% 98% 99% 97%
FY2020 99% 99% 98% 98% 97% 97% 98% 100% 99% 98%
Jul Aug Sep Oct Nov Dec Jan Feb Mar Apr May Jun FYTD
FY2018 113 134 124 87 103 95 150 102 91 70 119 91 999
FY2019 88 91 69 79 75 83 94 76 58 58 65 99 713
FY2020 96 62 93 61 69 75 71 70 33 630
*FY2020 Train On-Time Performance, Offloads, and Crowding results were evaluated for the period beginning July 1 and ending the day before service was adjusted due to the pandemic - March 16.
CROWDING: CROWDED PASSENGER TIME* | PILOT MEASURE
Jul Aug Sep Oct Nov Dec Jan Feb Mar Apr May Jun FYTD
FY2019 3.5% 4.2% 4.5% 4.3% 3.8% 3.1% 3.2% 3.7% 3.8% 3.8%
FY2020 5.1% 4.4% 6.3% 6.5% 5.9% 5.0% 2.6% 2.6% 2.1% 4.8%
Appendix I – Performance D
ata
283

QUALITY SERVICEMETRORAIL CROWDING* | PILOT MEASURE
Jul Aug Sep Oct Nov Dec Jan Feb Mar Apr May Jun FYTD
FY2019 4.8% 4.5% 3.2% 4.0% 4.2% 3.6% 2.5% 4.0% 3.8% 3.9%
FY2020 3.8% 2.0% 3.2% 4.1% 3.3% 3.1% 3.3% 3.1% 2.3% 3.3%
METRORAIL CROWDING* | BYLINE
Jul Aug Sep Oct Nov Dec Jan Feb Mar Apr May Jun FYTD
Red Line 4.5% 2.4% 3.9% 4.0% 3.5% 3.9% 3.2% 3.5% 2.8% 3.6%
Blue Line 2.2% 0.7% 1.8% 3.5% 2.4% 1.9% 2.5% 2.2% 1.3% 2.3%
Orange Line 5.3% 3.0% 5.0% 7.2% 5.8% 5.1% 5.8% 5.2% 3.6% 5.4%
Green Line 2.6% 1.7% 2.2% 3.0% 1.4% 1.0% 1.3% 0.8% 0.7% 1.8%
Yellow Line 3.3% 1.8% 3.0% 3.8% 3.9% 2.5% 4.0% 3.2% 2.9% 3.3%
Silver Line 2.8% 1.3% 2.3% 2.6% 2.7% 2.3% 2.2% 2.6% 1.6% 2.4%
*FY2020 Crowding results were evaluated for the period beginning July 1 and ending the day before service was adjusted due to the pandemic - March 16.
METRORAIL CROWDING* | BY TIME PERIOD
Jul Aug Sep Oct Nov Dec Jan Feb Mar Apr May Jun FYTD
AM Rush [5AM-9:30AM] 6.4% 3.2% 6.8% 7.7% 5.6% 5.9% 5.7% 6.0% 4.9% 6.0%
Midday [9:30AM-3PM] 0.1% 0.0% 0.2% 0.1% 0.1% 0.2% 1.6% 0.0% 0.0% 0.3%
PM Rush [3PM-7PM] 5.0% 3.3% 3.7% 4.7% 4.3% 4.3% 3.5% 3.7% 2.2% 4.0%
Evening [7PM-9:30PM] 0.8% 0.3% 0.2% 0.6% 0.1% 0.3% 0.1% 0.1% 0.1% 0.3%
Late Night [9:30PM-12AM] 0.0% 0.0% 0.0% 6.6% 0.0% 0.0% 0.0% 0.0% 0.0% 1.9%
Weekend 0.5% 0.2% 0.1% 0.9% 1.9% 0.0% 0.0% 0.0% 0.0% 0.5%
284
Appendix I – Performance D
ata

QUALITY SERVICEMETROBUS CROWDING* | PILOT MEASURE
Jul Aug Sep Oct Nov Dec Jan Feb Mar Apr May Jun FYTD
FY2019 3.4% 4.2% 4.5% 4.3% 3.8% 3.1% 3.2% 3.7% 3.8% 3.8%
FY2020 5.1% 4.4% 6.3% 6.5% 5.8% 5.0% 2.6% 2.6% 2.1% 4.9%
METROBUS CROWDING* | BY TIME PERIOD
Jul Aug Sep Oct Nov Dec Jan Feb Mar Apr May Jun FYTD
AM Early [4AM-6AM] 5.4% 5.7% 7.5% 8.3% 6.8% 5.2% 1.5% 1.9% 1.9% 5.0%
AM Peak [6AM-9AM] 6.5% 5.0% 9.0% 8.3% 7.8% 6.7% 4.0% 3.9% 3.2% 5.4%
Midday [9AM-3PM] 4.6% 3.6% 4.8% 5.1% 4.8% 4.3% 2.4% 2.4% 1.8% 6.5%
PM Peak [3PM-7PM] 5.6% 4.7% 6.5% 7.3% 6.3% 5.3% 2.3% 2.3% 2.0% 4.1%
Early Night [7PM-11PM] 3.7% 3.4% 4.2% 4.6% 3.4% 3.1% 1.4% 2.2% 1.7% 5.2%
Late Night [11PM-4AM] 9.2% 7.7% 7.5% 7.6% 5.3% 6.0% 3.5% 3.8% 3.4% 3.4%
Weekend 3.4% 4.5% 5.0% 5.2% 5.2% 4.0% 1.4% 1.6% 1.0% 6.6%
METRORAIL CUSTOMER SATISFACTION RATING
Q1 Q2 Q3 Q4
FY2018 74% 73% 76% 79%
FY2019 75% 73% 80% 76%
FY2020 79% 83% 85%
METROBUS CUSTOMER SATISFACTION RATING
Q1 Q2 Q3 Q4
FY2018 76% 72% 75% 80%
FY2019 71% 77% 75% 76%
FY2020 76% 79% 76%
*FY2020 Crowding results were evaluated for the period beginning July 1 and ending the day before service was adjusted due to the pandemic - March 16.
Appendix I – Performance D
ata
285

SAFETY & SECURITYPART I CRIMES PER MILLION PASSENGERS’*
Jul Aug Sep Oct Nov Dec Jan Feb Mar Apr May Jun FYTD
FY2018 4.5 4.9 5.1 4.1 3.8 3.7 3.6 2.5 3.7 4.6 3.8 4.4 4.0
FY2019 3.5 4.5 3.9 3.7 4.0 4.0 4.6 3.4 3.1 3.5 4.0 5.6 3.9
FY2020 4.8 4.2 5.9 6.9 4.3 5.5 3.7 4.5 4.5 5.0
PART I CRIMES* ̂| TARGET ≤ 1,550
Jul Aug Sep Oct Nov Dec Jan Feb Mar Apr May Jun FYTD
FY2018 113 127 126 107 90 79 79 52 90 116 97 114 863
FY2019 89 110 90 99 89 83 95 71 77 92 104 137 803
FY2020 125 106 147 188 100 118 88 101 47 1,020
PART I CRIMES*^ | BY TYPE
FY2020 Jul Aug Sep Oct Nov Dec Jan Feb Mar Apr May Jun FYTD
Property Crime 81 72 107 135 63 66 59 67 28 678
Larceny 27 15 33 51 23 30 21 33 15 248
Larcey (Other) 47 50 69 79 38 35 31 32 13 394
Burglary 2 0 0 0 0 0 0 0 0 2
Motor Vehicle Theft 5 6 4 2 2 1 4 1 0 25
Attempted MV Theft 0 1 1 3 0 0 3 1 0 9
Arson 0 0 0 0 0 0 0 0 0 0
Violent Crime 44 34 40 53 37 52 29 34 19 342
Aggravated Assault 13 11 13 11 10 9 10 8 3 88
Rape 1 0 0 0 0 0 0 1 0 2
Robbery 30 23 27 42 27 43 19 25 16 252
FY2020 Part I Crimes 125 106 147 188 100 118 88 101 47 1,020
FY2020 Homicides 0 0 0 1 0 0 1 0 0 2
*FY2020 Part I Crime results were evaluated for the period beginning July 1 and ending the day before service was adjusted due to the pandemic - March 16.
M Q3/FY2020 METRO PERFORMANCE REPORT
286
Appendix I – Performance D
ata
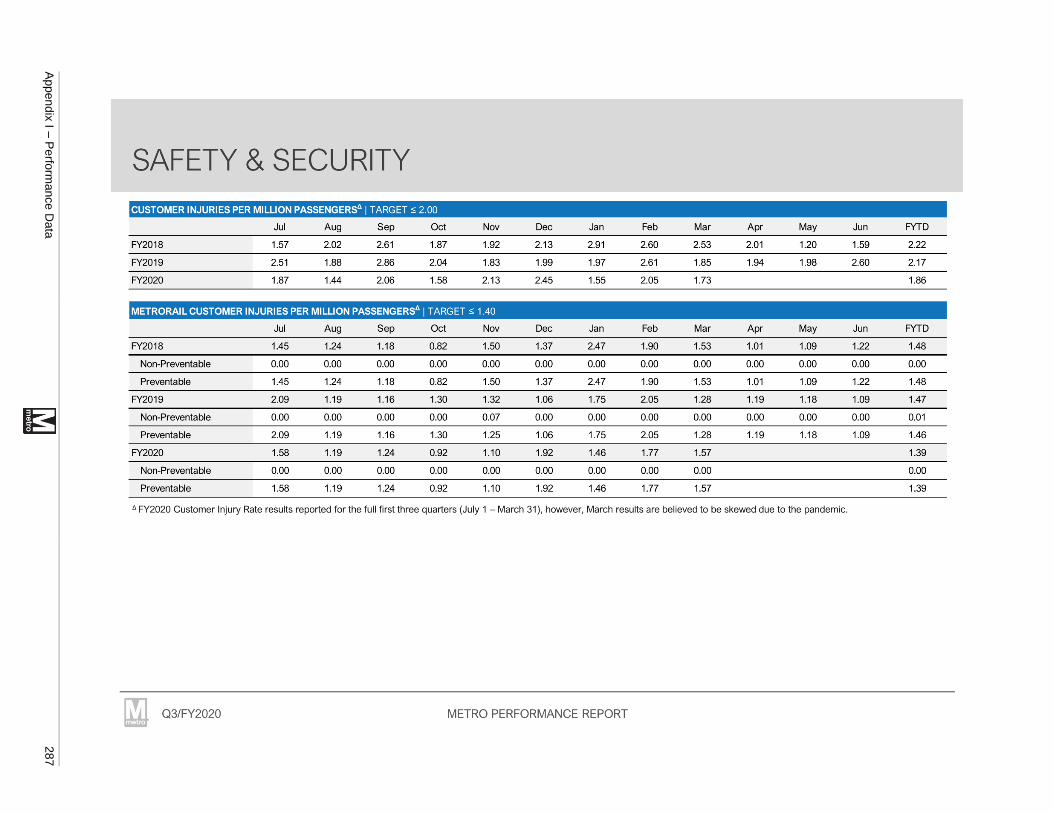
SAFETY & SECURITYCUSTOMER INJURIES PER MILLION PASSENGERS* | TARGET ≤ 2.00
Jul Aug Sep Oct Nov Dec Jan Feb Mar Apr May Jun FYTD
FY2018 1.57 2.02 2.61 1.87 1.92 2.13 2.91 2.60 2.53 2.01 1.20 1.59 2.22
FY2019 2.51 1.88 2.86 2.04 1.83 1.99 1.97 2.61 1.85 1.94 1.98 2.60 2.17
FY2020 1.87 1.44 2.06 1.58 2.13 2.45 1.55 2.05 1.73 1.86
^ FY2020 Customer Injury Rate results reported for the full first three quarters (July 1 - March 31), however, March results are believed to be skewed due to the pandemic.
METRORAIL CUSTOMER INJURIES PER MILLION PASSENGERS* TARGET < 1.40
Jul Aug Sep Oct Nov Dec Jan Feb Mar Apr May Jun FYTD
FY2018 1.45 1.24 1.18 0.82 1.50 1.37 2.47 1.90 1.53 1.01 1.09 1.22 1.48
Non-Preventable 0.00 0.00 0.00 0.00 0.00 0.00 0.00 0.00 0.00 0.00 0.00 0.00 0.00
Preventable 1.45 1.24 1.18 0.82 1.50 1.37 2.47 1.90 1.53 1.01 1.09 1.22 1.48
FY2019 2.09 1.19 1.16 1.30 1.32 1.06 1.75 2.05 1.28 1.19 1.18 1.09 1.47
Non-Preventable 0.00 0.00 0.00 0.00 0.07 0.00 0.00 0.00 0.00 0.00 0.00 0.00 0.01
Preventable 2.09 1.19 1.16 1.30 1.25 1.06 1.75 2.05 1.28 1.19 1.18 1.09 1.46
FY2020 1.58 1.19 1.24 0.92 1.10 1.92 1.46 1.77 1.57 1.39
Non-Preventable 0.00 0.00 0.00 0.00 0.00 0.00 0.00 0.00 0.00 0.00
Preventable 1.58 1.19 1.24 0.92 1.10 1.92 1.46 1.77 1.57 1.39
Appendix I – Performance D
ata
287

SAFETY & SECURITYMETROBUS CUSTOMER INJURIES PER MILLION PASSENGERS^ |TARGET ≤2.45
Jul Aug Sep Oct Nov Dec Jan Feb Mar Apr May Jun FYTD
FY2018 1.37 2.94 4.36 2.84 2.26 3.04 3.17 2.52 3.49 3.32 1.30 2.15 2.89
Non-Preventable 0.63 1.86 1.42 1.66 0.97 1.87 2.12 0.96 1.69 1.50 0.70 0.54 1.46
Preventable 0.74 1.08 2.94 1.17 1.29 1.17 1.06 1.56 1.80 1.82 0.60 1.61 1.43
FY2019 2.70 2.35 5.27 2.99 2.19 3.04 1.61 2.92 2.32 2.72 3.11 4.52 2.83
Non-Preventable 1.19 1.67 3.63 1.20 1.15 2.19 1.24 0.89 1.77 1.30 0.62 2.58 1.66
Preventable 1.51 0.69 1.65 1.79 1.04 0.85 0.37 2.03 0.55 1.41 2.49 1.94 1.17
FY2020 1.88 1.45 3.13 2.40 3.26 3.02 1.62 2.33 2.01 2.34
Non-Preventable 1.36 1.04 1.40 1.15 2.05 2.39 1.16 1.72 1.20 1.49
Preventable 0.52 0.41 1.73 1.25 1.21 0.63 0.46 0.61 0.80 0.85
^ FY2020 Customer Injury Rate results reported for the full first three quarters (July 1 - March 31), however, March results are believed to be skewed due to the pandemic.
METROACCESS CUSTOMER INJURIES PER 100,000 PASSENGERS^ | TARGET ≤ 2.85
Jul Aug Sep Oct Nov Dec Jan Feb Mar Apr May Jun FYTD
FY2018 2.14 1.46 2.09 3.39 1.55 1.07 2.18 5.48 3.62 1.99 0.48 0.51 2.54
Non-Preventable 1.61 0.97 2.09 1.45 1.55 0.00 0.54 4.38 1.55 1.49 0.48 0.00 1.56
Preventable 0.54 0.49 0.00 1.94 0.00 1.07 1.63 1.10 2.07 0.50 0.00 0.51 0.98
FY2019 2.54 2.36 1.06 1.39 2.10 1.66 3.38 2.84 2.45 2.94 0.96 2.57 2.18
Non-Preventable 2.54 2.36 1.06 0.46 2.10 1.66 2.82 1.70 1.96 1.47 0.48 1.54 1.84
Preventable 0.00 0.00 0.00 0.93 0.00 0.00 0.56 1.14 0.49 1.47 0.48 1.03 0.34
FY2020 2.49 1.97 1.55 1.92 3.28 1.73 0.56 1.18 0.00 1.72
Non-Preventable 1.00 0.99 1.55 1.44 3.28 1.15 0.56 0.59 0.00 1.23
Preventable 1.49 0.99 0.00 0.48 0.00 0.58 0.00 0.59 0.00 0.49
288
Appendix I – Performance D
ata
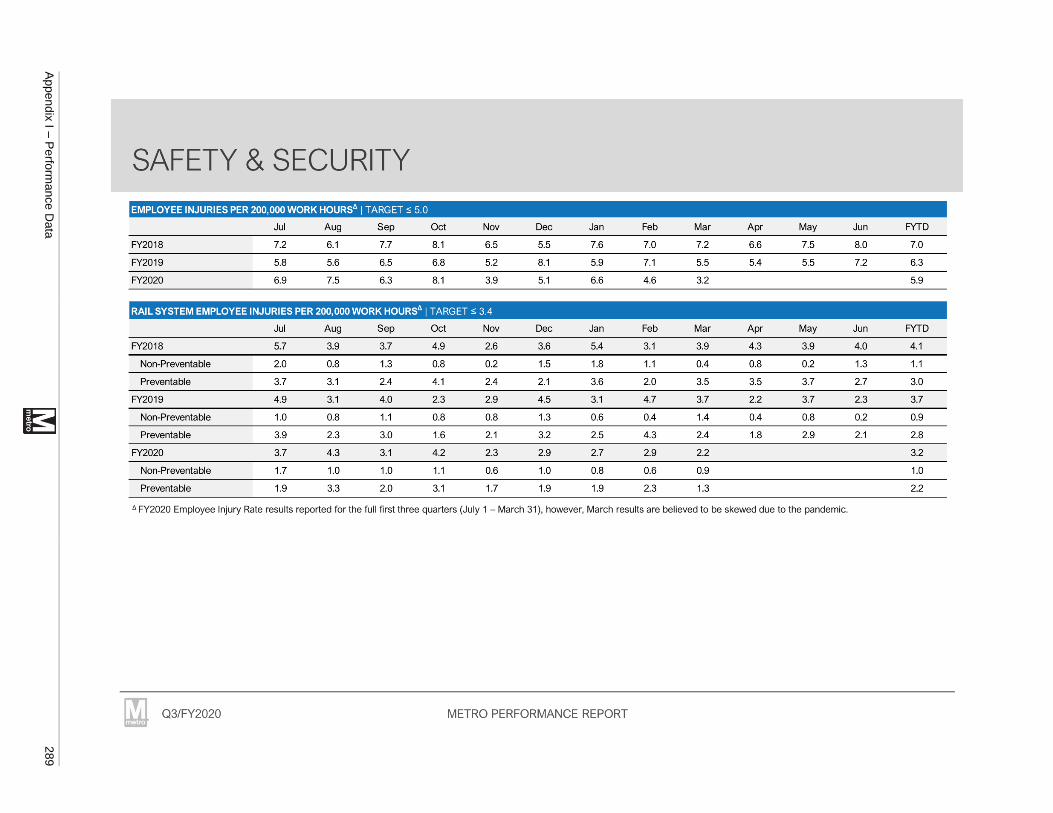
SAFETY & SECURITYEMPLOYEE INJURIES PER 200,000 WORK HOURS^ | TARGET ≤ 5.0
Jul Aug Sep Oct Nov Dec Jan Feb Mar Apr May Jun FYTD
FY2018 7.2 6.1 7.7 8.1 6.5 5.5 7.6 7.0 7.2 6.6 7.5 8.0 7.0
FY2019 5.8 5.6 6.5 6.8 5.2 8.1 5.9 7.1 5.5 5.4 5.5 7.2 6.3
FY2020 6.9 7.5 6.3 8.1 3.9 5.1 6.6 4.6 3.2 5.9
^ FY2020 Employee Injury Rate results reported for the full first three quarters (July 1 - March 31), however, March results are believed to be skewed due to the pandemic.
RAIL SYSTEM EMPLOYEE INJURIES PER 200,000 WORK HOURS^ | TARGET ≤3.4
Jul Aug Sep Oct Nov Dec Jan Feb Mar Apr May Jun FYTD
FY2018 5.7 3.9 3.7 4.9 2.6 3.6 5.4 3.1 3.9 4.3 3.9 4.0 4.1
Non-Preventable 2.0 0.8 1.3 0.8 0.2 1.5 1.8 1.1 0.4 0.8 0.2 1.3 1.1
Preventable 3.7 3.1 2.4 4.1 2.4 2.1 3.6 2.0 3.5 3.5 3.7 2.7 3.0
FY2019 4.9 3.1 4.0 2.3 2.9 4.5 3.1 4.7 3.7 2.2 3.7 2.3 3.7
Non-Preventable 1.0 0.8 1.1 0.8 0.8 1.3 0.6 0.4 1.4 0.4 0.8 0.2 0.9
Preventable 3.9 2.3 3.0 1.6 2.1 3.2 2.5 4.3 2.4 1.8 2.9 2.1 2.8
FY2020 3.7 4.3 3.1 4.2 2.3 2.9 2.7 2.9 2.2 3.2
Non-Preventable 1.7 1.0 1.0 1.1 0.6 1.0 0.8 0.6 0.9 1.0
Preventable 1.9 3.3 2.0 3.1 1.7 1.9 1.9 2.3 1.3 2.2
Appendix I – Performance D
ata
289

SAFETY & SECURITY
^ FY2020 Employee Injury Rate results reported for the full first three quarters (July 1 - March 31), however, March results are believed to be skewed due to the pandemic.
BUS EMPLOYEE INJURIES PER 200,000 WORK HOURS^ | TARGET ≤ 9.4
Jul Aug Sep Oct Nov Dec Jan Feb Mar Apr May Jun FYTD
FY2018 11.0 10.2 14.0 14.0 13.8 7.3 11.7 12.2 14.0 12.3 11.0 14.7 12.1
Non-Preventable 6.5 5.7 7.5 7.5 6.4 5.1 6.5 8.1 5.7 7.2 6.6 8.7 6.5
Preventable 4.5 4.5 6.5 6.5 7.4 3.2 5.2 4.1 8.4 5.0 4.5 6.1 5.6
FY2019 8.2 10.0 10.4 16.1 9.8 14.2 11.0 11.2 7.8 11.5 9.3 14.7 11.0
Non-Preventable 5.5 4.3 7.5 9.2 4.4 8.5 4.3 5.8 4.4 6.5 4.8 8.8 6.0
Preventable 2.7 5.7 2.9 6.9 5.4 5.7 6.7 5.4 3.4 5.0 4.5 5.9 5.0
FY2020 12.9 14.2 11.6 13.4 5.7 10.3 15.0 7.8 6.1 11.0
Non-Preventable 8.1 7.2 4.6 6.8 3.0 5.8 8.1 5.1 3.4 5.9
Preventable 4.8 6.9 6.9 6.5 2.7 4.5 6.9 2.7 2.7 5.0
290
Appendix I – Performance D
ata

^
SAFETY & SECURITYNTD BUS COLLISIONS PER MILLION MILES^ | TARGET ≤ 3.7
Jul Aug Sep Oct Nov Dec Jan Feb Mar Apr May Jun FYTD
FY2018 3.2 4.8 3.5 4.4 2.0 3.2 3.2 3.7 4.9 3.7
Non-Preventable 2.5 3.9 2.5 3.7 1.5 2.2 2.2 3.5 3.4 2.8
Preventable 0.7 0.9 1.0 0.7 0.5 1.0 1.0 0.3 1.5 0.9
FY2019 5.4 3.9 6.2 7.0 3.3 4.0 3.2 3.8 4.6 4.6
Non-Preventable 3.2 3.0 3.6 3.6 1.5 2.5 2.0 1.4 3.1 2.7
Preventable 2.2 0.9 2.6 3.4 1.8 1.5 1.2 2.5 1.4 1.9
FY2020 3.5 4.0 4.5 4.3 3.7 3.3 2.9 3.4 2.3 3.6
Non-Preventable 2.1 1.9 2.2 2.1 1.6 2.3 2.2 2.1 0.7 1.9
Preventable 1.4 2.1 2.2 2.1 2.1 1.0 0.7 1.3 1.7 1.6
^ FY2020 NTD and All Bus Collision Rate results reported for the full first three quarters (July 1 - March 31), however, March results are believed to be skewed due to the pandemic.
ALL BUS COLLISIONS PER MILLION MILES^
Jul Aug Sep Oct Nov Dec Jan Feb Mar Apr May Jun FYTD
FY2018 58.7 65.0 59.6 58.3 62.5 61.1 60.8 61.7 66.2 67.4 73.6 63.2 61.6
Non-Preventable 33.8 36.4 38.4 34.0 37.8 40.1 36.2 38.2 36.6 43.0 48.8 32.1 36.8
Preventable 24.9 28.6 21.2 24.2 24.8 20.9 24.6 23.5 29.6 24.4 24.8 31.1 24.8
FY2019 68.8 70.0 67.6 70.0 57.7 67.7 64.0 61.3 66.0 72.9 67.4 65.9 66.0
Non-Preventable 35.6 42.6 38.9 36.1 34.3 37.2 34.4 32.2 36.6 43.9 40.8 36.0 36.5
Preventable 33.2 27.3 28.6 33.9 23.4 30.5 29.5 29.2 29.4 29.0 26.6 29.9 29.5
FY2020 61.8 65.1 63.9 70.8 65.0 61.7 60.3 62.9 54.0 63.1
Non-Preventable 32.4 37.9 36.8 42.3 37.3 37.1 36.3 33.5 25.1 35.7
Preventable 29.4 27.2 27.1 28.5 27.7 24.6 24.0 29.4 28.8 27.4
Q3/FY2020 METRO PERFORMANCE REPORTMI
Appendix I – Performance D
ata
291

SAFETY & SECURITYRAIL COLLISIONS | TARGET DECREASE FROM PRIOR YEAR
Jul Aug Sep Oct Nov Dec Jan Feb Mar Apr May Jun FYTD
FY2018 1 1 1 0 0 1 1 1 2 1 1 2 8
FY2019 3 2 0 0 0 0 0 1 2 1 1 0 8
FY2020 1 2 0 2 0 0 1 2 0 8
DERAILMENTS | TARGET DECREASE FROM PRIOR YEAR
Jul Aug Sep Oct Nov Dec Jan Feb Mar Apr May Jun FYTD
FY2018 2 1 2 0 0 1 2 1 2 1 1 0 11
Trains Carrying Customers 0 0 0 0 0 0 1 0 0 0 0 0 1
Trains with No Customers 0 0 0 0 0 0 1 0 0 0 0 0 1
Roadway Maintenance Machine 2 1 2 0 0 1 0 1 2 1 1 0 9
FY2019 0 0 0 0 0 0 0 0 0 0 0 0 0
Trains Carrying Customers 0 0 0 0 0 0 0 0 0 0 0 0 0
Trains with No Customers 0 0 0 0 0 0 0 0 0 0 0 0 0
Roadway Maintenance Machine 0 1 0 0 1 0 0 0 0 0 1 0 2
FY2020 1 2 1 0 0 0 0 1 0 5
Trains Carrying Customers 0 0 0 0 0 0 0 0 0 0
Trains with No Customers 0 0 0 0 0 0 0 0 0 0
Roadway Maintenance Machine 1 2 1 0 0 0 0 1 0 5
M Q3/FY2020 METRO PERFORMANCE REPORT
292
Appendix I – Performance D
ata

SAFETY & SECURITYFIRE INCIDENTS | TARGET DECREASE FROM PRIOR YEAR
Jul Aug Sep Oct Nov Dec Jan Feb Mar Apr May Jun FYTD
FY2018 15 8 9 7 3 9 8 2 1 3 13 5 62
Non-Electrical 4 2 4 3 3 7 3 0 1 2 5 2 27
Cable 1 1 0 2 0 □ 1 0 0 0 0 0 5
Arcing Insulator 9 5 5 2 0 0 4 2 0 1 8 3 27
Train Component 1 0 0 0 0 2 0 0 0 0 0 0 3
Station Component 0 1 2 3 4 5 6 7 8 9 10 11 12
FY2019 10 11 5 3 5 2 3 5 7 7 4 9 51
Non-Electrical 4 1 1 2 4 2 3 3 3 4 3 4 23
Cable 0 3 0 □ 0 0 0 0 0 0 0 0 3
Arcing Insulator 6 6 4 1 1 0 0 2 4 3 1 5 24
Train Component 0 1 0 0 0 0 0 0 0 0 0 0 1
Station Component 0 1 2 3 4 5 6 7 8 9 10 11 12
FY2020 8 6 12 7 6 5 2 3 3 52
Non-Electrical 4 4 10 5 5 1 1 1 3 34
Cable 0 2 0 0 0 0 0 0 0 2
Arcing Insulator 4 0 1 1 1 4 1 2 0 14
Train Component 0 0 1 0 0 0 0 0 0 1
Station Component 0 0 0 1 0 0 0 0 0 1
Appendix I – Performance D
ata
293

SAFETY & SECURITYRED SIGNAL OVERRUNS | TARGET DECREASE FROM PRIOR YEAR
Jul Aug Sep Oct Nov Dec Jan Feb Mar Apr May Jun FYTD
FY2018 0 0 1 0 0 1 0 0 3 0 3 2 5
FY2019 0 0 1 0 0 1 0 0 3 0 3 2 5
FY2020 2 0 1 3 2 1 0 0 3 12
BUS PEDESTRIAN STRIKES | TARGET DECREASE FROM PRIOR YEAR
Jul Aug Sep Oct Nov Dec Jan Feb Mar Apr May Jun FYTD
FY2018 3 0 0 0 2 2 1 0 2 3 0 1 10
FY2019 2 4 2 3 2 1 4 3 0 0 1 2 21
FY2020 2 2 2 5 0 2 1 2 0 16
294
Appendix I – Performance D
ata

SUPPORTING MEASURESVACANCY RATE | TARGET 6%
Jul Aug Sep Oct Nov Dec Jan Feb Mar Apr May Jun FYTD
FY2018 7% 7% 7% 6% 7% 7% 6% 6% 7% 7% 7% 7% 7%
FY2019 7% 7% 6% 5% 5% 5% 5% 5% 6% 6% 6% 6% 6%
FY2020 6% 6% 6% 6% 6% 7% 7% 6% 6% 6%
Appendix I – Performance D
ata
295

RIDERSHIP + SUPPORTING MEASURSKPI How is it measured? What does this mean and why is it key to our strategy?
Ridership Total Metro ridership
Metrorail passenger trips + Metrobus
Ridership is a measure of total service consumed and an indicator of value to the region. Drivers of this indicator include service quality and accessibility.
passenger boardings + MetroAccess passenger trips
Passenger trips are defined as follows:
► Metrorail reports passenger trips. A passenger trip is counted when a customer enters through afaregate. In an example where a customer transfers between two trains to complete their travel one trip is counted.
► Metrobus reports passenger boardings. A passenger boarding is counted via the onboard Automatic Passenger Counter (APC) when a customer boards a Metrobus. In an example where a customer transfers between two Metrobuses to complete their travel two trips are counted. Metrobus totals also include shuttles* to accommodate rail station shutdowns and other track work.
► MetroAccess reports passenger trips. A fare paying passenger traveling from an origin to a destination is counted as one passenger trip.
*Metro does not include bus shuttle passenger trips in its budget or published ridership forecasts.
Vacancy Rate Percentage of budgeted positions that are vacant
(Number of budgeted positions - number of employees in budgeted positions) ÷ number of budgeted positions
This measure indicates how well Metro is managing its human capital strategy to recruit new employees in a timely manner. Factors influencing vacancy rate can include: recruitement activities, training schedules, availability of talent, promotions, retirements, among other factors.
296
Appendix I – Performance D
ata

SAFETY & SECURITY KPI How is it measured? What does this mean and why is it key to our strategy?
Crime Reported Part I Crimes Part I crimes reported to the Metro Transit Police Department for Metrobus (on buses), Metrorail (on trains and in rail stations), or at Metro-owned parking lots in relation to Metro’s monthly passenger trips. Uniform Crime Reporting, managed by the Federal Bureau of Investigation, include Part I offense classifications of Criminal Homicide, Forcible Rape, Robbery, Aggravated Assault, Burglary, Larceny, Motor Vehicle Theft, and Arson.
This measure provides an indicator of the perception of safety and security customers experience when traveling the Metro system. Increases or decreases in crime can have a direct effect on whether customers feel safe in the system.
Customer Injury Rate
Customer injury rate:
Number of injuries(Number of passengers ÷ 1,000,000)
The customer injury rate is based on National Transit Database (NTD) Reporting criteria. This measure includes customers injured during Metro operations when the injury is considered serious or requires immediate medical attention away from the scene.
Customer safety is the highest priority for Metro and a key measure of quality service. Customers expect a safe and reliable ride each day. The customer injury rate is an indicator of how well the service is meeting this safety objective.
Employee Injury Rate
Employee injury rate:
Number of injuries ÷ (Total work hours ÷ 200,000)
An employee injury is recorded based on OSHA 1904 Recordkeeping Criteria, when the injury is (a) work related; and, (b) one or more of the following happens to the employee: 1) fatality, 2) injury or illness that results in loss of consciousness, days away from work, restricted work, or job transfer 3) receives medical treatment above first aid, 4) diagnosed case of cancer, chronic irreversible diseases, fractured or cracked bones or teeth, and punctured eardrums, 5) special cases involving needlesticks and sharps injuries, medical removal, hearing loss, and tuberculosis.
Per the Occupational Safety and Health Act, employers are obligated to provide a workplace free of recognized hazards which may cause employee death or serious injury. OSHA recordable injuries are a key indicator of how safe employees are in the workplace.
Appendix I – Performance D
ata
297

SAFETY & SECURITYKPI How is it measured? What does this mean and why is it key to our strategy?NTD Bus Collision Rate
NTD bus collision rate:
Number of NTD reportable collisions ÷ (Total number of bus miles operated ÷1,000,000)
The NTD collision rate is a subset of the Bus Collision Rate and is based on National Transit Database (NTD) Reporting criteria. It reflects bus collisions that result in injuries requiring transport for any involved vehicle or pedestrian; towaway of any involved vehicle; or total damages that cost $25,000 or more.
NTD-reportable collisions reflect a measure of serious bus collisions and represent an opportunity to fullyinvestigate the incident; determining causal factors and root causes. The NTD bus collision rate is an indicator ofhow well service is meeting this safety objective.
Bus Collision Rate
Bus collision rate:
Number of collisions ÷ (Number of bus miles operated ÷1,000,000)
A bus collision includes all incidents where the transit vehicle comes in contact with another vehicle, object or person, regardless of fault. Collisions impact the ability to adhere to the published route schedule, reduce bus service quality, and reliability.
Rail Collisions Number of rail collisions Rail collision incidents reflect any incident on the mainline or yard where a train, with or without customers, or a Roadway Maintenance Machine (RMM) makes contact with another vehicle, equipment, or object, and meet the NTD threshold of substantial damage.
The number of rail collision incidents is an indicator of how well Train and Equipment Operators and Rail Controllers are paying full time and attention to their operating environment and how efficient communications are from controllers to operators.
Derailments Number of derailments A derailment is a non-collision event that occurs when a train or other rail vehicle unintentionally comes off its rail, causing it to no longer be properly guided onto the railway.
The number of derailment incidents is an indicator of how well Train Operators and Rail Controllers are paying full time and attention to their operating environment and how efficient communications are from controllers to operators. Derailments are also an indicator of the state of good repair of both the right-of-way and rail vehicles (trains, RMMs, Flat Cars, Hi-Rail trucks).
298
Appendix I – Performance D
ata

SAFETY & SECURITYKPI How is it measured? What does this mean and why is it key to our strategy?
Fire Incidents Number of fire incidents Fire incidents consistent of any fire that occurs within the Metrorail system regardless if active suppression wasrequired. There are three main types of fires that occur within the Metrorail system: non-electrical (e.g., debris, rubbish such as leaves, newspapers), cable, arcing events (track components, train components) and stationequipment.
The number of fire incidents is an indicator of how well Metro is keeping its right of way clean and dry, and its equipment in state of good repair.
Red Signal Overruns
Number of red signal overruns Red signal overrun incidents reflect any time a train or equipment operator passes a red signal on the right-of-way (including in rail yards), or when the operator passes an employee on the roadway who's telling the train or Roadway Maintenance Machine (RMM) to not move any further.
The number of red signal overruns is an indicator of how well Train Operators and Rail Controllers are paying full time and attention to their operating environment and how efficient communications are from controllers to operators.
Bus Pedestrian Strikes
Number of pedestrian or cyclist strikes Bus pedestrian strikes counts include all incidents where the impact of a the transit vehicle with a person or cyclist causes immediate medical transport from the scene.
Appendix I – Performance D
ata
299

QUALITY SERVICEKPI How is it measured? What does this mean and why is it key to our strategy?
MyTripTime
MetrorailCustomer On-TimePerformance
Percentage of customer journeys completed on time
Number of journeyscompleted on time ÷Total number of
Rail Customer On-Time Performance (OTP) communicates the reliability of rail service, which is a key driver of customer satisfaction. OTP measures the percentage of customers who complete their journey within the maximum amount of time it should take per WMATA service standards. The maximum time is equal to the train run-time + a headway (scheduled train frequency) + several minutes to walk between the fare gates and platform. These standards vary by line, time of day, and day of the week. Actual journey time is calculated from the time a customer
journeys taps a SmarTrip® card to enter the system, to the time when the SmarTrip® card is tapped to exit.
Factors that can effect OTP include: railcar availability, fare gate availability, elevator and escalator availability, infrastructure conditions, speed restrictions, single-tracking around scheduled track work, railcar delays (e.g., doors), or delays caused by sick passengers.
Metrobus On-Time Performance
Percentage of bus service delivered on-time
Schedule-based routes = Number of time
Bus on-time performance (OTP) communicates the reliability of bus service, which is a key driver of customer satisfaction and ridership.
points delivered on time based on a window of 2 minutes early and 7 minutes late + Total number of time points delivered
Headway-based routes = Number of time points delivered within the scheduled headway + 3 minutes÷ Total number of time points delivered
► For schedule-based routes, OTP measures adherence to the published route schedule for delivered service.
► For headway-based routes, OTP measures the adherence to headways, or the time customers wait between buses. Headway-based routes include routes 70, 79, X2, 90, 92, 16Y, and Metroway.
Factors that can effect OTP include: traffic congestion, detours, inclement weather, scheduling, vehicle reliability, operational behavior, or delays caused by passengers.
MetroAccess On- Time Performance
Adherence to Schedule
Number of vehicle arrivals at the pick-up location within the 30 minute on-time widow ÷ Total trips delivered
This indicator illustrates how closely MetroAccess adheres to customer pick-up windows on a system-wide basis. Factors that effect on-time performance are traffic congestion, inclement weather, scheduling, vehicle reliability, and operational behavior. MetroAccess on-time performance is essential to delivering quality service to the customer.
300
Appendix I – Performance D
ata

QUALITY SERVICEKPI How is it measured? What does this mean and why is it key to our strategy?Rail Fleet Reliability
Mean Distance Between Delays (MDBD) The number of miles traveled before a railcar experiences a failure. Some car failures result in inconvenience or ., discomfort, but do not always result in a delay of service (such as hot cars). Mean Distance Between Delay includesTotal railcar revenue miles ÷
Number of failures during revenue service those failures that had an imPact on customer on-time performance.
resulting in delays of four or more minutes Mean Distance Between Failure and Mean Distance Between Delay communicate the effectiveness of Metro’srailcar maintenance and engineering program. Factors that influence railcar reliability are the age and design of the
Mean Distance Between Failure (MDBF) railcars, the amount the railcars are used, the frequency and quality of preventive maintenance, and the interaction
Total railcar revenue miles ÷ between railcars and the track.Total number of failures occurring duringrevenue service
Bus Fleet Reliability
Mean Distance Between Failures (MDBF) Mean Distance Between Failures is used to monitor trends in vehicle breakdowns that cause buses to go out ofThe number of total miles traveled before a service and to plan corrective actions. Factors that influence bus fleet reliability include vehicle age, quality ofmechanical breakdown requiring the bus maintenance program, original vehicle quality, and road conditions affected by inclement weather and roadto be removed from service or deviate construction.
from the schedule
Elevator and Escalator Availability
In-service percentage Escalator/elevator availability is a key component of customer satisfaction with Metrorail service. This measurecommunicates system-wide escalator and elevator performance (at all stations over the course of the day) and will
Hours in service Operating hoursvary from an individual customer's experience.
Hours in service = Operating hours - Hoursout of service Availability is the percentage of time that Metrorail escalators or elevators in stations and parking garages are in
service during operating hours.Operating hours = Operating hours per unit xnumber of units Customers access Metrorail stations via escalators to the train platform, while elevators provide an accessible path
of travel for persons with disabilities, seniors, customers with strollers, and travelers carrying luggage.
An out-of-service escalator requires walking up or down a stopped escalator, which can add to travel time and may make stations inaccessible to some customers. When an elevator is out of service, Metro is required to provide alternative services which may include shuttle bus service to another station.
Appendix I – Performance D
ata
301

Appendix I - Perform
ance Data
M
QUALITY SERVICEKPI How is it measured? What does this mean and why is it key to our strategy?Rail Infrastructure
(Federal Transit Administration Transit Asset Management Performance Measure)
Percentage of track segments with performance restrictions at 9:00 AM the first Wednesday of every month
Number of track miles withperformance restrictions ÷ 234 totalmiles
In 2016, the Federal Transit Administration (FTA) issued its Final Rule on Transit Asset Management, which requires transit properties to set targets and report performance on a variety of measures, including guideway condition. Guideway includes track, signals and systems.
A performance restriction occurs when there is a speed restriction: the maximum train speed is set below the guideway design speed. Performance restrictions may result from a variety of causes, including defects,
signaling issues, construction zones, and maintenance causes. FTA considers performance restrictions to be a proxy for both track condition and the underlying guideway condition.
Train On-Time Performance: Headway Adherence
Number of station stops delivered within the scheduled headway plus 2 minutes during rush (AM/PM) service ÷ Total station stops delivered
Number of station stops delivered up to 150% of the scheduled headway during non-rush (midday and evening) ÷ Total station stops delivered
Train on-time performance measures the adherence to weekday headways, or the time customers wait between trains. Factors that can effect on-time performance include: infrastructure conditions, missed dispatches, railcar delays (e.g., doors), or delays caused by sick passengers. Station stops are tracked system-wide, with the exception of terminal and turn-back stations.
Trains in Service Percentage of required trains that are in service at 8:15 AM and 5:00PM
Number of Trains in service ÷ Total required trains
Trains in Service is a key driver of customer on-time performance and supports the ability to meet the Board standard for crowding. WMATA’s base rail schedule requires 140 trains during rush periods. Fewer trains than required results in missed dispatches, which leads to longer wait times for customers and more crowded conditions. Key drivers of train availability include the size of the total fleet and the number of “spares’’, railcar reliability and average time to repair, operator availability, and balancing cars across rail yards to ensure that the right cars are in the right place at the right time.
Offloads Number of railcar offloads An offload is any time all passengers traveling on a train must get off the train for any un-scheduled reason (e.g., not a turnback or planned removal from service). Offloads are a key driver of customer on-time performance and communicates the impact of Metro's maintenance and engineering programs on customer service. Factors that influence railcar offloads are railcar performance, rail infrastructure performance, rail operations policies, and customer behavior.
M Q3/FY2020 METRO PERFORMANCE REPORT
302
302
Appendix I – Performance D
ata

QUALITY SERVICE KPI How is it measured? What does this mean and why is it key to our strategy?
Crowding Percentage of passenger time spent on vehicles exceeding crowding guidelines
Number of crowdedpassenger minutes ÷Total number ofpassenger minutes
Crowding is a key driver of customer satisfaction with Metrorail and Metrobus service. Crowding measures the percentage of passenger time spent on vehicles that exceed crowding guidelines per WMATA service standards:
► Metrorail: 100 passengers per car
► Metrobus: 120% of seated capacity during peak, 100% off peak [100% at all times on express routes]
Crowding informs decision making regarding asset investments, service plans and scheduling.Factors that can effect crowding include: service reliability, missed trips insufficient schedule, or unusual demand.
Customer Satisfaction
Survey respondent rating
Number of survey respondents with high satisfaction ÷ Total number of survey respondents
Surveying customers about the quality of Metro's service delivery provides a mechanism to continually identify those areas of the operation where actions to improve the service can maximize rider satisfaction.
Customer satisfaction is defined as the percent of survey respondents who rated their last trip on Metrobus or Metrorail as “very satisfactory” or “satisfactory.” The survey is conducted via phone with approximately 400 bus and 400 rail customers who have ridden Metro in the past 30 days. Results are summarized by quarter (e.g., January- March).
Appendix I – Performance D
ata
303

304
Appendix I – Performance Data
THIS PAGE INTENTIONALLY LEFT BLANK

Appendix J – Board Budget Resolution
305
Appendix J - Board Budget Resolution
Original Budget Resolution and Attachments April 2, 2020
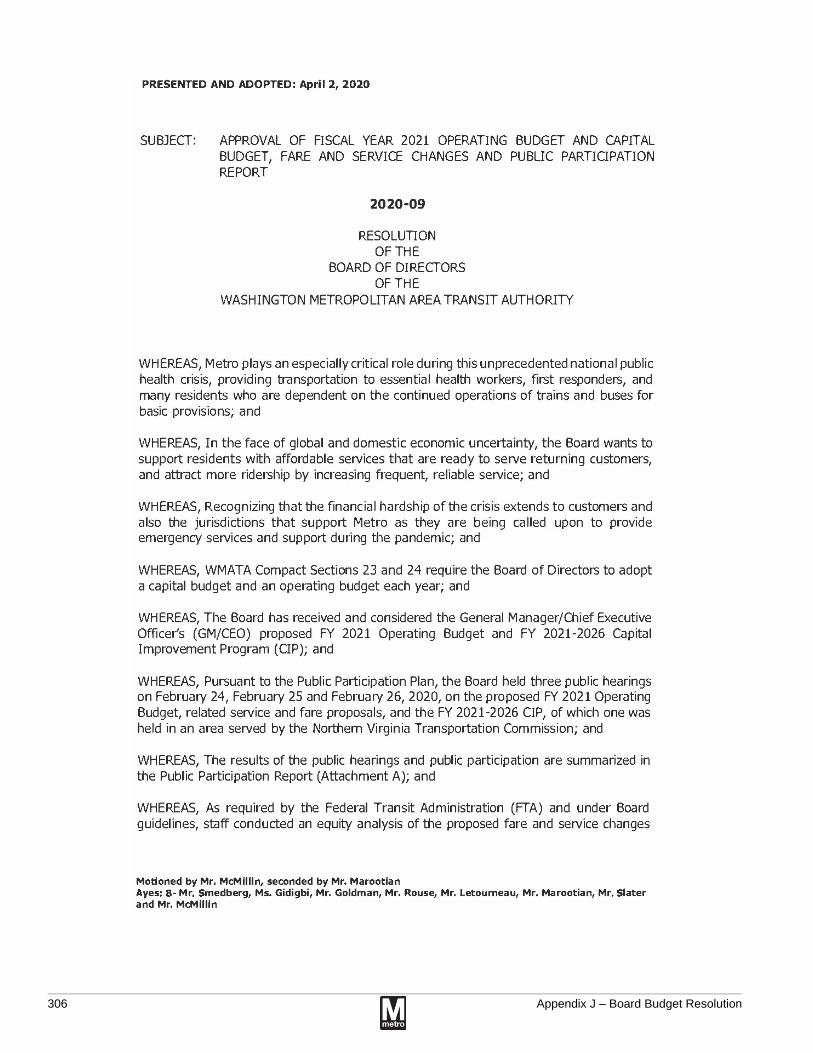
PRESENTED AND ADOPTED: April 2, 2020
SUBJECT: APPROVAL OF FISCAL YEAR 2021 OPERATING BUDGET AND CAPITAL BUDGET, FARE AND SERVICE CHANGES AND PUBLIC PARTICIPATION REPORT
2020-09
RESOLUTIONOF THE
BOARD OF DIRECTORSOF THE
WASHINGTON METROPOLITAN AREA TRANSIT AUTHORITY
WHEREAS, Metro plays an especially critical role during this unprecedented national public health crisis, providing transportation to essential health workers, first responders, and many residents who are dependent on the continued operations of trains and buses for basic provisions; and
WHEREAS, In the face of global and domestic economic uncertainty, the Board wants to support residents with affordable services that are ready to serve returning customers, and attract more ridership by increasing frequent, reliable service; and
WHEREAS, Recognizing that the financial hardship of the crisis extends to customers and also the jurisdictions that support Metro as they are being called upon to provide emergency services and support during the pandemic; and
WHEREAS, WMATA Compact Sections 23 and 24 require the Board of Directors to adopt a capital budget and an operating budget each year; and
WHEREAS, The Board has received and considered the General Manager/Chief Executive Officer's (GM/CEO) proposed FY 2021 Operating Budget and FY 2021-2026 Capital Improvement Program (CIP); and
WHEREAS, Pursuant to the Public Participation Plan, the Board held three public hearings on February 24, February 25 and February 26, 2020, on the proposed FY 2021 Operating Budget, related service and fare proposals, and the FY 2021-2026 CIP, of which one was held in an area served by the Northern Virginia Transportation Commission; and
WHEREAS, The results of the public hearings and public participation are summarized in the Public Participation Report (Attachment A); and
WHEREAS, As required by the Federal Transit Administration (FTA) and under Board guidelines, staff conducted an equity analysis of the proposed fare and service changes
Motioned by Mr. McMillin, seconded by Mr. MarootianAyes: 8- Mr. Smedberg, Ms. Gidigbi, Mr. Goldman, Mr. Rouse, Mr. Letourneau, Mr. Marootian, Mr. Slater and Mr. McMillin
M
306
Appendix J – Board Budget Resolution

(Attachment B) and determined that the proposed changes do not present a disproportionate burden on low-income customers nor a disparate impact on minority populations except for the reduced headway on Metrorail from 5:00 am to 6:00 am; and
WHEREAS, The reduced headway does not violate Title VI, is supported by minority customers and is mitigated by additional late night and Sunday rail service; and
WHEREAS, The WMATA Dedicated Funding Grant Agreement with the District of Columbia requires the Board to review and decide whether the most recent approved FTA Indirect Cost Rate is appropriate to apply to jurisdictional capital contributions; and
WHEREAS, The delay in opening Phase 2 of the Silver Line requires estimates of the revenues to be received from its operation during FY 2021; and
WHEREAS, Resolution 2012-29 established Metrorail headways; and
WHEREAS, WMATA's Metrorail hours of service currently are Monday-Thursday 5am- 11:30 pm; Friday 5am-1am; Saturday 7am-1am; and Sunday 8 am-11 pm; and
WHEREAS, Resolution 2010-31, adopted a 3/4 mile zone from fixed route service for the provision of MetroAccess Service; and
WHEREAS, Resolution 2019-09, which adopted the Keeping Metro Safe, Reliable &. Affordable Plan (KMSRA), and certain dedicated funding statutes require WMATA to keep jurisdictional operating subsidy growth at 3% annually, which further requires changes to previous policy resolutions, including Resolutions 79-39, 99-24 and 2003-50 on Operating Subsidy Interest, Audit Adjustments, and Operating Reserve Fund, respectively; and
WHEREAS, Resolution 2016-01, established the Claims Liability Fund to be continually funded at amounts specified therein; and
WHEREAS, Resolution 2019-09, approved a one-time capital funding contribution to support operating revenue losses caused by service disruptions associated with major capital projects; and
NOW, THEREFORE, be it
RESOLVED, Due to the scope of government imposed emergency measures such as office and business closures and travel restrictions, and the resulting impact on Metro's finances and ridership levels, the Board will review the approved fiscal year (FY) 2021 budget prior to its July 1, 2020 effective date, at which time the Board may reconsider the timing for the implementation of certain initiatives; and be it further
Appendix J – Board Budget Resolution
307

RESOLVED, That the Board approves the Public Participation Report on the proposed FY 2021 Operating Budget and FY 2021-2026 CIP, as detailed in Attachment A, and the Title VI equity analysis detailed in Attachment B; and be it further
RESOLVED, That the Board approves and adopts the FY 2021 Operating Budget (inclusive of all Operating Reimbursable projects) of $2,078 billion, with revenues, expenses, subsidies and statutory exemptions from subsidy calculation detailed in Attachments C and D computed by: (1) taking the FY 2020 subsidy allocations and adding three percent to each Signatory's allocation; (2) allocating the Signatory amounts by calculating the jurisdiction's percentage share of the applicable Signatory's amount using the Board- approved subsidy formulae; and (3) applying the Board-approved subsidy formulae to the legislative exclusions to the 3% subsidy increase limitation; and be it further
RESOLVED, That Resolution 2012-29 relating to Metrorail headways is amended by this Resolution and Resolution 2019-06 as to Metrorail hours of service hours for station closing and related supplemental bus service are superseded and the Board adopts the headway and service schedule and fares as detailed in Attachments E and F; and be it further
RESOLVED, That the Board authorizes the GM/CEO to continue the Rush Hour Promise program through June 30, 2021, with terms and conditions established by the GM/CEO; and be it further
RESOLVED, That as part of Attachment D, the Board adopts the regional estimate of Silver Line Phase 2 operating revenues with any shortfall in those revenues received and the estimated amount to be paid to WMATA by Regional Partners in FY 2022; and be it further
RESOLVED, That if: (1) any jurisdiction's paratransit expenses are less than such jurisdiction's budgeted paratransit amount due to a reduction in the number of MetroAccess trips attributable to that jurisdiction; and (2) WMATA's net expenses on Metrorail, Metrobus, and MetroAccess being favorable to WMATA's FY 2021 Operating Budget, the GM/CEO and Chief Financial Officer (CFO) are authorized to provide credits to such jurisdiction not to exceed the actual savings from such jurisdiction's budgeted paratransit amount on a schedule to be determined by the GM/CEO or CFO where credits are based on the per trip rate used by the innovative paratransit program; and be it further
RESOLVED, That Resolution 2010-31 is suspended until July 1, 2021 in regards to the % mile service area limitation and freezing the existing paratransit service area as it exists to allow staff to evaluate the impact of Metrobus service changes on paratransit service and to report to the Board by or before June 30, 2021, with MetroAccess service recommendations based on a review of (a) available fixed route service, (b) the
308
Appendix J – Board Budget Resolution

availability of subsidized alternatives to the MetroAccess service, and (c) demand for paratransit service; and be it further
RESOLVED, That the Board reserves the right, as part of this public hearing process, to revise fare and service changes approved in this Resolution prior to July 1, 2020 based on the expected budgetary impacts relating to the Coronavirus pandemic; and be it further
RESOLVED, That Resolution 79-39 is amended to delete the subsection titled "Fourth Quarter Adjustment" in its entirety and insert "Reserved" at subsection G; and be it further
RESOLVED, That Resolutions 99-24 and 2003-50, are rescinded in their entirety; and the Board authorizes the GM/CEO and CFO or their designee to establish an Operating Reserve within the 3% cap on operating subsidy growth for the purposes of managing operating surpluses and deficits; and be it further
RESOLVED, That the Board rescinds the ninth and tenth RESOLVED clauses of Resolution 2016-01; directs that the Operating Budget shall be prepared using an assumption of the actuarially forecasted claims payment in an amount that the GM/CEO deems appropriate; and authorizes the GM/CEO or his designee to fund the Claims Liability Fund in an amount deemed appropriate for FY 2021 and each fiscal year thereafter; provided, however, that the GM/CEO shall obtain concurrence from the Board each fiscal year prior to implementing the funding of the Claims Liability Fund; and be it further
RESOLVED, That the Board authorizes the GM/CEO to fund the OPEB trust in FY 2021 and subsequent fiscal years in an amount deemed appropriate and to establish an Obsolescence Reserve to be funded in an amount each fiscal year deemed appropriate for the purpose of recording the costs associated with disposal of unusable and unsaleable items; provided, however, that the GM/CEO shall obtain concurrence from the Board each fiscal year prior to implementing the funding of the OPEB trust and the funding of the Obsolescence Reserve; and be it further
RESOLVED, That the Board approves and adopts the FY 2021 Capital Budget of $1.786 billion (exclusive of all Capital Reimbursable projects in the amount of $89.000 million) and the FY 2021-2026 CIP of $10.113 billion (exclusive of $283.000 million Capital Reimbursable projects) as summarized in Attachments F and G and be it further
RESOLVED, That the Board approves the use of FTA grant and local matching funds in the amount of $60.000 million for eligible preventive maintenance expenditures through the FY 2021 Capital Budget; and be it further
RESOLVED, That the Board has considered the use of the most recent FTA-approved Indirect Cost Rate attached as Attachment H and determines that it is appropriate to
Appendix J – Board Budget Resolution
309

apply that rate to projects funded by jurisdictional capital contributions in the FY 2021 Capital Budget; and be it further
RESOLVED, That the Board approves a capital funding contribution of up to $17.000 million in capital funds to support operating revenue losses caused by service disruptions associated with major capital projects and efforts to prepare those projects for revenue service with any unused funds returned to the capital budget; and be it further
RESOLVED, That the Board authorizes the GM/CEO to reprogram within the capital budget any unused FY 2020 funds related to capital funding provided to support operating revenue losses caused by service disruptions associated with major capital projects; provided, however, that the GM/CEO shall obtain concurrence from the Board prior to any such reprogramming of capital funds back into the FY 2020 capital budget set aside to offset operating impacts of major capital projects; and be it further
RESOLVED, That $72.156 million of debt service payments resulting from the issuance of Series 2017A, 2017B, and 2018 bonds are due from and allocated to the participating jurisdictions as detailed in Attachment D; and be it further
RESOLVED, That, in order to implement the FY 2021 Capital Budget or the FY 2021 Operating Budget, the GM/CEO, the CFO, or their designees are authorized to: (1) file and execute grant applications and accept grants on behalf of WMATA for funds from the federal government and any other public or private entity regardless of whether a local match is required without further Board action, so long as the acceptance of such grant does not result in the increase in expenditures above the approved FY 2021-2026 CIP or the approved FY 2021 Operating Budget; (2) conduct public hearings at any time during FY 2021 in furtherance of the implementation of the FY 2021-2026 CIP; and (3) execute and file the annual FTA Certifications and Assurances as a prerequisite to the submission of federal grant applications; and be it further
RESOLVED, That the Board authorizes the GM/CEO to accept grant funding, above amounts listed in the FY 2020 Operating Budget and FY 2020-2025 CIP, without further Board action so long as there is no increase in the total annual expense budget authorization; and be it further
RESOLVED, That during FY 2021 the GM/CEO shall report to the Board all unbudgeted grant funds received on a quarterly basis; and be it further
RESOLVED, That the Board acknowledges that, in accordance with the terms of the Capital Funding Agreement (CFA), if any projects are started during the term of the CFA or any bonds or other financial instruments are issued pursuant to the CFA, the Contributing Jurisdictions have agreed to continue to make their Allocated Contributions for those projects or debt service until the conclusion of the projects or the final maturity of the bonds or other financial instruments; and be it finally
310
Appendix J – Board Budget Resolution

RESOLVED, That, to allow staff to timely shall be effective immediately.
apply for the coming FY's grants, this Resolution
Reviewed as to form and legal sufficiency,
Patricia Y. LeeGeneral Counsel
WMATA File Structure Nos.:
2.7 Delegation of Authority4.2.2 Fiscal Year Budgets9.12.9 Tariff/WMATA Fare Structure
Appendix J – Board Budget Resolution
311

ATTACHMENT A
PUBLIC OUTREACH & INPUT REPORTWashington Metropolitan Area Transit Authority
Docket B20-01: Proposed FY2021-2026Capital Improvement Program
Docket B20-02: Proposed FY2021 OperatingBudget and Related Service and Fare Proposals
312
Appendix J – Board Budget Resolution

Appendix J – Board Budget Resolution
313
Introduction
Metro’s proposed budget, beginning July 1, 2020, was developed to improve the
customer experience and fare option, and manage costs. Several fare and service
changes were proposed as part of the budget, summarized below:
Proposed Fare Changes Metrorail
• Increase peak fares
• Adjust Senior/Disabled fares to half of peak and off-peak fares
• Charge peak fare process after midnight
• Change a flat fare on weekends
• Simplify “mileage tiers”
• Add a surcharge at Dulles Airport Metrorail Station
Metrobus
• Lower the price of the 7-Day Regional Bus Pass
• Add a 25¢ surcharge for cash use
• Increase the fare on MetroExtra routes Metrorail + Metrobus
• Increase the transfer discount between Metrorail and Metrobus
• Add new Short-Trip and Weekend Passes
Proposed Service Changes Metrorail
• Restore late night hours
• Improve Sunday train frequency to match Saturday service
• Adjust weekday early morning service Metrobus
• Improve weekend service on high-ridership routes
• Improve MetroExtra service
• Adjust frequency and hours of service
• Eliminate “lifeline” late night and early morning service if Metrorail hours change
• Restructure and eliminate service
Details about the proposed changes, as well as the proposed Capital Improvement Program budget, can be found in WMATA Dockets B20-01 and B20-02 on wmata.com under About > Public Hearings & Meetings. The following report includes an overview of the public participation plan that was followed as well as a summary of the public feedback received.

314
Appendix J – Board Budget Resolution
Communications & Outreach Overview In order to encourage public feedback on the proposed budget, as well to fulfill the Board-approved Public
Participation Plan, Metro tailored a communications and outreach plan that focused on impacted
customers. The majority of the communications and outreach effort was concentrated within the official
public comment time period, Saturday, February 8 through Monday, March 9. The final plan included the
following efforts:
• Outreach events at stations, transit centers and bus stops
• Stakeholder engagement
• Targeted marketing and media
• Open houses and Compact Public Hearings
In order to best manage resources in the allotted amount of time, the majority of outreach efforts were
focused on the proposed changes that would have the greatest impact on riders. A demographic overview
of the impacted customers can be viewed in the Title VI equity analysis report.
Feedback was collected through the following sources during the public comment period:
• Online through the survey tool
• Oral and written testimony received at the Public Hearings
• Written comments received by the Board Secretary’s Office

Appendix J – Board Budget Resolution
315
OUTREACH EVENTS Outreach street teams, comprised of Metro staff and contractors, traveled to
various Metrorail stations, bus stops, and transit centers around the region during
the public comment period to notify customers about the proposals and
encourage them to provide feedback. Locations aligned closely with jurisdictional
station distribution and were chosen based on high average weekday, low-
income and minority ridership, high rail-to-bus transfers, and locations with
customers who were most impacted by the proposals. A complete list of the fifty
shifts is listed in Appendix A: Outreach Materials & Tools.
Street teams wore yellow Metro aprons, and those who were bilingual wore large
pins that identified them as speaking another language. At least half of all street
teams were fluent in Spanish, and some teams also had Amharic, French and
Korean speakers. Many teams included staff from the Office of Bus Planning who
could speak in detail about the proposed bus service changes.
Teams had a wide variety of materials and tools with them to help speak to the
proposals and encourage feedback:
• Over 106,400 brochures were distributed during the two weeks of
outreach events. The brochures summarized the fare and service
proposals and highlighted the multiple ways to provide feedback. The
brochure included language in both English and Spanish, and a statement
in Amharic, Chinese, French, Korean and Vietnamese about how to
receive information in their preferred language. It also included a QR code
for customers to scan and automatically go to the survey from their own
mobile device. A copy of the brochure is available in Appendix A:
Outreach Materials & Tools.
• At locations where there were bus routes that had service proposals,
teams had printed proposal maps to illustrate the proposed changes and
the travel alternatives.
• Tablets were available and used by the team to:
o Help customers understand the impact of the fare proposals to
their typical trip using the Fare Proposal Calculator in both English and Spanish. This can be
viewed in Appendix A: Outreach Materials & Tools.
o Push the survey link directly to a customer via email or text. 130 customers opted to receive
the survey link this way.
o Provide an opportunity for customers to take the survey. Not surprisingly, only 17 customers
opted to do this since the estimated timeframe to take the survey was at least 5-10 minutes.

316
Appendix J – Board Budget Resolution
STAKEHOLDER ENGAGEMENT Local stakeholders were key in getting the word out to their constituents about the proposed budget. Staff engaged with stakeholders in a variety of ways:
• The Accessibility Advisory Committee (AAC) was briefed by WMATA staff about the budget
proposal and discussed the budget at numerous meetings at WMATA headquarters on November
4, 2019; January 6, 13, and 30, 2020; February 3, 10, and 18, 2020.
• The Riders’ Advisory Council (RAC) was briefed by WMATA staff about the budget on September 4,
2019 and February 5, 2020. They also discussed the budget proposals and recommendations at
their January 8 and March 5, 2020 meetings.
• Employees were notified about the budget proposal and
encouraged to participate in the process through emails
from the General Manager on February 7 and February
28, 2020. All staff received a follow-up email on March 3,
2020 announcing that the public comment period had
been extended. Information about the proposed budget
was also included in Metrorail, Metrobus and Grounds
Maintenance & Custodial Services “hot sheets”,
newsletters that are shared with operations staff.
• Community Based Organizations (CBOs) and
community partners were notified about the budget
proposal by WMATA staff via email on February 24,
2020, requesting their comments and feedback on the
proposed Metro’s FY2021 Budget. This list included 443
unique individuals, working at 268 Community
Based Organizations, and Community
Base-like functioning institutions. This
message invited CBOs to meet with
Metro representatives, if necessary, to
provide additional feedback and also
included links to the bilingual survey,
information in languages other than
English for those CBOs serving various
linguistic minorities, and an invitation to
attend the open house and public
hearing. A second message was sent on
March 6, 2020 to remind CBOs that
were unable to attend the open house
and public hearing about the extension
of the public comment period and
approaching deadline to provide feedback via Metro’s online bilingual survey.

Appendix J – Board Budget Resolution
317
• Information about the budget proposal was sent via email to a stakeholder list through an email on
February 18, 2020. This list includes 2,900+ contacts, including places of worship, event venues,
business improvement districts, apartment and residences, schools, shopping areas, social
services, CBOs and more.
• Elected officials and agency staff at the local jurisdictions were provided extensive information from
WMATA staff about the budget proposal in numerous ways:
o Multiple email notifications were sent to lists of elected officials and agencies in the District
of Columbia, Maryland and Virginia to inform them of the budget docket and public comment
period between February 8 and March 3, 2020. WMATA staff answered many information
requests via email and phone from various constituents.
o WMATA staff had multiple face-to-face meetings with various officials. Between February 11
and 25, 2020, staff conducted individual briefings on proposals for DC Councilmembers
Mary Cheh, Robert White, Trayon White and Brandon Todd’s staff. There were also General
Manager Budget Briefings with key DC Councilmembers and Executive Branch between
January 29 and February 11, 2020, including Councilmember Robert White, Chairman
Mendelson, Councilmember Trayon White, Mayor Bowser and Councilmember Mary Cheh.
WMATA staff also briefed the Northern Virginia Transportation Commission (NVTC)
Management Advisory Committee (MAC) and participated in a Town Hall meeting on March
2, 2020 in Silver Spring convened by the Montgomery County Council’s Transportation and
Environment Committee.
o The Joint Coordinating Committee (JCC), comprised of staff from regional jurisdictions,
participated in two calls and a meeting to discuss the budget proposals with WMATA staff.
o An Advisory Neighborhood Commission (ANC) Forum was hosted at Metro Headquarters on
February 11, 2020, which allowed DC Commissioners to discuss proposals with WMATA
staff. Twelve Commissioners attended.

318
Appendix J – Board Budget Resolution
TARGETED MARKETING AND MEDIA
Metro used targeted marketing and media strategies to increase awareness and encourage feedback on
the proposed budget.
Website
The webpage wmata.com/budget was updated to reflect proposed FY2021 budget information:
• The wmata.com/budget webpages received over 42,750 view from over 34,500 unique viewers.
• The landing webpage included information in multiple
languages, including a link at the top to a translated page in
Spanish, wmata.com/budget_espansol and pdf flyers in
Amharic, Chinese, French, Korean, and Vietnamese.
• Information about how to provide feedback was listed,
including the link to the online survey and details about the
open houses and Public Hearings.
• There was a variety of content available for review, including
maps, the FY2021 Proposed Budget Book, bus service
proposal details for DC, Maryland, Virginia and late-night,
and the Notice of Public Hearing.
• A new fare proposal calculator tool was developed and linked
from the webpage. Available in English and Spanish, the tool
allowed a customer to enter in a trip to calculate their
proposed fare vs their current fare. Different fare proposals
could be toggled on and off, and the tool highlighted which
pass products could help the customer save money. There
were over 2,500 visits to the calculators from over 2,200
unique visitors. Screenshots of the calculators can be viewed
in Appendix A: Outreach Materials & Tools.
Paid Advertisements
Advertisements were placed in newspapers throughout the
region, including multi-lingual publications:
• The Washington Post (legal notice)- February 2 and 15, 2020
• The Afro - February 22, 2020
• El Tiempo Latino (Spanish) – February 14, 2020
• Washington Hispanic (Spanish) – February 21, 2020
• Atref (Amharic) – February 21, 2020
• Epoch Times (Chinese) – February 14, 2020
• Doi Nay (Vietnamese) – February 21, 2020
• Korean Times (Korean) – February 14, 2020

Appendix J – Board Budget Resolution
319
Print and Digital Sign Postings
Information about the proposed budget in
English and Spanish was posted throughout
the region. All printed signs included a QR
code.
• Signs were posted in Metrorail station
mezzanines.
• Brochures and signs were placed in
Bus Information Centers onboard
Metrobuses.
• Signs were posted in MetroAccess
vehicles.
• Real-time arrival signs at 330 bus
stops displayed information about the budget webpage.
• Over 130 signs listing specific proposals were posted at select bus stops of impacted routes.
Media Coverage
Besides the press releases that were published on February 14 and March 2,2020, there was extensive
media coverage around the proposed budget:
• There were over 150 stories in the local media from November 4 to March 9.
• The General Manager participated in one-on-one TV and radio interviews with WUSA9, ABC7,
NBC4 and FOX5.
• The primary news organizations that covered the budget proposal were:
o Print: Washington Post, Washington Times, Washington Business Journal, Washington City
Paper, Washingtonian, Springfield Connection
o TV: ABC7, WUSA9, NBC4, FOX5, WDVM, Telemundo, Montgomery Community Media
o Radio: WAMU, WTOP, WMAL
o Online / Blogs / Student papers: DCist, Bethesda Beat, Curbed DC, Greater Greater
Washington, Progressive Railroading, The DC Line, The DC Post, The Hoya, The Hatchet,
Capital News Service
Social Media Tactics
Multiple social media tactics were used to publicize the budget proposal and encourage feedback.
• Three MetroForward Facebook posts about the proposed budget reached 4,372 users and had 174
engagements.
• Six @wmata Twitter posts reached 113,237 users and received 967 engagements.
• Information posted on Nextdoor, a neighborhood social networking service, garnered 10,777
impressions.
Other Items
• Copies of the English and Spanish notices and dockets were sent to all jurisdictional libraries.
• The MetroAccess phone interactive voice response (IVR) was updated with announcements about the
upcoming public hearings.

320
Appendix J – Board Budget Resolution
OPEN HOUSES + COMPACT PUBLIC HEARINGS Metro hosted joint open houses and Compact Public Hearings for the proposed budget in the three
Compact jurisdictions. Each location was ADA accessible and conveniently located next to a Metrorail
station or bus line. Additional shuttle service was provided at the Maryland event. Materials and signage
were available in English and Spanish.
Open Houses
The open houses provided the opportunity for attendees to speak one-on-one with Metro staff about the
variety of proposals within the FY2021 budget. Subject matter experts in the following topic areas were
available: Operating Budget, Capital Improvement Program, Fare Changes, Metrorail Service Changes,
Metrobus Service Changes, and Customer Service. Tablets were also available for attendees to use the
fare calculator tool or take the survey on-site.
Compact Public Hearings
The Public Hearings followed WMATA’s standard Public Hearing procedures, beginning with a WMATA
Board Member reading a prepared statement outlining the Public Hearing process, and a Metro executive
presenting an overview of the proposal. Due to the large number of registered speakers at the Washington
DC event, the hearing ran concurrently in two separate rooms.

Appendix J – Board Budget Resolution 321
• * - denotes hearing officer
Event Dates & Locations Open House Attendees
Public Hearing Speakers
Public Hearing Metro Board Member Representatives
Public Hearing Metro Executive Representatives
Monday, February 24, 2020 Hilton Arlington 950 N. Stafford Street Arlington, VA 22203
Open House: 6:00 p.m. Public Hearing: 6:30 p.m.
57 59 Paul Smedberg* Dennis Anosike Jennifer Ellison
Tuesday, February 25, 2020 Metro Points Hotel 8500 Annapolis Road New Carrollton, MD 20784
Open House: 6:00 p.m. Public Hearing: 6:30 p.m.
49 30 Michael Goldman* Thomas Graham
Dennis Anosike Jennifer Ellison Tom Webster
Wednesday, February 26, 2020 Metro Headquarters Building 600 5th St NW Washington, DC 20001
Open House: 4:00 p.m. Public Hearing: 4:30 p.m.
109 106 Stephanie Gidigbi* Jeff Marootian Tom Bulger
Dennis Anosike Jennifer Ellison* Tom Webster

322
Appendix J – Board Budget Resolution
Online Survey
93%
Oral testimony
1%Written
Comments6%
PUBLIC INPUT RESULTS
Metro collected public input through surveys, written comments (through the survey tool or letters sent to
the Board Secretary’s Office), and oral testimony at the public hearings during the public comment period
from Saturday, February 8 through 9:00 a.m. Monday, March 9, 2020. Metro received over 17,000
responses to the proposed budget.
More than 93 percent of the input received came in using the survey tool. Analysis of public input collected
through responses to survey questions can be found in Appendix D: FY2021 Budget – Customer Feedback
on Proposed Service Changes and Fare Options. Another 6% of the input received was written comment,
with nearly all being provided through the survey tool via the upload or “provide written comment only”
choice. Written comments can be reviewed in Appendix C: Written Comments. Oral testimony at the public
hearing accounted for about 1% and can be reviewed in Appendix B: Public Hearing Oral Testimony.
PUBLIC INPUT SOURCES
Online survey 15,959
Written comments 1,044
Oral testimony 195
Total 17,198

John KuoE023756
I.
ATTACHMENT B
M M MSUBJECT: DATE: March 30, 2020
FROM:
THRU:
TO: GM/CEO - Paul J. Wiedefeld
Conclusion
Title VI Equity Analysis: Service and Fare Changes, FY 2021 Budget
This memorandum describes the methodology and findings of the Title VI equity analysis required for the fare changes and major service changes associated with the Fiscal Year 2021 Operating Budget.
Staff is seeking acceptance of the Title VI equity analysis required in order to change fares and service. This action item will be reviewed by the Finance and Capital Committee at the April 2 meeting.
Washington Metropolitan Area
Transit Authority
Digitally signed by Franklin Jones E025538 WMATA
-04'00"
Digitally signed by John Kuo E023756 WMATADN: c=US, D=Washington Metropolitan
In November 2019, the GM/CEO put forward a proposed FY2021 Operating Budget. Overall, the goals of the budget are to improve service and ridership through safe and on-time bus and rail services while ensuring that subsidies do not grow by more than three percent annually. Based on input from the public outreach process and consultations with the jurisdictions, the GM/CEO's revised budget proposal includes the following fare and service changes:
R A
Based on the Title VI equity analysis, staff has determined that the proposed fare changes and most of the service changes do not result in a disparate impact (DI) for minority populations or a disproportionate burden (DB) for low-income populations. The only exception is the change in headways during early morning hours (5:00 AM to 6:00 AM) on Metrorail, which results in a DI for minority customers. However, this change does not violate Title VI because Metro has a substantial legitimate justification for the proposed service change, and no less discriminatory alternative exists. It has support among minority customers, as 43 percent of minority customers surveyed during public outreach are in favor of the proposal compared to 33 percent against. Additionally, service during late-night periods and on Sundays acts as a mitigation to minority customers using Metro.
II. Fare and Service Change Proposals
Mmetro
I BOP — John T. Kuo E023756 WMATA Area Transit Authority, ou=People, cn= John Kuo E023756 WMATADate: 2020.03.30 18:03:05 -04'00"
From: FAIR - Franklin JonesFranklin Jones E025538 WMATA Date: 2020.03.30 19:30:20
E 0 N D U
Appendix J – Board Budget Resolution 323
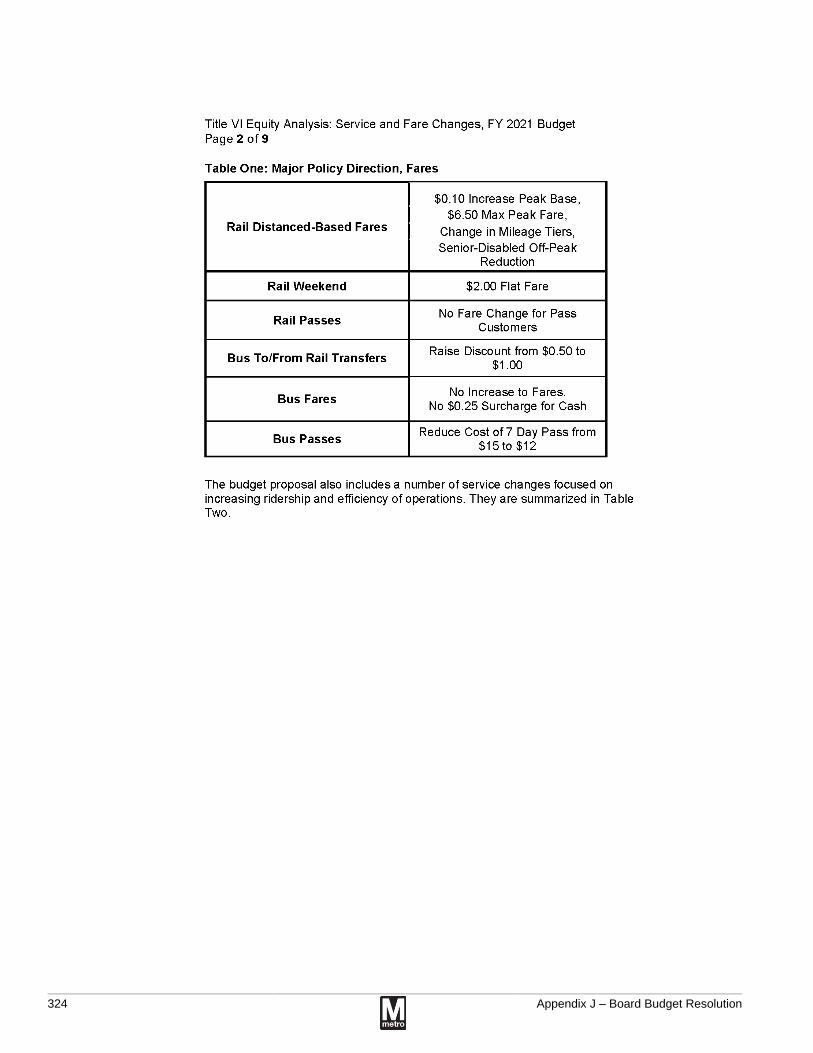
Title VI Equity Analysis: Service and Fare Changes, FY 2021 BudgetPage 2 of 9
Table One: Major Policy Direction, Fares
Rail Distanced-Based Fares
$0.10 Increase Peak Base, $6.50 Max Peak Fare,
Change in Mileage Tiers, Senior-Disabled Off-Peak
Reduction
Rail Weekend $2.00 Flat Fare
Rail Passes No Fare Change for Pass Customers
Bus To/From Rail Transfers Raise Discount from $0.50 to$1.00
Bus Fares No Increase to Fares.No $0.25 Surcharge for Cash
Bus Passes Reduce Cost of 7 Day Pass from $15to $12
The budget proposal also includes a number of service changes focused on increasing ridership and efficiency of operations. They are summarized in Table Two.
324
Appendix J – Board Budget Resolution

Title VI Equity Analysis: Service and Fare Changes, FY 2021 BudgetPage 3 of 9
Table Two: Major Service Changes
Rail Service
Increase Headway* on Weekdays 5 AM to 6 AM from 8 to 12
minutes,Decrease Headways on Sundays
to Match Saturdays,Extend Operating Hours by 30
Mins. Mon-Thurs,Extend Hours by 60 Mins. Friday
and Saturday Late-Nights
Bus Service
Add Saturday and Sunday Service on Various Routes,
Add Weekday Service on Four MetroExtra Routes,
Eliminate service on routes with low ridership or redundant service
including 5A, TAGS**, Z8, Z11,B29, and B30
Reduce frequency and span on certain routes including some late-
night bus trips*A headway is the time between trains. Increasing the headway means trains come less frequently.**TAGS: Transportation Association of Greater Springfield circulator bus (Metrobus Routes S80 and S91).
III. Title VI Analysis
When a transit agency proposes a fare change or a major service change, the Federal Transit Administration (FTA), in its Title VI Circular 4702.1 B, requires that the agency conduct an equity analysis to determine whether the service or fare change will result in a disparate impact (DI) for minority riders or a disproportionate burden (DB) for low-income riders. In conducting this equity analysis, Metro used the following survey and operations data to determine which populations would be affected by the proposed fare and service changes:
• 2016 Travel Trends Rail Passenger Survey (Spring 2016)• Supplemental Survey of Sunday Rail Ridership (Fall 2016)• 2018 Metrobus Passenger Survey (Fall 2018)• Metrorail and Metrobus ridership and revenue data (Fall 2019)• Public Outreach Survey for FY 2021 Budget (Early 2020)
a. Fare Equity Analysis
In Resolution 2013-27, the Board approved Metro’s DI/DB thresholds. For fare changes, the DI/DB threshold is five percent, meaning that the average fare
Appendix J – Board Budget Resolution
325

Title VI Equity Analysis: Service and Fare Changes, FY 2021 BudgetPage 4 of 9
increase or decrease for minority/low-income riders cannot exceed the average fare increase or decrease for non-minority/non-low-income riders by more than five percent.
To assess fare impacts, staff first calculated the average fare paid for bus and rail customers by demographic group on a typical weekday. To accomplish this, staff calculated the fare paid by each rail customer for each trip on rail by time of day (peak vs. off-peak) and by fare categories (regular fare, senior/disabled fare, passes) and divided that by the number of customers in each category to create an average fare paid per trip. The data is then merged with survey data for the same trips and/or fare categories to create an average fare paid by demographic group (minority vs. non-minority, low income vs. non-low income). On bus, the process is simpler, in that fares do not vary by time of day, only by the type of service (regular, express and airport) and by fare category (regular fare, senior/disabled fares, passes).
Future fares are calculated in the same way, except that the proposed fare policy changes are used in place of the current fares. The current average fare is then compared to the proposed average fare to determine the percentage change in fare by demographic group. The following tables summarize the results for each proposal currently under consideration:
Table Three: DI/DB Test, Fare Proposal
MinorityNonMinority
Low- Income
Non-Low- Income
Fare Change, Bus -7.1% -6.1% -6.4% -7.2%Fare Change, Rail -1.6% 0.7% -7.5% 0.5%System Average -3.1% 0.2% -7.0% -0.3%Difference -3.3% -6.7%DI/ DB No No
As shown on Table Three, the fare proposal under consideration would reduce the average fare paid by minority and low-income customers more than the proposal would reduce the average fare for their non-minority and non-low- income counterparts. This is due in large part to the increase of the bus/rail transfer discount. Therefore, the proposal does not result in a DI for minority customers or in a DB for low-income customers.
b. Service Equity Analysis
When Metro proposes a major service change, the FTA requires that Metro conduct a Title VI equity analysis. This includes additions to service, like the current proposals to increase the operating hours and the train frequency increase on Sundays. When adding service, the equity analysis assesses whether the added service benefits minority and low-income customers in the
326
Appendix J – Board Budget Resolution

Title VI Equity Analysis: Service and Fare Changes, FY 2021 BudgetPage 5 of 9
same way as all other customers, testing to see if there is a DI or DB.
To determine whether the proposed service changes would result in a DI for minority populations or a DB for low-income populations, staff used Metro’s Board-approved DI/DB thresholds adopted in Resolution 2013-27 (see Table Four).
Table Four: DI/DB Service Thresholds
Total Daily Riders Impacted Threshold for Significant Disparity
Up to 10,000 8%
10,001 to 20,000 7%
20,001 to 40,000 6%
Over 40,000 5%
Metrorail Service ReductionsUsing customer survey data, Metro staff calculated the percentage of minority and low-income customers impacted by the proposal to increase scheduled service headways from eight minutes to 12 minutes from 5:00 AM to 6:00 AM on weekdays. Because the proposed service change affects rail customers, Metro then compared that percentage to the system-wide profile for Metrorail (44.8 percent minority; 12.6 percent low-income). The number of daily riders impacted falls between 10,000 and 20,000. Therefore, the DI/DB threshold for this action is seven percent.Table Five: DI/DB Test, Change in Rail Headways 5AM to 6AM
Minority Impacted Trips
Low-Income Impacted Trips
Impacted Ratio 53.3% 10.1%System Average 44.8% 12.6%Difference 8.5% -2.5%Threshold 7.0% 7.0%DI or DB Yes No
As shown in Table Five, the proposal impacts a higher proportion of minority customers than the system average. This difference exceeds the seven percent threshold; therefore, there is a DI. See the Title VI Discussion later in the document for additional details.
The proposal impacts a lower proportion of low-income customers than the system average. Therefore, there is not a DB for low-income customers.
Appendix J – Board Budget Resolution
327

Title VI Equity Analysis: Service and Fare Changes, FY 2021 BudgetPage 6 of 9
Metrorail Service IncreasesThe proposal includes an increase in late-night service hours on weekdays, Fridays and Saturdays. The proposal also includes more frequent Sunday service. Since this proposal affects an entire service day, Sunday, the daily ridership impacted is over 40,000. Therefore, the DI/DB threshold is five percent.
Using survey data, Metro staff calculated the percentage of minority and low- income customers benefiting from the proposal. Because the proposed service change affects rail customers, Metro then compared that percentage to the system-wide profile for Metrorail (44.8 percent minority; 12.6 percent low- income).
Table Six: DI/DB Test, Late-Night and Sunday Metrorail Service Increases
Minority Impacted Trips
Low-IncomeImpacted Trips
Impacted Ratio 61.4% 30.7%System Average 44.8% 12.6%Difference 16.6% 18.1%Threshold -5.0% -5.0%DI or DB No No
As shown in Table Six, the service proposal benefits a higher proportion of minority and low-income customers than the system average. Therefore, the proposal does not result in a DI for minority customers and does not result in a DB for low-income customers.
Metrobus Service ReductionsThe proposal includes the elimination of some bus service to improve service efficiency. The proposal includes eliminations of service on some routes with low ridership or on routes that duplicate other service. The current proposal includes the following routes in this category: 5A, TAGS, Z11, Z8, B29, and the B30. Most customers affected by the changes on these routes have other travel options on transit.
The proposal also includes reductions in frequency or span on a select number of other routes. Overall, the proposal impacts approximately 3,000 customers each weekday. Therefore, the DI/DB threshold is eight percent.Using Metrobus survey data, Metro staff calculated the percentage of minority and low-income customers impacted by the proposal. Because the proposed service change affects bus customers, Metro then compared that percentage to the system-wide profile for Metrobus (80.7 percent minority; 46.4 percent low- income).
328
Appendix J – Board Budget Resolution

Title VI Equity Analysis: Service and Fare Changes, FY 2021 BudgetPage 7 of 9
Table Seven: DI/DB Test, Bus Service Reductions
Minority Impacted Trips
Low-Income Impacted Trips
Impacted Ratio 80.9% 40.3%System Average 80.7% 46.4%Difference 0.2% -6.1%Threshold 8.0% 8.0%DI or DB No No
As shown in Table Seven, the proposal impacts a slightly higher proportion of minority customers than the system average. However, this difference (of 0.2 percent) is below the 8.0 percent threshold. Therefore, there is not a DI for minority customers. The proposal impacts a lower proportion of low-income customers than the system average. Therefore, there is not a DB for low-income customers.
Metrobus Service IncreasesThe proposal includes additional weekend service on certain routes with high ridership, and additional weekday service on four MetroExtra routes. On any given service day, the number of benefiting customer trips is below 10,000; therefore, the DI/DB threshold is eight percent.
Using Metrobus survey data, Metro staff calculated the percentage of minority and low-income customers benefiting from the proposal. Because the proposed service change affects bus customers, Metro then compared that percentage to the system-wide profile for Metrobus (80.7 percent minority; 46.4 percent low- income).
Table Eight: DI/DB Test, Metrobus Service Increases
Minority Impacted Trips
Low-IncomeImpacted Trips
Impacted Ratio 90.6% 57.6%System Average 80.7% 46.4%Difference 9.9% 11.2%Threshold -8.0% -8.0%DI or DB No No
As shown in Table Eight above, the service proposal benefits a higher proportion of minority and low-income customers than the system average. Therefore, the proposal does not result in a DI for minority customers and does not result in a DB for low-income customers.
Appendix J – Board Budget Resolution
329

Title VI Equity Analysis: Service and Fare Changes, FY 2021 BudgetPage 8 of 9
Title VI Discussion - Disparate ImpactPursuant to FTA Title VI Circular, Metro may implement a proposed service change that will result in a DI for minority populations if Metro:
(1) has a substantial legitimate justification for the proposed change; and
(2) can show that there are no alternatives that would have a less disparate impact on minority riders but would still accomplish Metro’s legitimate program goals.
Although the proposal to reduce service levels on Metrorail between the hours of 5:00 AM and 6:00 AM results in a disparate impact, implementing this service change would not violate Title VI because: (1) Metro has a substantial legitimate justification for the proposed service change; and (2) no less discriminatory alternative exists. Furthermore, minority customers support the proposal, and additional service during late-night periods and on Sundays acts as a mitigation to minority customers using Metro.
Substantial Legitimate Justification: There is a substantial legitimate justification for this action as it helps Metro improve operations, offer more service, and achieve more reliable service while resulting in a minimal impact to the customer. Specifically:
• The 12-minute headway helps Metro “ramp up” service over a full hour rather than immediately at system opening as under the current 8-minute headway, making it easier to clear overnight track work. This contributes to Metro's ability to offer more service hours and reduces disruptions that could occur with late track clearance, improving service reliability.
• The three percent cap mandates that Metro look for ways to ensure that service is as efficient as possible to control operating costs, such as reducing service in low ridership periods.
• No one will be denied service by this action. Trains will still operate during this time period.
• At worst, the average change in wait time would only increase by two minutes (from four to six minutes). At stations served by multiple lines, the change in wait time would be even less.
• The proposal would not result in significant changes in crowding levels, as trains would continue to operate below guidelines for passenger load, with load factors below the 100 passengers per car guideline.
No Less Discriminatory Alternative: Metro has examined alternatives to reducing early morning service levels, including cutting service during peak periods or cutting service during mid-day. Cutting service during peak periods would impact too many customers. During mid-days, the Metrorail system already operates at a 12-minute headway. Thus, cutting service during this time
330
Appendix J – Board Budget Resolution

Title VI Equity Analysis: Service and Fare Changes, FY 2021 BudgetPage 9 of 9
period would result in a significant loss of service to customers that already have longer wait times than early morning customers and is not practical.
Metro could elect to not modify the early morning service. However, the operational benefits contribute to Metro’s ability to offer more service hours and resources saved by reducing service levels early in the morning are being used to provide more service during time periods that minority (and low-income) customers are far more likely to use Metro: late-nights and on Sundays. As discussed below, this is a far greater benefit to these customers overall.
Support among Minority Customers. Minority and other customers support the reduction in early morning service levels. According to customer survey data collected as part of FY2021 Budget Outreach, approximately 43 percent of all minority customers who responded on this topic are either strongly or moderately in favor of this service reduction. This is compared to 33 percent who are strongly or moderately against the service reduction. This trend is true for the general population as well as low-income customers.
Mitigation. The addition of late-night and Sunday service acts as a mitigation. As discussed in the prior section, 61 percent of those benefiting from the additional service are minority and 31 percent are low-income. This is well above the percentage of minority and low-income customers that are adversely impacted by reduction in service (53 percent minority and 10 percent low- income). In total, staff estimates that over 10 million customers will benefit from this new service, compared to the less than 3 million adversely impacted by the early morning reduction in service.
Public Outreach
In accordance with the Title VI Circular 4702.1 B, staff conducted public outreach and considered public feedback on the proposed fare change. The full Public Outreach Report is attached to the Board Action Information Summary. Staff considered the results of the public outreach when conducting this analysis.
Appendix J – Board Budget Resolution
331

Attachment C
Mmetro
FY2021 OPERATING BUDGET
1Total Revenues/ Total Expenses
(Dollars in Thousands)Total
with ReimbSubsidized
Total BUS RAIL ACCESS REIMB
REVENUESPassenger $677,755 $677,755 $117,812 $551,275 $8,668 $0Parking $44,509 $44,509 $0 $44,509 $0 $0Advertising $35,800 $35,800 $8,940 $26,860 $0 $0Joint Development $17,750 $14,644 $0 $14,644 $0 $3,106Fiber Optics $19,460 $18,777 $0 $18,777 $0 $684Other $36,197 $32,220 $3,124 $29,096 $0 $3,977
Total Revenues $831,472 $823,706 $129,876 $685,162 $8,668 $7,766
EXPENSESPersonnel $1,393,590 $1,387,919 $536,470 $837,546 $13,904 $5,671Services $388,915 $387,245 $66,975 $150,909 $169,361 $1,671Materials & Supplies $107,742 $107,317 $27,663 $78,892 $762 $425Fuel (Gas/Diesel/CNG) $31,939 $31,939 $22,553 $3,684 $5,702 $0Utilities & Propulsion $105,793 $105,793 $11,645 $93,378 $770 $0Casualty & Liability $32,260 $32,260 $8,786 $22,890 $584 $0Leases & Rentals $11,036 $11,036 $2,657 $7,394 $985 $0Miscellaneous $6,505 $6,505 $780 $5,589 $136 $0
Total Expenses $2,077,781 $2,070,015 $677,529 $1,200,282 $192,204 $7,766
NetSubsidy $1,246,310 $1,246,310 $547,654 $515,120 $183,536 $0
Cost Recovery Ratio1 39.8% 19.2% 57.1% 4.5%
332
Appendix J – Board Budget Resolution

ATTACHMENT D: FY2021 Summary of State/Local Operating Requirements
FY2020 BaseFY2021 Capped Change %
Legislative Exclusions
Change%
Silver Line Phase 2
FY2021 Total Subsidy
TotalChange %
Debt Service
Jurisdictional Contribution
District of Columbia $407,765,902 $419,998,879 3.0% $2,079,419 0.5% $25,892,842 $447,971,141 9.9% $33,267,125 $481,238,266
Montgomery County $189,124,318 $190,358,776 0.7% $1,622,723 0.9% $13,748,799 $205,730,298 8.8% $15,406,871 $221,137,169
Prince George's County $242,610,897 $254,328,496 4.8% $3,476,973 1.4% $12,340,775 $270,146,243 11.3% $15,806,488 $285,952,731
Maryland Subtotal $431,735,215 $444,687,272 3.0% $5,099,696 1.2% $26,089,573 $475,876,541 10.2% $31,213,359 $507,089,900
City of Alexandria $45,835,235 $47,885,869 4.5% $112,636 0.2% $3,657,319 $51,655,824 12.7% $1,774,830 $53,430,654
Arlington County $78,160,432 $79,025,489 1.1% $150,169 0.2% $7,321,818 $86,497,475 10.7% $0 $86,497,475
City of Fairfax $2,486,758 $2,728,923 9.7% $26,195 1.1% $238,364 $2,993,482 20.4% $111,451 $3,104,932
Fairfax County $156,043,184 $158,429,291 1.5% $1,123,321 0.7% $12,732,683 $172,285,295 10.4% $5,613,058 $177,898,353
City of Falls Church $3,449,375 $3,314,749 (3.9%) $11,266 0.3% $196,824 $3,522,838 2.1% $176,178 $3,699,016
Loudoun County $0 $3,169,912 100.0% $20,252 100.0% $2,316,758 $5,506,922 100.0% $0 $5,506,922
Virginia Subtotal $285,974,984 $294,554,233 3.0% $1,443,839 0.5% $26,463,765 $322,461,837 12.8% $7,675,516 $330,137,353
Total Contribution $1,125,476,101 $1,159,240,384 3.0% $8,622,954 0.8% $78,446,181 $1,246,309,519 10.7% $72,156,000 $1,318,465,519
1. The base subsidy model was adjusted to prorate Loudoun County for one quarter of Silver Line Operations2 Applicable costs for Metrobus Routes 16E, B29, and B30 that are funded by management actions are not included in calculation of the Subsidy Allocation
Appendix J – Board Budget Resolution
333

Appendix J – Board Budget Resolution
334
ATTACHMENT E: SERVICE CHANGES
Metrorail Service Changes
1. Better Weekend Metrorail Service: Operate Saturday Headways on Sundays
Reduce Orange/Silver/Yellow/Green/Blue Line Sunday daytime headway from 15 minutes to 12 minutes. Reduce Red Line Sunday daytime headways from 8 minutes to 6 minutes.
2. Restore Rail Late Night Hours: Add Four Hours of Service Per Week
Trains would operate an additional four hours per week; staying open 30 additional minutes Monday through Thursday (until midnight) and
one additional hour on Fridays and Saturdays (until 2:00 a.m.).
3. Weekday Early Morning Right-sizing: Widen Weekday Headway before 6 a.m.
Increase weekday headways on all lines before 6:00 a.m. from 8 minutes to 12 minutes.

Metrobus Service Changes
Weekend Service Improvements
Route Name Day(s) Proposed Service Change(s) Jurisdictions Served
80 North Capitol Street Sat/Sun
Increase frequency from 30 minutes to 20 minutes DC
83,86 College Park Sat/Sun
Increase frequency from 60 minutes to 30 minutes (15 minutes in combined section) DC, PG
A12 Martin Luther King Jr.Highway
Sun Increase frequency to match Saturday (every 45 minutes) PG
C29 Central Avenue Sat/Sun
Increase frequency from 60 minutes to 30 minutes PG
E4 Military Road- Crosstown Sat /Sun
Increase frequency from every 24 minutes on Saturday and every 30 minutes on Sunday to every 20 minutes
DC
F4 New Carrollton-Silver Spring Sat /Sun
Increase frequency from every 24 minutes on Saturday and every 30 minutes on Sunday to every 20 minutes
MG, PG
P6 Anacostia-Eckington Sat /Sun
Increase frequency from every 35 minutes to every 20 minutes DC
P12 Eastover-Addison Road Sun Increase frequency to match Saturday (every 20 minutes) DC, PGS2 16th Street Sun Increase frequency to match Saturday (every 20 minutes) DC, MG59 16th Street Limited Sun Increase frequency to match Saturday (every 20 minutes) DC, MGY2, Y8 Georgia Avenue-MD Sat /
SunIncrease frequency from every 24 minutes to every 20 minutes MG
7A,7F Lincolnia-North Fairlington Sun Increase frequency to match Saturday (every 30 minutes) AR, AX
23B,23T
McLean-Crystal City Sun Increase frequency from 60 minutes to 30 minutes (15 minutes in combined section) AR, AX, FX
28A Leesburg Pike Sun Increase frequency to match Saturday (every 20 minutes) AX, FX
Appendix J – Board Budget Resolution
335

MetroExtra Improvements
Route Name Day(s) Proposed Service Change(s) Jurisdictions Served
79 Georgia Avenue Limited Mon-Fri Extend PM service 3 hours to 10 PM DC, MG
X9 Benning Road-H Street Limited
Mon-Fri Add additional peak period trips. Extend PM peak period 1 hour to 7:45 PM DC, PG
K9 New Hampshire Avenue Limited
Mon-Fri Add midday service DC, MG, PG
16Y Columbia Pike-Farragut
Square
Mon-Fri Extend AM peak period 1 hour to 10:00 AM. Extend PM peak period 1 hour to
8:15 PMDC, AR
336
Appendix J – Board Budget Resolution

Efficiencies and Restructuring
Route Nome Category Proposed Service Change(s) JurisdictionsServed
92 U Street ■ Garfield Redundancy Eliminate short trips ending at Eastern Market. DCD4 Ivy City- Franklin Square Frequency/Span Eliminate service after 10 PM DC
D6 Sibley Hospital-Stadium Armory
Frequency/Span Eliminate certain late-night trips on weekdays and Saturday DC
E2 Ivy City - Fort Totten Frequency/Span Eliminate service after 10 PM DC
C4 Greenbelt-Twinbrook Frequency/Span Reduce late-night span on weekdays MG, PG
J2 Bethesda-Silver Spring Frequency/Span Reduce late-night span on weekdays MG
K6 New Hampshire Ave- MD Frequency/Span Reduce late-night span on weekdays DC, MG. PG
L8 Connecticut Ave.-MD Frequency/Span Reduce early morning and evening span on weekdays DC, MG
NH2 National Harbor- Alexandria Redundancy Eliminate route segment from King St.-Old Town to Huntington. Reduce frequency.
PG, AX, FX
T2 River Road Frequency/Span Reduce early morning and evening span on weekdays DC, MG
Y2 Georgia Ave.-MD Frequency/Span Reduce late-night span on weekdays MGZ6 Calverton-Westfarm Redundancy Extend service to Greencastle to replace part of the Z8 line. Add additional
frequency to rep ace Z8 trips. Eliminate service toBurtonsville.
MG
Z8 Fairland Redundancy Eliminate entire line MGZ11 Burtonsville- Greencastle
ExpressRedundancy Eliminate entire line MG
3T Pimmit Hills Low Ridership Eliminate segment between West Fa Is Church and East Falls Church when current grant funding expires in December 2020
FC, FX
5A DC-Dulles Redundancy Eliminate entire line when Silver Line Extension opens for revenue service DC, AR, FX
S80, S91 Springfield Circulator- Metro Park Shuttle
Low Ridership Eliminate entire line in December 2020 FX
Appendix J – Board Budget Resolution
337

Bus Lifeline Service Adjustment
Route Name Day(s) Proposed Service Change(s) Jurisdiction Served
30N,30S
Friendship Heights-Southeast
Weekday Sat/Sun
Eliminate the last trip each direction on Route 30N weekday, Saturday and Sunday and the last trip each direction on Route 30S on weekdays and Saturdays
DC, PG
80 North Capitol Street Fri / Sat /
Sun
Eliminate the last 2 trips each direction DC
96 East Capitol Street- Cardoza
Fri / Sat Eliminate the last westbound trip on Fridays and the last eastbound trip on Fridays and Saturdays. The remaining last trip on Saturdays will terminate at U & 14th Sts.
NW
DC, PG
G8 Rhode Island Avenue Fri / Sat Eliminate all trips operating to/from Rhode Island Avenue Station DC, PG
H4 Crosstown Fri / Sat /
Sun
Eliminate the last trip each direction DC
P6 Anacostia- Eckington Weekday Sat / Sun
Eliminate service between 2 am and 4 am DC
W4 Deanwood - Alabama Avenue
Weekday Sat/Sun
Eliminate the last northbound trip on weekdays, Saturday and Sunday. Eliminate the last southbound trip on Saturday and Sunday.
DC
2A Washington Blvd.-
Dunn Loring
Fri / Sat Eliminate the last trip each direction AR, FC, FX
10A, 10N
Alexandria- Pentagon Fri / Sat /
Sun
Eliminate the last 10A trip each direction. Eliminate the entire Route 10N. AR, AX
338
Appendix J – Board Budget Resolution

ATTACHMENT F: FARE CHANGES
CURRENT FY2021 ProposedMetrorail Fares______________________________________________Fares/Fees_________ Fare OptionsPeak Fares11 ■ Boarding charge (up to 3 miles) $2.25 $2.352 ■ Composite miles between 3 and 6 miles $0.326 no change3 ■ Composite miles over 6 miles $0.288 $0.3264 ■ Maximum peak fare $6.00 $6.505 ■ Charge for senior/disabled is one-half peak fare $1.10-$3.00 $1.15-$3.25
Off-Peak Fares26 ■ Boarding charge (up to 3 miles) $2.00 no change7 ■ Composite miles between 3 and 6 miles $0.244 $0.2168 ■ Composite miles over 6 miles $0.216 no change9 ■ Maximum off-peak fare $3.85 no change
10 ■ Weekend Flat Fare3 $2.00 - $3.85 $2.0011 ■ Charge for senior/disabled is one-half the fare during off-peak $1.10-$3.00 $1.00-$1.90
Unlimited Combo Passes12 ■ Monthly unlimited passes4 varies no change13 ■ 1-day unlimited pass $13.00 no change14 ■ 3-day unlimited pass $28.00 no change15 ■ 7-day short-trip unlimited pass $38.00 no change16 ■ 7-day unlimited pass $58.00 no change
Other Rail Fares17 ■ Bus-to-rail transfer utilizing SmarTrip® card $0.50 discount $1.00 discount18 ■ Monthly TransitLink Card on MARC and VRE5 $114.00 no change19 ■ Monthly TransitLink Card on MTA5 $176.00 no change20 ■ Surcharge on Entry/Exit for station improvements, two $0.05 no change
stations per Compact jurisdiction6
Regular FaresMetrobus Fares
21 ■ Cash boarding charge for local bus $2.00 no change22 ■ Cash boarding charge for express bus $4.25 no change23 ■ Cash boarding charge for designated airport routes $7.50 no change24 ■ SmarTrip® boarding charge for local bus $2.00 no change25 ■ SmarTrip® boarding charge for express bus $4.25 no change26 ■ SmarTrip® boarding charge for designated airport routes $7.50 no change
Senior/Disabled: One-Half Regular Fares27 ■ Cash boarding charge for local bus $1.00 no change28 ■ Cash boarding charge for express bus $2.10 no change29 ■ Cash boarding charge for designated airport routes $3.75 no change30 ■ SmarTrip® boarding charge for local bus $1.00 no change31 ■ SmarTrip® boarding charge for express bus $2.10 no change32 ■ SmarTrip® boarding charge for designated airport routes $3.75 no change
Cash Upload to SmarTrip®33 ■ Surcharge for cash upload to SmarTrip® on board bus $0.00 no change
Appendix J – Board Budget Resolution
339

Bus Transfers utilizing SmarTrip® card34 ■ Local to local bus free no change35 ■ Local to express bus $2.00 discount no change36 ■ Local to designated airport routes $2.00 discount no change37 ■ Rail-to-bus transfer $0.50 discount $1.00 discount38 ■ Transfer from MARC, VRE, & MTA with weekly/monthly pass free no change39 ■ Transfer from regional bus partners varies varies
Bus Passes40 ■ 7-Day Regional Bus Pass $15.00 $12.0041 ■ 7-Day Regional Senior/Disabled Bus Pass $7.50 $6.00
Other Fare Media42 ■ Package of 10 tokens, available to organizations $20.00 no change43 ■ DC student tokens -10 trips per pack $10.00 no change
MetroAccess Fares744 ■ MetroAccess fare (within ADA 3/4 mile service corridor) varies varies45 ■ Maximum fare $6.50 no change
Parking Fees846 ■ District of Columbia $4.45 - $4.95 no change47 ■ Montgomery County $4.45 - $5.20 no change48 ■ Prince George's County $3.00 - $5.20 no change49 ■ Virginia $3.00 - $4.95 no change50 ■ Monthly reserved parking fee $45.00 - $65.00 no change51 ■ Parking meters $1.00/60 minutes $1.00 no change52 ■ Prince George’s parking garage at New Carrollton (monthly) $85.00 no change53 ■ Non-Metro rider parking fees $7.50-$15.00 no change54 ■ Special event parking fees up to $25.00 no change
Other Fees55 ■ Bicycle locker rental $120.00 (annual) no change
1 Peak fares are in effect from opening through 9:30 a.m. and from 3:00 p.m. to 7:00 p.m. weekdays, except on national holidays.2 Off-peak fares are in effect during all other hours on weekdays and all national holidays.3 Weekend flat fares are in effect from Saturday opening until Sunday closing.4 The Monthly Unlimited Pass, as originally approved in Resolution 2015-67 and updated to include both rail and bus for FY2020, charges customers a monthly rate equal to 36 times a customers self-selected price point for a one-way peakperiod rail trip. Customers purchasing the Monthly Unlimited Pass will continue to pay a monthly rate equal to 36 times the self-selected one-way peak rail trip, but this trip cost shall be based on FY2020 peak period rail trip pricing. For trips that exceed the distance included in the self-selected monthly rate, the difference in fare shall be charged at the FY2021 approved fare rates. Said promotional pricing shall remain in effect until otherwise stated.5 Metro's portion of the TransitLink Cards on MARC, VRE. and MTA.6 A $0.05 surcharge on entry and exit at up to two stations in each jurisdiction in the Compact Transit Zone to fund stationspecific capital improvements to Metro facilities at the station(s) where the surcharge is levied may be imposed with further Board approval.7 MetroAccess fare is twice the equivalent fixed route SmarTrip® fare based on fastest trip.8 Parking fees consist of Metro's base fee plus jurisdiction surcharge, if any.
340
Appendix J – Board Budget Resolution

Appendix J – Board Budget Resolution
341
Attachment G
Financial Plan by Investment Category
Capital Investment Categories ($M)
FY2021 Budget
FY2022 Plan
FY2023 Plan
FY2024 Plan
FY2025 Plan
FY2026 Plan
6-Year Total
Railcar $280 $257 $333 $347 $454 $565 $2,236 Rail Systems $165 $131 $163 $153 $147 $132 $891 Track and Structure Rehabilitation $148 $176 $166 $193 $161 $170 $1,014 Stations and Passenger Facilities $546 $526 $391 $252 $192 $179 $2,085
Bus and Paratransit $208 $225 $293 $313 $284 $216 $1,539 Business Support $475 $550 $218 $236 $243 $227 $1,949
Total Capital Investments $1,821 $1,865 $1,563 $1,493 $1,481 $1,490 $9,714 Revenue Loss from Capital Projects $23 $24 $25 $25 $26 $27 $149
Debt Service - Dedicated Funding $31 $52 $84 $104 $121 $140 $533
Total Capital Program Cost $1,875 $1,941 $1,672 $1,623 $1,628 $1,657 $10,396

Financial Plan - Allocation of State & Local ContributionsFY2021Budget
FY2022Plan
FY2023Plan
FY2024Plan
FY2025Plan
FY2026Plan
6 YearTotal
Federal FundingFederal Formula Programs $321,106,774 $321,106,774 $321,106,774 $321,106,774 $321,106,774 $321,106,774 $1,926,640,644Federal PRIIA $148,500,000 $0 $0 $0 $0 $0 $148,500,000Other Federal Grants $19,964,914 $4,428,532 $2,800,000 $2,960,000 $2,840,000 $2,840,000 $35,833,446Total - Federal Grants $489,571,688 $325,535,306 $323,906,774 $324,066,774 $323,946,774 $323,946,774 $2,110,974,090
State & Local Funding Contributions
District of ColumbiaFormula Match & System Performance $95,116,884 $99,240,193 $101,357,944 $105,205,060 $107,436,033 $108,760,022 $617,116,136PR IIA $49,500,000 $49,500,000 $49,500,000 $49,500,000 $49,500,000 $49,500,000 $297,000,000Dedicated Funding $178,500,000 $178,500,000 $178,500,000 $178,500,000 $178,500,000 $178,500,000 $1,071,000,000Subtotal - District of Columbia $323,116,884 $327,240,193 $329,357,944 $333,205,060 $335,436,033 $336,760,022 $1,985,116,136
State of MarylandMontgomery County $45,005,174 $45,864,257 $47,564,988 $48,676,827 $50,496,360 $52,746,682 $290,354,288Prince George's County $45,181,684 $46,915,584 $48,154,482 $49,877,126 $51,081,137 $52,036,091 $293,246,104MD PRIIA $49,500,000 $49,500,000 $49,500,000 $49,500,000 $49,500,000 $49,500,000 $297,000,000MD Dedicated Funding $167,000,000 $167,000,000 $167,000,000 $167,000,000 $167,000,000 $167,000,000 $1,002,000,000Subtotal - Maryland $306,686,858 $309,279,841 $312,219,470 $315,053,953 $318,077,497 $321,282,773 $1,882,600,392
Commonwealth of VirginiaCity of Alexandria $12,401,646 $12,773,528 $13,146,057 $13,535,690 $13,943,924 $14,363,906 $80,164,751Arlington County $22,641,546 $23,012,708 $23,880,758 $24,388,260 $25,350,214 $26,575,529 $145,849,016City of Fairfax $715,612 $717,184 $751,711 $761 431 $798,856 $852,639 $4,597,433Fairfax County $40,760,743 $41,487,654 $43,046,454 $44,013,681 $45,699,476 $47,814,951 $262,822,959City of Falls Church $757,037 $792,724 $807,605 $840,022 $855,791 $862,074 $4,915,253Loudoun County (1) $5,797,066 $5,624,882 $6,011,578 $5,965,127 $6,399,330 $7,111,061 $36,909,044VA PRIIA $49,500,000 $49,500,000 $49,500,000 $49,500,000 $49,500,000 $49,500,000 $297,000,000VA Dedicated Funding $154,500,000 $154,500,000 $154,500,000 $154,500,000 $154,500,000 $154,500,000 $927,000,000CMAQ $877,153 $903,467 $930,571 $958,488 $987,243 $1,016,860 $5,673,783Subtotal -Virginia $287,950,804 $289,312,148 $292,574,734 $294,462,699 $298,034,834 $302,597,020 $1,764,932,238
Jurisdiction Planning Projects $3,000,000 $3,000,000 $3,000,000 $3,000,000 $3,000,000 $3,000,000 $18,000,000Silver Line (MWAA) $26,556,000 $17,747,000 $0 $0 $0 $0 $44,303,000Potomac Yard (Alexandria) $59,050,000 $88,900,000 $33,870,000 $38,580,000 $0 $0 $220,400,000Purple Line (MDOT) $89,000 $194,000 $0 $0 $0 $0 $283,000Subtotal -Jurisdictional Reimbursable $88,695,000 $109,841,000 $36,870,000 $41,680,000 $3,000,000 $3,000,000 $282,986,000
Total - State & Local $1,006,449,546 $1,035,673,182 $971,022,148 $984,301,712 $954,548,364 $963,639,814 $5,915,634,766
Debt $379,346,720 $580,141,220 $376,817,384 $314,501,415 $349,140,047 $368,938,324 $2,368,885,110
Grand Total Funding (2) $1,875,367,954 $1,941,349,709 $1,671,746,306 $1,622,869,901 $1,627,635,134 $1,656,524,913 $10,395,493,966
(1) The jurisdictional shares of Formula Match and System Performance contributions are calculated using the original methodology which fully includes Loudoun County, rather than the prorated method used for the FY2021 Operating Subsidy calculation
(2) Total funding requirement includes capital program expenditures, debt service, and estimated revenue loss from major shutdowns Note; Does not assume reauthorization of Federal PRIIA.
342
Appendix J – Board Budget Resolution

Attachment H
U.S. Department of Transportation
Federal Transit Administration
REGION IIIDelaware, District ofColumbia, Maryland, Pennsylvania, Virginia, West Virginia
1835 Market Street Suite 1910Philadelphia, PA 19103-2932215-656-7100215-656-7260 (fax)
November 27, 2019
Mr. Paul J. WiedefeldGeneral Manager and CEOWashington Metropolitan Area Transit Authority600 5th Street, NWWashington, DC 20001
Re: FY 2020 Indirect Cost Rate Proposal
Dear Mr. Wiedefeld:
The Federal Transit Administration (FTA) has reviewed the Washington Metropolitan Area Transit Authority’s (WMATA) most recent indirect cost proposal, as requested. As the Cognizant Agency for Indirect Costs, FTA concurs with WMATA’s use of a final average departmental rate of 59.10% for the period of July I, 2019 to June 30, 2020. This concurrence supersedes FTA’s authorization of June 7, 2019 for WMATA to apply the FY20I9 indirect cost rate of 43.54% provisionally for FY2020, pending submission of WMATA’s FY2020 ICRP for FTA review.
This fixed rate should be applied according to proposed departmental rates, with carryforward, as specified in Attachment A (enclosed). Review of future rates is based on the policies outlined in FTA’s Circular 5010.1E. Please consult Circular 5010.IE for specific thresholds and guidance, including changes in accounting systems, methodologies, and increases of 20% from the most recently FTA approved indirect cost rate.
FTA’s review and approval of WMATA’s FY2019 ICRP on April 8, 2019 included an expectation that WMATA’s use of carryforward costs would lead to an increase of its Indirect Cost Rate for several subsequent years.
FTA review of WMATA’s FY2020 ICRP found that it was consistent with the methodology applied in FY2019. Although the FY2020 rate does exceed the FY2019 approved rate in excess of the 20% threshold, FTA did not conduct a formal review of the FY2020 ICRP, which would generate an official approval with accompanying approval report. Therefore, the most recent rate that should be considered “approved” shall remain the FY2019 approved rate of 43.54%. The FY2019 approved rate of 43.54% will be used as the baseline for calculating whether subsequent ICRPs exceed the 20% increase threshold.
FTA expects that WMATA will submit its FY2021 ICRP by the end of the calendar year.
Attachment A to this agreement is the indirect cost rate plan or proposal, formally concurred and incorporated herein. FTA has completed and signed the attached agreement forms. WMATA must sign both agreement forms and return one countersigned original to our office. The countersigned document serves as your organization’s indirect costs concurrence and should be provided to FTA and other federal agencies to reflect the concurred rate, terms, and effective dates.
Appendix J – Board Budget Resolution
343
Attachment H

sincerely,
If you have any questions, please contact Andre Anderson at (202) 366-1953 or email at [email protected].
Terry Garcia Crews Regional Administrator
cc: Dennis Anosike Yetunde Olumide Lawrence Flint
Enclosure
344 Appendix J – Board Budget Resolution

INDIRECT COST NEGOTIATION AGREEMENT BETWEEN THE
WASHINGTON METROPOLITAN AREA TRANSIT AUTHORITY AND THE
FEDERAL TRANSIT ADMINISTRATION
This agreement is made and entered into between Washington Metropolitan Area Transit Authority (WMATA) and the United States Department of Transportation, Federal Transit Administration (FTA), the cognizant Federal agency for indirect costs under governmentwide Uniform Administrative Requirements and Cost Principles, 2 CFR 200.
The indirect cost rates concurred and contained herein are for use and may be charged to grant awards, cooperative agreements and contracts with the Federal Government, to which 2 CFR 200 Subpart E and Appendix VII applies, subject to the limitations contained in Section II. A of this agreement, as wells the grants management guidelines included FTA’s Circular 5010.IE.
The indirect cost rates were concurred by FTA in accordance with the authority contained in Appendix G of FTA Circular 5010.IE.
Section I: Rate
Type: Fixed Rate with Carry Forward
Effective Period: July 1, 2019 to June 30, 2020
Rate: As reflected below:
DEPARTMENT Indirect Cost Rates with Carry-forward
Access Services, Mode 10 - Paratransit (ACCESS) 415.66%
Bus Services - Transportation, Mode 01 (BTRA) 31.39%
Bus Services - Vehicle Maintenance, Mode 01 (BMNT) 66.76%
Rail Transportation Administration, Mode 02 (RTRA) 51.24%
Railcar Maintenance, Mode 02 (CMNT) 52.40%
Rail Infrastructure and Facilities, Mode 02 (INFR) 62.04%
Metro Transit Police Department (MTPD) 0.00%
Customer Service, Communications, and Marketing (CSCM)
46.33%
Total 59.10%
Appendix J – Board Budget Resolution
345
Base: Approved direct cost base
Applicable To: All programs not specifically exempted, or limited by law, or otherwise not applicable because special operating factors necessitate special indirect cost rates.
Section II: General
A. Limitations
The rates contained in this agreement may be subject to statutory or administrative limitations and are reimbursable through grant, contract, or other agreement only to the extent that funds are available. Acceptance of these rates is predicated on these conditions: (1) Only costs incurred by WMATA were included in its indirect cost pool as finally accepted and are allowable under the governing cost principles; (2) The same costs that have been treated as indirect costs are not claimed as direct costs; (3) Similar types of costs have been accorded consistent accounting treatment, and (4) The information provided by WMATA which was used to establish the rates are not later found to be materially incomplete or inaccurate by the Federal Government. In such situations, the agreement will be subject to reopening, and the rates may be adjusted and refunds made if the proposal included unallowable costs.
B. Accounting Changes
This agreement is based on the accounting system to be in effect during the agreement period. Changes in the method of accounting for costs that affect the amount of reimbursement resulting from the use of these rates require prior concurrence of FTA. Such changes include, but are not limited to, changes in the charging of a particular type of cost from indirect to direct. Failure to obtain concurrence may result in cost disallowances.
C. Fixed Rate with Carry Forward
This agreement and concurrence is for fixed rate with carry forward indirect cost rates and is based on an estimate of the costs for the period covered by the rates. When the actual costs for this period are determined, an adjustment will be made to the rates for the subsequent Fiscal Years to compensate for the difference between the costs used to establish the fixed rates and actual costs as required under 2 CFR 200 Appendix VII.
D. Use by Other Federal Agencies
The rates in this Agreement were concurred in accordance with the authority in 2 CFR 200 Subpart E and Appendix (insert applicable Appendix from for entity type and approved plan), and should be applied to grants, contracts, and other agreements covered by this regulation, subject to any limitations in Section I or II A above. Copies of this document may be provided to other Federal Agencies as a means of notifying them of this agreement.
346
Appendix J – Board Budget Resolution

E. Other
If any Federal contract, grant, or other agreement is reimbursing indirect costs by means other than the concurred rates in this agreement, WMATA shall notify FTA.
Washington Metropolitan AreaTransit Authority
U. S. Department of Transportation Federal Transit Administration
Dennis AnosikeChief Financial Officer
Terry Garcia CrewsRegional Administrator
11-27-19
Date Date
Appendix J – Board Budget Resolution
347

348
Appendix J – Board Budget Resolution
Revised Budget Resolution and Attachments May 28, 2020

PRESENTED AND ADOPTED: May 28, 2020
SUBJECT: AMENDMENT OF FISCAL YEAR 2021 OPERATING BUDGET AND CAPITAL BUDGET
2020-20
RESOLUTIONOF THE
BOARD OF DIRECTORSOF THE
WASHINGTON METROPOLITAN AREA TRANSIT AUTHORITY
WHEREAS, Pursuant to Resolution 2020-09, the Board adopted the fiscal year (FY) 2021 Operating Budget and Capital Budget, adopted service and fare changes, and reserved the right to reconsider implementation of various initiatives based on Metro's finances; and
WHEREAS, The Board wishes to amend Resolution 2020-09 because the coronavirus pandemic health emergency and various stay-at-home orders have adversely impacted regional economies and have resulted in significant Metro service and operational changes; and
WHEREAS, Further, the Board wishes to amend Resolution 2020-09 in light of the availability of the Coronavirus Aid Relief and Economic Security Act of 2020 (CARES Act) funding;
NOW, THEREFORE, be it
RESOLVED, That Attachments C (FY 2021 Operating Budget) and D (FY 2021 Summary of State/Local Operating Requirements) to Resolution 2020-09 are deleted in their entirety and replaced with new Attachments C and D hereto that reduce the FY 2021 Operating Budget from $2.078 billion to $2.052 billion, and reduce the total jurisdictional contributions from $1.246 billion to $1.112 billion with a credit of CARES Act funding, respectively; and be it further
RESOLVED, That implementation of the service changes and fare changes in Attachments E (service changes) and F (fare changes) to Resolution 2020-09 are deferred for six months from July 1, 2020, such that said service changes and fare changes will commence on or about January 1, 2021; and be it further
Motioned by Mr. McMillin, seconded by Mr. GoldmanAyes: 8- Mr. Smedberg, Ms. Gidgibi, Mr. Goldman, Mr. Rouse, Mr. Letoureau, Mr. Marootian, Mr. Graham and Mr. McMillin
MAppendix J - Board Budget Resolution 349
Appendix J – Board Budget Resolution
349

RESOLVED, That the Board reserves the right to further defer the service changes and fare changes in Attachments E (service changes) and F (fare changes) to Resolution 2020-09, as may be necessary and appropriate in light of the coronavirus pandemic health emergency and Metro's finances; and be it finally
RESOLVED, That this Resolution shall be effective 30 days after adoption in accordance with § 8(b) of the WMATA Compact.
Reviewed as to form and legal sufficiency,
Patricia Y. LeeExecutive Vice President and General Counsel
WMATA File Structure No.:4.2.2. Fiscal Year budgets
350
Appendix J – Board Budget Resolution

Attachment C
Mmetro
FY2021 REVISED OPERATING BUDGET
(Dollars In Thousands)Total
with REIMBSubsidized
Total BUS RAIL ACCESS REIMB
REVENUESPassenger $281,376 $281,376 $27,683 $249,085 $4,607 $0Parking $20,031 $20,031 $0 $20,031 $0 $0Advertising $33,342 $33,342 $8,326 $25,016 $0 $0Joint Development $14,528 $11,423 $0 $11,423 $0 $3,106Fiber Optics $14,766 $14,083 $0 $14,083 $0 $684Other $29,607 $25,630 $2,584 $23,046 $0 $3,977
Total Revenues $393,649 $385,883 $38,593 $342,683 $4,607 $7,766
EXPENSESPersonnel $1,373,690 $1,368,019 $534,090 $820,226 $13,704 $5,671Services $399,583 $397,912 $70,342 $158,209 $169,361 $1,671Materials & Supplies $100,742 $100,317 $27,463 $72,092 $762 $425Fuel (Gas/Diesel/CNG) $26,939 $26,939 $17,553 $3,684 $5,702 $0Utilities & Propulsion $100,793 $100,793 $11,645 $88,378 $770 $0Casualty & Liability $32,260 $32,260 $8,786 $22,890 $584 $0Leases & Rentals $11,036 $11,036 $2,657 $7,394 $985 $0Miscellaneous $6,505 $6,505 $780 $5,589 $136 $0
Total Expenses $2,051,549 $2,043,783 $673,317 $1,178,462 $192,004 $7,766
Gross Subsidy $1,657,899 $1,657,899 $634,724 $835,779 $187,396 $0
CARES Act ($546,315) ($546,315) ($150,248) ($371,034) ($25,034) $0
Net Subsidy $1,111,584 $1,111,584 $484,476 $464,745 $162,363 $0
Appendix J – Board Budget Resolution
351
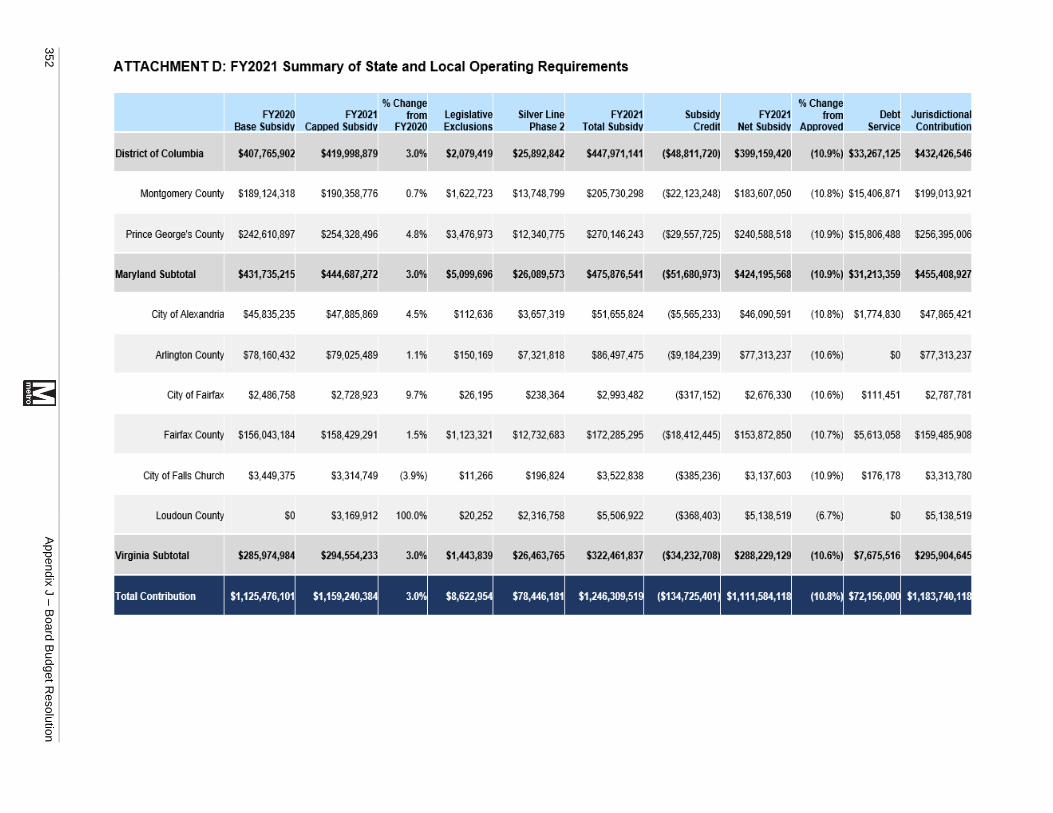
3.0% $72,156,00 $1,183,740,118
ATTACHMENT D: FY2021 Summary of State and Local Operating Requirements
FY2020 Base Subsidy
FY2021Capped Subsidy
% Change from
FY2020Legislative Exclusions
Silver LinePhase 2
FY2021 Total Subsidy
Subsidy Credit
FY2021 Net Subsidy
% ChangeJurisdictional Contribution
from Approved
Debt Service
District of Columbia $407,765,902 $419,998,879 3.0% $2,079,419 $25,892,842 $447,971,141 ($48,811,720) $399,159,420 (10.9%) $33,267,125 $432,426,546
Montgomery County $189,124,313 $190,358,776 0 7% 31,622,723 $13,748,799 3205,730,298 ($22,123,248 $133,607,050 (10 8%) $15,406,871 $199,013,921
Prince George's County $242,610,897 $254,320,496 4 8% 33,476,973 $12,340,775 $270,146,243 ($29,557,725 $240,588,518 (10 9%) $15,806,488 $256,395,006
Maryland Subtotal $431,735,215 $444,687,272 3.0% $5,099,696 $26,089,573 $475,876,541 ($51,680,973) $424,195,568 (10.9%) $31,213,359 $455,408,927
City of Alexandria 345,335,235 $47,885,869 4 5% $112,636 33,657.319 $51,655,824 ($5,565,233 346,090,591 (10.8%) $1,774,830 347,865,421
Arlington County $78,160,432 $79,025,489 1.1% $150,169 $7,321,818 $86,497,475 ($9,184,239) 377,313,237 (10.6% $0 377,313,237
City of Fairfax $2,436,758 $2,728,923 9 7% $26,195 $238,364 $2,993,482 ($317,152 $2,676,330 (10.6% $111,451 $2,787,781
Fairfax County $156,043,184 $158,429,291 1.5% 31,123,321 $12,732,683 3172,285,295 ($18,412,445) $153,872,850 (10.7%) $5,613,058 $159,485,908
City of Falls Church $3,449,375 $3,314,749 (3.9%) $11,266 $196,824 $3,522,838 ($385,236 $3,137,603 (10.9% $176,178 $3,313,780
Loudoun County $0 33,169,912 100.0% $20,252 32,316.758 35,506,922 ($368,403 $5,138,519 (6.7% $0 $5,138,519
Virginia Subtotal $285,974,984 $294,554,233 3.0% $1,443,839 $26,463,765 $322,461,837 ($34,232,708) $288,229,129 (10.6%) $7,675,516 $295,904,645
Total Contribution $1,125,476,101 $1,159,240,384■ $8,622,954 $78,446,181 $1,246,309,519 ($134,725,401) $1,111,584,118 (10.8%]
352 Appendix J – Board Budget R
esolution

Appendix K – Glossary of Terms
353
Appendix K - Glossary of Terms
Accounting Basis The accounting principles and methods appropriate for a government enterprise fund. Financial statements are prepared on the accrual basis of accounting under which revenues and expenses are recognized when earned or incurred.
Accrual Basis Basis of Accounting where revenues are recognized when they are measurable and
earned. Expenses are recorded when incurred. Approved Budget The revenue and expenditure plan approved by the WMATA Board of Directors for
a specific one year period starting on July 1. Assets Property owned by Metro which has monetary value with a future benefit. Balanced Budget Refers to a budget where estimated revenues are equal to or greater than estimated
expenses. Board of Directors The Board of Directors is a 16-member body composed of eight voting and eight
alternate members responsible for corporate governance of WMATA. Bond A written promise to pay a specified sum of money (face value) at a specified
future date and the proposed means of financing them. Bond Proceeds Refers to additional local capital funds raised, when necessary, by issuance of
revenue bonds in the municipal markets. Budget Refers to a financial operation embodying an estimate of revenues and
expenditures for a fiscal period of 12 months or longer. This can be an operating or capital budget.
Budget Calendar Refers to a schedule of key dates for specific milestones in the preparation and
approval of a budget. Budget Document Refers to the official written statement and the supporting numbers prepared
by the Financial staff for presentation for approval by the Board. Budget Message Refers to the general discussion of the budget document presented in writing as
an overview, usually by the head of the organization Bus Shelter A shelter for riders to wait for the bus, a canopy area with or without bench
seating. In addition, the shelter includes a display case with bus information for Metrobus riders and is equipped with a trash receptacle.
Bus Stop Refers to a stop indicated by a sign for riders to wait for the bus. Capital Assets Assets of a material value and having a useful life of more than one year. Also called
fixed assets. Capital Budget The portion of the budget that provides for the funding of improvements, projects and
major equipment purchases. Capital Improvement Program The six-year plan of capital projects to be completed by Metro. Cash Basis Basis of Accounting whereby revenue and expense are recorded on the books of
account when received and paid, respectively, without regard to the period to which they are incurred.
Compact Refers to interstate compact creating WMATA; this is a special type of contract or

354
Appendix K – Glossary of Terms
agreement between the three jurisdictions within which the organization operates. Contingency Funds Operating and capital funds reserved for unexpected expenditures during the fiscal
year which were not addressed in the annual budget. Coronavirus (Also see Covid-19)
Refers to a family (Coronaviridae) of large single-stranded RNA viruses that have a lipid envelope studded with club-shaped spike proteins, infect birds and many mammals including humans, and include the causative agents of MERS, SARS, and Covid-19; also, an illness caused by a coronavirus.
Cost Allocation Refers to a process by which indirect or common costs are distributed to multiple
cost objects (a job, task, or business unit) based on a prescribed basis or methodology. For example, overhead costs such as IT support are allocated to the transportation modes on a percentage basis.
Covid-19 (Also see Coronavirus)
First identified in Wuhan, China in December 2019, Covid-19 refers to a mild to severe respiratory illness caused by a coronavirus (Severe acute respiratory syndrome coronavirus 2 of the genus Betacoronavirus), is transmitted chiefly by contact with infectious material (such as respiratory droplets) or with objects or surfaces contaminated by the causative virus, and is characterized especially by fever, cough, and shortness of breath and may progress to pneumonia and respiratory failure.
DC Circulator Refers to a bus route funded by the DC Government with support from Metro to
take persons to Washington, DC's premier cultural, shopping, dining, and business destinations.
Development and Evaluation An initial investment into the planning, development and evaluation of potential or
proposed capital projects to determine whether a project is viable and should be pursued.
Deadhead Refers to non-revenue time when a bus or train is not carrying revenue passengers,
usually a trip from, to, or between lines, yards or garages. Usually this refers to bus or rail travel to or from the garage or yard to a terminus or station where revenue service begins or ends.
Deficit Refers to an excess of Liabilities over Assets or Expenses over Revenue. Department A major organizational unit that has overall responsibility for an operation or a
group of operations within a functional area. Diesel Fuel Fuel composed of petroleum distillates that have a boiling point and specific
gravity higher than gasoline. Division Refers to a garage and yard facility where buses are stored, maintained, and
dispatched into service. Fairfax Connector The bus system that runs seven days a week with service throughout Fairfax
County, Virginia and to Metrorail stations on the Orange, Blue and Yellow lines, including the Pentagon.
Fare box recovery ratio Refers to the ratio of passenger fares (including inter-agency agreements related to
fares) to total operating costs. Farecard Refers to a paper pass used to ride Metrorail or Metrobus. Paper farecards are no
longer accepted, by bus or at rail faregates (as of March 2016). Four-point Securement System Refers to an onboard securement system for wheelchairs, three-wheel and four-
wheel scooters. The system incorporates four seatbelt type straps that attach to the frame of a mobility device as a way to keep it from moving or rolling while
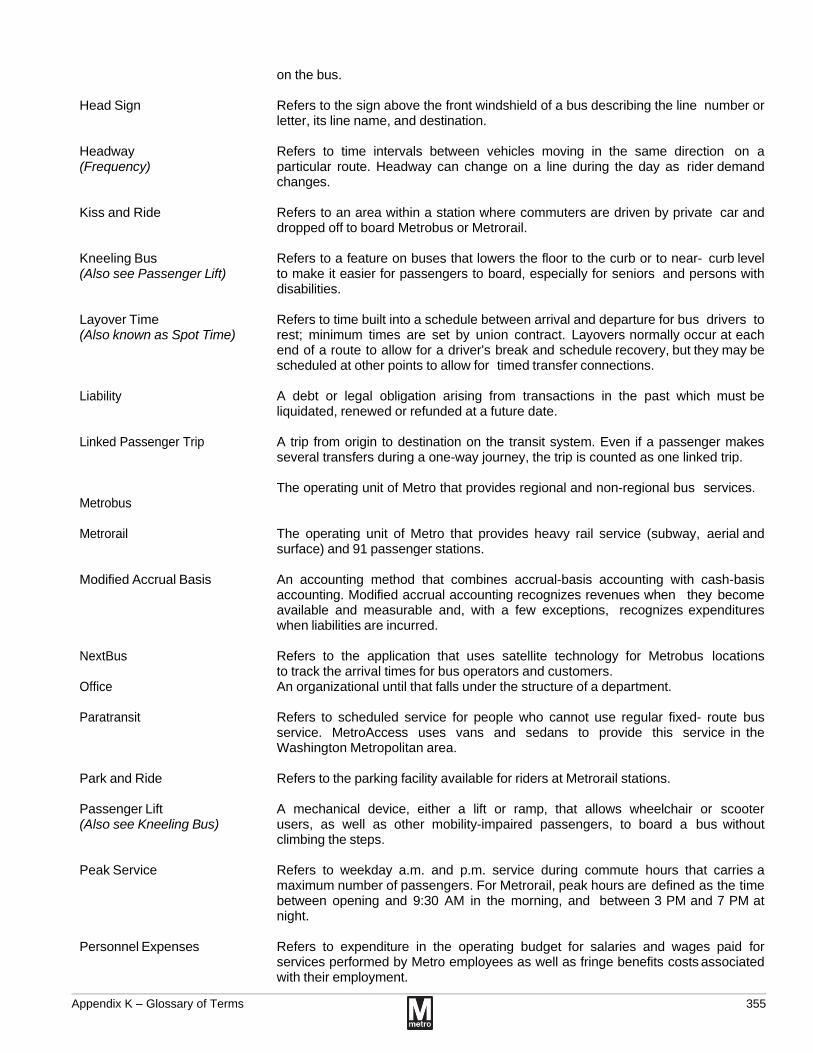
Appendix K – Glossary of Terms
355
on the bus. Head Sign Refers to the sign above the front windshield of a bus describing the line number or
letter, its line name, and destination. Headway (Frequency)
Refers to time intervals between vehicles moving in the same direction on a particular route. Headway can change on a line during the day as rider demand changes.
Kiss and Ride Refers to an area within a station where commuters are driven by private car and
dropped off to board Metrobus or Metrorail. Kneeling Bus (Also see Passenger Lift)
Refers to a feature on buses that lowers the floor to the curb or to near- curb level to make it easier for passengers to board, especially for seniors and persons with disabilities.
Layover Time (Also known as Spot Time)
Refers to time built into a schedule between arrival and departure for bus drivers to rest; minimum times are set by union contract. Layovers normally occur at each end of a route to allow for a driver's break and schedule recovery, but they may be scheduled at other points to allow for timed transfer connections.
Liability A debt or legal obligation arising from transactions in the past which must be
liquidated, renewed or refunded at a future date. Linked Passenger Trip Metrobus
A trip from origin to destination on the transit system. Even if a passenger makes several transfers during a one-way journey, the trip is counted as one linked trip. The operating unit of Metro that provides regional and non-regional bus services.
Metrorail The operating unit of Metro that provides heavy rail service (subway, aerial and
surface) and 91 passenger stations. Modified Accrual Basis An accounting method that combines accrual-basis accounting with cash-basis
accounting. Modified accrual accounting recognizes revenues when they become available and measurable and, with a few exceptions, recognizes expenditures when liabilities are incurred.
NextBus Refers to the application that uses satellite technology for Metrobus locations
to track the arrival times for bus operators and customers. Office An organizational until that falls under the structure of a department. Paratransit Refers to scheduled service for people who cannot use regular fixed- route bus
service. MetroAccess uses vans and sedans to provide this service in the Washington Metropolitan area.
Park and Ride Refers to the parking facility available for riders at Metrorail stations. Passenger Lift (Also see Kneeling Bus)
A mechanical device, either a lift or ramp, that allows wheelchair or scooter users, as well as other mobility-impaired passengers, to board a bus without climbing the steps.
Peak Service Refers to weekday a.m. and p.m. service during commute hours that carries a
maximum number of passengers. For Metrorail, peak hours are defined as the time between opening and 9:30 AM in the morning, and between 3 PM and 7 PM at night.
Personnel Expenses Refers to expenditure in the operating budget for salaries and wages paid for
services performed by Metro employees as well as fringe benefits costs associated with their employment.

356
Appendix K – Glossary of Terms
Platform Hours The total scheduled time a bus spends from pull-out to pull-in at the division.
Platform hours are used as a benchmark to calculate the efficiency of service by comparing "pay to platform" hours.
Programmed Reader A machine that is attached to the fare gate/fare box where magnetic fare media can
be read on Metrorail and Metrobus. Revenue An increase in fund assets from operational activity such as passenger fares,
parking and advertising. Revenue Bonds A bond on which debt service is payable solely from a restricted revenue source. Revenue Hours (Also known as Revenue Service)
Refers to all scheduled time bus/rail spends serving passengers, which can also be defined as platform hours minus deadhead and layover time.
Revenue Passengers Refers to passengers who enter the system through the payment of a fare. Revenue trip (Also see Linked/Unlinked Trip)
Refers to any linked or unlinked trip that generates revenue by cash payment, use of a pass, and/or any other means of payment.
Ride-On Refers to Montgomery County regional bus transit system in Maryland.Round Trip (Also known as a Cycle)
Refers to one inbound, plus one outbound trip (unless a loop route), equals one round trip or cycle.
Slinky bus Refers to a nickname used by passengers for an articulated bus. SmartStudent Pass
A monthly pass for unlimited travel on Metrobus and Metrorail for students under 19 years of age who live and attend school in the District of Columbia.
SmartTrip® Refers to a technology built and designed by Cubic Transportation Systems, Inc.,
a subsidiary of San Diego-based Cubic Corporation to add and deduct value from an electronically encoded card when a rider passes the card near a programmed reader on Metrobus and at fare gates on Metrorail.
Strategic Buses Refers to spare buses available for service in the event that a bus in route is taken
out of service. Subsidy Refers to funding received from jurisdictional funding partners in the Washington
Metropolitan area consisting of Washington, DC, suburban Maryland (Montgomery County and Prince George’s County) and Northern Virginia counties of Arlington and Fairfax and the Cities of Alexandria, Fairfax and Falls Church.
TheBus Prince George’s County, Maryland local bus service. Transit Advertising Refers to ads posted on the exterior and interior of buses and rail cars. Tripper A short piece of work (usually on a bus, but sometimes on a train) not long enough
to qualify as complete run or full day’s work. May involve vehicles from one line or route being re-routed to serve another.
Trunk Line Unlinked Passenger Trip
A route operating along a major corridor that carries a large number of passengers and operates at headway frequencies of 15 minutes or less. Unlinked passenger trips count each boarding as a separate trip.

Appendix L – Glossary of Acronyms and Abbreviations
357
Appendix L - Glossary of Acronyms and Abbreviations
A
AAC AC ADA AFC AP APTA ART AWP
Accessibility Advisory Committee Alternating Current Americans with Disabilities Act Automatic fare collection Accounts Payable American Public Transportation Association Arlington Transit Annual Work Plan
B
B2G BOCC
Back2Good Bus Operations Communication Center
C
CAFR CBA CCTV CFA CIP CMAQ CNF CNG COG Covid-19 CRCS CTF
Comprehensive Annual Financial Report Collective Bargaining Agreement Closed-Circuit Television Capital Funding Agreement Capital Improvement Program Congestion Mitigation and Air Quality Capital Needs Forecast; Formerly Capital Needs Inventory (CNI) Compressed Natural Gas (Metropolitan Washington) Council Of Governments See Covid-19 or Coronavirus, Appendix K Comprehensive Radio Communications System Carmen Turner Facility D
D/B D/B/B DBE D&E DPS
Design/Build Design/Bid/Build Disadvantaged Business Enterprise Development and Evaluation Drainage Pumping Station
E
EEO Equal Employment Opportunity
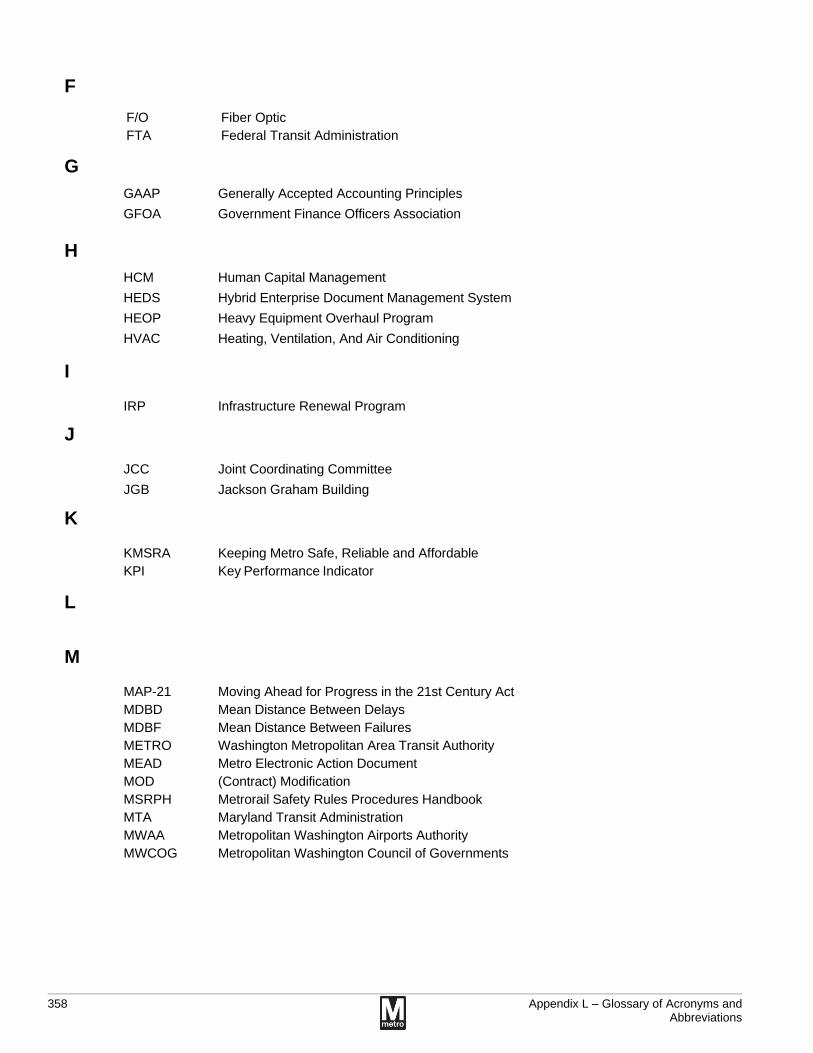
358
Appendix L – Glossary of Acronyms and Abbreviations
F
F/O FTA
Fiber Optic Federal Transit Administration
G
GAAP GFOA
Generally Accepted Accounting Principles Government Finance Officers Association
H
HCM HEDS HEOP HVAC
Human Capital Management Hybrid Enterprise Document Management System Heavy Equipment Overhaul Program Heating, Ventilation, And Air Conditioning
I
IRP Infrastructure Renewal Program
J
JCC JGB
Joint Coordinating Committee Jackson Graham Building
K
KMSRA KPI
Keeping Metro Safe, Reliable and Affordable Key Performance Indicator
L
M
MAP-21 MDBD MDBF METRO MEAD MOD MSRPH MTA MWAA MWCOG
Moving Ahead for Progress in the 21st Century Act Mean Distance Between Delays Mean Distance Between Failures Washington Metropolitan Area Transit Authority Metro Electronic Action Document (Contract) Modification Metrorail Safety Rules Procedures Handbook Maryland Transit Administration Metropolitan Washington Airports Authority Metropolitan Washington Council of Governments

Appendix L – Glossary of Acronyms and Abbreviations
359
N NTSB NTD NTE NTI
National Transportation Safety Board National Transit Database Not to Exceed National Transit Institute
O
OCC OTP
Operations Control Center On-Time Performance
P
PCO P/I
Pending (or proposed) Change Order Policy Instruction
Q
QA Quality Assurance
R
RAC RFP
Riders’ Advisory Council Request for Proposal
S
S&I SBPO
Service and Inspection Small Business Programs Office
T
TC TIP
Train Control Transportation Improvement Program
U
V
VMI VRE
Vendor Managed Inventory Virginia Railway Express
W
WMATA WMSC
Washington Metropolitan Area Transit Authority Washington Metrorail Safety Commission
Y
YE Year End
Z

360
Appendix L – Glossary of Acronyms and Abbreviations
How to Contact Metro
By mail or in person: Washington Metropolitan Area Transit Authority 600 Fifth Street, NW Washington, DC 20001
To reach Metro headquarters at the Jackson Graham Building, take the Red, Green or Yellow lines to Gallery Pl-Chinatown station. Use the Arena exit. Walk two blocks east on F Street to 5th Street. Or, ride Metrobus routes D1, D6, P6, X2, X9, 42, 70, 74, or 80.
By website: http://www.wmata.com
By telephone:
Administrative Offices 202-962-1234 Administrative offices and general information Weekdays: 8:00 a.m. to 4:30 p.m.
Customer Relations 202-637-1328 Suggestions, commendations, comments
Metro Information 202-637-7000 (TTY 202-962-2033) Metrobus and rail schedules, fares, parking, Bike ‘N Ride program, and more
MetroAccess 301-562-5360 (TTY 301-588-7535) or toll free at 800-523-7009 MetroAccess Paratransit Service
Transit Police 202-962-2121