fy2018 consolidated financial results - aisin.com · 138.8 22.5 4.5 56.4 +5.0 7.8 169.8 fx 2.8 5.0...
TRANSCRIPT

FY2018
Consolidated Financial Results
April 27th, 2018
AISIN SEIKI Co., Ltd.

1
1.Consolidated Operating Results (FY2018) P.2-8
2.Consolidated Operating Forecast (FY2019) P.9-13
3.Reference information P.14-24
Contents

2
1.Consolidated Operating Results (FY2018)

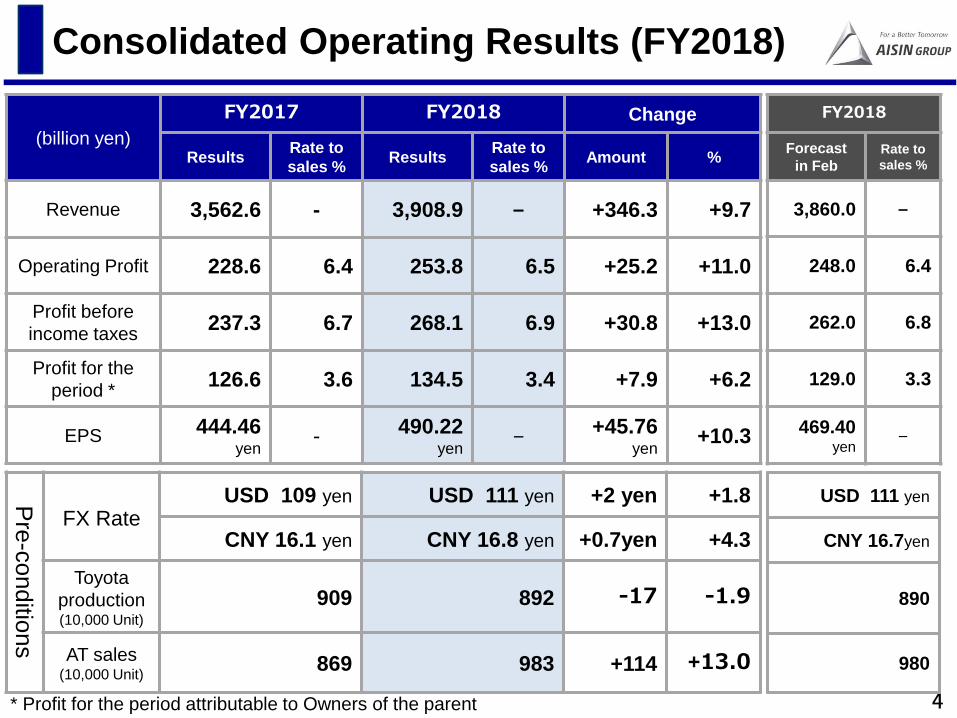
1.Revenue for FY2018 reached 3,908.9 billion yen, which is the
highest ever before, due to favorable AT and Body parts sales,
and the contribution of newly consolidated Art Metal Mfg. Co.,
Ltd. group.
FY2018 Overview of Financial Results
2. Operating profit reached 253.8 billion yen, which is also the
highest ever before, due to the increase of sales and FX trend
etc. , in spite of the rise in material price, the increase of
depreciation cost and extraordinary gain from stock swap
with SHIROKI Corporation last year.
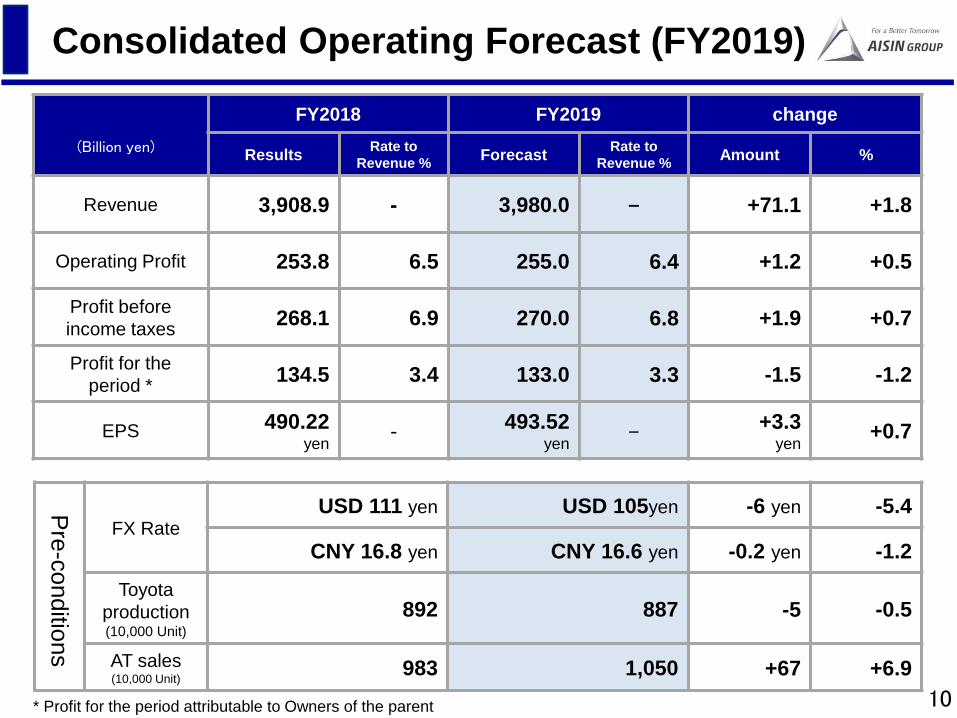
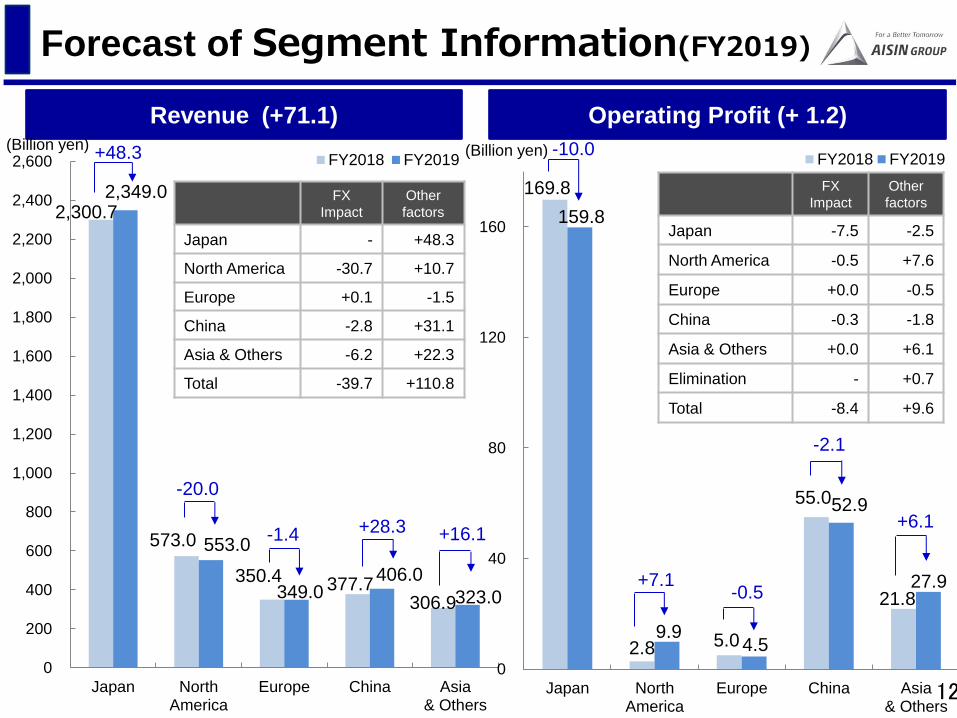
3. Regarding FY2019 forecast, revenue is predicted to reach
3,980.0 billion yen which is higher than FY2018, due to the
increase of AT sales. Operating profit is predicted to be 255.0
billion yen, which is almost same as FY2018, due to the
unfavorable factors such as the increase of depreciation and
R&D cost and FX loss, in spite of the increase of sales.
3
(billion yen)
FY2017 FY2018 Change
Results Rate to
sales % Results
Rate to
sales % Amount %
Revenue 3,562.6 - 3,908.9 - +346.3 +9.7
Operating Profit 228.6 6.4 253.8 6.5 +25.2 +11.0
Profit before
income taxes 237.3 6.7 268.1 6.9 +30.8 +13.0
Profit for the
period * 126.6 3.6 134.5 3.4 +7.9 +6.2
EPS 444.46 yen
- 490.22 yen
- +45.76
yen +10.3
FX Rate USD 109 yen USD 111 yen +2 yen +1.8
CNY 16.1 yen CNY 16.8 yen +0.7yen +4.3
Toyota
production (10,000 Unit)
909 892 -17 -1.9
AT sales (10,000 Unit)
869 983 +114 +13.0
4
FY2018
Forecast
in Feb
Rate to
sales %
3,860.0 -
248.0 6.4
262.0 6.8
129.0 3.3
469.40 yen
-
USD 111 yen
CNY 16.7yen
890
980
Consolidated Operating Results (FY2018)
Pre
-co
nd
itions
* Profit for the period attributable to Owners of the parent

279.1 291.5
93.9 122.1 94.1
104.7 80.1
95.8 69.2
88.6 71.0
85.4 79.1
84.6 37.4
80.7 75.2
74.6
51.3
59.9
34.2
54.9 335.4
376.5
0
200
400
600
800
1,000
1,200
1,400
1,600
FY2017 FY2018
VW&Audi
GM
PSA
BMW
FY2017 Revenue
FY2018 Revenue (+ 346.3)
Other Auto Makers sales breakdown
+12.4
+28.2
+10.6
+15.7
+19.4
+14.4
+5.5
-0.6
+8.6
+43.3
3,562.6
+20.7
+41.1
5
Sales by Customer (FY2018)
(Billion yen)
(Billion yen)
Toyota
Group
2,141.2 (60.1%)
3,908.9
Toyota
Group
2,267.1 (58.0%)
1,300.0 (36.5%)
Other
Auto Makers
Life & others
Life & others
Other
Auto Makers
121.3 (3.4%)
122.5 (3.1%)
1,519.3 (38.9%)
1,300.0
1,519.3 +219.3
Others
VOLVO
Mitsubishi
SUZUKI
Guangzhou Automobile
NISSAN
HONDA
Changan Automobile
Chinese OEMs Total
148.1⇒230.1(+82.0) (Billion yen)
138.8
22.5
4.5
56.4
7.8
169.8
2.8 5.0
55.0
21.8
0
40
80
120
160
Japan NorthAmerica
Europe China Asia& Others
FY2017 FY2018
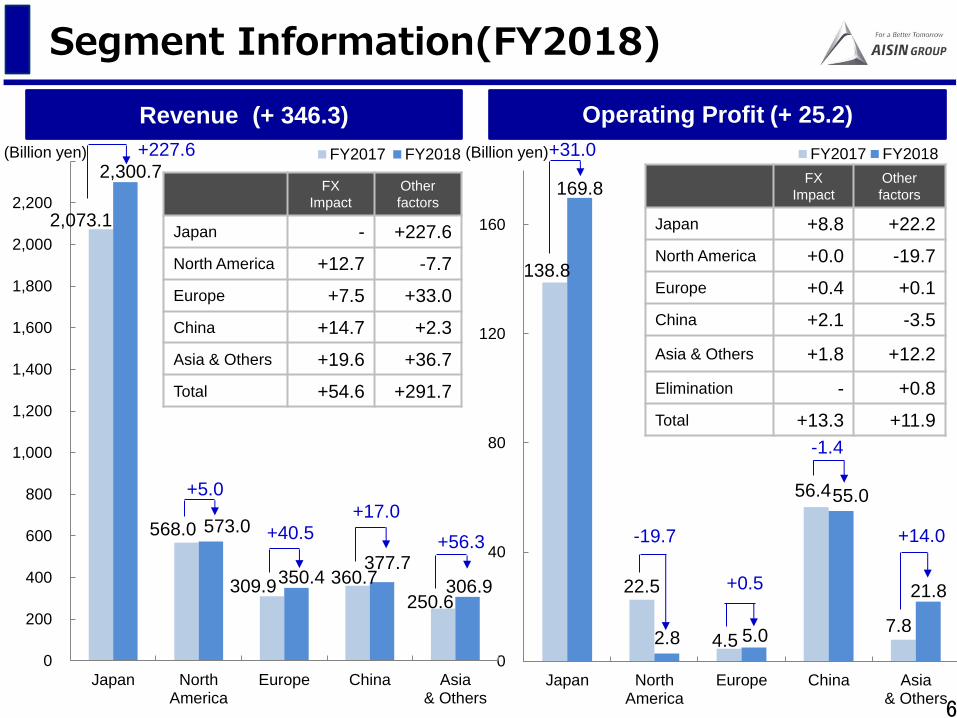
2,073.1
568.0
309.9 360.7
250.6
2,300.7
573.0
350.4 377.7
306.9
0
200
400
600
800
1,000
1,200
1,400
1,600
1,800
2,000
2,200
2,400
Japan NorthAmerica
Europe China Asia& Others
FY2017 FY2018
Revenue (+ 346.3) Operating Profit (+ 25.2)
+227.6
+5.0
+17.0
+56.3 -19.7
+0.5
-1.4
+14.0 +40.5
+31.0
6
Segment Information(FY2018)
(Billion yen)
FX
Impact
Other
factors
Japan - +227.6
North America +12.7 -7.7
Europe +7.5 +33.0
China +14.7 +2.3
Asia & Others +19.6 +36.7
Total +54.6 +291.7
FX
Impact
Other
factors
Japan +8.8 +22.2
North America +0.0 -19.7
Europe +0.4 +0.1
China +2.1 -3.5
Asia & Others +1.8 +12.2
Elimination - +0.8
Total +13.3 +11.9
(Billion yen)
FY2017
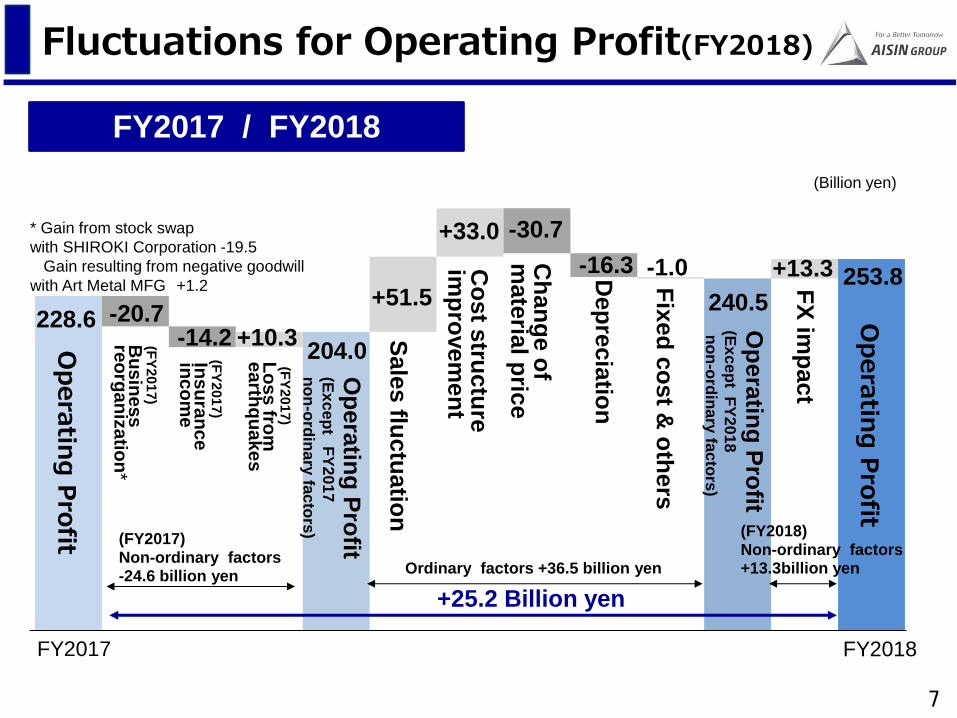
228.6 -20.7 +10.3
+51.5
FY2018
-14.2
7
Fluctuations for Operating Profit(FY2018)
FY2017 / FY2018
Op
era
ting
Pro
fit
Op
era
ting
Pro
fit
Bu
sin
es
s
reo
rga
niz
atio
n*
Lo
ss fro
m
ea
rthq
ua
ke
s
(FY
20
17
)
(FY
2017)
(FY
20
17
)
Insu
ran
ce
inc
om
e
204.0
+33.0 -30.7
-16.3 -1.0
240.5
Op
era
ting
Pro
fit (E
xc
ep
t
no
n-o
rdin
ary
fac
tors
)
FY
20
18
+13.3 253.8
(Billion yen)
* Gain from stock swap
with SHIROKI Corporation -19.5
Gain resulting from negative goodwill
with Art Metal MFG +1.2
Op
era
ting
Pro
fit (E
xc
ep
t
no
n-o
rdin
ary
fac
tors
)
FY
20
17
Sale
s flu
ctu
atio
n
Co
st s
tructu
re
imp
rovem
en
t
Ch
an
ge o
f m
ate
rial p
rice
Dep
recia
tion
Fix
ed
co
st &
oth
ers
FX
imp
act
(FY2017) Non-ordinary factors -24.6 billion yen
Ordinary factors +36.5 billion yen
+25.2 Billion yen
(FY2018) Non-ordinary factors +13.3billion yen

+5.5 -0.2
+6.6
+0.7
-6.8
8
Fluctuations for Operating Profit(FY2018)
FY2018(Feb 2nd Forecast) / FY2018(Result)
Op
era
ting
Pro
fit (F
ore
cast in
Feb
)
248.0
253.1 253.8 O
pera
ting
Pro
fit (E
xc
ep
t
no
n-o
rdin
ary
fac
tors
)
Op
era
ting
Pro
fit
FX
imp
act
Sale
s flu
ctu
atio
n
Ch
an
ge o
f m
ate
rial p
rice
Dep
recia
tion
Fix
ed
co
st &
oth
ers
(Billion yen)
Ordinary factors +5.1 billion yen
+5.8 Billion yen
Non-ordinary factors +0.7 billion yen
FY2018
(Forecast in Feb) FY2018
(Result)

9
2.Consolidated Operating Forecast (FY2019)
FY2018 FY2019 change
Results Rate to
Revenue % Forecast
Rate to
Revenue % Amount %
Revenue 3,908.9 - 3,980.0 - +71.1 +1.8
Operating Profit 253.8 6.5 255.0 6.4 +1.2 +0.5
Profit before
income taxes 268.1 6.9 270.0 6.8 +1.9 +0.7
Profit for the
period * 134.5 3.4 133.0 3.3 -1.5 -1.2
EPS 490.22 yen
- 493.52 yen
- +3.3
yen +0.7
FX Rate USD 111 yen USD 105yen -6 yen -5.4
CNY 16.8 yen CNY 16.6 yen -0.2 yen -1.2
Toyota
production (10,000 Unit)
892 887 -5 -0.5
AT sales (10,000 Unit)
983 1,050 +67 +6.9
10
Consolidated Operating Forecast (FY2019)
(Billion yen)
Pre
-co
nditio
ns
* Profit for the period attributable to Owners of the parent

291.5 283.0
122.1 169.1
104.7 102.8
85.4 101.2
95.8 98.7
84.6 96.2 88.6 91.2 80.7 87.0 74.6 74.9 54.9
74.5 59.9
60.3
376.5
413.1
0
200
400
600
800
1,000
1,200
1,400
1,600
1,800
FY2018 FY2019
VW&Audi
PSA
BMW
GM
FY2018 Revenue
FY2019 Revenue (+ 71.1)
Other Auto Makers sales breakdown
-8.5
+47.0
-1.9
+15.8
+2.9
+11.6
+2.6
+0.3 +19.6
+6.3
+132.7
+0.4
+36.6
11
Forecast of Sales by Customer(FY2019)
3,908.9 Toyota
Group
2,267.1 (58.0%)
Life & others
Other
Auto Makers
122.5 (3.1%)
1,519.3 (38.9%)
3,980.0 Toyota
Group
2,196.0 (55.2%)
Other
Auto Makers 1,652.0 (41.5%)
Life & others 132.0 (3.3%)
(Billion yen)
(Billion yen) Chinese OEMs Total
230.1⇒282.1(+52.0)
(Billion yen)
1,652.0
1,519.3
VOLVO
SUZUKI
Mitsubishi
Guangzhou Automobile
NISSAN
HONDA Changan Automobile
Others
2,300.7
573.0
350.4 377.7 306.9
2,349.0
553.0
349.0 406.0
323.0
0
200
400
600
800
1,000
1,200
1,400
1,600
1,800
2,000
2,200
2,400
2,600
Japan NorthAmerica
Europe China Asia& Others
FY2018 FY2019
169.8
2.8 5.0
55.0
21.8
159.8
9.9 4.5
52.9
27.9
0
40
80
120
160
Japan NorthAmerica
Europe China Asia& Others
FY2018 FY2019
Revenue (+71.1) Operating Profit (+ 1.2)
+48.3
-20.0
+28.3 +16.1
-0.5
-2.1
+6.1 -1.4
-10.0
+7.1
12
Forecast of Segment Information(FY2019)
(Billion yen) (Billion yen)
FX
Impact
Other
factors
Japan - +48.3
North America -30.7 +10.7
Europe +0.1 -1.5
China -2.8 +31.1
Asia & Others -6.2 +22.3
Total -39.7 +110.8
FX
Impact
Other
factors
Japan -7.5 -2.5
North America -0.5 +7.6
Europe +0.0 -0.5
China -0.3 -1.8
Asia & Others +0.0 +6.1
Elimination - +0.7
Total -8.4 +9.6

FY2018
253.8
13
Forecast of Fluctuations for Operating Profit(FY2019)
FY2018 / FY2019
Op
era
ting
Pro
fit
(Fo
recast)
Op
era
ting
Pro
fit
Sale
s flu
ctu
atio
n
Co
st s
tructu
re
imp
rovem
en
t
Ch
an
ge o
f m
ate
rial p
rice
Dep
recia
tion
Fix
ed
co
st &
oth
ers
Op
era
ting
Pro
fit (E
xc
ep
t
no
n-o
rdin
ary
fac
tors
) F
Y2
01
8
Ordinary factors +9.6 billion yen
Non-ordinary factors - 8.4billion yen
+1.2 Billion yen
FX
imp
act
+33.0
+36.0 -8.0
-21.6
-29.8
263.4 255.0 -8.4
(Billion yen)
FY2019 (forecast)

14
3.Reference information
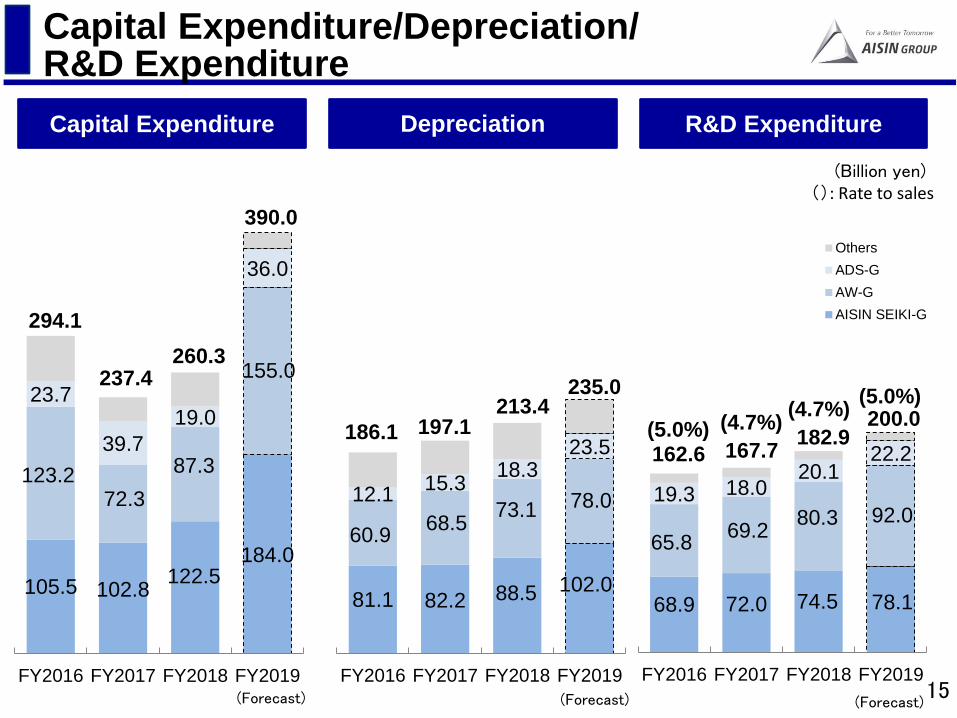
81.1 82.2 88.5 102.0
60.9 68.5
73.1 78.0 12.1 15.3
18.3 23.5
FY2016 FY2017 FY2018 FY2019
68.9 72.0 74.5 78.1
65.8 69.2
80.3 92.0 19.3 18.0
20.1 22.2
FY2016 FY2017 FY2018 FY2019
Others
ADS-G
AW-G
AISIN SEIKI-G
105.5 102.8 122.5
184.0
123.2 72.3
87.3
155.0 23.7
39.7
19.0
36.0
FY2016 FY2017 FY2018 FY2019
237.4
294.1
390.0
260.3
15
Capital Expenditure/Depreciation/ R&D Expenditure
Capital Expenditure Depreciation R&D Expenditure
(Billion yen)
186.1 197.1 213.4
235.0
(Forecast) (Forecast) (Forecast)
162.6 167.7 182.9
200.0 (5.0%)
(4.7%) (5.0%)
(4.7%)
(): Rate to sales

74 73 74 70
80 83 76 74
80 76 81 75
80 81 83 88
FY2016 FY2017 FY2018 FY2019(Forecast)
4Q
3Q
2Q
1Q
314
146 153 143 145
152 148 147 151
140 151 151 150
135 144 137 134
FY2016 FY2017 FY2018 FY2019(Forecast)
220 226 217 215
232 231 223 225
220 227 232 225
215 225 220 222
FY2016 FY2017 FY2018 FY2019(Forecast)
887 887 909
16
892
Toyota car production
Toyota Domestic production
Toyota Oversea production
Toyota global production
(10,000 Unit)
313 314 307
573 596 578 580

31 44 43 29
45 45 38
43 47 46
46 46
0
50
100
150
200
FY2016 FY2017 FY2018 FY2019(Forecast)
180 204 233 172 207 234 194
224 258 191
234 258
0
200
400
600
800
1,000
FY2016 FY2017 FY2018 FY2019(Forecast)
37 42 42
41 39 34
43 45 48
39 39 40
0
50
100
150
200
FY2016 FY2017 FY2018 FY2019(Forecast)
869 737
1,050
165 160 159
178
144 160
15 16 13
19 14 13
13 12 13
14 13 14
0
20
40
60
80
FY2016 FY2017 FY2018 FY2019(Forecast)
53 61 61
55
17
983 164
181
Sales Number
AT sales
Navigation System sales
MT sales
Navigation Soft sales
(10,000 Unit) (10,000 Unit)
(10,000 Unit) (10,000 Unit)
Yearly

130 132 119
130
105 120
109 111
70
95
120
145
EUR
USD
16.6 18.8 16.1 16.8
3.4 3.4 3.1 3.4
0.0
5.0
10.0
15.0
20.0
25.0
FY2016 FY2017 FY2018 FY2019(Forecast)
CNY
THB
18
Foreign Currency Exchange Rate
Foreign Exchange Rate
Impacts on
Operating Profit Forex Impact on Operating
profit per 1(or 0.1) yen
(yen)
FY2016 FY2017 FY2018 FY2019(Forecast)
USD 1.27 1.34 1.13 1.23
EUR 0.13 0.17 0.19 0.15
THB * 0.80 0.81 1.26 1.41
CNY * 0.54 0.79 0.81 0.88
(Billion yen)
* Impacts of THB and CNY are per 0.1yen.

0
30
60
90
120
150
180
0
30
60
90
120
150
0
600
1,200
1,800
◆
0
500
1,000
1,500
2,000
19
◆
◆ ◆
4.7%
◆
◆ ◆ 7.9%
◆
Financial Results of the Main Consolidated Companies Ⅰ
AISIN SEIKI Group
AISIN AW Group
1,503.0 1,641.9
70.8 80.5
1,776.2
78.0 70.0
1,680.0
FY2016 FY2017 FY2018 FY2019(Forecast)
(Billion yen)
(Billion yen)
(Billion yen)
(Billion yen)
FY2016 FY2017 FY2018 FY2019(Forecast)
1,276.6
101.0 122.9
1,431.1 1, 621.2
141.9
1,720.0
147.0
4.9% 4.4% 4.2%
8.6% 8.8% 8.5%

0
2
4
6
8
10
12
0
10
20
30
0
50
100
150
200
0
100
200
300
400
20
◆
◆
◆
◆
4.3% 3.2%
4.5% 4.1%
◆
◆
◆
◆
3.4%
1.0%
5.3%
0.0%
AISIN Takaoka Group
AISIN AI Group
FY2016 FY2017 FY2018 FY2019(Forecast)
FY2016 FY2017 FY2018 FY2019(Forecast)
8.8
275.9 273.0
12.3
295.7
11.9 13.0
300.9
(Billion yen)
(Billion yen)
133.9 137.8
1.3 0.0
154.7 8.1
156.9
5.4
(Billion yen)
(Billion yen)
Financial Results of the Main Consolidated Companies Ⅱ
0
5
10
15
20
25
0
200
400
600
800
21
◆
◆
◆
◆
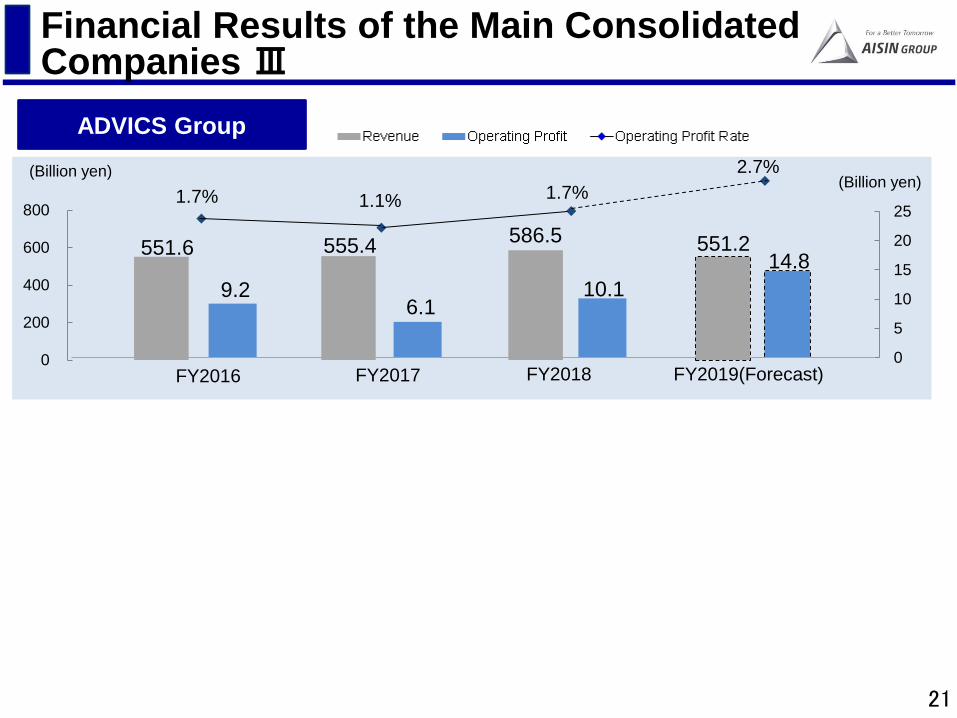
2.7%
1.7% 1.1% 1.7%
FY2016 FY2017 FY2018 FY2019(Forecast)
ADVICS Group
(Billion yen) (Billion yen)
551.6 555.4
9.2 6.1
586.5
10.1
551.2 14.8
Financial Results of the Main Consolidated Companies Ⅲ
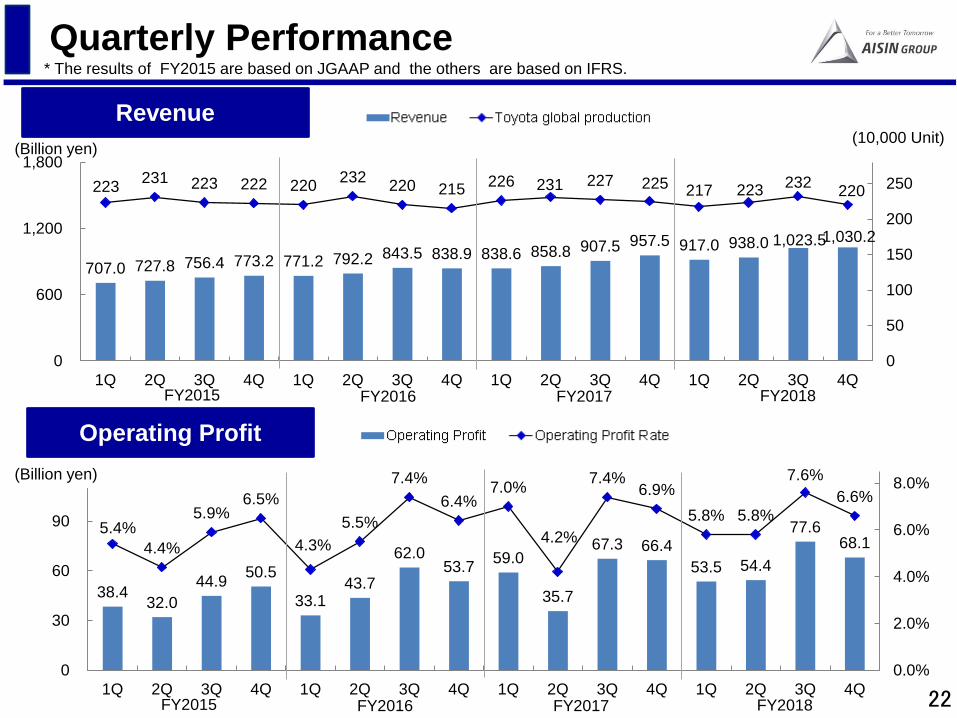
707.0 727.8 756.4 773.2 771.2 792.2 843.5 838.9 838.6 858.8 907.5 957.5 917.0 938.0 1,023.5 1,030.2
223 231 223 222 220
232 220 215
226 231 227 225 217 223 232
220
0
50
100
150
200
250
0
600
1,200
1,800
1Q 2Q 3Q 4Q 1Q 2Q 3Q 4Q 1Q 2Q 3Q 4Q 1Q 2Q 3Q 4Q
38.4 32.0
44.9 50.5
33.1 43.7
62.0 53.7
59.0
35.7
67.3 66.4
53.5 54.4
77.6 68.1
5.4%
4.4%
5.9% 6.5%
4.3%
5.5%
7.4%
6.4% 7.0%
4.2%
7.4% 6.9%
5.8% 5.8%
7.6%
6.6%
0.0%
2.0%
4.0%
6.0%
8.0%
0
30
60
90
120
1Q 2Q 3Q 4Q 1Q 2Q 3Q 4Q 1Q 2Q 3Q 4Q 1Q 2Q 3Q 4Q22
Quarterly Performance
Operating Profit
Revenue
* The results of FY2015 are based on JGAAP and the others are based on IFRS.
FY2015 FY2016 FY2017 FY2018
FY2015 FY2016 FY2017 FY2018
(10,000 Unit) (Billion yen)
(Billion yen)

1,434.8 1,529.7 1,563.4 1,682.5 1,697.5
1,865.0 1,855.1 2,053.8
454 445 451 436 457 452 440 452
0
120
240
360
480
0
600
1,200
1,800
2,400
3,000
1st H 2nd H 1st H 2nd H 1st H 2nd H 1st H 2nd H
70.5
95.5
76.8
115.8
94.8
133.8
108.0
145.7
4.9%
6.2%
4.9%
6.9%
5.6%
7.2%
5.8%
7.1%
0.0%
2.0%
4.0%
6.0%
8.0%
0
30
60
90
120
150
180
1st H 2nd H 1st H 2nd H 1st H 2nd H 1st H 2nd H23
Half Yearly Performance * The results of FY2015 are based on JGAAP and the others are based on IFRS.
Operating Profit
Revenue
(Billion yen) (10,000 Unit)
(Billion yen)
FY2015 FY2016 FY2017 FY2018
FY2015 FY2016 FY2017 FY2018

35 45 50 50 60 60
60 50 50 75
90 90
29.7%
34.7%
28.2% 28.1% 30.6% 30.4%
0%
5%
10%
15%
20%
25%
30%
35%
0
50
100
150
200
FY2014 FY2015 FY2016 FY2017 FY2018 FY2019…24
Dividend per Share * The results before FY2015 are based on JGAAP and the others are based on IFRS.
FY2014 FY2015 FY2016 FY2017 FY2018 FY2019
(Forecast)
Interim 35 45 50 50 60 60
Year-end 60 50 50 75 90 90
Total 95 95 100 125 150 150
Dividend Payout Ratio 29.7% 34.7% 28.2% 28.1% 30.6% 30.4%
Repurchase of Treasury
Stock (billion yen) 0.0 0.0 0.0 49.0 59.4 -
Total return Ratio(*) 29.7% 34.7% 28.2% 66.5% 74.5% -
Div
ide
nd
(yen)
(*) Total return Ratio= (Cash dividend paid + repurchase of treasury Stock) / Profit for the period
95 95 100
125
150 150