fy2016 fy2018 triennial performance audit of the
TRANSCRIPT

1
FY2016 – FY2018
Triennial Performance
Audit of the Metropolitan
Transit System (MTS)
FINAL AUDIT REPORT
JUNE 2019
JUNE 2019
AUGUST 2018
Prepared For:
San Diego Association of Governments
401 B Street, Suite 800
San Diego, CA 92101
Prepared By:
Yonel Grant
100 W San Fernando Street Suite 250
San Jose, CA 95113
669-800-1984

2
TABLE OF CONTENTS
Executive Summary ................................................................................................................................... 3
SECTION I: INTRODUCTION ................................................................................................................... 5
I.1. Overview ................................................................................................................................... 7
I.2. Accomplishments and Challenges ............................................................................................ 9
I.3. Report Outline ......................................................................................................................... 13
SECTION II: COMPLIANCE REVIEW AND PRIOR AUDIT RECOMMENDATIONS ............................. 14
II.1. Compliance Review................................................................................................................. 14
II.2. Prior Audit Recommendations ................................................................................................ 14
SECTION III: MANAGEMENT CONTROL AND REPORTING ............................................................... 19
SECTION IV: PERFORMANCE TRENDS AND FUNCTIONAL REVIEW .............................................. 21
IV-1. System-wide Performance .......................................................................................................... 22
IV-2. MTS – Directly Operated Bus Operations Performance ............................................................. 24
IV-3. MTS – Contracted Bus Operations ............................................................................................. 28
IV-3.1. MTS – Contracted Bus Fixed Route Services ......................................................................... 29
IV-3.2. MTS – Commuter Express Services ........................................................................................ 30
IV-3.3. MTS – Contracted Bus Rural Services .................................................................................... 31
IV-3.4 MTS - Sorrento Valley Coaster Connection (SVCC) ............................................................... 32
IV-3.5 MTS – ADA Paratransit Services ............................................................................................. 34
IV-4. MTS – Rail Operations Performance ......................................................................................... 35
SECTION V: CONCLUSIONS AND RECOMMENDATIONS ................................................................. 41

3
EXECUTIVE SUMMARY Transit operators that receive Transportation Development Act (TDA) funds are required to
undergo triennial performance audits in the State of California. Triennial performance audits are a
requirement for the continued receipt of State TDA funds for public transit under California Public Utilities
Code (PUC) Section 99246. This performance audit is administered by the San Diego Association of
Governments (SANDAG) and prepared by Kimley-Horn and Associates. This report represents the State-
mandated performance audit of the San Diego Metropolitan Transit System (MTS) for Fiscal Years 2016,
2017, and 2018, the period from July 1, 2015 through June 30, 2018.
The TDA triennial performance audit of MTS includes evaluations of:
– Compliance with pertinent sections of the Public Utilities Code
– Progress to implement prior performance audit recommendations
– Agency goals and objectives and performance monitoring systems
– Systemwide and functional area performance trends.
The objective of the performance audit is to assess compliance with PUC requirements, identify
significant achievements as well as opportunities for improvement, and develop recommendations for
short- and long-term efficiency and effectiveness improvements.
Several audit period accomplishments and challenges were noted. Major accomplishments include:
– Safety awards for both rail and for bus
– Transit Optimization Plan (TOP) study, implemented during 2018 and 2019
– Financial sustainability actions, including naming rights, advertising and continued migration to
401k style plan
– Implementation of SAP project
– Advancement of Compass Program upgrade and re-brand
– Rehabilitation of the South Bay, East County, and opening of the Courthouse Trolley Station.
– Ongoing development of Mid-Coast Trolley extension project.
A decrease in ridership is noted as the most significant challenge during the audit period. Other
challenges included unfunded mandates (e.g., zero-emission requirements), recruiting in a tight economy,
and planning for new technology in a new environment.
MTS is in compliance with Public Utilities Code (PUC) requirements and the implementation of
prior audit recommendations:
– Compliance with PUC Requirements: MTS is in compliance with all PUC requirements.
– Progress to Implement Prior Audit Recommendations: There were no prior audit
recommendations regarding PUC requirements.

4
Performance indicator trends show the following:
– Systemwide operating cost per revenue vehicle hour, a measure of cost efficiency, increased by
12.7% during the audit period to $111.35. During the same period inflation rose 7.9%. The trend
is a result of a 16.3% growth in operating costs and an 3.2% increase in vehicle service hours.
These costs reflect the impact of minimum wage increases in a tight economy and miscellaneous
other expenses such as increasing energy costs. Operating cost per passenger, a measure of
cost effectiveness, increased by 31.6% from $2.53 in FY15 to $3.33 in FY18. This is a result of
the combined 16.3% increase in operating costs and the 11.6% decrease in ridership. The
ridership decline affected all modes (except rural bus) and is a national phenomenon.
– Service productivity declined during the audit period. Passengers per service hour decreased by
14.4% while passengers per service mile decreased by 14.8%. The main contributor to this was
the overall ridership declines. MTS added service as part of the Transit Optimization Plan (TOP)
– adding frequency to core network routes with the highest ridership, and restoration of service
that was cut during the recession.
– Service hours per employee FTE, a measure of labor productivity, increased by 0.6% during the
audit period from 1,018 in FY15 to 1,024 in FY18. Total staffing was stable for MTS during the
audit period, holding steady at about 2,450 FTEs.
– The MTS systemwide farebox recovery ratio decreased during the audit period, from 40.5% in
FY15 to 31.7% in FY18). This is a statistic for all modes and the average masks variances
observed for the individual modes. For all years in the audit period except for FY18, MTS
systemwide farebox recovery was still higher than the 31.9% goal, and significantly higher than
the 20% requirement. MTS has so far not taken the option to make changes in reporting post SB
508.
– The average fare per passenger trip increased by 3.0% during the audit period, from $1.03 to
$1.06. The net cost per passenger trip increased by 51%, from $1.51 in FY15 to $2.27 in FY18.
The systemwide TDA performance trends overall are indicative decreases in ridership, increases in
operating cost, and of the continued attention that MTS placed on cost containment during the audit
period. MTS’ accomplishments position it well for continued cost containment in the future.
One recommendation is noted (see details in Section V). MTS should track and document the farebox
recovery ratio very closely over the next several years both with Senate Bill 508 reporting and without. A
fare increase would bring back farebox revenue back to historical average. Given the other constraints
(ballot measure, coordination with new regional fare structure, new fare collection system implementation)
a new fare increase is not expected in the immediate near term but ought to be considered at the earliest
opportunity.

5
SECTION I: INTRODUCTION The TDA triennial performance audit of the San Diego Metropolitan Transit System (MTS) follows state
guidelines. Triennial performance audits are a requirement for the continued receipt of State
Transportation Development Act (TDA) funds for public transit under California Public Utilities Code
(PUC) Section 99246. The San Diego Association of Governments (SANDAG) is responsible for
administering the conduct of performance audits in the San Diego Region. SANDAG has retained
Kimley-Horn & Associates to conduct the performance audit of MTS. This report represents the State-
mandated performance audit of MTS for Fiscal Years 2016, 2017, and 2018, the period from July 1, 2015
through June 30, 2018.
The TDA triennial performance audit of MTS includes evaluations of:
– Compliance with pertinent sections of the Public Utilities Code
– Progress to implement prior performance audit recommendations
– System wide performance trends for efficiency and effectiveness
– Functional area performance results
– Opportunities to improve the efficiency and effectiveness of operations.
The objective of the performance audit is to identify significant achievements as well as opportunities for
improvements, and to provide recommendations for short- and long-term efficiency and effectiveness
improvements.
The methodology for the MTS audit included site visits, interview, and data collection and analysis.
Interviews were conducted with personnel responsible for the management and oversight of MTS
services:
– Chief Executive Officer
– Chief Financial Officer
– Chief Operating Officer, Trolley
– Chief Operating Officer, Transit (Interim)/Director of Fleet and Facility Maintenance
– Chief of Staff
– Director of Human Resources and Labor Relations
– Director of Marketing and Communications
– Chief of Police
– General Counsel
– Internal Auditor
– Director of Financial Planning & Analysis
– Procurement Manager

6
– Manager of Planning
– Manager of Capital Projects (Bus)
– Assistant Superintendent of Transportation
– Superintendent of Light Rail Vehicle Maintenance
– Assistant Superintendent of Light Rail Vehicle Maintenance
– Director of Transportation
– Manager of Training (Bus)
– Manager of Transportation Communication and Technology
– Transit Operations Specialist
– Senior Transportation Planner
– Enterprise Business Solutions Manager
– Operating Budget Supervisor
– TransDev Project Manager
– Manager of South Bay and East County Operations/Manager of Contract Operations &
Passenger Facilities
– Manager of Fleet and Facility Maintenance
– Manager of Paratransit and Mini Bus
– Transit Services Data Analyst
– Rail Operations Analyst/Manager of Service Quality (Rail)
– Systems Safety Manager
– Director of Capital Projects
Background documents and other written information including those identified in Exhibit I-1 were
collected and reviewed:
Exhibit I-1: MTS Background Documents and Written Information Reviewed
Organization and staffing charts
Maps & Brochures Re-Services
Organization Goals, Objectives,
Policies and Procedures, FY16-
FY18
Form C Reports-Formerly B10,
National Transit Database (NTD)
Reports, FY16-FY18
State Controller Reports, FY16-
FY18
Annual Budget Documents,
FY16-FY18
Labor Agreements
Service Contracts
Sample Monthly Reports and
Invoice Contractors
Short Range Transit Plan

7
B11
Year-End Performance Reports
to Board and Management,
FY16-FY18
Customer Satisfaction Survey,
FY16, FY18
Rail Fleet Management Plan,
FY16
Vehicle Assignment Policy, FY18
Financial Audit Reports and
Letters, FY16-FY18
Sample Routine Performance
Reports by Functional Managers,
FY16-FY18
Bus Maintenance Plan, FY18
Community Impact Report, 2018
CHP Terminal Inspection & Pull-
out Notice Reports, FY16-FY18
Mobile Phone Usage Survey,
FY15, FY17
System Safety Program Plan,
FY15
Transit Asset Management Plan,
2018
The audit team also:
– Conducted on-site interviews with MTS management and staff responsible for administering,
managing, and operating the transit system, including staff from MTS Bus Operations, MTS Rail
Operations, and other functions (e.g., marketing, finance, planning, human resources, and legal).
– Assessed compliance with applicable Public Utilities Code Sections, including progress and
performance results relative to prior audit recommendations.
– Compiled and analyzed performance indicator trend information for the system and the individual
operations, as well as for major functional areas.
I.1. Overview
MTS operates motorbus, light rail, and demand response services throughout the southern portion of the
urbanized areas of San Diego County, as well as rural parts of east San Diego County not served by the
North County Transit District (NCTD). The name MTS began being used in 2005, reflecting a name
change of the former Metropolitan Transit Development Board (MTDB). At the end of the audit period, the
MTS transit system includes three light rail lines with 53 stations, 100 fixed bus routes and ADA
complementary paratransit (MTS Access). MTS Bus operations has a fleet of 793 buses and operates
more than 2 million revenue hours. MTS rail operations operates 128 light rail vehicles over 54.3 miles of
track. The service area includes the cities of San Diego, Chula Vista, Coronado, El Cajon, Imperial
Beach, La Mesa, Lemon Grove, National City, Poway, Santee and a portion of the unincorporated area of
San Diego County.
MTS responsibilities include service planning, performance monitoring and analysis, and the activities
required to administer, fund and deliver transit services within this service area either directly or through
contracts with other service providers. These services include:
– Directly Operated Bus
– Trolley
– Contracted Fixed Route
– Commuter Express

8
– Rural Service
– General Public Paratransit - Sorrento Valley Coaster Connection (SVCC)
– Americans with Disabilities Act (ADA) Demand Response Service (MTS Access).
Each of these services that MTS provides is described in Section IV: Performance Trends and Functional
Review. The section provides TDA performance indicators for the MTS system as a whole, as well as
performance indicators for each service type individually.
MTS is governed by a 15-member Board of Directors that includes:
• Four appointed from the City of San Diego (the Mayor of San Diego and 3 San Diego City Council members)
• Two appointed from the City of Chula Vista (the Mayor of Chula Vista and a Chula Vista City Council Member)
• One appointed from each city council of Coronado, El Cajon, Imperial Beach, La Mesa, Lemon Grove, National City, Poway and Santee
• One appointed from the San Diego County Board of Supervisors.
Exhibit I-2 shows the high-level MTS organization chart. San Diego Transit includes all motorbus (directly
operated and contracted) and demand response services. San Diego Trolley is the light rail system.
Exhibit I-2: MTS Organization Chart
There were no changes to MTS fares during the audit period, from July 1, 2015 to July 1, 2018.
The primary fare types as of June 30, 2018, are the cash fare ($2.25 for local, Rapid routes 201/202, 204,
and 215, urban and shuttle routes, $2.50 for the Trolley, Rapid routes 235 and 237, and express routes,
MTS Board of Directors
San Diego Transit
Chief Operating Officer (Bus)
San Diego Trolley
Chief Operating Officer (Rail)
Planning, Government Affairs, Taxicab Admin
Chief of Staff
Security
Director of Transit
System Security
Marketing
Director of Marketing and Communications
Finance
Chief Financial Officer
Legal
General Counsel
Human Resources
Director of Human Resources and Labor
Relations
Administrative Departments
Chief Executive Officer Executive Assistant/Clerk
of the Board

9
$5.00 for Rapid express/premium routes, and $5 to $10 for rural routes); the Day Pass ($5.00 for most
services), and the Monthly Pass ($72 for regional, $100 for rapid express/premium). Discounts are
applicable for seniors and persons with disabilities, and special fare products for college students, youth,
social service agencies, stadium services, and class trips. SANDAG is responsible for fare policy and fare
setting in San Diego County.
I.2. Audit Period Accomplishments and Challenges
MTS accomplishments during the audit period can be summarized as follows:
• Safety
• Ridership stabilization and changes to service
• Financial sustainability
• Technology initiatives
• Capital renewal and investment
Safety – In May 2017, MTS won the APTA GOLD award for Safety, the second bus safety award
received in three years. MTS created the “Pause, Focus, Look” campaign to renew focus on driving
safety. The campaign included enhancements to the buses and visibility conditions, new training
technology using drone video footage, and increased visual safety cues to drivers. Before the program,
MTS recorded ten preventable pedestrian accidents from 2013 to March 2016. After the campaign and
until the end of 2016, zero pedestrian accidents were recorded.
In June 2018, MTS was presented the APTA Rail Safety Gold award, presented at the APTA Rail
conference held in Denver, Colorado. The award represents the culmination of years of hard work and
recognizes MTS safety performance for light rail and efforts to continuously improve safety (e.g., rule of
the week, regular goals and stretch goals). Preventable accidents per 100,000 vehicle miles continued
their downward trend during the audit period and Trolley had zero preventable accidents in FY16 or
FY17. MTS exhibits the best safety record in the State of California among large light rail operators.
Ridership Stabilization and Changes to Service – In response to declining ridership, MTS launched
the Transit Optimization Plan (TOP) study. It had several components: Market Analysis, Service
Evaluation, Implementation Plan. The work started in spring 2016 and the Board approved TOP
recommendations in September 2017. Service changes were made occurred over four shake ups from
January 2018 to January 2019 (i.e., half within the audit period, and half just after). Low performing
services were trimmed in June 2017. While it too early to definitely assess the results, ridership appears
to have bottomed out and the route-by-route tracking is a useful tool in gauging progress. MTS also
introduced its South Bay BRT service and saw large increases in the Blue Line and the rural bus
services.
In parallel, MTS has engaged in aggressive marketing activities. These include the Choose Transit
campaign to enlist the support of cities, military and universities; Free Ride Day; UPass for the University
of California San Diego, and mobile ticketing.
Financial Sustainability – MTS constantly evaluates financial sustainability decisions, ranging from
investing into computer systems, rehabilitating infrastructure, holding the line on wages, to energy
purchases. One of the first operators in the country to do so, MTS secured new long-term revenue
sources through naming rights of two trolley lines. The Blue and Green lines were renamed the “UC San
Diego Blue Line” and “Sycuan Green Line” respectively. The contracts have a long-term horizon,
providing funding of at least $675,000 per year and $600,000 per year, respectively. When the Mid-Coast

10
extension is complete, this will further increase the blue line naming rights revenues to $945,000 and
there is a provision for inflation.
In an effort intended to boost advertising revenues combined with state of good repair, MTS is in the
process of installing 600 bus shelters and 1,850 bus benches. Combined, these provide roughly $1
million of advertisement revenues per year.
To decrease fare evasion rates, MTS implemented a new beat system and reported 2.8% fare evasion.
This is on the low end of the spectrum of peer transit systems that report the percentages of trips where
fare is evaded. A pair of code compliance officers and contracted security workers patrolled a chosen
station twice a week and performed a ticket check. Fifty of these checks were performed in 2018.
MTS continues to benefit from its transition to a 401k style plan instead of a pension plan. Though the
shift was made in the prior audit period, each year that passes sees a higher percentage of employees
transitioned over. For example, by FY18, approximately 55% of bus operators are now in the 401k plan.
Ultimately, all of them will be.
During the second half of the audit period, MTS developed its own Transit Asset Management (TAM)
plan. Through this effort, MTS assessed many of its assets useful lives to optimize the lifecycle cost. For
example, MTS analyzed operating costs per mile for a given age of a bus and found diminishing returns
after the 13th year. Asset useful lives are an integral assumption that feeds into the agency 20-year
Capital Improvement Program (CIP).
The combination of low unemployment and increased minimum wage led to challenges with recruitment.
With the unemployment rate under 5% throughout the audit period and now closer to 3%, recruitment
efforts were restructured to attract potential new employees. Internally, MTS dedicated one full time staff
member to recruitment; this position was rotated amongst a team four. Externally, potential bus driver
candidates were given immediate interviews at job fairs and response time between interviews and the
process for offer letters was shortened.
Finally, MTS is having some detailed discussions on more clearly defining capital and operating budget
items as some may categorize better as capital rather than operating cost and vice versa.
Technology Initiatives – During the audit period, MTS implemented a complex technology project, SAP,
and made significant strides in advancing the Compass Program upgrade and re-brand.
MTS launched its ERP/EAM software which went live on January 1, 2016 at the beginning of the audit
period, with approximately a year planned for implementation. The endeavor involved all MTS
departments with emphasis on Finance. MTS has seen a reduction in lag time for procurements and a
more streamlined approach to budgeting and scheduling. On the bus maintenance side, the adoption was
straightforward, staff were on board immediately for work orders and to order parts. On the rail
maintenance side, adoption of the new system was also fast but a glitch caused the staff to have to
rebuild the inventory from scratch. Nevertheless, the staff believes the up-to-date-information will yield
efficiencies moving forward as well as provide a better opportunity to mine information for trends.
On the customer facing end, MTS has made improvements to and are planning a complete re-design of
the Compass fare system. In March 2017, MTS launched a mobile ticketing application called Compass
Cloud (with North County Transit District) that provides a platform to purchase fares that could be stored
on devices and activated when needed. In parallel, during the audit period MTS started the process of
upgrading its entire fare system and re-branding the Compass program. This initiative is in response to
the Compass system’s obsolescence and will include a new fare schedule. MTS brought contractor Init to

11
become the new system vendor and expects to launch the new system in June 2021 to coincide with the
opening of the UCSD Blue Line extension (Mid Coast).
Another accomplishment during this time was the successful launch of the OneBusAway app, which
provides real-time transit information (for bus and trolley) on both iPhones and Android devices.
Capital Renewal and Replacement – During the audit period, MTS wrapped up its Trolley Renewal
Project targeting the Blue and Orange Lines. MTS completed the rehabilitation of the South Bay Division
(part of South Bay Rapid project, required to accommodate the articulated buses). MTS also completed
the rehabilitation of the East County Division, a separate project.
A highlight was the October 2016 opening of the East County operations and maintenance facility in El
Cajon. The 5.5 acre facility holds a LEED Silver certification and accommodates 120 CNG buses and 129
employees (operators and mechanics). This is also where the 24 diesel over the road coaches are
domiciled.
In April 2018, MTS opened the Courthouse Trolley Station, the western terminus for the Orange Line.
This station addressed constraints for a terminus at America Plaza and was designed in preparation of
the Mid Coast LRT extension opening. The station provides access for 44,500 jobs within a half mile
radius. The project was completed using a $31.9 million grant fund from the Transit and Intercity Rail
Capital Program (TIRCP). This cap and trade fund has also assisted in the procurement of nine new rail
vehicles to add services to the Blue Line.
MTS challenges during the audit period can be summarized as follows:
• Ridership
• Unfunded mandates
• Recruiting in a tight economy
• Planning for new technology in a new environment
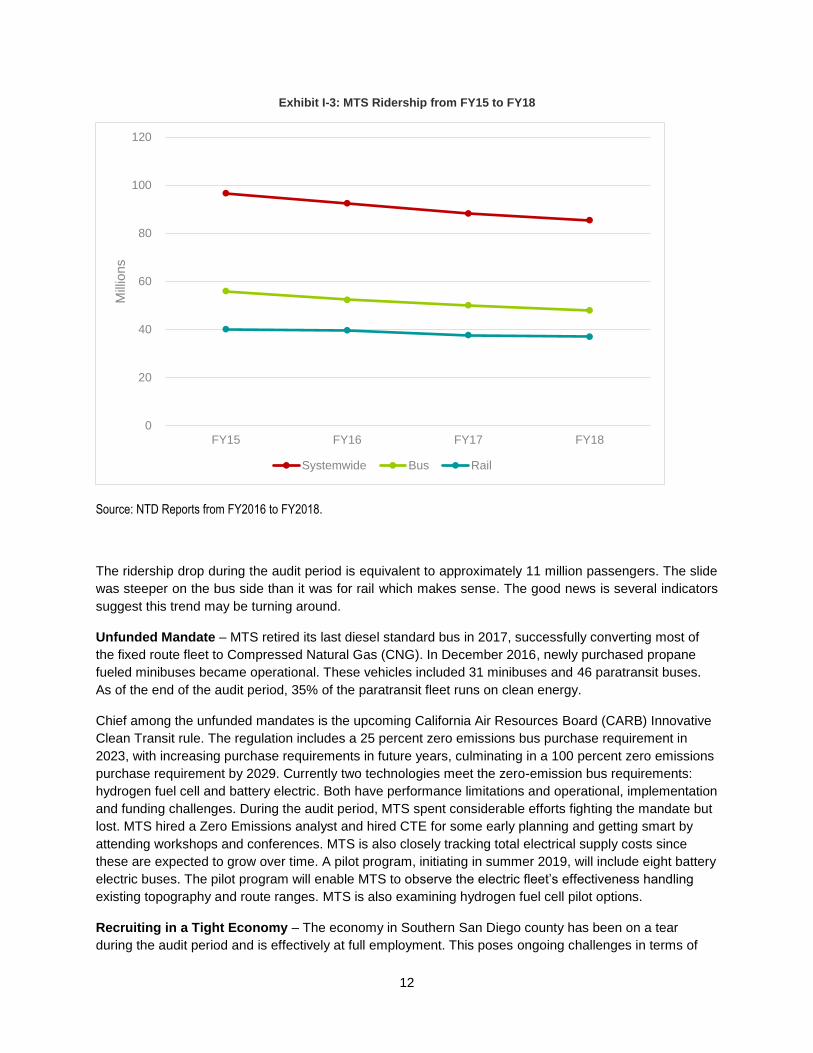
Ridership – In FY15, MTS experienced its highest ridership ever with 96.7 million total passenger trips. A
“perfect storm” of reasons – listed below – resulted in a 11.6% ridership decrease in the three years
following FY15, as shown in the chart below. The ridership drop follows a California-wide and in fact a
national trend in ridership decreases and ridership demand for MTS was in fact peaking in FY15 when it
was already declining in other markets.
Among often-cited reasons for the decline include: historically low fuel prices, Assembly Bill 601; the rising
cost of living in Southern San Diego county which is causing transit dependents to move to more
remote/suburban, lower density areas that are challenging to effectively serve with transit, Transportation
Network Companies; zero or low cost of parking in many locations; and other factors.
In the past, ridership was fairly highly correlated with employment. This does not appear to be the case
any more.
1 Assembly Bill 60 (2013) authorized applicants unable to submit satisfactory proof of legal presence in the United
States, but able to meet other qualifications for licensure and provide satisfactory proof of identity and California residency, to obtain California Driver Licenses
12
Exhibit I-3: MTS Ridership from FY15 to FY18
Source: NTD Reports from FY2016 to FY2018.
The ridership drop during the audit period is equivalent to approximately 11 million passengers. The slide
was steeper on the bus side than it was for rail which makes sense. The good news is several indicators
suggest this trend may be turning around.
Unfunded Mandate – MTS retired its last diesel standard bus in 2017, successfully converting most of
the fixed route fleet to Compressed Natural Gas (CNG). In December 2016, newly purchased propane
fueled minibuses became operational. These vehicles included 31 minibuses and 46 paratransit buses.
As of the end of the audit period, 35% of the paratransit fleet runs on clean energy.
Chief among the unfunded mandates is the upcoming California Air Resources Board (CARB) Innovative
Clean Transit rule. The regulation includes a 25 percent zero emissions bus purchase requirement in
2023, with increasing purchase requirements in future years, culminating in a 100 percent zero emissions
purchase requirement by 2029. Currently two technologies meet the zero-emission bus requirements:
hydrogen fuel cell and battery electric. Both have performance limitations and operational, implementation
and funding challenges. During the audit period, MTS spent considerable efforts fighting the mandate but
lost. MTS hired a Zero Emissions analyst and hired CTE for some early planning and getting smart by
attending workshops and conferences. MTS is also closely tracking total electrical supply costs since
these are expected to grow over time. A pilot program, initiating in summer 2019, will include eight battery
electric buses. The pilot program will enable MTS to observe the electric fleet’s effectiveness handling
existing topography and route ranges. MTS is also examining hydrogen fuel cell pilot options.
Recruiting in a Tight Economy – The economy in Southern San Diego county has been on a tear
during the audit period and is effectively at full employment. This poses ongoing challenges in terms of
0
20
40
60
80
100
120
FY15 FY16 FY17 FY18
Mill
ions
Systemwide Bus Rail

13
both recruiting and retention. MTS sometimes loses employees to other companies who offer more
money, or to situations where the schedule can be more flexible (e.g., working for Uber or Lyft). The latter
is a growing challenge with the newer generation. It is difficult recruiting people from outside of San Diego
due to the difference in pay in and cost of living. MTS has addressed this in part my making sure there
are excellent training programs in place to grow from within. MTS has also worked very hard at recruiting,
rotating positions and providing interviews on the spot to help potential bus operators who can’t take time
off from their jobs, for example. Minimum wage increases ripple throughout the organization. In some
cases, MTS has made special adjustments to wages and schedules as well (e.g., for flaggers).
Planning for New Technology in a New Environment – Longer term, an ongoing challenge will be
reinventing MTS services in a new environment which is becoming more congested all the time.
Understanding the impacts of technology such as autonomous vehicles, ubiquitous scooters, changing
behaviors due to Transportation Network Companies, is a big challenge. There are big changes in urban
mobility, with new players coming into the market and some exiting after a short period. MTS needs to
stay on the forefront of this revolution, develop the best alternatives for itself to stay competitive and the
right partnerships to be successful.
I.3. Report Outline
The remainder of the performance audit report is organized into four sections:
– II. Compliance Review: Assesses MTS compliance with specific PUC requirements and
discusses the status of prior audit recommendations.
– III. Management Control and Reporting: Examines the management structure and performance
monitoring systems in place to help reach MTS goals and objectives.
– IV. Performance Trends and Functional Review: Examines system wide performance trends as
well as trends in the major functional areas: operations, maintenance, and planning and
administration.
– V. Conclusions and Recommendations: Outlines recommendations and potential implementation
strategies for MTS to capitalize on improvement opportunities.

14
SECTION II: COMPLIANCE REVIEW AND PRIOR AUDIT
RECOMMENDATIONS The compliance review assesses compliance with PUC requirements and implementation of prior audit
recommendations. Activities conducted by MTS and each of the MTS service providers to comply with
TDA requirements are described in this section. TDA performance indicator results and trends are
discussed in Section IV – Performance Trends and Functional Review.
PUC requirements verified as part of this performance audit include the compliance requirements for
transit operators stipulated in the California Department of Transportation TDA Performance Audit
Guidebook for Transit Operators and Regional Transportation Planning Entities (2008) and TDA Statutes
and California Codes of Regulations (2009).
With the consolidation of operations in the MTS service area, some of the compliance findings have been
made for MTS as a whole. Where appropriate (e.g., where operators continue to file separate financial
audits and State Controller reports), findings have been made for particular MTS services. Please note
that Chula Vista Transit (CVT) information is provided where appropriate and merged with MTS
Contracted Service, also where appropriate, due to the absorption of CVT by MTS in January 2015.
Compliance is assessed at three levels:
– Fully compliant.
– Partially compliant, with additional actions required to achieve full compliance.
– Non-compliant or not applicable.
Compliance to measure progress towards implementing prior audit recommendations has been
measured in three categories:
– Fully implemented.
– Partially implemented but further progress is warranted.
– Not implemented or not applicable.
II.1. Compliance Review
MTS and its contractors are in compliance with the PUC and CAC requirements for urban operators.

15
Code Reference Operator Compliance Requirements, Findings, Verification
PUC Section 99243
Requirement – Uniform System of Accounts and Records: Annual reports based on the Uniform System of Accounts and Records established by the State Controller are submitted to the RTPA within 90 days of the end of the fiscal year (September 30) or 110 days if submitted electronically (approx. October 20). Starting FY17, annual report due within 7 months of the end of the fiscal year (January 31) (AB 1113).
Findings State Controller Report Submittal Dates
MTS Bus: fully compliant Source: State Controller Annual Report
All reports were submitted electronically
MTS Bus: FY16: 18-October-2016 FY17: 25-January-2018 FY18: 28-January-2019
MTS Contracted Bus and Demand Response: fully compliant Source: State Controller Annual Report
All reports were submitted electronically
MTS Contracted Bus: FY16: 18-October-2016 FY17: 25-January-2018 FY18: 28-January-2019
MTS Rail: fully compliant Source: State Controller Annual Report
All reports were submitted electronically
MTS Rail: FY16: 18-October-2016 FY17: 25-January-2018 FY18: 28-January-2019
Chula Vista Transit
Chula Vista Transit: n/a MTS assumed full operations starting in FY16
PUC Section 99245
Requirement – Annual Fiscal Audit: Certified annual fiscal and compliance audits are submitted to the RTPA and State Controller within 180 days of the end of the fiscal year (December 31), or receive 90-day extension (March 31).
Findings Annual Fiscal Audit Submittal Dates
MTS: fully compliant Source: Annual fiscal audits were included as part of the Comprehensive Annual Financial Report.
MTS: FY16: 31-October-2016 FY17: 23-November-2017 FY18: 1-November-2018
Chula Vista Transit Chula Vista Transit: n/a MTS assumed full operations starting in FY16.
PUC Section 99251
Requirement – CHP Certifications: Following inspection of the operator’s terminal, CHP has
certified operator's compliance with Vehicle Code 1808.1 within 13 months prior to each TDA claim
submittal.
Findings CHP Certification Dates
MTS: Fully Compliant
Source: CHP Transit Operator Compliance Certificates
FY16 FY17 FY18
Imperial Ave 7-Jun-16 5-Jul-17 24-Jul-18
Kearny Mesa
16-Jun-16
14-Jun-17
19-Jun-18

16
Code Reference Operator Compliance Requirements, Findings, Verification
MTS Contracted Bus and Demand Response: Fully Compliant Source: CHP Transit Operator Compliance Certificates
FY16 FY17 FY18
First Transit, Copley Park
27-Oct-15
20-Oct-16
18-Oct-17
Transdev, El Cajon
9-Sep-16 15-Sep-17
6-Sep-18
Transdev, South Bay
1-Jan-16 20-Jan-17
9-Feb-18
MTS Rail: not applicable MTS Rail: Vehicle Code 1801.1 does not apply to rail operators.
Chula Vista Transit Chula Vista Transit: n/a MTS assumed full operations starting in FY16.
PUC Section 99261
Requirement – Transportation Planning Agency Regulations: Claims for TDA funds are submitted in compliance with RTPA's rules and regulations for such claims.
Findings Verification
Fully compliant – MTS submits its TDA claims and proper documentation to SANDAG each year.
Review of full claims packet including checklist submitted to SANDAG for the audit period.
PUC Section 99266
Requirement – Budget Changes: Operating budget has not increased by more than 15% over the preceding year unless reasonable justification has been provided.
Findings Percent Growth in Budget
MTS Bus: fully compliant Source: Annual adopted budgets FY16-18
MTS Bus: FY16: +1.6% FY17: - 0.2% FY18: +4.2%
MTS Contracted Bus and Demand Response: fully compliant Source: Annual adopted budgets FY16-18
MTS Contracted Bus: FY16: +5.7% FY17: +3.2% FY18: +1.6%
MTS Rail: fully compliant Source: Annual adopted budgets FY16-18
MTS Rail: FY16: +2.0% FY17: +5.0% FY18: +2.2%
Chula Vista Transit Chula Vista Transit: n/a MTS assumed full operations starting in FY16.
PUC Section 99247
Requirement – Performance Measures Definitions: The operator’s definition of performance
measures are consistent with Public Utilities Code Section 99247, including (a) operating cost, (b)
operating cost per passenger, (c) operating cost per vehicle service hour, (d) passengers per vehicle
service hour, (e) passengers per vehicle service mile, (f) total passengers, (g) transit vehicle, (h)

17
Code Reference Operator Compliance Requirements, Findings, Verification
vehicle service hours, (i) vehicle service miles, and (j) vehicle service hours per employee.
Findings Verification
Fully compliant MTS operating statistics are collected and performance measures are calculated in accordance with PUC requirements. In annual the Performance Monitoring Report, revenue hours are defined by MTS as in-service hours plus layover hours.
PUC,
Sections 99268.2 99268.3 99268.4 99268.5 99269
Requirement – Revenue Ratios: Operator has maintained a ratio of fare revenues to operating costs at least equal to: 20% for urban areas, 10% for non-urban areas, 10% for services for elderly and disabled persons. For MTS operators, the systemwide ratio shall be not less than the ratio achieved in FY79 (31.9%). The urban area ratio of 20% became the systemwide standard starting in FY17 from SB 508.
Findings Farebox Recovery Ratios
MTS Systemwide Combined Operations: fully compliant
Exceeded the systemwide 31.9% ratio in FY16 and exceeded the 20% ratio in FY17 and FY18.
Source: CAFR, Schedule of Revenues, Expenses, and Changes in Net Position – Budget and Actual
FY16: 37.9% FY17: 34.4% FY18: 32.3%
MTS Bus: fully compliant
Exceeded the 20% urban area ratio annually.
Source: Audited Financial Statements
MTS Bus: FY16: 27.4% FY17: 26.2% FY18: 23.1%
MTS Contracted Bus and Demand Response: fully compliant
Exceeded the 20% urban area ratio annually.
Source: Audited Financial Statements
MTS Contracted Bus Operations: FY16: 38.1% FY17: 36.0% FY18: 33.4%
MTS Rail: fully compliant
Exceeded the 20% urban area ratio annually.
Source: Audited Financial Statements
MTS Rail: FY16: 54.8% FY17: 47.8% FY18: 44.9%
MTS Non-Urban Area: fully compliant
Exceeded the 10% rural area ratio annually.
Source: TDA Claim Form
MTS Non-Urban: FY16: 13.3% FY17: 11.4% FY18: 12.0%
MTS Elderly and Disabled: fully compliant
Exceeded the 10% elderly & disabled ratio
MTS Elderly & Disabled: FY16: 12.4% FY17: 12.3% FY18: 12.9%

18
Code Reference Operator Compliance Requirements, Findings, Verification
annually.
Source: TDA Claim Form
Chula Vista Transit Chula Vista Transit: n/a MTS assumed full operations starting in FY16.
PUC Section 99271
Requirement – Employee Retirement System: The current cost of the operator's retirement system is fully funded with respect to the officers and employees of its public transportation system, or the operator is implementing an RTPA-approved plan to fully fund the retirement system within 40 years.
Findings Verification
MTS: fully compliant Comprehensive Annual Financial Report
MTS CalPERS Plans
SDTI CalPERS Plans
SDTI PARS Plan
SDTC Retirement Plan
Chula Vista Transit Chula Vista Transit: n/a MTS assumed full operations starting in FY16.
CAC Section 6754(a)(3)
Required Findings: If the operator received STA funds, the operator makes full use of funds available from the Federal Transit Administration before TDA claims are granted.
Findings Verification
MTS: fully compliant MTS utilizes federal funds that are available to the agency, as reported in the annual financial reports. MTS receives FTA Section 5307, Section 5337, Section 5339, Section 5311 and Section 5311F grants.
Chula Vista Transit Chula Vista Transit: n/a MTS assumed full operations starting in FY16.
II.2. Prior Audit Recommendations
The prior audit did not contain any specific recommendations.

19
SECTION III: MANAGEMENT CONTROL AND REPORTING On June 23, 2005, the MTS Board of Directors approved the following vision for MTS services (still valid
through the audit period).
A Vision for MTS Services
– Develop a Customer-Focused System: Provide services that reflect the travel needs and
priorities of our customers.
– Develop a Competitive System: Provide services that are competitive with other travel options by
meeting market segment expectations.
– Develop an Integrated System: Develop transit services as part of an integrated network rather
than a collection of individual routes.
– Develop a Sustainable System: Provide appropriate types and levels of service that are
consistent with market demands and are maintainable under current financial conditions.
To achieve this vision of a customer-focused, competitive, integrated, and sustainable system, MTS
Board Policy No. 42 establishes a process for evaluating existing transit services. The policy provides a
set of measures for annual evaluation, listed in Exhibit III-1.
Exhibit III-1: MTS Transit Service Performance Indicators
Source: MTS Policies and Procedures: Transit Service Evaluation and Adjustment (Revised June 20, 2013)
For each indicator, MTS establishes performance targets every three years. These targets represent
aggressive, yet realistic service expectations based on service design, route characteristics, and
operating environments. At the conclusion of each fiscal year, MTS conducts an annual service
evaluation to compare actual performance of the system with the targets and to identify opportunities for
adjustments and improvements based on this analysis. Overall system performance is documented in the
Annual Performance Monitoring Report.
20
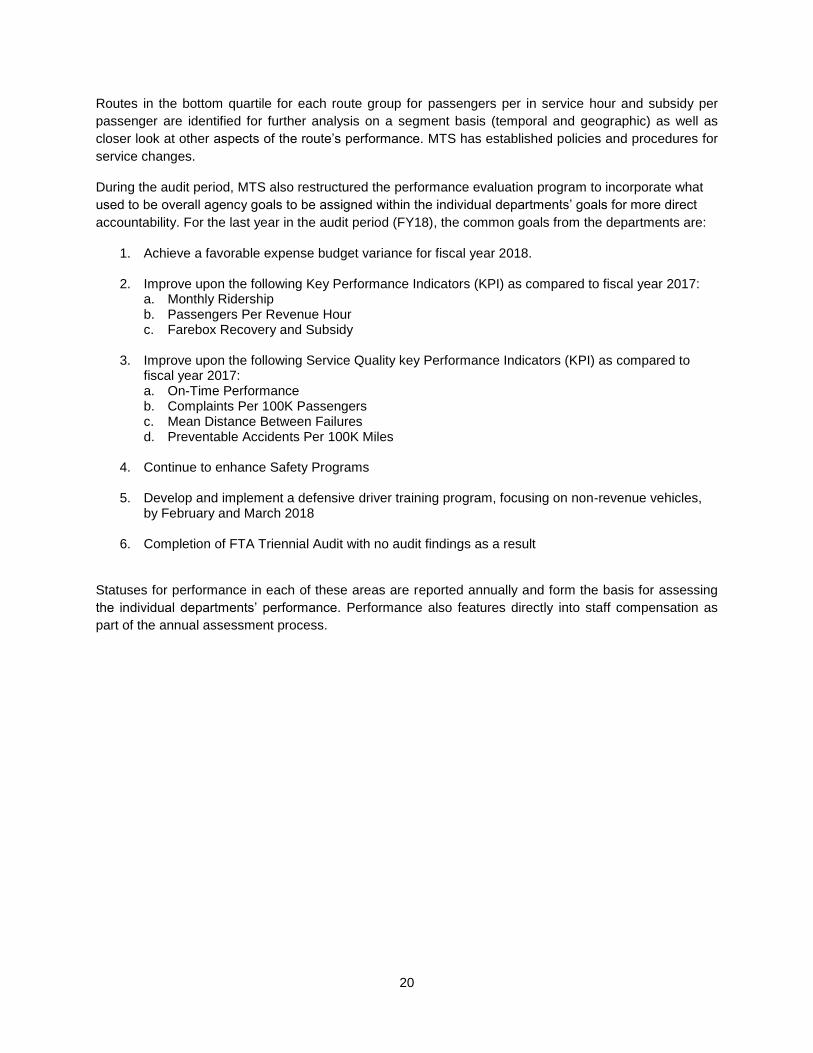
Routes in the bottom quartile for each route group for passengers per in service hour and subsidy per
passenger are identified for further analysis on a segment basis (temporal and geographic) as well as
closer look at other aspects of the route’s performance. MTS has established policies and procedures for
service changes.
During the audit period, MTS also restructured the performance evaluation program to incorporate what
used to be overall agency goals to be assigned within the individual departments’ goals for more direct
accountability. For the last year in the audit period (FY18), the common goals from the departments are:
1. Achieve a favorable expense budget variance for fiscal year 2018.
2. Improve upon the following Key Performance Indicators (KPI) as compared to fiscal year 2017: a. Monthly Ridership b. Passengers Per Revenue Hour c. Farebox Recovery and Subsidy
3. Improve upon the following Service Quality key Performance Indicators (KPI) as compared to
fiscal year 2017: a. On-Time Performance b. Complaints Per 100K Passengers c. Mean Distance Between Failures d. Preventable Accidents Per 100K Miles
4. Continue to enhance Safety Programs
5. Develop and implement a defensive driver training program, focusing on non-revenue vehicles,
by February and March 2018
6. Completion of FTA Triennial Audit with no audit findings as a result
Statuses for performance in each of these areas are reported annually and form the basis for assessing
the individual departments’ performance. Performance also features directly into staff compensation as
part of the annual assessment process.

21
SECTION IV: PERFORMANCE TRENDS AND FUNCTIONAL REVIEW This section of the report provides results of the analysis of TDA and functional performance indicators.
This section of the audit report discusses performance results, beginning with the five TDA performance
indicators required under Section 99246 (c) of the Public Utilities Code (PUC):
– Operating Cost per Service Hour: a measure of cost efficiency
– Operating Cost per Passenger: a measure of cost effectiveness
– Passengers per Service Hour: a measure of service productivity
– Passengers per Service Mile: another measure of service productivity
– Vehicle Service Hours per Employee Full-Time Equivalent (FTE): a measure of labor
productivity.
TDA performance indicators are provided for MTS first at the Systemwide level (i.e., MTS Bus, MTS
Contracted Bus, and MTS Rail combined), then for each individual service type. Functional level
performance is reviewed at the service type level. The performance trends cover the audit period, from
FY16 through FY18, with FY15 used as a base year to provide a point of reference for the analysis.
Most primary data elements for this analysis are extracted from the National Transit Database (NTD).
Other sources (e.g., MTS Annual Performance Monitoring Reports, State Controller, financial audit, and
internal reports) have been used as necessary either to augment the information reported, or to improve
data accuracy and availability. Most of the tables presented include inflation, measured by the change in
the Consumer Price Index (CPI) for San Diego county. Inflation was up 7.9% over the three years of the
audit period.
Data collection and reporting procedures for the five TDA performance indicators were reviewed to verify
that the data reported are consistent with data definitions. TDA performance indicators are used to
assess service efficiency and effectiveness and to provide a point of departure to drill down into functional
performance indicators and trends, to provide additional clarification of performance results. Additional
performance indicators were also evaluated regarding the efficiency, effectiveness, and general
performance of MTS’s public transportation services
In addition to the five required indicators, the farebox recovery ratio is calculated to determine whether
an operator is eligible for funding under PUC. A summary of what is include is under PUC sections 99243
and 99247. The ratio of fare revenues to operating cost is 20% as the claimant is serving an urbanized
area.
With the passage of Senate Bill 508 (SB 508) in October 2015, the State deleted provisions for certain
operators to meet a greater than 20% farebox ratio. Previously, MTS was required to continually meet a
31.9% (regional routes have a 20% goal). SB 508 effectively authorized operators to use local funds in
the calculation of farebox recovery ratio. The specific SB 508 language change is presented in the text
box below. This is a significant change that affects this TDA Triennial audit period for the first time.
SB 508 (99268.19.)
If fare revenues are insufficient to meet the applicable ratio of fare revenues to operating cost required by
this article, an operator may satisfy that requirement by supplementing its fare revenues with local funds.

22
As used in this section, “local funds” means any nonfederal or nonstate grant funds or other revenues
generated by, earned by, or distributed to an operator.
Given its farebox recovery rates exceed the minimum goal, MTS opted not to modify its farebox recovery
reporting approach during the audit period.
IV-1. System-wide Performance
Exhibit IV-1 shows MTS systemwide TDA performance indicators during the audit period.
Exhibit IV-1: MTS Systemwide TDA Performance Indicators
Verified TDA Statistics & Base Year Audit Review Period %
Change
Performance Indicators FY15 FY16 FY17 FY18 FY15-FY18
Operating Costs $244,611,260 $250,808,312 $268,652,470 $284,436,283 16.3%
Unlinked Passengers 96,660,850 92,437,294 88,194,806 85,429,212 -11.6%
Vehicle Service Hours 2,475,048 2,569,421 2,581,544 2,554,405 3.2%
Vehicle Service Miles 32,118,758 33,344,787 33,501,220 33,323,214 3.8%
Employee FTEs 2,431 2,520 2,453 2,494 2.6%
Operating Cost per Revenue Vehicle Hour $98.83 $97.61 $104.07 $111.35 12.7%
Operating Cost per Passenger $2.53 $2.71 $3.05 $3.33 31.6%
Passengers per Revenue Vehicle Hour 39.05 35.98 34.16 33.44 -14.4%
Passengers per Revenue Vehicle Mile 3.01 2.77 2.63 2.56 -14.8%
Service Hours per Employee FTE 1,018 1,019 1,052 1,024 0.6%
Percent Change, Consumer Price Index 2.2% 2.6% 2.8% 7.9%
Source: NTD Reports, Bureau of Labor Statistics, Form-C Reports
The Transit Optimization Plan (TOP) study approved by the MTS Board in September 2017 resulted in
significant changes to allocation of services. In June 2017, MTS trimmed some low performance bus
routes. Other changes were implemented over four shake ups, from January 2018 to January 2019. Even
though about half of these changes were made during the audit period, real results of the TOP are likely
to be better observed in the next audit period. Systemwide, operating costs were up 16.3% from FY15
levels and ridership down 11.6%.
The main findings for Systemwide TDA performance are:
– Operating cost per revenue vehicle hour, a measure of cost efficiency, increased by 12.7% during
the audit period from $98.83 in FY15 to $111.35 in FY18.
– Operating cost per passenger, a measure of cost effectiveness, increased 31.6% from $2.53 in
FY15 to $3.33 in FY18. The decrease in ridership combined with the increase in operating costs
almost equally contributed to this increase.
– Service productivity declined during the audit period. Passengers per revenue vehicle hour
decreased by 14.4% while passengers per revenue service mile decreased by 14.8%.

23
– Service hours per employee FTE, a measure of labor productivity, remained stable during the
audit period, increasing by 0.6%. This trend is a result of minor increases in the total level service
provided and a 2.6% increase in employee FTEs.
Exhibit IV-2 shows MTS systemwide fare revenue indicators during the audit period.
Exhibit IV-2: MTS Systemwide Revenue Performance Indicators
Date Item and Farebox Ratio Base Year Audit Review Period % Change
FY15 FY16 FY17 FY18 FY15-FY18
Operating Costs $244,611,260 $250,808,312 $268,652,470 $284,436,283 16.3%
Farebox Revenues $99,114,021 $97,913,890 $93,279,455 $90,235,809 -9.0%
Net Cost $145,497,239 $152,894,422 $175,373,015 $194,200,474 33.5%
Unlinked Passenger Trips 96,660,850 92,437,294 88,194,806 85,429,212 -11.6%
Farebox Recovery Ratio 40.5% 39.0% 34.7% 31.7% -21.7%
Average Fare per Passenger Trip $1.03 $1.06 $1.06 $1.06 3.0%
Net Cost per Passenger Trip $1.51 $1.65 $1.99 $2.27 51.0%
Percent Change in CPI 2.2% 2.6% 2.8% 7.9%
Source: NTD Reports
The main findings for systemwide MTS revenue are as follows:
– The MTS systemwide farebox recovery ratio diminished from 40.5% in FY15 to 31.7% in FY18.
For every year in the audit period except FY18 the MTS farebox recovery was higher than the
MTS systemwide farebox recovery requirement of 31.9%. MTS, for the time being, has not taken
the option to report farebox recovery differently with the 2015 passing of SB 508 (see further
explanatory note below).
– The average fare per passenger trip increased by 3% during the audit period, from $1.03 to
$1.06.
– The net cost per passenger trip increased by half, from $1.51 in FY15 to $2.27 in FY18. This
reflects the combined effect of increased net costs and overall decreased ridership.
MTS has performed internal calculations of Farebox Recovery Ratio that include other revenues as
allowed by SB 508. According to one calculation, adding other advertising, naming rights, energy credit
and miscellaneous other revenues increases the FY18 rail operations ratio from 45.2% to 49.8% and the
FY18 bus operations ratio from 21.9% to 29.5%. MTS is aware of the bill and for the time being has
elected not to report farebox recovery differently than in the past.
Systemwide tallies provide average performance across all modes. Individual modal calculations
(separated by directly operated and contracted operations) break out these statistics at a more granular
level for all service types. The rest of this chapter includes the following sections:
– IV-2: MTS Bus Operations
– IV-3: MTS Contracted Bus Operations, including ADA paratransit services.
– IV-3: MTS Rail Operations

24
Each section includes an overview of performance against TDA performance indicators, followed by a
discussion of performance at the functional level.
IV-2. MTS – Directly Operated Bus Operations Performance
Exhibit IV-3 shows MTS Bus Operations TDA performance indicators during the audit period.
Exhibit IV-3: MTS Bus TDA Performance Indicators
Verified TDA Statistics & Base Year Audit Review Period % Change
Performance Indicators FY15 FY16 FY17 FY18 FY15-FY18
Operating Costs $91,410,940 $94,782,000 $104,733,367 $110,955,049 21.4%
Unlinked Passengers 27,263,712 25,627,964 24,314,556 22,866,573 -16.1%
Vehicle Service Hours 806,048 824,866 822,277 820,677 1.8%
Vehicle Service Miles 9,561,390 9,702,131 9,626,387 9,683,731 1.3%
Employee FTEs 719 762 758 763 6.2%
Operating Cost per Revenue Vehicle Hour $113.41 $114.91 $127.37 $135.20 19.2%
Operating Cost per Passenger $3.35 $3.70 $4.31 $4.85 44.7%
Passengers per Revenue Vehicle Hour 33.82 31.07 29.57 27.86 -17.6%
Passengers per Revenue Vehicle Mile 2.85 2.64 2.53 2.36 -17.2%
Service Hours per Employee FTE 1,122 1,082 1,084 1,075 -4.1%
Percent Change, Consumer Price Index 2.2% 2.6% 2.8% 7.9%
Source: NTD Reports
The main drivers for TDA performance for directly-operated bus include operations cost and ridership.
MTS Bus Operations experienced a 21.4% increase in operating costs, a rate significantly higher than
inflation. Root causes for this cost increase include: (1) wages – minimum wage increases had impacts
during the audit period (e.g., $500,000 increase for security labor alone); (2) recruitment – whereas there
was a deficiency in the operator ranks before, MTS made strides in recruitment to fill driver ranks. This
explains the FTE increase and also drove up operating cost; and (3) new service – MTS deployed the
new South Bay Rapid Service.
One of the big stories of this audit period is the decline in ridership – 16.1% – which is about five
percentage points higher than the systemwide ridership number. Reasons for the decline include AB360,
cost of living in the greater San Diego area, TNC’s, and the low cost of gasoline, among other factors.
The volume of service provided as measured by revenue vehicle hours and miles, was stable, increasing
1.8% and 1.3%, respectively.
TDA Performance measures include:
• Cost efficiency declined as the operating cost per service hour increased by 19.2%. Cost
effectiveness also decreased as the operating cost per passenger increased by 44.7%. Cost
effectiveness suffered the double whammy of the increase in operating cost (numerator) and drop
in ridership (denominator).
• The ridership’s decline also affected service productivity. Passengers per service hour and per
service mile decreased by 17.6% and 17.2%, respectively. Because the volume of service
provided in the region was stable, the reduction in service productivity measures was highly
driven by the ridership decline during FY15 through FY18.

25
• Service hours per employee FTE, a measure of labor productivity, decreased over the audit
period by 4.1%.
Exhibit IV-4 shows MTS Bus Operations fare revenue indicators during the audit period.
Exhibit IV-4: MTS Bus Revenue Performance Indicators
Base Data and Base Year Audit Review Period % Change
Performance Indicators FY15 FY16 FY17 FY18 FY15-FY18
Operating Costs $91,410,940 $94,782,000 $104,733,367 $110,955,049 21.4%
Farebox Revenues $27,156,322 $26,169,280 $24,863,742 $23,034,059 -15.2%
Net Cost $64,254,618 $68,612,720 $79,869,625 $87,920,990 36.8%
Unlinked Passenger Trips 27,263,712 25,627,964 24,314,556 22,866,573 -16.1%
Farebox Recovery Ratio 29.7% 27.6% 23.7% 20.8% -30.1%
Average Fare per Passenger Trip $1.00 $1.02 $1.02 $1.01 1.1%
Net Cost per Passenger Trip $2.36 $2.68 $3.28 $3.84 63.1%
Percent Change, Consumer Price Index 2.2% 2.6% 2.8% 7.9%
Source: NTD Reports
Main findings for MTS Bus revenue indicators are as follows:
– The farebox recovery ratio decreased over one quarter from 29.7% to 20.8%, as a result of the
ridership declines and increased operating cost. However, farebox recovery continues to exceed
the TDA-mandated farebox recovery ratio (20% for urban systems). MTS also has not made any
changes to its farebox recovery reporting approach despite the passage of SB 508.
– The average fare per passenger trip was very stable during the audit period, increasing just 1.1%
over three years.
– Due to increasing operating costs and decreasing ridership, the net cost per passenger trip
increased by 63.1% over the audit period, again a result of the combined effect of increased net
costs and ridership declines.
Exhibit IV-5 shows MTS Bus Operations performance indicators. Sources for the data include NTD
reports but also MTS annual performance monitoring reports.
Exhibit IV-5: MTS Bus Operations Performance Indicators
Base Data and Base Year Audit Review Period % Change
Performance Indicators FY15 FY16 FY17 FY18 FY15-FY18
Vehicle Operations FTEs 529.3 579.5 575.4 573.5 8.4%
Vehicle Operations Costs $52,045,813 $54,880,177 $63,736,387 $67,132,804 29.0%
Vehicle Service Hours (VSH) 806,048 824,866 822,277 820,677 1.8%
Vehicle Service Miles (VSM) 9,561,390 9,702,131 9,626,387 9,683,731 1.3%
Total Vehicle Hours 861,908 894,988 889,932 888,098 3.0%
Total Vehicle Miles 11,142,180 11,326,789 11,279,703 11,210,583 0.6%
Unlinked Passenger Trips 27,263,712 25,627,964 24,314,556 22,866,573 -16.1%
26
Passenger Miles 117,585,084 114,845,052 109,727,324 104,544,729 -11.1%
VSH per Operations FTE 1,523 1,424 1,429 1,431 -6.0%
VSM per Operations FTE 18,063 16,744 16,731 16,884 -6.5%
Service Miles per Service Hour 11.9 11.8 11.7 11.8 -0.5%
Service Hours / Total Hours 93.5% 92.2% 92.4% 92.4% -1.2%
Service Miles / Total Miles 85.8% 85.7% 85.3% 86.4% 0.7%
Vehicle Operations Cost per Passenger Trip $1.91 $2.14 $2.62 $2.94 53.8%
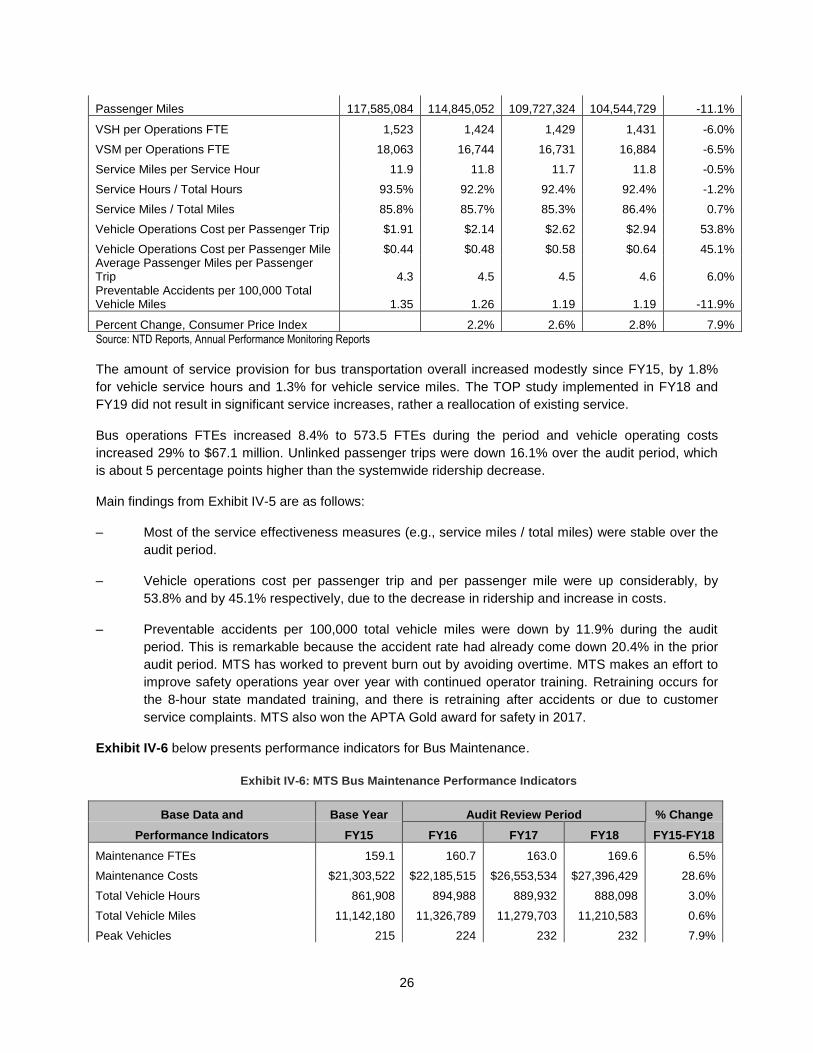
Vehicle Operations Cost per Passenger Mile $0.44 $0.48 $0.58 $0.64 45.1% Average Passenger Miles per Passenger Trip 4.3 4.5 4.5 4.6 6.0% Preventable Accidents per 100,000 Total Vehicle Miles 1.35 1.26 1.19 1.19 -11.9%
Percent Change, Consumer Price Index 2.2% 2.6% 2.8% 7.9%
Source: NTD Reports, Annual Performance Monitoring Reports
The amount of service provision for bus transportation overall increased modestly since FY15, by 1.8%
for vehicle service hours and 1.3% for vehicle service miles. The TOP study implemented in FY18 and
FY19 did not result in significant service increases, rather a reallocation of existing service.
Bus operations FTEs increased 8.4% to 573.5 FTEs during the period and vehicle operating costs
increased 29% to $67.1 million. Unlinked passenger trips were down 16.1% over the audit period, which
is about 5 percentage points higher than the systemwide ridership decrease.
Main findings from Exhibit IV-5 are as follows:
– Most of the service effectiveness measures (e.g., service miles / total miles) were stable over the
audit period.
– Vehicle operations cost per passenger trip and per passenger mile were up considerably, by
53.8% and by 45.1% respectively, due to the decrease in ridership and increase in costs.
– Preventable accidents per 100,000 total vehicle miles were down by 11.9% during the audit
period. This is remarkable because the accident rate had already come down 20.4% in the prior
audit period. MTS has worked to prevent burn out by avoiding overtime. MTS makes an effort to
improve safety operations year over year with continued operator training. Retraining occurs for
the 8-hour state mandated training, and there is retraining after accidents or due to customer
service complaints. MTS also won the APTA Gold award for safety in 2017.
Exhibit IV-6 below presents performance indicators for Bus Maintenance.
Exhibit IV-6: MTS Bus Maintenance Performance Indicators
Base Data and Base Year Audit Review Period % Change
Performance Indicators FY15 FY16 FY17 FY18 FY15-FY18
Maintenance FTEs 159.1 160.7 163.0 169.6 6.5%
Maintenance Costs $21,303,522 $22,185,515 $26,553,534 $27,396,429 28.6%
Total Vehicle Hours 861,908 894,988 889,932 888,098 3.0%
Total Vehicle Miles 11,142,180 11,326,789 11,279,703 11,210,583 0.6%
Peak Vehicles 215 224 232 232 7.9%

27
Total Vehicles 286 275 273 270 -5.6%
Vehicle Hours per Maintenance FTE 5,416 5,569 5,460 5,238 -3.3%
Vehicle Miles per Maintenance FTE 70,016 70,483 69,204 66,115 -5.6%
Maintenance Cost per Active Vehicle $74,488 $80,675 $97,266 $101,468 36.2%
Maintenance Cost per Vehicle Hour $24.72 $24.79 $29.84 $30.85 24.8%
Maintenance Cost per Vehicle Mile $1.91 $1.96 $2.35 $2.44 27.8%
Vehicle Hours per Active Vehicle 3,014 3,255 3,260 3,289 9.1%
Vehicle Miles per Active Vehicle 38,959 41,188 41,318 41,521 6.6%
Mean Distance between Failures 12,943 9,463 9,600 10,980 -15.2%
Spare Ratio 33.0% 22.8% 17.7% 16.4% -50.4%
Percent Change, Consumer Price Index 2.2% 2.6% 2.8% 7.9%
Source: NTD Reports, Annual Performance Monitoring Reports
At the top level for maintenance, the service output remained fairly stable during the audit period. While
the total fleet decreased by 5.6%, the number of vehicles in peak service increased by 7.9%. Fluctuations
in the number of buses are normal, given the procurement cycles and accounting for inactive buses that
may be ready to retire. MTS procures its buses annually to avoid the peaks and valleys issues in
procurements, a best practice. The number of miles the vehicles traveled remained remarkably stable
during the period, at about 11.2 million miles. Within this context, the maintenance workforce went from
159.1 FTEs to 169.6 FTEs, a 6.5% increase. Maintenance costs increased 28.6%, much higher than
inflation.
Main findings of the performance indicators on the bottom half of Exhibit IV-6 are as follows:
– Maintenance cost per active vehicle increased by 36%. The reduction in total vehicles contributed
to this trend.
– Maintenance cost per vehicle hour and mile increased by 24.8% and 27.8% respectively. The
total service provision during this period being fairly stable, this metric is primarily driven by the
increase in maintenance cost experience during the period.
– Vehicle hours and miles per active vehicle increased by 9.1% and 6.6% meaning that vehicles
were more utilized over the audit period.
– Mean distance between failures (MDBF) decreased by 15.2% but is closer to the historical
average. Since FY16, vehicle reliability for directly operated bus has been rising gradually to its
FY18 level of 10,980. This measure is reported consistent with the NTD definition of MDBF, and a
failure is a mechanical failure that presents a vehicle from starting or completing its trip (for
safety, movement, or policy reasons).
– Spare ratio decreased from 33% to 16.4% of peak vehicles. Compared to FY15, the spare ratio
has stabilized to a better range below 20%%. FTA recommends operators carry spares at no
more than 20%. Note the NTD measure for spare ratio is a point in time measurement as of June
30 and may include deliveries not yet in service and retired buses awaiting disposal.
During the audit period, MTS decreased its directly operated bus administration staffing, and
administration costs decreased as well. This is shown in Exhibit IV-7.
28
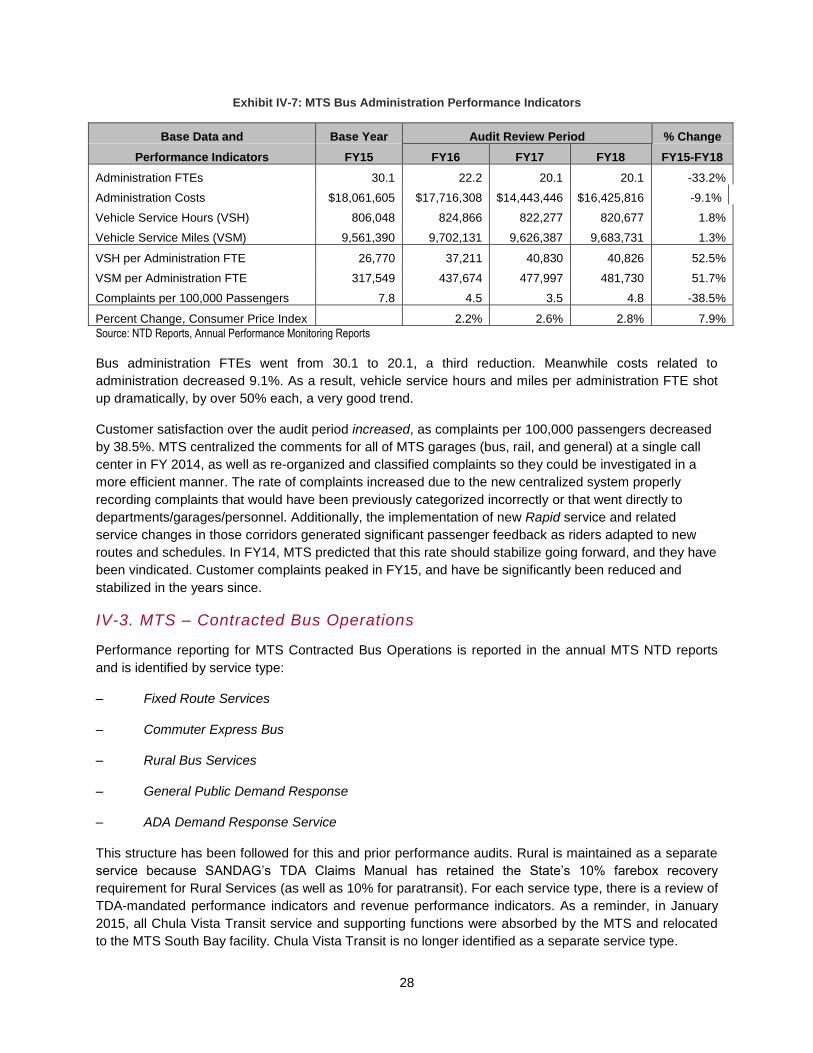
Exhibit IV-7: MTS Bus Administration Performance Indicators
Base Data and Base Year Audit Review Period % Change
Performance Indicators FY15 FY16 FY17 FY18 FY15-FY18
Administration FTEs 30.1 22.2 20.1 20.1 -33.2%
Administration Costs $18,061,605 $17,716,308 $14,443,446 $16,425,816 -9.1%
Vehicle Service Hours (VSH) 806,048 824,866 822,277 820,677 1.8%
Vehicle Service Miles (VSM) 9,561,390 9,702,131 9,626,387 9,683,731 1.3%
VSH per Administration FTE 26,770 37,211 40,830 40,826 52.5%
VSM per Administration FTE 317,549 437,674 477,997 481,730 51.7%
Complaints per 100,000 Passengers 7.8 4.5 3.5 4.8 -38.5%
Percent Change, Consumer Price Index 2.2% 2.6% 2.8% 7.9%
Source: NTD Reports, Annual Performance Monitoring Reports
Bus administration FTEs went from 30.1 to 20.1, a third reduction. Meanwhile costs related to
administration decreased 9.1%. As a result, vehicle service hours and miles per administration FTE shot
up dramatically, by over 50% each, a very good trend.
Customer satisfaction over the audit period increased, as complaints per 100,000 passengers decreased
by 38.5%. MTS centralized the comments for all of MTS garages (bus, rail, and general) at a single call
center in FY 2014, as well as re-organized and classified complaints so they could be investigated in a
more efficient manner. The rate of complaints increased due to the new centralized system properly
recording complaints that would have been previously categorized incorrectly or that went directly to
departments/garages/personnel. Additionally, the implementation of new Rapid service and related
service changes in those corridors generated significant passenger feedback as riders adapted to new
routes and schedules. In FY14, MTS predicted that this rate should stabilize going forward, and they have
been vindicated. Customer complaints peaked in FY15, and have be significantly been reduced and
stabilized in the years since.
IV-3. MTS – Contracted Bus Operations
Performance reporting for MTS Contracted Bus Operations is reported in the annual MTS NTD reports
and is identified by service type:
– Fixed Route Services
– Commuter Express Bus
– Rural Bus Services
– General Public Demand Response
– ADA Demand Response Service
This structure has been followed for this and prior performance audits. Rural is maintained as a separate
service because SANDAG’s TDA Claims Manual has retained the State’s 10% farebox recovery
requirement for Rural Services (as well as 10% for paratransit). For each service type, there is a review of
TDA-mandated performance indicators and revenue performance indicators. As a reminder, in January
2015, all Chula Vista Transit service and supporting functions were absorbed by the MTS and relocated
to the MTS South Bay facility. Chula Vista Transit is no longer identified as a separate service type.

29
IV-3.1. MTS – Contracted Bus Fixed Route Services
Overall performance of MTS Contracted Fixed Route Bus Operations was similar, though lighter,
experience as that experienced on the directly-operated fixed route side. Exhibit IV-8 provides TDA
performance indicators for MTS Contracted Fixed Route Services exclusive of Commuter Express and
Rural services.
Exhibit IV-8: MTS Contracted Fixed Route Bus Operations TDA Performance Indicators
Verified TDA Statistics & Base Year Audit Review Period % Change
Performance Indicators FY15 FY16 FY17 FY18 FY15-FY18
Operating Costs $58,455,305 $57,484,817 $57,184,255 $58,626,688 0.3%
Unlinked Passengers 28,331,402 26,360,743 25,312,824 24,606,833 -13.1%
Vehicle Service Hours 959,417 973,233 975,156 980,624 2.2%
Vehicle Service Miles 9,634,872 9,723,147 9,810,491 9,802,569 1.7%
Employee FTEs 841 850 823 856 1.8%
Operating Cost per Revenue Vehicle Hour $60.93 $59.07 $58.64 $59.79 -1.9%
Operating Cost per Passenger $2.06 $2.18 $2.26 $2.38 15.5%
Passengers per Revenue Vehicle Hour 29.53 27.09 25.96 25.09 -15.0%
Passengers per Revenue Vehicle Mile 2.94 2.71 2.58 2.51 -14.6%
Service Hours per Employee FTE 1,141 1,144 1,185 1,146 0.4%
Percent Change, Consumer Price Index 2.2% 2.6% 2.8% 7.9% Source: Form-C Reports
Operating costs for contracted fixed route services increased by 0.3% over the audit period, far less than
inflation. This is commendable especially given the accompanying increase in service output. Contracted
services increased the service put out on the street, with a 2.2% increase in vehicle service hours
coupled with a 1.7% increase in service miles. The fleet size increased and added South Bay BRT
service contributed to the increase. However, ridership declined 13.1%. The contractor, TransDev, reports
that border routes have grown significantly, despite the overall ridership decline.
TDA indicator findings include:
• Operating cost per revenue vehicle hour decreased 1.9%, a good trend. The drop is observed
from FY15 to FY16. Afterwards, cost efficiency was stable.
• When adjusted for service consumed (operating cost per passenger) cost increased significantly
by 15.5%. The main contributing factor as with other service types was the 13.1% ridership
reduction.
• Passengers per service hour and passengers per service mile decreased by 15% and 14.6%
respectively.
• Service hours per Employee FTE increased during the audit period, by 0.4%.
Fare revenue indicators for MTS Contracted Fixed Route Bus increased over the audit period. This is
shown in Exhibit IV-9.

30
Exhibit IV-9: MTS Contracted Fixed Route Revenue Performance Indicators
Base Data and Base Year Audit Review Period % Change
Performance Indicators FY15 FY16 FY17 FY18 FY15-FY18
Operating Costs $58,455,305 $57,484,817 $57,184,255 $58,626,688 0.3%
Farebox Revenues $27,032,179 $26,801,735 $25,286,644 $23,759,622 -12.1%
Net Cost $31,423,126 $30,683,081 $31,897,611 $34,867,066 11.0%
Unlinked Passenger Trips 28,331,402 26,360,743 25,312,824 24,606,833 -13.1%
Farebox Recovery Ratio 46.2% 46.6% 44.2% 40.5% -12.4%
Average Fare per Passenger Trip $0.95 $1.02 $1.00 $0.97 1.2%
Net Cost per Passenger Trip $1.11 $1.16 $1.26 $1.42 27.8%
Percent Change, Consumer Price Index 2.2% 2.6% 2.8% 7.9% Source: Form-C Reports
Contracted fixed route services have continued to significantly exceed the TDA 20% farebox recovery
requirement and contributed to the achievement of MTS exceeding the systemwide recovery requirement
(31.9%) in spite of this indicator experiencing a 12.4% decrease over the audit period (in line with
ridership declines). The farebox revenues were down 12.1% over the audit period and the farebox
recovery ratio ended the audit period at 40.5%.
IV-3.2. MTS – Commuter Express Services
Although operated by the same contractor, Commuter Express Services are treated separately for
reporting purposes. Exhibit IV-10 provides Commuter Express TDA performance indicators.
Exhibit IV-10: MTS Contracted Commuter Express TDA Performance Indicators
Verified TDA Statistics & Base Year Audit Review Period % Change
Performance Indicators FY15 FY16 FY17 FY18 FY15-FY18
Operating Costs $2,393,711 $2,186,845 $2,255,518 $2,384,988 -0.4%
Unlinked Passengers 303,940 291,969 287,252 283,135 -6.8%
Vehicle Service Hours 11,255 11,562 11,357 11,657 3.6%
Vehicle Service Miles 344,334 350,017 343,297 342,749 -0.5%
Employee FTEs 15 14 15 13 -10.7%
Operating Cost per Revenue Vehicle Hour $212.68 $189.14 $198.60 $204.60 -3.8%
Operating Cost per Passenger $7.88 $7.49 $7.85 $8.42 7.0%
Passengers per Revenue Vehicle Hour 27.00 25.25 25.29 24.29 -10.1%
Passengers per Revenue Vehicle Mile 0.88 0.83 0.84 0.83 -6.4%
Service Hours per Employee FTE 750 817 757 870 15.9%
Percent Change, Consumer Price Index 2.2% 2.6% 2.8% 7.9%
Source: NTD Reports, Form-C Reports
The drivers for the TDA performance are presented in the upper half of the table. Operating costs were
flat (even slightly negative) over the audit period, including a small reduction in staff size. This is
commendable in an environment where inflation was up almost 8%. Service output was pretty stable, with
a recent increase in the number of service hours in FY18, as a result of added service. Ridership was
down 6.8% over the audit period, which is less erosion than for other MTS services.

31
Main findings for commuter express bus TDA performance include:
– TDA performance measures reflect some mixed results. Cost efficiency improved by 3.8%, but
cost effectiveness declined 7% over the audit period. Service productivity was affected by the
reduction in ridership, with a 10.1% and a 6.4% decrease in the associated measures. Finally,
labor productivity increased 15.9% to 870 hours per employee FTE, a nice accomplishment made
possible by the reduction in staffing.
Fare revenue indicators for MTS Contracted Commuter Express services increased over the audit period.
This is shown in Exhibit IV-11.
Exhibit IV-11: MTS Contracted Commuter Express Revenue Performance Indicators
Base Data and Base Year Audit Review Period % Change
Performance Indicators FY15 FY16 FY17 FY18 FY15-FY18
Operating Costs $2,393,711 $2,186,845 $2,255,518 $2,384,988 -0.4%
Farebox Revenues $1,251,705 $1,242,792 $1,196,656 $1,197,246 -4.4%
Net Cost $1,142,006 $944,053 $1,058,862 $1,187,742 4.0%
Unlinked Passenger Trips 303,940 291,969 287,252 283,135 -6.8%
Farebox Recovery Ratio 52.3% 56.8% 53.1% 50.2% -4.0%
Average Fare per Passenger Trip $4.12 $4.26 $4.17 $4.23 2.7%
Net Cost per Passenger Trip $3.76 $3.23 $3.69 $4.19 11.6%
Percent Change, Consumer Price Index 2.2% 2.6% 2.8% 7.9%
Source: NTD Reports
Of all the bus modes, one would expect a higher farebox recovery ratio for commuter express service.
During the audit period the ratio was remarkably stable with a 4% decline compared to the FY15 base
year. The best year was FY16 when it hit 56.8%. Still at 50.2% in FY18 the farebox recovery ration
continues to significantly exceed the TDA 20% farebox recovery requirement. It also contributed to the
achievement of MTS exceeding the 31.9% systemwide recovery requirement.
The net cost per passenger trip increased by 11.6% from $3.76 in FY15 to $4.19 in FY18 while the
average fare per passenger trip increased by 2.7% over the audit period.
IV-3.3. MTS – Contracted Bus Rural Services
Rural transit services link the sparsely populated central and eastern portions of San Diego County to the
San Diego urban core. Exhibit IV-12 provides TDA performance indicators for MTS Contracted Bus Rural
Services.
Exhibit IV-12: MTS Contracted Bus Rural Services TDA Performance Indicators
Verified TDA Statistics & Base Year Audit Review Period % Change
Performance Indicators FY15 FY16 FY17 FY18 FY15-FY18
Operating Costs $795,080 $778,383 $853,595 $905,621 13.9%
Unlinked Passengers 69,545 72,129 72,881 80,771 16.1%
Vehicle Service Hours 5,389 5,439 5,376 6,144 14.0%
Vehicle Service Miles 138,779 138,815 138,692 162,860 17.4%
Employee FTEs 3 4 5 5 42.4%

32
Operating Cost per Revenue Vehicle Hour $147.54 $143.11 $158.78 $147.40 -0.1%
Operating Cost per Passenger $11.43 $10.79 $11.71 $11.21 -1.9%
Passengers per Revenue Vehicle Hour 12.90 13.26 13.56 13.15 1.9%
Passengers per Revenue Vehicle Mile 0.50 0.52 0.53 0.50 -1.0%
Service Hours per Employee FTE 1,576 1,307 1,075 1,262 -19.9%
Percent Change, Consumer Price Index 2.2% 2.6% 2.8% 7.9%
Source: Form-C Reports
From a ridership perspective, rural routes provide a rare bright spot in an otherwise bleak audit period for
system ridership. Ridership increased 13.9% over the period, to over 80,000 passengers.
Vehicle service hours and miles increased significantly throughout the current audit period, by 14.0% and
17.4% respectively. Contractor TransDev reports that many routes are at capacity. Even thirty percent of
its operators live across the border in Tijuana and neighboring areas. Operating costs increased 13.9%
during the audit period, higher than inflation. These offset the TDA performance metrics gains from
ridership and service provision.
The operating cost per revenue vehicle hour, a measure of efficiency, decreased by 1.9%. The operating
cost per passenger decreased by 1.9% during the same period. Service productivity measures –
passengers per revenue vehicle hour and per revenue vehicle mile – increased by 1.9% and decreased
by 1%, respectively. Service hours per employee FTE were down by 19.9%, because of a modest
increase in the dedicated staff.
Exhibit IV-13 provides revenue performance indicators for MTS Contracted Bus Rural Services.
Exhibit IV-13: MTS Contracted Bus Rural Services Revenue Performance Indicators
Base Data and Base Year Audit Review Period % Change
Performance Indicators FY15 FY16 FY17 FY18 FY15-FY18
Operating Costs $795,080 $778,383 $853,595 $905,621 13.9%
Farebox Revenues $96,090 $93,643 $85,835 $204,180 112.5%
Net Cost $698,990 $684,740 $767,760 $701,441 0.4%
Unlinked Passenger Trips 69,545 72,129 72,881 80,771 16.1%
Farebox Recovery Ratio 12.1% 12.0% 10.1% 22.5% 86.6%
Average Fare per Passenger Trip $1.38 $1.30 $1.18 $2.53 83.0%
Net Cost per Passenger Trip $10.05 $9.49 $10.53 $8.68 -13.6%
Percent Change, Consumer Price Index 2.2% 2.6% 2.8% 7.9%
Source: Form-C Reports
The big story here is the 112.5% increase in farebox revenues over the audit period, resulting in an
86.6% increase in the farebox recovery ratio. The ratio increased from 12.1% in FY15 to almost double,
22.5%, in FY18. The farebox recovery ratio easily exceeded the TDA-mandated farebox recovery ratio of
10% for non-urban areas over the audit period.
IV-3.4 MTS - Sorrento Valley Coaster Connection (SVCC)
The SVCC service was designed to provide direct access to regional transit. Exhibit IV-14 provides
SVCC TDA performance indicators for the audit period.

33
Exhibit IV-14: MTS Demand Response SVCC TDA Performance Indicators
Verified TDA Statistics & Base Year Audit Review Period % Change
Performance Indicators FY15 FY16 FY17 FY18 FY15-FY18
Operating Costs $289,717 $279,569 $297,882 $315,280 8.8%
Unlinked Passengers 119,317 104,987 105,250 90,726 -24.0%
Vehicle Service Hours 5,837 5,597 5,522 5,976 2.4%
Vehicle Service Miles 69,165 67,179 66,713 68,607 -0.8%
Employee FTEs 5 5 5 5 0.0%
Operating Cost per Revenue Vehicle Hour $49.63 $49.95 $53.94 $52.76 6.3%
Operating Cost per Passenger $2.43 $2.66 $2.83 $3.48 43.1%
Passengers per Revenue Vehicle Hour 20.44 18.76 19.06 15.18 -25.7%
Passengers per Revenue Vehicle Mile 1.73 1.56 1.58 1.32 -23.3%
Service Hours per Employee FTE 1,167 1,119 1,104 1,195 2.4%
Percent Change, Consumer Price Index 2.2% 2.6% 2.8% 7.9%
Source: Form-C Reports
MTS Contracted SVCC Services show mixed results throughout the audit period. Ridership decreased
24%, higher than any other service type. Meanwhile, operating costs increased 8.8%, about the inflation
rate.
Given this, TDA performance indicators will predictably indicate negative performance for efficiency and
effectiveness. Cost efficiency worsened 6.3% and cost effectiveness 43.1%. Also, passengers per
revenue vehicle hour and per mile decreased by 25.4% and by 23.3%, respectively. The only indicator
with a flat performance was the labor productivity measure, up 2.4% over the audit period.
Exhibit IV-15 provides revenue performance indicators for MTS SVCC Services.
Exhibit IV-15: MTS Demand Response SVCC Revenue Performance Indicators
Base Data and Base Year Audit Review Period % Change
Performance Indicators FY15 FY16 FY17 FY18 FY15-FY18
Operating Costs $289,717 $279,569 $297,882 $315,280 8.8%
Farebox Revenues $114,320 $108,043 $104,566 $88,862 -22.3%
Net Cost $175,397 $171,526 $193,316 $226,418 29.1%
Unlinked Passenger Trips 119,317 104,987 105,250 90,726 -24.0%
Farebox Recovery Ratio 39.5% 38.6% 35.1% 28.2% -28.6%
Average Fare per Passenger Trip $0.96 $1.03 $0.99 $0.98 2.2%
Net Cost per Passenger Trip $1.47 $1.63 $1.84 $2.50 69.8%
Percent Change, Consumer Price Index 2.2% 2.6% 2.8% 7.9%
Source: Form-C Reports
All revenue performance indicators for SVCC services declined over the audit period including the SVCC
farebox recovery ratio which decreased from 39.5% to 28.2%. The average fare per passenger trip
increased by 2.2% and the net cost per passenger trip increased by 69.8%.

34
IV-3.5 MTS – ADA Paratransit Services
MTS provides MTS Access Paratransit services in central and southern San Diego. Operating funding for
these services is provided by local TDA and TransNet revenue sources. MTS Access provides the
complementary paratransit services required by the Americans with Disabilities Act (ADA). First Transit
has been the contractor during the audit period. Their contract was executed in 2009, it is a nine year
contract with option years.
Personal Care Attendants may travel without paying a fare. Children five years and younger travel free
with a fare paying adult. Reservations are accepted from two days in advance up to 5:00 p.m. the day
before travel. Exhibit IV-16 provides TDA performance indicators for MTS Access services.
Exhibit IV-16: MTS Demand Response ADA TDA Performance Indicators
Verified TDA Statistics & Base Year Audit Review Period % Change
Performance Indicators FY15 FY16 FY17 FY18 FY15-FY18
Operating Costs $16,970,435 $18,559,650 $19,764,550 $20,159,479 18.8%
Unlinked Passengers 475,322 516,221 529,091 505,973 6.4%
Vehicle Service Hours 231,650 251,937 262,276 251,152 8.4%
Vehicle Service Miles 4,083,491 4,517,497 4,736,926 4,606,212 12.8%
Employee FTEs 258 264 290 293 13.8%
Operating Cost per Revenue Vehicle Hour $73.26 $73.67 $75.36 $80.27 9.6%
Operating Cost per Passenger $35.70 $35.95 $37.36 $39.84 11.6%
Passengers per Revenue Vehicle Hour 2.05 2.05 2.02 2.01 -1.8%
Passengers per Revenue Vehicle Mile 0.12 0.11 0.11 0.11 -5.6%
Service Hours per Employee FTE 898 953 904 856 -4.7%
Percent Change, Consumer Price Index 2.2% 2.6% 2.8% 7.9%
Source: Form-C Reports
At the top level, paratransit operating costs climbed 18.8%, well over inflation. Service provision also
increased significantly over the audit period (8.4% increase in vehicle service hours and 12.8% increase
in vehicle service miles). Ridership increased 6.4% and staffing levels were also up by 13.8% compared
to FY15 levels. The highest ridership was experienced in FY17 at 529,000 and FY18 levels are slightly
lower at about 506,000. During the audit period, MTS and the contractor had to deal with a driver strike
that lasted 9 days. The strike was about contract negotiations between union workers and First Transit.
Given the above, MTS has achieved generally positive results in all aspects of meeting and managing
ADA demand. The main takeaways for the TDA indicators include:
• Cost effectiveness, measured by the operating cost per passenger decreased by 11.6%, from
$35.70 in FY15 to $39.84 in FY18. At the same time, the cost per revenue vehicle hour of
service provided increased by 9.6%, a bit higher than the 7.9% growth in the CPI.
• Service productivity indicator performance was significantly more stable.
MTS is also in the process of converting the fleet to propane. Out of 170 vehicles, three quarters have
been converted, leaving about 50 vehicles to convert in the next audit period. The benefit will be
operating cost savings of about $400,000 per year. The full benefit of the program is expected to become
more apparent in future years.

35
MTS also hired a new contractor to handle ADA eligibility to provide improved accuracy of the process.
Exhibit IV-17 provides revenue performance indicators for MTS Access Services.
Exhibit IV-17: MTS Demand Response ADA Revenue Performance Indicators
Base Data and Base Year Audit Review Period % Change
Performance Indicators FY15 FY16 FY17 FY18 FY15-FY18
Operating Costs $16,970,435 $18,559,650 $19,764,550 $20,159,479 18.8%
Farebox Revenues $2,323,231 $2,385,015 $2,773,603 $2,598,019 11.8%
Net Cost $14,647,204 $16,174,635 $16,990,948 $17,561,461 19.9%
Unlinked Passenger Trips 475,322 516,221 529,091 505,973 6.4%
Farebox Recovery Ratio 13.7% 12.9% 14.0% 12.9% -5.9%
Average Fare per Passenger Trip $4.89 $4.62 $5.24 $5.13 5.1%
Net Cost per Passenger Trip $30.82 $31.33 $32.11 $34.71 12.6%
Percent Change, Consumer Price Index 2.2% 2.6% 2.8% 7.9%
Source: Form-C Reports
Operating costs increased faster than farebox revenues over the audit period. As a result, the farebox
recovery ratio shed about 6%, from 13.7% in FY15 to 12.9% in FY18. The average fare per trip increased
5.1%, but the net cost per passenger trip experienced an increase of 12.6%.
IV-4. MTS – Rail Operations Performance
Exhibit IV-18 shows MTS Rail Operations TDA performance indicators during the audit period.
Exhibit IV-18: MTS Rail TDA Performance Indicators
Verified TDA Statistics & Base Year Audit Review Period % Change
Performance Indicators FY15 FY16 FY17 FY18 FY15-FY18
Operating Costs $73,101,951 $75,515,653 $82,472,931 $90,313,010 23.5%
Unlinked Passengers 40,082,461 39,614,897 37,638,945 36,995,201 -7.7%
Vehicle Service Hours 495,684 492,683 490,197 478,175 -3.5%
Vehicle Service Miles 8,596,143 8,673,789 8,728,365 8,656,486 0.7%
Employee FTEs 497 474 461 461 -7.4%
Operating Cost per Revenue Vehicle Hour $147.48 $153.27 $168.24 $188.87 28.1%
Operating Cost per Passenger $1.82 $1.91 $2.19 $2.44 33.9%
Passengers per Revenue Vehicle Hour 80.86 80.41 76.78 77.37 -4.3%
Passengers per Revenue Vehicle Mile 4.66 4.57 4.31 4.27 -8.3%
Service Hours per Employee FTE 997 1,039 1,063 1,038 4.2%
Percent Change, Consumer Price Index 2.2% 2.6% 2.8% 7.9%
Source: NTD Reports
At the top level, ridership for MTS Rail services experienced a 7.7% decline over the audit period, which
is consistent with the national experience and about half the decline observed for Bus. The biggest drop
occurred between FY16 and FY17. MTS kept the service output stable in term of vehicle service miles
and constrained the vehicle service hours with a 3.5% reduction over three years. In addition, MTS

36
contained the labor force and employee FTEs decreased 36, from 497 in FY15 to 461 in FY18. Despite
these three concerted actions, the overall operating costs for Rail increased 23.5% over the audit period.
Reasons for the increase in operating cost include: (1) wages and (2) cost of electricity and (3)
Accounting for General Accounting Standards Board (GASB) regulations and operating capital flows. On
the labor side, MTS has a positive reputation in the community, but is confronted with record low
unemployment. To address retention, particularly with flaggers, MTS raised rates and adjusted
schedules. Security wages were affected by minimum wage increases. MTS has been closely tracking
energy costs particularly given the upcoming California Air Resource Board zero emissions requirements
and the paradigm change this will require for Bus operations. But with Rail, the total cost of energy (cost
of the commodity provided by Calpine plus the cost of demand/transmission provided by SDG&E) has
risen 16% during the audit period, and a further 20% in the first quarter of FY19. Finally, according to
management, adjusting for GASB and FY18 operating capital would bring rail operating cost increases
better in line with inflation – 6.5% versus 7.9%.
Findings for TDA performance indicators for rail include:
– The first two measures represent overall efficiency and effectiveness. Operating cost per revenue
vehicle hour, a measure of cost efficiency, increased 28.1% over the three-year audit period.
Operating cost per passenger, a measure of cost effectiveness, increased 33.9%. While these
increases are substantially higher than the change in inflation, MTS suffered the combined effects
of the ridership decrease with increased cost of operations.
– The next two measures are meant to capture productivity of the service provided. Passengers per
revenue vehicle hour and passengers per revenue vehicle mile decreased by 4.3% and 8.3%,
respectively due to the declines in ridership.
– The last measure is intended to address labor productivity. Service hours per employee
increased by 4.2% over the audit period. MTS is to be commended that it has managed to
improve labor productivity over multiple audit cycles.
Exhibit IV-19 shows MTS Rail Operations fare revenue indicators during the audit period.
Exhibit IV-19: MTS Rail Revenue Performance Indicators
Base Data and Base Year Audit Review Period % Change
Performance Indicators FY15 FY16 FY17 FY18 FY15-FY18
Operating Costs $73,101,951 $75,515,653 $82,472,931 $90,313,010 23.5%
Farebox Revenues $41,140,175 $41,113,382 $38,968,409 $39,353,823 -4.3%
Net Cost $31,961,776 $34,402,271 $43,504,522 $50,959,187 59.4%
Unlinked Passenger Trips 40,082,461 39,614,897 37,638,945 36,995,201 -7.7%
Farebox Recovery Ratio 56.3% 54.4% 47.2% 43.6% -22.6%
Average Fare per Passenger Trip $1.03 $1.04 $1.04 $1.06 3.6%
Net Cost per Passenger Trip $0.80 $0.87 $1.16 $1.38 72.7%
Percent Change, Consumer Price Index 2.2% 2.6% 2.8% 7.9%
Source: NTD Reports
The main findings for MTS Rail revenue are as follows:

37
– The MTS Rail farebox recovery ratio diminished from 56.3% in FY15 to 43.6% in FY18. MTS Rail
farebox recovery during the audit period was significantly higher than the MTS systemwide
farebox recovery requirement of 31.9%. As mentioned above, MTS has not taken the option to
report farebox recovery differently with the passing of SB 508, for the time being.
The system average farebox recovery for rail masks different recovery rates for the Blue, Orange,
Green and Silver lines. Of the four, the heavily used Blue line exhibits by far the highest farebox
recovery ratio. The FY18 annual route statistics show the Blue Line at 69.1% farebox recovery,
and the Orange, Green, and Silver lines at 39.5%, 39.6%, and 5.5%, respectively.
– The average fare per passenger trip decreased by 3.6% during the audit period, from $1.03 to
$1.06.
– The net cost per passenger trip increased by 72.7%, from $0.80 in FY15 to $1.38 in FY18. This
reflects the combined effect of increased net costs (i.e., higher energy and labor costs) and
decreased ridership levels.
During the audit period, MTS significantly reduced its operations staffing. This is shown in Exhibit IV-20.
Exhibit IV-20: MTS Rail Operations Performance Indicators
Base Data and Base Year Audit Review Period % Change
Performance Indicators FY15 FY16 FY17 FY18 FY15-FY18
Vehicle Operations FTEs 291.1 266.7 252.4 239.0 -17.9%
Vehicle Operations Costs $25,034,145 $25,995,153 $28,780,200 $31,982,876 27.8%
Car Service Hours (CSH) 495,684 492,683 490,197 478,175 -3.5%
Car Service Miles (CSM) 8,596,143 8,673,789 8,728,365 8,656,486 0.7%
Total Vehicle Hours 509,243 506,905 504,300 486,523 -4.5%
Total Vehicle Miles 8,690,330 8,786,704 8,839,806 8,758,506 0.8%
Unlinked Passenger Trips 40,082,461 39,614,897 37,638,945 36,995,201 -7.7%
Passenger Miles 224,422,021 220,170,000 210,971,128 214,376,455 -4.5%
CSH per Operations FTE 1,703 1,847 1,942 2,001 17.5%
CSM per Operations FTE 29,526
32,519
34,586
36,224 22.7%
Service Miles per Service Hour 17.3 17.6 17.8 18.1 4.4%
Service Hours / Total Hours 97.3% 97.2% 97.2% 98.3% 1.0%
Service Miles / Total Miles 98.9% 98.7% 98.7% 98.8% -0.1%
Vehicle Operations Cost per Passenger Trip $0.62 $0.66 $0.76 $0.86 38.4%
Vehicle Operations Cost per Passenger Mile $0.11 $0.12 $0.14 $0.15 33.7%
Average Passenger Miles per Passenger Trip 5.6 5.6 5.6 5.8 3.5% Preventable Accidents per 100,000 Total Vehicle Miles 1.17 1.21 1.04 1.16 -0.9%
Percent Change, Consumer Price Index 2.2% 2.6% 2.8% 7.9%
Source: NTD Reports, Annual Performance Monitoring Reports
Base data for rail operations show that MTS kept the service output stable over the audit period. Car
service hours decreased 3.5% since FY15, with the biggest reduction occurring between FY17 and FY18.
Total vehicle hours decreased 4.5% during the same period, meaning MTS carved out some efficiencies.

38
Car service miles and total vehicle miles remained very stable during the audit period with less than a 1%
change. Total rail vehicle operations costs jumped to $31.9 million in FY18.
The MTS Rail staff count decreased significantly during the audit period, by 52 FTEs in three years. The
biggest drop occurred in FY16, but the sizeable reductions occurred every year. The reduction is
explained by the ramping down of the extensive Trolley Renewal Project targeting the Blue and Orange
lines. The repairs and replacements included rehabilitation and retrofit of stations and transit centers
throughout the system, new crossovers and upgraded signaling, replacement of the overhead catenary
wire, track work and rail replacement, slope repair, and traction power substation replacement and
rehabilitation. MTS also opened the Courthouse Station, a $12 million terminal for the Orange Line that is
used as stub terminal. This station was constructed due to insufficient capacity at America Plaza station
to turn trains. MTS also refreshed the operations control center during this audit period with new screens.
Labor productivity measures such as Car Service Hours and Car Service Miles per Operations FTE
jumped by 17.5% and by 22.7%, respectively, mainly due to the staffing reductions.
MTS also maintains a very high rate of service efficiency, with rates in the high 90s percentage for both
service hours over total hours and service miles over total miles. Recent projects like the Courthouse
station are likely to improve these numbers even more.
Vehicle operations costs per passenger trip and per passenger mile did increase 38.4% and by 33.7%
over the audit period, respectively, largely due to the 27.8% increase in vehicle operations costs.
MTS Policy 42 Performance Monitoring Report for FY18 notes that Trolley had no preventable accidents
in FY16 or FY17, but two such accidents in FY18. Preventable accidents per 100,000 vehicle miles as
shown in Exhibit IV-25 continued their downward trend since FY15. MTS exhibits the best safety record in
the State of California among large light rail operators. Finally, as a result of its safety performance and of
its efforts to continuously enhance safety, MTS received the coveted APTA Rail Safety Gold Award in
Denver in June 2018.
During the audit period, MTS slightly increased its rail maintenance staffing. This is shown in Exhibit IV-
21.
Exhibit IV-21: MTS Rail Maintenance Performance Indicators
Base Data and Base Year Audit Review Period % Change
Performance Indicators FY15 FY16 FY17 FY18 FY15-FY18
Maintenance FTEs 202.1 203.3 206.7 215.8 6.7%
Maintenance Costs $25,026,539 $26,425,383 $29,852,701 $32,711,904 30.7%
Total Car Hours 509,243 506,905 504,300 486,523 -4.5%
Total Car Miles 8,690,330 8,786,704 8,839,806 8,758,506 0.8%
Peak Cars 97 97 97 97 0.0%
Total Cars 130 130 130 130 0.0%
Car Hours per Maintenance FTE 2,519 2,493 2,440 2,255 -10.5%
Car Miles per Maintenance FTE 42,992 43,213 42,776 40,594 -5.6%
Maintenance Cost per Active Vehicle $192,512 $203,272 $229,636 $251,630 30.7%
Maintenance Cost per Car Hour $49.14 $52.13 $59.20 $67.24 36.8%
Maintenance Cost per Car Mile $2.88 $3.01 $3.38 $3.73 29.7%
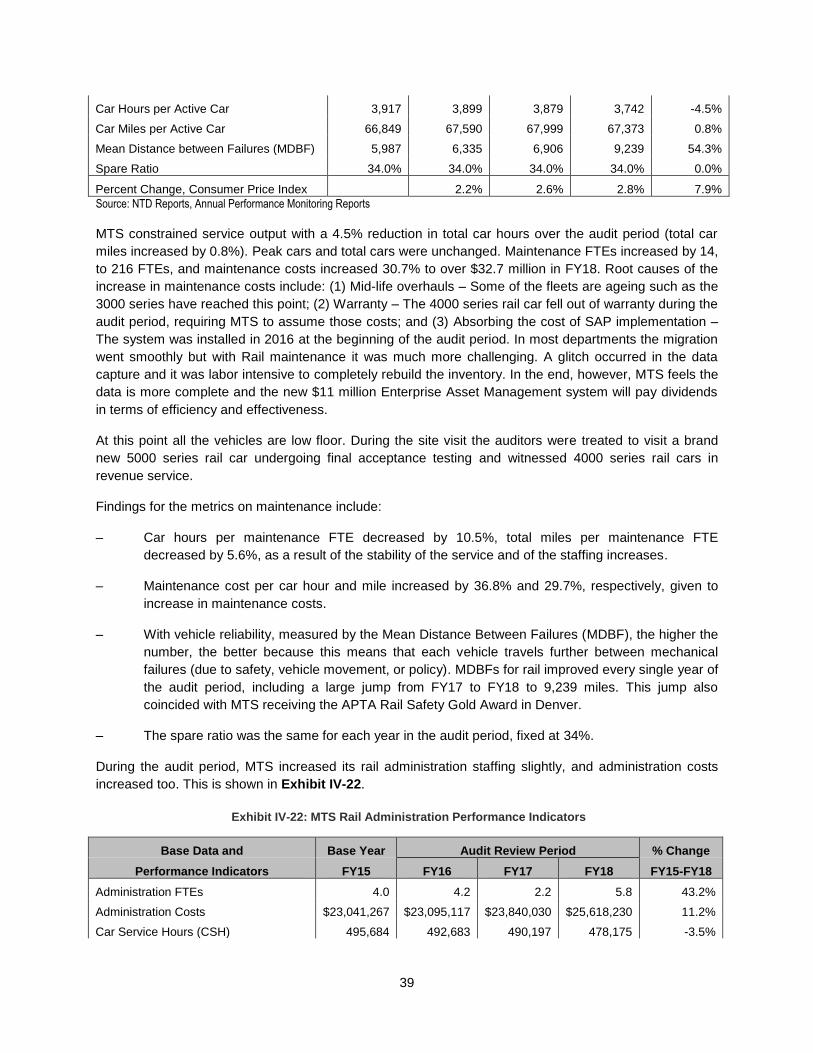
39
Car Hours per Active Car 3,917 3,899 3,879 3,742 -4.5%
Car Miles per Active Car 66,849 67,590 67,999 67,373 0.8%
Mean Distance between Failures (MDBF) 5,987 6,335 6,906 9,239 54.3%
Spare Ratio 34.0% 34.0% 34.0% 34.0% 0.0%
Percent Change, Consumer Price Index 2.2% 2.6% 2.8% 7.9%
Source: NTD Reports, Annual Performance Monitoring Reports
MTS constrained service output with a 4.5% reduction in total car hours over the audit period (total car
miles increased by 0.8%). Peak cars and total cars were unchanged. Maintenance FTEs increased by 14,
to 216 FTEs, and maintenance costs increased 30.7% to over $32.7 million in FY18. Root causes of the
increase in maintenance costs include: (1) Mid-life overhauls – Some of the fleets are ageing such as the
3000 series have reached this point; (2) Warranty – The 4000 series rail car fell out of warranty during the
audit period, requiring MTS to assume those costs; and (3) Absorbing the cost of SAP implementation –
The system was installed in 2016 at the beginning of the audit period. In most departments the migration
went smoothly but with Rail maintenance it was much more challenging. A glitch occurred in the data
capture and it was labor intensive to completely rebuild the inventory. In the end, however, MTS feels the
data is more complete and the new $11 million Enterprise Asset Management system will pay dividends
in terms of efficiency and effectiveness.
At this point all the vehicles are low floor. During the site visit the auditors were treated to visit a brand
new 5000 series rail car undergoing final acceptance testing and witnessed 4000 series rail cars in
revenue service.
Findings for the metrics on maintenance include:
– Car hours per maintenance FTE decreased by 10.5%, total miles per maintenance FTE
decreased by 5.6%, as a result of the stability of the service and of the staffing increases.
– Maintenance cost per car hour and mile increased by 36.8% and 29.7%, respectively, given to
increase in maintenance costs.
– With vehicle reliability, measured by the Mean Distance Between Failures (MDBF), the higher the
number, the better because this means that each vehicle travels further between mechanical
failures (due to safety, vehicle movement, or policy). MDBFs for rail improved every single year of
the audit period, including a large jump from FY17 to FY18 to 9,239 miles. This jump also
coincided with MTS receiving the APTA Rail Safety Gold Award in Denver.
– The spare ratio was the same for each year in the audit period, fixed at 34%.
During the audit period, MTS increased its rail administration staffing slightly, and administration costs
increased too. This is shown in Exhibit IV-22.
Exhibit IV-22: MTS Rail Administration Performance Indicators
Base Data and Base Year Audit Review Period % Change
Performance Indicators FY15 FY16 FY17 FY18 FY15-FY18
Administration FTEs 4.0 4.2 2.2 5.8 43.2%
Administration Costs $23,041,267 $23,095,117 $23,840,030 $25,618,230 11.2%
Car Service Hours (CSH) 495,684 492,683 490,197 478,175 -3.5%

40
Car Service Miles (CSM) 8,596,143 8,673,789 8,728,365 8,656,486 0.7%
CSH per Administration FTE 122,922 117,824 226,314 82,794 -32.6%
CSM per Administration FTE 2,131,716 2,074,325 4,029,716 1,498,829 -29.7%
Complaints per 100,000 Passengers 1.9 1.5 1.2 1.3 -31.6%
Percent Change, Consumer Price Index 2.2% 2.6% 2.8% 7.9%
Source: NTD Reports, Annual Performance Monitoring Reports
For base data reported to NTD, administrative costs for Rail increased 11.2% over the audit period,
compared to 7.9% for the San Diego County CPI. The number of administration FTEs is somewhat
suspicious with a large dip and jump in FY17 and FY18, though from a small base. Administrative costs
rose a bit higher than inflation, to over $25 million in FY18.
Customer satisfaction improved during the audit period as complaints per 100,000 passengers decreased
by 31.7% over the audit period. This continues a positive trend from the past audit period (FY12-15). The
decrease in complaints was specific to MTS Rail. Trolley complaints are tracked through the consolidated
MTS call center, now in place since FY14.

41
SECTION V: CONCLUSIONS AND RECOMMENDATIONS MTS is in compliance with PUC requirements and has made satisfactory progress to implement prior
audit recommendations:
– Compliance with PUC Requirements: MTS is in compliance with applicable PUC requirements.
– Progress to Implement Prior Audit Recommendations: The last audit did not have any
recommendations
The systemwide TDA performance trends overall are indicative of the continued attention that MTS
placed on cost containment during the audit period, and the Transit Optimization Plan was drawn up and
implemented to combat declining ridership. One recommendation is offered for MTS at this time.
Recommendation 1:
Issues and Opportunities. MTS suffered fare erosion across its system during the last three years.
MTS has not raised fares in 10 years, since 2009. The combined farebox recovery ratio for all modes in
FY2018 was 31.7%. For FY2018, the farebox recovery ratio is 43.6% for rail and 20.8% for directly
operated bus. While farebox recovery for rail is still very healthy, the bus number is 9% lower than where
it started the audit period (30%).
Two developments have occurred in the audit period:
• Passage of SB 508, enabling MTS to report local revenues in the farebox calculations to the
State
• SANDAG fare change, scheduled for implementation in September 2019 and designed to
harmonize fares across NCTD and MTS, to simplify the structure and raise more revenues.
SB 508 provides an opportunity to report farebox differently. SANDAG’s fare change, the first since 2009,
affects mostly passes (reduction for youth passes, increase for senior/disabled/Medicare patrons, day
pass went up by one dollar). The new INIT fare collection system is expected to reduce the need for
passes by calculating the best fare possible for each rider. MTS expects that once the fare change goes
into effect, an additional four to five million dollars will be generated, with a positive impact on the farebox
recovery ratio.
Recommended Actions. This is a two-part recommendation. First, MTS should track and document the
farebox recovery ratio side by side over the next several years both with SB 508 reporting and without.
SB 508 provides an opportunity for MTS shine a light on local revenue generation as well as further
develop cost efficiencies. For the second part, a fare increase would bring back farebox revenue back to
historical average. Given the other constraints (ballot measure, coordination with new regional fare
structure, new fare collection system implementation) a new fare increase is not expected in the
immediate near term but ought to be considered at the earliest opportunity.
Expected Results. Maximize local fund contribution to operations. Increased fare revenues to maintain
farebox recovery above 20%.
MTS Response.
• MTS is in compliance with the TDA FRR thresholds and has already obtained approval from our Board and the SANDAG Board to simplify fares and increase revenue (primarily driven by the $1 increase in the day pass) by approximately $5M. Since historically we haven’t had challenges meeting the FRR target and thus haven’t needed to look at other “local funds” to enhance our

42
revenue streams, we can track these sources of revenues and determine the impacts on FRR with and without these revenue sources.
• Our focus in the coming years are to drive additional riders to our system through a simplified fare structure, and a significant enhancement of our transit network as we pursue additional sales taxes through a November 2020 ballot measure. With this as the short-term focus, there are no considerations for additional fare increases in the coming years.