fy18 state of the fleet report final
TRANSCRIPT
1 | P a g e
State of the Fleet Report Fiscal Year 2018
EQUIPMENT MANAGEMENT DIVISION

2 | P a g e
Government Fleet “Leading Fleets” Competition – For 2018, the City of Tulsa Equipment Management Division (EMD) was recognized as the #1 Leading Fleet in North America. This was EMD’s fifth year to participate and win a spot in the top 50. This is a rigorous fleet competition, involving head-to-head competition against the best public fleet organizations from all 50 States plus Canada. No other Oklahoma fleet placed in the top 50.
3 | P a g e
Contents Executive Summary 5
Operational Overview 5
EMD Expenditures 6
EMD Positions 6
Rates & Customer Billings 6
Vendor Surveys 7
FY18 Outsourcing 8
Preventive Maintenance Program 8
M5 Fleet Management System 9
Key Performance Indicators 9
Insurance Collections 10
Fuel Costs 10
Fuel Consumption 12
FY18 Motor Fuels and Fleet Parts Ending Inventories 13
Count of Fleet Units 13
Total Annual Miles Driven for the Entire Fleet 15
Ratio of Vehicles to Employees 15
Count of Vehicles Driven Less than 5,000 Miles 15
Total Annual Capital Expenditures for Licensed Vehicles 16
Year-End Average Fleet Age 16
Operational Downtime 17
Fleet Management Steering Committee (FMSC) 18
Fleet Utilization Scoring System (FUSS) 18
Alternative Fueled Vehicles (AFVs) and AFV Infrastructure 19
Conclusion 20
Appendix 1 – Tables 22
Appendix 2 – Contact Information 35
4 | P a g e
Charts Chart 1 – EMD Positions 5
Chart 2 – FY18 Expenditures ($Million) 6
Chart 3 – FY18 Department Billings ($Million) 7
Chart 4 – EMD Labor Rate Versus Vendor Rates 8
Chart 5 – 9-Year Insurance Collections 10
Chart 6 – FY18 Fuel Purchases (Million Gallons) 10
Chart 7 – Average Price for Unleaded Fuel 11
Chart 8 – Average Price for Diesel Fuel 11
Chart 9 – Average Price for CNG 11
Chart 10 – Fuel Costs and Fuel Consumption 12
Chart 11 – 5-Year Fuel Consumption 12
Chart 12 – Four-Year Comparison of Fuel Consumption (Gallons) 13
Chart 13 – Fleet Count (by Vehicle Type) 14
Chart 14 – Fleet Count (by Department) 14
Chart 15 – Total Annual Miles Driven 15
Chart 16 – FY18 Year-End Fleet Age (Light Fleet) 16
Chart 17 – FY18 Year-End Fleet Age (Trucks) 16
Chart 18 – Average Downtime (by Category) 17
Chart 19 – Average Downtime (by Shop) 17
Chart 20 – FY18 Fleet Justification Forms 18
5 | P a g e
EXECUTIVE SUMMARY This State of the Fleet Report looks at the past fiscal year to explain what significant and operational activities took place in the Equipment Management Division (EMD). The main purpose of this report is to inform management, employees, and customers about what took place during FY18 that could impact the EMD’s ability to operate effectively and efficiently in the future. This report also addresses the EMD’s challenges, opportunities, and planned activities for FY19.
EMD Mission Statement: To provide our customers with safe, economical, environmentally efficient and reliable services to ensure maximum utilization of the fleet.
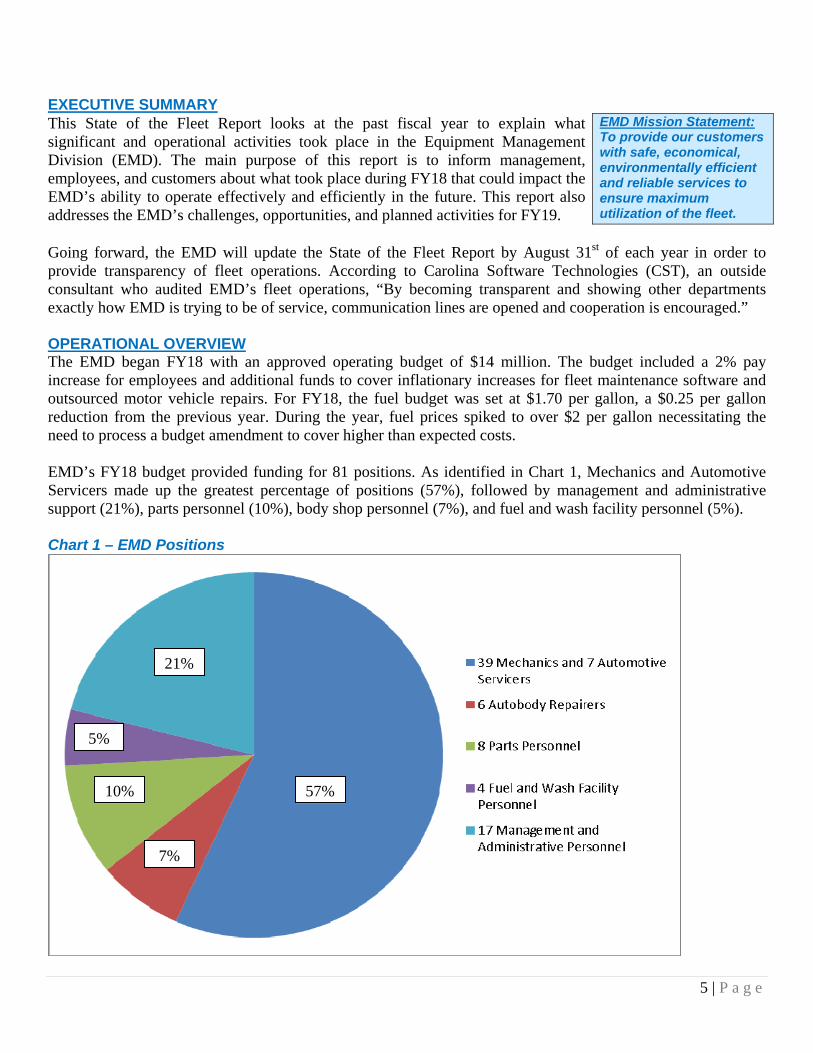
Going forward, the EMD will update the State of the Fleet Report by August 31st of each year in order to provide transparency of fleet operations. According to Carolina Software Technologies (CST), an outside consultant who audited EMD’s fleet operations, “By becoming transparent and showing other departments exactly how EMD is trying to be of service, communication lines are opened and cooperation is encouraged.” OPERATIONAL OVERVIEW The EMD began FY18 with an approved operating budget of $14 million. The budget included a 2% pay increase for employees and additional funds to cover inflationary increases for fleet maintenance software and outsourced motor vehicle repairs. For FY18, the fuel budget was set at $1.70 per gallon, a $0.25 per gallon reduction from the previous year. During the year, fuel prices spiked to over $2 per gallon necessitating the need to process a budget amendment to cover higher than expected costs. EMD’s FY18 budget provided funding for 81 positions. As identified in Chart 1, Mechanics and Automotive Servicers made up the greatest percentage of positions (57%), followed by management and administrative support (21%), parts personnel (10%), body shop personnel (7%), and fuel and wash facility personnel (5%). Chart 1 – EMD Positions
57%
21%
7%
10%
5%
6 | P a g e
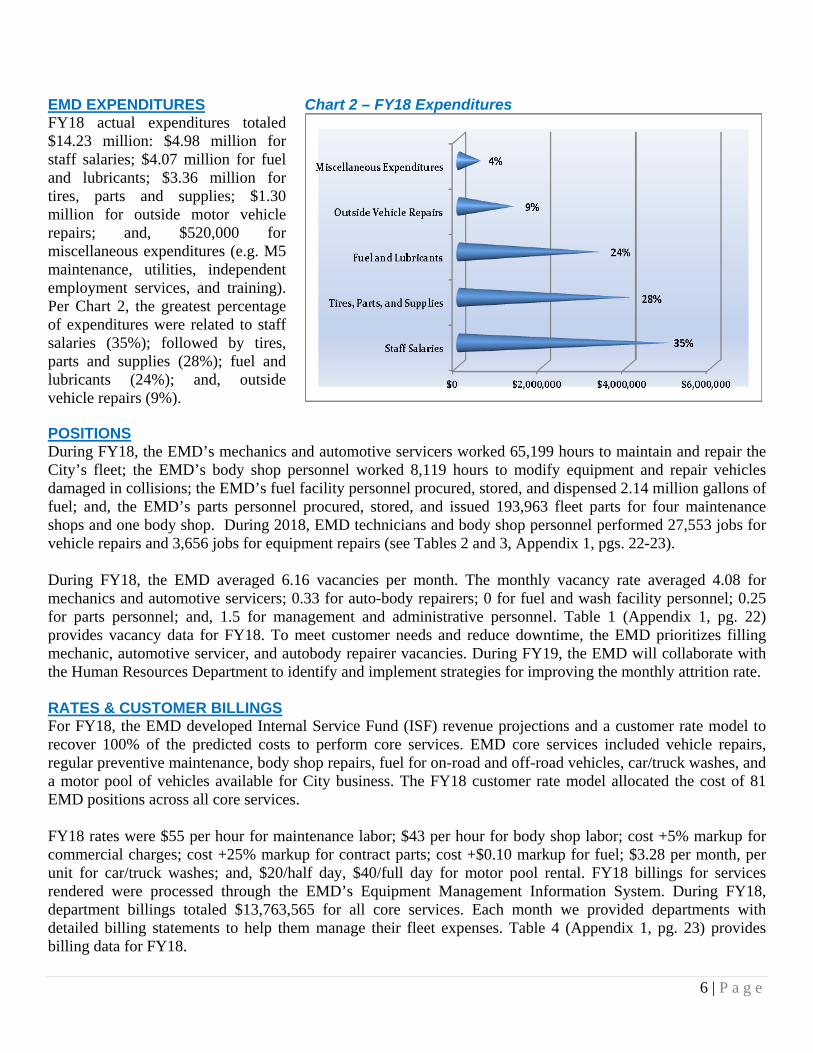
EMD EXPENDITURES FY18 actual expenditures totaled $14.23 million: $4.98 million for staff salaries; $4.07 million for fuel and lubricants; $3.36 million for tires, parts and supplies; $1.30 million for outside motor vehicle repairs; and, $520,000 for miscellaneous expenditures (e.g. M5 maintenance, utilities, independent employment services, and training). Per Chart 2, the greatest percentage of expenditures were related to staff salaries (35%); followed by tires, parts and supplies (28%); fuel and lubricants (24%); and, outside vehicle repairs (9%).
Chart 2 – FY18 Expenditures
POSITIONS During FY18, the EMD’s mechanics and automotive servicers worked 65,199 hours to maintain and repair the City’s fleet; the EMD’s body shop personnel worked 8,119 hours to modify equipment and repair vehicles damaged in collisions; the EMD’s fuel facility personnel procured, stored, and dispensed 2.14 million gallons of fuel; and, the EMD’s parts personnel procured, stored, and issued 193,963 fleet parts for four maintenance shops and one body shop. During 2018, EMD technicians and body shop personnel performed 27,553 jobs for vehicle repairs and 3,656 jobs for equipment repairs (see Tables 2 and 3, Appendix 1, pgs. 22-23). During FY18, the EMD averaged 6.16 vacancies per month. The monthly vacancy rate averaged 4.08 for mechanics and automotive servicers; 0.33 for auto-body repairers; 0 for fuel and wash facility personnel; 0.25 for parts personnel; and, 1.5 for management and administrative personnel. Table 1 (Appendix 1, pg. 22) provides vacancy data for FY18. To meet customer needs and reduce downtime, the EMD prioritizes filling mechanic, automotive servicer, and autobody repairer vacancies. During FY19, the EMD will collaborate with the Human Resources Department to identify and implement strategies for improving the monthly attrition rate. RATES & CUSTOMER BILLINGS For FY18, the EMD developed Internal Service Fund (ISF) revenue projections and a customer rate model to recover 100% of the predicted costs to perform core services. EMD core services included vehicle repairs, regular preventive maintenance, body shop repairs, fuel for on-road and off-road vehicles, car/truck washes, and a motor pool of vehicles available for City business. The FY18 customer rate model allocated the cost of 81 EMD positions across all core services. FY18 rates were $55 per hour for maintenance labor; $43 per hour for body shop labor; cost +5% markup for commercial charges; cost +25% markup for contract parts; cost +$0.10 markup for fuel; $3.28 per month, per unit for car/truck washes; and, $20/half day, $40/full day for motor pool rental. FY18 billings for services rendered were processed through the EMD’s Equipment Management Information System. During FY18, department billings totaled $13,763,565 for all core services. Each month we provided departments with detailed billing statements to help them manage their fleet expenses. Table 4 (Appendix 1, pg. 23) provides billing data for FY18.

7 | P a g e
The maintenance labor rate has remained static the past few years while benefits and training costs have risen nearly 25%. As a result, the FY19 maintenance labor rate is being increased to $62 per hour. This will ensure revenues cover escalating costs for benefits and training; an FY19 across-the-board salary increase; and, permanent pay increases for technicians obtaining professional certifications. Since FY15, parts and outside repair costs have risen upwards of 25 to 50 percent. This is attributed to vehicles and equipment being retained for longer periods of time because adequate funds are not always available to replace units at the proper intervals. FY19 appropriations are being increased by $409,000 to cover rising parts, fuel and software maintenance costs.
Chart 3 – Department Billings Resources dedicated to EMD will continue to address the Mayor and City Council’s goals and objectives, which include improving public safety and making local government efficient and reliable. FY18 funding allowed EMD to continue to provide preventive maintenance and unscheduled repairs as well as fuel services to the Police, Fire and Water and Sewer departments, among others, for their vital operations.
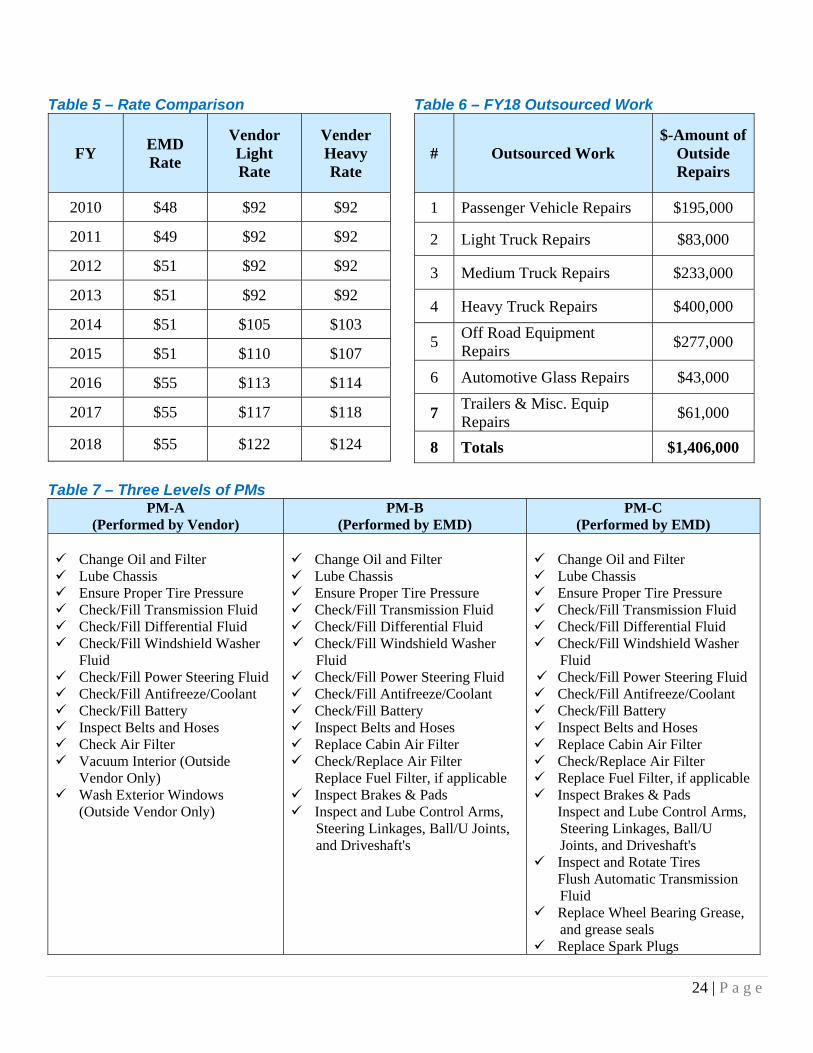
VENDOR SURVEYS As part of the FY18 cost of operations review, the EMD surveyed local businesses and dealerships to understand labor costs in Tulsa. Table 5 (Appendix 1, pg. 24) provides survey results for the past 8 years. The FY18 average labor rate for automotive and light trucks was $122 per hour; and, the average labor rate for heavy trucks and heavy equipment was $124 per hour. For FY18, the EMD’s maintenance labor rate was 122% to 126% below the market; $55 versus vendor rate of $122-$124 (see Chart 4). The $55 labor rate does not adequately cover EMD’s labor costs. Since benefits costs have increased by nearly 25% the past several years and training costs have risen by almost 20%, the FY19 labor rate is being increased by $7. This is needed to cover higher benefits and training costs, as well as an FY19 across-the board salary increase, and permanent pay increases for technicians obtaining professional certifications.

8 | P a g e
During FY18, the EMD saved City departments $4.07 million by performing 65,199 hours of maintenance on the City’s fleet instead of outsourcing this work. The $4.07 million savings is derived by multiplying the $62.50 per hour savings by 65,199 maintenance hours performed by EMD technicians. The EMD will annually survey local vendors to ensure its rates are reasonable and cost competitive. Rate comparisons will be provided to all City departments. FY18 OUTSOURCING In some cases, it is more efficient to outsource specialized maintenance and repair work. For example, the EMD saved City customers $71,932 in FY18 by outsourcing specialized
Chart 4 – EMD Labor Rate versus Vendor Rates
maintenance and repair work. For example, the EMD saved City customers $71,932 in FY18 by outsourcing basic oil changes (PMAs). The oil changes were outsourced to local vendors who performed 1,816 PMAs on City vehicles. Vendor costs were $58,372, or approximately $32.14 per oil change. The EMD’s cost to perform PMAs is $71.75 per oil change ($55 labor + $16.75 for oil and filter). The savings is calculated as follows: ($71.75-$32.14)*1,816=$71,932. For FY19, the EMD outsourced 1.4-million for vehicle maintenance and repairs. Table 6 (Appendix 1, pg. 24) identifies some of the maintenance and repair work that was outsourced in FY18. The EMD will continue to subcontract repair work when efficiencies and/or cost savings benefit City departments. PREVENTIVE MAINTENANCE PROGRAM The EMD’s Preventive Maintenance (PM) program helps bolster fleet availability. The EMD’s three levels of PMs are based on time, miles/hours, and gallons. Table 7 (Appendix 1, pg. 24) identifies the services provided for each PM level. The EMD interfaces with its fueling system to record up-to-date odometer readings in order to properly schedule PMs. The EMD tracks maintenance in its M5 Fleet System and provides a monthly PM schedule to equipment coordinators. EMD’s goal is to achieve a 95% PM compliance rate for all fleet equipment. FY18 preventive maintenance compliance results were 87% for vendor PMs and 87% for combined light-duty and heavy duty PMs. These percentages are calculated as follows:
Vendor PMs 1 FY18 Scheduled Vendor PMs Completed 1,2792 FY18 Unscheduled Vendor PMs Completed 6583 Total FY18 Vendor PMs Completed (1,279 + 658) 1,9374 FY18 Vendor PMs Scheduled 2,2205 FY18 Vendor PM Compliance Rate (1,937/2,220) 87%

9 | P a g e
In-House PMs (Light Duty and Heavy Duty Units) 1 FY18 Scheduled In-House PMs Completed 2,5062 FY18 Unscheduled In-House PMs Completed 1,0113 Total FY18 In-House PMs Completed (2,506 + 1,011) 3,5174 FY18 In-House PMs Scheduled 4,0415 FY18 In-House PM Compliance Rate (3,517/4,041) 87%
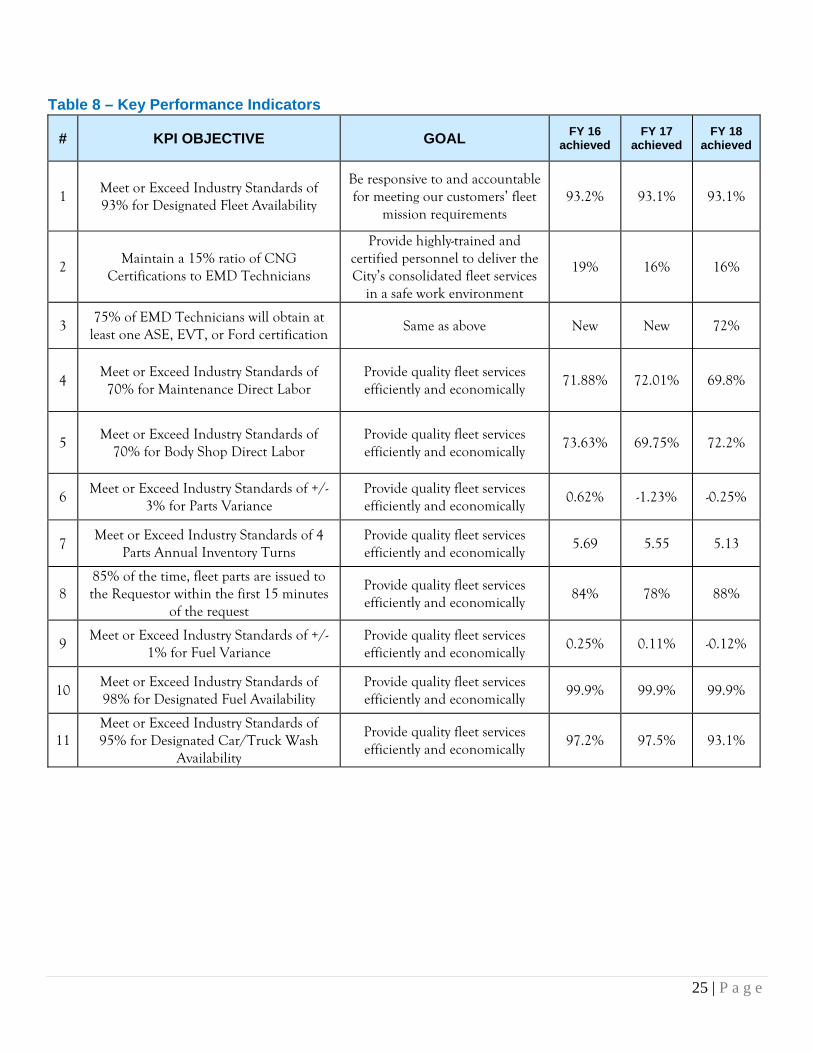
M5 FLEET MANAGEMENT SYSTEM The EMD’s fleet management system is used to track and automate fleet maintenance activities for the City’s licensed fleet of nearly 2,500 vehicles and off-road fleet of over 800 units. In December 2012, the EMD upgraded its fleet software from client server technology (M4) to current-day web technology (M5). EMD annually trains employees to use the M5 system. Employees learn how to obtain the following M5 information: maintenance cost history; fuel costs and fuel consumption history; preventive maintenance due dates and completion dates; basic unit information (mileage, tag numbers, vehicle identification numbers); unit disposal information (date sold, reason for disposal, amount unit was sold for); and, work order information (status of open work orders). M5 has provided EMD and City Departments with broader system access, improved reporting, “Real-time” labor tracking, and improved transparency through better reporting tools. The new fleet system is allowing EMD customers to gain unlimited M5 access so they can obtain “real-time” fleet information. The current M5 configuration allows for 4,600 active units to be maintained on the system at any one time. During FY14, $47,520 was spent to increase the active unit count from 4,000 to 4,600 units. The active unit count was increased to account for additional equipment in the Fire Department. During FY18, EMD began using an M5 module that allows technicians to electronically request parts from their work stations. The M5 Parts Request Module works as follows: 1) the technician logs into the M5 fleet management system and submits an electronic parts request from the work order screen or from the labor wedge screen; 2) an electronic parts request is received by the Storekeeper; 3) the Storekeeper procures the part if it is not stocked; 4) if the part is stocked, the Storekeeper electronically issues the part to the applicable work order; 5) the Storekeeper then delivers the part to the technician’s work location. Electronic parts issuance eliminates the need for technicians to visit the storeroom and allows technicians to remain on task while Storekeepers deliver requested parts to their work location. During FY19, the EMD will revise all M5 owning and user department codes to match organization codes in the City’s MUNIS financial system. EMD staff will also continue efforts to standardize M5 vehicle and equipment descriptions; install dashboards and train employees how to use them; and, create standardized data categories for improved reporting and efficiencies. KEY PERFORMANCE INDICATORS The EMD monthly and annually tracks 11 Key Performance Indicators (KPIs). Table 8 (Appendix 1, pg. 25) provides KPI results for FYs 16-18. The KPIs provide a snapshop of our overall performance; promote long-term strategic goals; and, lead to actionable steps in order to achieve our goals. For FY18, 8 of 11 KPI objectives were met. The following KPIs were not met: 1) 75% of EMD technicians obtained at least one Automotive Service Excellence (ASE), Emergency Vehicle Technician (EVT) or Ford certification; 2) maintenance direct labor meets or exceeds 70%; and, 3) car/truck wash availability meets or exceeds 95%. To meet the certification objective, technicians will receive permanent pay increases for obtaining and maintaining ASE, EVT and Ford certifications. To meet the maintenance direct labor goal, the EMD will work with Human Resources to timely fill vacancies and will also hire temporary help to increase billed labor hours. To meet the car/truck wash standard, the EMD will refurbish aging wash facility components to help reduce downtime.

10 | P a g e
INSURANCE COLLECTIONS EMD subrogates, settles, and collects insurance claims against insurance companies for drivers who are involved in accidents with City vehicles where the City driver was not at fault. These claims help pay for the damage to repair the vehicle, or in situations where the damage costs are greater than the value of the vehicle, to compensate the City for the total loss of the vehicle. During FY18, the EMD subrogated and collected insurance proceeds of $156,472 for 54 collectable accidents. At year-end FY18, the EMD was still in the process of collecting an additional $438,058 of which $191,300 is being pursued with help from the City’s legal department (the $438K will be collected during FY19). During the past ten years, the EMD has subrogated and collected $1.7 million in insurance claims for the benefit of City departments (see Chart 5).
Chart 5 – Insurance Collections
FUEL COSTS During FY18, the EMD purchased 2.14 million gallons of petroleum and CNG for the City’s fleet. The quantities purchased by fuel type were: 1.19 million gallons of unleaded fuel; 889,000 gallons of diesel fuel; 21,000 gasoline gallon equivalents (GGE) of compressed natural gas (CNG); and, 40,000 gallons of jet fuel (see Chart 6). Unleaded fuel purchased from IPC, Inc. (TAC 071B) was -$0.0135 per gallon BELOW OPIS (Oil Price Information Service); and, diesel fuel purchased from IPC, Inc. was -$0.0105 BELOW OPIS. During FY18, the EMD purchased biodiesel/ultra-low sulfur diesel (ULSD) for the City’s diesel fleet. Vapor recovery
Chart 6 – FY18 Fuel Purchases
was fully-functional on all city dispensers. Though not required in Tulsa, Vapor Recovery is a system that returns harmful hydrocarbon vapors to fuel storage tanks. Recovery of hydrocarbon vapors is good for the environment and the EPA requires Vapor Recovery in non-attainment cities. Prior to FY14, the EMD purchased 100% gasoline (E0) for the City’s unleaded fleet. During second quarter FY14, the EMD switched to E10 (10% Ethanol) due to the escalating costs of Ethanol-free fuel. The EMD will continually monitor any problems the switch to E10 may cause fuel tanks and vehicle filtration systems. Corrective measures will be taken if problems arise (e.g. using fuel additives that neutralize combustion acids and inhibit corrosion). The only issues identified to date are high alcohol content trouble codes in the Chevrolet Impala (Model Year 2009-2010).
11 | P a g e
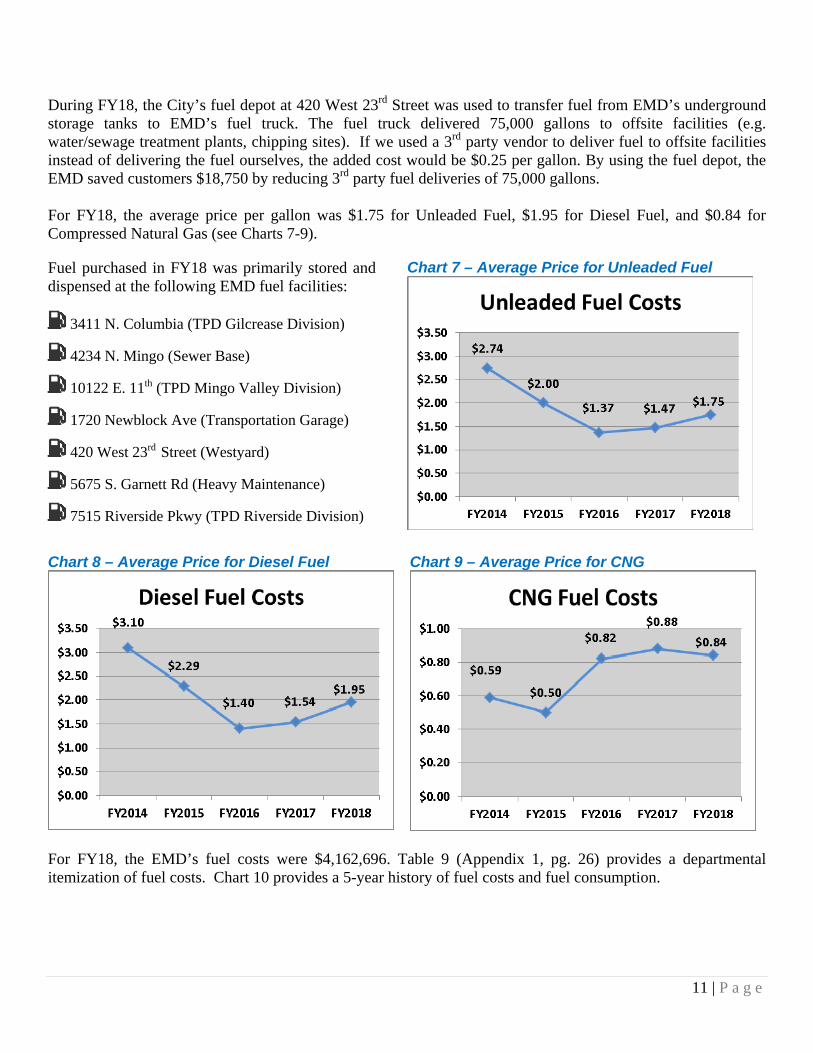
During FY18, the City’s fuel depot at 420 West 23rd Street was used to transfer fuel from EMD’s underground storage tanks to EMD’s fuel truck. The fuel truck delivered 75,000 gallons to offsite facilities (e.g. water/sewage treatment plants, chipping sites). If we used a 3rd party vendor to deliver fuel to offsite facilities instead of delivering the fuel ourselves, the added cost would be $0.25 per gallon. By using the fuel depot, the EMD saved customers $18,750 by reducing 3rd party fuel deliveries of 75,000 gallons. For FY18, the average price per gallon was $1.75 for Unleaded Fuel, $1.95 for Diesel Fuel, and $0.84 for Compressed Natural Gas (see Charts 7-9).
Fuel purchased in FY18 was primarily stored and dispensed at the following EMD fuel facilities:
3411 N. Columbia (TPD Gilcrease Division)
4234 N. Mingo (Sewer Base)
10122 E. 11th (TPD Mingo Valley Division)
1720 Newblock Ave (Transportation Garage)
420 West 23rd Street (Westyard)
5675 S. Garnett Rd (Heavy Maintenance)
7515 Riverside Pkwy (TPD Riverside Division)
Chart 7 – Average Price for Unleaded Fuel
Chart 8 – Average Price for Diesel Fuel Chart 9 – Average Price for CNG
For FY18, the EMD’s fuel costs were $4,162,696. Table 9 (Appendix 1, pg. 26) provides a departmental itemization of fuel costs. Chart 10 provides a 5-year history of fuel costs and fuel consumption.

12 | P a g e
Chart 10 – Fuel Costs and Fuel Consumption
FUEL CONSUMPTION During FY18, Departments and Agencies consumed 2.14 million gallons of fuel (see Chart 11). Quantities consumed by fuel type were: 1.19 million gallons of Unleaded Fuel; 889,000 gallons of Diesel Fuel; 21,000 gasoline gallon equivalents (GGEs) of Compressed Natural Gas (CNG); and, 40,000 gallons of Jet Fuel. For FY18, fuel consumption was similar to the previous year, but fuel costs increased 21.7%. To reduce fuel consumption and costs, the EMD encourages drivers to employ energy conservation strategies identified in Table 11 (Appendix 1, pg. 26). Strategies include reducing idle times, route planning, and keeping tires properly inflated.
Chart 11 – Fuel Consumption
The City’s long range plan to reduce fuel consumption includes replacement of vehicles at the end of their lifecycle with more fuel efficient vehicles. The long range plan encompasses the following steps: 1) An Equipment Study is developed by the Finance Department to determine how much funding is needed to replace vehicles over a 10-year timeframe. The Study then recommends a funding allocation for each department; 2) A Fleet Utilization Scoring System (FUSS) is developed by EMD to identify which vehicles are eligible to be replaced; 3) Departments must submit Fleet Justification Forms (FJFs) to obtain approval for vehicle replacements; and, 4) The Fleet Management Steering Committee (FMSC) must review all FJFs and either approve or deny vehicle replacement requests.
13 | P a g e
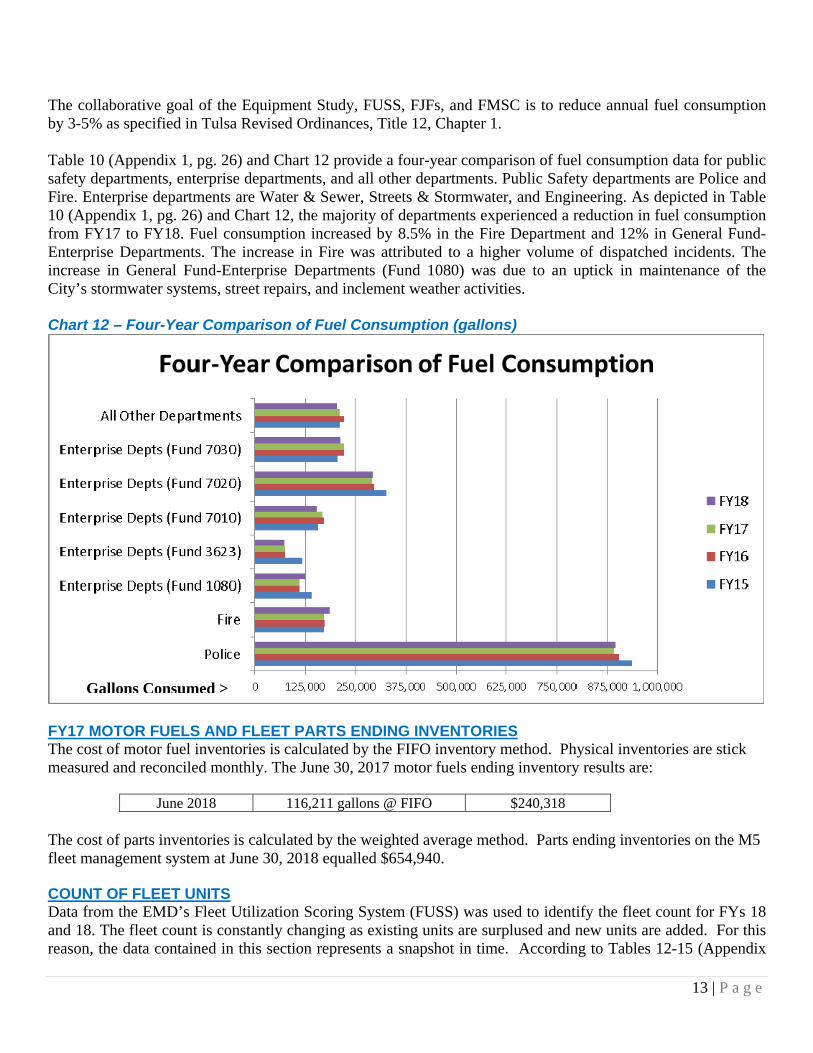
The collaborative goal of the Equipment Study, FUSS, FJFs, and FMSC is to reduce annual fuel consumption by 3-5% as specified in Tulsa Revised Ordinances, Title 12, Chapter 1. Table 10 (Appendix 1, pg. 26) and Chart 12 provide a four-year comparison of fuel consumption data for public safety departments, enterprise departments, and all other departments. Public Safety departments are Police and Fire. Enterprise departments are Water & Sewer, Streets & Stormwater, and Engineering. As depicted in Table 10 (Appendix 1, pg. 26) and Chart 12, the majority of departments experienced a reduction in fuel consumption from FY17 to FY18. Fuel consumption increased by 8.5% in the Fire Department and 12% in General Fund-Enterprise Departments. The increase in Fire was attributed to a higher volume of dispatched incidents. The increase in General Fund-Enterprise Departments (Fund 1080) was due to an uptick in maintenance of the City’s stormwater systems, street repairs, and inclement weather activities. Chart 12 – Four-Year Comparison of Fuel Consumption (gallons)
FY17 MOTOR FUELS AND FLEET PARTS ENDING INVENTORIES The cost of motor fuel inventories is calculated by the FIFO inventory method. Physical inventories are stick measured and reconciled monthly. The June 30, 2017 motor fuels ending inventory results are:
June 2018 116,211 gallons @ FIFO $240,318 The cost of parts inventories is calculated by the weighted average method. Parts ending inventories on the M5 fleet management system at June 30, 2018 equalled $654,940. COUNT OF FLEET UNITS Data from the EMD’s Fleet Utilization Scoring System (FUSS) was used to identify the fleet count for FYs 18 and 18. The fleet count is constantly changing as existing units are surplused and new units are added. For this reason, the data contained in this section represents a snapshot in time. According to Tables 12-15 (Appendix
Gallons Consumed >

14 | P a g e
1, pgs. 27-28) and Charts 13-14, the fleet count decreased by 8 units, or -0.3% during FY18. Most vehicle classes did not experience a significant change. The most significant change was in the Motorcycle category which decreased from 26 to 18 units, a 31% decrease. Chart 13 – Fleet Count (by Vehicle Type)
Chart 14 – Fleet Count (by Department)
During FY18, the EMD will continue to implement fleet efficiency initiatives outlined in the City’s 2011 Sustainability Plan. These initiatives include reducing energy costs, increasing efficiencies, and improving air quality. The Plan’s initiatives related to EMD are: 1) develop and implement a plan to right-size the City’s fleet; 2) increase the net fuel efficiency of the fleet; 3) increase the use of CNG in the City fleet; and, 4) integrate fleet data into an overall sustainability and energy data management program. The Sustainability Plan recommends the City reduce its fleet of on-road vehicles by 550 within 5 years. The FMSC, EMD, and City departments continue to identify under-utilized vehicles that can be surplused without replacement.

15 | P a g e
TOTAL ANNUAL MILES DRIVEN During FY18, the City’s on-road fleet drove 20,103,285 miles. Compared to the previous fiscal year, miles driven decreased 0.7% in the Police Department (-76,358); decreased 7.5% in the Fire Department (-103,198); increased 0.4% in the enterprise departments (+22,601); decreased 21.2% in the Parks Department (-126,020); decreased 5.3% in the Planning and Development Department (-13,443); decreased 21.2% in the WIN Department (-38,665); increased 0.7% in the Asset Management Department (+5,020); and, decreased 44.2% in all other departments (-134,077). FY18 miles driven by all departments were 464,140 less than the previous FY (2.3% decrease). For the past four fiscal years, average miles driven by the City’s fleet is approximately 20.5 million. Chart 15 and Table 16 (Appendix 1, pg. 28) provide a four-year comparison of annual miles driven by the City’s fleet. Table 17 (Appendix 1, pg. 28) provides a 2-year comparison of miles driven by department (FY18 versus FY17). RATIO OF VEHICLES TO EMPLOYEES For FY18, the ratio of on-road vehicles compared to the number of City employees equals 0.63 vehicles for every City employee (-2.5% decrease from previous FY). As identified in Table 18 (Appendix 1, pg. 29), the greatest change from FY17 to FY18 was in the Parks Department (5.9% increase). The Parks increase occured because their position count decreased while their fleet size increased. Ratios decreased in the Fire and Enterprise Departments because position counts increased while the fleet size decreased.
Chart 15 – Miles Driven
COUNT OF VEHICLES DRIVEN LESS THAN 5,000 MILES, 2,500 MILES, AND 1,000 MILES Data from the EMD’s Fleet Utilization Scoring System (FUSS) is used to identify the number of fleet units driven less than 5,000 miles in a one-year period. Because the fleet count is constantly changing as existing units are surplused and new units are added, the data contained in this section represents a snapshot in time. Tables 19 and 20 (Apendix 1, pgs. 29-30) identify vehicles utilized less than 5,000 miles in a 1-year period for FYs 17 and 18. According to Table 19, the number of units driven less than 5,000 miles equals 800 units; units driven less than 2,500 miles equals 438; and, units driven less than 1,000 miles equals 243. Compared to FY17, vehicles driven less than 1,000 miles decreased by 1.1%; vehicles driven less than 2,500 miles decreased by 2.2%; and, vehicles driven between 2,500 and 5,000 decreased by 4.3%. Reasons vehicles are driven less than 5,000 miles in a one-year period include: 1) new units were not in service for the full year; 2) usage was based on hours instead of miles; 3) vehicles were not used due to vacancies; 4) vehicles were out of service due to mechanical deficiencies; and, 5) vehicles were underutilized. The EMD recommends that departments with under-utilized vehicles consider the following actions in order to improve fleet utilization and avoid fleet creep: 1) rotate under-utilized vehicles with high-use vehicles within their department; 2) rotate under-utilized vehicles with high-use vehicles owned by other departments; 3) surplus under-utilized vehicles without replacement; and, 4) transfer under-utilized vehicles to the EMD motor pool for multi-departmental use.

16 | P a g e
The City of Tulsa’s Utilization Management Policy requires the EMD to generate an Annual Utilization Report for vehicles and motorized equipment. This report is presented to the FMSC and identifies: a) vehicles that have been in-service a minimum of 12-months and utilized less than 2,500 miles or 20 hours per fiscal year; and, b) motorized equipment that has been in-service a minimum of 12 months and utilized less than 20 hours per fiscal year. Department representatives are required to appear before the FMSC and justify retaining these units. The FMSC will consider department justification responses and then approve one of the following actions: 1) removal from the fleet; 2) re-assignement of the unit; 3) exchange for another unit of a similar type with higher miles/hours; or, 4) exchange for a different type of unit that better suites the mission. TOTAL ANNUAL CAPITAL EXPENDITURES FOR LICENSED VEHICLES Data from the City’s financial system was used to identify expenditures for licensed vehicles (automobiles, marked Police units, vans, trucks, motorcycles, and sport utility vehicles). For FY18, vehicle expenditures in the following funds were 48.8% higher than FY17: Short-Term Capital Fund, TMUA Water & Sewer Operating Funds, Stormwater Management Enterprise Fund, and Tulsa Authority for Recovery of Energy Fund. Table 21 (Appendix 1, pg. 30) identifies FYs 17 and 18 capital expenditures for licensed vehicles. YEAR-END AVERAGE FLEET AGE M5 Fleet Management System data was used to calculate the FY18 year-end fleet age for the City’s fleet. Per M5, the average year-end age for trucks ranged from 6-16 years; and, the average year-end age for light vehicles (e.g. automobiles, marked units, SUVs and vans) ranged from 2-13 years. Table 22 (Appendix 1, pg. 31) identifies the average age of each fleet category. This table also provides examples of makes and models in each category. In Charts 16 and 17, the blue line represents the average age for each fleet category, and the red line depicts the life expectancy. Where the blue line extends above the red line is indicative of aging fleet kept beyond the recommended replacement timeframes. Fleet dependability suffers when units are not replaced at appropriate intervals. Keeping vehicles beyond recommended replacement timeframes leads to a higher frequency of vehicle breakdowns, higher maintenance and parts costs, and increased downtime. Since FY15, parts costs have risen 45% and outside vehicle and equipment repairs have increased by nearly 30%. This is attributed to vehicles and equipment being retained for longer periods of time.
Chart 16 – FY18 Year-End Fleet Age (Light Fleet)
Chart 17 – FY18 Year-End Fleet Age (Trucks)

17 | P a g e
The replacement timeframes for each category are published in the Finance Department’s 2012 Equipment Study. The EMD developed the Fleet Utilization Scoring System (FUSS) to help set annual replacement priorities for each department. The current FUSS identifies 394 units for replacement. Timely replacement of these units will help ensure the average fleet age does not exceed the life expectancy timeframes. OPERATIONAL DOWNTIME Dowtime refers to the period of time when a vehicle or piece of equipment is unavailable for normal use. This may be due to factors such as planned or unplanned maintenance. Charts 18 and 19 depict the FYs 17 and 18 average downtime statistics for City vehicles. These statistics reflect the average number of days a unit is out of service due to maintenance and repairs. Downtime has an impact on revenue, reputation and fleet management costs. By concentrating on controllable factors to downtime, costly periods of interrupted service can be measured, prevented and managed. Strategies for reducing downtime include: 1) Regular servicing, maintenance and repair.
A regularly serviced vehicle that is maintained and repaired to a high standard is less likely to breakdown and cause problems. When possible, vehicle servicing and essential maintenance can be completed after-hours to reduce downtime.
2) Departments should replace older vehicles that incur exorbitant maintenance and repairs. New vehicles are less likely to breakdown and arrive with a warranty.
3) Equipment Management will continue to work with departments to prioritize the order in which vehicles/equipment should be serviced.
4) Equipment Management will work with departments to develop preventive maintenance schedules that maximize the number of vehicles on the road without extending the periods between services.
Chart 18 – Average Downtime (by Category)
Chart 19 – Average Downtime (by Shop)
Planned preventive maintenance helps limit the number of breakdowns by ensuring vehicle parts are replaced at correct intervals, minimizing extensive wear and tear.
5) According to Bob Stanton of Stanton Consulting, much of the downtime a fleet experiences during maintenance and repair events is not related to actual wrench turning. Inefficiencies in the maintenance and repair process have ramifications throughout the entire fleet operation. From accounting to administration

18 | P a g e
and dispatch to operations, every facet of a fleet’s operation feels the pinch when the maintenance and repair process is not as efficient as possible. Equipment Management will continue to audit its maintenance and repair processes to correct inefficiencies that contribute to higher downtime.
Tables 23 and 24 (Appendix 1, pg. 32) provide FY18 downtime statistics by class and shop. FLEET MANAGEMENT STEERING COMMITTEE The Fleet Management Steering Committee (FMSC) includes representatives from 11 departments. The FMSC determines policy and provides oversight for all aspects of specifying, purchasing, assigning to departments, re-assigning between departments and retiring vehicles for the City. To avoid fleet creep, departments must surplus one unit for every new unit that is purchased and introduced into the fleet. FMSC has resulted in sharing under-utilized equipment/vehicles previously purchased; asking difficult questions of peers; reviewing all requests for repurposing; and, collaborating to save the City money. During FY18, the FMSC reviewed 170 Fleet Justification Forms (FJF): 164 were approved; and 6 were tabled or pulled (see Chart 20). Departments are required to answer the following questions on the FJF: 1) explain why a dedicated or bi-fuel vehicle
Chart 20 – FY17 Fleet Justification Forms
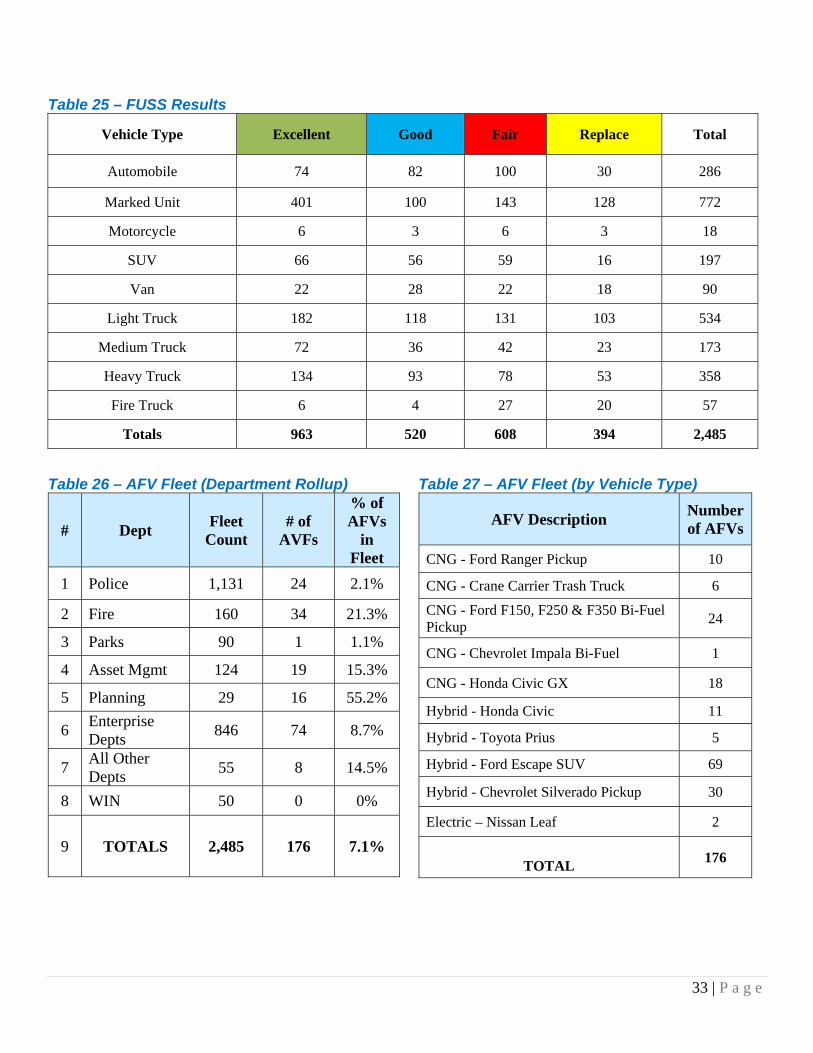
cannot be used for this application; 2) can you reduce the size and weight of your current vehicle by specifying a smaller, lighter vehicle, for improved MPGs, and reduced operating costs; and, 3) how will you ensure the requested vehicle has a fuel efficiency rating better than the vehicle being replaced. FLEET UTILIZATION SCORING SYSTEM (FUSS) The EMD developed the FUSS to help set replacement priorities and ensure the most deserving City vehicles are replaced with the level of available funding. Table 25 (Appendix 1, pg. 33) provides detailed FUSS findings for FY19. In July 2018, the FUSS was updated and distributed to departments. The FUSS recommended replacement quantities based on seven criterion: 1) Age; 2) Life-to-Date (LTD) Mileage or LTD Hours; 3) Reliability; 4) LTD Maintenance and Repair Costs; 5) LTD Downtime; 6) Vehicle Condition; and, 7) Use. The data used to determine FUSS recommended replacement quantities is obtained from the M5 Fleet Management System. The current FUSS provides recommended replacement quantities for 2,485 vehicles purchased from approximately 25 different funds. The FUSS scores each vehicle based on the seven criteria mentioned above. The maximum total score a vehicle can obtain is 35 points. Vehicles scoring between 28 to 35 points are rated, “Needs Immediate Consideration for Replacement.” Previous FUSS versions included scoring categories for “Fuel Consumption” and “Miles per Gallon.” These categories were removed and replaced with “Vehicle Condition” and “Use.” The new EMD policy is to
19 | P a g e
annually inspect all vehicles and assign a Vehicle Condition Score based on criterion from the National Auto Auction Association (NAAA). Units that score a 1 in the Vehicle Condition category represent vehicles in the best condition, and units that score a 5 represent vehicles in the worst condition. Scoring criteria for the “Use” category is as follows: administrative vehicles receive a score of 1, light and medium trucks receive a score of 2, and public safety vehicles and heavy trucks receive a score of 3. ALTERNATIVE FUELED VEHICLES (AFVs) For FY18, 7.1% of the City’s on-road fleet consisted of AFVs. The department with the largest percentage of AFVs was Planning and Development at 55.2%. Table 26 (Appendix 1, pg. 33) identifies the number of AFVs in each department. Because AFVs are fuel efficient and good for the environment, departments should consider replacing eligible fleet units with AFVs. Per the City of Tulsa Revised Ordinances (TRO), Title 12, Chapter 1, Section 102, “Before the acquisition of any vehicle, consideration of need, use, vehicle size and efficiency shall be carefully examined. In all cases, replacement vehicles shall have a fuel efficiency rating equal to or better than the vehicle being replaced. Prior to the acquisition of vehicles, serious consideration must be given to AFVs and hybrid vehicles.” The City’s AFV fleet is comprised of 59 CNG vehicles, 115 Hybrid vehicles, and 2 electric vehicles. The total number of AFVs in the City’s fleet is 176. Tables 27 and 28 (Appendix 1, pgs. 33-34) provide detailed AFV data. The City has approximately 400 flex fuel vehicles. During FY18, these vehicles were fueled with E10 gas instead of flex fuel (E85). During FY19, the EMD will determine the viability and efficiency of purchasing flex fuel (E85) for these units. Lastly, City departments are replacing older diesel vehicles with cleaner-burning diesel vehicles that require Diesel Exhaust Fluid (DEF). The EMD purchases and stores DEF for these vehicles. ALTERNATIVE FUELS INFRASTRUCTURE AND PRODUCTS In August 2012, the EMD opened two new CNG stations. One of the new stations is a CNG time-fill fueling station to fuel City green waste collection trucks, and the other is a public-only CNG fast-fill fueling station. A fourth public-private CNG station opened in July 2017 near 33rd and Memorial. During 2018, the City’s CNG stations displaced 46,000 petroleum gallons (21,000 GGEs from City vehicles and 25,000 GGEs from public vehicles) and reduced harmful carbon dioxide (CO2) emissions in Tulsa’s airshed by approximately 116 tons. For 2019, the City's four CNG stations (3 opened prior to 2013 and 1 opened in 2017) are expected to dispense over 50,000 GGEs of CNG. During FY18, the City used approximately 20,000 gallons of propane to fuel generators and small off-road equipment (e.g. forklifts, hotboxes). The EMD collaborated with the Tulsa Parking Authority to install Electric Vehicle (EV) charging stations in five downtown parking garages. During FY19, the City will utilize grant funding to install Electric Vehicle (EV) charging stations in Tulsa. The EV stations will be available for City and public use. The EMD will also ask departments to consider replacing administrative vehicles (meeting the replacement criteria) with electric vehicles. During the past seven years, the EMD has obtained five grants and two donations totaling nearly $500,000 for alternative fueled vehicles and infrastructure. We research and annually apply for federal, state, and local grants. EMD's goals are: 1) identify and apply for at least one state or federal grant each year (related to alternative fuels infrastructure and vehicles); 2) obtain a minimum of one state or federal grant award per year; 3) achieve 100% project compliance in accordance with the grant requirements; and, 4) provide accurate plans, progress reports, and projected results within established time frames.
20 | P a g e
CONCLUSION Customer Service was the cornerstone for changes made at EMD throughout the fiscal year. EMD authored the Interdepartmental Customer Protocol (ICP) which was approved by the Mayor’s Office on June 24, 2015. The ICP is a working document that reflects priorities of the EMD and City departments. The ICP reflects values that support superior customer service and quantifiable performance standards. The purpose of the ICP is to hold EMD accountable for the effectiveness, efficiency and competitiveness of its service. Tools to improve customer service include EMD’s Internet-based Service Board, Fleet Utilization Scoring System (FUSS), Quick Response (QR) Codes, and Website. The on-line Service Board allows customers to obtain “Real-Time” information about the status of their vehicle repairs. Customers access the Service Board at https://www.cityoftulsa.org/government/departments/human-resources/employees/emd-status-board/ The Service Board identifies completed work, pending work, and the status of work being performed. The Fleet Utilization Scoring System (FUSS) and FUSS Calculator have been updated to help customers determine which vehicles to replace. Signs with Quick Response (QR) Codes are posted at each shop for customers to provide input about EMD services via a smart phone. The EMD website communicates our initiatives, best practices and accomplishments (www.cityoftulsa.org/EMD). The website is also used to recruit technicians. The Government Fleet Management Alliance (GFMA) and the Coalition for Green Fleet Management (CGFM) awarded EMD the Fleet Masters Operation Award. To earn this award, the EMD achieved Certified Fleet Management Operation (CFMO) status and attained CLEANFleet certification. The Fleet Masters award recognizes fleet operations that are considered to be exceptional in their industry. Tulsa is one of only seven fleets to receive this award (Anaheim CA, Boise ID, Dublin OH, Mesa AZ, Portland OR, San Bernardino CA, and Tulsa OK). The CFMO certification process helped EMD improve its effectiveness, competitiveness and efficiency. At the core of the certification were eight foundation categories: 1) staffing and productivity; 2) company and employee goals, mission statement and business plan; 3) parts inventory management; 4) replacement policy and financial program; 5) fleet utilization management; 6) fleet policy and procedures documentation; 7) preventive maintenance program; and, 8) customer service and level of support. The CLEANFleet certification process helped EMD develop standards for clean fleet management. For FY19, the EMD will continue to place a greater emphasis on training. Technicians are required to obtain four hours training per month using the Ford Standardized Training and Resource System (STARS) or the International On-Command Navistar Learning Management System. We plan to engage in succession planning and cross-training to identify and train internal employees to fill key positions. The EMD will continue to be on the leading edge of industry standards and strive to be a benchmark operation. We will endeavor to improve our tracking and reporting of internal benchmarks. These benchmarks will include measurement of comeback rates, staffing levels, PM compliance rates, scheduled repair rates, average repair turnaround times, and vehicle utilization metrics. Please contact EMD staff for questions and concerns about the fleet. Appendix 2 (pg. 33) provides a listing of EMD contacts with their telephone numbers and email addresses. A major challenge we must address in FY19 is EMD’s ability to hire and retain technicians and body shop personnel. Recently, several experienced and tenured technicians have left our organization to work for private companies and dealerships. Additionally, we have been unable to timely fill vacancies because our pay structure is not competitive with the local market. To enhance our competitiveness, we will work with the Human Resources Department to increase pay for existing positions and starting pay for new hires. Once this occurs, EMD will increase its maintenance and body shop labor rates to cover pay increases.

21 | P a g e
Other initiatives that will be considered during FY19 include: 1) Pursue vehicle leases between the Water and Sewer Department and General Fund Departments to
reduce capital costs and narrow replacement timeframes. 2) Improve the accuracy of fleet data in EMD’s M5 Fleet Management System. 3) Create and utilize M5 dashboards to improve data transparency and decision making. 4) Adjust job descriptions for all EMD employees so 100% of staff can obtain pay increases for obtaining
and maintaining professional certifications. 5) Collaborate with the Water and Sewer Department to determine the feasibility of replacing EMD’s
current fleet software system (M5 AssetWorks) with Lucity. Lucity is a work order system used by other City departments.
6) Eliminate redundancies and reduce costs by consolidating 4 shops to 1. $7-$14 million has been requested to purchase and refurbish an existing facility.
7) Pursue cooperative procurement with the Oklahoma Public Fleet Management Association (OPFMA) to buy goods and services at the lowest cost.
8) Change from in-house to on-line fleet auctions to increase returns and get units immediately off the lot. 9) Install GPS devices on fleet units to improve collection of odometer readings, reduce idling and engine
speeds, help track units, and optimize routes. 10) Shop equipment and diagnostic tools – improve issuance, tracking, and inventory control. 11) Automate parts issuance and parts availability tracking. 12) Create a mobile APP so departments can use their mobile devices to access EMD’s on-line service board
and obtain pertinent fleet information. 13) Consider purchasing renewable diesel (a cleaner burning fuel) for the City’s heavy truck fleet. 14) Complete Government Fleet Management Alliance (GFMA) and Coalition for Green Fleet Management
(CGFM) requirements to recertify EMD as a CLEANFleet. Recertification is required every 3 years.

22 | P a g e
APPEND//IX 1: TABLES Table 1 – EMD Positions, Vacancies, and Major Tasks
Positions Number
of Positions
Average Vacancies
Per Month
FY18 Major Tasks
Mechanic and Automotive Servicer
46 4.08 Worked 65,199 hours to maintain and repair the City’s fleet equipment
Autobody Repairer 6 0.33 Worked 8,119 hours to modify equipment and repair vehicles damaged in
collisions
Fuel & Wash Facility Personnel
4 0 Procured, Stored, and Dispensed 2.13 million gallons of fuel; maintained
7 fuel facilities and 6 car and truck wash facilities
Parts Personnel 8 0.25 Procured and issued 193,163 fleet parts from 4 storerooms
Management and Administrative Personnel
17 1.50 Directed department and division activities; and, provided accounting,
payroll, administrative, and fleet management support
TOTALS 81 6.16
Table 2 – Number of Vehicle Repairs (by Class and Shop)
Class Police Garage
Fire Garage
Fire Garage Service Truck
Body Shop
West 23rd Street Heavy Garage
56th & Garnett Heavy Garage
Total # of Repairs
Automobile 1,178 4 1 120 139 18 1,460
Marked Unit 5,488 6 0 463 0 0 5,957
Light Truck 1,349 154 49 170 1,671 610 4,003
Medium Truck 10 164 107 33 1,449 517 2,280
Heavy Truck 0 719 1,461 62 4,631 2,563 9,436
Fire Truck 0 650 1,014 18 3 0 1,685
SUV 1,058 24 17 112 92 13 1,316
Van 276 17 0 37 275 162 767
Motorcycle 649 0 0 0 0 0 649
Number of Vehicle Repairs
10,008 1,738 2,649 1,015 8,260 3,883 27,553

23 | P a g e
Table 3 – Number of Equipment Repairs (by Class and Shop)
Class Police Garage
Fire Garage
Fire Garage Service Truck
Body Shop
West 23rd Street Heavy Garage
56th & Garnett Heavy Garage
Total # of Repairs
Generator 2 1 1 0 10 22 36
Heavy Equip 2 37 1 4 776 766 1,586
Trailer 65 22 9 13 583 365 1,057
Pump 0 0 0 0 38 85 123
Mower 0 0 0 0 14 37 51
Tractor 0 0 0 0 36 38 74
Compressor 0 0 0 0 79 69 148
Miscellaneous 17 26 4 4 262 268 581
Number of Equipment Repairs
86 86 15 21 1,798 1,650 3,656
Table 4 – FY18 Department Billings
Department / Agency
Labor Billing
Parts Billing
Outside Repairs Billing
Fuel Billing
Car Wash Billing
Motor Pool
Billing Credits
Total Billing
Convention Center
$4,105 $3,579 $884 $11,151 $324 $0 $0 $20,043
Engineering $55,414 $49,887 $16,322 $79,920 $2,952 $780 -$8,871 $196,404 Finance $27,431 $7,397 $14,536 $5,595 $468 $6,660 $0 $62,087 Fire $816,465 $962,542 $256,374 $381,860 $6,660 $0 $0 $2,423,901 Human Resources
$5,422 $4,856 $235 $2,787 $252 $80 $0 $13,632
Information Technology
$20,155 $8,975 $4,047 $12,670 $828 $660 $0 $47,335
Agencies $4,973 $1,722 $119 $59,868 $792 $0 $0 $67,474 Parks $98,679 $94,839 $21,097 $96,341 $4,032 $0 $0 $314,988 Planning $21,298 $21,283 $3,433 $24,389 $1,152 $80 $0 $71,635 Police $861,188 $911,769 $134,170 $1,664,138 $40,536 $0 -$36,883 $3,574,918 Streets & Stormwater
$931,883 $1,128,490 $438,700 $676,821 $14,400 $0 $0 $3,190,294
Water & Sewer $957,343 $993,073 $425,360 $974,967 $22,284 $220 -$1,263 $3,371,984 WIN $39,874 $27,385 $3,871 $45,074 $1,836 $40 $0 $118,080
Asset Mgmt. $89,875 $71,761 $25,077 $95,234 $3,384 $0 $0 $285,331
Small Departments
$972 $1,155 $513 $691 $108 $2,020 $0 $5,459
TOTALS $3,935,077 $4,288,713 $1,344,738 $4,131,506 $100,008 $10,540 -$47,017 $13,763,565
24 | P a g e
Table 5 – Rate Comparison
FY EMD Rate
Vendor Light Rate
Vender Heavy Rate
2010 $48 $92 $92
2011 $49 $92 $92
2012 $51 $92 $92
2013 $51 $92 $92
2014 $51 $105 $103
2015 $51 $110 $107
2016 $55 $113 $114
2017 $55 $117 $118
2018 $55 $122 $124
Table 6 – FY18 Outsourced Work
# Outsourced Work $-Amount of
Outside Repairs
1 Passenger Vehicle Repairs $195,000
2 Light Truck Repairs $83,000
3 Medium Truck Repairs $233,000
4 Heavy Truck Repairs $400,000
5 Off Road Equipment Repairs
$277,000
6 Automotive Glass Repairs $43,000
7 Trailers & Misc. Equip Repairs
$61,000
8 Totals $1,406,000
Table 7 – Three Levels of PMs
PM-A (Performed by Vendor)
PM-B (Performed by EMD)
PM-C (Performed by EMD)
Change Oil and Filter Lube Chassis Ensure Proper Tire Pressure Check/Fill Transmission Fluid Check/Fill Differential Fluid Check/Fill Windshield Washer
Fluid Check/Fill Power Steering Fluid Check/Fill Antifreeze/Coolant Check/Fill Battery Inspect Belts and Hoses Check Air Filter Vacuum Interior (Outside
Vendor Only) Wash Exterior Windows
(Outside Vendor Only)
Change Oil and Filter Lube Chassis Ensure Proper Tire Pressure Check/Fill Transmission Fluid Check/Fill Differential Fluid Check/Fill Windshield Washer
Fluid Check/Fill Power Steering Fluid Check/Fill Antifreeze/Coolant Check/Fill Battery Inspect Belts and Hoses Replace Cabin Air Filter Check/Replace Air Filter
Replace Fuel Filter, if applicable Inspect Brakes & Pads Inspect and Lube Control Arms,
Steering Linkages, Ball/U Joints, and Driveshaft's
Change Oil and Filter Lube Chassis Ensure Proper Tire Pressure Check/Fill Transmission Fluid Check/Fill Differential Fluid Check/Fill Windshield Washer
Fluid Check/Fill Power Steering Fluid Check/Fill Antifreeze/Coolant Check/Fill Battery Inspect Belts and Hoses Replace Cabin Air Filter Check/Replace Air Filter Replace Fuel Filter, if applicable Inspect Brakes & Pads
Inspect and Lube Control Arms, Steering Linkages, Ball/U Joints, and Driveshaft's
Inspect and Rotate Tires Flush Automatic Transmission Fluid
Replace Wheel Bearing Grease, and grease seals
Replace Spark Plugs
25 | P a g e
Table 8 – Key Performance Indicators
# KPI OBJECTIVE GOAL FY 16 achieved
FY 17 achieved
FY 18 achieved
1 Meet or Exceed Industry Standards of 93% for Designated Fleet Availability
Be responsive to and accountable for meeting our customers’ fleet
mission requirements 93.2% 93.1% 93.1%
2 Maintain a 15% ratio of CNG
Certifications to EMD Technicians
Provide highly-trained and certified personnel to deliver the City’s consolidated fleet services
in a safe work environment
19% 16% 16%
3 75% of EMD Technicians will obtain at
least one ASE, EVT, or Ford certification Same as above New New 72%
4 Meet or Exceed Industry Standards of 70% for Maintenance Direct Labor
Provide quality fleet services efficiently and economically
71.88% 72.01% 69.8%
5 Meet or Exceed Industry Standards of
70% for Body Shop Direct Labor Provide quality fleet services efficiently and economically
73.63% 69.75% 72.2%
6 Meet or Exceed Industry Standards of +/-
3% for Parts Variance Provide quality fleet services efficiently and economically
0.62% -1.23% -0.25%
7 Meet or Exceed Industry Standards of 4
Parts Annual Inventory Turns Provide quality fleet services efficiently and economically
5.69 5.55 5.13
8 85% of the time, fleet parts are issued to the Requestor within the first 15 minutes
of the request
Provide quality fleet services efficiently and economically
84% 78% 88%
9 Meet or Exceed Industry Standards of +/-
1% for Fuel Variance Provide quality fleet services efficiently and economically
0.25% 0.11% -0.12%
10 Meet or Exceed Industry Standards of 98% for Designated Fuel Availability
Provide quality fleet services efficiently and economically
99.9% 99.9% 99.9%
11 Meet or Exceed Industry Standards of 95% for Designated Car/Truck Wash
Availability
Provide quality fleet services efficiently and economically
97.2% 97.5% 93.1%

26 | P a g e
Table 9 – Four-Year Comparison of Fuel Costs ($’s)
# Department FY15 FY16 FY17 FY18 4-Year
Average 1 Police $1,989,592 $1,382,750 $1,412,443 $1,664,138 $1,612,2312 Fire $404,390 $271,420 $214,980 $381,860 $318,1633 Enterprise Dpts (Fund 1080) $321,198 $174,228 $185,631 $252,137 $233,2994 Enterprise Depts (Fund 3623) $194,803 $108,295 $118,268 $136,633 $139,5005 Enterprise Depts (Fund 7010) $369,125 $271,939 $289,317 $318,937 $312,3306 Enterprise Depts (Fund 7020) $764,586 $462,956 $489,120 $595,664 $578,0827 Enterprise Depts (Fund 7030) $475,047 $342,361 $371,138 $428,337 $404,2218 All Other Departments $461,653 $336,629 $338,346 $384,990 $380,4059 TOTALS $4,980,394 $3,350,578 $3,419,243 $4,162,696 $3,978,231
Table 10 – Four-Year Comparison of Fuel Consumption (gallons)
# Department FY15 FY16 FY17 FY18 % Increase or Decrease
1 Police 936,242 903,287 891,651 894,908 -0.4%2 Fire 171,931 174,392 171,606 186,152 +8.5%3 Enterprise Departments (Fund 1080) 140,773 112,193 111,307 124,675 +12.0%4 Enterprise Departments (Fund 3623) 116,550 75,301 75,437 72,404 -4.0%5 Enterprise Departments (Fund 7010) 156,216 171,048 168,248 153,939 -8.5%6 Enterprise Departments (Fund 7020) 327,142 296,231 290,071 292,249 +0.8%7 Enterprise Departments (Fund 7030) 203,793 220,584 220,668 210,952 -4.4%8 All Other Departments 209,539 220,039 210,099 202,421 -3.7%9 TOTALS 2,262,186 2,173,075 2,139,087 2,137,700 -0.06%
Table 11 – Strategies to Reduce Fuel Consumption and Costs
# Strategy Description
1 Slow Down!
Speeding, rapid acceleration, and rapid braking all waste gas and cut down mileage potential by as much as 33 percent at highway speeds, according to the U.S. Department of Energy (DOE). End sudden, jack-rabbit starts, opting instead for slow acceleration. Keep in mind that speeding wastes gas and money. Each mile per hour driven over 60 mph is like paying an extra 10 cents per gallon according to DOE.
2 Don’t Idle When your car is idling in traffic or warming up, it gets 0 miles per gallon. Even sitting still for 60 seconds uses more gas than shutting off the engine and restarting it.
3 Keep Tires Properly Inflated
Under-inflated tires results in vehicles using more fuel than necessary, and causes tires to wear incorrectly. Over-inflated tires also wear incorrectly and can increase blowouts.
4 Lighten Up! Check your trunk for unnecessary weight. Just carrying around an extra 100 pounds can raise your gasoline use 1%.
5 Reduce the Number of Trips
When running errands, have a plan. Map out your stops and use a logical route. Being organized can save you big time on fuel costs not to mention the mileage on your car's odometer.
6 Use AFV’s and Fuel Efficient Vehicles
When possible, use Alternative Fueled Vehicles (AFVs) and vehicles that achieve the greatest miles per gallon (AFVs include CNG and hybrid powered units). CNG fuel is typically $2 per gallon cheaper than traditional fuels.
7 Right Typing Reduce the size and weight of your current vehicle, by specifying a smaller, lighter vehicle, for improved MPGs and reduced operating costs.
8 Route Planning Employ route planning as a way of limiting the daily mileage of fleet vehicles while reducing total vehicles on the road.

27 | P a g e
Table 12 – FY17 Fleet Count for each Department
# Fleet Type Police Fire Enterprise
Depts Parks WIN Planning AMD
All Other Depts
TOTALS
1 Automobile 170 20 32 2 13 2 29 14 282 2 Light Truck 64 27 302 49 34 14 33 18 541
3 Medium Truck
3 18 122 16 0 0 13 2 174
4 Heavy Truck
5 15 309 14 0 0 12 3 358
5 Motorcycle 26 0 0 0 0 0 0 0 26 6 Van 21 12 29 6 2 0 18 10 98 7 SUV 80 14 68 0 3 13 16 10 204 8 Fire Truck 0 57 0 0 0 0 0 0 57 9 Marked Unit 753 0 0 0 0 0 0 0 753
10 TOTALS 1,122 163 862 87 52 29 121 57 2,493 Table 13 – FY18 Fleet Count for each Department
# Fleet Type Police Fire Enterprise
Depts Parks WIN Planning AMD
All Other Depts
TOTALS
1 Automobile 181 20 29 2 13 2 27 15 289 2 Light Truck 64 27 295 51 32 13 34 18 534
3 Medium Truck
3 19 120 16 0 0 13 2 173
4 Heavy Truck
5 15 309 14 0 0 12 2 358
5 Motorcycle 18 0 0 0 0 0 0 0 18 6 Van 20 9 27 6 1 0 20 7 90 7 SUV 78 13 66 1 4 14 18 10 204 8 Fire Truck 0 57 0 0 0 0 0 0 57 9 Marked Unit 762 0 0 0 0 0 0 0 762
10 TOTALS 1,131 160 846 90 50 29 124 55 2,485
Table 14 – Fleet Count by Vehicle Type (FY18 versus FY17)
# Fleet Type FY17 FY18 Difference %
Increase or Decrease
1 Automobile 282 289 +7 +2.5% 2 Light Truck 541 534 -7 -1.3% 3 Medium Truck 174 173 -1 -0.6% 4 Heavy Truck 358 358 0 N/A 5 Motorcycle 26 18 -8 -30.8% 6 Van 98 90 -8 -8.2% 7 SUV 204 204 0 N/A 8 Fire Truck 57 57 0 N/A 9 Marked Unit 753 762 +9 +1.2%
10 TOTALS 2,493 2,485 -8 -0.3%

28 | P a g e
Table 15 – Fleet Count by Department (FY18 versus FY17)
# Department FY17 FY18 Difference %
Increase or Decrease
1 Police 1,122 1,131 +9 +0.8%
2 Enterprise Departments 862 846 -16 -1.9%
3 Fire 163 160 -3 -1.8%
4 Parks 87 90 +3 +3.4%
5 WIN 52 50 -2 -3.8%
6 Planning & Economic Development 29 29 0 N/A
7 Asset Management 121 124 +3 +2.5%
8 All Other Departments 57 55 -2 -3.5%
9 TOTALS 2,493 2,485 -8 -0.3%
Table 16 – Miles Driven by City’s On-Road Fleet
FY Miles
Driven
Quantity Increase or
Decrease Compared to Previous Fiscal Year
Percent Increase or
Decrease Compared to Previous Fiscal Year
FY14 20,175,507 ‐150,455 ‐0.7%
FY15 20,582,856 +407,349 +2.0%
FY16 20,549,529 ‐33,327 ‐0.2%
FY17 20,567,425 +17,896 +0.1%
FY18 20,103,285 ‐464,140 ‐2.3%
Table 17 – Miles Driven by Department (FY18 versus FY17)
# Department FY17 Miles
Driven FY18 Miles
Driven Difference
% Increase or Decrease
1 Police 10,992,263 10,915,905 -76,358 -0.7%
2 Enterprise Departments 5,939,653 5,962,254 +22,601 +0.4%
3 Fire 1,380,057 1,276,859 -103,198 -7.5%
4 Parks 595,632 469,612 -126,020 -21.2%
5 WIN 341,422 302,757 -38,665 -11.3%
6 Planning & Economic Development 251,708 238,265 -13,443 -5.3%
7 Asset Management 763,384 768,404 +5,020 +0.7%
8 All Other Departments 303,306 169,229 -134,077 -44.2%
9 TOTALS 20,567,425 20,103,285 -464,140 -2.3%

29 | P a g e
Table 18 – Ratio of Vehicles to Employees
# Dept. FY17 Fleet Size
FY18 Fleet Size
FY17 # of
Positions
FY18 # of
Positions
Diff # of
PositionsFY18
-v- FY17
FY17 Ratio of Vehicles
to Positions
FY18 Ratio of Vehicles
to Positions
Diff. Ratio FY18
-v- FY17
% Increase
or Decrease
1 Police 1,122 1,131 1,009 1,048 +39 1.112 1.079 -.033 -2.7%
2 Enterprise Departments
862 846 1,129 1,159 +30 .764 .730 -.034 -3.9%
3 Fire 163 160 715 735 +20 .228 .218 -.01 -4.3% 4 Parks 87 90 170 168 -2 .511 .536 +.025 +5.9% 5 WIN 52 50 69 69 0 .754 .725 -.029 +2.7% 6 Planning 29 29 79 79 0 .367 .367 0 N/A
7 AMD 121 124 136 136 0 .890 .912 +.022 +2.2%
8 All Other Departments
57 55 528 525 -3 .108 .105 -.003 N/A
9 TOTALS 2,493 2,485 3,835 3,919 +84 .650 .634 -.016 -2.5%
Table 19 – FY18 Fleet Units Driven Less than 5,000/2,500/1,000 Miles
# Department Units Driven
Less than 1,000 Miles
Units Driven Less than 2,500
Miles
Units Driven Less than 5,000
Miles
1 Police 86 139 221
2 Enterprise Departments
78 172 353
3 Fire 21 31 53
4 Parks 18 25 46 5 WIN 9 17 25 6 Planning 1 3 6
7 AMD 20 32 62
8 All Other Departments
10 19 34
9 TOTALS 243 438 800 10
11 Percent of fleet driven less than 1,000/2,500/5,000
9.8% 17.6% 32.2%

30 | P a g e
Table 20 – FY17 Fleet Units Driven Less than 5,000/2,500/1,000 Miles
# Department Units Driven
Less than 1,000 Miles
Units Driven Less than 2,500
Miles
Units Driven Less than 5,000
Miles
1 Police 119 209 334
2 Enterprise Departments
82 160 347
3 Fire 23 32 57
4 Parks 17 24 48
5 WIN 11 16 28
6 Planning 0 0 3
7 AMD 13 29 57
8 All Other Departments
7 23 37
9 TOTALS 272 493 911
10
11 Percent of fleet driven less than 1,000/2,500/5,000
10.9% 19.8% 36.5%
Table 21 – Capital Expenditures for Vehicles
# Dept.
FY17 Capital
Expenditure for Vehicles
FY18 Capital
Expenditure for Vehicles
$ Increase or Decrease
% Increase or Decrease
1 Police $2,817,865 $2,839,847 +$21,982 +0.8%
2 Enterprise
Departments $3,416,336 $6,950,110 +$3,533,774 +103.4%
3 Fire $100,183 $186,816 +$86,633 +86.5%
4 Parks $112,016 $61,205 -$50,811 -45.4%
5 WIN $240,691 $135,391 -$105,300 -43.7%
6 Planning $0 $1,334 +$1,334 N/A
7 AMD $268,125 $200,757 -$67,368 -25.1%
8 All Other
Departments $41,045 $34,462 -$6,583 -16.0%
9 TOTALS $6,996,261 $10,409,922 +$3,413,661 +48.8%

31 | P a g e
Table 22 – FY18 Year-End Average Fleet Age in Years
# Fleet
Category Average
Age Life
Expectancy Examples of Vehicles in this Class
1 Automobile 9.8 yrs 7 yrs Chevrolet Cavalier, Chevrolet Impala, Dodge Intrepid, Ford Contour, Ford Crown Victoria, Nissan Leaf
2 Class 1 Light Truck 8.2 yrs 8 yrs Dodge Dakota, Toyota Tacoma, Ford F150, Ford Ranger
3 Class 2 Light Truck 8.2 yrs 8 yrs Chevrolet Silverado, Dodge Ram 2500, Ford F250, Toyota Tundra
4 Class 3 Medium Truck 9.6 yrs 9 yrs Ford F350, Freightliner Sprinter
5 Class 4 Medium Truck 14.6 yrs 9 yrs Ford F450
6 Class 5 Medium Truck 6.3 yrs 9 yrs Ford F550, Freightliner M Line Walk-In Van, International 4700
7 Class 6 Light Heavy Truck 15.5 yrs 10 yrs Chevrolet C6000, Ford CF7000, Freightliner F160, International 4300
8 Class 7 Heavy Truck 11.8 yrs 10 yrs Ford F750, International 4900, Isuzu FTR-FVR, Kenworth T370, Nissan UD3300, Sterling Acterra
9 Class 8 Heavy Truck 8.9 yrs 12 yrs Crane Carrier, Chevrolet ME6500, Freightliner 114SD, International 2554 and 7500, Mack 700, Peterbilt 337, Sterling 8500
10 Fire Apparatus (Engine) 15.6 yrs 10 yrs Fire Pumper Truck
11 Fire Apparatus (Ladder) 11.8 yrs 15 yrs Fire Ladder Truck
12 Fire Apparatus (Rescue) 16.1 yrs 10 yrs Fire Rescue Truck
13 Marked Police Car 6.0 yrs 6 yrs Chevrolet Impala, Dodge Charger, Ford Crown Victoria, Ford Taurus
14 Marked Police SUV 2.2 yrs 6 yrs Ford Explorer
15 Light SUV 8.0 yrs 8 yrs Chevrolet Blazer, Chevrolet Suburban C1500, Chevrolet Tahoe, Ford Bronco, Ford Escape
16 Medium SUV 6.2 yrs 8 yrs Chevrolet Suburban C2500, Chevrolet Traverse
17 Light Van 12.7 yrs 8 yrs Chevrolet Astro, Dodge Caravan, Ford Aerostar, Ford Club Wagon, Ford E150, Ford Freestar, Ford Windstar
18 Medium Van 13.3 yrs 8 yrs Ford E250 and E350
19 Heavy Van 7.1 yrs 9 yrs Ford E450
20 Motorcycle 4.1 yrs 2 yrs Harley Davidson

32 | P a g e
Table 23 – FY18 Vehicle Downtime by Class and Shop (expressed in days)
Class Police
Garage Fire
Garage
Fire Garage Service Truck
Body Shop
West 23rd Street Heavy Garage
56th & Garnett Heavy Garage
Avg. Class
Downtime
Automobile 3.19 0.44 0.71 5.17 5.12 1.80 3.59
Marked Unit 2.05 0.03 0.00 5.18 0.00 0.00 2.49
Light Truck 3.75 1.42 0.70 6.18 4.97 4.19 4.31
Medium Truck 3.65 3.37 0.93 4.43 9.27 5.91 6.86
Heavy Truck 0.00 3.56 1.45 7.17 7.23 5.46 5.43
Fire Truck 0.00 4.67 1.43 2.33 0.20 0.00 2.61
SUV 3.46 1.84 4.08 4.00 1.79 2.80 3.36
Van 3.03 2.97 0.00 8.51 8.47 3.86 5.30
Motorcycle 3.18 0.00 0.00 0.00 0.00 0.00 3.18
Avg. Shop Downtime 2.66 3.52 1.41 5.38 6.89 5.16 4.21 Table 24 – FY18 Equipment Downtime by Class and Shop (expressed in days)
Class Police
Garage Fire
Garage
Fire Garage Service Truck
Body Shop
West 23rd Street Heavy Garage
56th & Garnett Heavy Garage
Avg. Class
Downtime
Generator 7.68 8.62 2.91 0.00 9.96 7.49 7.93
Heavy Equip 4.03 13.33 0.00 11.68 9.32 8.70 9.09
Trailer 6.54 3.40 15.98 4.74 7.76 6.61 7.19
Pump 0.00 0.00 0.00 0.00 4.87 8.69 7.44
Mower 0.00 0.00 0.00 0.00 4.36 6.21 5.64
Tractor 0.00 0.00 0.00 0.00 4.51 9.31 6.97
Compressor 0.00 0.00 0.00 0.00 9.65 6.30 7.90
Miscellaneous 12.01 4.76 7.73 0.56 20.29 5.16 11.31
Avg. Shop Downtime 7.97 7.13 8.22 5.35 10.15 7.38 8.70
33 | P a g e
Table 25 – FUSS Results
Vehicle Type Excellent Good Fair Replace Total
Automobile 74 82 100 30 286
Marked Unit 401 100 143 128 772
Motorcycle 6 3 6 3 18
SUV 66 56 59 16 197
Van 22 28 22 18 90
Light Truck 182 118 131 103 534
Medium Truck 72 36 42 23 173
Heavy Truck 134 93 78 53 358
Fire Truck 6 4 27 20 57
Totals 963 520 608 394 2,485
Table 26 – AFV Fleet (Department Rollup)
# Dept Fleet
Count # of
AVFs
% of AFVs
in Fleet
1 Police 1,131 24 2.1%
2 Fire 160 34 21.3%
3 Parks 90 1 1.1%
4 Asset Mgmt 124 19 15.3%
5 Planning 29 16 55.2%
6 Enterprise Depts
846 74 8.7%
7 All Other Depts
55 8 14.5%
8 WIN 50 0 0%
9 TOTALS 2,485 176 7.1%
Table 27 – AFV Fleet (by Vehicle Type)
AFV Description Numberof AFVs
CNG - Ford Ranger Pickup 10
CNG - Crane Carrier Trash Truck 6
CNG - Ford F150, F250 & F350 Bi-Fuel Pickup
24
CNG - Chevrolet Impala Bi-Fuel 1
CNG - Honda Civic GX 18
Hybrid - Honda Civic 11
Hybrid - Toyota Prius 5
Hybrid - Ford Escape SUV 69
Hybrid - Chevrolet Silverado Pickup 30
Electric – Nissan Leaf 2
TOTAL
176

34 | P a g e
Table 28 – AFV Fleet (Department Breakdown of CNG and Hybrid Units)
Department Quantity Vehicle Type
Communications 1 CNG – Honda Civic GX Engineering 21 Hybrid – Ford Escape SUV Enginering 3 CNG – Honda Civic CX Engineering 1 Hybrid – Chevrolet Silverado Pickup Engineering 1 Hyrid – Ford Fusion Asset Management 1 CNG – Chevrolet Impala Bi-Fuel Asset Management 6 CNG – Honda Civic GX Asset Management 2 Hybrid – Toyota Prius Asset Management 3 Hybrid – Ford Escape SUV Asset Management 2 CNG – Ford F250 & F350 Bi-Fuel Pickup Asset Management 3 Hybrid – Chevrolet Silverado Pickup Asset Management 2 Electric – Nissan Leaf Finance 1 CNG – Honda Civic GX Finance 3 CNG – Ford Ranger Fire 5 Hybrid – Ford Escape SUV Fire 11 Hybrid – Honda Civic Fire 3 Hybrid – Toyota Prius Fire 10 Hybrid – Chevrolet Silverado Pickup Fire 3 CNG – Ford F150, F250, F350 Bi-Fuel Truck Fire 2 CNG – Ford Transit Van Bi-Fuel Human Resources 3 Hybrid – Ford Escape SUV Parks 1 CNG – Honda Civic GX Planning & Economic Development 6 CNG – Ford Ranger Pickup Planning & Economic Development 10 Hybrid – Ford Escape SUV Police 4 CNG – Honda Civic GX Police 14 Hybrid – Ford Escape SUV Police 6 Hybrid – Chevrolet Silverado Pickup Streets and Stormwater 4 Hybrid – Ford Escape SUV Streets and Stormwater 5 Hybrid – Chevrolet Silverado Pickup Streets and Stormwater 6 CNG – Crane Carrier Trash Truck Streets and Stormwater 10 CNG – Ford F150, F250, F350 Bi-Fuel Truck Streets and Stormwater 1 CNG – Ford Ranger Pickup Streets and Stormwater 1 CNG – Ford F550 Water and Sewer 2 CNG – Honda Civic GX Water and Sewer 9 Hybrid – Ford Escape SUV Water and Sewer 5 Hybrid – Chevrolet Silverado Pickup Water and Sewer 5 CNG – Ford F150 & F250 Bi-Fuel Pickup
TOTALS 176

35 | P a g e
APPENDIX 2: CONTACT INFORMATION #
Position Title
Duties Position Name
Location Phone
Number Cell
Number Email
Address
1 Director Department
Director, FMSC Chair
Mark Hogan
490 W. 23rd 591-4070 527-0170 [email protected]
2 Maintenance
Manager
Manager of Body Shop & Maintenance
Garages
Mike Wallace
490 W. 23rd 596-1235 906-6563 [email protected]
3 Administrative
Manager
Manager of Fuel, Parts,
Wash Facilities, M5,
& Admin
Brian Franklin
490 W. 23rd 596-9810 697-6188 [email protected]
4 Mechanical Shop
Supervisor
Supervisor of Body Shop & Police Garage
Kevin Jones 1720
Newblock Park Dr.
596-9840 695-6324 [email protected]
5 Mechanical Shop
Supervisor Supervisor of Fire Garage
Danny Taylor
1790 Newblock Park Dr.
596-9817 636-9256 [email protected]
6 Mechanical Shop
Supervisor
Supervisor of Westyard Garages
Vacant 480 W. 23rd 596-9842
7 Mechanical Shop
Supervisor
Supervisor of Eastyard Garages
Gary Burr 5675 S.
Garnett Rd. 596-8131 697-6176 [email protected]
8 Accountant Accounting Kevin Rice 490 W. 23rd 596-9839 [email protected]
9 Maintenance
Operations Analyst Safety and
PMs Diane
Whalen 490 W. 23rd 596-1244 322-2116 [email protected]
10 Administrative
Supervisor
M5 Support, Vehicle In-
Service, Fuel Keys, FMSC Administrator
John Reel 490 W. 23rd 596-9815 850-8470 [email protected]
11 Maintenance
Operations Analyst Accident
Collections Sherron Wilson
490 W. 23rd 596-2853 630-5278 [email protected]
12 Support Operations
Supervisor
Supervisor of Fuel & Car
Wash Operations
Robert Fazendine
480 W. 23rd 596-1236 527-0002 [email protected]
13 Inventory Control
Supervisor
Supervisor of Parts
Operations
Jesse Robbins
490 W. 23rd 596-9825 697-6177 [email protected]
14 Warranty and
Training Admin
Warranties, Recalls, Training
Tim Keiffer 1720
Newblock Park Dr.
596-9820 850-8470 [email protected]