fy16cip.pdf
TRANSCRIPT
DRAFT
City of Portland
CAPITAL IMPROVEMENT PLAN
FY 2016 – FY 2020
February 2015

(Page intentionally left blank)

Table of Contents Introduction 4 Needs Assessment 9 A. Funding Summary 16 B. Proposed Capital Projects (2016)
General Fund 18 Sewer Fund 20
C. Capital Improvement Plan (5-Year) General Fund 23 Sewer Fund 27 D. Debt Management Strategy 29 E. Project Descriptions 30

Introduction The Capital Improvements Plan (CIP) is the document that presents the City’s capital needs in the current year and plans for capital needs in future years. It is also a financing plan for public improvement projects that require significant capital investment for the City. The purpose of developing and annually updating a five-year CIP is to inform policy makers and community of both the current and future capital needs of the community and balanced those needs with the City’s debt position, public expectations, and the ability of the City’s operating budget to fund capital projects. The capital plan is not intended to predetermine that a project will be funded, but is intended to be a living and flexible document that considers capital needs in the community and balances those needs with what the City can afford. Generally, capital improvements projects consist of purchasing, constructing or renovating structures, acquiring land and/or purchasing major equipment or vehicles that have a total cost of at least $10,000 and a useful life of more than five years. Common CIP projects include new vehicles, new or improved sidewalks, roads, neighborhood renewal projects and new City facilities, such as schools and other facilities. The CIP, which is to be updated annually and submitted to City Council specifies and describes the City's capital project schedules and priorities for the next five years. The CIP attempts to reflect Government Financial Officer Association (GFOA) best practices for multi-year capital planning and asset assessment, maintenance, and replacement. This Capital Improvement Plan meets the following requirements. Pursuant to the 2011 amendments to the City Charter (Article VI, Section 5, paragraph (i)), one of the City Manager’s duties is to “prepare a five (5) year rolling Capital Improvement Plan for annual presentation to the City Council, which Plan includes the following:
1. A one (1) year plan of specific projects and their costs;
2. A two (2) through five (5) year plan of specific projects and general categories, and amounts of proposed spending and funding sources; and
3. A discussion of the basis for the plan and the factors which went into its development or amendments.”
CIP Preparation City Departments reviewed and developed potential CIP projects (including those submitted by the community) and submitted projects for consideration in the CIP. Each capital project request includes a project description, justification, proposed funding levels and sources and, if applicable, estimated ongoing operating costs. For projects already underway, the description also notes the remaining portion of the project's budget. Each project was then reviewed by City staff and evaluated as to whether it was critical to maintaining a City asset. Projects that were deemed critical were recommended based on the projected availability of funds in future years.
4

A list of specific projects and their costs and the DRAFT Capital Improvement Plan is then prepared and presented to the City Council Finance Committee for consideration. The Finance Committee then recommends the list of specific projects and their costs to the City Council with a recommendation to fund through borrowing. Relationship to the Annual Operating Budget Some projects listed in the CIP are recommended for funding through annual operating funds in the upcoming operating budget while other projects are recommended for funding through borrowing. Projects funded through borrowing impact the operating budget through ongoing debt service expenses. Some CIP projects also directly impact the operating budget in that they will require ongoing expenses for staff and other operating costs. The projects funded through borrowing in the coming year impact the following year’s operating budget dependent on when bonds are issued. From a financial planning standpoint the CIP attempts to balance deferring maintenance and other capital investments with the increased expenditure from borrowing and then debt payments from that borrowing that then needs to be offset by increasing revenue (e.g. property taxes). In summary, funding for capital projects comes from four general sources:
• Funds received through the sale of bonds including general obligations bonds (repaid through taxes on property) and sometimes revenue supported bonds (repaid through utility charges);
• Money from the City’s general fund (annual operating budget); or • Other loans, grants or other Federal/State aid.
Funding Summary Given the City’s consistently strong financial position, managing the overall debt level and ability to service that debt remain critical factors in maintaining a strong credit rating. At the present time, the City’s outstanding authorized and issued debt for city and school funds is approximately $219 Million.
Outstanding Debt Authorized and Issued as of June 30, 2014 General City 108,760,921 Pension 110,210,000 Sewer 70,005,301 Total 288,976,222
The City’s General Fund debt service for the current year and the next five years, exclusive of authorized, but not issued debt and reimbursements for School Construction debt service are:
Fiscal Year CURRENT Principal and Interest Payments Exclusive of POB Inclusive of POB 2016 (current) 14,250,995 26,382,363 2017 14,307,028 26,182,790 2018 13,331,127 25,438,936 2019 11,764,084 25,028,503 2020 10,480,622 24,519,066
5

The five year DRAFT Capital Improvement Plan calls for approximately $61 Million in city and school projects supported by City resources including the operating budget, fund balance, and the issuance of general obligation bonds. The following table summarizes the proposed use of local resources in the first year (2016) and the total over the full five years (2016-2020):
Funding Source FY 2016 FY 2016 – FY 2020 City Bond Issue 14,257,000 60,984,700 City Operating Budget 580,000 3,855,000 Sewer Bond Issue 3,445,000 19,595,000 Sewer Operating Budget 435,000 1,300,000
The following table summarizes the proposed bond Issues over the next five years:
Fund FY 2016 FY 2017 FY 2018 FY 2019 FY 2020 Total City 13,165,000 9,569,700 10,620,000 9,565,000 7,185,000 50,104,700
School 950,000 2,950,000 1,250,000 4,580,000 560,000 10,290,000 Public Art 71,000 61,000 57,000 69,000 37,000 295,000
Land Bank 71,000 61,000 57,000 69,000 37,000 295,000
Total General Fund
14,257,000
12,641,700
11,984,000
14,283,000
7,819,000
60,984,700
Sewer Fund 3,445,000 9,820,000 2,255,000 2,130,000 1,945,000 19,595,000 As a result of the funding levels for bonds issues over the next five years, the planned City’s General Fund debt service for the next five years, including reimbursements for School debt service and excluding pension bonds is estimated to be:
Fiscal Year PROJECTED Principal and Interest Payments
Net Increase/ (Decrease)
Tax Rate Increase/(Decrease)
2016 (current) 14,307,028 0.01 2017 14,808,292 501,264 0.06 2018 14,615,859 (192,434) (0.03) 2019 14,613,744 (2,114) 0.00 2020 14,586,852 (26,892) 0.00
Inclusive of pension bonds, the estimates are:
Fiscal Year PROJECTED Principal and Interest Payments
Net Increase/ (Decrease)
Tax Rate Increase/(Decrease)
2016 (current) 26,382,363 0.10 2017 27,659,955 1,277,592 0.16 2018 28,290,711 603,756 0.08 2019 29,161,625 870,915 0.11 2020 14,586,852 897,624 0.10
6

CIP Discussion In Fiscal Year 2015 the City authorized approximately $12.5 Million in General Fund borrowing. The decision to authorize $12.5 Million in borrowing is estimated to result in an increase of approximately $50,000 for capital debt payments in the upcoming FY2016 operating budget. Including pension bond payment increases, the net increase from FY 2015 borrowing will be approximately $800,000. The tax rate increase from capital borrowing will be approximately $0.01 or $0.10 including the pension bond payment. The FY 2015 five-year planning document estimated $130 Million in borrowing during the five year planning horizon. This would potentially result in annual increases of upwards of $1.7 Million from capital alone to the operating budget year-after-year from 2016 to 2020. Increases of that size or borrowing in that amount are unrealistic; setting up false expectations for funding projects when there are not the funds to support the debt payments. In this year’s CIP, approximately half of the 2016 capital budget ($14.2 Million) proposed for authorization by the City Council is funding for the necessary replacement of the Public Safety Communication System ($7 Million estimate) which at this point is obsolete. The remaining capital projects are critical to maintaining the City’s assets; however, in an effort to minimize the immediate impact to the FY 2017 operating budget from borrowing resulting from the FY 2016 CIP and to minimize long-term tax rate increases, there were numerous capital maintenance projects that were deferred for later years including over a $1 Million in vehicle replacements such as snow plows, police cruisers and parking enforcement vehicles. Additionally, needed street repairs and sidewalk repairs were deferred to later years. Street reconstructions were also deferred as well as important projects such as renovating library facilities and making investment to the waterfront. Even with deferred maintenance as is proposed in the 2016 DRAFT Capital Improvement Plan, the net increase to the FY2017 operating budget will be approximately $500,000 from capital or $1,300,000 from all debt (i.e. Pension Bond). The resulting tax rate increase in FY 2017 from committed to FY 2015 and projected FY 2016 debt payments is estimated to be an increase of approximately $0.26 per $1,000 of value on the tax rate from all forms of debt. This year’s DRAFT Five-year Capital Improvement Plan presents a capital maintenance funding program that balance maintaining roads, sidewalks, facilities (School and City), parks and open space, as well as the City’s vehicle fleet with minimizing the impact from capital expenditure on the operating budget and minimizing potential tax rate increases. The presented five-year Plan, in years two through five, shows the maximum funding-levels available so as not to increase operating budget expenditure. However, it is understood that there are upcoming capital projects of great importance to the community that carry with them significant costs. It is recommended that the Capital Improvement Plan be used as the tool that it is will help the City plan for and analyze future capital expenditures. Just as this year’s Communication System Replacement project ($7 Million estimate) carries with it deferred maintenance City-wide and an increase to the FY 2017 operating budget; the preparation of future year capital budgets will also need to make similar choices to balance capital maintenance, community investment, and increases to operating budget expenditures and therefore the tax rate. Capital projects that will be considered by the community over the next five to ten year will have a significant impact upon the operating budget. There will be a need to balance funding the projects with
7

impact to the operating budget, the tax rate and service impacts. The following is the known list of projects that are of importance to the community (in no particular order):
• Continuing to move Public Services from Bayside (estimated additional $6 Million1); • Elementary School Renovations and Expansions (non-State funded $51 Million2); • Capisic Pond Dredging and Park Improvements (additional $1.125 Million); • Congress Square Re-design (estimated $3.4 Million)3; • Franklin Street Re-design (estimated $5 Million)4; • Bayside Transportation Improvements (estimated $1.5 Million)5; • State and High Streets One-way/Two-way (estimated $3 Million)6; • Forest Avenue Transportation Improvements ($3.5 Million)7;
In planning for the financial impact of funding these projects, the planning horizon has been extended to 2027 to coincide with the expiration of the pension bonds. A draft funding schedule and resulting financial impact to the operating budget and tax rate can be found in Section D on page 29 of this document.
1 Relocated Public Services from Bayside incorporates the consolidation of city facilities. The sale of the Bayside Public Services properties will somewhat offset the purchase new property and facilities. 2 ESTIMATE ONLY 3 ESTIMATE ONLY and final estimated cost contingent on other projects. 4 ESTIMATE ONLY 5 PROJECT SCOPE UNDEVELOPED, ESTIMATE ONLY 6 ESTIMATE ONLY 7 PROJECT SCOPE UNDEVELOPED, ESTIMATE ONLY
8

Needs Assessment The needs assessment is a summary of the City’s capital assets, an evaluation of the replacement value of those assets, and estimate of the annual reinvestment needed to maintain those assets. It can be used as a tool for evaluating investment in the City’s capital assets and suggests an average annual funding target for future capital investment. Asset Inventory The City provides a wide range of services to the community requiring a diverse range of capital assets. In summary those assets include approximately:
82 buildings containing 2.5 million square feet (sf) of occupied space
1,075 acres of parks area
6.3 million sf of sidewalk area
43.2 million sf of road area
2 million linear feet of underground pipe
683 vehicles
Public Facilities Capital Assets
General Fund Buildings
33 City Building totaling approx. 486,138 sf
25 School Building totaling approx. 1,632,364 sf
9 Fire Building totaling approx. 69,621 sf
3 Barron Center Building totaling approx. 117,032 sf
3 Parking Garages with 1,585 parking garage spaces
Enterprise Fund Buildings
5 Golf Course Buildings totaling approximately 17,068 sf
1 Ice Arena Building totaling approximately 42,415 sf
2 Library Building totaling approximately 82,900 sf1
1 The Library is not an enterprise fund, but is subject to the
City’s debt limit policy. There are additional library
locations; however, these locations are located in other
buildings.
Recreation
3 Stadium
46 Playing Fields
23 Tennis Courts
9 Basket Ball Courts
3 Swimming Pools
3 Skating Pond
1 Skate Park
25 Playgrounds
Open Space and Cemeteries
1,075 acres of park area2
Fort Gorges
9,331 linear feet of sea wall
38,400 linear feet of walking path
Unknown number of tombs
2 This value does not include the islands.
9

Vehicles and Equipment Capital Assets General Fund Vehicles
55 Fire Vehicles
81 Police Vehicles
332 Public Service Vehicles
50 Recreation and Facilities Vehicles
10 Parking Management Vehicles
30 School Vehicles
3 Health and Human Services Vehicles
8 Barron Center Vehicles
8 Miscellaneous City Hall Department Vehicles
Enterprise Fund Vehicles
104 Golf Course Vehicles
1 Ice Arena Vehicle
1 Library Vehicle
General Fund Equipment
2,560 square feet of Health and Human Services kitchen space
685,957 linear feet of Public Safety data cable
3 Public Safety transmission towers
7 Public safety communication equipment systems
22 Information Technology storage and network devices
Information Technology network wiring
28,000 square feet of School kitchen space
125 signalized pedestrian intersections
97 streetlight poles
9,000 square feet of pier area
2 pedestrian piers
Field Irrigation systems
Field Lighting systems
Enterprise Fund Equipment
Golf Course irrigation system
Ice Arena refrigeration system
Ice Arena skate sharpener
Library network and storage devices
Roadways and Sewer System Capital Assets
Roadways
6,341,751 square feet of sidewalk area
1,006,300 linear feet of curbing
14,516,986 square feet of arterial and collector area
21,753,143 square feet of local street area
Sewer and Stormwater Enterprise Fund
2,034,220 linear feet of underground pipe
7,966 sewer manholes
6223 catch basins
859 sewer and stormwater outfalls
10 sewer pump stations
10

Full Replacement Cost Keeping all of the City’s capital assets in functional and working order requires regular reinvestment. Assuming that the City’s entire General Fund asset portfolio required replacement tomorrow, the current replacement value (excluding land value) of those capital assets is estimated to be $830 Million. Approximately 48% of that value is in infrastructure such as roads and sidewalks, 44% in public facilities and the remaining value in vehicles and equipment. Assuming that the City’s entire General Fund asset portfolio required replacement tomorrow, the current replacement value (excluding land value) of those capital assets is estimated to be $393 Million.
Figure: Full Replacement Cost: General Fund Assets (Approximately $830,000,000)
Annualized Reinvestment Cost Assuming regular reinvestment in the City’s General Fund capital assets would take place annually through such activities as reconstruction of facilities, repaving of roadways, and replacement of equipment the annualized reinvestment requirement would be approximately $19 Million. Given that the estimated lifespan of capital assets varies considerably from asset to asset reinvestment requirements would vary per asset category. Facilities and infrastructure has a much longer estimated lifespan than vehicles; however, given shorter lifespans of some assets and the high cost of replacing those assets, those assets would require a larger proportion of annualized investment requirements.
11
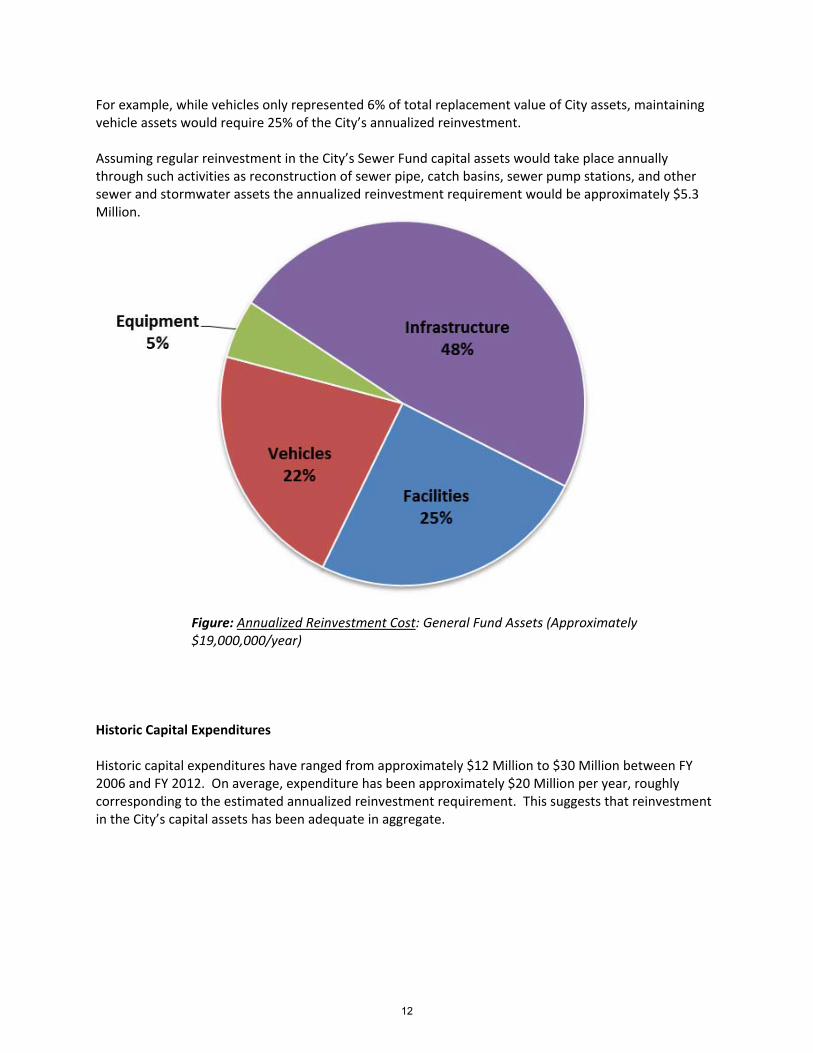
For example, while vehicles only represented 6% of total replacement value of City assets, maintaining vehicle assets would require 25% of the City’s annualized reinvestment. Assuming regular reinvestment in the City’s Sewer Fund capital assets would take place annually through such activities as reconstruction of sewer pipe, catch basins, sewer pump stations, and other sewer and stormwater assets the annualized reinvestment requirement would be approximately $5.3 Million.
Figure: Annualized Reinvestment Cost: General Fund Assets (Approximately $19,000,000/year)
Historic Capital Expenditures Historic capital expenditures have ranged from approximately $12 Million to $30 Million between FY 2006 and FY 2012. On average, expenditure has been approximately $20 Million per year, roughly corresponding to the estimated annualized reinvestment requirement. This suggests that reinvestment in the City’s capital assets has been adequate in aggregate.
12

$0
$5,000,000
$10,000,000
$15,000,000
$20,000,000
$25,000,000
2006 2007 2008 2009 2010 2011 2012 2013 2014
EXPENDED CAPITAL FUNDS
EQUIPMENT AND TECHNOLOGY FACILITIES AND SITE IMPROVEMENTS
INFRASTRUCTURE LAND
VEHICLES
13

$0
$5,000,000
$10,000,000
$15,000,000
$20,000,000
$25,000,000
2006 2007 2008 2009 2010 2011 2012 2013 2014
EXPENDED CAPITAL FUNDS
Marine Other Departments
Police and Fire Public Facilities, Parking, Parks, Recreation
Public Services Schools
14

$0
$5,000,000
$10,000,000
$15,000,000
$20,000,000
$25,000,000
2006 2007 2008 2009 2010 2011 2012 2013 2014
EXPENDED CAPITAL FUNDS
CDBG City Funds Fed/State/Other Grant
15

A: FUNDING SUMMARY ‐ GENERAL FUND
FY15 auth. FY16 FY17 FY18 FY19 FY20 FY21
Funding RecommendationCash
City 383,000 580,000 1,295,000 935,000 545,000 500,000 School ‐ ‐ ‐ ‐ ‐ ‐
Total General Fund Cash 383,000 580,000 1,295,000 935,000 545,000 500,000
BorrowingCity 10,983,000 13,165,000 9,569,700 10,620,000 9,565,000 7,185,000 School 1,525,000 950,000 2,950,000 1,250,000 4,580,000 560,000
Subtotal General Fund Borrowing 12,508,000 14,115,000 12,519,700 11,870,000 14,145,000 7,745,000
Public Art 63,000 71,000 61,000 57,000 69,000 37,000 Land Bank 63,000 71,000 61,000 57,000 69,000 37,000
Total General Fund Borrowing 12,634,000 14,257,000 12,641,700 11,984,000 14,283,000 7,819,000
Subtotal ‐ Cash and BorrowingCity 11,492,000 13,887,000 10,986,700 11,669,000 10,248,000 7,759,000 School 1,525,000 950,000 2,950,000 1,250,000 4,580,000 560,000
Total General Fund 13,017,000 14,837,000 13,936,700 12,919,000 14,828,000 8,319,000
Sewer/Stormwater FundsReallocated Bond Proceeds 2,150,000 ‐ ‐ ‐ ‐ ‐ Authorized Tier III CSO LTCP 3,000,000 29,250,000 10,000,000 32,000,000 16,300,000 10,300,000 Cash 115,000 375,000 240,000 200,000 200,000 225,000 Borrowing 3,277,000 3,445,000 9,820,000 2,255,000 2,130,000 1,945,000
16

A: FUNDING SUMMARY ‐ GENERAL FUND
FY15 auth. FY16 FY17 FY18 FY19 FY20 FY21
Valuation (1% est. increase) 7,662,000,000 7,738,620,000 7,816,006,200 7,894,166,262 7,973,107,925 8,052,839,004 8,133,367,394
Current Debt ServiceCurrent General Fund Debt Service
City General Obligation 10,019,919 9,172,383 8,351,893 7,539,174 7,169,173 6,016,341 5,478,064 City Loans 123,002 123,002 123,002 123,002 123,002 123,002 123,002 School General Obligation 5,793,145 5,076,951 4,696,180 3,990,113 3,425,063 3,135,628 2,987,329 School Capital Leases 186,843 93,086 46,996 4,180 4,180 - -
Total GF (Non‐POB) Debt Service 16,122,909 14,465,422 13,218,071 11,656,469 10,721,418 9,274,971 8,588,395
Pen. Obligation Bond ‐ City 9,985,356 10,626,295 11,309,463 12,033,870 12,802,135 13,615,710 14,474,866 Pen. Obligation Bond ‐ School 1,361,640 1,449,040 1,542,200 1,640,982 1,745,746 1,856,688 1,973,845
Total POB Debt Service 11,346,996 12,075,335 12,851,663 13,674,852 14,547,881 15,472,397 16,448,711
Total Current GF Debt Service 27,469,905 26,540,757 26,069,734 25,331,321 25,269,299 24,747,368 25,037,106
Authorized, Not Borrowed‐‐est. debt servicePublic Services Canco Road - 274,500 268,401 262,302 256,203 250,100 City (CIP 2015) 1,269,848 1,238,709 1,207,570 1,088,098 1,060,492 1,001,886 School (CIP 2015) 345,008 333,529 322,049 52,236 51,090 49,944
Total Authorized, Not Borrowed‐‐est. debt service 1,614,856 1,846,738 1,798,020 1,402,636 1,367,785 1,301,930
Less State reimbursed School Debt Service (est) (1,871,914) (1,773,250) (1,733,682) (1,690,405) (1,643,432) (1,596,087) (1,547,410)
Current GF Debt Service Est. 25,597,991 26,382,363 26,182,790 25,438,936 25,028,503 24,519,066 24,791,626 increase from prior year 1,682,449 784,372 (199,573) (743,854) (410,433) (509,437) 272,560
Current GF Debt Service Est. (less POB) 14,250,995 14,307,028 13,331,127 11,764,084 10,480,622 9,046,669 8,342,915 increase from prior year 991,448 56,033 (975,901) (1,567,043) (1,283,462) (1,433,953) (703,754)
Current Debt Service Available (784,372) (584,799) 159,055 569,488 1,078,925 806,365
Current FY15 Comparative Est. Tax Rate Increase from ‐ 0.10 0.07 (0.02) (0.07) (0.13) (0.10)
Projected Debt ServiceProjected New Issue Debt Service‐‐est. debt service
City 1,386,915 2,483,412 3,661,422 4,650,596 5,353,205 School 90,250 368,363 471,700 889,588 889,980
General Fund‐‐est. debt service 1,477,165 2,851,775 4,133,122 5,540,183 6,243,185
Projected GF Debt Service Est. 25,597,991 26,382,363 27,659,955 28,290,711 29,161,625 30,059,249 31,034,811 increase from prior year 1,682,449 784,372 1,277,592 630,756 870,915 897,624 975,562
Projected GF Debt Service Est. (less POB) 14,250,995 14,307,028 14,808,292 14,615,859 14,613,744 14,586,852 14,586,100 increase from prior year 991,448 56,033 501,264 (192,434) (2,114) (26,892) (752)
Projected Debt Service Available (784,372) (2,061,964) (2,692,720) (3,563,634) (4,461,258) (5,436,820)
Projected FY15 Comparative Est. Tax Rate increase ‐ 0.10 0.26 0.34 0.45 0.55 0.67
ProjectedEst. Tax Rate increase from prior year 0.16 0.08 0.11 0.11 0.11
17

B. RECOMMENDED 2016 CAPITAL PROJECTS ‐ GENERAL FUND CASH
FacilitiesBuildings/Garages
Peaks Island Exhaust Removal System 30,000 Buildings/Garages Total 30,000
Facilities Total 30,000
Parks, Fields, TrailsParks, Fields, Trails
Western Promenade Walkways 50,000
Complete Dead House Restoration 20,000 Parks, Fields, Trails Total 70,000
Parks, Fields, Trails Total 70,000
Equipment and VehiclesEquipment
Phonemail System Replacement 45,000
Ticket Dispensers at Spring Street Parking Garage 45,000
Virtualization, Storage and Redundancy Upgrade 65,000
Ticket Dispenser at Elm Street Parking Garage 15,000 Equipment Total 170,000
Vehicles1/2 Ton Pickup Replacement ‐ Playgrounds 2188 40,000
Replace 1 Ton Stake Body ‐ 4970 School Maintenance 50,000
3/4 Ton Pickup Replacement ‐ Solid Waste 2033 25,000
Staff Car Replacement ‐ Fire 40,000
Replace Pickup Riverside Golf 2017 30,000
1/2 Ton Pickup Replacement ‐ Trades 2084 25,000
Compact Pickup Replacement ‐ Barron Center 2209 20,000
Replace Parking Enforcement Truck 2154 25,000
1/2 Ton Truck Replacement ‐ Forestry 2038 30,000
Solid Waste Inspections Pickup Replacement ‐ Solid Waste 2155 25,000 Vehicles Total 310,000
Equipment and Vehicles Total 480,000
GENERAL FUND CASH TOTAL 580,000
18

B. RECOMMENDED 2016 CAPITAL PROJECTS ‐ GENERAL FUND FINANCED
TransportationPACTS/Match
MaineDOT Arterial Paving Riverside St (Brighton Av to Home Depot entrance) ‐ ineligibles/system upgrades
50,000
PACTS Regional Transportation Management Systems (RTMS) ‐ Traffic Signals 100,000
PACTS/Match Total 150,000
Streets/SidewalksPaving Preservation and Rehabilitation 1,000,000
Sidewalk Rehabilitation/Accessibility 500,000 Streets/Sidewalks Total 1,500,000
Transportation Total 1,650,000
FacilitiesBuildings/Garages
Fire Alarm & Sprinkler Systems at all Fire Stations 75,000
Waterproof Decking Recoat at Temple Street Parking Garage 305,000
Ultra Violet Water Treatment System at Riverton Pool 50,000
Passenger Elevator at City Hall 100,000
Seating at Hadlock Field 190,000
Bleachers at Ice Arena 100,000
Roof Deck at Spring Street Parking Garage 500,000
Library Roof Section 25,000 Buildings/Garages Total 1,345,000
MarineCompass Park Pier Stablization 30,000
Piles at Portland Ocean Terminal 280,000
Steel Piles at Ocean Gateway Pier (engineering) 100,000 Marine Total 410,000
SchoolsPATHS Paving 450,000
Fire Alarm System at Portland High School 150,000
Windows at Deering High School 250,000
Oil Tanks Removal at Various School Buildings 100,000 Schools Total 950,000
Facilities Total 2,705,000
19

B. RECOMMENDED 2016 CAPITAL PROJECTS ‐ GENERAL FUND FINANCED
Parks, Fields, TrailsParks, Fields, Trails
Lyman Moore Sports Complex 275,000
Payson Park Softball Field "A" ‐ Amenity and Field Upgrades 200,000
Golf Course Rehabilitiation 100,000 Parks, Fields, Trails Total 575,000
Parks, Fields, Trails Total 575,000
Equipment and VehiclesEquipment
Communication System Replacement 7,000,000 Equipment Total 7,000,000
Vehicles30 Passenger Bus ‐ School 50,000
Full Size Bus ‐ School 90,000
7 Passenger Van ‐ School 50,000
Medcu Ambulance Replacement ‐ Fire 265,000
Police Cruisers (4) Replacement ‐ Police 160,000
Ladder 1 Replacement ‐ Fire 1,300,000
Bucket Truck Replacement ‐ Forestry 5098 220,000 Vehicles Total 2,135,000
Equipment and Vehicles Total 9,135,000
GENERAL FUND FINANCED TOTAL 14,065,000
20

B. RECOMMENDED 2016 CAPITAL PROJECTS ‐ SEWER FUND CASH
Equipment and VehiclesEquipment
Wastewater Server 50,000 Equipment Total 50,000
Vehicles3/4 Ton Extended Cab Pickup Replacement ‐ Sewer 2513 40,000
Vehicles Total 40,000
Equipment and Vehicles Total 90,000
StormwaterStormwater
Neighborhood Stormwater Drainage 200,000
Greenleaf Street Stormwater Facilities 85,000 Stormwater Total 285,000
Stormwater Total 285,000
SEWER FUND CASH TOTAL 375,000
21

B. RECOMMENDED 2016 CAPITAL PROJECTS ‐ SEWER FUND FINANCED
FacilitiesBuildings/Garages
Water Resource Relocation 250,000 Buildings/Garages Total 250,000
Facilities Total 250,000
Equipment and VehiclesVehicles
Dump Truck Replacement ‐ Public Services 3112 165,000
Dump Truck Replacement ‐ Sewer 3110 165,000
Street Sweepers Replacement 175,000
CCTV Truck ‐ NEW 415,000 Vehicles Total 920,000
Equipment and Vehicles Total 920,000
StormwaterStormwater
Stormwater Storage and Filtration Systems at Sagamore Village (Engineering) 120,000
Gravel Wetland Stormwater Treatment System in the Capisic Brook Watershed (Engineering)
175,000
Stormwater Total 295,000
Stormwater Total 295,000
SewerSewer
CMOM ‐ Sewer System Renewal 1,100,000
CMOM ‐ Pump Station Rehabilitation 670,000
Rowe Avenue Sewer Separation 210,000 Sewer Total 1,980,000
Sewer Total 1,980,000
SEWER FUND FINANCED TOTAL 3,445,000
22

C. RECOMMENDED CAPITAL IMPROVEMENT PLAN ‐ GENERAL FUND
2016 2017 2018 2019 2020TransportationPACTS/Match
‐ MaineDOT Arterial Paving Riverside St (Brighton Av to Home Depot entrance) ‐ ineligibles/system upgrades
50,000 ‐ ‐ ‐ ‐
‐ PACTS Regional Transportation Management Systems (RTMS) ‐ Traffic Signals
100,000 100,000 100,000 100,000 ‐
‐ PACTS/Match GENERAL ‐ 1,974,700 3,075,000 320,000 ‐ PACTS/Match Total 150,000 2,074,700 3,175,000 420,000 ‐
Streets/Sidewalks‐ Paving Preservation and Rehabilitation 1,000,000 1,500,000 1,500,000 1,750,000 1,500,000
‐ Street Reconstruction ‐ 500,000 500,000 500,000 500,000
‐ Sidewalk Rehabilitation/Accessibility 500,000 700,000 850,000 850,000 850,000
‐ Streets/Sidewalks GENERAL ‐ 50,000 500,000 250,000 280,000 Streets/Sidewalks Total 1,500,000 2,750,000 3,350,000 3,350,000 3,130,000
Traffic/Streetlights‐ Traffic/Streetlights GENERAL ‐ 790,000 400,000 445,000 830,000
Traffic/Streetlights Total ‐ 790,000 400,000 445,000 830,000
Transportation Total 1,650,000 5,614,700 6,925,000 4,215,000 3,960,000
23

C. RECOMMENDED CAPITAL IMPROVEMENT PLAN ‐ GENERAL FUND
2016 2017 2018 2019 2020FacilitiesBuildings/Garages
‐ Ultra Violet Water Treatment System at Riverton Pool 50,000 ‐ ‐ ‐ ‐
‐ Roof Deck at Spring Street Parking Garage 500,000 720,000 ‐ ‐ ‐
‐ Bleachers at Ice Arena 100,000 ‐ ‐ ‐ ‐
‐ Fire Alarm & Sprinkler Systems at all Fire Stations 75,000 ‐ ‐ ‐ ‐
‐ Seating at Hadlock Field 190,000 ‐ ‐ ‐ ‐
‐ Library Roof Section 25,000 ‐ ‐ ‐ ‐
‐ Waterproof Decking Recoat at Temple Street Parking Garage 305,000 ‐ ‐ ‐ ‐
‐ Passenger Elevator at City Hall 100,000 ‐ ‐ ‐ ‐
‐ Peaks Island Exhaust Removal System 30,000 ‐ ‐ ‐ ‐
‐ Buildings/Garages GENERAL ‐ 1,105,000 915,000 2,000,000 1,150,000 Buildings/Garages Total 1,375,000 1,825,000 915,000 2,000,000 1,150,000
Marine‐ Compass Park Pier Stablization 30,000 350,000 ‐ ‐ ‐
‐ Steel Piles at Ocean Gateway Pier (engineering) 100,000 400,000 500,000 500,000 ‐
‐ Piles at Portland Ocean Terminal 280,000 ‐ ‐ ‐ ‐
‐ Marine GENERAL ‐ ‐ ‐ 325,000 155,000 Marine Total 410,000 750,000 500,000 825,000 155,000
Schools‐ Windows at Deering High School 250,000 250,000 250,000 ‐ ‐
‐ Fire Alarm System at Portland High School 150,000 ‐ ‐ ‐ ‐
‐ Hall School Replacement (Engineering) ‐ 500,000 ‐ ‐ ‐
‐ Oil Tanks Removal at Various School Buildings 100,000 100,000 ‐ ‐ ‐
‐ PATHS Paving 450,000 ‐ ‐ ‐ ‐
‐ Schools GENERAL ‐ 2,100,000 1,000,000 4,580,000 560,000 Schools Total 950,000 2,950,000 1,250,000 4,580,000 560,000
Facilities Total 2,735,000 5,525,000 2,665,000 7,405,000 1,865,000
24

C. RECOMMENDED CAPITAL IMPROVEMENT PLAN ‐ GENERAL FUND
2016 2017 2018 2019 2020Parks, Fields, TrailsParks, Fields, Trails
‐ Payson Park Softball Field "A" ‐ Amenity and Field Upgrades 200,000 ‐ ‐ ‐ ‐
‐ Complete Dead House Restoration 20,000 ‐ ‐ ‐ ‐
‐ Western Promenade Walkways 50,000 ‐ ‐ ‐ ‐
‐ Golf Course Rehabilitiation 100,000 100,000 100,000 100,000 100,000
‐ Lyman Moore Sports Complex 275,000 ‐ ‐ ‐ ‐
‐ Parks, Fields, Trails GENERAL ‐ 250,000 735,000 1,395,000 745,000 Parks, Fields, Trails Total 645,000 350,000 835,000 1,495,000 845,000
Parks, Fields, Trails Total 645,000 350,000 835,000 1,495,000 845,000
Equipment and VehiclesEquipment
‐ Ticket Dispensers at Spring Street Parking Garage 45,000 ‐ ‐ ‐ ‐
‐ Communication System Replacement 7,000,000 ‐ ‐ ‐ ‐
‐ Virtualization, Storage and Redundancy Upgrade 65,000 75,000 55,000 ‐ ‐
‐ Phonemail System Replacement 45,000 ‐ ‐ ‐ ‐
‐ Ticket Dispenser at Elm Street Parking Garage 15,000 ‐ ‐ ‐ ‐
‐ Equipment GENERAL 50,000 720,000 605,000 ‐ ‐ Equipment Total 7,220,000 795,000 660,000 ‐ ‐
25

C. RECOMMENDED CAPITAL IMPROVEMENT PLAN ‐ GENERAL FUND
2016 2017 2018 2019 2020Vehicles
‐ 7 Passenger Van ‐ School 50,000 ‐ ‐ ‐ ‐
‐ Rubbish Packer Replacement ‐ 265,000 265,000 265,000 265,000
‐ 1/2 Ton Pickup Replacement ‐ Trades 2084 25,000 ‐ ‐ ‐ ‐
‐ Medcu Ambulance Replacement ‐ Fire 265,000 265,000 265,000 265,000 265,000
‐ 1/2 Ton Truck Replacement ‐ Forestry 2038 30,000 ‐ ‐ ‐ ‐
‐ Solid Waste Inspections Pickup Replacement ‐ Solid Waste 2155 25,000 ‐ ‐ ‐ ‐
‐ 3/4 Ton Pickup Replacement ‐ Solid Waste 2033 25,000 ‐ ‐ ‐ ‐
‐ Vehicle Replacement GENERAL ‐ 500,000 500,000 500,000 500,000
‐ 30 Passenger Bus ‐ School 50,000 ‐ ‐ ‐ ‐
‐ Replace 1 Ton Stake Body ‐ 4970 School Maintenance 50,000 ‐ ‐ ‐ ‐
‐ Replace Parking Enforcement Truck 2154 25,000 ‐ ‐ ‐ ‐
‐ Replace Pickup Riverside Golf 2017 30,000 ‐ ‐ ‐ ‐
‐ Sidewalk Tractors Replacement ‐ 145,000 290,000 145,000 145,000
‐ Bucket Truck Replacement ‐ Forestry 5098 220,000 ‐ ‐ ‐ ‐
‐ Staff Car Replacement ‐ Fire 40,000 ‐ ‐ ‐ ‐
‐ Compact Pickup Replacement ‐ Barron Center 2209 20,000 ‐ ‐ ‐ ‐
‐ Police Cruisers (4) Replacement ‐ Police 160,000 265,000 265,000 265,000 265,000
‐ Full Size Bus ‐ School 90,000 90,000 135,000 135,000 135,000
‐ 1/2 Ton Pickup Replacement ‐ Playgrounds 2188 40,000 ‐ ‐ ‐ ‐
‐ Ladder 1 Replacement ‐ Fire 1,300,000 ‐ ‐ ‐ ‐ Vehicles Total 2,445,000 1,530,000 1,720,000 1,575,000 1,575,000
Equipment and Vehicles Total 9,665,000 2,325,000 2,380,000 1,575,000 1,575,000
General Fund Capital Funding Total 14,695,000 13,814,700 12,805,000 14,690,000 8,245,000
Public Art 71,000 61,000 57,000 69,000 37,000 Land Bank 71,000 61,000 57,000 69,000 37,000
General Fund Capital Funding Grand Total 14,837,000 13,936,700 12,919,000 14,828,000 8,319,000
26

C. RECOMMENDED CAPITAL IMPROVEMENT PLAN ‐ SEWER FUND
2016 2017 2018 2019 2020Buildings/GaragesWater Resource Relocation 250,000 ‐ ‐ ‐ ‐
Buildings/Garages Total 250,000 ‐ ‐ ‐ ‐
EquipmentWastewater Server 50,000 ‐ ‐ ‐ ‐
Equipment Total 50,000 ‐ ‐ ‐ ‐
SewerCMOM ‐ Pump Station Rehabilitation 670,000 1,100,000 670,000 670,000 670,000
CMOM ‐ Sewer System Renewal 1,100,000 1,100,000 1,100,000 1,100,000 1,100,000
Sewer Replacement ‐ Somerset Street Extension ‐ 300,000 ‐ ‐ ‐
USM Roundabout Sewer Separation ‐ 400,000 ‐ ‐ ‐
Rowe Avenue Sewer Separation 210,000 ‐ ‐ ‐ ‐ Sewer Total 1,980,000 2,900,000 1,770,000 1,770,000 1,770,000
27

C. RECOMMENDED CAPITAL IMPROVEMENT PLAN ‐ SEWER FUND
2016 2017 2018 2019 2020StormwaterNeighborhood Stormwater Drainage 200,000 200,000 200,000 200,000 200,000
Stormwater Retrofits on Riverside Street ‐ ‐ ‐ 185,000 ‐
Canco Road Storm Drain ‐ 580,000 ‐ ‐ ‐
Warren Ave Storm Drain ‐ 517 Warren Ave to 659 Warren Ave ‐ 750,000 ‐ ‐ ‐
Greenleaf Street Stormwater Facilities 85,000 ‐ ‐ ‐ ‐
Stormwater Storage and Filtration Systems at Sagamore Village (Engineering) 120,000 1,245,000 ‐ ‐ ‐
Gravel Wetland Stormwater Treatment System in the Capisic Brook Watershed (Engineering)
175,000 2,000,000 ‐ ‐ ‐
Stormwater Total 580,000 4,775,000 200,000 385,000 200,000
VehiclesReplace Stormwater Staff Car ‐ ‐ ‐ ‐ 25,000
Street Sweepers Replacement 175,000 175,000 235,000 175,000 175,000
TV Truck Replacement ‐ Sewer 2516 ‐ ‐ 250,000 ‐ ‐
1 Ton Crew Cab Pickup Replacement ‐ Sewer 2511 ‐ 40,000 ‐ ‐ ‐
3/4 Ton Extended Cab Pickup Replacement ‐ Sewer 2513 40,000 ‐ ‐ ‐ ‐
Dump Truck Replacement ‐ Sewer 3110 165,000 ‐ ‐ ‐ ‐
Dump Truck Replacement ‐ Public Services 3112 165,000 ‐ ‐ ‐ ‐
Catch Basin Cleaning Vehicle Replacement ‐ Sewer 3127 ‐ 170,000 ‐ ‐ ‐
CCTV Truck ‐ NEW 415,000 ‐ ‐ ‐ ‐ Vehicles Total 960,000 385,000 485,000 175,000 200,000
CSOCSO ‐ Close CSO #42 and #43 ‐ 2,000,000 ‐ ‐ ‐
CSO Total ‐ 2,000,000 ‐ ‐ ‐
Grand Total 3,820,000 10,060,000 2,455,000 2,330,000 2,170,000
28

D: DEBT STRATEGY ‐ GENERAL FUND
FY15 auth. FY16 FY17 FY18 FY19 FY20 FY21 FY22 FY23 FY24 FY25 FY26 FY27Funding Recommendation
Capital Maintenance Borrowing 12,634,000 14,257,000 12,641,700 11,984,000 14,283,000 7,819,000 12,000,000 12,000,000 12,000,000 12,000,000 12,000,000 12,000,000 12,000,000
Projected New Issue Debt Service‐‐est. debt serviceGeneral Fund‐‐est. debt service 1,477,165 2,851,775 4,133,122 5,540,183 6,243,185 8,086,084 8,676,073 9,351,110 9,974,532 10,534,414 10,922,721
Projected GF Debt Service Est. 25,597,991 26,382,363 27,659,955 28,290,711 29,161,625 30,059,249 31,034,811 33,380,800 34,451,786 35,658,668 36,816,566 38,166,492 15,809,241 increase from prior year 1,682,449 784,372 1,277,592 630,756 870,915 897,624 975,562 2,345,988 1,070,986 1,206,882 1,157,898 1,349,926 (22,357,251)
Projected GF Debt Service Est. (less POB) 14,250,995 14,307,028 14,808,292 14,615,859 14,613,744 14,586,852 14,586,100 15,895,005 15,866,386 15,906,175 15,826,748 15,868,603 15,809,241 increase from prior year 991,448 56,033 501,264 (192,434) (2,114) (26,892) (752) 1,308,904 (28,619) 39,789 (79,427) 41,854 (59,361)
Projected Debt Service Available (784,372) (2,061,964) (2,692,720) (3,563,634) (4,461,258) (5,436,820) (7,782,809) (8,853,795) (10,060,677) (11,218,575) (12,568,501) 9,788,750
Projected FY15 Comparative Est. Tax Rate Increase ‐ 0.10 0.26 0.34 0.45 0.55 0.67 0.95 1.07 1.20 1.33 1.47 (1.13)
Potential CIP Major Project SELECT YEAR
Elementary Schools 18 ‐ ‐ 11,257,319 15,339,060 12,337,789 12,183,505 ‐ ‐ ‐ ‐ ‐ ‐ Public Services Relocation 17 ‐ 6,000,000 ‐ ‐ ‐ ‐ ‐ ‐ ‐ ‐ ‐ ‐ Congress Square Re‐Design 18 ‐ ‐ 2,000,000 1,370,000 ‐ ‐ ‐ ‐ ‐ ‐ ‐ ‐ Capisic Pond Improvements 20 ‐ ‐ ‐ ‐ 1,125,000 ‐ ‐ ‐ ‐ ‐ ‐ ‐ Franklin Street Redesign 23 ‐ ‐ ‐ ‐ ‐ ‐ ‐ 500,000 4,500,000 ‐ ‐ ‐ Bayside Transportation 25 ‐ ‐ ‐ ‐ ‐ ‐ ‐ ‐ ‐ 500,000 500,000 500,000 State St & High St 25 ‐ ‐ ‐ ‐ ‐ ‐ ‐ ‐ ‐ 1,500,000 1,500,000 ‐ Forest Avenue 20 ‐ ‐ ‐ ‐ 500,000 2,000,000 500,000 500,000 ‐ ‐ ‐ ‐
Total Potential Projects ‐ 6,000,000 13,257,319 16,709,060 13,962,789 14,183,505 500,000 1,000,000 4,500,000 2,000,000 2,000,000 500,000
Potential GF Debt Service Est. 25,597,991 26,382,363 27,659,955 28,860,711 30,964,071 33,346,068 35,454,385 38,909,800 39,724,469 40,874,222 42,296,241 43,597,414 21,227,410 increase from prior year 1,682,449 784,372 1,277,592 1,200,756 2,103,360 2,381,998 2,108,316 3,455,416 814,668 1,149,753 1,422,019 1,301,173 (22,370,004)
Potential GF Debt Service Est. (les 14,250,995 14,307,028 14,808,292 15,185,859 16,416,190 17,873,671 19,005,674 21,424,005 21,139,069 21,121,729 21,306,424 21,299,525 21,227,410 increase from prior year 991,448 56,033 501,264 377,567 1,230,331 1,457,481 1,132,003 2,418,332 (284,937) (17,340) 184,695 (6,899) (72,115)
Potential Debt Service Available ‐ (784,372) (2,061,964) (3,262,720) (5,366,080) (7,748,077) (9,856,394) (13,311,809) (14,126,478) (15,276,231) (16,698,250) (17,999,423) 4,370,581
Potential FY15 Comparative Est. Tax Rate Inc 0.10 0.26 0.41 0.67 0.96 1.21 1.62 1.70 1.82 1.97 2.11 (0.51)
Potential Prior Year Est. Tax Rate Increase 0.16 0.15 0.26 0.29 0.25 0.41 0.08 0.12 0.15 0.13 (2.61)
Potential Project Tax Rate Increase ‐ 0.07 0.23 0.41 0.54 0.67 0.64 0.62 0.65 0.64 0.63
29

Project Title
Communication System Replacement
Update or Replace Radio System
Project JustificationOur current public safety communication system, which serves the public safety answering point (911), Police, Fire, Public Services, and Public Schools, is reaching the end of its life expectancy and some of the major components are no longer supported by Motorola. The costs to upgrade to their next generation system are reflected in the estimates entered in 2015.
Because this will be a significant expense, we contracted a system specialist to help us prepare and evaluate an RFP for a system upgrade or replacement. The consultant's findings will assist with establishing timeline, project implementation phases and the costs associated with each phase.
Est Total Cost
5 Year Cost Summary
Planning Land Construction Equipment
$9,000,000
Funding Source
Other Funding Source Description
Operating Budget ImpactThe savings associated with this might be in reduced maintenance costs.
Fire Department
Dispatch Services
Information Technology
Division
Classification
ID 141539
Project Description
Request Year 2016
Other FundingRequestedFundingYear
City Mgr Recommended Funding Type
$9,000,0002016 $9,000,000 Borrowed2017
2018
2019
2020
$9,000,000Total $9,000,000
30

Project Title
Fire Alarm & Sprinkler Systems at all Fire Stations
Install complete fire sprinkler & fire alarm systems throughout each of the 8 existing fire stations.
Project JustificationTo bring our buildings into compliance with all applicable City and State codes.
Page 338 of the Performance and Management Study of the Portland Fire Department, prepared by Public Safety Solutions, Inc.: "Ensuring that all fire department facilities comply with all legal, health, safety, building, and fire code requirements. Ensuring that work sites have adequate fire and life safety protection systems in place such as smoke detectors, fire alarm systems, carbon monoxide detectors, and automatic sprinkler system."
Est Total Cost
5 Year Cost Summary
Planning
$52,000
Land Construction
$690,000
Equipment
Funding Source
Other Funding Source Description
Operating Budget ImpactWe have submitted an Assistance to Firefighters Grant (AFG) application for this project, but funding has not been secured.
There may be grant funding available for this, however not guaranteed, and there may also be a local match portion that would need to be considered.
Fire Department
Building Maintenance
Facilities
Division
Classification
ID 152415
Project Description
Request Year 2016
Other FundingRequestedFundingYear
City Mgr Recommended Funding Type
$742,0002016 $75,000 Borrowed2017
2018
2019
2020
$742,000Total $75,000
31

Project Title
Peaks Island Exhaust Removal System
Install Plymovent vehicle exhaust system at Peaks Island Station.
Project JustificationHealth and safety of Police and Fire personnel assigned to work at the station.
Priority item needed to comply with applicable health and safety standards.
Est Total Cost
5 Year Cost Summary
Planning Land Construction
$30,000
Equipment
Funding Source
Other Funding Source Description
Operating Budget Impact
Fire Department
Building Maintenance
Facilities
Division
Classification
ID 152496
Project Description
Request Year 2016
Other FundingRequestedFundingYear
City Mgr Recommended Funding Type
$30,0002016 $30,000 Capital2017
2018
2019
2020
$30,000Total $30,000
32

Project Title
Phonemail System Replacement
This project increase mail box capacity, allow ability to send voicemail to email as well as provide caller ID functionality.
Project JustificationThe City's voicemail system is 20 years old, capacity is low resulting in mailboxes filling up. There are many requests for voicemail to be sent to email, and also caller ID.
Est Total Cost
5 Year Cost Summary
Planning Land Construction Equipment
$45,000
Funding Source
Other Funding Source Description
Operating Budget ImpactIt is expected that this project will improve productivity.
Information Technology
Information Technology
Division
Classification
ID 14907
Project Description
Request Year 2016
Other FundingRequestedFundingYear
City Mgr Recommended Funding Type
$45,0002016 $45,000 Capital2017
2018
2019
2020
$45,000Total $45,000
33

Project Title
Virtualization, Storage and Redundancy Upgrade
This Green initiative will increase energy efficiency by reducing the number of servers we rely on and operate. This is an IT best practice for backup and recovery and it will improve data protection, systems performance, reduce down time when systems fail. This will provide us with a disk‐based storage solution which will help us to improve our data protection process in many ways. It will replace much of the aging hardware by allowing us to consolidate its systems into a virtual infrastructure running either Hyper‐V or Vmware. Although it will not eliminate tape reliance, but it will reduce our reliance on tape which will increase backup performance, reliability and restoration if necessary.
Project JustificationJustification for Storage/virtualization is that the current inventory of the City's main server farm of Servers is at or exceeding the 5 year life span of Server machines. This icludes replacing current servers at City Hall and the Police Department server locations with nine virtualized based machines. This is an effort to reduce the footprint of individual servers by logical grouping in an effort to decrease server hardware reliance, improve reliability, redundancy and scalability of applications and data, ease the A/C demands in the data center, therefore improve energy efficiency, improve operational efficiency (ability to add servers and applications on the fly), increase the density of the virtual environment, increase "Up Time" for critical applications. This will decrease tape reliance, improve/decrease backup windows, improve reliability, improve the speed and ease of restores, replicate off site.
Est Total Cost
5 Year Cost Summary
Planning Land Construction Equipment
$260,000
Funding Source
Other Funding Source Description
Operating Budget Impact
Information Technology
Information Technology
Division
Classification
ID 141596
Project Description
Request Year 2016
Other FundingRequestedFundingYear
City Mgr Recommended Funding Type
$65,0002015 $65,000$65,0002016 $65,000 Capital
$75,0002017
$55,0002018
2019
2020
$260,000Total $130,000
34

Project Title
Roof Deck at Spring Street Parking Garage
This project includes the removal of existing pavement, repavings, and applying a waterproofing membrane. During the process repairing any concrete damage will be completed as well.
Project JustificationThe existing pavement and waterprooofing membrane on the roof are 19 years old. Water leaks through the deck causing rusting of rebar and spalling of the concrete which weaken the stucture of the deck. Delaying the project will result in further damage to the structure and added cost.
Est Total Cost
5 Year Cost Summary
Planning Land Construction
$1,100,000
Equipment
Funding Source
Other Funding Source Description
Operating Budget Impact
Parking / Garages
Spring Street Garage
Facilities
Division
Classification
ID 141282
Project Description
Request Year 2016
Other FundingRequestedFundingYear
City Mgr Recommended Funding Type
$1,100,0002016 $500,000 Borrowed2017
2018
2019
2020
$1,100,000Total $500,000
35

Project Title
Waterproof Decking Recoat at Temple Street Parking Garage
This project is to recoat the Temple Street Garage with a waterproof membrane
Project JustificationThe existing coating has begun to fail as noted in the condition appraisal
Est Total Cost
5 Year Cost Summary
Planning Land Construction
$305,000
Equipment
Funding Source
Other Funding Source Description
Operating Budget Impact
Parking / Garages
Temple Street Garage
Facilities
Division
Classification
ID 141287
Project Description
Request Year 2016
Other FundingRequestedFundingYear
City Mgr Recommended Funding Type
$305,0002016 $305,000 Borrowed2017
2018
2019
2020
$305,000Total $305,000
36

Project Title
Ticket Dispensers at Spring Street Parking Garage
The project is to replace ticket dispensers with new dispensers
Project JustificationThe existing ticket dispensers will be over 15 years old in 2016 and nearing the end of their useful life when this request is funded
Est Total Cost
5 Year Cost Summary
Planning Land Construction Equipment
$45,000
Funding Source
Other Funding Source Description
Operating Budget Impact
Parking / Garages
Spring Street Garage
Stationary Equipment
Division
Classification
ID 141288
Project Description
Request Year 2016
Other FundingRequestedFundingYear
City Mgr Recommended Funding Type
$45,0002016 $45,000 Capital2017
2018
2019
2020
$45,000Total $45,000
37

Project Title
Ticket Dispenser at Elm Street Parking Garage
The project is to replace the existing ticket dispensers with new ticket dispensers.
Project JustificationThe existing ticket dispenser will be over 15 years old in 2016 and near the end of their useful life when this request is funded.
Est Total Cost
5 Year Cost Summary
Planning Land Construction Equipment
$15,000
Funding Source
Other Funding Source Description
Operating Budget Impact
Parking / Garages
Elm Street Garage
Stationary Equipment
Division
Classification
ID 141289
Project Description
Request Year 2016
Other FundingRequestedFundingYear
City Mgr Recommended Funding Type
$15,0002016 $15,000 Capital2017
2018
2019
2020
$15,000Total $15,000
38

Project Title/DescLibrary Roof Replacement
Project Justification
Operating Budget Impact
5 Year Cost SummaryPlanning Land Construction Equipment Est Total Cost
$25,000 $25,000
Funding SourceYear Other Funding Requested
2016 $0 $25,0002017201820192020
The flat roof over mechanical room 203 is an original roof from the 1979 project and needs to be replaced. In heavy rains the water pools on the roof and leaks through seams along the edges, flooding ceilings on the main level. Attempts to repair the leaks have been marginally successful and are temporary.
Replacement of the roof will eliminate maintenance labor and materials being used to continually replace ceiling tiles, and continuing efforts to patch the leak. It will also stop the need to close off areas of the children's room due to leaks.
39

Project Title
Paving Preservation and Rehabilitation
Preservation and rehab including combination of treatments ranging from crack sealing and preservation overlays to milling and resurfacing thoughout the city. Scope of work also includes improvements to storm and santitary structures, installation/improvement to handicap access, and other existing infrastructure. A reinventory the pavement conditions city‐wide was completed in late fall of 2014 and results from that are being processed for an updated status.
Project JustificationOur recent streets inventory conduded that nearly 31% of the City's roadways are in poor to failed condition. The cost to maintain a road in this condition will be four to six times higher than a road that is in good or better condition. We need to maintain the roads that are in good condition while providing upgrades to those in poor condition. Maintaining an adequate roadway system is essential to support transportation including vehicular, transit, pedestrian, and bicycle traffic throughout the city.
Keeping more streets in a good condition greatly reduces the annual maintenance costs city wide and also reduces hours needed to address concerns from residents/business regarding poor street condition.
Est Total Cost
5 Year Cost Summary
Planning Land Construction
$26,750,000
Equipment
Funding Source
Other Funding Source Description
Operating Budget Impact
Public Services
Engineering
Streets
Division
Classification
ID 141013
Project Description
Request Year 2016
Other FundingRequestedFundingYear
City Mgr Recommended Funding Type
$4,000,0002013 $2,500,000$4,000,0002014 $2,500,000
$4,000,0002015 $1,750,000
$4,000,0002016 $1,000,000 Borrowed
$4,000,0002017
$4,000,0002018$4,000,0002019
$4,000,0002020
$32,000,000Total $7,750,000
40
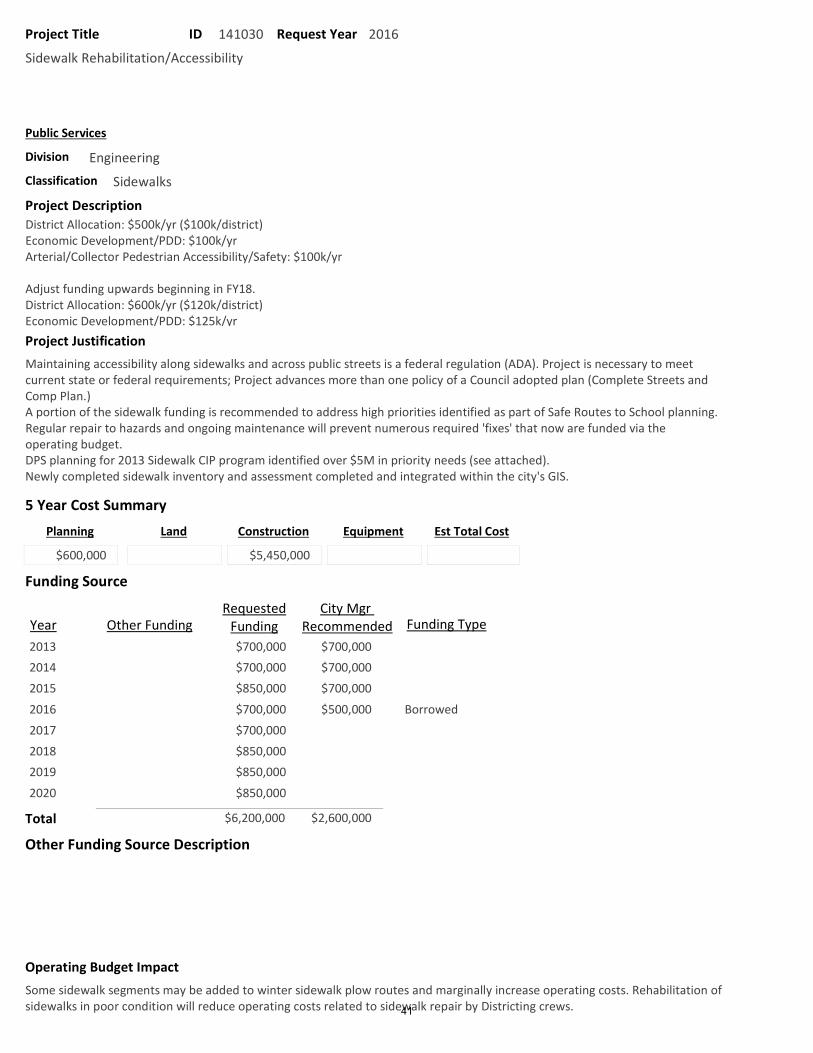
Project Title
Sidewalk Rehabilitation/Accessibility
District Allocation: $500k/yr ($100k/district)Economic Development/PDD: $100k/yrArterial/Collector Pedestrian Accessibility/Safety: $100k/yr
Adjust funding upwards beginning in FY18.District Allocation: $600k/yr ($120k/district)Economic Development/PDD: $125k/yrProject JustificationMaintaining accessibility along sidewalks and across public streets is a federal regulation (ADA). Project is necessary to meet current state or federal requirements; Project advances more than one policy of a Council adopted plan (Complete Streets and Comp Plan.)A portion of the sidewalk funding is recommended to address high priorities identified as part of Safe Routes to School planning.Regular repair to hazards and ongoing maintenance will prevent numerous required 'fixes' that now are funded via the operating budget. DPS planning for 2013 Sidewalk CIP program identified over $5M in priority needs (see attached).Newly completed sidewalk inventory and assessment completed and integrated within the city's GIS.
Est Total Cost
5 Year Cost Summary
Planning
$600,000
Land Construction
$5,450,000
Equipment
Funding Source
Other Funding Source Description
Operating Budget ImpactSome sidewalk segments may be added to winter sidewalk plow routes and marginally increase operating costs. Rehabilitation of sidewalks in poor condition will reduce operating costs related to sidewalk repair by Districting crews.
Public Services
Engineering
Sidewalks
Division
Classification
ID 141030
Project Description
Request Year 2016
Other FundingRequestedFundingYear
City Mgr Recommended Funding Type
$700,0002013 $700,000$700,0002014 $700,000
$850,0002015 $700,000
$700,0002016 $500,000 Borrowed
$700,0002017
$850,0002018$850,0002019
$850,0002020
$6,200,000Total $2,600,000
41

Project Title
Western Promenade Walkways
Completes the reconstruction of the walkways on Western Promenade.
Project JustificationThe walks in this park are in very poor condition and needs to be repaired for public safety purposes.
Est Total Cost
5 Year Cost Summary
Planning Land Construction
$51,000
Equipment
Funding Source
Other Funding Source Description
Operating Budget ImpactThe Department has receiced regular complaints over the condition of the walkways within the Western Prom park area. This project would provide funding for the design and construction of those improvements following historic preservation guidelines
Public Services
Administration
Parks, Fields, Trails
Division
Classification
ID 141714
Project Description
Request Year 2016
Other FundingRequestedFundingYear
City Mgr Recommended Funding Type
$51,0002016 $51,000 Capital2017
2018
2019
2020
$51,000Total $51,000
42

Project Title
PACTS Regional Transportation Management Systems (RTMS) ‐ Traffic Signals
Local support to augment PACTS UPWP funding for regional transportation system upgrades. Includes money for new equipment and especially improved communications. Anticipate requiring approximately $100,000 to $175,000 per year, which includes PACTS funding. In FY16 a PACTS 16‐18 TIP application for work on Congress Street was awarded for a total of $330,000, of which the City will provide a $82,500 match.
The FY16 funding request is for component and communications upgrades for the intersections of Congress/India, Congress/Washington, and Washington/Cumberland. The equipement is generally out of date, and in same cases, begun to Project JustificationThe City of Portland has partnered with PACTS, as well as the Cities of Westbrook, South Portland, Biddford, Saco and the Town of Scarborough to oversee the deployment of transportation management systems for the more efficient flow of traffic and improved detection for all modes along the City's major travel corridors. Work to date has included upgrades along Riverside Street, Brighton Avenue and Forest Avenue, and expected in 2015, portions of Washington Avenue and Auburn Street.
Significant work remains to be done along Congress Street on the downtown peninsula, Forest Avenue in the Parkside area, as well as portions of Washington Avenue, Cumberland Avenue, and State and High streets. One of the top priorities will be to provide improved fiber‐optic connections so that up‐to‐date communications can be achieved at Traffic Operations (currently
Est Total Cost
5 Year Cost Summary
Planning
$150,000
Land Construction Equipment
$1,173,770
Funding Source
Other Funding Source Description
Operating Budget ImpactThis funding will help to supplement the limited money from PACTS and MaineDOT for RTMS upgrades, as well as reducing the strain on the capital available for City signal equipment.
$22,000 annually. Other funding source is anticipated PACTS RTMS funding via UPWP Program, as discussed with Carl Eppich of PACTS on November 19, 2012. FY16 reflects an additional $247,500 that has been awarded in the PACTS 16‐18 TIP, requiring $82,500 in Local Match.
Public Services
Traffic
Stationary Equipment
Division
Classification
ID 141740
Project Description
Request Year 2016
Other FundingRequestedFundingYear
City Mgr Recommended Funding Type
$22,000 $78,0002014 $80,000$22,000 $167,0002015 $165,000
$269,500 $277,2702016 $100,000 Borrowed
$22,000 $100,0002017
$22,000 $100,0002018
$22,000 $100,0002019$22,000 $100,0002020
$401,500 $922,270Total $345,000
43

Project Title
MaineDOT Arterial Paving Riverside St (Brighton Av to Home Depot entrance) ‐ ineligibles/system upgrades
FY16 "Other Funding" = MaineDOT Arterial paving project currently proposed for 2016.
Project JustificationProject costs are covered by MaineDOT arterial paving program; City pays only for Utility system repairs/adjustments and items outside the project scope (see attachment for estimates). Resurfacing will eliminate the need for local paving and provide upgrades to the City's infrastructure.
Est Total Cost
5 Year Cost Summary
Planning Land Construction
$650,000
Equipment
Funding Source
Other Funding Source Description
Operating Budget ImpactResurfacing will reduce operating costs for summer and winter maintenance of pavement.
Resurfacing funds provided by MaineDOT Arterial paving program.
Public Services
Engineering
Streets
Division
Classification
ID 152406
Project Description
Request Year 2016
Other FundingRequestedFundingYear
City Mgr Recommended Funding Type
$500,000 $150,0002016 $50,000 Borrowed2017
2018
2019
2020
$500,000 $150,000Total $50,000
44
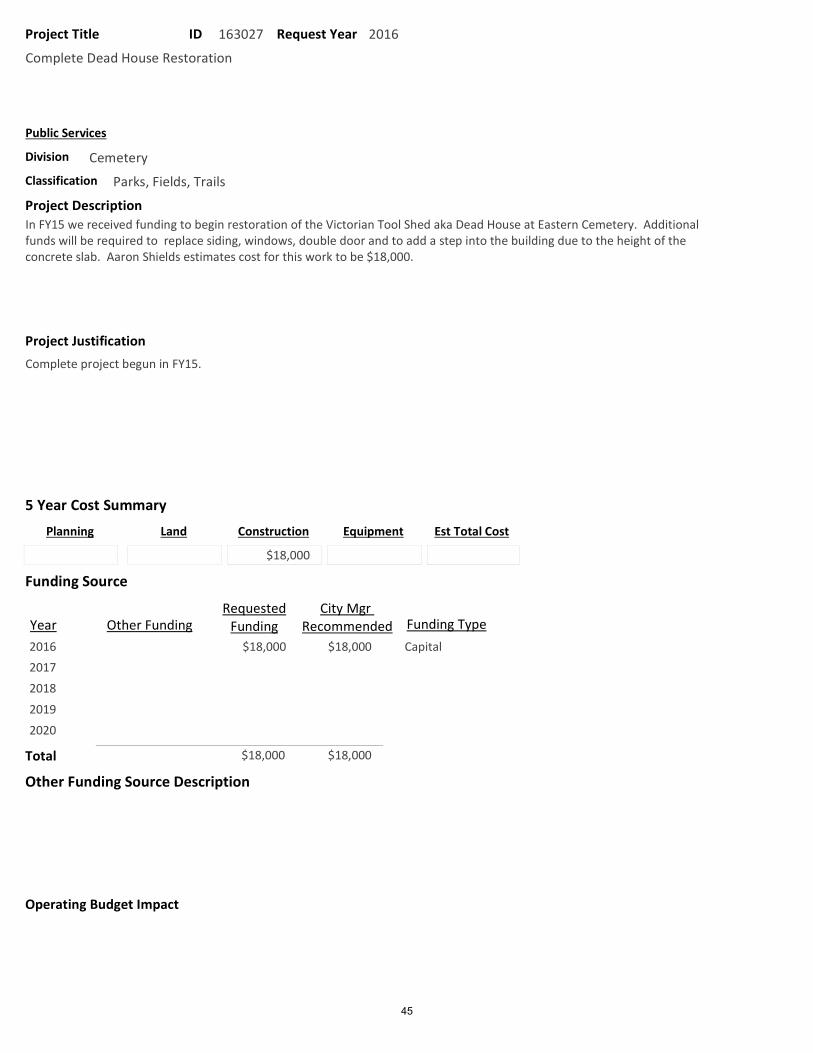
Project Title
Complete Dead House Restoration
In FY15 we received funding to begin restoration of the Victorian Tool Shed aka Dead House at Eastern Cemetery. Additional funds will be required to replace siding, windows, double door and to add a step into the building due to the height of the concrete slab. Aaron Shields estimates cost for this work to be $18,000.
Project JustificationComplete project begun in FY15.
Est Total Cost
5 Year Cost Summary
Planning Land Construction
$18,000
Equipment
Funding Source
Other Funding Source Description
Operating Budget Impact
Public Services
Cemetery
Parks, Fields, Trails
Division
Classification
ID 163027
Project Description
Request Year 2016
Other FundingRequestedFundingYear
City Mgr Recommended Funding Type
$18,0002016 $18,000 Capital2017
2018
2019
2020
$18,000Total $18,000
45
Project Title
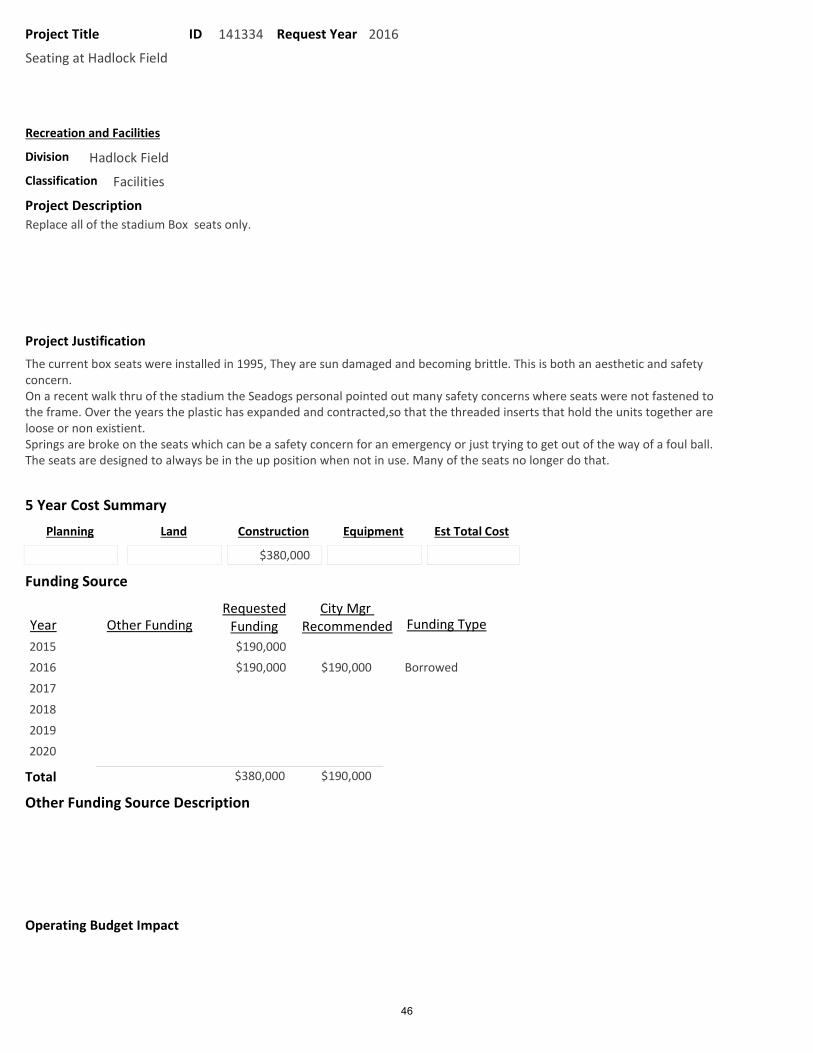
Seating at Hadlock Field
Replace all of the stadium Box seats only.
Project JustificationThe current box seats were installed in 1995, They are sun damaged and becoming brittle. This is both an aesthetic and safety concern.On a recent walk thru of the stadium the Seadogs personal pointed out many safety concerns where seats were not fastened to the frame. Over the years the plastic has expanded and contracted,so that the threaded inserts that hold the units together are loose or non existient. Springs are broke on the seats which can be a safety concern for an emergency or just trying to get out of the way of a foul ball.The seats are designed to always be in the up position when not in use. Many of the seats no longer do that.
Est Total Cost
5 Year Cost Summary
Planning Land Construction
$380,000
Equipment
Funding Source
Other Funding Source Description
Operating Budget Impact
Recreation and Facilities
Hadlock Field
Facilities
Division
Classification
ID 141334
Project Description
Request Year 2016
Other FundingRequestedFundingYear
City Mgr Recommended Funding Type
$190,0002015$190,0002016 $190,000 Borrowed
2017
2018
2019
2020
$380,000Total $190,000
46

Project Title
Passenger Elevator at City Hall
Replace the ropes on the passenger elevator.
Project JustificationThe passenger elevator is approching the time when all of the cables need to be replaced. This is extensive work and would require the passenger elevator to be taken out of service during this process. This process happens rarely and most often the cables can be shortened and extend the life.
Est Total Cost
5 Year Cost Summary
Planning Land Construction Equipment
$100,000
Funding Source
Other Funding Source Description
Operating Budget Impact
Recreation and Facilities
City Hall
Facilities
Division
Classification
ID 141340
Project Description
Request Year 2016
Other FundingRequestedFundingYear
City Mgr Recommended Funding Type
$100,0002016 $100,000 Borrowed2017
2018
2019
2020
$100,000Total $100,000
47

Project Title
Lyman Moore Sports Complex
Renovate old sports complex at Lyman Moore School.
Project JustificationPlan would call for baseball/Softball Fields to moved out to the corners of the complex allowing for more rectangle fields (soccer, football, field hockey etc) . Currently there is no drainage or irrigation making it difficult to maintain healthy turf grass. Old field designs limit use of the large area. Older baseball fields are very uneven and the field hockey field is constantly wet from poor drainage.
Improvements to this facility were recommended by the Athletic Facilities Task Force.
Est Total Cost
5 Year Cost Summary
Planning Land Construction Equipment
$275,000
Funding Source
Other Funding Source Description
Operating Budget Impact
Recreation and Facilities
Athletic Facilities
Parks, Fields, Trails
Division
Classification
ID 141347
Project Description
Request Year 2016
Other FundingRequestedFundingYear
City Mgr Recommended Funding Type
$275,0002016 $275,000 Borrowed2017
2018
2019
2020
$275,000Total $275,000
48

Project Title
Ultra Violet Water Treatment System at Riverton Pool
Installation of an ultra violet light supplemental treatment system for the Riverton Pool.
Project JustificationThe installation of an ultra violet light supplemental treatment system will: Reduce chlorine usage by a reported 2 ppm which lessens the chemical load on the pool and expose to swimmers. Reduce / eliminate chloramines which are an irritant to swimmers and spectators There have been air quality complaints from swimmers during the pools' most intense use
Est Total Cost
5 Year Cost Summary
Planning Land Construction Equipment
$50,000
Funding Source
Other Funding Source Description
Operating Budget ImpactReduce water heating and consumption by performing fewer backwashes of the filtration systemReduce HVAC costs by bringing in less outside air seasonally
Recreation and Facilities
Aquatics
Facilities
Division
Classification
ID 141356
Project Description
Request Year 2016
Other FundingRequestedFundingYear
City Mgr Recommended Funding Type
$50,0002016 $50,000 Borrowed2017
2018
2019
2020
$50,000Total $50,000
49

Project Title
Bleachers at Ice Arena
To remove 30+ year old wooden bleachers and replace with new aluminum structure with plastic bench.
Project JustificationThe current bleachers are 30+ years old. Ample code violations are present and are dangerous. In addition, the support brackets and structure show signs of wear more then half way through. I have contacted Hussy Seating and walked the bleachers. They have provided a cost estimate to repair them for 6890.00. They will guarantee a 5 yr with an annual maintenance contract.
Est Total Cost
5 Year Cost Summary
Planning Land Construction
$100,000
Equipment
Funding Source
Other Funding Source Description
Operating Budget Impact
Recreation and Facilities
Ice Arena
Facilities
Division
Classification
ID 141363
Project Description
Request Year 2016
Other FundingRequestedFundingYear
City Mgr Recommended Funding Type
$100,0002016 $100,000 Borrowed2017
2018
2019
2020
$100,000Total $100,000
50

Project Title
Piles at Portland Ocean Terminal
FY15 Timber survey and structural assessment. Survey approximately 400 piles, chalks whales and cross bracing. Records indicate this was last done 10 years ago.
FY16 BLDG STRUCTURAL ‐ Repair/replace 30 structural timber bents. Replace exterior 6' by 12" stringer and wood decking waterproof and add drip edge.
MSP WOODEN DOCK/ROADWAY ‐ Remove existing rottened timber, repair pile caps, remove railroad track, replace minimum Project JustificationBLDG STRUCTURAL ‐ West side of building bents have rottened and most are salvagable at this time. The outside line of bents/piles carries the exterior wall and is need of repair.
A recent 15 yr lease has been signed with Shucks. Shucks will need to do some additional pile work to support a piece of their equipment. It would make good sense to do this work in conjunction with Shucks. Sink holes within this space is not going to be acceptable.
Est Total Cost
5 Year Cost Summary
Planning
$30,000
Land Construction
$250,000
Equipment
Funding Source
Other Funding Source Description
Operating Budget ImpactThese businesses run 16‐24 hrs daily. Any inconvience to that could be costly to the city.
Recreation and Facilities
Waterfront
Marine (i.e., piers)
Division
Classification
ID 141775
Project Description
Request Year 2016
Other FundingRequestedFundingYear
City Mgr Recommended Funding Type
$280,0002016 $280,000 Borrowed2017
2018
2019
2020
$280,000Total $280,000
51
Project Title
Steel Piles at Ocean Gateway Pier
Steel Pier Maintenance
Project JustificationApprox. 900 piles are in need of grinding and having a coating applied to them. The top 6' of these piles are showing signs of rusting and decay. Maintaining these piles is adament due to their proximity of being located under the pier with no access to replace them.
If these piles fail, the repair would be to drive sheet pile and fill with concrete. I've been told from Tec Assoc this would be in the 5 million dollar range to replace piles with sheet pile.
Est Total Cost
5 Year Cost Summary
Planning Land Construction
$1,500,000
Equipment
Funding Source
Other Funding Source Description
Operating Budget ImpactFuture pile replacement could average 15k each. Future ferry service will use this pier.
Recreation and Facilities
Waterfront
Marine (i.e., piers)
Division
Classification
ID 141788
Project Description
Request Year 2016
Other FundingRequestedFundingYear
City Mgr Recommended Funding Type
$500,0002016 $100,000 Borrowed$500,0002017
$500,0002018
2019
2020
$1,500,000Total $100,000
52

Project Title
Compass Park Pier Stablization
Pier Stabilization
Project JustificationThis pier got renovated approx 25yrs ago. Sway/ cross bracing, wales, chocks piles need replacing. With vehicle traffic on this pier this needs to be considered soon.
Est Total Cost
5 Year Cost Summary
Planning
$30,000
Land Construction
$350,000
Equipment
Funding Source
Other Funding Source Description
Operating Budget Impact
Grant funds are available for the engineering as well as a portion of the construction costs.
Recreation and Facilities
Waterfront
Marine (i.e., piers)
Division
Classification
ID 152328
Project Description
Request Year 2016
Other FundingRequestedFundingYear
City Mgr Recommended Funding Type
$30,0002016 $30,000 Borrowed$350,0002017
2018
2019
2020
$380,000Total $30,000
53
Project Title
Payson Park Softball Field "A" ‐ Amenity and Field Upgrades
The Office of Civil Rights through the U.S. Department of Education found Title IX issues with the field and through a deal with the Portland School System it was decided we need to make upgrades to the field, bleachers, locker rooms, storage and smaller items.
Project JustificationThe City manager agreed to recommend this project for funding as part of an agreement with the Office of Civil Rights. (see attached letter)
Est Total Cost
5 Year Cost Summary
Planning
$10,000
Land Construction
$390,000
Equipment
Funding Source
Other Funding Source Description
Operating Budget Impact
Recreation and Facilities
Athletic Facilities
Parks, Fields, Trails
Division
Classification
ID 152490
Project Description
Request Year 2016
Other FundingRequestedFundingYear
City Mgr Recommended Funding Type
$200,0002015$200,0002016 $200,000 Borrowed
2017
2018
2019
2020
$400,000Total $200,000
54

Project Title
Golf Course Rehabilitiation
Assess current course conditions, engineer improvements, and formulate a 5‐10 year capital improvement plan, to address the need for leveling and relocation of tees, the construction/relocation of forward tees, the leveling of uneven fairways, location of cart paths, and addressing drainage issues.
Project JustificationTees are in their original shape and form and many are uneven. Some tees need to be realigned and new forward tees need to be constructed. The course is built on heavy clay soils and poor drainage has been a significant ongoing issue. Much of the drainage system has failed. Over the years there has been significant heaving with frost/thaw cycle which has created an uneven surface on fairways. Wet conditions impact turf health, and disrupt play and daily maintenance. A significant factor in developing the master plan will be the efficient maintenance of the course.
Est Total Cost
5 Year Cost Summary
Planning
$50,000
Land Construction
$450,000
Equipment
Funding Source
Other Funding Source Description
Operating Budget ImpactImproved drainage will help maintain turf health, which in turn helps minimize the use of water and pesticides. Addressing wet conditions, bumpy fairways and cart path issues should also increase play.
Recreation and Facilities
Golf Course
Parks, Fields, Trails
Division
Classification
ID 152491
Project Description
Request Year 2016
Other FundingRequestedFundingYear
City Mgr Recommended Funding Type
$100,0002016 $100,000 Borrowed$100,0002017
$100,0002018
$100,0002019
$100,0002020
$500,000Total $100,000
55

Project Title
Windows at Deering High School
Replace double hung windows with single hung
Project JustificationCurrent windows have gaps and are unsafe. These widows are large and heavy. There inefficient most have been screwed shut due to them being blown open. The mechanisms that secure them have failed. A double pane single hung window resolves these matters.
Est Total Cost
5 Year Cost Summary
Planning Land Construction
$500,000
Equipment
Funding Source
Other Funding Source Description
Operating Budget ImpactReduces utility costs and injuries.
School Department
School Maintenance
Facilities
Division
Classification
ID 141621
Project Description
Request Year 2016
Other FundingRequestedFundingYear
City Mgr Recommended Funding Type
$500,0002016 $500,000 Borrowed2017
2018
2019
2020
$500,000Total $500,000
56
Project Title
PATHS Paving
Repair roadway and parking lots
Project JustificationRoadway is breaking up, parking lots have many sink holes and tripping hazards
Est Total Cost
5 Year Cost Summary
Planning Land Construction
$500,000
Equipment
Funding Source
Other Funding Source Description
Operating Budget Impact
School Department
School Maintenance
Streets
Division
Classification
ID 152268
Project Description
Request Year 2015
Other FundingRequestedFundingYear
City Mgr Recommended Funding Type
2015$500,0002016 $500,000 Borrowed
2017
2018
2019
$500,000Total $500,000
57

Project Title
Replace Fire Alarm Syatem at Portland High School
The current equipment is no longer being manufactured. A panel failed recently and the only source was ebay. The system is obsolete and must be replaced with equipment that meets building codes.
Project JustificationThis is a Life Safety issue.
Est Total Cost
5 Year Cost Summary
Planning Land Construction Equipment
$150,000
Funding Source
Other Funding Source Description
Operating Budget ImpactNone
School Department
School Maintenance
Facilities
Division
Classification
ID 163137
Project Description
Request Year 2016
Other FundingRequestedFundingYear
City Mgr Recommended Funding Type
$150,0002016 $150,000 Borrowed2017
2018
2019
2020
$150,000Total $150,000
58

Project Title
Remove Oil Tanks at Various School Buildings
There are 8 underground fuel tanks which need to be removed
Project JustificationThe fuel tanks are beyond their State mandated removal date.
Est Total Cost
5 Year Cost Summary
Planning Land Construction
$250,000
Equipment
Funding Source
Other Funding Source Description
Operating Budget ImpactAvoidance of potential fines
School Department
School Maintenance
Facilities
Division
Classification
ID 163138
Project Description
Request Year 2016
Other FundingRequestedFundingYear
City Mgr Recommended Funding Type
$250,0002016 $100,000 Borrowed2017
2018
2019
2020
$250,000Total $100,000
59

Project Title
Stormwater Storage and Filtration Systems at Sagamore Village
Install two underground storage and filtration systems and associated diversion structures in the vicinity of Sagamore Village.
Project JustificationThis project is a recommendation of the Capisic Brook Watershed Management Plan. The two storage and filtration systems would treat stormwater runoff from a drainage area of 42 AC of mainly residential property (housing, lawns, streets, & driveways). The drainage area is about 40% impervious, far exceeding the 11% threshold for a healthy watershed. The Maine Dept of Environmental Protection has determined that Capisic Brook does not meet its designated water quality classification (Class C). The City, under the Clean Water Act, is obligated to take steps to restore water quality in this Urban Impaired Stream (UIS) watershed. The Capisic Brook Watershed Management Plan was funded in large part by the US EPA and Maine DEP to help the City chart a path for restoring water quality in the brook.
Est Total Cost
5 Year Cost Summary
Planning
$120,000
Land Construction
$1,246,060
Equipment
Funding Source
Other Funding Source Description
Operating Budget Impact
Sewer Fund
Stormwater
Wastewater
Division
Classification
ID 141052
Project Description
Request Year 2016
Other FundingRequestedFundingYear
City Mgr Recommended Funding Type
$120,0002016 $120,000 Borrowed$1,246,0602017
2018
2019
2020
$1,366,060Total $120,000
60
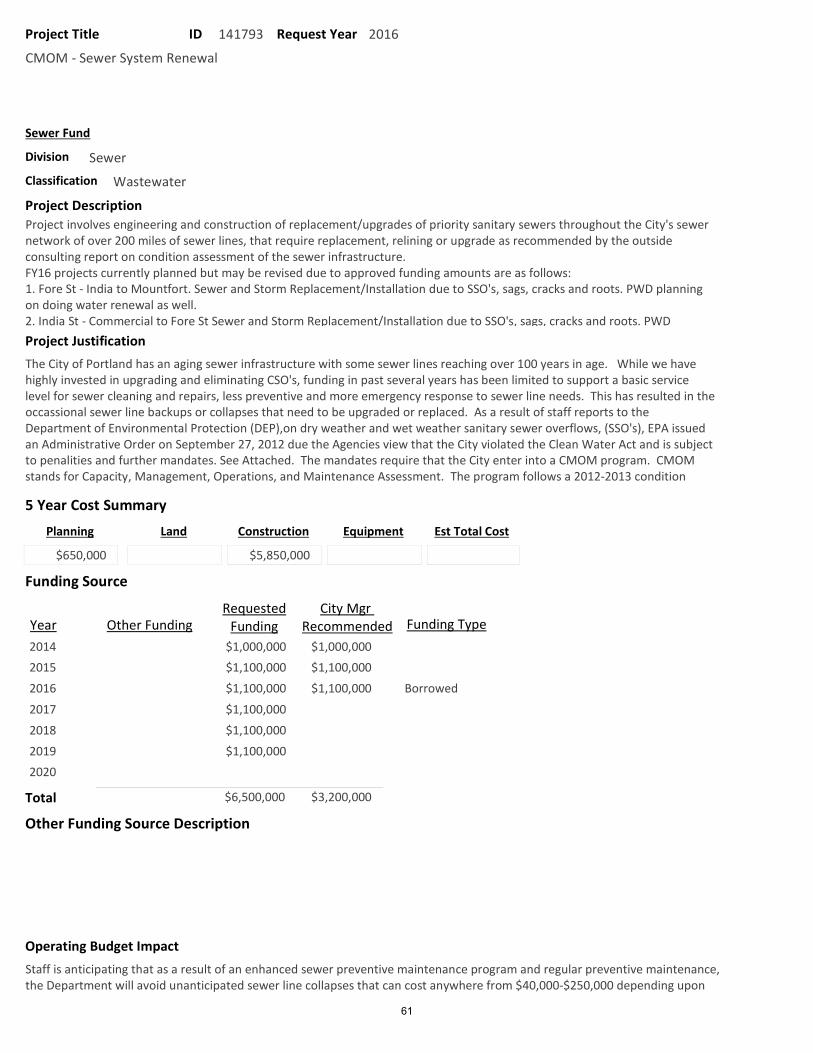
Project Title
CMOM ‐ Sewer System Renewal
Project involves engineering and construction of replacement/upgrades of priority sanitary sewers throughout the City's sewer network of over 200 miles of sewer lines, that require replacement, relining or upgrade as recommended by the outside consulting report on condition assessment of the sewer infrastructure.FY16 projects currently planned but may be revised due to approved funding amounts are as follows:1. Fore St ‐ India to Mountfort. Sewer and Storm Replacement/Installation due to SSO's, sags, cracks and roots. PWD planning on doing water renewal as well.2. India St ‐ Commercial to Fore St Sewer and Storm Replacement/Installation due to SSO's, sags, cracks and roots. PWD Project JustificationThe City of Portland has an aging sewer infrastructure with some sewer lines reaching over 100 years in age. While we have highly invested in upgrading and eliminating CSO's, funding in past several years has been limited to support a basic service level for sewer cleaning and repairs, less preventive and more emergency response to sewer line needs. This has resulted in the occassional sewer line backups or collapses that need to be upgraded or replaced. As a result of staff reports to the Department of Environmental Protection (DEP),on dry weather and wet weather sanitary sewer overflows, (SSO's), EPA issued an Administrative Order on September 27, 2012 due the Agencies view that the City violated the Clean Water Act and is subject to penalities and further mandates. See Attached. The mandates require that the City enter into a CMOM program. CMOM stands for Capacity, Management, Operations, and Maintenance Assessment. The program follows a 2012‐2013 condition
Est Total Cost
5 Year Cost Summary
Planning
$650,000
Land Construction
$5,850,000
Equipment
Funding Source
Other Funding Source Description
Operating Budget ImpactStaff is anticipating that as a result of an enhanced sewer preventive maintenance program and regular preventive maintenance, the Department will avoid unanticipated sewer line collapses that can cost anywhere from $40,000‐$250,000 depending upon
Sewer Fund
Sewer
Wastewater
Division
Classification
ID 141793
Project Description
Request Year 2016
Other FundingRequestedFundingYear
City Mgr Recommended Funding Type
$1,000,0002014 $1,000,000$1,100,0002015 $1,100,000
$1,100,0002016 $1,100,000 Borrowed
$1,100,0002017
$1,100,0002018
$1,100,00020192020
$6,500,000Total $3,200,000
61

Project Title
Neighborhood Stormwater Drainage
The project would involve the design and construction of added storm drainage piping, catch basins and other improvements addressing neighborhood street and property flooding issues. Project funds would be used within public rights of way, and within private property affecting public right of way, where existing drainage systems are inadequate.
Project JustificationThe project funds would address on going complaints about drainage system deficiences within the City's storm drainage system and addresses neighborhood issues that the Department receives request to correct from residents, City Councilors and or staff. The proposed storm water utility program if adopted would fund improvements and system corrections on a sustained basis.
Est Total Cost
5 Year Cost Summary
Planning Land Construction
$1,000,000
Equipment
Funding Source
Other Funding Source Description
Operating Budget Impact
Sewer Fund
Stormwater
Streets
Division
Classification
ID 141794
Project Description
Request Year 2016
Other FundingRequestedFundingYear
City Mgr Recommended Funding Type
$200,0002019$200,0002020
$200,0002016 $200,000 Capital
$200,0002017
$200,0002018
$1,000,000Total $200,000
62

Project Title
Gravel Wetland Stormwater Treatment System in the Capisic Brook Watershed
This project was developed under the Capisic Brook Watershed Management Plan and is designed to provide stormwater treatment and stream flow management for about 48 AC of impervious area within the north tributary catchment area of Capisic Brook. The project would consist of a series of gravel wetland treatment cells adjacent Capisic Brook on undeveloped land just north of Warren Avenue. Gravel wetlands are known to provide exceptional water quality treatment including nutrient (ie.: Nitrogen) removal. The "gravel wetlands park" concept provides the opportunity to create a stormwater treatment system and educational/recreational amenity, since it would be located near exiting open space currently enjoyed by Portland residents and the Portland Trails network. The project is divided into two steps, the first being land acquisition and Project JustificationCapisic Brook does not meet State water quality standards and has been designated as an Urban Impaired Stream. Citing the link between developed land (i.e.: impervious area) and water quality impairment, the State developed an Impervious Cover TMDL for Capisic Brook that sets targets for reducing the impacts of stormwater runoff from developed areas. Under the Clean Water Act the City is required to develop and implement a plan for mitigating the impacts of stormwater runoff and restoring water quality in the brook. The Capisic Brook Watershed Management Plan was approved by the Maine Department of Environmental Protection and adopted by the City in December of 2012. This project, recommended in the Watershed Management Plan, is designed to improve water quality in the brook and manage stream flow in the upper portion of the watershed, which will benefit the entire watershed. Construction of this project, as part of the overall implementation of the
Est Total Cost
5 Year Cost Summary
Planning
$175,000
Land
$1,000,000
Construction
$2,000,000
Equipment
Funding Source
Other Funding Source Description
Operating Budget ImpactAs with all stormwater management systems, once constructed there will be ongoing maintenance requirements and costs.
Sewer Fund
Stormwater
Wastewater
Division
Classification
ID 152329
Project Description
Request Year 2016
Other FundingRequestedFundingYear
City Mgr Recommended Funding Type
$1,000,0002015 $1,000,000$175,0002016 $175,000 Borrowed
$2,000,0002017
2018
2019
2020
$3,175,000Total $1,175,000
63

Project Title
CMOM ‐ Pump Station Rehabilitation
The following projects were recommended to be done in FY16 .Curtis Pump Station EngineeringCurtis Gravity Sewer EngineeringRiverton Replacement with Submersible Pump StationCastine Replacement of Security FenceScata and Hardware UpdatesFlowmeters at Pump StationsProject JustificationRecommendations in the CMOM report which was done by Woodard and Curran.Also from the I & I Study
Est Total Cost
5 Year Cost Summary
Planning
$450,000
Land Construction
$4,010,000
Equipment
Funding Source
Other Funding Source Description
Operating Budget Impact
Sewer Fund
Sewer
Stationary Equipment
Division
Classification
ID 152461
Project Description
Request Year 2016
Other FundingRequestedFundingYear
City Mgr Recommended Funding Type
$682,0002015 $680,000$670,0002016 $670,000 Borrowed
$1,100,0002017
$670,0002018
$670,0002019
$670,0002020
$4,462,000Total $1,350,000
64

Project Title
Wastewater Server
Project involves the purchase of a server to store all NASSCO certified CCTV inspection video footage, images and related reports.In order to achieve compliance, 10 ‐ 20TB of additional server space will be required. To comply with internal policies and be sure that we have a recovery strategy, MIS will need to expand their backup server as well.
Project JustificationCCTV work is a major component of our CMOM program. As part of the March 4, 2014 communication the EPA it was federally mandated that the City, beginning July 1, 2014, perform annual Closed Circuit Television (“CCTV”) assessment of at least 6% of the collection system and manholes using the National Association of Sewer System Companies (“NASSCO”) procedures by NASSCO Pipeline Assessment Certification Program (“PACP”) and Manhole Assessment Certification Program (“MACP”) certified personnel. It also requires that the data be integrated with the City’s CMMS.
Est Total Cost
5 Year Cost Summary
Planning Land Construction Equipment
$50,000
Funding Source
Other Funding Source Description
Operating Budget Impact
Sewer Fund
Sewer
Equipment
Division
Classification
ID 162997
Project Description
Request Year 2016
Other FundingRequestedFundingYear
City Mgr Recommended Funding Type
$50,0002016 $50,000 Capital2017
2018
2019
2020
$50,000Total $50,000
65

Project Title
Water Resource Relocation
Relocate the water resource division and equipment from 55 Portland Street.
Project JustificationThe water resource division currently does not have enough space to house all of the personel, equipment, and materials necessary to perform their duties when located at 55 Portland Street. Currently the equipment and materials are scattered at differenent locations throughout the city and not in one central location. This creates loss of time for transportation to and from office and job sites. The division will also be acquiring additional personel and equipment within the next year with little space to put them. The equipment needs to be located in an enclosed and covered secure location. Current availablity at 55 Portland Street does not allow this.
Est Total Cost
5 Year Cost Summary
Planning
$250,000
Land Construction Equipment
Funding Source
Other Funding Source Description
Operating Budget Impact
Sewer Fund
Sewer
Facilities
Division
Classification
ID 163053
Project Description
Request Year 2016
Other FundingRequestedFundingYear
City Mgr Recommended Funding Type
$250,0002016 $250,000 Borrowed2017
2018
2019
2020
$250,000Total $250,000
66

Project Title
Rowe Avenue Sewer Separation
Currently Rowe Avenue is a combined sewer system. This project will install a separated storm system to remove a wetland and street water which currently drains into the sewer system. The exiting sewer system is under capicity and has a CSO associated with it.
Project JustificationDPS has identified a private wetland directly upstream of CSO 39 (Rowe Street). As there is only a combined sewer in the area the wetland has an immediate impact to the downstream CSO . In 2014 this CSO accounted for 3.09% of the city total (5.94 million gallons). This CSO does not fall under the Tier III CSO efforts and DPS feels it would have an immediate mitigation to the volumes experienced at this location.
Est Total Cost
5 Year Cost Summary
Planning Land Construction
$210,000
Equipment
Funding Source
Other Funding Source Description
Operating Budget Impact
Sewer Fund
Sewer
Wastewater
Division
Classification
ID 163054
Project Description
Request Year 2016
Other FundingRequestedFundingYear
City Mgr Recommended Funding Type
$210,0002016 $210,000 Borrowed2017
2018
2019
2020
$210,000Total $210,000
67

Project Title
Greenleaf Street Stormwater Facilities
The objective of the project is to build a new storm drain system, including green infrastructure, in Greenleaf Street between Everett Street and Madison Street. The new storm drain system would be built in conjunction with a street reconstruction project, which might be funded from other sources (CDBG Program application submitted).
Project JustificationGreenleaf Street between Everett Street and Madison Street has been closed to through vehicular traffic. This block of Greenleaf Street has been essentially abandoned as a City Street. The public infrastructure in this block has deteriorated, and the street has become an eyesore. The project application to reconstruct Greenleaf Street stems from an initiative by neighborhood residents and the East Bayside Neighborhood Organization, which seek to rebuild the street and convert it into an attractive public space that enhances the neighborhood. This block of Greenleaf currently has no stormwater drainage facilities. The new stormwater drainage facilities will be required as part of the reconstruction project to meet current street standards. Current City policies encourage the use of green infrastructure.
Est Total Cost
5 Year Cost Summary
Planning Land Construction
$303,000
Equipment
Funding Source
Other Funding Source Description
Operating Budget Impact
$218,000 are being sought through a CDBG fund request submitted in November 2014. Work by City staff on the project would be funded through the operating budget; the estimated value of this work is $46,000.
Sewer Fund
Stormwater
Wastewater
Division
Classification
ID 163129
Project Description
Request Year 2016
Other FundingRequestedFundingYear
City Mgr Recommended Funding Type
$218,000 $85,0002016 $85,000 Capital2017
2018
2019
2020
$218,000 $85,000Total $85,000
68

Project Title
Bucket Truck Replacement ‐ Forestry 5098
Bucket truck for Forestry
Project JustificationCurrent unit is a model year 1998 and is used for tree trimming and removal by Forestry. Safe operation of the bucket truck is imperative and a new unit should be purchased to replace this aging unit. A new unit will decrease down time and maintenance costs.
Est Total Cost
5 Year Cost Summary
Planning Land Construction Equipment
$220,000
Funding Source
Other Funding Source Description
Operating Budget ImpactCost EstimateAltec aerial truck ‐ $205,000
Vehicle Maintenance
Public Services
Vehicles
Division
Classification
ID 14988
Project Description
Request Year 2016
Other FundingRequestedFundingYear
City Mgr Recommended Funding Type
$220,0002016 $220,000 Borrowed2017
2018
2019
2020
$220,000Total $220,000
69

Project Title
Street Sweepers Replacement
Must replace 1 street sweeper per year to maintain the fleet
Project Justificationscheduled replacements
Est Total Cost
5 Year Cost Summary
Planning Land Construction Equipment
$1,275,000
Funding Source
Other Funding Source Description
Operating Budget ImpactDecreased maintenance costs
Vehicle Maintenance
Sewer Fund
Vehicles
Division
Classification
ID 141056
Project Description
Request Year 2016
Other FundingRequestedFundingYear
City Mgr Recommended Funding Type
$175,0002015 $175,000$175,0002016 $175,000 Borrowed
$175,0002017
$235,0002018
$175,0002019
$165,0002014 $165,000$175,0002020
$1,275,000Total $515,000
70

Project Title
Dump Truck Replacement ‐ Sewer 3110
Single axle, 6 yard dump with plow, sander, and calcium system
Project JustificationCurrent unit is a model year 2000. A new unit will decrease down time and maintenance cost.
Est Total Cost
5 Year Cost Summary
Planning Land Construction Equipment
$165,000
Funding Source
Other Funding Source Description
Operating Budget ImpactCost Estimate ‐ based on prior purchase of comperable dump truck
Vehicle Maintenance
Sewer Fund
Vehicles
Division
Classification
ID 141064
Project Description
Request Year 2016
Other FundingRequestedFundingYear
City Mgr Recommended Funding Type
$165,0002016 $165,000 Borrowed2017
2018
2019
2020
$165,000Total $165,000
71

Project Title
Ladder 1 Replacement ‐ Fire
Replace Ladder 1 vehicle which is a 1993 Pierce articulating boom.
Project JustificationThis is scheduled replacement of a 1993 vehicle. Vehicle is within range of 20year replacement and maintenancce issues continue with an aging hydraulic system. This vehicle is an aerial device and requires dependability for firefighter and civilian safety.
Est Total Cost
5 Year Cost Summary
Planning Land Construction Equipment
$1,300,000
Funding Source
Other Funding Source Description
Operating Budget Impact
Vehicle Maintenance
Fire Department
Vehicles
Division
Classification
ID 141106
Project Description
Request Year 2016
Other FundingRequestedFundingYear
City Mgr Recommended Funding Type
$1,300,0002016 $1,300,000 Borrowed2017
2018
2019
2020
$1,300,000Total $1,300,000
72
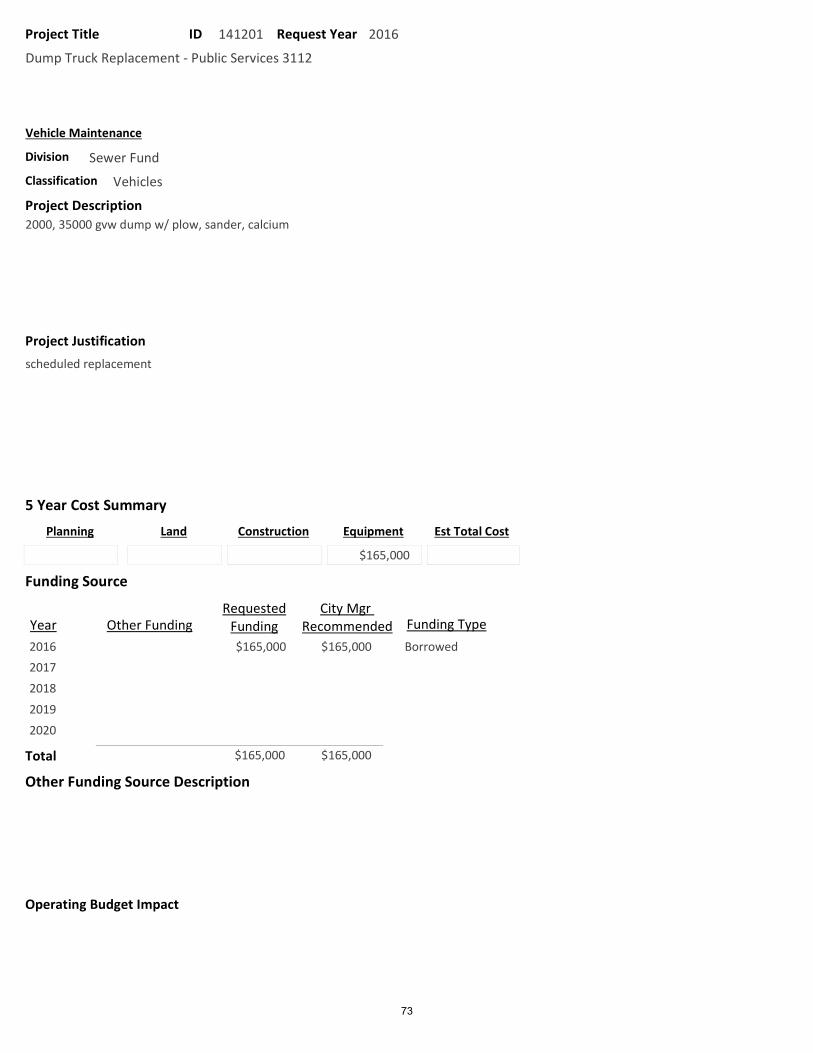
Project Title
Dump Truck Replacement ‐ Public Services 3112
2000, 35000 gvw dump w/ plow, sander, calcium
Project Justificationscheduled replacement
Est Total Cost
5 Year Cost Summary
Planning Land Construction Equipment
$165,000
Funding Source
Other Funding Source Description
Operating Budget Impact
Vehicle Maintenance
Sewer Fund
Vehicles
Division
Classification
ID 141201
Project Description
Request Year 2016
Other FundingRequestedFundingYear
City Mgr Recommended Funding Type
$165,0002016 $165,000 Borrowed2017
2018
2019
2020
$165,000Total $165,000
73

Project Title
3/4 Ton Extended Cab Pickup Replacement ‐ Sewer 2513
2006 3/4 ton pickup / sewer maintenance supervisor
Project Justificationscheduled replacement
Est Total Cost
5 Year Cost Summary
Planning Land Construction Equipment
$38,000
Funding Source
Other Funding Source Description
Operating Budget Impact
Vehicle Maintenance
Sewer Fund
Vehicles
Division
Classification
ID 141257
Project Description
Request Year 2016
Other FundingRequestedFundingYear
City Mgr Recommended Funding Type
$38,0002016 $38,000 Capital2017
2018
2019
2020
$38,000Total $38,000
74

Project Title
Medcu Ambulance Replacement ‐ Fire
Replace Medcu
Project JustificationCost Estimate:GM4500 Van and Box ‐ $215,000Battery upgrade ‐ $500IPD suspension ‐ $1,500Inverter Alarm ‐ $500Radio Equip ‐ $23,500Headsets ‐ $2,000Stretcher ‐ $14,000
Est Total Cost
5 Year Cost Summary
Planning Land Construction Equipment
$2,305,000
Funding Source
Other Funding Source Description
Operating Budget Impact
Vehicle Maintenance
Fire Department
Vehicles
Division
Classification
ID 141803
Project Description
Request Year 2016
Other FundingRequestedFundingYear
City Mgr Recommended Funding Type
$225,0002013 $225,000$225,0002014 $225,000
$265,0002015 $265,000
$265,0002016 $265,000 Borrowed
$265,0002017
$530,0002018$265,0002019
$265,0002020
$2,305,000Total $980,000
75

Project Title
Police Cruisers (7) Replacement ‐ Police
Yearly replacement of 7 marked police cruisers @$38,000 each ($25,000 each plus upfit of $7,000 and Watchguard unit of $6,000). Note that Toughbook for each vehicle is not included in the upfit price.
Project JustificationDPW recommends yearly replacement of 7 marked police cruisers. DPW goal is to have no vehicle in fleet > 100K miles. Vehicles with higher mileage require costly DPW repairs in order to stay in service. Older patrol vehicles under 100K miles will continue to be recycled as spares or rolled into CID fleet. By using 100K miles as a disposal guideline, City will recognize increased sales/trade‐in of inventory vehicles. Watchguard units will need to be replaced throughout the vehicle cycle until all old units are transitioned out. Separate CIP funding request for entire Watchguard system would remove that piece from the vehicle upfit costs.
Est Total Cost
5 Year Cost Summary
Planning Land Construction Equipment
$1,860,000
Funding Source
Other Funding Source Description
Operating Budget ImpactReduced fuel consumption by replacing 8 cylinder Crown Victoria with 6 cylinder Ford Police Interceptor
Vehicle Maintenance
Police Department
Vehicles
Division
Classification
ID 141804
Project Description
Request Year 2016
Other FundingRequestedFundingYear
City Mgr Recommended Funding Type
$266,0002014 $265,000$266,0002015 $265,000
$266,0002016 $160,000 Borrowed
$266,0002017
$266,0002018
$266,0002019$266,0002020
$1,862,000Total $690,000
76

Project Title
Add CCTV Truck
Water Resources is proposing the purchase of a production oriented closed circuit television truck which will have digital side scan technology and software in order to do Pipe and MH Assessment Certification rating.
Project JustificationIn response to our recent EPA Compliance Directive, Water Resources is proposing the purchase of a production oriented closed circuit television truck. Beginning in the current fiscal year, Water Resources will be required to televise 6% of Portland’s combined and sanitary sewage systems. All of the televised footage will require NASCCO rating before uploading into our Cityworks CMMS system. Unlike our existing camera unit, the new CCTV unit will incorporate digital side scan technology to provide clear and concise imagery of our underground infrastructure. Once field TV data is collected it will be post processed such that each televised pipe segment will be rated to NASSCO PACP (Pipe Assessment Certification Program) standards and uploaded to our CMMS system as required by our EPA Compliance Directive. TV truck operations staff will be trained and certified to apply NASSCO standards to all of our televised infrastructure. The new CCTV truck will also have the capability to
Est Total Cost
5 Year Cost Summary
Planning Land Construction Equipment
$415,000
Funding Source
Other Funding Source Description
Operating Budget Impact
Vehicle Maintenance
Sewer Fund
Vehicle ‐ New (Not Replacement)
Division
Classification
ID 162999
Project Description
Request Year 2016
Other FundingRequestedFundingYear
City Mgr Recommended Funding Type
$415,0002016 $415,000 Borrowed2017
2018
2019
2020
$415,000Total $415,000
77