fy16 financial results - care’s ratings ratings... · forward-looking statements are not...
TRANSCRIPT
FY16 Financial Results
D. R. Dogra
MD & CEO
FY16 Results 27th May 2016
SAFE HARBOR STATEMENT
2
THIS PRESENTATION AND THE ACCOMPANYING SLIDES (THE “PRESENTATION”), WHICH HAVE BEEN PREPARED BY CREDIT ANALYSIS &
RESEARCH LIMITED (THE “COMPANY”), HAVE BEEN PREPARED SOLELY FOR INFORMATION PURPOSES AND DO NOT CONSTITUTE ANY
OFFER, RECOMMENDATION OR INVITATION TO PURCHASE OR SUBSCRIBE FOR ANY SECURITIES, AND SHALL NOT FORM THE BASIS OR
BE RELIED ON IN CONNECTION WITH ANY CONTRACT OR BINDING COMMITMENT WHATSOEVER. NO OFFERING OF SECURITIES OF
THE COMPANY WILL BE MADE EXCEPT BY MEANS OF A STATUTORY OFFERING DOCUMENT CONTAINING DETAILED INFORMATION
ABOUT THE COMPANY.
THIS PRESENTATION HAS BEEN PREPARED BY THE COMPANY BASED ON INFORMATION AND DATA WHICH THE COMPANY CONSIDERS
RELIABLE, BUT THE COMPANY MAKES NO REPRESENTATION OR WARRANTY, EXPRESS OR IMPLIED, WHATSOEVER, AND NO RELIANCE
SHALL BE PLACED ON, THE TRUTH, ACCURACY, COMPLETENESS, FAIRNESS AND REASONABLENESS OF THE CONTENTS OF THIS
PRESENTATION. THIS PRESENTATION MAY NOT BE ALL INCLUSIVE AND MAY NOT CONTAIN ALL OF THE INFORMATION THAT YOU MAY
CONSIDER MATERIAL. ANY LIABILITY IN RESPECT OF THE CONTENTS OF, OR ANY OMISSION FROM, THIS PRESENTATION IS EXPRESSLY
EXCLUDED.
CERTAIN MATTERS DISCUSSED IN THIS PRESENTATION MAY CONTAIN STATEMENTS REGARDING THE COMPANY’S MARKET
OPPORTUNITY AND BUSINESS PROSPECTS THAT ARE INDIVIDUALLY AND COLLECTIVELY FORWARD-LOOKING STATEMENTS. SUCH
FORWARD-LOOKING STATEMENTS ARE NOT GUARANTEES OF FUTURE PERFORMANCE AND ARE SUBJECT TO KNOWN AND UNKNOWN
RISKS, UNCERTAINTIES AND ASSUMPTIONS THAT ARE DIFFICULT TO PREDICT. THESE RISKS AND UNCERTAINTIES INCLUDE, BUT ARE
NOT LIMITED TO, THE PERFORMANCE OF THE INDIAN ECONOMY AND OF THE ECONOMIES OF VARIOUS INTERNATIONAL MARKETS,
THE PERFORMANCE OF THE RATING INDUSTRY IN INDIA AND WORLD-WIDE, COMPETITION, THE COMPANY’S ABILITY TO
SUCCESSFULLY IMPLEMENT ITS STRATEGY, THE COMPANY’S FUTURE LEVELS OF GROWTH AND EXPANSION, TECHNOLOGICAL
IMPLEMENTATION, CHANGES AND ADVANCEMENTS, CHANGES IN REVENUE, INCOME OR CASH FLOWS, THE COMPANY’S MARKET
PREFERENCES AND ITS EXPOSURE TO MARKET RISKS, AS WELL AS OTHER RISKS. THE COMPANY’S ACTUAL RESULTS, LEVELS OF
ACTIVITY, PERFORMANCE OR ACHIEVEMENTS COULD DIFFER MATERIALLY AND ADVERSELY FROM RESULTS EXPRESSED IN OR IMPLIED
BY THIS PRESENTATION. THE COMPANY ASSUMES NO OBLIGATION TO UPDATE ANY FORWARD-LOOKING INFORMATION CONTAINED
IN THIS PRESENTATION. ANY FORWARD-LOOKING STATEMENTS AND PROJECTIONS MADE BY THIRD PARTIES INCLUDED IN THIS
PRESENTATION ARE NOT ADOPTED BY THE COMPANY AND THE COMPANY IS NOT RESPONSIBLE FOR SUCH THIRD PARTY STATEMENTS
AND PROJECTIONS.

FY16 Results 27th May 2016
Contents
Highlights
Financial & Business Performance
MCR / CDQI
New Developments
Economic Backdrop
3
FY16 Results 27th May 2016
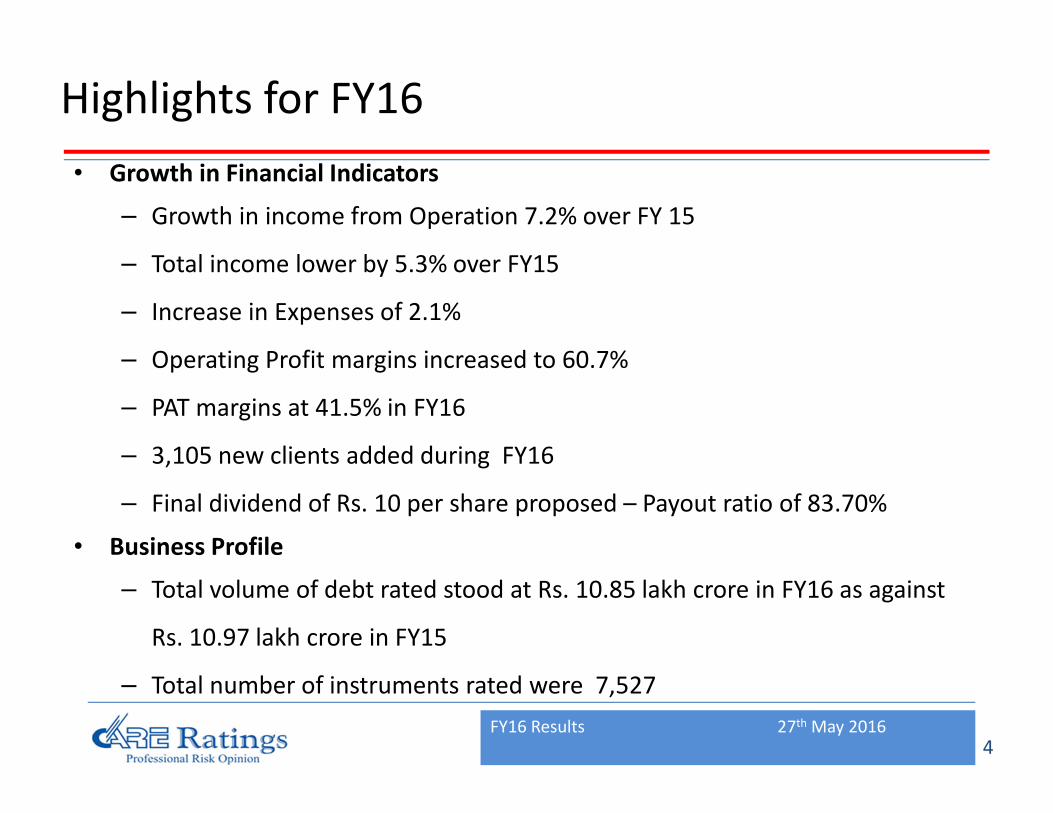
Highlights for FY16
• Growth in Financial Indicators
– Growth in income from Operation 7.2% over FY 15
– Total income lower by 5.3% over FY15
– Increase in Expenses of 2.1%
– Operating Profit margins increased to 60.7%
– PAT margins at 41.5% in FY16
– 3,105 new clients added during FY16
– Final dividend of Rs. 10 per share proposed – Payout ratio of 83.70%
• Business Profile
– Total volume of debt rated stood at Rs. 10.85 lakh crore in FY16 as against
Rs. 10.97 lakh crore in FY15
– Total number of instruments rated were 7,527
4

FY16 Results 27th May 2016
Contents
Highlights
Financial & Business Performance
MCR / CDQI
New Developments
Economic Backdrop
5

FY16 Results 27th May 2016
Financial Performance – Consolidated Accounts
Rs crore FY15 FY16 Growth
Total income from Ops 260.55 279.37 7.22%
Other income 43.69 8.69 -80.11%
Total income 304.24 288.06 -5.32%
Total Expenses 107.38 109.66 2.13%
Operating profit 153.17 169.70 10.79%
PAT 137.82 119.60 -13.22%
Operating profit margin 58.79% 60.74%
PAT Margin 45.30% 41.52%
6
FY16 Results 27th May 2016
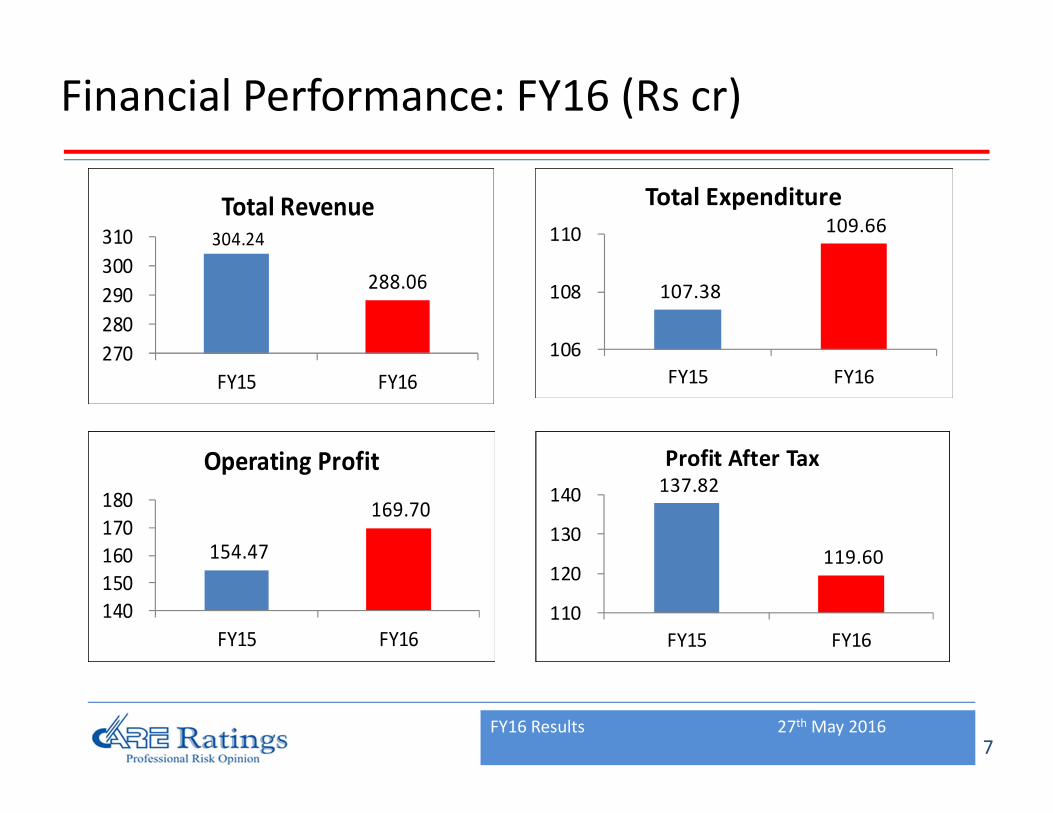
Financial Performance: FY16 (Rs cr)
304.24
288.06
270
280
290
300
310
FY15 FY16
Total Revenue
107.38
109.66
106
108
110
FY15 FY16
Total Expenditure
154.47
169.70
140
150
160
170
180
FY15 FY16
Operating Profit137.82
119.60
110
120
130
140
FY15 FY16
Profit After Tax
7
FY16 Results 27th May 2016
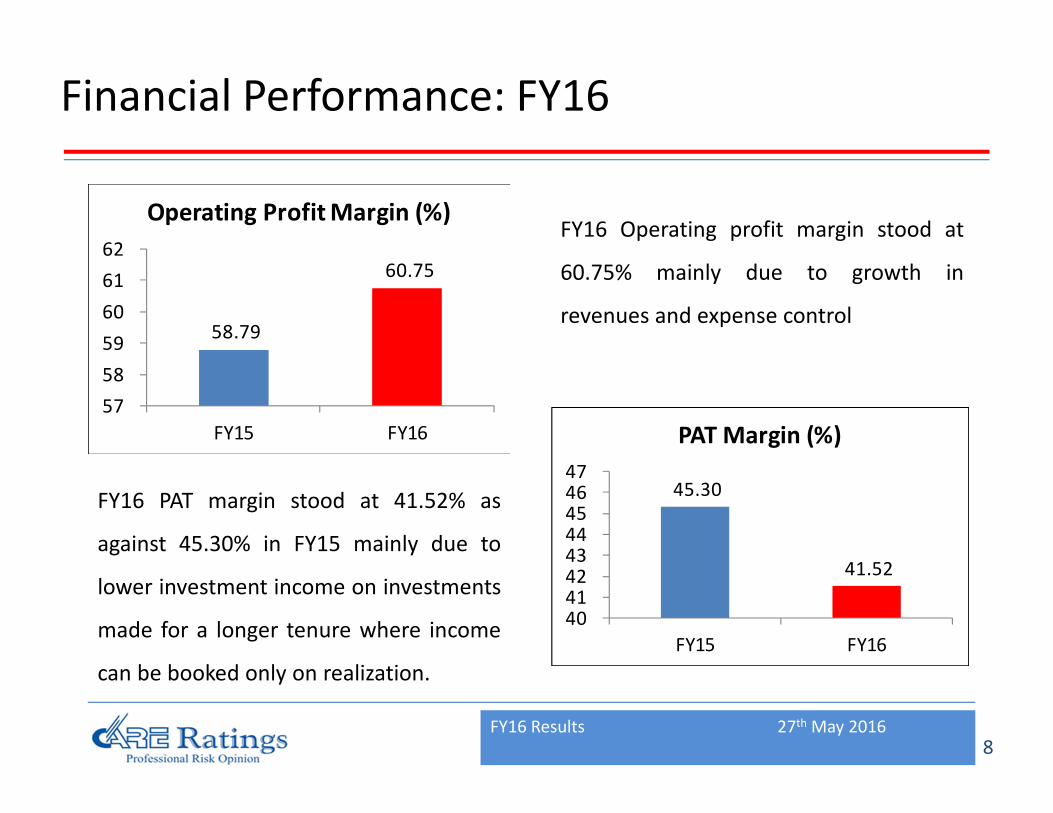
Financial Performance: FY16
FY16 Operating profit margin stood at
60.75% mainly due to growth in
revenues and expense control
FY16 PAT margin stood at 41.52% as
against 45.30% in FY15 mainly due to
lower investment income on investments
made for a longer tenure where income
can be booked only on realization.
58.79
60.75
57
58
59
60
61
62
FY15 FY16
Operating Profit Margin (%)
45.30
41.52
40 41 42 43 44 45 46 47
FY15 FY16
PAT Margin (%)
8
FY16 Results 27th May 2016
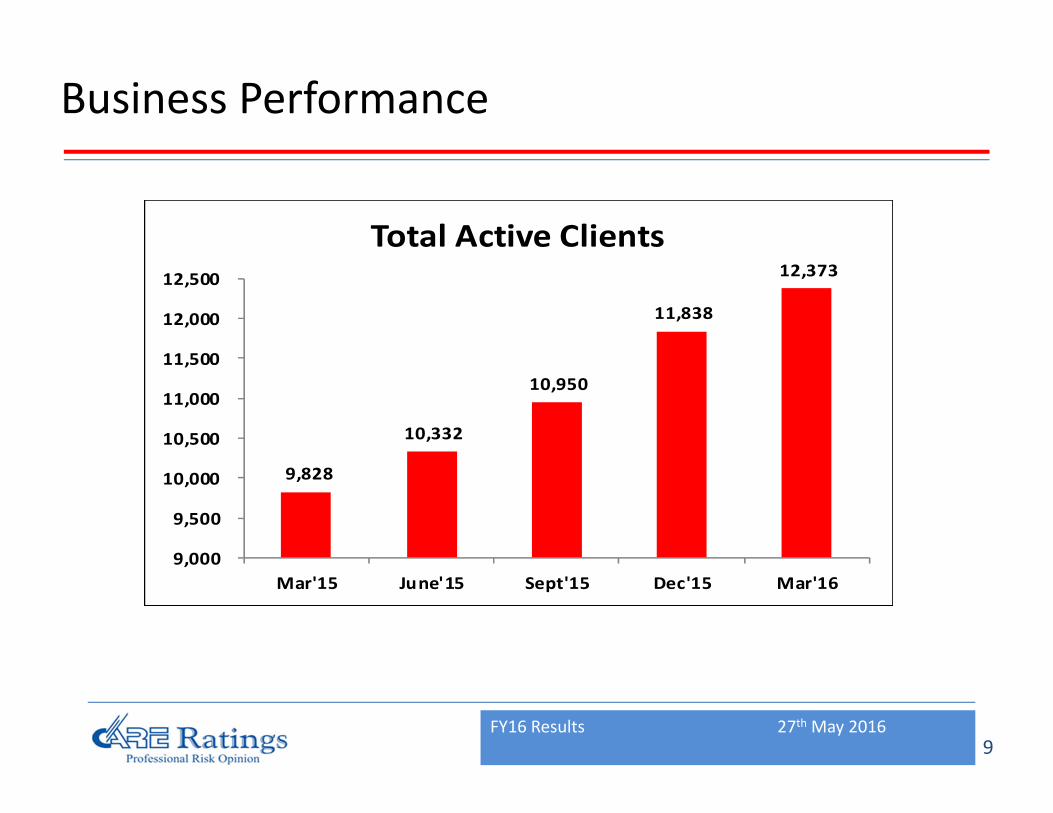
Business Performance
9,828
10,332
10,950
11,838
12,373
9,000
9,500
10,000
10,500
11,000
11,500
12,000
12,500
Mar'15 June'15 Sept'15 Dec'15 Mar'16
Total Active Clients
9

FY16 Results 27th May 2016
Business Performance: FY16
0.64
3.79
6.45
10.97
1.10
4.23
5.45
10.85
0
2
4
6
8
10
12
14
Short & Medium
term Instruments
Long term
Instruments
Bank Loan Ratings Total
Volume of Debt Rated (Rs lk cr)
FY15 FY16
10
FY16 Results 27th May 2016
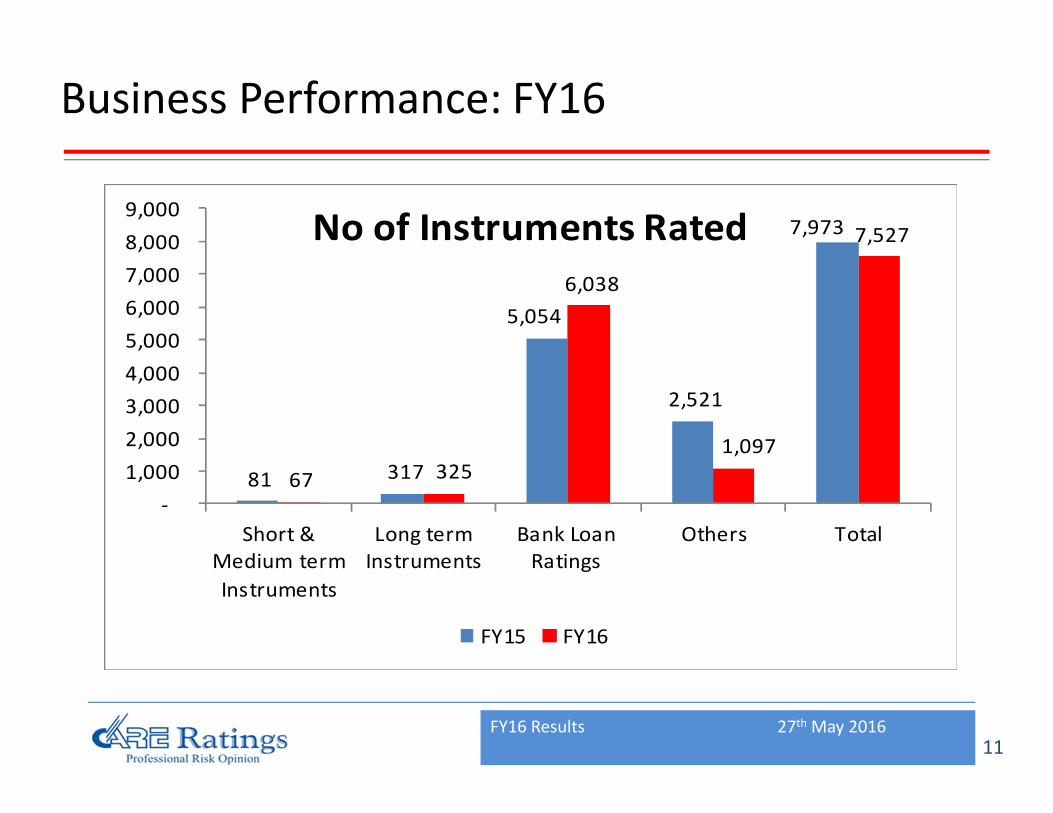
Business Performance: FY16
81 317
5,054
2,521
7,973
67 325
6,038
1,097
7,527
-
1,000
2,000
3,000
4,000
5,000
6,000
7,000
8,000
9,000
Short &
Medium term
Instruments
Long term
Instruments
Bank Loan
Ratings
Others Total
No of Instruments Rated
FY15 FY16
11
FY16 Results 27th May 2016
Contents
Highlights
Financial & Business Performance
MCR / CDQI
New Developments
Economic Backdrop
12
FY16 Results 27th May 2016
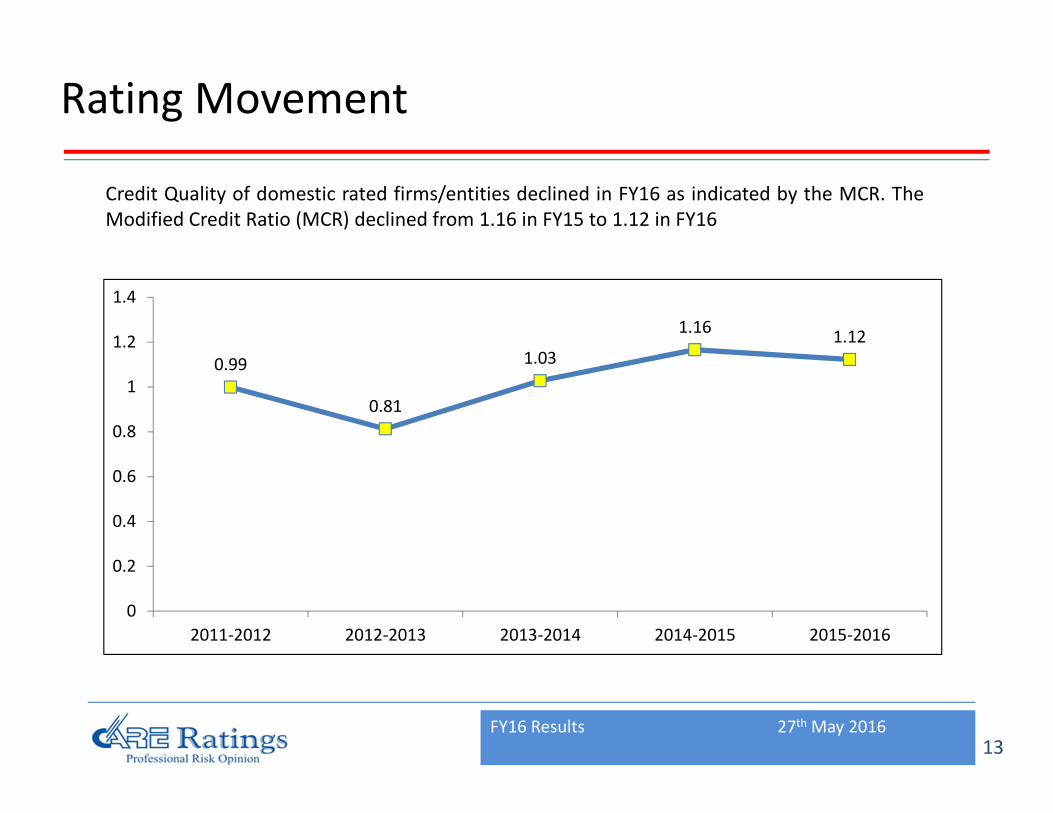
Rating Movement
Credit Quality of domestic rated firms/entities declined in FY16 as indicated by the MCR. The
Modified Credit Ratio (MCR) declined from 1.16 in FY15 to 1.12 in FY16
0.99
0.81
1.03
1.161.12
0
0.2
0.4
0.6
0.8
1
1.2
1.4
2011-2012 2012-2013 2013-2014 2014-2015 2015-2016
13

FY16 Results 27th May 2016
CARE Ratings Debt Quality Index
The CDQI has been witnessing a downward movement since June’15.The index exhibited some stability
with a moderation of merely 0.01 point during Sept’15 at 92.76, followed by a significant decline to 92.13
in Oct’15 and 91.83 in Nov’15. It continued to register a contraction (albeit marginal) in Dec’15 and stood
at 91.79. The index, after witnessing marginal recovery in the month of January 2016 and February 2016,
declined in March 2016
97.63
95.35
91.0590
95
100
Ma
r'1
2
Ma
y'1
2
July
'12
Se
pt'
12
No
v'1
2
Jan
'13
Ma
r'1
3
Ma
y'1
3
July
'13
Se
pt'
13
No
v'1
3
Jan
'14
Ma
r'1
4
Ma
y'1
4
July
'14
Se
pt'
14
No
v'1
4
Jan
'15
Ma
r'1
5
Ma
y'1
5
Jul'1
5
Se
pt'
15
No
v'1
5
Jan
'16
Ma
r'1
6
CDQI Index
14

FY16 Results 27th May 2016
Contents
Highlights
Financial & Business Performance
MCR / CDQI
New Developments
Economic Backdrop
15

FY16 Results 27th May 2016
New Developments
• Was the knowledge partner for the 4th International
Conference on Securitization “Indian Securitization Summit
2015” held at Mumbai
• Received the ‘Fastest Growing Indian Company Excellence
Award’ at International Achievers Conference, Bangkok.
• Launched the CARE Debt Quality Index (CDQI), first of its type
index which helps in quantifying the quality of debt in the
country
• Signed a Memorandum of Understanding (MoU) with Japan
Credit Rating Agency, Ltd. (JCR) to collaborate with each other
as strategic business partners.
16
FY16 Results 27th May 2016
New Developments
• Entered into an agreement with GREX Alternative Investments
Market to provide a broad analytical framework within which
CARE Ratings will be involved in conducting Rating/Grading
exercises for companies
• CARE Ratings Africa announce its first rating Assigned to Fixed
deposit programme of Banyan Tree Bank Ltd
• Was awarded the title of 4ps Most Recognizable Brands of
Indian origin @ Franchise India’s Omaxe Power brands Glam
2016 held in New Delhi
• Launched CARE Rating Tracker (CART), a platform which gives
information pertaining to 40,000 rated companies across
more than 120 industries
17
FY16 Results 27th May 2016
New Developments
• Hosted Budget Conversations: FY17’ - a discussion on the
budgetary proposals in Mumbai and Delhi.
– Speakers for the Mumbai event included Mr. Ashvin Parekh
(Managing Partner, Ashvin Parekh Advisory Services LLP),
Mr. Milind Sarwate (Founder & CEO, Increate Value
Advisors LLP) and Mr. Nilesh Shah (Managing Director,
Kotak Asset Management Co. Ltd)
– Speakers for Delhi event included Mr Sanjeev Kaushik
(DMD, IIFCL) and Ms Mythili Bhusnurmath (Consulting
Editor, Economic Times)
18

FY16 Results 27th May 2016
Contents
Highlights
Financial & Business Performance
MCR / CDQI
New Developments
Economic Backdrop
19
FY16 Results 27th May 2016
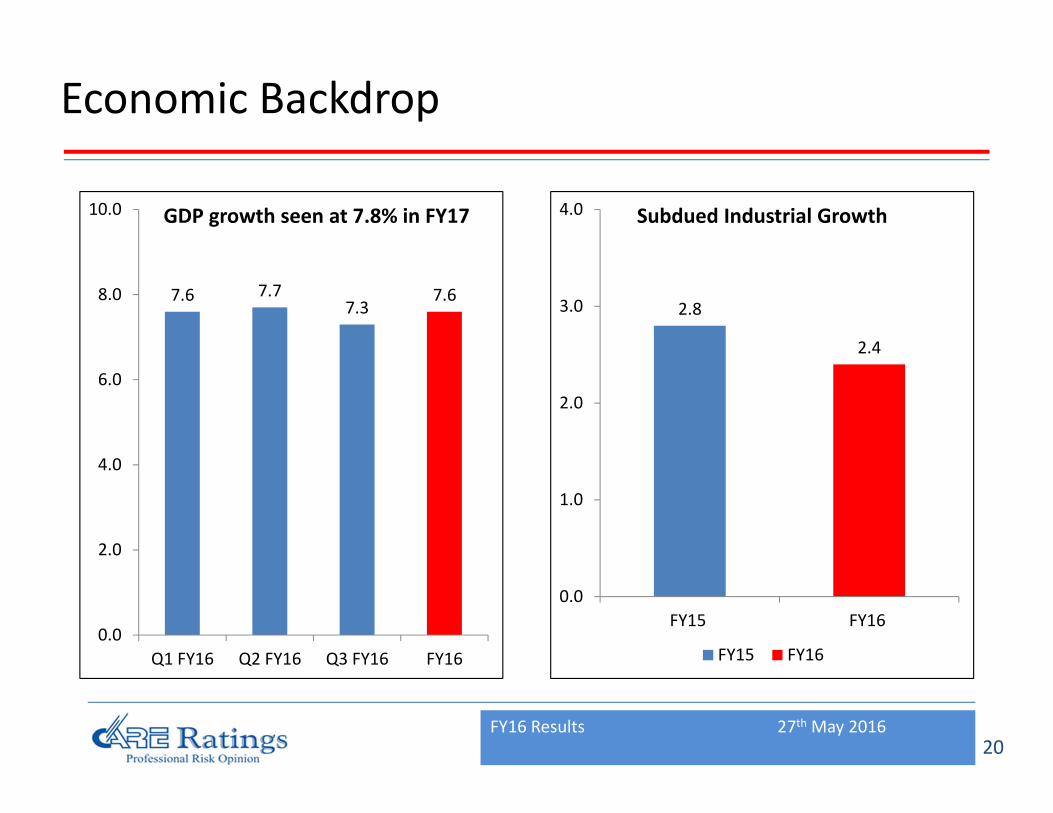
Economic Backdrop
7.6 7.77.3
7.6
0.0
2.0
4.0
6.0
8.0
10.0
Q1 FY16 Q2 FY16 Q3 FY16 FY16
GDP growth seen at 7.8% in FY17
2.8
2.4
0.0
1.0
2.0
3.0
4.0
FY15 FY16
Subdued Industrial Growth
FY15 FY16
20

FY16 Results 27th May 2016
Economic Backdrop
60.59
62.00
62.25
63.50
64.91
65.93
67.5
60
62
64
66
68
Q2
FY15
Q3
FY15
Q4
FY15
Q1
FY16
Q2
FY16
Q3
FY16
Q4
FY16
Depreciating Currency
Rs/$
4.9
4.8
-6.0
-4.0
-2.0
0.0
2.0
4.0
6.0
8.0
Ap
r-1
5
Ma
y-1
5
Jun
-15
Jul-
15
Au
g-1
5
Se
p-1
5
Oct
-15
No
v-1
5
De
c-1
5
Jan
-16
Fe
b-1
6
Ma
r-1
6
Easing Inflation
WPI (%) CPI (%)
21

FY16 Results 27th May 2016
Economic Backdrop
8.65.6 5.7
15.5
9.0
2.7
9.1
19.4
0
5
10
15
20
25
Bank Credit Industry Services Retail
Growth in Credit (%)
FY15 FY16
1,510,060
1,562,170
1,480,000
1,520,000
1,560,000
1,600,000
FY15 FY16
CP Issuances (Rs cr)
FY15 FY16
9,713
465,643 475,356
33,812
466,144 499,956
-
200,000
400,000
600,000
Public Issue Private Placement Total
Corporate Debt Raised (Rs cr)
FY15 FY16
Source: RBI
Source: Prime Database
22

FY16 Results 27th May 2016
Economic Backdrop
6.00
8.00
10.00
12.00
Ap
r-1
5
Ma
y-1
5
Jun
-15
Jul-
15
Au
g-1
5
Se
p-1
5
Oct
-15
No
v-1
5
De
c-1
5
Jan
-16
Fe
b-1
6
Ma
r-1
6
Repo Rate & Base Rate (%)
Repo Rate (%) Base Rate (%)
7.5
7.6
7.7
7.8
7.9
8
Ap
r-1
5
Ma
y-1
5
Jun
-15
Jul-
15
Au
g-1
5
Se
p-1
5
Oct
-15
No
v-1
5
De
c-1
5
Jan
-16
Fe
b-1
6
Ma
r-1
6
G Sec Yield (%)
G Sec Yield (%)
23
FY16 Results 27th May 2016
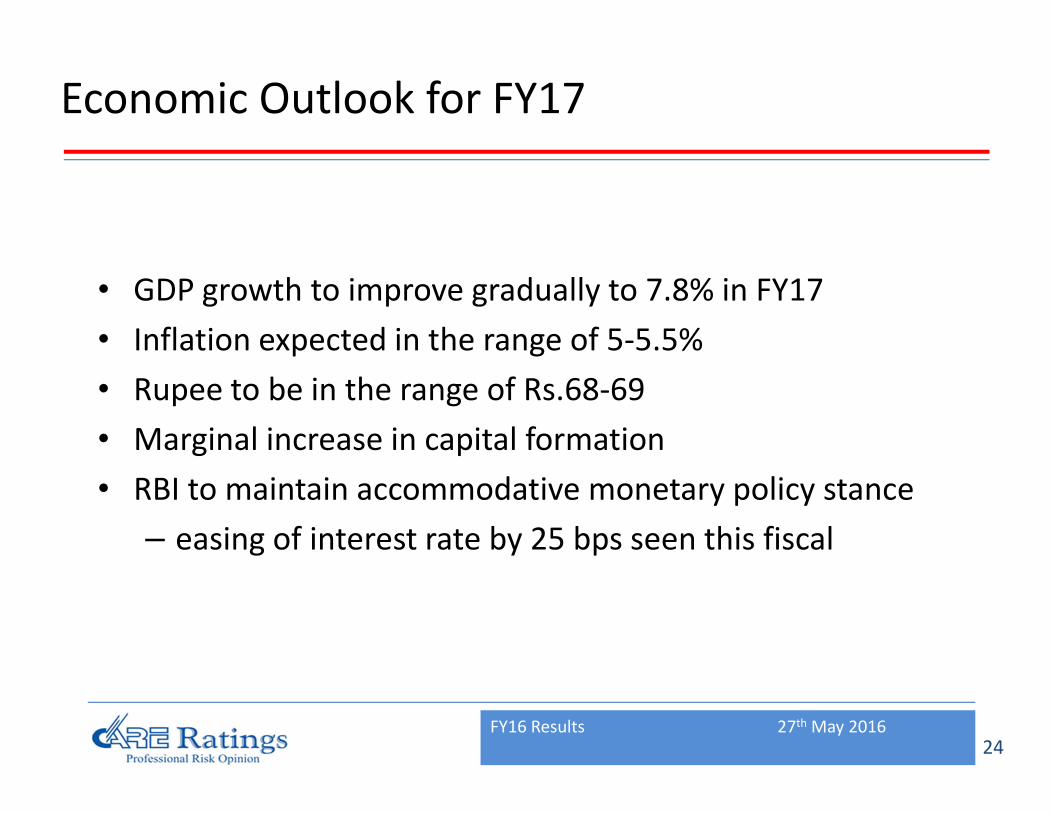
Economic Outlook for FY17
• GDP growth to improve gradually to 7.8% in FY17
• Inflation expected in the range of 5-5.5%
• Rupee to be in the range of Rs.68-69
• Marginal increase in capital formation
• RBI to maintain accommodative monetary policy stance
– easing of interest rate by 25 bps seen this fiscal
24
FY16 Results 27th May 2016
Thank You
25