fy14 quarter three performance report - nm doit · fy14 quarter three performance report january 1,...
TRANSCRIPT

FY14 Quarter Three
Performance Report
January 1, 2014 through March 31, 2014
Darryl Ackley
Cabinet Secretary
Jacqueline Miller
Deputy Secretary
361 Department of Information Technology FY14 Q3 Performance Measure
Report
Page 2 of 24
Department of Information Technology - 361
The purpose of this document is to provide an update to the Department of Information Technology
(Department) Performance Monitoring Plan (Plan) for each of the program areas. The Department’s
Plan includes the definition, source of data and methodology to capture and analyze the data. The
Plan also describes the validation and reliability process to ensure the data is accurate and repeatable.
The Department was created by legislation enacted in the 2007 Legislative Session. The Department
began operations July 1, 2007 and as a new Department established new performance measures.
As the State of New Mexico (State)’s provider for Enterprise Information Technology (IT) services, the
Department is working across the State with all executive agencies (Agencies) to improve services and
better facilitate efficient and responsive government for New Mexicans. At its foundation, this Plan is
a continuation and evolution of core IT measurement practices. Emphasis is placed on tracking, cost-
benefit based, and consolidation of IT resources that leverages shared services, mitigates redundancy,
and continues to drive economies of scale. Also, leveraging systemic thinking as a means to better
measure the many various IT systems upon which the State builds its core business.
In Fiscal Year 2014 the Department will embrace improvement with two new metrics for the SHARE
Program and the twenty-three continued performance metrics from last year. With the twenty-five
performance metrics the Plan tracks the use of emerging technologies to better support constituents
and stakeholders of the enterprise services that the Department provides. In addition, these metrics
help measure the reduction of duplicated efforts through pooled services and enterprise service
optimization through increased process efficiency and effectiveness. New metrics require resources
and foundation work to include development of process and procedure. Consequently, the reporting
on these metrics will improve as they mature.
Performance Measure Status
For each of the performance measures, in this report, a color coded status is presented. The color
coding, green, yellow or red is based on the percentage of the target being reported on either a
quarterly or annual basis:
Green 80% to 100% of the performance target or exceeding target.
Yellow 70% to 79% of the performance target.
Red 0% to 69% of the performance target.
361 Department of Information Technology FY14 Q3 Performance Measure
Report
Page 3 of 24
Program Area: Program Support (P771)
The Program Support provides leadership, legal and administrative services, to the Department in
support of the mission. Program Support includes the Office of the Secretary and the Administrative
Services Division. Program Support is responsible for the Department's direction, administrative
policies and procedures, human resources, budget and financial management, and purchasing and
contractual support. Additionally, Program Support is responsible for establishing a cost recovery
model and establishes rates for services provided by the Department.
Program Budget and Full Time Employee (FTE) The Program Support Program area has 41 FTE and the following budget:
Budget Category Total (Thousands)
Salaries and Benefits $3,367.00
Contractual $38.20
Other $208.10
Other Financing Uses $0.00
Total $3,613.30
Performance Measures
PERFORMANCE MEASURE 1 - Percent of Audit Corrective Action Plan Commitments Completed on Schedule (Annual)
This measure will be reported in FY14 Q4.
PERFORMANCE MEASURE 2 - Percent of Accounts Receivable Dollars Collected Within Sixty Days of the Invoice Due Date
The Department is the enterprise information technology service provider for Agencies. Invoices are
generated and delivered to Agencies on a monthly basis for services rendered. This measure tracks
the timeliness of customer Agency payments to the Department. Agencies bills are measured with a
sixty day period for the receipt of payment from the invoice date.
This quarter’s performance shows the results of the Accounts Receivable section of the Administrative
Services Division (ASD) efforts continue to refine and implement processes, particularly around
collections, to improve accounts receivable balances. The Department is cognizant of the difficulties
361 Department of Information Technology FY14 Q3 Performance Measure
Report
Page 4 of 24
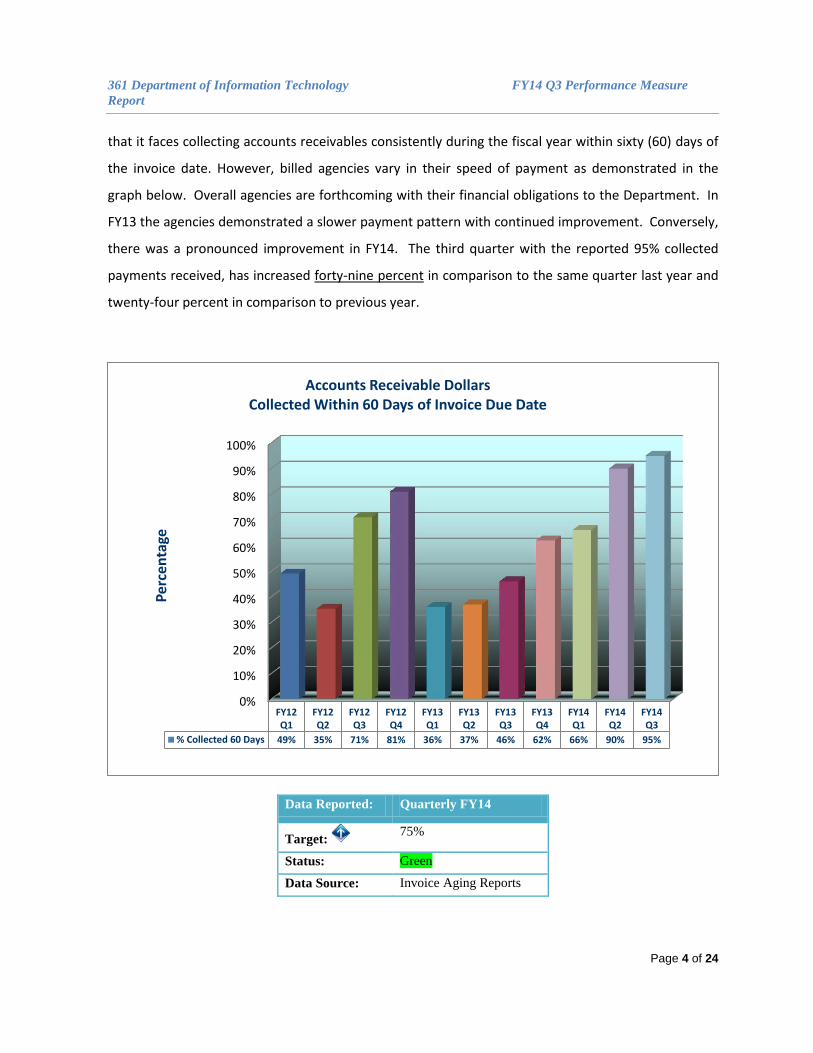
that it faces collecting accounts receivables consistently during the fiscal year within sixty (60) days of
the invoice date. However, billed agencies vary in their speed of payment as demonstrated in the
graph below. Overall agencies are forthcoming with their financial obligations to the Department. In
FY13 the agencies demonstrated a slower payment pattern with continued improvement. Conversely,
there was a pronounced improvement in FY14. The third quarter with the reported 95% collected
payments received, has increased forty-nine percent in comparison to the same quarter last year and
twenty-four percent in comparison to previous year.
Data Reported: Quarterly FY14
Target: 75%
Status: Green
Data Source: Invoice Aging Reports
0%
10%
20%
30%
40%
50%
60%
70%
80%
90%
100%
FY12Q1
FY12Q2
FY12Q3
FY12Q4
FY13Q1
FY13Q2
FY13Q3
FY13Q4
FY14Q1
FY14Q2
FY14Q3
% Collected 60 Days 49% 35% 71% 81% 36% 37% 46% 62% 66% 90% 95%
Per
cen
tage
Accounts Receivable Dollars Collected Within 60 Days of Invoice Due Date
361 Department of Information Technology FY14 Q3 Performance Measure
Report
Page 5 of 24
PERFORMANCE MEASURE 3 - Dollar Amount of Account Receivables Over Sixty Days
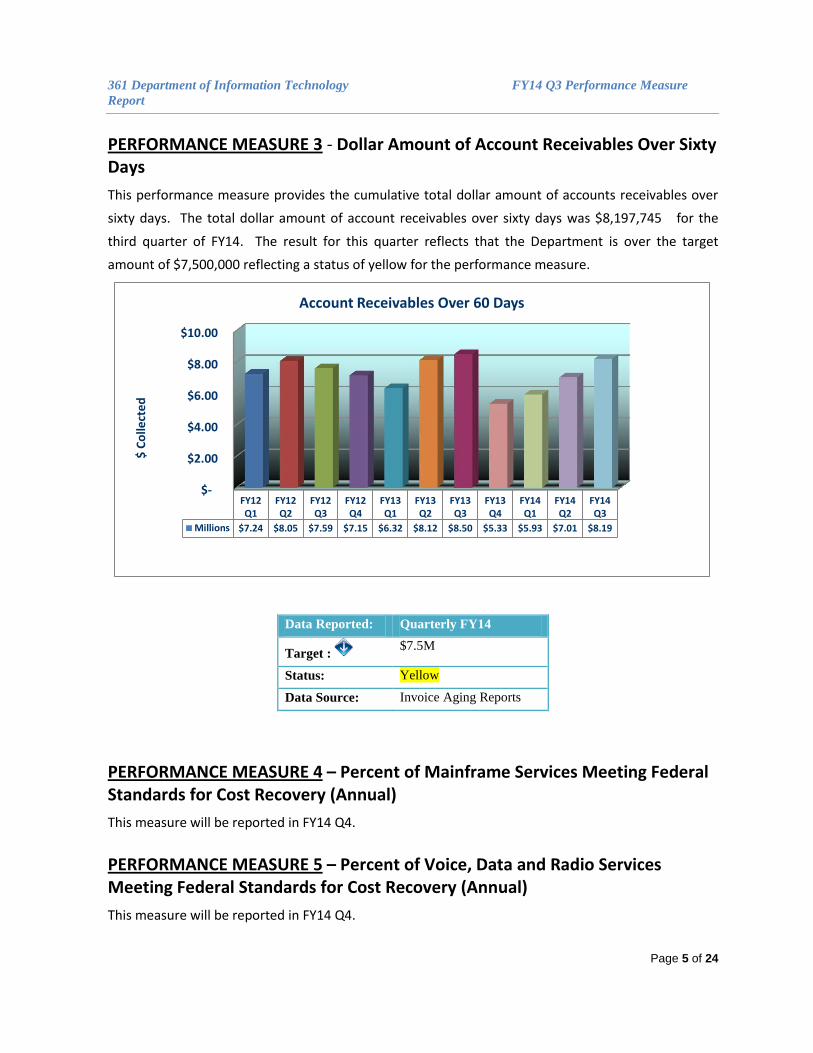
This performance measure provides the cumulative total dollar amount of accounts receivables over
sixty days. The total dollar amount of account receivables over sixty days was $8,197,745 for the
third quarter of FY14. The result for this quarter reflects that the Department is over the target
amount of $7,500,000 reflecting a status of yellow for the performance measure.
Data Reported: Quarterly FY14
Target : $7.5M
Status: Yellow
Data Source: Invoice Aging Reports
PERFORMANCE MEASURE 4 – Percent of Mainframe Services Meeting Federal Standards for Cost Recovery (Annual)
This measure will be reported in FY14 Q4.
PERFORMANCE MEASURE 5 – Percent of Voice, Data and Radio Services Meeting Federal Standards for Cost Recovery (Annual)
This measure will be reported in FY14 Q4.
$-
$2.00
$4.00
$6.00
$8.00
$10.00
FY12Q1
FY12Q2
FY12Q3
FY12Q4
FY13Q1
FY13Q2
FY13Q3
FY13Q4
FY14Q1
FY14Q2
FY14Q3
Millions $7.24 $8.05 $7.59 $7.15 $6.32 $8.12 $8.50 $5.33 $5.93 $7.01 $8.19
$ C
olle
cte
d
Account Receivables Over 60 Days

361 Department of Information Technology FY14 Q3 Performance Measure
Report
Page 6 of 24
361 Department of Information Technology FY14 Q3 Performance Measure
Report
Page 7 of 24
Program Area: Compliance & Project Management (P772)
The Compliance and Project Management Division is the State’s Enterprise Project Management
Office (EPMO) and performs the following functions: Provide IT Management Lifecycle policies,
methodologies and templates for IT initiatives to promote quality and success and report regularly to
Executive, Legislative, and IT Commission. The EPMO reports on the status of the State’s IT Project
Portfolio; provides support, guidance and oversight on IT projects and procurements to promote
improved outcomes; reviews agency IT plans for prudent allocation of IT resources and monitors
compliance of projects with Agency strategic plans and the State IT strategic plan; reviews
appropriation requests and legislation related to IT and makes recommendations to the Department
of Finance, and Legislative Finance Committee for formal approval by the Legislature and the
Governor. Additionally EPMO provides senior project management guidance for enterprise projects.
Program Budget and FTE The Compliance and Project Management has seven (7) FTE and the following budget:
Budget Category Total (Thousands)
Salaries and Benefits $669.80
Contractual $0.00
Other $17.30
Other Financing Uses $157.40
Total $844.50
Performance Measures
PERFORMANCE MEASURE 6 – Number and Appropriated Budget of Executive Agency Certified Projects Reviewed Monthly for Oversight Requirements
This performance measure reflects the volume of oversight for agency certified IT projects by tracking
both the number and budget appropriations. All certified IT projects are required to submit monthly
status reports to the Department. During the fiscal year 2014, third quarter there were twenty-three
agency certified projects that were reviewed monthly for oversight requirements worth $13.4 Million.
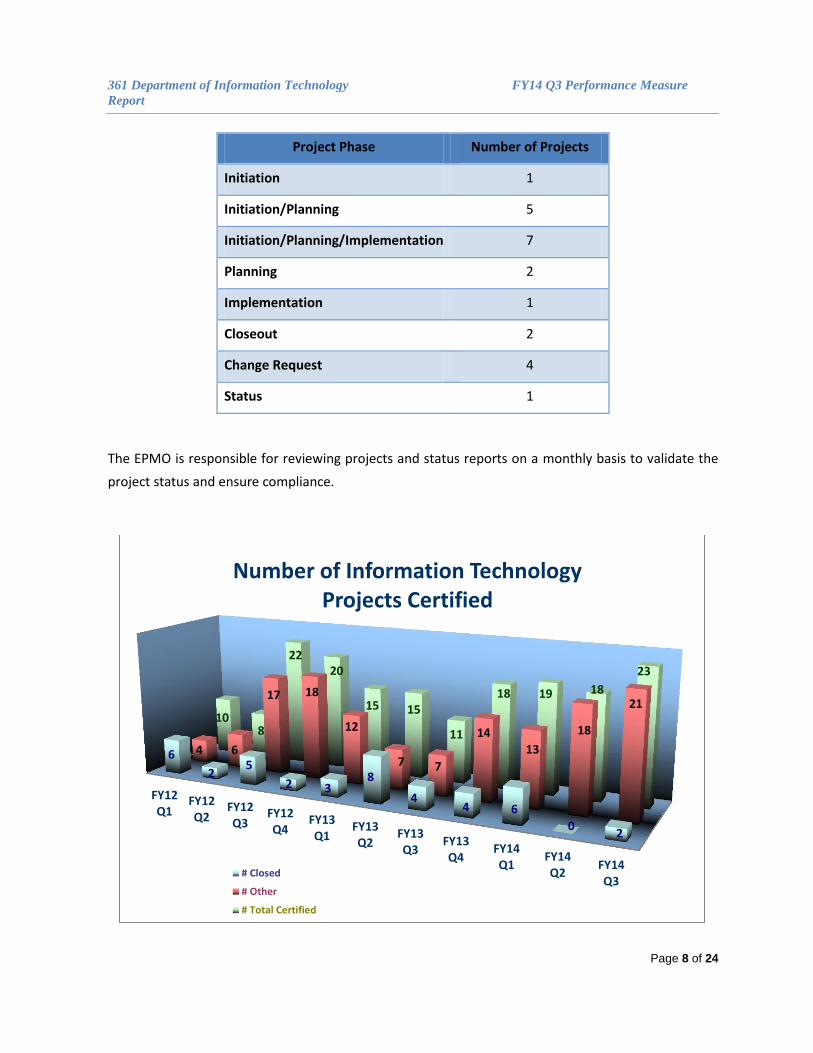
Additional details include the number and appropriated budget for projects presented to the Project
Certification Committee (PCC) for phases, changes, and status updates of IT projects. During the
quarter, there were twenty-three project certifications:
361 Department of Information Technology FY14 Q3 Performance Measure
Report
Page 8 of 24
Project Phase Number of Projects
Initiation 1
Initiation/Planning 5
Initiation/Planning/Implementation 7
Planning 2
Implementation 1
Closeout 2
Change Request 4
Status 1
The EPMO is responsible for reviewing projects and status reports on a monthly basis to validate the
project status and ensure compliance.
FY12Q1
FY12Q2
FY12Q3
FY12Q4
FY13Q1
FY13Q2
FY13Q3
FY13Q4
FY14Q1
FY14Q2
FY14Q3
6
2 5
2 3 8
4 4 6
0 2
4 6
17 18
12
7 7
14
13
18
21 10
8
22 20
15 15
11
18 19 18
23
Number of Information Technology Projects Certified
# Closed
# Other
# Total Certified
361 Department of Information Technology FY14 Q3 Performance Measure
Report
Page 9 of 24
Data Reported: Quarterly FY14
Target: N/A
Status: N/A
Data Source: Excel Spreadsheet
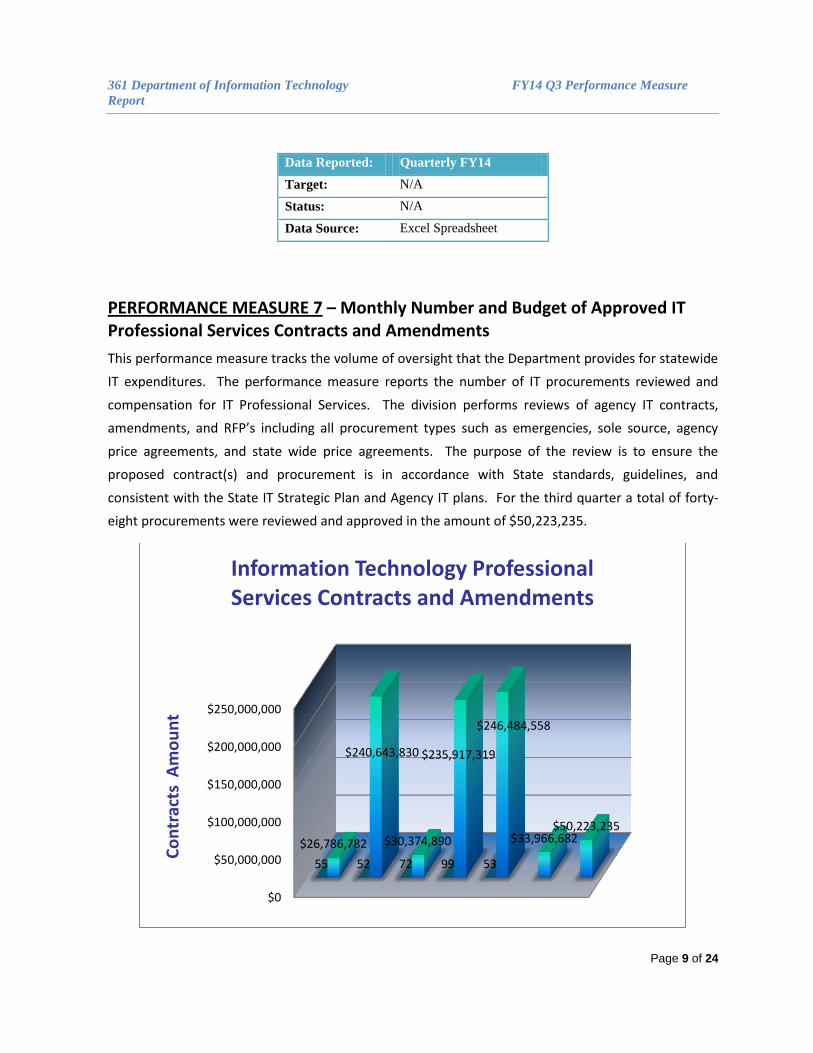
PERFORMANCE MEASURE 7 – Monthly Number and Budget of Approved IT Professional Services Contracts and Amendments
This performance measure tracks the volume of oversight that the Department provides for statewide
IT expenditures. The performance measure reports the number of IT procurements reviewed and
compensation for IT Professional Services. The division performs reviews of agency IT contracts,
amendments, and RFP’s including all procurement types such as emergencies, sole source, agency
price agreements, and state wide price agreements. The purpose of the review is to ensure the
proposed contract(s) and procurement is in accordance with State standards, guidelines, and
consistent with the State IT Strategic Plan and Agency IT plans. For the third quarter a total of forty-
eight procurements were reviewed and approved in the amount of $50,223,235.
$0
$50,000,000
$100,000,000
$150,000,000
$200,000,000
$250,000,000
55 52 72 99 53
$26,786,782
$240,643,830
$30,374,890
$235,917,319
$246,484,558
$33,966,682 $50,223,235
Co
ntr
acts
Am
ou
nt
Information Technology Professional Services Contracts and Amendments

361 Department of Information Technology FY14 Q3 Performance Measure
Report
Page 10 of 24
Data Reported: Quarterly FY14
Target: N/A
Status: N/A
Data Source: Excel Spreadsheet
PERFORMANCE MEASURE 8 – Number and Budget Requested for One Time IT Appropriations as Incorporated Within Annual Agency IT Plans (Annual)
This measure will be reported in FY14 Q4.

361 Department of Information Technology FY14 Q3 Performance Measure
Report
Page 11 of 24
Program Area: Enterprise Services (P773) & Equipment Refresh
(P784)
The purpose of the Enterprise Services program is to provide the State with the information
technology fabric that enables Agencies to innovate and excel in their specific domains with the goal
of consolidating services duplicated within agencies to promote cost savings and efficiencies. This is
accomplished through the delivery and management of cost effective and efficient IT infrastructure
services, enterprise applications and other value added IT services. The program is enterprise funded
thereby assessing fees for services which includes the depreciation cost for providing service. This
enables an Equipment Replacement Fund to be utilized to maintain and enhance services over time.
Program Budget and FTE The Enterprise Services and the Equipment Replacement Fund has been merged together for
performance measure reporting purposes. The Enterprise Services Program has 152 FTE. The
combined budget is as follows:
Budget Category Enterprise Services
(P773) Replacement Fund
(P784)
Total (Thousands)
Enterprise and Replacement
Salaries and Benefits $15,381.9 $15,381.9
Contractual $6,980.7 $2,501.0 $9,481.7
Other $20,585.5 $3,323.9 $23,909.4
Other Financing Uses $8,992.6 $8,992.6
Total $51,940.7 $5,824.9 $57,765.6
Performance Measures
PERFORMANCE MEASURE 9 – Number of Enterprise Services Instrumented with Quantitative Metrics for Evaluating Savings/Cost Avoidance Resulting from Consolidation (Annual)
This measure will be reported in FY14 Q4.
361 Department of Information Technology FY14 Q3 Performance Measure
Report
Page 12 of 24
PERFORMANCE MEASURE 10 – Amount of IT Savings/Cost Avoidance as Calculated for Enterprise Systems with Existing and Documented Metrics (Annual)
This measure will be reported in FY14 Q4.
PERFORMANCE MEASURE 11 – Percentage of Phone Systems Using Internet Protocol or Other Similar Technologies to Achieve Virtual Local Calling within the State
This performance measure tracks the increased use of internet protocol (IP) technologies versus
landlines. This performance measure quantifies the continued advancements utilized by the State for
telephone technology and represents the potential for significant measurable cost savings to the
State. The number of landline systems replaced by the use of the enterprise network reflects the
continued success of increased cost saving, leveraging economies of scale within the IT consolidation
effort.
An additional 720 IP provisioned telephone sets were installed during fiscal year 2014 quarter three
bringing the total IP core network installed base to 3,383. For quarter three the installed base of IP
telephones is approximately 15.0%.
This was a new performance measures for FY13 with a target of 25%. In the first year the metric was
structured with an incline target that began at 3% the first quarter and increases each quarter with the
requirement of meeting the 25% target. With the data received last year; the realistic target is an
increase of approximately 350 IP telephones per quarter at an increase of 1.5%. However, this
quarter demonstrated a higher increase with 720 IP phones installed. This is a performance measure
that is driven by agency funding and infrastructure capability and will continue to vary over the years.

361 Department of Information Technology FY14 Q3 Performance Measure
Report
Page 13 of 24
Data Reported: Quarterly FY14
Target: 25% (requires revision)
Status: GREEN
Data Source: Contracts Database
0.0%
25.0%
50.0%
75.0%
100.0%
FY13Q1 FY13
Q2 FY13Q3 FY13
Q4 FY14Q1 FY14
Q2 FY14Q3
FY14Q4
% IP Base Telephones
Percentage of Phone Systems Using Internet Protocol to Achieve Local Calling
Within the State Enterprise
Actuals IP Phones
Projected IP Phones
Landlines

361 Department of Information Technology FY14 Q3 Performance Measure
Report
Page 14 of 24
PERFORMANCE MEASURE 12 – Percentage Reduction of Past End of Life Systems Refreshed/Replaced with Equipment Replacement Funds (Annual)
This measure will be reported in FY14 Q4.
PERFORMANCE MEASURE 13 – Number of Anchor Institutions Utilizing the Forthcoming 700MHz Long Term Evolution Public Safety Network
On behalf of the State, the Department is one of seven institutions nation-wide to have both a waiver
for the operation of a 700 MHz public safety network, and federal funds for the initial deployment of
such a capability. This performance measure will track the number of anchor institutions, or
‘customers’ that this new technology will support. This metric is also a requirement of the federal
grant awarded to the Department, but is equally as important to be established internally to the
Department. As this technology is anticipated to become a substantial portion of the Department’s
radio capability over the next five to ten years, it will be important to meter how widespread its
adoption is for the purposes of advanced planning and development of related cost models.
The 700MHz performance measure was on hold due to the Federal Communications Commission
(FCC) placing the 700MHz project on hold. The Department requested an extension for the BTOP
SIRCITS federal grant that funds the 700MHz project. The extension for the SIRCITS project was
received; however the 700MHz LTE portion of the project remained on-hold. During the last quarter,
the Department negotiated and signed a Spectrum Lease Management Agreement with First
Responder Network Authority (FirstNet). The 700MHz suspension was lifted this past quarter. The
Department is in the process of developing a Request for Proposal (RFP) for the system design. The
RFP is in final review and should be released next quarter. With the award of the RFP the Department
will begin reporting on this performance measure.
Data Reported: Quarterly FY14
Target: 5
Status: TBD
Data Source: ARRA Reporting
361 Department of Information Technology FY14 Q3 Performance Measure
Report
Page 15 of 24
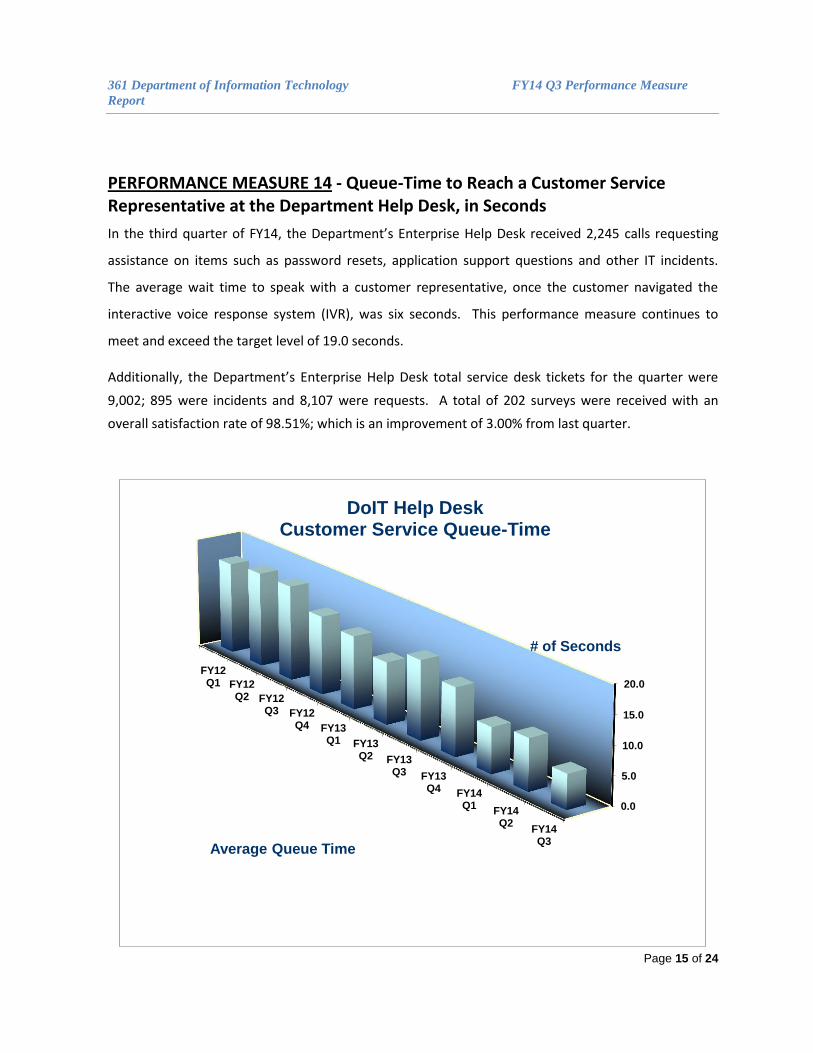
PERFORMANCE MEASURE 14 - Queue-Time to Reach a Customer Service Representative at the Department Help Desk, in Seconds
In the third quarter of FY14, the Department’s Enterprise Help Desk received 2,245 calls requesting
assistance on items such as password resets, application support questions and other IT incidents.
The average wait time to speak with a customer representative, once the customer navigated the
interactive voice response system (IVR), was six seconds. This performance measure continues to
meet and exceed the target level of 19.0 seconds.
Additionally, the Department’s Enterprise Help Desk total service desk tickets for the quarter were
9,002; 895 were incidents and 8,107 were requests. A total of 202 surveys were received with an
overall satisfaction rate of 98.51%; which is an improvement of 3.00% from last quarter.
0.0
5.0
10.0
15.0
20.0
FY12Q1 FY12
Q2 FY12Q3 FY12
Q4 FY13Q1 FY13
Q2 FY13Q3 FY13
Q4 FY14Q1
FY14Q2
FY14Q3
# of Seconds
Average Queue Time
DoIT Help Desk Customer Service Queue-Time

361 Department of Information Technology FY14 Q3 Performance Measure
Report
Page 16 of 24
Data Reported: Quarterly FY14
Target: <19 Seconds
Status: GREEN
Data Source: Service Desk System
PERFORMANCE MEASURE 15 – Percentage of Service Desk Incidents Resolved Within the Time Frame Specified for Their Priority Level
The Department has moved to a new enterprise support desk application which will enable it to
effectively monitor the called in incidents by priority level. The Department has defined and
configured the system to report on five priority levels. This is the third quarter that the Department is
able to report the percentage of service desk incidents resolved within the time frame specified for
the five priority level. The measure reflects the average percentage of incidents resolved within the
timeframe specified for their priority levels. When reporting IT service concerns or incidents, users
can call the Enterprise Help Desk. The help desk establishes the nature of the call and the priority for
the type of incident being reported by impact. The measure is an important metric for the
Department as the Enterprise Support Desk is the first point of contact for Agency customers.
Through tracking time frames for priority levels, the responses for each priority level can be evaluated.
Previously the Service Desk Application only had three priority levels defined. This is the fourth
quarter in which five priority levels have been defined and made available for use and tracking.
Targets have been set for each priority level. Below is the target for resolving the work order for each
specific priority.
PRIORITY LEVEL TARGET RESPONSE
HOURS
Priority-1 8 hours
Priority-2 24 hours
Priority-3 40 hours
Priority-4 80 hours
Priority-5 160 hours

361 Department of Information Technology FY14 Q3 Performance Measure
Report
Page 17 of 24
Quarter three of Fiscal Year 2014 demonstrated a performance decline in two of the priority levels.
Priority 2 declined from in six percent maintained the red status; Priority 3 declined from a green
status to a red status. The Department will strive next quarter to improve Priority 2 and 4
performance.
Data Reported: Quarterly FY14
Target: 90%
Data Source: Service Desk System
Priority 1 (8 Hrs.) 75% Green
Priority 2 (24 Hrs.) 43% Red
Priority 3 (40 Hrs.) 73% Green
Priority 4 (80 Hrs.) 40% Red
Priority 5 (160 Hrs.) 100% Green
0%
20%
40%
60%
80%
100%
FY13 Q4FY14 Q1
FY14 Q2
FY14 Q3
FY14 Q4
DoIT Customer Support Priority Levels FY14 Q3
Priority 1 (8 Hrs)
Priority 2 (24 Hrs)
Priority 3 (40 Hrs)
Priority 4 (80 Hrs)
Priority 5 (160 Hrs)

361 Department of Information Technology FY14 Q3 Performance Measure
Report
Page 18 of 24
PERFORMANCE MEASURE 16 - In-Service Percentage of the State Voice Communication Network
The Department maintains and operates the state voice communication network. The in-service
percentage measures the availability of the telephone system and is critical to state government
operations. In-service percentage is measured across 40,503 ports, and uptime/down time is
measured in minutes. This in-service performance measure has been consistent at 99.999% for the
past three years. The reporting status of this metric demonstrates that the Department has been
successful in sustaining a performance measure that is industry best practice.
Data Reported: Quarterly FY14
Target: 99.9%
Status: GREEN
Data Source: Altura In-Service Reports
90.0%
92.5%
95.0%
97.5%
100.0%
FY12Q1 FY12
Q2 FY12Q3 FY12
Q4 FY13Q1 FY13
Q2 FY13Q3 FY13
Q4FY14Q1
FY14Q2
FY14Q3
% In-Service
43,066 Ports Available
State Voice Communication Network In-Service Percentage

361 Department of Information Technology FY14 Q3 Performance Measure
Report
Page 19 of 24
PERFORMANCE MEASURE 17 - Percent of Mainframe Uptime Affecting User Access and/or Batch Scheduling
The Department maintains and operates the State’s mainframe environment within the State Data
Center. The mainframe hosts several critical agency applications such as the Child Support
Enforcement System, Cash Assistance, Oil and Natural Gas Administration and Revenue Database
(ONGARD) system. This performance measure reports any unscheduled downtime of the mainframe
that affects user access or batch processing. There are scheduled windows designated for
maintenance when the mainframe is not available and are not included as part of this performance
measurement.
In FY 2014 Third Quarter the Mainframe experienced an unscheduled initial program load (IPL), during
night production at 8:43 P.M. on Friday, March 2, 2014 the system recovered and did not affect user
access or batch processing for approximately twenty minutes. For corrective measures, hardware was
replaced during a normal maintenance window. The mainframe was up 99.9%, which continued to
report performance at a green status.
99.000%
99.100%
99.200%
99.300%
99.400%
99.500%
99.600%
99.700%
99.800%
99.900%
100.000%
FY12Q1
FY12Q2
FY12Q3
FY12Q4
FY13Q1
FY13Q2
FY13Q3
FY13Q4
FY14Q1
FY14Q2
FY14Q3
% U
pti
me
Percent of Mainframe Uptime
361 Department of Information Technology FY14 Q3 Performance Measure
Report
Page 20 of 24
Data Reported: Quarterly FY14
Target: (99.9% Uptime)
Status: GREEN
Data Source: Real-time Monitoring
PERFORMANCE MEASURE 18 – Percentage Increase of Applications Running on Virtualized Enterprise Servers (Annual)
This measure will be reported in FY14 Q4.
PERFORMANCE MEASURE 19 – Number of Enterprise Data Systems with Established Disaster Recovery of Business Continuity Presence at the Secondary Data Center (Annual)
This measure will be reported in FY14 Q4.
PERFORMANCE MEASURE 20 – Percent of Co-located and Enterprise-hosted
Services with Documented System Security Plans (Annual)
This measure will be reported in FY14 Q4.
PERFORMANCE MEASURE 21 – Number of Perimeter and Security-Logged Systems Reporting Security Metrics to the Network Operations Center (Annual)
This measure will be reported in FY14 Q4.
361 Department of Information Technology FY14 Q3 Performance Measure
Report
Page 21 of 24
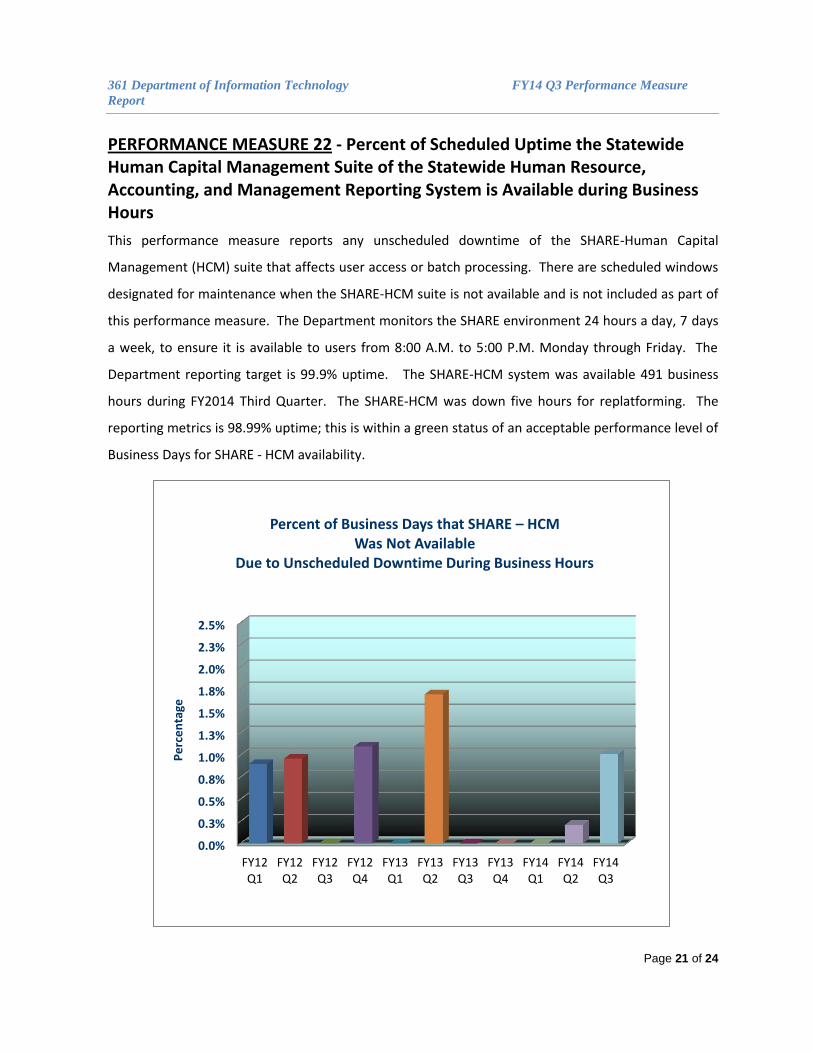
PERFORMANCE MEASURE 22 - Percent of Scheduled Uptime the Statewide Human Capital Management Suite of the Statewide Human Resource, Accounting, and Management Reporting System is Available during Business Hours
This performance measure reports any unscheduled downtime of the SHARE-Human Capital
Management (HCM) suite that affects user access or batch processing. There are scheduled windows
designated for maintenance when the SHARE-HCM suite is not available and is not included as part of
this performance measure. The Department monitors the SHARE environment 24 hours a day, 7 days
a week, to ensure it is available to users from 8:00 A.M. to 5:00 P.M. Monday through Friday. The
Department reporting target is 99.9% uptime. The SHARE-HCM system was available 491 business
hours during FY2014 Third Quarter. The SHARE-HCM was down five hours for replatforming. The
reporting metrics is 98.99% uptime; this is within a green status of an acceptable performance level of
Business Days for SHARE - HCM availability.
0.0%
0.3%
0.5%
0.8%
1.0%
1.3%
1.5%
1.8%
2.0%
2.3%
2.5%
FY12Q1
FY12Q2
FY12Q3
FY12Q4
FY13Q1
FY13Q2
FY13Q3
FY13Q4
FY14Q1
FY14Q2
FY14Q3
Pe
rce
nta
ge
Percent of Business Days that SHARE – HCM Was Not Available
Due to Unscheduled Downtime During Business Hours
361 Department of Information Technology FY14 Q3 Performance Measure
Report
Page 22 of 24
Data Reported: Quarterly FY14
Target: 99.9%,
Status: GREEN
Data Source: Real-time Monitoring Reports
PERFORMANCE MEASURE 23 - Percent of Scheduled Uptime the Financial Suite of the Statewide Human Resource, Accounting, and Management Reporting System is Available during Business Hours
This performance measure reports any unscheduled downtime of the SHARE-Financial (FIN) suite that
affects user access or batch processing. There are scheduled windows designated for maintenance
when the SHARE-FIN suite is not available and is not included as part of this performance measure.
The Department monitors the SHARE environment 24 hours a day, 7 days a week, to ensure it is
available to users from 8:00 A.M. to 5:00 P.M. Monday through Friday. The SHARE-FIN was available
484 business hours during FY2014 Third Quarter. The SHARE-FIN was down five hours for
replatforming and seven hours for an unplanned outage on February 26, 2014. The Department
reporting target is 99.9% uptime. The reporting metrics is 97.58% uptime; this is within a green status
of an acceptable performance level of Business Days for SHARE-FIN availability.

361 Department of Information Technology FY14 Q3 Performance Measure
Report
Page 23 of 24
Data Reported: Quarterly FY14
Target: 99.9%,
Status: GREEN
Data Source: Real-time Monitoring Reports
PERFORMANCE MEASURE 24 – Human Resource, Accounting, and
Management Reporting System Number of days to respond to an agency
Project Request for Statewide
This performance measure tracks the response time of the Department to the Agencies for Statewide
Human Resource, Accounting, and Management Reporting System (SHARE) Project Requests. A
Project Request is submitted to the Department and the SHARE team analyzes the request for impact
to the SHARE system. At present, the data for this performance measure is not available. The
Department successfully tracks SHARE’ projects from the point the projects have been assigned and
work has started to completion. However, for the majority of this quarter, resources were directed
0.0%
1.0%
2.0%
3.0%
4.0%
5.0%
6.0%
7.0%
8.0%
9.0%
10.0%
FY12Q1
FY12Q2
FY12Q3
FY12Q4
FY13Q1
FY13Q2
FY13Q3
FY13Q4
FY14Q1
FY14Q2
FY14Q3
Pe
rce
nta
ge
Percent of Business Days that SHARE – FINANCIALS Was Not Available
Due to Unscheduled Downtime During Business Hours
361 Department of Information Technology FY14 Q3 Performance Measure
Report
Page 24 of 24
towards the completion of the SHARE stabilization project. SHARE projects outside of the stabilization
efforts were stationary until the stabilization was complete. Immediately following the confirmation
of the successful completion of the stabilization project, work resumed on agency project
requests. This was for a short period before the end of the reporting quarter; therefor meaningful
metrics were not attainable. Reporting will commence for this performance measure in the next
reporting period.
PERFORMANCE MEASURE 25 - Percent on time delivery of Statewide Human Resource, Accounting, and Management Reporting System approved projects to the implementation date
This performance measure tracks the on-time delivery of approved project requests to agencies for
the Statewide Human Resource, Accounting, and Management Reporting (SHARE) enterprise system.
As different projects can have different estimated durations this performance measure will normalize
the duration differences by calculating the days missed as a percentage of the scheduled time. At
present, the data for this performance measure is not available. The information that is required to
report on this measure as in Performance Measure 24 was on hold until the stabilization was
complete. In addition, the Department needs to modify the project request and execution process to
define and capture the specific information required to accurately report on this performance
measure. These process improvements are currently being defined. Reporting for this performance
measure will commence when all process improvements are in place.