fy13 financial results - hitachi high-technologies group · ・maintain and expand top worldwide...
TRANSCRIPT

Copyright ©2014 Hitachi High-Technologies Corporation All Rights Reserved.
FY13 Financial Results
Hitachi High-Technologies Corporation
April 24, 2014
President and Chief Executive Officer Masao Hisada
Vice President and Executive Officer Shunichi Uno

Copyright ©2014 Hitachi High-Technologies Corporation All Rights Reserved.
Contents
2
FY13 Financial Results
1. Outline of FY13
3. FY14 Outlook
2. Management Policy
4. Financial Data

Copyright ©2014 Hitachi High-Technologies Corporation All Rights Reserved.
(Note) YY/M denotes the year and month of the accounting period-end.
(e) denotes the forecast for the previous period (Jan. 2014).
3
1. Outline of FY13

Copyright ©2014 Hitachi High-Technologies Corporation All Rights Reserved.
Sales 6,391
Results Increase/Decrease
Operating
Income Ordinary
Income
Net
Income
304
311
180
+636
+115
+110
+59
+91
+31
-12
Increase/Decrease
Net Income
per Share 131.11yen +42.66yen
Cash Dividend
per Share 30.00yen +10.00yen +10.00yen
-8.49yen
+24
Outline of FY13 (Highlights)
4
YoY vs. Previous Forecast
Ratio Ratio
+11%
+61%
+55%
+48%
+1%
+11%
-6%
+9%
(100 million yen)
ROE 7.0% +2.3% ー
FCF +117 +51 +67

Copyright ©2014 Hitachi High-Technologies Corporation All Rights Reserved.
Outline of FY13 (Explanation of Deviations)
5
Science & Medical
Systems:
Increased 5.2Ybn due to major order for clinical analyzers
from overseas
Industrial & IT
Systems:
Increased 2.9Ybn due to higher shipments of mobile phones
for the U.S. market
Science & Medical
Systems:
Increased 2.8Ybn due to substantially the same reasons as
sales
Fine Technology
Systems: Decreased 0.8Ybn due to decreases capacity utilization, etc.
Sales (630Ybn → 639.1Ybn +9.1Ybn)
Operating Income (28Ybn → 30.4Ybn +2.4Ybn)
vs. Previous Forecast (Jan. 2014)

Copyright ©2014 Hitachi High-Technologies Corporation All Rights Reserved. 6
13/3 14/3(e) 14/3
+13%
+20%
+13%
-1%
5,755
143
941
2,364
+11%
+13% 1,329
1,039
6,391
1,173
172
933
2,670
1,504
6,300
1,175
178
904
2,676
1,451
Sales
(100 million yen)
Outline of FY13 (Sales)
YoY
Electronic Device Systems
Fine Technology Systems
Science & Medical Systems
Industrial & IT Systems
Advanced Industrial Products
Note: Elimination such as subtractions in intersegment transactions, etc., are included in the totals.

Copyright ©2014 Hitachi High-Technologies Corporation All Rights Reserved. 7
-57
137
6
13/3
12
0
128
14/3(e)
-72
205
181
22
6
+61%
+60%
+32%
-48%
+244%
-% (-1.5Ybn)
304
14/3
-64
201
153
22 10
280
190
Outline of FY13 (Operating Income)
Operating Income
(100 million yen) YoY
Electronic Device
Systems
Fine Technology
Systems
Science & Medical
Systems
Industrial & IT
Systems
Advanced Industrial
Products
Note: Elimination such as subtractions in intersegment transactions, etc., are included in the totals.

Copyright ©2014 Hitachi High-Technologies Corporation All Rights Reserved.
Outline of FY13 (Balance Sheet in Summary)
8
Current Assets 3,770 +464 Current Liabilities 1,709 +336
Cash & Deposits/Deposit to
Hitachi Group Cash Management
Fund 1,347 +166 Notes & Accounts Payable 1,057 +213
Notes & Accounts Receivable 1,351 +243 Others 652 +124
Inventories 752 +49 Fixed Liabilities 511 +219
Others 321 +6 Retirement and severance
benefits 493 +228
Fixed Assets 1,179 +149 Others 18 -9
Tangible Fixed Assets 751 +88 Net Assets 2,730 +58
Intangible Fixed Assets 130 -10 Shareholder Capital 2,768 +129
Investments & Other Assets 298 +71 Accumulated Other
Comprehensive Income (Loss) -43 -73
Minority Interests 5 +1
Total Assets 4,949 +613 Total Liabilities &
Shareholders’ Equity 4,949 +613
As of end of March 2014 (100 million yen) vs. 13/3 vs. 13/3
・Shareholders’ Equity per Share: 1,981.00yen (YoY +41.19yen)

Copyright ©2014 Hitachi High-Technologies Corporation All Rights Reserved.
Outline of FY13 (Cash Flow Statement in Summary)
9
14/3 14/3 (100 million yen)
Cash Flow from Operating Activities +363 Cash Flow from Financing Activities -47
Income Before Income Taxes and
Minority Interests +280 Dividends Paid -30
Depreciation and Amortization +94 Others -17
Working Fund -78 Effect of Exchange Rate Changes +31
Income Taxes Paid -63
Others +131
Cash Flow from Investing Activities -247
Capital Expenditures Proceeded
from Sales/Purchase of Securities +1
Capital Expenditures Proceeded from
Sales/Purchase of Property and Equipment -186
Others -61
Free Cash Flow +117
14/3 14/3
Cash and Cash Equivalents
At the Beginning of Year 1,235
Net Increase (Decrease) +101
At the End of Term 1,336
14/3

Copyright ©2014 Hitachi High-Technologies Corporation All Rights Reserved. 10
2. Management Policy

Copyright ©2014 Hitachi High-Technologies Corporation All Rights Reserved. 11
Leading the way for our customers’ future as
a fast-moving creator of cutting-edge business
Becoming a Global Top in high-tech solutions Corporate Vision
Long-Term Management Strategy (CS11)
Long-term Management Strategy for 2020: CS11 (Corporate Strategy 2011: Formulated in 2011)
Vision and Management Strategy ①
1
1. Reorganize the four CS11 target fields into three business domains and prioritize
allocation of investment and resources to these domains
2. Downsize unprofitable businesses in response to shifting market conditions, to
expedite achievement of CS11 objectives
Initiatives to Achieve CS11 Objectives 2

Copyright ©2014 Hitachi High-Technologies Corporation All Rights Reserved.
Vision and Management Strategy ②
Domain Overview
Biotechnology and
healthcare
(1)In vitro diagnostics (2)Biotechnology (DNA sequencers and cell
incubation, etc.) (3)Life informatics (life sciences x IT)
Social infrastructure
Platform solutions for the narrowly defined social infrastructure business,
including new energy, and the scientific instruments and trading businesses
underpinning industry and society at large
Advanced industrial
systems
Manufacturing and inspection equipment for advanced industrial fields
(current: semiconductors, FPD and HDD; new: MEMS, power devices and
others)
Business Domains 3
Four CS11 target fields
Next-generation electronics
Life sciences
Environment and new energy
Social innovation
Three business domains
Biotechnology and healthcare
Social infrastructure
Advanced industrial systems
Biotechnology & medical products
Scientific instruments,
trading business
Electronic device systems, FPD
and HD manufacturing equipment
12

Copyright ©2014 Hitachi High-Technologies Corporation All Rights Reserved.
Management Policy
13
1. Strengthen business portfolio by shifting resources to growing fields
2. Accelerate global growth strategies
3. Strengthen business creation

Copyright ©2014 Hitachi High-Technologies Corporation All Rights Reserved.
Business Strategies for Biotechnology and Healthcare
14
Core businesses
In vitro diagnostics
・Maintain and expand top worldwide market share of automated clinical chemistry
and immunodiagnostic analyzers ・Accelerate development needed to establish future core businesses
(blood coagulation, bacteria, gene testing)
DNA sequencers ・Promote development of next-generation nanopore DNA sequencer technology
New businesses
Cultivate the pharmaceutical and food fields
・Steadily execute plans to bring new products to market
Create a life sciences informatics business
・Accelerate development and commercialization through alliances with partners
New businesses targeting regenerative medicine
・Promote development of cell observation, measurement and incubation equipment
Invest intensively in this top priority field
Actively develop new fields and new businesses in addition to expanding
existing businesses
Clinical analyzers
Labospect 008

Copyright ©2014 Hitachi High-Technologies Corporation All Rights Reserved.
Strengthen as the Company’s core competence
Business Strategies for Social Infrastructure
15
Scientific instruments
Provide solutions to the life sciences, new energy
and new materials fields ・Enhance product lineups and applications
Boost global sales capacity ・Globally expand products with a top market share in Japan
by redeveloping the overseas sales agency network
Strengthen core technologies
Trading
Bolster the platform business ・Pursue business expansion measures based on customers, strengthen cooperative ties
with suppliers
Accelerate global growth strategies ・Established companies in Russia and Mexico
Enhance the business model by promoting the development business
Upgrade platform solutions
Field-emission scanning electron
microscope SU8200 series

Copyright ©2014 Hitachi High-Technologies Corporation All Rights Reserved.
Enhance profitability through selection and concentration
Business Strategies for Advanced Industrial Systems
16
Primary businesses
Semiconductor metrology and inspection equipment
・Bolster the portfolio by adding optical inspection and new
businesses to the core CD-measurement SEMs
Etching systems ・Increase the number of processes won at primary customers ・Upfront development and production support for customers’
cutting-edge processes at overseas engineering sites
Business restructuring
Downsize unprofitable businesses in the electronics field in light of
shifting market conditions along with implementing personnel measures
(FPD manufacturing equipment, etc.)
Accelerate shifting of resources to cutting-edge, growth domains
Etching systems

Copyright ©2014 Hitachi High-Technologies Corporation All Rights Reserved. 17
Revise and strengthen new business creation activities
(established New Business Development Div.) Create top-down themes by strengthening strategy formulation
functions Centralize organizations and schemes, and strengthen
marketing and project management functions
Implementation of aggressive investments
Biotechnology and healthcare ・Promote M&As and alliances to strength in vitro diagnostics and
DNA sequence business Social infrastructure (Trading Divisions) ・Continuously execute investments to enhance and
add value to business models
Expand service business
・Develop solution services that help solve customers problems in addition to
worldwide product maintenance services
Business Strategies for Advanced Industrial Systems

Copyright ©2014 Hitachi High-Technologies Corporation All Rights Reserved. 18
3. FY14 Outlook
Note: YY/M denotes the year and month of the accounting period end.
(e) Denotes the forecast for the present period.

Copyright ©2014 Hitachi High-Technologies Corporation All Rights Reserved.
FY14 Outlook (Highlights)
19
Sales 6,600
FY14 Outlook
Operating Income
Ordinary Income
Net Income
350
350
256
Net Income per Share 186.13yen
Note: FX rate estimate: 1USD=98yen, 1EUR=130yen
+209
+39
+76
+55.02yen
+46
Increase / Decrease
YoY
Ratio
+3%
+13%
+42%
+15%
6,391
FY13 Results
304
311
180
131.11yen
(100 million yen)
Cash Dividend
per Share 30.00yen
ROE 9.0%
FCF +100
±0.00yen
+2.0%
-17
30.00yen
7.0%
+117
Copyright ©2014 Hitachi High-Technologies Corporation All Rights Reserved. 20
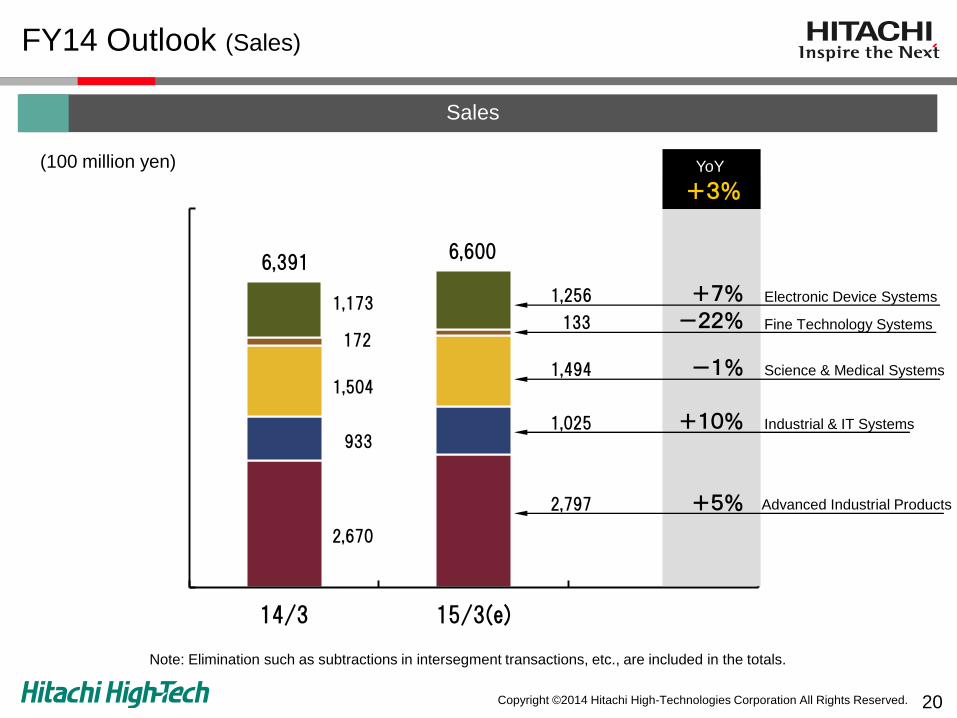
14/3 15/3(e)
+7%
-22%
+5%
+10%
6,391
172
933
2,670
+3%
-1% 1,504
1,173
6,600
1,256
133
1,025
2,797
1,494
FY14 Outlook (Sales)
(100 million yen)
Sales
YoY
Electronic Device Systems
Fine Technology Systems
Science & Medical Systems
Industrial & IT Systems
Advanced Industrial Products
Note: Elimination such as subtractions in intersegment transactions, etc., are included in the totals.

Copyright ©2014 Hitachi High-Technologies Corporation All Rights Reserved. 21
-72
181
22
14/3
6
205
15/3(e)
2
163
167
27
21
+15%
-20%
-8%
+230%
+24%
-% (+7.5Ybn )
0
Operating Income
YoY
Electronic Device
Systems
Fine Technology
Systems
Science & Medical
Systems
Industrial & IT
Systems
Advanced Industrial
Products
Note: Elimination such as subtractions in intersegment transactions, etc., are included in the totals.
(100 million yen)
FY14 Outlook (Operating Income)
304 350

Copyright ©2014 Hitachi High-Technologies Corporation All Rights Reserved.
FY14 Outlook (Electronic Device Systems) ①
22
FY14 Business Environment
Overview of the Semiconductor Manufacturing Equipment Market
■In FY2013, Hitachi High-Tech’s wafer fabrication equipment (WFE) sales grew 22% year on year in
relation to the market growing 12%. Market growth was due to major foundries investing actively in 20nm
and large-scale investment by a South Korean semiconductor maker in a 3D-NAND mass production
plant ■In FY2014, the WFE market is projected to grow by 1% year on year. Growth is expected from large
investments that are being planned for 16/14 nm foundries, along with strong investment in miniaturization
and increased production of mobile device memories ■The need for double-patterning and high-aspect-ratio metrology and inspection equipment for logic devices
is expected to increase in step with growing mass production of FinFET transistors ■Full-fledged development of transistors in patterns finer than 10 nm has started and equipment makers are
responding faster to the needs of new materials, structures and processing methods for new types of
memory ■In the die bonder market, strong demand for memories in mobile devices should persist
■In the high-speed mounter market, a shift to low-price, ultra-high-speed products is expected to accelerate
further in FY2014
EMSs are expected to resume their investments for manufacturing new mobile devices, but the market will
be largely unchanged from FY2013
Overview of the Assembly Equipment Market

Copyright ©2014 Hitachi High-Technologies Corporation All Rights Reserved. 23
実装装置市場
Previous Forecast
2%
5%
13%
FY14 Outlook (Electronic Device Systems) ②
Semiconductor Manufacturing Equipment Market (Reference) Equipment Market Growth Rates (CAGR 2012-2016)
(100 million USD)
YoY
Back-end
Front-end
(Source) Gartner(Apr. 2014)/ HHT’s estimation
Previous forecast is based on published values for Q2/Oct. 2013.
(Source) Gartner(Mar. 2014)/ HHT’s estimation
CAGR for CD-SEM is 2013-2016
357 375
423

Copyright ©2014 Hitachi High-Technologies Corporation All Rights Reserved.
■ FY2014 trends in semiconductor process technology and growing fields
24
FY14 Outlook (Electronic Device Systems) ③
Semiconductor Devices Miniaturization Trends and Our Actions
■ Our Actions
(1) Development of process technologies for cutting-edge devices
・Utilize overseas engineering sites (PEC*2
, PICT*3
) to promote joint development with cutting-edge customers
・Strengthen strategic partnership with imec (consortium)
(2) Utilize modular design methods to develop multi-functionality (high-aspect-ratio processing and metrology,
deep-hole metrology, etc.)
(3) Develop flip chip bonding equipment
Fields Trends Growing technology fields
MPU Development of 10 nm mass
production technology ・Development of new materials and
structural processes
・Metrology and inspection technology
for DP*1
and FinFET mass production
ASSP Full-scale launch of 20 nm
mass production Shift from pre-mass production
to mass production line
installation of 16/14 nm FinFET
NAND Investment in 10nm-generation
miniaturization Launch year of 3D-NAND mass
production
・High-aspect-ratio multilayer etching
・Metrology and inspection technology for
high-aspect-ratio hole
Packaging Multi-layer packaging (memory) Flip chip mounting
・High-precision thin-die bonding
technology
*1DP: Double Patterning
*2 PEC: Process Engineering Center (U.S.A.) *3 PICT: Process Innovation Center (Taiwan)

Copyright ©2014 Hitachi High-Technologies Corporation All Rights Reserved.
662 656
537
667
0
400
800
13/1H 13/2H 14/1H(e) 14/2H(e)
25
14/3 1,317 15/3 1,204 -9%
-19%
+2% +33% +28%
+31%
FY14 Outlook (Electronic Device Systems) ④
Changes in Order Received
(100 million yen)
Previous Forecast
YoY

Copyright ©2014 Hitachi High-Technologies Corporation All Rights Reserved.
144 153
558 602
471 501
0
700
1,400
14/3 15/3(e)
FY14 Outlook (Electronic Device Systems) ⑤
26
Sales Change in Main Businesses Sales Ratio by Fields (Front-end Equip.)
FY14 Strategies
1,173
YoY
+7%
+8%
+6%
1,256
+6%
(100 million yen)
Process
Equip.
Metrology &
Inspection
Equip.
Back-end &
Assembly
Equip.
1. Accelerate global growth strategies Win global customers and achieve segment leadership by promoting early collaboration and enhancing engineering sites
2. Promote business portfolio optimization Develop new fields by enhancing the product lineup with core technologies
FY13: Robust investment in foundries and MPUs
Increased investment in DRAM
FY14: Continued investment in foundries and MPUs
Investments in NAND and Logic increase
DRAM NAND Logic Others Foundry MPU
0% 50% 100%
15/3(e)
14/3

Copyright ©2014 Hitachi High-Technologies Corporation All Rights Reserved.
155
100
17
34
0
100
200
14/3 15/3(e)
FY14 Outlook (Fine Technology Systems)
27
YoY
-23%
Sales Changes in main products Business Portfolio Strategy
FY14 Strategies
172
+93%
133
-36%
1. Accelerate shift in resources mainly into the social infrastructure inspection business and
factory automation (FA)-related equipment business, etc.
2. Expand and enhance FPD and HD-related service businesses
(100 million yen)
Social
Infrastructure
Inspection
Environment
& Electronics
・ Accelerate a shift in resources by positioning
business segments leveraging core technologies as growth
businesses
・ Reform the business structure and expand business content
・Optical-sensoring technology ・Robotics
・Image processing technology
・High-speed signal processing technology, etc.
Core
Technologies
・Railway inspection equipment
・Power transmission line
inspection equipment
Gro
wth
Bu
sin
esses
Social infrastructure
inspection business Environment & electronics
business
・FA-related equipment
・Lithium-ion battery-
related businesses,
printed electronics
・FPD and HD-related
post-sales services
Expliner High-Voltage Transmission
Line Inspection Robot

Copyright ©2014 Hitachi High-Technologies Corporation All Rights Reserved.
0
2,000
4,000
3,600
CY13 CY14(e) CY15(e)
3,750 3,900
FY14 Outlook (Science & Medical Systems) ① Scientific Instruments
28
Scientific Instruments Market (HHT-related) FY14 Business Environment
(100 million yen)(based on sales) CAGR +4%
Elemental
Analysis
Spectroscopic
Analysis
Separation
Analysis
Scanning probe
Microscope
Thermal Analysis
X-ray fluorescence
Analysis
FIB
Electron
Microscopes
Electron Microscopes
・Domestic demand to increase from a recovery in
private-sector corporate earnings, even though
demand from Japan’s supplementary fiscal budgets
are expected to wane
・Demand to increase in cutting-edge fields (new
energy, new materials and life sciences) for the
next generation
Separation Analysis
・Demand to increase for ultra-high-speed liquid
chromatographs in the pharmaceutical field even
while declining for general models
X-ray fluorescence Analysis
・Demand for metal particle contamination
inspections to expand in the lithium-ion battery
market
・Replacement demand to increase in RoHS
inspection equipment
Thermal Analysis
・Demand for evaluating thermal characteristics of
functional materials to increase
(Source) Estimates by HHT based on data from market research firms

Copyright ©2014 Hitachi High-Technologies Corporation All Rights Reserved.
Integrate Hitachi High-Tech’s analytical instruments
business with HHS to expand the product portfolio
and leverage the sales networks of both companies
to increase sales
Introduce products that were jointly developed with
HHS (FIB-SEM, etc.) to the market by
strengthening core technologies
Cultivate the environment and new energy field
further by expanding sales of metal particle
contamination inspection equipment for lithium-ion
batteries and fuel cells
Create a market for barometric
pressure scanning electron
microscopes in the new
materials and life sciences
fields and expand sales
296 318
274 276
0
300
600
14/3 15/3(e)
FY14 Outlook (Science & Medical Systems) ② Scientific Instruments
29
570 594
YoY
+4%
Sales Change in Main Businesses Future Actions
FY14 Strategies
+1%
+8%
1. Maximize synergies with Hitachi High-Tech Science Corporation (HHS)
2. Expand sales of dedicated tools for the environment and new energy, new materials,
and life sciences fields
Other
Scientific
Instr.
Electron
Microscopes
(100 million yen)
Barometric pressure
scanning electron microscope

Copyright ©2014 Hitachi High-Technologies Corporation All Rights Reserved.
0
10,000
20,000
30,000
40,000
FY14 Outlook (Science & Medical Systems) ③ Biotechnology & Medical Products
30
Biotechnology Product/Clinical Analyzer Market
(HHT-related)
FY14 Business Environment
CAGR +6% (100 million yen)(based on sales)
DNA Sequencer
Biochemistry &
Immunodiagnostics
Other in Vitro
Diagnostics
(Source) Estimates by HHT based on data from market research firms (reagent and equipment included)
In Vitro Diagnostics ・ The clinical chemistry and immunodiagnostic
analyzer market is projected to continuing growing
at an annual rate of 4-5%. Reagents account for the
bulk of these markets
・ The market for Europe the U.S. and other
developed countries is projected to grow 2-3%,
while the market for China and other emerging
countries is forecast to grow 10%
・ Solid growth is forecast in the medium term for
equipment sales, with growing demand from
emerging markets while the EU market gradually
recovers
DNA Sequencers
・ Demand for CE* sequencers has held firm as they
are strongly positioned as the industry’s de facto
standard. The reliability of Hitachi High-Tech’s CE
sequencers has garnered acclaim from around the
world, particularly in identifying bodily remains
(medical jurisprudence) for criminal investigations
and after disasters
32,900 34,700
36,700
CY13 CY14(e) CY15(e)
* CE: Capillary Electrophoresis

Copyright ©2014 Hitachi High-Technologies Corporation All Rights Reserved.
795 771
138 129
0
500
1,000
14/3 15/3(e)
FY14 Outlook (Science & Medical Systems) ④ Biotechnology & Medical Products
31
Sales Change in Main Businesses Future Actions
FY14 Strategies
YoY
-4% 933
900
-3%
-7%
1. Expand sales of clinical chemistry and immunodiagnostic analyzers by launching
a new automated clinical laboratory testing system
2. Promote sales of CE sequencers in fields with growing demand
3. Promote development of next-generation sequencer technology
(100 million yen)
Medical
Products
Biotechnology
Products,
Others
Expand sales to large-scale medical facilities in
Europe with proposals combining new automated
clinical laboratory systems with large-scale
automated clinical analyzers
Steadily capture new and replacement demand in
the market for medical jurisprudence in
identifying bodily remains with the model 3500
CE sequencer.
Promote collaborative development of nanopore
DNA sequencer technology with Base4
Innovation Ltd. of the U.K.
cobas® 8100
automated workflow series
cobas® 8000
modular analyzer series

Copyright ©2014 Hitachi High-Technologies Corporation All Rights Reserved.
FY14 Strategies
FY14 Outlook (Industrial & IT Systems) (Advanced Industrial Products) ①
32
Hitachi Group
products & functions
Hitachi High-Tech
products & functions Products & functions
outside the Hitachi Group
Business
Collaboration
Demonstration of Trading Functions Noteworthy Business
1. Cultivate trading company functions further to strengthen business foundations
Develop a strategic approach by sharing information, leveraging the Group’s abundant data on customers and suppliers
2. Promote investments for developing new lines of business
Create business lines with high added value in the shared automotive, mobile communications, materials and energy fields
3. Improve profitability by providing solutions from a customer’s perspective
Improve profitability by promptly grasping customers’ needs and providing services with added value
GX1000 Series
High-end model
Remote backup model
Office model
*All are domestic models
WAN Accelerator
Stems the performance-drop
of global communication lines
in long-distance transmission,
thereby realizing efficient data
transmission
Tempered glass
for smartphones

Copyright ©2014 Hitachi High-Technologies Corporation All Rights Reserved.
371 396
1,102 1,045
409 481
787 874
0
1,500
3,000
14/3 15/3(e)
(1,574)
(620)
(1,171)
(3,762)
505 463
429 562
0
600
1,200
14/3 15/3(e)
FY14 Outlook (Industrial & IT Systems) (Advanced Industrial Products) ②
33
Changes in Sales (Industrial & IT Systems)
2,797 2,670
-8%
+31%
1,025
Changes in Sales (Advanced Industrial Products)
933
(100 million yen) (100 million yen)
Industrial Solutions
ICT
Solutions
Industrial
C&M**
Automobile/
Transportation
C&M
Electronic C&M
Fine Chemicals,
Others
YoY
+10% YoY
+5%
+18%
-5%
+11%
+7%
*ICT: Information and Communication Technology *Figures in parenthesis are transaction amounts that include net transaction amounts
**C&M: Components & Materials

Copyright ©2014 Hitachi High-Technologies Corporation All Rights Reserved. 34
4. Financial Data
Note: YY/M denotes the year and month of the accounting period end.
(e) Denotes the forecast for the present period.

Copyright ©2014 Hitachi High-Technologies Corporation All Rights Reserved.
Changes in Quarterly Results
35
(100 million yen)
FY13
1Q
FY13
2Q
FY13
3Q
FY13
4Q
Sa
les / O
pe
ratin
g In
co
me
Electronic Device
Systems
Sales 213 283 274 403
Operating Income 13 39 58 96
Fine Technology
Systems
Sales 12 28 16 116
Operating Income -20 -15 -18 -20
Science & Medical
Systems
Sales 291 371 333 508
Operating Income 16 43 37 85
Industrial & IT Systems Sales 171 258 183 322
Operating Income -9 4 -6 17
Advanced Industrial
Products
Sales 642 667 670 692
Operating Income 6 4 8 3
Others &
Elimination/Corporate
Sales -15 -15 -15 -16
Operating Income -7 -12 -7 -12
Total
Sales 1,315 1,592 1,460 2,024
Operating Income 0 63 72 169
Ordinary Income 5 62 74 171
Net Income -15 51 49 96

Copyright ©2014 Hitachi High-Technologies Corporation All Rights Reserved.
Capital Expenditure/ Depreciation Costs/ R&D /
Sales by Region
36
■Capital Expenditures/Depreciation Costs/R&D
■Sales by Region
(100 million yen)
13/3 14/3 YoY 15/3(e) YoY
Capital Expenditure 117 189 +62% 180 -5%
Depreciation Costs 78 94 +20% 119 +27%
R&D 218 211 -3% 228 +8%
Japan North
America Europe
Asia
Other Total Mainland
China
13/3 Sales 2,524 630 686 1,776 790 139 5,755
Ratio 43.9% 10.9% 11.9% 30.9% 13.7% 2.4% 100.0%
14/3
Sales 2,667 854 780 2,000 850 89 6,391
Ratio 41.7% 13.4% 12.2% 31.3% 13.3% 1.4% 100.0%
(100 million yen)
Note: Capital expenditure is based on acquisition base

Copyright ©2014 Hitachi High-Technologies Corporation All Rights Reserved.
Sales Change in Main Business
37
(億円) FY13/Q1 FY13/Q2 FY13/Q3 FY13/Q4
Electronic Device Systems 213 283 274 403
Process Equipment 90 110 150 121
Metrology & Inspection Equipment 82 119 106 250
Back-end & Assembly Equipment 41 54 18 33
Fine Technology Systems 12 28 16 116
Environment & Electronics 12 25 12 106
Social Infrastructure Inspection 0 3 4 10
Science & Medical Systems 291 371 333 508
Electron Microscopes 38 78 62 117
Other Scientific Instr. 51 65 60 99
Medical Products 171 195 178 252
Biotechnology Products, Others 31 33 34 41
Industrial & IT Systems 171 258 183 322
Industrial Solutions 67 99 78 186
ICT Solutions 105 159 105 136
Advanced Industrial Products 642 667 670 692
Industrial C&M 188 192 201 206
Automobile/Transportation C&M 90 98 105 116
Electronic C&M 277 278 266 281
Fine Chemicals, Others 86 98 98 89
(100 million yen)

Copyright ©2014 Hitachi High-Technologies Corporation All Rights Reserved. 38
Notes on the data
1. All financial statement summaries and results predictions included in this presentation are on a consolidated basis unless otherwise stated.
Numerical data is rounded off to the nearest 100 million yen.
2. In its disclosures, Hitachi High-Technologies may make statements that constitute forward-looking statements that reflect management‘s views with
respect to certain future events and financial performance at the time of disclosure. Such statements are based on information available at the time
of disclosure and may differ from actual results due to various external factors, both direct and indirect. In the event of a major discrepancy with the
items disclosed, the Company will disclose on a case-by-case basis based on the law and/or the timely disclosure rules and regulations of the stock
exchanges on which the Company is listed.
The information included in this material is for reference when investing, and not a canvass to invest. Brand selection and the final decision is at your
own judgment.

Copyright ©2014 Hitachi High-Technologies Corporation All Rights Reserved.
FY13 Financial Results
39
For further information
Hiroyuki Kato
General Manager
CSR & Corporate Communications Dept.
CSR Div.
TEL:+81-3-3504-5138 FAX:+81-3-3504-5943
E-mail:[email protected]