fy12 summary report on liquid-liquid contactor experiments ... · fy12 summary report on...
TRANSCRIPT
ANL-LTR-CERT-12-002
FY12 Summary Report on Liquid-Liquid Contactor Experiments for CFD Model Validation
Chemical Sciences and Engineering Division

About Argonne National Laboratory Argonne is a U.S. Department of Energy laboratory managed by UChicago Argonne, LLC under contract DE-AC02-06CH11357. The Laboratory’s main facility is outside Chicago, at 9700 South Cass Avenue, Argonne, Illinois 60439. For information about Argonne and its pioneering science and technology programs, see www.anl.gov. Availability of This Report This report is available, at no cost, at http://www.osti.gov/bridge. It is also available on paper to the U.S. Department of Energy and its contractors, for a processing fee, from:
U.S. Department of Energy Office of Scientif ic and Technical Information P.O. Box 62 Oak Ridge, TN 37831-0062 phone (865) 576-8401 fax (865) 576-5728 [email protected]
Disclaimer This report was prepared as an account of work sponsored by an agency of the United States Gov ernment. Neither the United Sta tes Gov ernment nor any agency thereof , nor UChicago Argonne, LLC, nor any of their employ ees or of f icers, makes any warranty , express or implied, or assumes any legal liability or responsibility f or the accuracy , completeness, or usef ulness of any information, apparatus, product, or process disclosed, or represents that its use would not inf ringe priv ately owned rights. Ref erence herein to any specif ic commercial product, process, or serv ice by trade name, trademark, manuf acturer, or otherwise, does not necessarily constitute or imply its endorsement, recommendation, or f av oring by the United States Gov ernment or any agency thereof . The v iews and opinions of document authors expressed herein do not necessarily state or ref lect those of the United States Gov ernment or any agency thereof , Argonne National Laboratory , or UChicago Argonne, LLC.
ANL-LTR-CERT-12-002
FY12 Summary Report on Liquid-Liquid Contactor
Experiments for CFD Model Validation prepared by Kent E. Wardle
Chemical Sciences and Engineering Division, Argonne National Laboratory
September 28, 2012
work sponsored by
U.S. Department of Energy, Office of Nuclear Energy, Science and Technology
FY12 Summary Report on Liquid–Liquid Contactor
Experiments for CFD Model Validation
Kent E. Wardle∗
Chemical Sciences and Engineering Division
Argonne National Laboratory
Argonne, IL 60439, U.S.A.
28 September 2012
1 Introduction
This report presents a summary of preliminary experiments performed in the latter half of FY12 us-
ing the capability of the Contactor Electrical Resistance Tomography (CERT) Facility. This facility
includes the capability for multiphase measurements of flow in liquid–liquid contactors using ERT
as well as high-speed imaging with the current test focus on an instrumented engineering-scale
annular centrifugal contactor having a 5 inch rotor (CINC-V5). In addition, a smaller CINC-V2
(2 inch rotor) contactor was also added to the facility and made possible the exploration of equip-
ment scaling for liquid–liquid operation. The purpose of the efforts during this current FY were to
explore a range of flow conditions for multiphase operation to gain broad insight into observable
trends and quantities after which detailed measurements will be made for specific controlled test
conditions to provide data for validation of advanced computational fluid dynamics models which
are being developed under a separate work package (FT-12AN030901). In FY13, this project
and the CFD modeling project are to be combined into a single Work Package named “Contactor
Modeling and Validation Data”.
In addition to the CINC-V2 contactor that was added to the facility during this period, we also
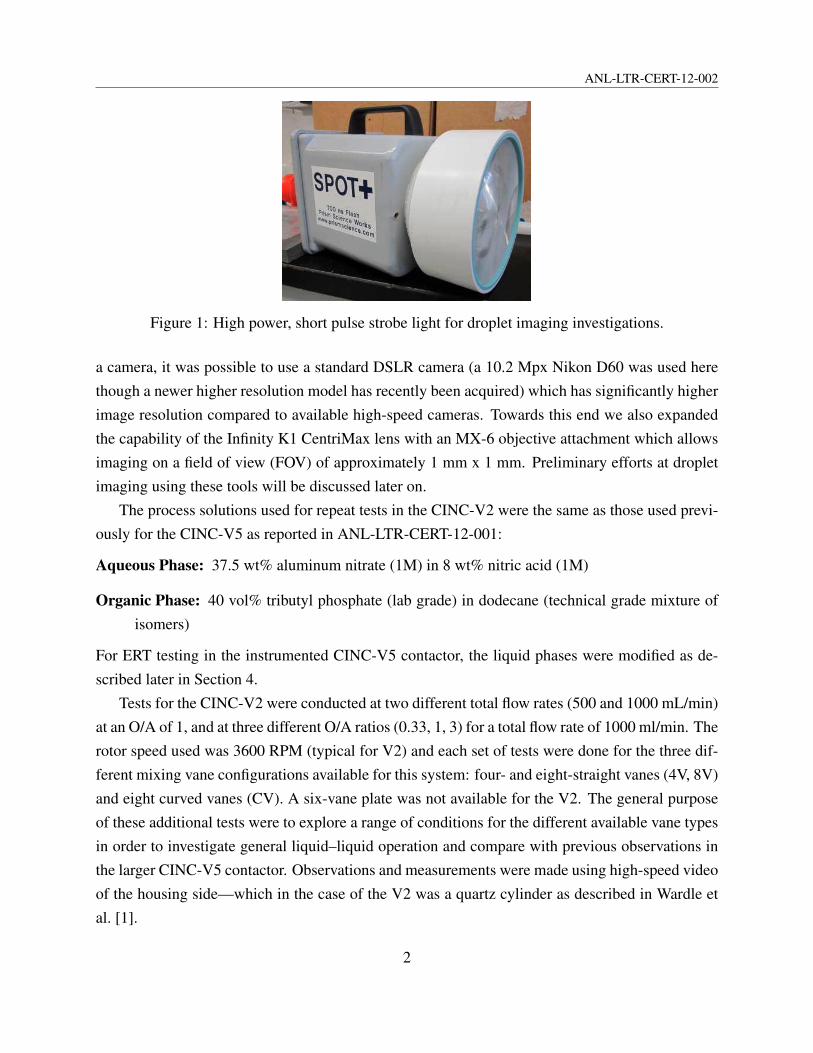
acquired a high-power, short pulse (700 ns) strobe light (Prism Science’s SPOT+ unit) for use in
obtaining short exposure images of liquid–liquid droplets for size distribution investigations. As
the short pulse of the strobe allows for an ‘effective’ shuttering speed of 700 ns when synced with
1
ANL-LTR-CERT-12-002
Figure 1: High power, short pulse strobe light for droplet imaging investigations.
a camera, it was possible to use a standard DSLR camera (a 10.2 Mpx Nikon D60 was used here
though a newer higher resolution model has recently been acquired) which has significantly higher
image resolution compared to available high-speed cameras. Towards this end we also expanded
the capability of the Infinity K1 CentriMax lens with an MX-6 objective attachment which allows
imaging on a field of view (FOV) of approximately 1 mm x 1 mm. Preliminary efforts at droplet
imaging using these tools will be discussed later on.
The process solutions used for repeat tests in the CINC-V2 were the same as those used previ-
ously for the CINC-V5 as reported in ANL-LTR-CERT-12-001:
Aqueous Phase: 37.5 wt% aluminum nitrate (1M) in 8 wt% nitric acid (1M)
Organic Phase: 40 vol% tributyl phosphate (lab grade) in dodecane (technical grade mixture of
isomers)
For ERT testing in the instrumented CINC-V5 contactor, the liquid phases were modified as de-
scribed later in Section 4.
Tests for the CINC-V2 were conducted at two different total flow rates (500 and 1000 mL/min)
at an O/A of 1, and at three different O/A ratios (0.33, 1, 3) for a total flow rate of 1000 ml/min. The
rotor speed used was 3600 RPM (typical for V2) and each set of tests were done for the three dif-
ferent mixing vane configurations available for this system: four- and eight-straight vanes (4V, 8V)
and eight curved vanes (CV). A six-vane plate was not available for the V2. The general purpose
of these additional tests were to explore a range of conditions for the different available vane types
in order to investigate general liquid–liquid operation and compare with previous observations in
the larger CINC-V5 contactor. Observations and measurements were made using high-speed video
of the housing side—which in the case of the V2 was a quartz cylinder as described in Wardle et
al. [1].
2
ANL-LTR-CERT-12-002
2 Comparison of Scaling: High-speed Imaging of CINC-V2
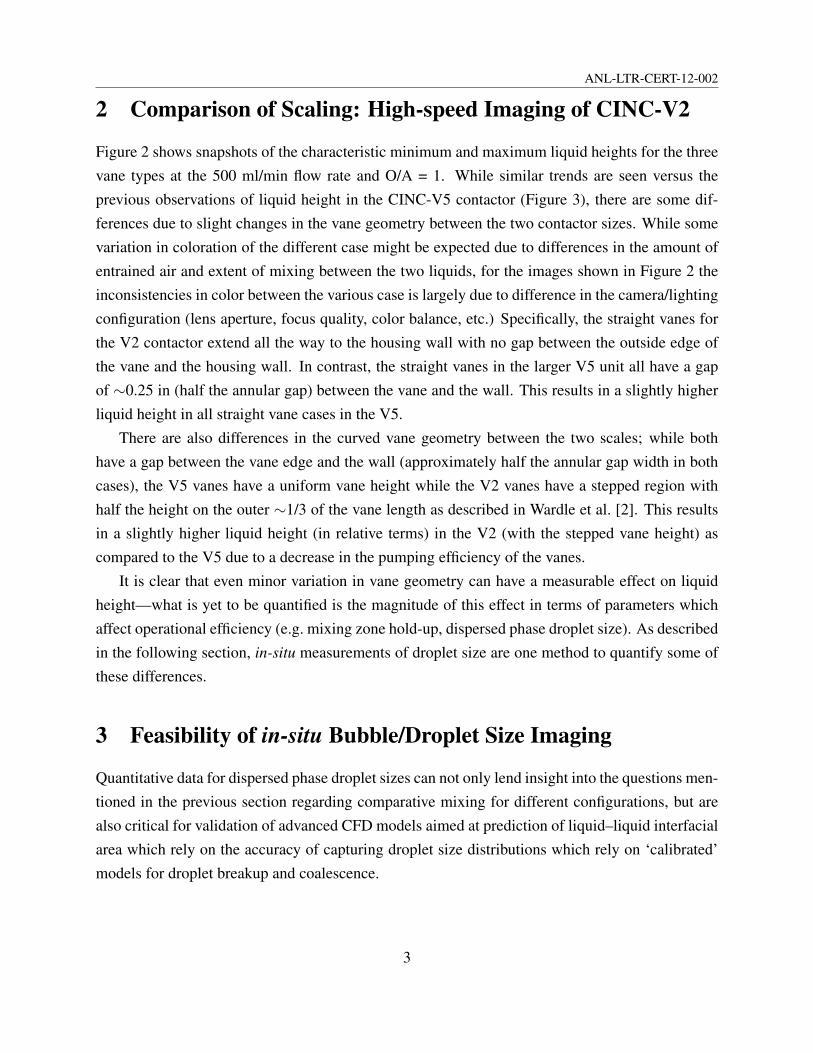
Figure 2 shows snapshots of the characteristic minimum and maximum liquid heights for the three
vane types at the 500 ml/min flow rate and O/A = 1. While similar trends are seen versus the
previous observations of liquid height in the CINC-V5 contactor (Figure 3), there are some dif-
ferences due to slight changes in the vane geometry between the two contactor sizes. While some
variation in coloration of the different case might be expected due to differences in the amount of
entrained air and extent of mixing between the two liquids, for the images shown in Figure 2 the
inconsistencies in color between the various case is largely due to difference in the camera/lighting
configuration (lens aperture, focus quality, color balance, etc.) Specifically, the straight vanes for
the V2 contactor extend all the way to the housing wall with no gap between the outside edge of
the vane and the housing wall. In contrast, the straight vanes in the larger V5 unit all have a gap
of ∼0.25 in (half the annular gap) between the vane and the wall. This results in a slightly higher
liquid height in all straight vane cases in the V5.
There are also differences in the curved vane geometry between the two scales; while both
have a gap between the vane edge and the wall (approximately half the annular gap width in both
cases), the V5 vanes have a uniform vane height while the V2 vanes have a stepped region with
half the height on the outer ∼1/3 of the vane length as described in Wardle et al. [2]. This results
in a slightly higher liquid height (in relative terms) in the V2 (with the stepped vane height) as
compared to the V5 due to a decrease in the pumping efficiency of the vanes.
It is clear that even minor variation in vane geometry can have a measurable effect on liquid
height—what is yet to be quantified is the magnitude of this effect in terms of parameters which
affect operational efficiency (e.g. mixing zone hold-up, dispersed phase droplet size). As described
in the following section, in-situ measurements of droplet size are one method to quantify some of
these differences.
3 Feasibility of in-situ Bubble/Droplet Size Imaging
Quantitative data for dispersed phase droplet sizes can not only lend insight into the questions men-
tioned in the previous section regarding comparative mixing for different configurations, but are
also critical for validation of advanced CFD models aimed at prediction of liquid–liquid interfacial
area which rely on the accuracy of capturing droplet size distributions which rely on ‘calibrated’
models for droplet breakup and coalescence.
3
ANL-LTR-CERT-12-002
Figure 2: Snapshots from high-speed imaging of flow at 500 ml/min, O/A=1 for the three vane
types (4V, 8V, CV) showing minimums (bottom row) and maximums (top row) in liquid height.
The height of the organic inlet is noted on the 4V lower image for reference.
4

ANL-LTR-CERT-12-002
Figure 3: Time average from high-speed video for liquid height in mixing zone of CINC-V5
contactor at 5 and 10 LPM, O/A = 1, 1800 RPM. For reference the height of the inlet is just above
the top of the image.
Recently, a research effort at Sandia (Wyatt et al., unpublished)1 has conducted droplet size dis-
tribution measurements in a CINC-V2 annular centrifugal contactor (with curved housing vanes
[cast]2). While this work has not yet been published, it provides the only available data set of this
type and the researchers were kind enough to discuss their methods and even supply preliminary
data for comparison with simulations conducted under the companion modeling project to this cur-
rent effort. The experiments at Sandia were done at a total flow rate of 300 ml/min—significantly
1This project was funded internally through an LDRD which ends in FY12 and was unfortunately only discov-
ered (and then, only serendipitously) by Wardle very recently (July 2012) else earlier collaboration would have been
possible.2Very late in FY12, an additional vane plate having 4 straight vanes was sent from Argonne to Sandia and a brief
round of tests was planned prior to the close of the project funding there. Note that the curved vanes used in the Sandia
contactor are slightly different from those reported in Wardle et al. [2] which were machined rather than cast. For the
cast vanes, the vane height was constant and did not have the lower stepped region near the outer portion as in the case
of the machined ones. It is thought this may actually result in slightly lower annular liquid height in the cast curved
vanes compared to the earlier machined version. This was seen to be the case for full height vanes in the larger V5
contactor.
5
ANL-LTR-CERT-12-002
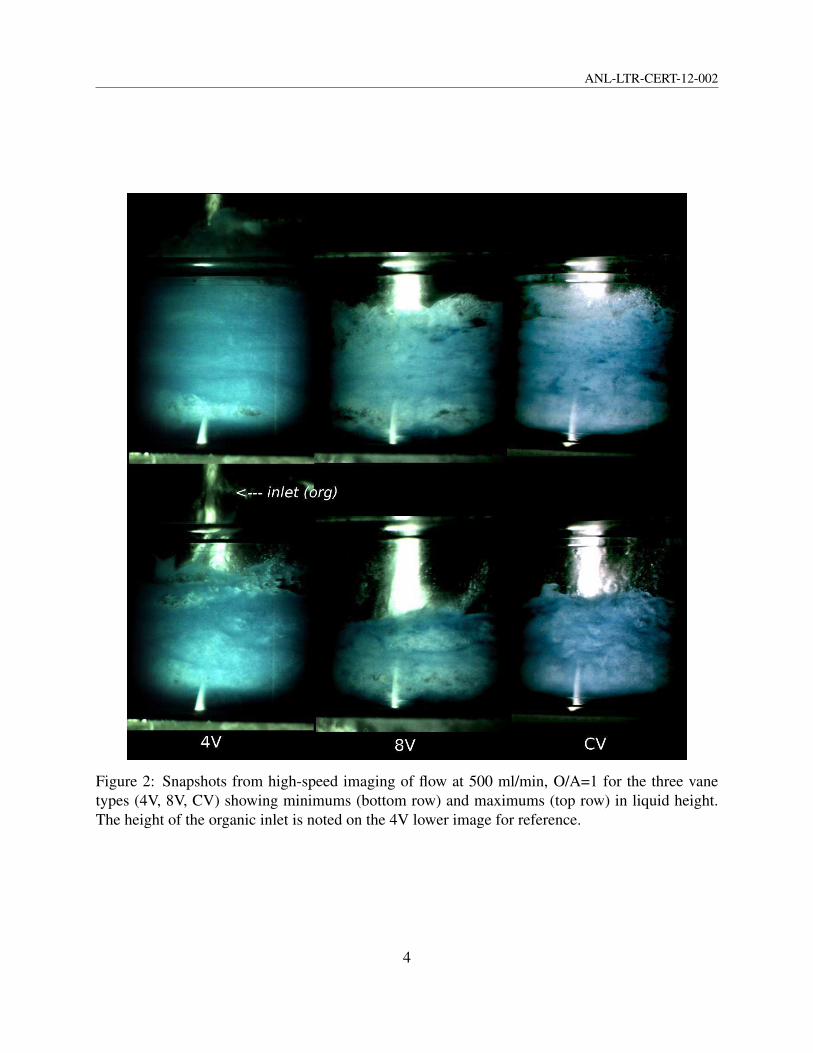
lower than for typical operation—and for varying O/A ratios less than 0.333 (O:A, 1:3) for or-
ganic dispersion in water. Only the data for O/A = 0.333 is used here. The organic phase was
polydimethylsiloxane (PDMS, ρ = 0.918) dyed with fluorescent Nile Red to aid in phase discrim-
ination and the droplet size was determined through manual analysis of high-speed imaging with a
minimum visible radius in the range of ∼10 microns. Data was taken for rotor speeds ranging from
1100 to 3000 RPM. Two different PDMS compositions were used having kinematic viscosities of
5 and 20 cSt. These data have obvious limitations (low flow rate, organic dispersed only, curved
vanes only [liquid height in mixing zone was not documented, but was likely quite low]) which
make the conditions less than ideal for equipment performance. However, they are the only data
currently available and at a minimum demonstrate the feasibility of performing in-situ droplet size
measurements in centrifugal contactors. As an example of the data obtained, Figure 4 shows a plot
of the size distributions at several rotor speeds for O/A = 0.333.
Given the budgetary constraints of this project in the current FY, only a preliminary effort was
made to perform our own measurements of this kind. Due to the critical nature of this data to
the success of companion simulation efforts, it is planned that more directed effort will be put
towards this important task in FY13. Even so, given the funding levels of the combined computa-
tional/experimental FY13 Work Package, only targeted experiments will be feasible.
Our preliminary investigations were conducted using the SPOT+ strobe light and SLR camera
system to look at droplets in liquid–liquid dispersions. Tests were done with nitric acid/dodecane-
Figure 4: Droplet size distribution data from Wyatt et al. for PDMS dispersed in water in a CINC-
V2 at an O/A of 0.333.
6

ANL-LTR-CERT-12-002
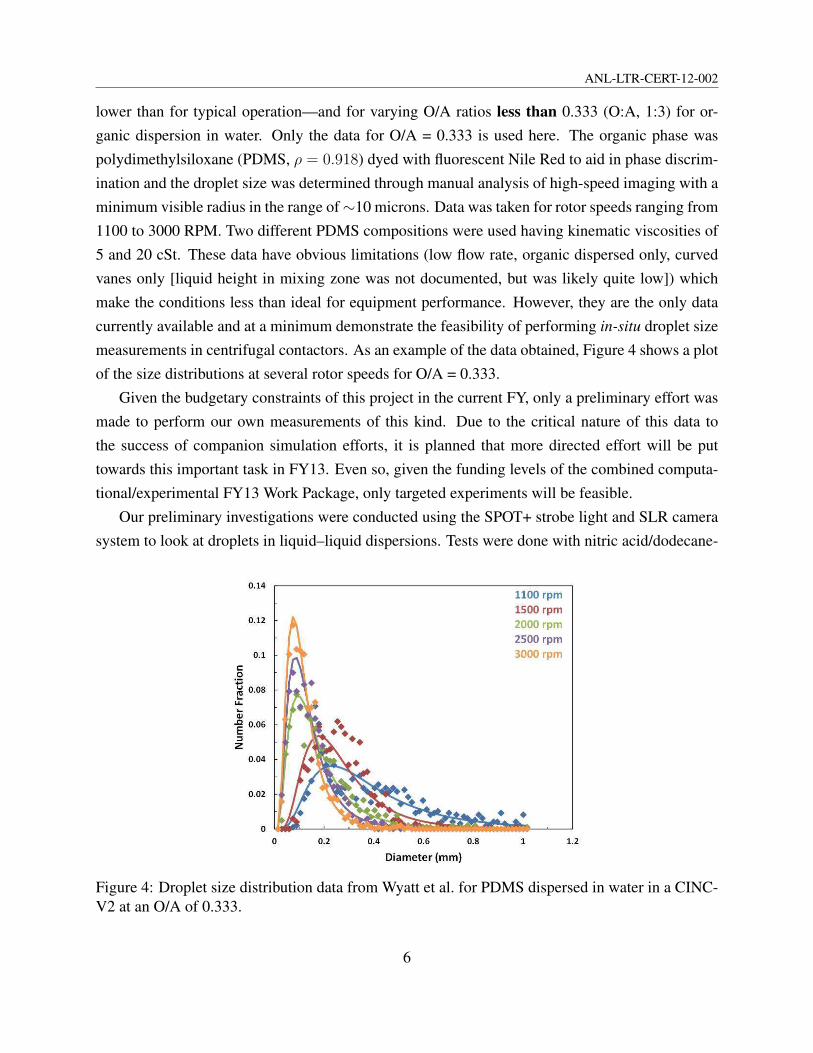
TBP phase pairs for aqueous-dyed (methylene blue) or organic dyed (Nile Red) conditions. Fig-
ure 5 shows an example for successive snapshots of a coalescing liquid–liquid dispersion (O/A =
0.333, 30 vol%TBP in dodecane and 0.01 M nitric acid) in a graduated cylinder where the time be-
tween images is approximately 3-5 s. While many overlapping droplets can be visually identified
and manual measurement using ImageJ (or other similar software) has been demonstrated, all at-
tempts at developing an automatic image analysis tool have been unsuccessful. This is a generally
remarked challenge for all liquid–liquid droplet size measurements reported in the literature—the
phase contrast is so small that common methods including thresholding, binary transformation,
and circle detection fail to work or are not efficient enough to give a representative picture of
the full size distribution (e.g. bias towards specific scales). Preliminary measurements were also
taken during operation of the V2 contactor. From the preliminary testing that has been done, the
following list outlines some significant, but not insurmountable, challenges to in-situ droplet size
measurements:
Camera focusing: For the very small field of view (∼1 mm x 1 mm) provided by the microscope-
like lens required for these measurements, there is a very narrow depth-of-field which makes
focusing the image a significant challenge. In addition vibrations also become problematic
and care must be taken to isolate the camera and lens. Modification to the setup have been
made which should help in this regard for future measurements. This includes a vibration
isolated optical breadboard and 3-axis translation stages for the camera mounting which
should enable very fine movements of the entire camera to aid in focusing.
Phase discrimination: Contrast between the two liquids is very limited—unlike bubbles, which
are much more distinguishable (see Figure 5). Fluorescent dye can help but does not com-
pletely solve this issue. Adequate lighting is, of course, a very related challenge; however,
it appears that the SPOT+ strobe gives very good light output—so much so that the camera
lens aperture had to be nearly closed to get good contrast. Too much light is a good problem
to have as it provides greater flexibility and range of operation.
Phase loading limitations: Droplet identification at high phase loading (O/A near 1) becomes a
challenge as droplets are packed very densely and multiple overlapping droplets can be seen.
This is evident in the images shown in Figure 5.
Image analysis: As noted earlier and related to the above items in this list, image analysis is a
significant challenge. It requires painstaking manual analysis of images in which user must
identify each droplet individually. It may be possible to develop a more automated method
7
ANL-LTR-CERT-12-002
Figure 5: Evolution (from top left) of drop size for a coalescing liquid–liquid dispersion in a
graduated cylinder. Along with the many liquid drops, some air bubbles are also visible (e.g. large
bubble near interface in bottom row, middle image).
8
ANL-LTR-CERT-12-002
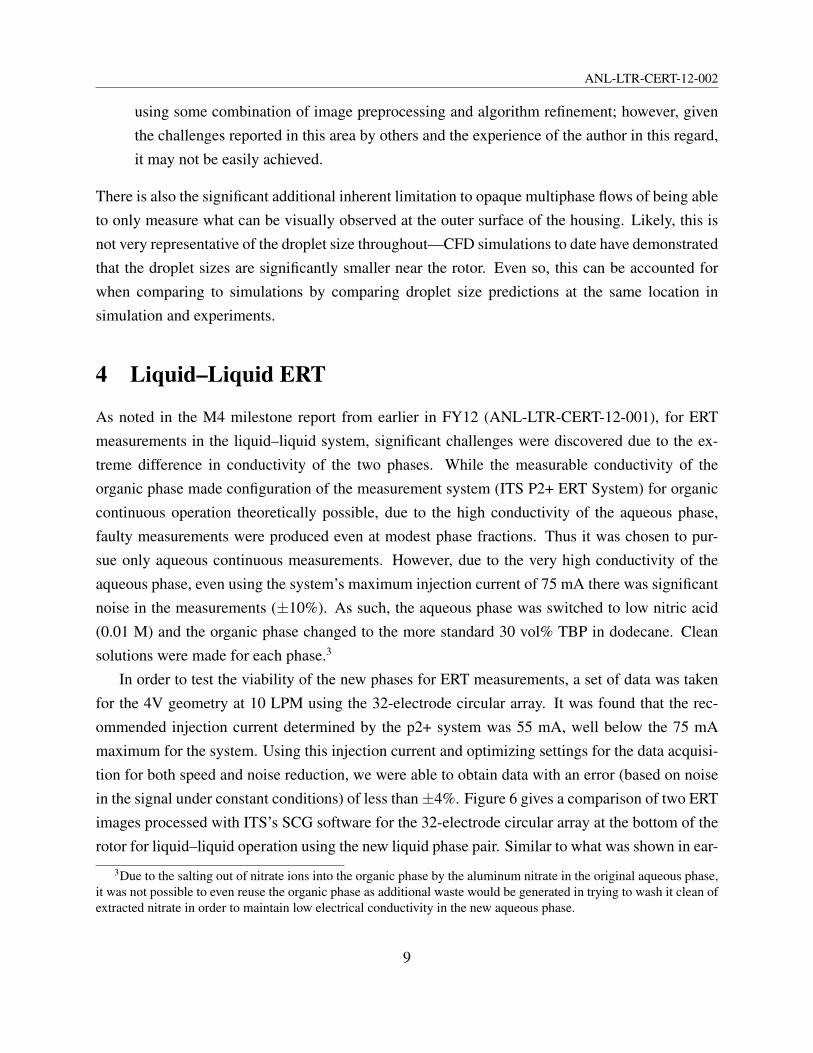
using some combination of image preprocessing and algorithm refinement; however, given
the challenges reported in this area by others and the experience of the author in this regard,
it may not be easily achieved.
There is also the significant additional inherent limitation to opaque multiphase flows of being able
to only measure what can be visually observed at the outer surface of the housing. Likely, this is
not very representative of the droplet size throughout—CFD simulations to date have demonstrated
that the droplet sizes are significantly smaller near the rotor. Even so, this can be accounted for
when comparing to simulations by comparing droplet size predictions at the same location in
simulation and experiments.
4 Liquid–Liquid ERT
As noted in the M4 milestone report from earlier in FY12 (ANL-LTR-CERT-12-001), for ERT
measurements in the liquid–liquid system, significant challenges were discovered due to the ex-
treme difference in conductivity of the two phases. While the measurable conductivity of the
organic phase made configuration of the measurement system (ITS P2+ ERT System) for organic
continuous operation theoretically possible, due to the high conductivity of the aqueous phase,
faulty measurements were produced even at modest phase fractions. Thus it was chosen to pur-
sue only aqueous continuous measurements. However, due to the very high conductivity of the
aqueous phase, even using the system’s maximum injection current of 75 mA there was significant
noise in the measurements (±10%). As such, the aqueous phase was switched to low nitric acid
(0.01 M) and the organic phase changed to the more standard 30 vol% TBP in dodecane. Clean
solutions were made for each phase.3
In order to test the viability of the new phases for ERT measurements, a set of data was taken
for the 4V geometry at 10 LPM using the 32-electrode circular array. It was found that the rec-
ommended injection current determined by the p2+ system was 55 mA, well below the 75 mA
maximum for the system. Using this injection current and optimizing settings for the data acquisi-
tion for both speed and noise reduction, we were able to obtain data with an error (based on noise
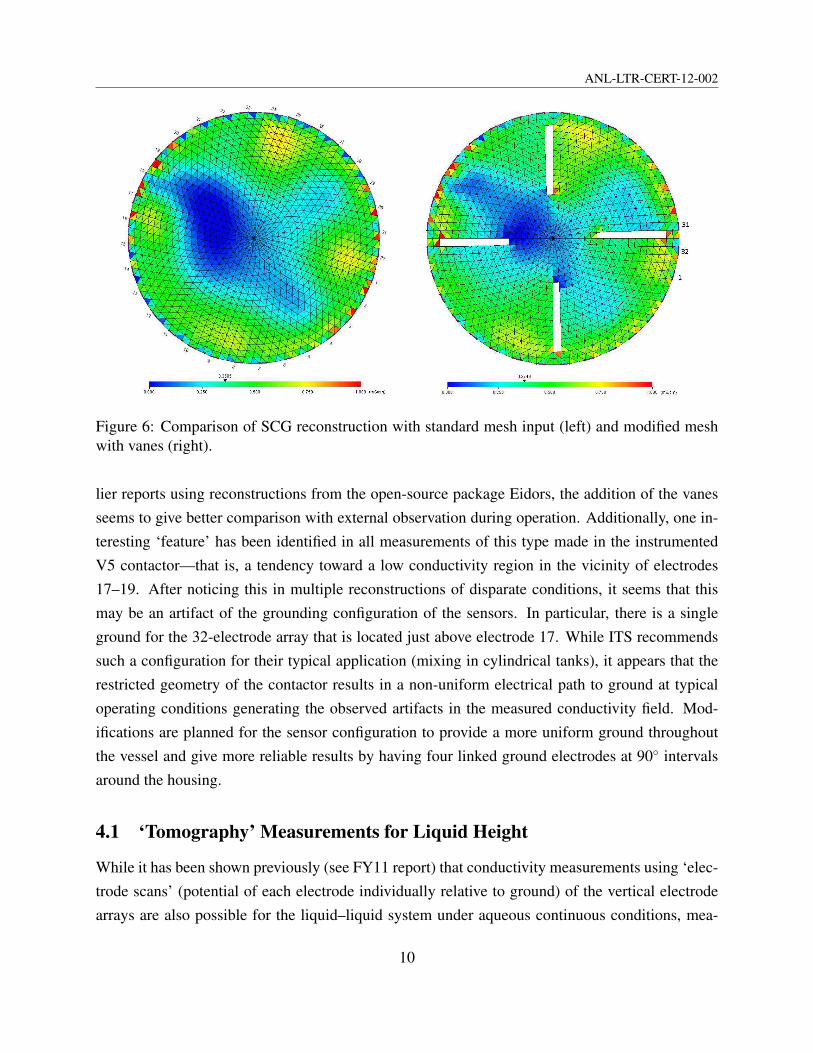
in the signal under constant conditions) of less than ±4%. Figure 6 gives a comparison of two ERT
images processed with ITS’s SCG software for the 32-electrode circular array at the bottom of the
rotor for liquid–liquid operation using the new liquid phase pair. Similar to what was shown in ear-
3Due to the salting out of nitrate ions into the organic phase by the aluminum nitrate in the original aqueous phase,
it was not possible to even reuse the organic phase as additional waste would be generated in trying to wash it clean of
extracted nitrate in order to maintain low electrical conductivity in the new aqueous phase.
9
ANL-LTR-CERT-12-002
Figure 6: Comparison of SCG reconstruction with standard mesh input (left) and modified mesh
with vanes (right).
lier reports using reconstructions from the open-source package Eidors, the addition of the vanes
seems to give better comparison with external observation during operation. Additionally, one in-
teresting ‘feature’ has been identified in all measurements of this type made in the instrumented
V5 contactor—that is, a tendency toward a low conductivity region in the vicinity of electrodes
17–19. After noticing this in multiple reconstructions of disparate conditions, it seems that this
may be an artifact of the grounding configuration of the sensors. In particular, there is a single
ground for the 32-electrode array that is located just above electrode 17. While ITS recommends
such a configuration for their typical application (mixing in cylindrical tanks), it appears that the
restricted geometry of the contactor results in a non-uniform electrical path to ground at typical
operating conditions generating the observed artifacts in the measured conductivity field. Mod-
ifications are planned for the sensor configuration to provide a more uniform ground throughout
the vessel and give more reliable results by having four linked ground electrodes at 90◦ intervals
around the housing.
4.1 ‘Tomography’ Measurements for Liquid Height
While it has been shown previously (see FY11 report) that conductivity measurements using ‘elec-
trode scans’ (potential of each electrode individually relative to ground) of the vertical electrode
arrays are also possible for the liquid–liquid system under aqueous continuous conditions, mea-
10

ANL-LTR-CERT-12-002
surements of this type are quite slow (1 every 2-3 s) and therefore an effort was made to develop a
technique to measure annular liquid height using tomography data from the usual rotating adjacent
injection pair measuring scheme for which the system has been optimally configured. Using such
a configuration it is possible to take measurements on a single plane in the 10s of Hz range. One
drawback of this measurement scheme is that some electrode information is lost. Whereas the
electrode scans provide a measurement at each electrode location individually, for tomographic
data, only the data from a single injection pair (the two bottommost electrodes, 1&2) is useful
meaning that the first measurement pair is for electrodes 3&4 with the resulting data point being
at a height between the two; the last available measurement is then for the electrode pair 15&16.
The result is that for the electrode scans there are 16 measurements (one for each electrode) and
for the tomographically-obtained values there are only 13 (for the 13 adjacent pair combinations,
2&3, 3&4, and so on through 15&16).
A python script was written to process the data from tomographic measurements to give a
map of liquid fraction along the height of the electrode array. Unfortunately, it appears that this
may require additional refinement as the initial results at least show some strange artifacts relative
to similar (albeit much slower) measurements from electrode scans (Figure 7). It is not clear
what caused the signal dropout at ∼4 cm and above ∼7 cm in the tomographic measurements
as compared to the electrode scan data. If this can be corrected, the speed of this measurement
scheme offers a significant advantage compared to electrode scans.
Figure 7: Comparison of axial volume fraction data reconstructions from electrode scans (left) and
adjacent injection-pair measurement (right).
11

ANL-LTR-CERT-12-002
5 Summary and Future Work
Based on the data needs for liquid–liquid contactor CFD model validation, a number of exper-
imental techniques have been explored and the status of these efforts has been presented here.
It is anticipated that targeted experimental measurements providing well-characterized validation
quality data sets can be conducted in the coming FY. Beyond droplet size and phase fraction mea-
surements, an additional need is for phase velocity and turbulence data. While some of the equip-
ment required for such measurements is available (e.g. PIV-capable high-speed camera) through
partnerships with other research groups at the laboratory, it may be useful to partner with a uni-
versity perhaps through an NEUP project to obtain velocity data. While several several NEUP
proposal submission attempts have been made in the past through partnerships with the University
of Wisconsin–Madison and Texas A&M University, these have unfortunately been unsuccessful.
To what degree it is possible given the structure of the NEUP program, FCR&D programmatic
support of future proposals in this regard would be very helpful.
6 Acknowledgments
Thanks to Jing Gao of the University of Illinois at Chicago for high-speed imaging of the CINC-V2
while working as a graduate research aide during this past summer.
References
1. Wardle, K.E., Allen, T.R., Anderson, M.H., Swaney, R.E. (2010) Experimental study of the
hydraulic operation of an annular centrifugal contactor with various mixing vane configurations.
AICHE J., 56: 1960.
2. Wardle, K.E., Allen, T.R., Anderson, M.H., Swaney, R.E. (2009) Analysis of the effect of
mixing vane geometry on the flow in an annular centrifugal contactor. AICHE J., 55: 2244.
12

Chemical Sciences and Engineering Division Argonne National Laboratory 9700 South Cass Avenue, Bldg. 205 Argonne, IL 60439 www.anl.gov
Argonne National Laboratory is a U.S. Department of Energy laboratory managed by UChicago Argonne, LLC