fy 2018 results - singapore exchange
TRANSCRIPT

FY 2018 ResultsDisclaimer: Jardine Cycle & Carriage accepts no liability whatsoever with respect to the use of this document or its contents.
YEARS
OF SOUTHEAST ASIAN
PARTNERSHIPS

JARDINE CYCLE & CARRIAGE
Long-term, strategic business
interests in Southeast Asia

Presence in Southeast Asia
3
LEGEND
Our Presence
Astra International
Direct Motor Interests
SINGAPORE:
• Cycle & Carriage Singapore
MALAYSIA:
• Cycle & Carriage Bintang
MYANMAR:
• Cycle & Carriage Myanmar
INDONESIA:
• Tunas Ridean
VIETNAM:
• Truong Hai Auto Corporation
Other Strategic Interests
THAILAND:
• Siam City Cement
VIETNAM:
• Refrigeration Electrical Engineering Corporation
• Vinamilk
• Siam City Cement
THAILAND
VIETNAM
MYANMAR
SINGAPORE
INDONESIA
MALAYSIA

4As of February 2019
Group Structure
Cycle & Carriage
Singapore100%
59.1%
46.2%
25.3%
60%
Cycle & Carriage Bintang
Tunas Ridean
Truong Hai Auto
Corporation
Cycle & Carriage
Myanmar
Siam City Cement25.5%
24.9%
10.6%
Refrigeration Electrical
Engineering Corporation
Vinamilk
50.1% Astra International
DIRECT MOTOR INTERESTS OTHER STRATEGIC INTERESTSASTRA INTERNATIONAL
FINANCIAL
HIGHLIGHTS

6
Jardine Cycle & Carriage
US$10 billion
Market cap
US$858 million
Underlying profit
US$19 billion
Revenue
Founded in 1899
Employs over
250,000 people
Listed on SGX
STI constituent
75%
Jardine Strategic
held by
* Includes 100% of revenue from associates and joint ventures for full year ended 31 December 2018
+ As at end 2018
2018 snapshot:
Combined gross revenue*
US$40 billion +

Financial Highlights
• Revenue and underlying earnings per share up 10% and 12%, respectively
• Strong performances across all businesses
• Underlying profit contributions:
– Astra’s contribution to Group’s underlying profit up 15%
– Direct Motor Interests’ contribution to Group’s underlying profit up 19%
– Other Strategic Interests up significantly mainly due to Vinamilk dividends
7

8
-5,000
0
5,000
10,000
15,000
20,000
25,000
30,000
(200)
0
200
400
600
800
1,000
1,200
Underlying Profit and Revenue from 2000 to present
Astra Non Astra / Corporate Revenue
Underlying
Profit (US$'m)
Revenue
(US$'m)
2000 2001 2002 2003 2004 2005 2006 2007 2008 2009 2010 2011 2012 2013 2014 2015 2016 2017 2018
Astra -29% 55% 75% 74% 73% 84% 86% 89% 91% 89% 93% 94% 94% 94% 90% 73% 72% 80% 77%
Non-Astra 129% 45% 25% 26% 27% 16% 14% 11% 9% 11% 7% 6% 6% 6% 10% 27% 28% 20% 23%
Financial Highlights – Profit & Loss AccountRevenue and underlying profit up 10% and 12%, respectively

9
2018 2017
US$m US$m Change
Revenue 18,992 17,337 10%
Underlying profit 858 770 12%
Non-trading items (438) 169 nm
Net profit 420 939 -55%
*The 2017 accounts have been restated due to the adoption of IFRS 9 “Financial Instruments” and IFRS 15 “Revenue Contracts with Customers”
Financial Highlights – Profit & Loss AccountRevenue and underlying profit up 10% and 12%, respectively

Financial Highlights – Balance SheetNet debt up largely due to investments by Astra in its road toll business,
a gold mining concession, GOJEK and other capital expenditure
10
Dec-18 Dec-17
US$m US$m Change
Shareholders' funds 6,148 6,408 -4%
Total equity 13,493 13,398 1%
Net debt (5,482) (4,219) 30%
Net cash/(debt) (excl. FS) (2,189) (819) 167%
Gearing 41% 31%
Gearing (excl. FS) 16% 6%
US$ US$
Net asset value per share 15.56 16.22 -4%

11
Restated
2018 2017
US¢ US¢ Change
Underlying EPS 217 195 12%
EPS 106 238 -55%
Dividend per share 87 86 1%
Financial Highlights – OtherUnderlying EPS up 12%, dividend per share at US¢87

Contribution by Business

Underlying Profit – By BusinessGrowth in underlying profit driven by higher contributions across all businesses
13
Restated
2018 2017
US$m US$m Change
Astra 718.7 622.3 15%
Direct motor interests 144.6 121.3 19%
Other strategic interests 71.1 34.3 107%
Corporate costs (76.4) (8.4) nm
Underlying profit 858.0 769.5 12%

ASTRA INTERNATIONAL
Majority shareholder of leading
Indonesian diversified group

15
Astra – Diversified Business Group in Indonesia
Market share
51% Cars | 75% Motorcycles
Automotive Financial Services
Total amount financed from Astra’s
consumer finance businesses
US$5.6 billion
Largest coal mining contractor in
Indonesia
Heavy equipment, mining,
construction & energy
Toll roads in operation and under
construction
313km
Infrastructure & LogisticsAgriculture
Total plantation area
285,000 hectaresProvider of document solutions and
information technology &
communications solutions
7 core businesses
Information Technology
Leading real estate projects including
Grade A office development
Menara Astra
Property

Underlying Profit – AstraKey growth contributors include heavy equipment, mining,
construction and energy, and financial services
16
Restated
2018 2017
US$m US$m Change
Automotive 272 284 -4%
Financial services 171 125 38%
Heavy equipment, mining, construction and energy 231 168 38%
Agribusiness 43 60 -28%
Infrastructure and logistics 7 4 64%
Information technology 7 7 -1%
Property 19 0 nm
Withholding tax on dividend (31) (25) 22%
719 622 15%
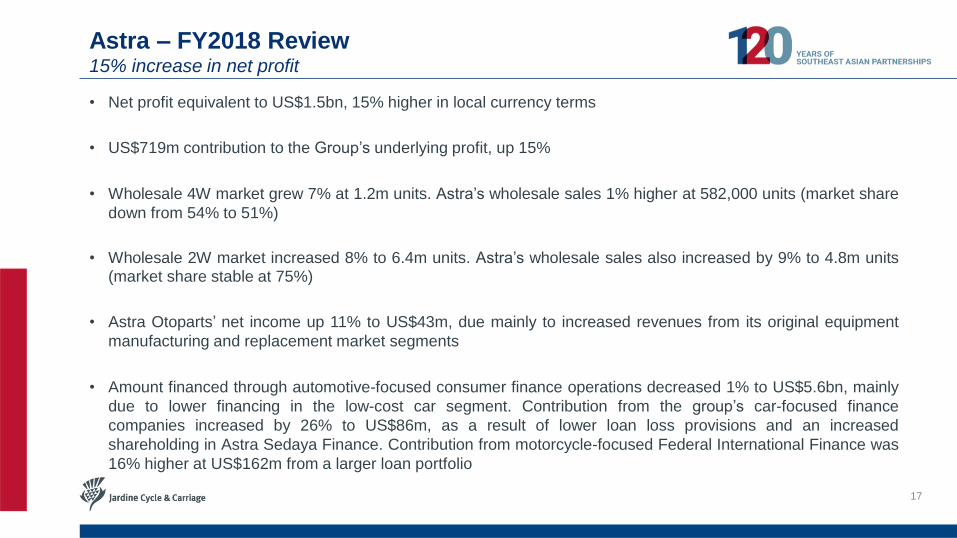
Astra – FY2018 Review15% increase in net profit
• Net profit equivalent to US$1.5bn, 15% higher in local currency terms
• US$719m contribution to the Group’s underlying profit, up 15%
• Wholesale 4W market grew 7% at 1.2m units. Astra’s wholesale sales 1% higher at 582,000 units (market share
down from 54% to 51%)
• Wholesale 2W market increased 8% to 6.4m units. Astra’s wholesale sales also increased by 9% to 4.8m units(market share stable at 75%)
• Astra Otoparts’ net income up 11% to US$43m, due mainly to increased revenues from its original equipment
manufacturing and replacement market segments
• Amount financed through automotive-focused consumer finance operations decreased 1% to US$5.6bn, mainly
due to lower financing in the low-cost car segment. Contribution from the group’s car-focused finance
companies increased by 26% to US$86m, as a result of lower loan loss provisions and an increased
shareholding in Astra Sedaya Finance. Contribution from motorcycle-focused Federal International Finance was
16% higher at US$162m from a larger loan portfolio
17

• Amount financed through the heavy equipment-focused finance operations decreased 12% to US$363m, mainly
due to reduced lending to the small and medium-sized segment
• Permata Bank’s net income at US$63m, compared to US$56m in 2017, mainly due to increased net interest
income and recoveries from non-performing loans. Gross NPL ratio and net NPL ratio were at 4.4% and 1.7%,
respectively (2017: 4.6% and 1.7%, respectively)
• Asuransi Astra Buana’s net income 4% higher at US$73m, primarily due to higher investment income
• United Tractors’ net income 50% higher at US$775m mainly due to improved performances in its construction
machinery, mining contracting and mining operations as a result of increased coal prices
- Komatsu heavy equipment sales up 29% at 4,878 units
- Contract coal production up 11% to 125m tonnes
- Overburden removal up 22% to 979m bcm
- Coal sales up 11% at 7m tonnes
- Acset Indonusa’s net income down 88% at US$1m mainly due to increased financing costs
- Agincourt Resources reported gold sales of 35,000 oz
18
Astra – FY2018 ReviewUnited Tractors net income up by 50%
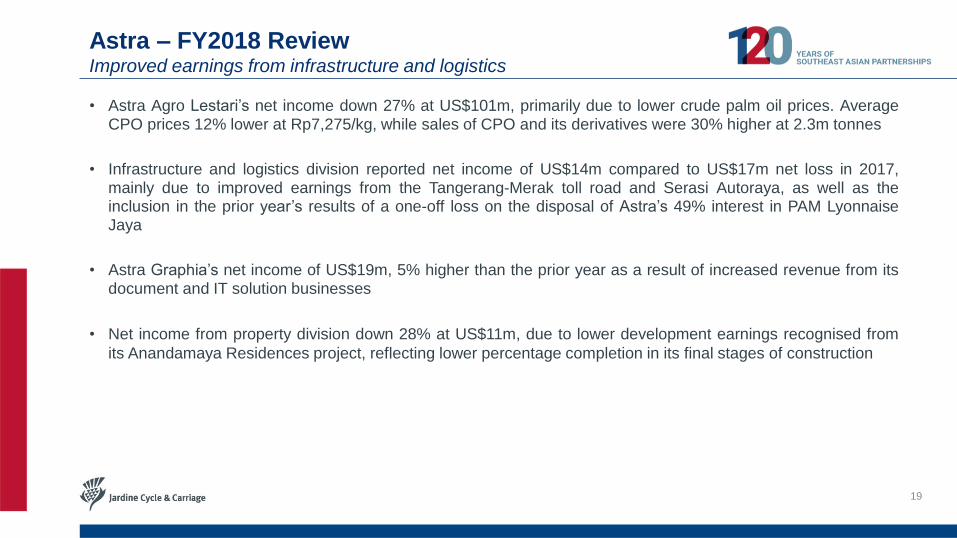
• Astra Agro Lestari’s net income down 27% at US$101m, primarily due to lower crude palm oil prices. AverageCPO prices 12% lower at Rp7,275/kg, while sales of CPO and its derivatives were 30% higher at 2.3m tonnes
• Infrastructure and logistics division reported net income of US$14m compared to US$17m net loss in 2017,mainly due to improved earnings from the Tangerang-Merak toll road and Serasi Autoraya, as well as theinclusion in the prior year’s results of a one-off loss on the disposal of Astra’s 49% interest in PAM LyonnaiseJaya
• Astra Graphia’s net income of US$19m, 5% higher than the prior year as a result of increased revenue from itsdocument and IT solution businesses
• Net income from property division down 28% at US$11m, due to lower development earnings recognised from
its Anandamaya Residences project, reflecting lower percentage completion in its final stages of construction
19
Astra – FY2018 ReviewImproved earnings from infrastructure and logistics

Established automotive
presence across Southeast AsiaDIRECT MOTOR INTERESTS

21
Direct Motor Interests
Leading diverse automotive group
6 Facilities | represents 8 brands
Singapore
Singapore | Malaysia | Myanmar
Bintang Myanmar
17% Passenger Cars market share
> 13,300 units sold
Leading MB dealer group in Malaysia
13 Facilities | represents 2 brands
Listed on Bursa Malaysia
> 4,700 units sold
6 Facilities | represents 3 brands
#1 luxury car brand (Mercedes-Benz)
Top 3 mass market brands (Mazda)
Tunas Ridean
Represents 5 brands
Listed on Indonesia Stock
Exchange
248,900 motorcycles sold
48,300 motor cars sold
THACO
Represents 7 brands
Engages in
Property development &
Agriculture
66,900 PC units sold
30,200 CV units sold
22
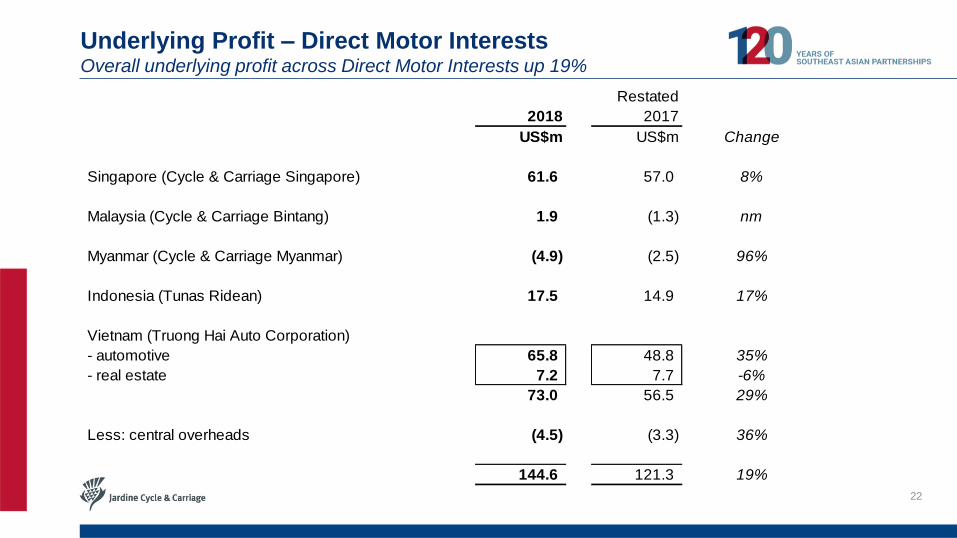
Underlying Profit – Direct Motor InterestsOverall underlying profit across Direct Motor Interests up 19%
Restated
2018 2017
US$m US$m Change
Singapore (Cycle & Carriage Singapore) 61.6 57.0 8%
Malaysia (Cycle & Carriage Bintang) 1.9 (1.3) nm
Myanmar (Cycle & Carriage Myanmar) (4.9) (2.5) 96%
Indonesia (Tunas Ridean) 17.5 14.9 17%
Vietnam (Truong Hai Auto Corporation)
- automotive 65.8 48.8 35%
- real estate 7.2 7.7 -6%
73.0 56.5 29%
Less: central overheads (4.5) (3.3) 36%
144.6 121.3 19%
• Contribution of US$62m, up 8%
- Margins improved on passenger cars
• PC market down 13% to 80,300 units
• PC sales down 7% at 13,300 units, market share rose from 16% to 17%
- Mercedes-Benz unit sales down 6%
- Kia unit sales up 2%
- Mitsubishi unit sales down 7%
- Citroen unit sales down 61%
23
Cycle & Carriage Singapore – FY2018 ReviewImproved margins on passenger cars

• Contributed a profit of US$2m, compared to a loss of US$1m in the prior year
• 9% increase in unit sales as the company benefited from the zero rate of GST from June to August
24
Cycle & Carriage Bintang – FY2018 Review9% increase in unit sales

• Contributed a higher loss of US$5m (2017: US$3m loss) mainly due to higher capex depreciation and stock
provisions, partly offset by increased sales volume
25
Cycle & Carriage Myanmar – FY2018 Review

• Contribution of US$18m up 17%, due to improved performances from its automotive, consumer finance and
rental operations
• 4W sales down 6% to 48,300 units, but margins improved due to less discounting
• 2W sales 11% higher at 248,900 units, benefiting from higher agricultural prices
• MTF’s new lending volume up 22% to US$1.9bn
• Rental business recorded higher gains on disposals, partly offset by increased depreciation and borrowing costsassociated with fleet expansion and replacement
26
Tunas Ridean – FY2018 ReviewHigher contributions from automotive, consumer finance and rental operations

• Contribution of US$73m up 29%, due mainly to higher unit sales and improved margins
• Vehicle market grew 9% to 362,000 units as tariffs on CBUs were eliminated, following the full implementation ofthe ASEAN Trade in Goods Agreement in 2018
• Thaco’s overall sales up 11% to 97,100 units, with market share stable at 27%
• Thaco’s PC sales up 41% to 66,900 units, with market share at 23% (2017: 19%)
• Thaco’s CV sales down 25% to 30,200 units, with market share at 47% (2017: 51%)
27
Truong Hai Auto Corporation (Thaco) – FY2018 ReviewOverall unit sales up 11% to 97,100 units

• Single point of accountability for Jardine Matheson Group automotive interests (Southeast Asia + Greater China)
- Leverage scale, maximise partnerships, consolidate expertise, share innovation, optimise transformation initiatives
• No change in shareholding; JC&C retains ownership of its Direct Motor Interests (DMI) business
• Formation of leadership of senior staff from JC&C and Jardine Motors Group
- Eric Chan to succeed Haslam Preeston as Managing Director, DMI and participate as an Executive Committee member of JIM
• JIM to become Jardine Matheson Group’s automotive specialist and provide central resource to drive groupwide
collaboration, minimise duplication and optimise cost
- JC&C will be able to source services and expertise from JIM
• Better opportunities for employees
- Broader work experience, wider range of learning, training and development
28
Formation of Jardine International Motors (JIM)

OTHER STRATEGIC INTERESTS
Diversified interests supporting
Southeast Asia’s growth
OTHER STRATEGIC INTERESTS
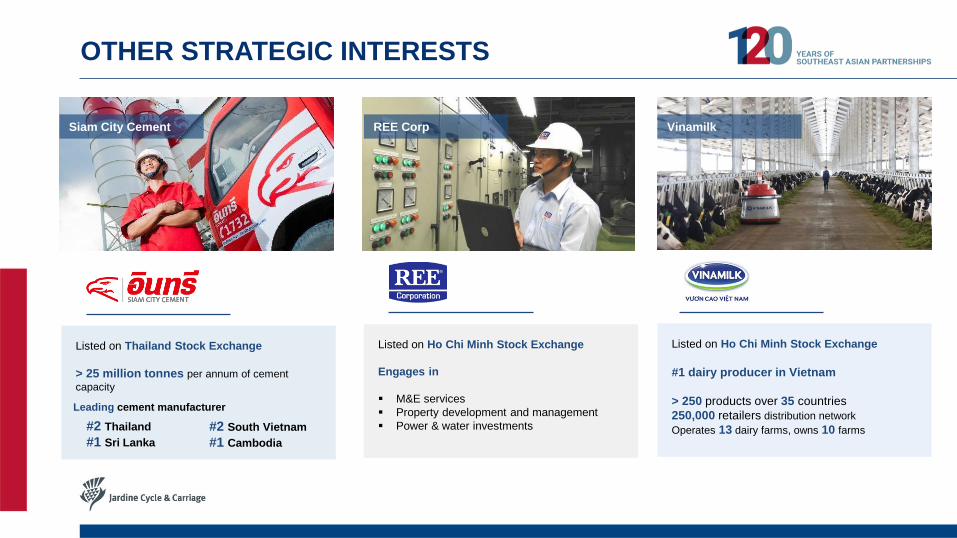
Leading cement manufacturer
Siam City Cement
Listed on Thailand Stock Exchange
> 25 million tonnes per annum of cement
capacity
REE Corp Vinamilk
#2 Thailand
#1 Sri Lanka
#2 South Vietnam
#1 Cambodia
Listed on Ho Chi Minh Stock Exchange
Engages in
M&E services
Property development and management
Power & water investments
Listed on Ho Chi Minh Stock Exchange
#1 dairy producer in Vietnam
> 250 products over 35 countries
250,000 retailers distribution network
Operates 13 dairy farms, owns 10 farms

• Siam City Cement’s contribution of US$20 million was significantly higher than the prior year, due to improved
domestic performance and lower one-off expenses, partially offset by lower contributions from its regional
operations
• REE’s contribution of US$19 million was 39% higher, due mainly to strong contributions from its power and
water investments
• The Group recognised dividend income of US$32 million from its 10.6% interest in Vinamilk
31
Underlying Profit – Other Strategic InterestsSubstantial growth to US$71m driven by Vinamilk dividends
“The Group achieved good overall results in 2018, but Astra is likely to face a number
of macro-economic and commercial headwinds in 2019, while the Group’s Direct
Motor Interests and Other Strategic Interests may also see slower growth.”
32
Outlook
Ben Keswick, Chairman
27th February 2019

THANK YOU