fy 2016 pay plan recommendations - missouri … 2016 pay plan recommendations the impact of pay...
TRANSCRIPT
Page 1 of 11
FY 2016 PAY PLAN RECOMMENDATIONS
THE IMPACT OF PAY COMPRESSION
WITHIN-GRADE SALARY ADVANCEMENTS
GENERAL STRUCTURE ADJUSTMENT
REPOSITIONING
DIFFERENTIALS
TOTAL ESTIMATED COSTS
The Impact of Pay Compression
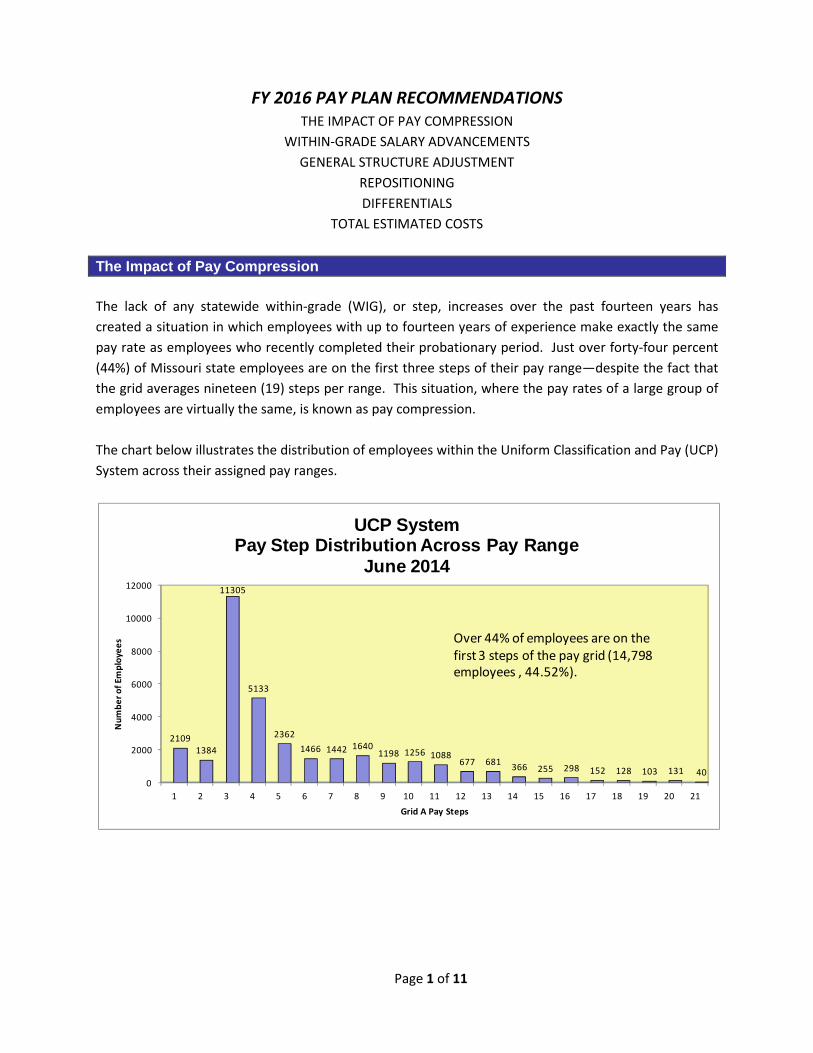
The lack of any statewide within-grade (WIG), or step, increases over the past fourteen years has
created a situation in which employees with up to fourteen years of experience make exactly the same
pay rate as employees who recently completed their probationary period. Just over forty-four percent
(44%) of Missouri state employees are on the first three steps of their pay range—despite the fact that
the grid averages nineteen (19) steps per range. This situation, where the pay rates of a large group of
employees are virtually the same, is known as pay compression.
The chart below illustrates the distribution of employees within the Uniform Classification and Pay (UCP)
System across their assigned pay ranges.
2109
1384
11305
5133
2362
1466 1442 16401198 1256 1088
677 681366 255 298 152 128 103 131 40
0
2000
4000
6000
8000
10000
12000
1 2 3 4 5 6 7 8 9 10 11 12 13 14 15 16 17 18 19 20 21
Nu
mb
er
of
Em
plo
ye
es
Grid A Pay Steps
UCP SystemPay Step Distribution Across Pay Range
June 2014
Over 44% of employees are on the
first 3 steps of the pay grid (14,798
employees , 44.52%).
Page 2 of 11
In order to illustrate this concept more specifically, the following charts provide more detail related to
job classes and employees assigned to pay Range 17 on the UCP A Grid. Range 17 is one of the more
commonly used ranges within the UCP System. The following analysis of this pay range is provided for
clarification only and the focus on this range is not suggesting that it is necessarily any worse than other
ranges within the UCP System. The chart below lists those UCP job classes that are currently assigned to
Range 17. The list reflects a broad spectrum of work areas.
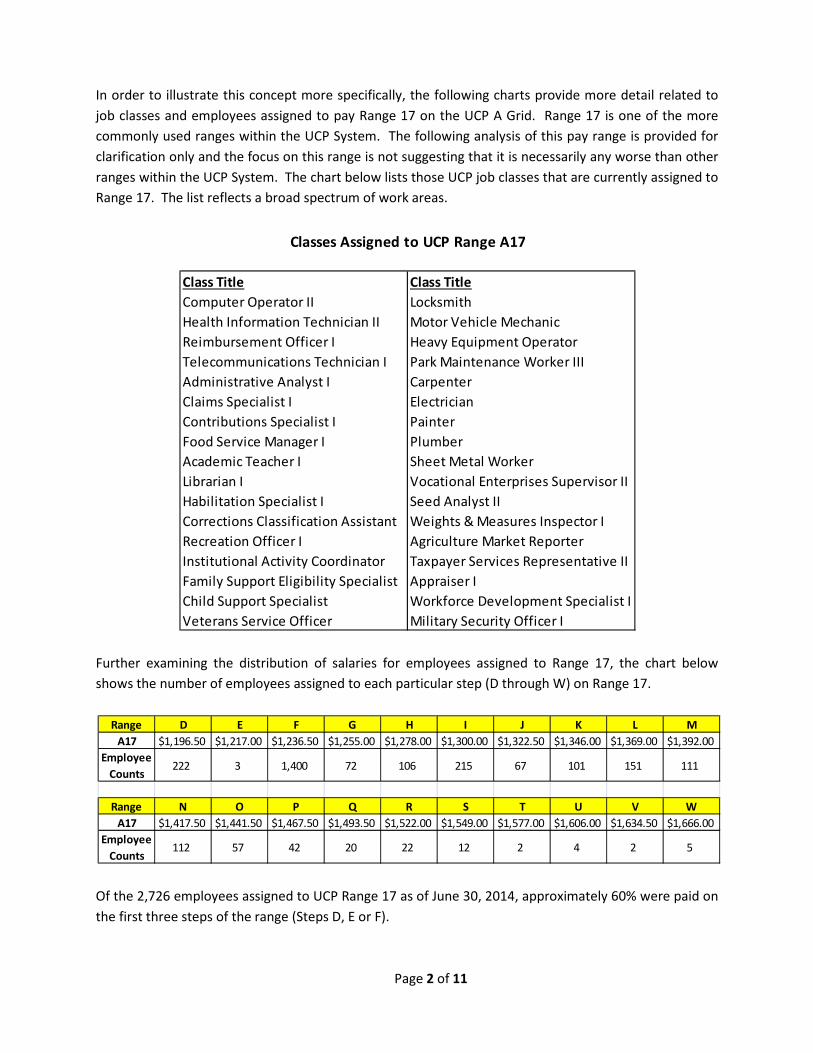
Further examining the distribution of salaries for employees assigned to Range 17, the chart below
shows the number of employees assigned to each particular step (D through W) on Range 17.
Of the 2,726 employees assigned to UCP Range 17 as of June 30, 2014, approximately 60% were paid on
the first three steps of the range (Steps D, E or F).
Class Title Class Title
Computer Operator II Locksmith
Health Information Technician II Motor Vehicle Mechanic
Reimbursement Officer I Heavy Equipment Operator
Telecommunications Technician I Park Maintenance Worker III
Administrative Analyst I Carpenter
Claims Specialist I Electrician
Contributions Specialist I Painter
Food Service Manager I Plumber
Academic Teacher I Sheet Metal Worker
Librarian I Vocational Enterprises Supervisor II
Habilitation Specialist I Seed Analyst II
Corrections Classification Assistant Weights & Measures Inspector I
Recreation Officer I Agriculture Market Reporter
Institutional Activity Coordinator Taxpayer Services Representative II
Family Support Eligibility Specialist Appraiser I
Child Support Specialist Workforce Development Specialist I
Veterans Service Officer Military Security Officer I
Classes Assigned to UCP Range A17
Range D E F G H I J K L M
A17 $1,196.50 $1,217.00 $1,236.50 $1,255.00 $1,278.00 $1,300.00 $1,322.50 $1,346.00 $1,369.00 $1,392.00
Employee
Counts222 3 1,400 72 106 215 67 101 151 111
Range N O P Q R S T U V W
A17 $1,417.50 $1,441.50 $1,467.50 $1,493.50 $1,522.00 $1,549.00 $1,577.00 $1,606.00 $1,634.50 $1,666.00
Employee
Counts112 57 42 20 22 12 2 4 2 5

Page 3 of 11
As shown in the chart above, 1,400 of the 2,726 employees paid on Range 17 are paid on the 3rd step of
the Range (Step F). The chart below shows the impact of compression by showing the years of service of
all the employees paid on Range 17, Step F. In spite of years of service ranging from less than one year
to 28 years, all of these employees are paid the exact same rate ($1,236.50 per semi-monthly pay
period).
No statewide within-grade, or step, salary advancement has been received since July 1, 2000. The only
WIG increase for employees hired after that date may have been the customary two-step increase for
successfully completing their probationary period, or an occasional targeted WIG for a specific job
classification like Corrections Officers. Due to budgetary constraints, even the end of probation
increases have not always been possible. Thus, we may have proficient and trained employees with
many years of service with the state who receive the exact same salary as co-workers with less than a
year’s service who have just completed their probationary period.
Typically, as employees acquire experience and proficiency in their jobs they are more valuable to the
state than when they were first hired. This value should be reflected in salaries. Unfortunately, it is not.
This situation potentially leads to morale issues as employees may feel under-valued and under-
appreciated. Employees can easily feel that their job commitment, knowledge and experience remains
unrecognized from a compensation perspective. The most recently hired employees are, or soon will
be, making exactly the same salary even though some may lack the same level of experience.
This situation threatens Missouri’s ability to retain its best employees. Employees can see that they
have little hope of progressing salary-wise and, as the economy improves, many may seek to leave state
employment for better paying jobs. Many state government employees have salaries near the bottom
of their established pay range. Without within-grade salary advancement, those salaries will remain
58
122119
73
45
118122
118
50
107
64
42
71
8475
43
2115
10 126 6 7 6 3 1 1 1
0
20
40
60
80
100
120
140
< 1 1 2 3 4 5 6 7 8 9 10 11 12 13 14 15 16 17 18 19 20 21 22 23 24 25 26 27 28
# o
f Em
plo
ye
es
Years of State Service
Number of Employees on Range A17, Step F ($1,236.50 )by Years of State Service
June 2014

Page 4 of 11
near the bottom. The following chart shows the trend in total turnover and total voluntary turnover for
the State of Missouri over the past five years:
This situation may also impact the state’s ability to effectively recruit new employees. Applicants may
see the history of the lack of increases and decide that working for the State of Missouri will lead to
reduced future earnings throughout their careers. The state may experience problems in filling
positions, may be forced to fill positions with candidates who possess marginal qualifications, or, even
worse, be forced to reduce the minimum qualifications for job classes in order to fill them.
Within-Grade Salary Advancements
For employees paid on ranges and steps (table-driven pay), within-grade (WIG) salary advancements
provide the only compensation mechanism to move employees through their respective pay ranges.
WIG salary advancements are designed to recognize distinctions in salary based upon the experience,
knowledge and expertise of employees.
No statewide WIG salary advancement has been granted to Missouri employees since July 1, 2000.
Currently, about 44% of Missouri state employees within the UCP system remain on the bottom three
steps of their pay range. The significant low-end pay compression now experienced by Missouri state
government is the result of this lack of consistent within-grade salary advancements.
Custody staff, probation and parole assistants for the Department of Corrections and the security aides
for the Department of Mental Health were granted job class-specific WIG increases by the legislature in
the FY 2009 (July 1, 2008) budget. This allowed many of these employees to advance to the fourth step
of their assigned pay range. Nearly 60% of state employees are paid on the first four steps of their pay
range.
6.4%
8.0%
9.5% 9.9% 10.1%
12.4%
14.5%15.8% 16.3% 16.0%
0.0%
4.0%
8.0%
12.0%
16.0%
20.0%
June 2010 June 2011 June 2012 June 2013 June 2014
Executive Branch Total Turnover and Voluntary Turnover
Voluntary Turnover Total Turnover

Page 5 of 11
The Personnel Advisory Board (PAB) is recommending a two-tiered WIG approach for FY 2016. It is
hoped that this approach will take moderate, yet meaningful, steps to address low-end pay
compression. From an employee perspective, the most significant compression issues are felt by
employees that have been with the state for a number of years, but may not have received a step
increase beyond their initial end of probation increase. In order to directly target this situation, the
Board recommends that employees with table-driven pay (paid on a range and a step) with at least
seven (7) years of state service will receive a 2-step increase. A 1-step increase is recommended for all
employees with less than seven (7) years of state service. Due to significant variances in the
percentages between some of the steps, it is understood that the actual increases received by these
employees will vary based on the particular range and step that each employee is currently paid on.
Similarly, for employees whose pay is non-table driven, the PAB is recommending a 1.7% increase for all
employees. Further, those employees with at least seven (7) years of state service whose pay is non-
table driven, the PAB is recommending an additional 1.7% increase. This approach strives to balance
costs with the need to address low-end pay compression. Applying both parts of this plan, all
employees with non-table driven pay would receive a 1.7% increase and the employees with at least
seven (7) years of experience with the state would receive a 3.4% total WIG increase.
General Structure Adjustment
An important compensation component relates to the ability to maintain the overall competitiveness of
the pay plan. This is primarily accomplished through the use of the General Structure Adjustment (GSA).
The GSA is often described as a “cost of living” adjustment. While the cost of living is a factor in
determining the amount of the GSA, the adjustment should not be considered solely as a cost of living
increase. The primary purpose of the GSA is to maintain the competitiveness of the pay plan relative to
other employers.
Historically, the GSA has involved an adjustment to the pay grids themselves. Virtually all employees
benefit from this type of increase. Only temporary and seasonal workers are not automatically included.
Their increases, if any, are determined by each agency.
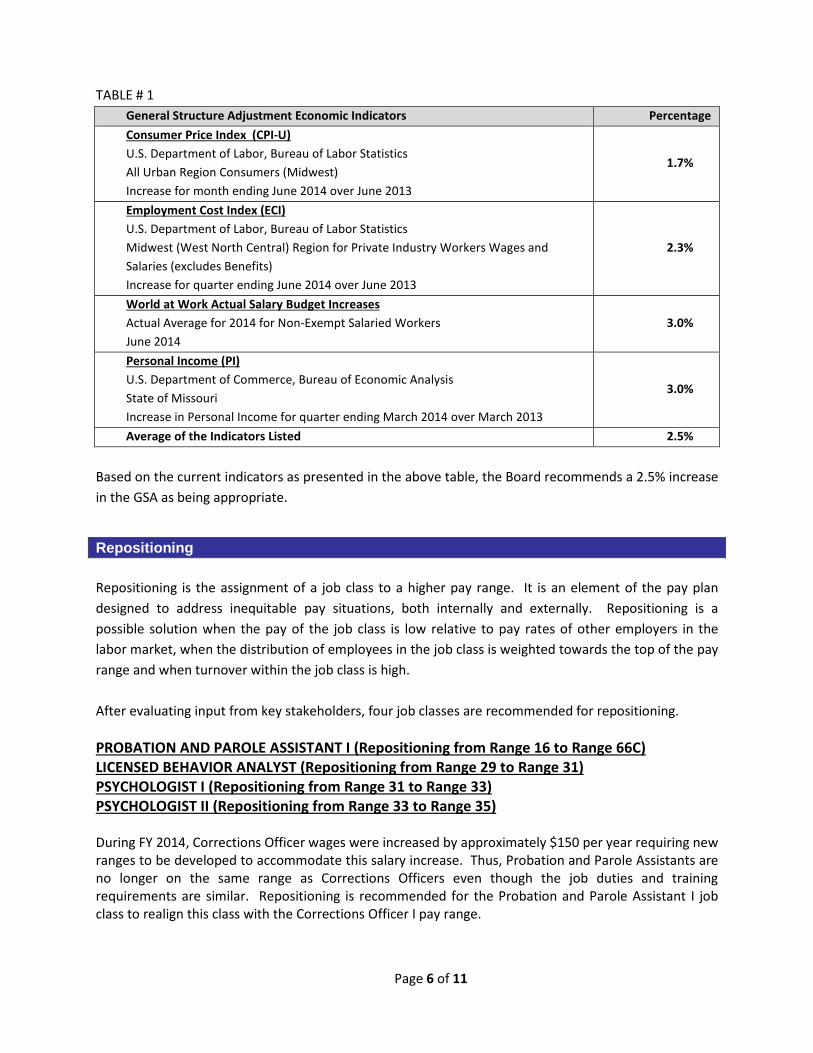
The recommended GSA adjustment is an average of four consistent indicators. These indicators include:
the Consumer Price Index (CPI), the Employment Cost Index (ECI), the WorldatWork Salary Budget
Survey and Personal Income (PI) data for the State of Missouri. The following table represents the most
current data from these indicators:
Page 6 of 11
TABLE # 1
General Structure Adjustment Economic Indicators Percentage
Consumer Price Index (CPI-U)
U.S. Department of Labor, Bureau of Labor Statistics
All Urban Region Consumers (Midwest)
Increase for month ending June 2014 over June 2013
1.7%
Employment Cost Index (ECI)
U.S. Department of Labor, Bureau of Labor Statistics
Midwest (West North Central) Region for Private Industry Workers Wages and
Salaries (excludes Benefits)
Increase for quarter ending June 2014 over June 2013
2.3%
World at Work Actual Salary Budget Increases
Actual Average for 2014 for Non-Exempt Salaried Workers
June 2014
3.0%
Personal Income (PI)
U.S. Department of Commerce, Bureau of Economic Analysis
State of Missouri
Increase in Personal Income for quarter ending March 2014 over March 2013
3.0%
Average of the Indicators Listed 2.5%
Based on the current indicators as presented in the above table, the Board recommends a 2.5% increase
in the GSA as being appropriate.
Repositioning
Repositioning is the assignment of a job class to a higher pay range. It is an element of the pay plan
designed to address inequitable pay situations, both internally and externally. Repositioning is a
possible solution when the pay of the job class is low relative to pay rates of other employers in the
labor market, when the distribution of employees in the job class is weighted towards the top of the pay
range and when turnover within the job class is high.
After evaluating input from key stakeholders, four job classes are recommended for repositioning.
PROBATION AND PAROLE ASSISTANT I (Repositioning from Range 16 to Range 66C)
LICENSED BEHAVIOR ANALYST (Repositioning from Range 29 to Range 31)
PSYCHOLOGIST I (Repositioning from Range 31 to Range 33)
PSYCHOLOGIST II (Repositioning from Range 33 to Range 35)
During FY 2014, Corrections Officer wages were increased by approximately $150 per year requiring new
ranges to be developed to accommodate this salary increase. Thus, Probation and Parole Assistants are
no longer on the same range as Corrections Officers even though the job duties and training
requirements are similar. Repositioning is recommended for the Probation and Parole Assistant I job
class to realign this class with the Corrections Officer I pay range.

Page 7 of 11
A two range repositioning is recommended for the Licensed Behavior Analyst, Psychologist I, and
Psychologist II job classes. The minimum qualifications for a Licensed Behavior Analyst require
completion of an extensive certification process in order to obtain the necessary license, which includes
a Master’s degree, to become a Board Certified Behavior Analyst. Recruitment for Licensed Behavior
Analysts is a challenge nation-wide due to the small applicant pool. There are approximately twelve
employees in this class, and all but one is currently paid at the top of their salary range.
The minimum qualifications for Psychologist I and Psychologist II also require licensure, which includes a
doctoral degree and completion of at least one year of post-doctoral psychology experience under the
supervision of a licensed psychologist. Few, if any, other state job classifications require a doctorate and
do not allow work experience to substitute for education. The Department of Mental Health has
expressed concern about their increasing inability to fill vacancies with recruitment and retention being
hampered by the wage levels for these job classes. There are approximately forty-five total employees
in the Psychologist I and Psychologist II classes, and their salaries are toward the top of the respective
salary ranges.
0 0 15
2
157
4 1
17 2 1 3 3 0 1 0 0 0 0 0 0 0 0 0
0 20 40 60 80
100 120 140 160 180
Number of Employees by Class and Step Pay Range A16Total Employees In Job Class = 206
Average Salary = $29,421Voluntary Turnover = 23.5%
PROBATION & PAROLE ASST I

Page 8 of 11
0 0 0 0 0 0 0 0 0 0 0 0 0 0 0 0 0 0 0 1
0 0
11
0
2
4
6
8
10
12
Number of Employees by Class and Step Pay Range A29Total Employees In Job Class = 12
Average Salary = $65,725Voluntary Turnover = 9.1%
LICENSED BEHAVIOR ANALYST
0 0 0 0 0 0 0 0 0 0
1
0
2
3
2
0
1
6
1
2
4
0
4
0
1
2
3
4
5
6
7
Number of Employees by Class and Step Pay Range A31Total Employees In Job Class = 26
Average Salary = $64,731Voluntary Turnover = 18.5%
PSYCHOLOGIST I
0 0 0 0 0 0 0 0 0 0 0 0
2
0 0 0
5
1
0 0
1
0
6
0
1
2
3
4
5
6
7
Number of Employees by Class and Step Pay Range A33Total Employees In Job Class = 15
Average Salary = $71,737Voluntary Turnover = 12.1%
PSYCHOLOGIST II

Page 9 of 11
Differentials
The Department of Mental Health (DMH) has requested a security differential for registered nurse
classes working in maximum security and intermediate security areas. The DMH request did not include
a request for registered nurse employees working in either of the SORTS units. Differentials do not
adjust the base pay, but provide additional pay based on specific factors for some of the employees. In
this particular case, the differential is based on working in secured areas.
SECURITY DIFFERENTIAL (Total Differentials of 15% (Maximum Security) and 12%
(Intermediate Security) for Department of Mental Health)
These differentials are designed to help recruitment and retention at the maximum and intermediate
security facilities at the Fulton State Hospital. According to data submitted by DMH in August of 2014,
the vacancy rate for registered nurse positions at Fulton State Hospital was approximately 27%.
A security differential for registered nurse classes who work in maximum and intermediate security units
at the Department of Mental Health is recommended. Currently several other job classes receive a
security differential, but the registered nurse classes have not been included prior to efforts for FY 2015.
This recommendation would result in the augmentation of security differentials established in FY 2015
or the establishment of new security differentials. The end goal of this recommendation is to reach
targeted levels for both the maximum security registered nurse differential (15%) and the intermediate
security registered nurse differential (12%).
Positions in the following job classes, assigned to security areas as mentioned above, are recommended
to receive the appropriate differential:
Registered Nurse
Registered Nurse Senior
Registered Nurse Supervisor
Registered Nurse-Clinical Operations
Registered Nurse Manager

Page 10 of 11
Total Estimated Cost of Suggested Within-Grade Sala ry Advancements, General Structure Adjustment, Repositioning, & Differential s – Based on June 30, 2014 Salaries
Pay Plan Element General RevenueNon-General
Revenue TotalPercentage of Total Personal Services
Within-Grade Increase, General $12,788,073 $11,227,036 $24,015,109 1.7%
Within-Grade Increase, 7 Plus Years of Service $8,151,461 $7,156,415 $15,307,876 1.1%
General Structure Adjustment (2.5%) $18,696,012 $16,413,796 $35,109,808 2.5%
Repositioning $226,661 $85,075 $311,736
Differentials $300,187 $129,081 $429,268
Total UCP System Agencies, Salary Only $40,162,394 $35,011,403 $75,173,797
Benefits (31.15%) $12,510,586 $10,906,052 $23,416,638
Total UCP System Agencies, Salary plus Benefits $52,672,980 $45,917,455 $98,590,435
Pay Plan Element General RevenueNon-General
Revenue TotalPercentage of Total Personal Services
Within-Grade Increase, General $4,936,114 $8,827,663 $13,763,777 1.7%
Within-Grade Increase, 7 Plus Years of Service $3,146,412 $5,626,990 $8,773,402 1.1%
General Structure Adjustment (2.5%) $7,216,542 $12,905,940 $20,122,481 2.5%
Repositioning $0 $0 $0
Differentials $0 $0 $0
Total Non-UCP System Agencies, Salary Only $15,299,068 $27,360,592 $42,659,661
Benefits (31.15%) $4,765,660 $8,522,825 $13,288,484
Total Non-UCP System Agencies, Salary plus Benefits $20,064,728 $35,883,417 $55,948,145
Pay Plan Element General RevenueNon-General
Revenue TotalPercentage of Total Personal Services
Within-Grade Increase, General $17,724,187 $20,054,699 $37,778,886 1.7%
Within-Grade Increase, 7 Plus Years of Service $11,297,874 $12,783,405 $24,081,278 1.1%
General Structure Adjustment (2.5%) $25,912,554 $29,319,736 $55,232,290 2.5%
Repositioning $226,661 $85,075 $311,736
Differentials $300,187 $129,081 $429,268
Total All Agencies, Salary Only $55,461,462 $62,371,995 $117,833,458
Benefits (31.15%) $17,276,246 $19,428,877 $36,705,122
Total All Agencies, Salary plus Benefits $72,737,708 $81,800,872 $154,538,580
UNIFORM CLASSIFICATION & PAY SYSTEM
NON-UCP SYSTEM AGENCIES
ALL AGENCIES

Page 11 of 11
Total Estimated Cost of Suggested Within-Grade Sala ry Advancements, General Structure Adjustment, Repositioning, & Differential s – Based on FY 15 Pay Plan Salaries
Pay Plan Element General RevenueNon-General
Revenue TotalPercentage of Total Personal Services
Within-Grade Increase, General $12,846,859 $11,280,904 $24,127,763 1.7%
Within-Grade Increase, 7 Plus Years of Service $8,188,934 $7,190,752 $15,379,685 1.1%
General Structure Adjustment (2.5%) $18,781,958 $16,492,550 $35,274,508 2.5%
Repositioning $228,927 $85,926 $314,853
Differentials $222,752 $95,784 $318,536
Total UCP System Agencies, Salary Only $40,269,431 $35,145,915 $75,415,346
Benefits (31.15%) $12,543,928 $10,947,953 $23,491,880
Total UCP System Agencies, Salary plus Benefits $52,813,359 $46,093,867 $98,907,226
Pay Plan Element General RevenueNon-General
Revenue TotalPercentage of Total Personal Services
Within-Grade Increase, General $4,953,924 $8,867,785 $13,821,709 1.7%
Within-Grade Increase, 7 Plus Years of Service $3,157,764 $5,652,565 $8,810,329 1.1%
General Structure Adjustment (2.5%) $7,242,578 $12,964,598 $20,207,176 2.5%
Repositioning $0 $0 $0
Differentials $0 $0 $0
Total Non-UCP System Agencies, Salary Only $15,354,266 $27,484,948 $42,839,214
Benefits (31.15%) $4,782,854 $8,561,561 $13,344,415
Total Non-UCP System Agencies, Salary plus Benefits $20,137,120 $36,046,510 $56,183,629
Pay Plan Element General RevenueNon-General
Revenue TotalPercentage of Total Personal Services
Within-Grade Increase, General $17,800,783 $20,148,689 $37,949,472 1.7%
Within-Grade Increase, 7 Plus Years of Service $11,346,698 $12,843,316 $24,190,014 1.1%
General Structure Adjustment (2.5%) $26,024,536 $29,457,148 $55,481,684 2.5%
Repositioning $228,927 $85,926 $314,853
Differentials $222,752 $95,784 $318,536
Total All Agencies, Salary Only $55,623,697 $62,630,863 $118,254,560
Benefits (31.15%) $17,326,782 $19,509,514 $36,836,295
Total All Agencies, Salary plus Benefits $72,950,478 $82,140,377 $155,090,855
UNIFORM CLASSIFICATION & PAY SYSTEM
NON-UCP SYSTEM AGENCIES
ALL AGENCIES