fy 2013 operating budget (summary) - town of … operati… · fy 2013 operating budget (summary)...
TRANSCRIPT

Town of Barnstable Massachusetts
FY 2013
OPERATING
BUDGET (Summary)
Thomas K. Lynch Acting Town Manager
May 17, 2012

TABLE OF CONTENTS
TOWN MANAGER’S FY 2013 BUDGET MESSAGE ........................................................................................................................ 1
ALL FUNDS SUMMARY ....................................................................................................................................................................... 4
GENERAL FUND SUMMARY ............................................................................................................................................................. 6
GENERAL FUND REVENUE SUMMARY ........................................................................................................................................... 6
TAX LEVY, TAX RATES & TAX BILL .................................................................................................................................................. 8
GENERAL FUND BUDGET BY MAJOR EXPENDITURE CATEGORY ........................................................................................... 11
MUNICIPAL OPERATIONS DEPARTMENT EXPENDITURES AND RESOURCE SUMMARY ..................................................... 12
MUNICIPAL OPERATIONS EXPENDITURES BY CATEGORY ....................................................................................................... 14
MUNICIPAL OPERATING DEPARTMENT EXPENDITURES BY DIVISION .................................................................................. 15
SCHOOL OPERATION EXPENDITURES BY CATEGORY (LOCAL SCHOOLS ONLY) ................................................................. 16
ALL EDUCATION EXPENDITURES ................................................................................................................................................. 17
OTHER REQUIREMENTS EXPENDITURE SUMMARY .................................................................................................................. 18
DEPARTMENT BUDGETS ................................................................................................................................................................. 20
1. POLICE DEPARTMENT ............................................................................................................................................................... 20 Summary of police department expenditures and funding sources ................................................................................................ 20 Summary of significant budget changes for police department...................................................................................................... 20 Police department appropriation order 2012-112 ........................................................................................................................... 20
2. BARNSTABLE MUNICIPAL AIRPORT ENTERPRISE FUND ..................................................................................................... 21 Summary of airport expenses and funding sources ........................................................................................................................ 21 Summary of significant budget changes for airport enterprise fund ............................................................................................... 21 Airport enterprise fund appropriation order 2012-114 ................................................................................................................... 21
3. EDUCATION ................................................................................................................................................................................. 22 Summary of school department expenditures and funding resources ............................................................................................ 22 Summary of significant budget changes for the school department ............................................................................................... 22 School department appropriation order 2012-113 .......................................................................................................................... 22
4. DEPARTMENT OF PUBLIC WORKS GENERAL FUND BUDGET ............................................................................................. 23 Summary of Public Works Department expenditures and funding sources ................................................................................... 23 Summary of significant budget changes for public works general fund operations ....................................................................... 23 Public works department general fund appropriation order 2012-115 ........................................................................................... 23
5. DEPARTMENT OF PUBLIC WORKS SOLID WASTE ENTERPRISE FUND .............................................................................. 24 Summary of Solid Waste Division expenditures and funding sources ........................................................................................... 24 Solid Waste enterprise fund appropriation order 2012-116 ............................................................................................................ 24
6. DEPARTMENT OF PUBLIC WORKS WATER POLLUTION ENTERPRISE FUND ................................................................... 25 Summary of Water Pollution Control expenses and funding sources ............................................................................................ 25 Water pollution control enterprise fund appropriation order 2012-117 .......................................................................................... 25
7. DEPARTMENT OF PUBLIC WORKS WATER SUPPLY ENTERPRISE FUND .......................................................................... 26 Summary of Water Supply Division expenses and funding sources .............................................................................................. 26 Summary of significant budget changes for water supply operations ............................................................................................ 26 Water supply enterprise fund appropriation order 2012-118 .......................................................................................................... 26
8. REGULATORY SERVICES DEPARTMENT ................................................................................................................................... 27 Summary of Regulatory Services Department expenditures and funding resources ...................................................................... 27 Summary of significant budget changes for regulatory services department ................................................................................. 27 Regulatory Services Department appropriation order 2012-119 .................................................................................................... 27
9. COMMUNITY SERVICES DEPARTMENT GENERAL FUND BUDGET .................................................................................... 28 Summary of Community Services Department expenditures and funding sources ........................................................................ 28 Summary of significant budget changes for Community Services Department general fund operations....................................... 28
Community Services Department general fund operations appropriation order 2012-120 ............................................................ 28
10. DEPARTMENT OF COMMUNITY SERVICES GOLF COURSE ENTERPRISE FUND ............................................................. 29 Summary of Golf Course Enterprise Fund expenses and funding sources ..................................................................................... 29 Summary of significant budget changes for Golf Course Enterprise Fund .................................................................................... 29 Golf Course Enterprise Fund appropriation order 2012-121 .......................................................................................................... 29
11. DEPARTMENT OF COMMUNITY SERVICES HYCC ENTERPRISE FUND ............................................................................. 30 Summary of Hyannis Youth and Community Center expenditures and funding sources .............................................................. 30 Summary of significant budget changes for HYCC Enterprise Fund ............................................................................................. 30 HYCC Enterprise Fund appropriation order 2012-122 .................................................................................................................. 30
12. DEPARTMENT OF COMMUNITY SERVICES MARINA ENTERPRISE FUND ......................................................................... 31 Summary of Marina Enterprise Fund expenditures and funding sources ....................................................................................... 31 Summary of significant budget changes for Marina Enterprise Fund ............................................................................................ 31 Marina Enterprise Fund appropriation order 2012-123 .................................................................................................................. 31
13. DEPARTMENT OF COMMUNITY SERVICES SANDY NECK ENTERPRISE FUND ................................................................ 32 Summary of Sandy Neck operating expenses and funding sources ............................................................................................... 32 Summary of significant budget changes for Sandy Neck Enterprise Fund .................................................................................... 32 Sandy Neck Enterprise Fund appropriation order 2012-124 .......................................................................................................... 32
14. GROWTH MANAGEMENT DEPARTMENT ............................................................................................................................... 33 Summary of Growth Management Department expenditures and funding resources .................................................................... 33 Summary of significant budget changes for the Growth Management Department ....................................................................... 33 Growth Management Department appropriation order 2012-125 .................................................................................................. 33
15. TOWN COUNCIL DEPARTMENT .............................................................................................................................................. 34 Summary of Town Council expenditures and funding sources ...................................................................................................... 34 Summary of significant budget changes for Town Council operations .......................................................................................... 34 Town Council Department appropriation order 2012-126 ............................................................................................................. 34
16. TOWN MANAGER DEPARTMENT ............................................................................................................................................. 35 Summary of Town Manager expenditures and funding sources .................................................................................................... 35 Summary of significant budget changes for Town Manager operations ........................................................................................ 35 Town Manager Department appropriation order 2012-127 ............................................................................................................ 35
17. ADMINISTRATIVE SERVICES DEPARTMENT ......................................................................................................................... 36 Summary of Administrative Services Department expenditures and funding sources ................................................................... 36 Summary of administrative department significant budget changes .............................................................................................. 36 Administrative Services Department appropriation order 2012-128 .............................................................................................. 36
18. GENERAL FUND OTHER REQUIREMENTS ............................................................................................................................ 37 Summary of Other Requirements expenditures and funding sources ............................................................................................. 37 Debt Service ................................................................................................................................................................................... 37 Debt service appropriation order 2012-129 .................................................................................................................................... 38 Employee Benefits and Insurance .................................................................................................................................................. 39 Health Insurance ............................................................................................................................................................................. 40 Unemployment ............................................................................................................................................................................... 41 Pension Assessments & Non Contributory Pension ....................................................................................................................... 41 Worker's Compensation ................................................................................................................................................................. 41 Property And Casualty Insurance ................................................................................................................................................... 43 Employee Benefits and Insurance Appropriation Order 2012-130 ................................................................................................ 43 Libraries and Other Grants ............................................................................................................................................................. 44 Library Appropriation Order 2012-131 .......................................................................................................................................... 44 Other Grants Appropriation Order 2012-132 ................................................................................................................................. 44 Assessments ................................................................................................................................................................................... 45 Assessments Appropriation Order 2012-133.................................................................................................................................. 45 Transfers and Appropriation Deficits ............................................................................................................................................. 46 Transfers Appropriation Order 2012-134 ....................................................................................................................................... 47
19. REVOLVING FUNDS ................................................................................................................................................................... 48
POSITION SUMMARY ........................................................................................................................................................................ 49

1
TOWN MANAGER’S FY 2013 BUDGET MESSAGE Thomas K. Lynch, Acting Town Manager
Fiscal Stability In A Changing Environment
The state of our community continues to provide challenges to us every day. The FY 2013 Operating Budget reflects the economic challenges we are all facing. This budget maintains fiscal stability in a changing environment. Some of the changes took place in the Town Manager’s office and with the composition of the Town Council. Under a contract buyout in September, Town Manager John Klimm ceased his official duties as Town Manager. In November, five new town councilors were elected to the Town Council. I became Interim and then Acting Town Manager throughout this budget process. Despite the changing political environment, we have maintained our fiscal stability, achieved modest service enhancements, spent within our means, and prudently planned our financial future. This budget reflects that prudent financial management and is structurally balanced.
Financial Accountability Financial accountability continues to be the Town of Barnstable’s highest priority. Of the State’s 351 cities and towns, Barnstable is one of 21 to attain the AAA bond rating, the highest a town can receive. We have maintained this rating six years running. We have also received our 11
th consecutive Distinguished Budget Presentation Award for the FY 2012
budget document and the Excellence in Financial Report Award for 9 years in a row. These awards demonstrate the Town’s commitment to providing the most comprehensive and highest quality financial information. We have passed an FY 2013 Capital Budget designed to improve our infrastructure and preserve our valuable public assets. In FY 2012, we completed the new Bath House at Sandy Neck Beach Park, opened the new Barnstable Municipal Airport Terminal and Tower, completed the exterior town hall renovations, began Phase III of the Stevens Street/High School Road Gateway and appropriated $3.25 million for public road improvements. In Fiscal 2013, Barnstable continues to work toward preserving our capital assets and improving our infrastructure. The FY 2013 Capital Budget funds interior town hall repairs, improves West Barnstable and Centerville Community buildings, improves septic needs at Hathaways Pond, Marine and Environmental Affairs and our Structures and Grounds Building. The schools have adopted a capital plan and funding for school repairs is included. Municipal and school management is taking steps to further consolidate our maintenance and grounds operations and will be funding a study of this consolidation in FY 13. Our revenues have shown growth over FY 2012. Motor vehicle excise tax revenues have increased and we are budgeting an extra $332,598 or 6.95%. Investment income has also grown and FY 2013 revenues from this resource are being increased 30% or $150,000. We are conservatively estimating new growth revenue at $521,000. Over the last ten years, the percent of total tax collections to net tax levy has averaged between 99 and 100%. Tax collection rates for this fiscal year are tracking to reach a similar high collection percentage. Dedicated Staff
Our dedicated Town and District employees are second to none. We keep asking them to do more with less. Our employees have given their all again this year. Our dedicated School Committee, School Superintendent and staff have done an extraordinary job in advancing excellence in our school system. Our schools’ non-negotiables remain academic success, safe school environments and meeting the needs of our students. We will not compromise on these core principles. There has been change at the school department. Our School Superintendent, Patricia Grenier, left us in us August. We welcomed Dr. Mary Czajkowski who has set the bar high working toward academic excellence throughout our school district. Community Resources
As a community, we have libraries that cultivate and foster our intellect. We are grateful to our Fire and Water Districts, made up of the very finest professionals in the country, as they work to preserve and protect our health and safety. Our community is committed to our children through recreation programs and a state of the art Youth and Community Center. Seniors have a facility that provides daily programs and an Adult Supportive Day Program for seniors who can no longer remain alone at home. Civic and business associations are our partners in providing a vibrant, livable community.

2
Fiscal Year 2013 Priorities We will be busy in FY 2013 continuing to provide the highest quality services possible within the budget constraints that confront us. One area which will receive extra attention will be our current health care plan design. We are committed to studying both the current health care benefit plan offered through the Cape Cod Municipal Health Group and looking at models which might save money, reduce employee costs, and maintain our current benefit offerings. The priorities listed below are designed to keep us financially sound: keep our community safe; improve and increase the amount of information available to our citizens; promote economic development; and improve the environment with our green initiatives. First, the FY 2013 budget is balanced and does not rely on any one-time fixes or solutions. Minimal reserves are used to cover one-time costs. Structurally we have placed our health care costs under our Employee Benefits budget which will create a better understanding of how much of the budget is directed towards this category. This will also allow us to expand our strategy for financing our unfunded healthcare benefit liabilities as any budgetary savings in this category can be directed towards the trust fund that the Town Council created for this purpose as part of the FY12 budget. We are proposing to establish an account to set aside funding for the capital needs of our town owned leased properties. And in FY 2013, we began planning to include a performance based measurement system into our award winning budget document. We plan to improve efficiency and effectiveness each year as we produce performance measures and indicators to track the performance of our operations. The budget funds a new parking ticket processing contract to increase the collection rate on citations issued through our Regulatory Services Department. Second, public safety remains one of our highest priorities. We will continue our community approach to crime prevention and public safety, with our Police Chief Paul MacDonald and the dedicated members of the Barnstable Police Department. The budget restores an additional full time police officer to keep our department fully staffed at 115. The new Street Crimes Unit, which has taken over 600 criminals off our streets, will receive additional overtime funding to keep this unit operational. The budget restores the Domestic Violence Specialist to a full time position. We applaud the daily patrol protection, the targeting of high crime areas, the nationally recognized cyber crimes successful efforts, and the community policing which keeps us all safe. Third, we understand that community outreach and citizen engagement are at our core of what we do. Over the past year, civic engagement continued to be an important priority. We implemented outreach measures with thousands of households now receiving our monthly bulletin and E-newsletter. Our recently improved website is seen by many residents each day. We continue to produce over two hours of live television programming every day on Barnstable This Morning, attend village meetings with our civic associations and neighborhood groups and provide streaming video and Video on Demand. We also continue our successful Citizens Leadership Academy, “Inside Barnstable Town Government”, and the ever popular Barnstable Citizens Police Academy. We are the first community in Massachusetts to have introduced the Barnstable iForum, a virtual town meeting which engages citizens in a discussion of issues confronting our community.
The School Department’s Channel 22 has been offering excellent student driven programming and we expect great things again from them this coming year. In January, we introduced the Citizens Resource Line, a direct line for citizens to reach an employee with a concern which will be followed up and addressed. The CRL has been well received with over fifty calls received and forty-two cases closed. We have also strengthened our internal network abilities with the Town Council’s approval to construct the Barnstable Fiber Optics Network (BFON). BFON will provide reliable, high speed networking connectivity between all municipal, school, fire, library, water and county buildings within the Town of Barnstable. The system will serve us for decades to come. Fourth, we remain committed to improving our economic climate. We have partnered with the Gateway Cities Program and the Executive Office of Housing and Economic Development to bring all available resources to Barnstable. Gateway Cities provided a $50,000 grant which we have used to create the Kennedy Legacy Trail, part of our effort to make downtown Hyannis a walkable place to live, work and visit. We are changing the funding for our Arts and Culture Coordinator from relying on grants to the General Fund. Our environment is our economy and residents and visitors alike enjoy our natural resources. We have funded clean up efforts at our ponds. There is beach equipment replacement at Veterans’ Park. The budget funds ramp attendants at Blish

3
Point to assist boater access to Barnstable Harbor and Cape Cod Bay. There is dinghy removal money to protect our fragile coastal dunes after the summer boating season ends. Fifth, we continue to aggressively pursue our “green” agenda. The Water Pollution Control turbine and solar array systems are on line. We are working on a major renewable energy generation project at the transfer station. There are new photovoltaic projects scheduled for the industrial park, Barnstable Municipal Airport, and the roof tops of municipal buildings. Although not budgeted, we expect funding from renewable energy projects in FY 2013 to be collected, which be used to fund future projects in FY 2014. And working with staff and the Renewable Energy Commission, we will improve our recycling rates and explore ways to reduce our trash stream. Barnstable will continue to use organic methods to address turf management and pesticide programs.

4
ALL FUNDS SUMMARY The total proposed FY13 operating budgets for the Town of Barnstable’s appropriated funds is $155,614,901. This is a decrease from the FY12 budget of $284,682, or 0.18 percent. In addition to the General Fund, this figure includes the Town’s eight enterprise fund operations; Airport, Golf, Solid Waste, Sewer, Water Supply, Marina, Sandy Neck and the Hyannis Youth and Community Center. These funds comprise the Town’s annually appropriated funds. The General Fund accounts for revenues and expenditures necessary to provide general governmental services. By definition, all financial resources that are not required to be accounted for in other funds are accounted for in the General Fund. This is the fund that receives all property tax revenue except for property tax surcharges for the Community Preservation Act. The enterprise funds are primarily supported by user fees. Residents that access these services pay a fee to support the operation. The fees charged by the enterprise fund operations are set at levels which should allow them cover all operational and capital costs unless a general fund subsidy is provided.
SUMMARY OF ALL APPROPRIATED FUNDS
The General Fund budget is increasing $577,587 in FY13. Factors driving an increase to the budget include contractual salary obligations, increases to employee benefits and an increase in the Commonwealth Charter School assessments (Sturgis & Lighthouse charter schools). Cost reductions offsetting these increases include declines in debt service, operating capital, transfers to other funds and no snow and ice deficit for FY12 to fund in FY13. The decrease in the airport enterprise fund is principally due to the declining sale of jet fuel. The airport purchases jet fuel for resale. This one activity generates more than 50% of the fund’s operating revenue. A decline in the number of gallons sold results in a reduced budget proposal for FY13. The golf course enterprise fund is declining $230,883 as a drop in play has resulted in less recurring revenue available to fund operations. The proposed FY13 budget includes a reduction in seasonal staff, overtime, supplies and capital improvements. The solid waste enterprise fund budget is increasing slightly by $41,348 or 1.6%. Contractual salary obligations and capital improvements account for most of the budget increase. The decrease in the sewer enterprise fund is primarily due to decreases in debt service and utility costs. The water enterprise fund budget is increasing $251,287 primarily due to an increase in the management contract for operating the system. Two new water storage tanks and pump stations require a higher level of service. The HYCC enterprise fund is decreasing $131,060 in FY13 as this operation is also experiencing a revenue decline. As a result, reductions to part-time staffing, overtime and operating expenses have been implemented to offset most of the revenue decline. Debt service payments on the facility’s construction bonds are also declining in FY13.

5
The marina enterprise fund is decreasing $35,512 mainly due to reductions in debt service and operating capital. Finally, the increase in the Sandy Neck enterprise fund of $25,750 is mainly attributable to contractual pay increases as well as an increase in part-time staff and an increase in the hourly seasonal wage for some positions.
General Fund operations comprise 84 percent of the Town’s total appropriated funds. The enterprise funds make up the remaining 16 percent. The Airport Enterprise Fund is the largest enterprise fund in the Town with a proposed budget of $7.3 million for FY13, or 4.7 percent of all appropriated funds.

6
GENERAL FUND SUMMARY
GENERAL FUND REVENUE SUMMARY
Total general fund resources are projected to increase $577,587 or 0.44%. Property taxes available for operations are projected to increase $3 million which is almost entirely offset by a reduction in the amount of general fund surplus used to balance the FY13 budget. A majority of the surplus used in FY12 included a one-time transfer of $2 million to the Capital Trust Fund that is not repeated in FY13 and a $925,000 snow and ice removal deficit from FY11 and paid for in FY12.

7
Property taxes and excise taxes comprise 83% of General Fund revenues. The second largest category is state aid at 10%. State aid is a relatively small percentage of the Town’s General Fund revenue sources compared to many Massachusetts communities. The remaining 7% is generated from local receipts and surplus funds.

8
TAX LEVY, TAX RATES & TAX BILL
Tow n tax levy 86,040,891$ 81% 89,064,457$ 80% 91,769,862$ 81% 94,579,102$ 81% 97,325,379$ 80% 11,284,488$ 13%
Hyannis FD tax levy 6,238,186 6% 7,152,301 6% 6,836,967 6% 7,363,834 6% 7,992,181 7% 1,753,995 28%
Barnstable FD tax levy 2,522,490 2% 2,852,855 3% 2,884,014 3% 2,713,369 2% 2,914,168 2% 391,678 16%
Cotuit FD tax levy 2,091,491 2% 2,217,884 2% 2,063,825 2% 2,222,660 2% 2,901,523 2% 810,032 39%
W. Barnstable FD tax levy 1,205,038 1% 1,303,867 1% 1,332,277 1% 1,345,754 1% 1,344,740 1% 139,702 12%
COMM FD tax levy 8,030,068 8% 8,299,303 7% 8,892,217 8% 9,099,538 8% 9,637,526 8% 1,607,458 20%
Total FD tax levy 20,087,273 19% 21,826,210 20% 22,009,300 19% 22,745,155 19% 24,790,138 20% 4,702,865 23%
Grand total all tax levies 106,128,164$ 100% 110,890,667$ 100% 113,779,162$ 100% 117,324,257$ 100% 122,115,517$ 100% 15,987,353$ 15%
FY 2009 FY 2010FY 2008
History Of Town And Fire District Tax Levy Growth For The Past 5 Years
Growth in Levy
FY 2011 FY08 to FY12FY 2012
The Town maintains a property assessment database by Fire District. The tax rates for the Town of Barnstable and the five Fire Districts are determined by dividing the Town’s tax levy into the Town’s total property value and the Districts’ tax levy into the Districts’ respective property value. The Town’s tax levy is subject to Proposition 2½ taxing limitations while the Districts’ are not. The table above illustrates the tax levies for the Town and each district for the past five years and their relative percentage of the total. The Town’s tax levy has increased $11.3 million over the five year period of FY08 to FY12 or 13%. The Fire Districts’ tax levies have collectively increased $4.7 million over the same time period or 23%.
Tow n Tax Rate $5.80 79% $6.12 77% $6.87 79% $7.28 78% $7.59 77%
Hyannis FD $1.53 21% $1.78 23% $1.82 21% $2.04 22% $2.24 23%
Total $7.33 100% $7.90 100% $8.69 100% $9.32 100% $9.83 100%
Tow n Tax Rate $5.80 74% $6.12 72% $6.87 74% $7.28 76% $7.59 75%
Barnstable FD $2.04 26% $2.37 28% $2.43 26% $2.31 24% $2.52 25%
Total $7.84 100% $8.49 100% $9.30 100% $9.59 100% $10.11 100%
Tow n Tax Rate $5.80 81% $6.12 81% $6.87 81% $7.28 81% $7.59 78%
Cotuit FD $1.33 19% $1.43 19% $1.56 19% $1.68 19% $2.20 22%
Total $7.13 100% $7.55 100% $8.43 100% $8.96 100% $9.79 100%
Tow n Tax Rate $5.80 76% $6.12 74% $6.87 75% $7.28 76% $7.59 76%
W. Barn. FD $1.86 24% $2.11 26% $2.28 25% $2.34 24% $2.37 24%
Total $7.66 100% $8.23 100% $9.15 100% $9.62 100% $9.96 100%
Tow n Tax Rate $5.80 85% $6.12 85% $6.87 85% $7.28 85% $7.59 84%
COMM FD $1.03 15% $1.08 15% $1.26 15% $1.33 15% $1.43 16%
Total $6.83 100% $7.20 100% $8.13 100% $8.61 100% $9.02 100%
Tow n Tax Rate $5.80 79% $6.12 78% $6.87 79% $7.28 79% $7.59 78%
Average FD Rate $1.56 21% $1.75 22% $1.87 21% $1.94 21% $2.15 22%
Average Total $7.36 100% $7.87 100% $8.74 100% $9.22 100% $9.74 100%
FY 2012
History of Tax Rates For Town And Fire Districts
FY 2010 FY 2011FY 2009FY 2008
The table above illustrates the total tax rates for residential property only including the Town and each Fire District for the most recent 5 years assuming no residential exemption was elected by any entity. The portion of the combined average tax rate attributed to the Fire Districts has been in the range of 21 to 22 percent over this five-year period.

9
The chart above illustrates the Town’s tax rates over the past 5 years. The residential rate exceeds the rate for commercial, industrial and personal property due to the adoption of a residential exemption by the Town Council. The projected tax rate for FY13 assumes no change in property value and the amount of the residential exemption. FY13 is a revaluation year which will result in some modest changes to property values. The actual tax rate for FY13 is projected to be set in November 2012 and should be very close to the projected rates above unless there is a major change to the levy or property values.
The graph above illustrates the FY12 combined residential Town and Fire District tax bill on a property value of $311,000 (the Town median residential value) for each District.
10
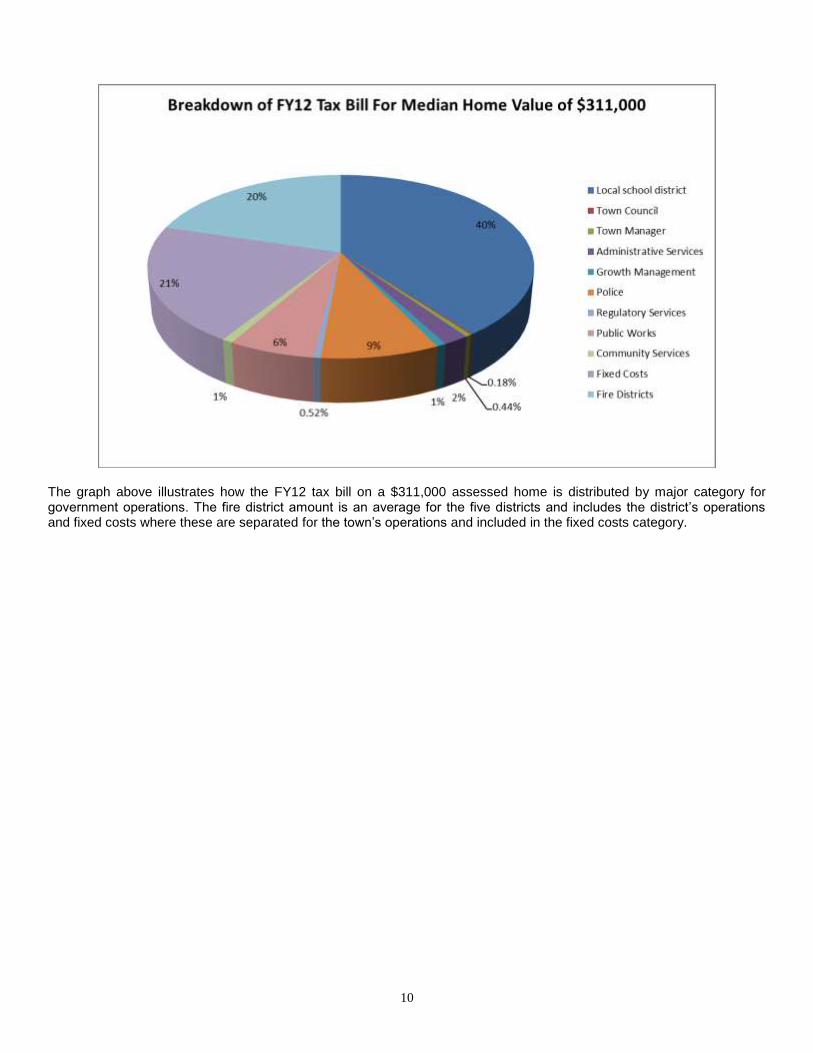
The graph above illustrates how the FY12 tax bill on a $311,000 assessed home is distributed by major category for government operations. The fire district amount is an average for the five districts and includes the district’s operations and fixed costs where these are separated for the town’s operations and included in the fixed costs category.

11
GENERAL FUND BUDGET BY MAJOR EXPENDITURE CATEGORY
Actual Actual Budget Projected Proposed Change Percent
Expenditure Category FY 2010 FY 2011 FY 2012 FY 2012 FY 2013 FY12 - FY13 Change
Personnel 56,327,265$ 57,734,246$ 59,656,030$ 59,158,204$ 61,530,414$ 1,874,384$ 3.14%
Operating Expenses 16,504,210 16,215,723 15,998,534 15,898,158 16,284,572 286,038 1.79%
Capital Outlay 844,345 488,709 890,878 884,000 664,800 (226,078) -25.38%
Horace Mann Charter Schools 7,958,579 8,222,890 8,349,943 8,349,943 8,497,452 147,509 1.77%
Debt Service 9,685,913 9,876,504 10,390,994 10,298,533 9,456,306 (934,688) -9.00%
Employee Benefits 15,669,235 16,321,690 17,743,163 17,563,747 18,203,846 460,683 2.60%
Insurance 1,205,171 1,281,890 1,300,000 1,299,000 1,386,000 86,000 6.62%
Grants 1,570,937 1,618,159 1,655,727 1,654,896 1,692,352 36,625 2.21%
Assessments 6,647,798 6,692,310 7,275,478 7,491,941 7,850,411 574,933 7.90%
Transfers 2,601,565 2,452,521 5,656,868 5,656,868 4,945,690 (711,178) -12.57%
Deficits - - 1,036,641 20,000 20,000 (1,016,641) -98.07%
Total Expenditures 119,015,019$ 120,904,642$ 129,954,256$ 128,275,290$ 130,531,843$ 577,587$ 0.44%
The FY13 proposed General Fund budget is $133,531,843 or $577,587 more than the FY12 approved budget. The more significant changes by expenditure category include the following:
1. Salary and wages are increasing $1.874 million, or 3.1 percent. This covers all contractual pay increases and a 7.15 increase in the full-time equivalents budgeted within the general fund.
2. Operating expenses are increasing $286,000 and capital outlay is decreasing $226,000. 3. Debt service is decreasing $934,688 or 9% as some bonds have been retired. 4. Employee benefits will increase $461,000 principally due to the county retirement assessment and unemployment
insurance. 5. Property and casualty insurance will increase 6.6% ($86,000) principally due to the new facilities at the airport
being added to the policy coverage. 6. Assessments are increasing $575,000 due to the expansion of the Sturgis Charter School. 7. Transfers to other funds will decline $711,000 as the FY12 budget included a one-time transfer of $2 million to the
Capital Trust Fund 8. Deficits are $1 million less in FY13 due to the absence of an FY12 snow and ice budget shortage.
12
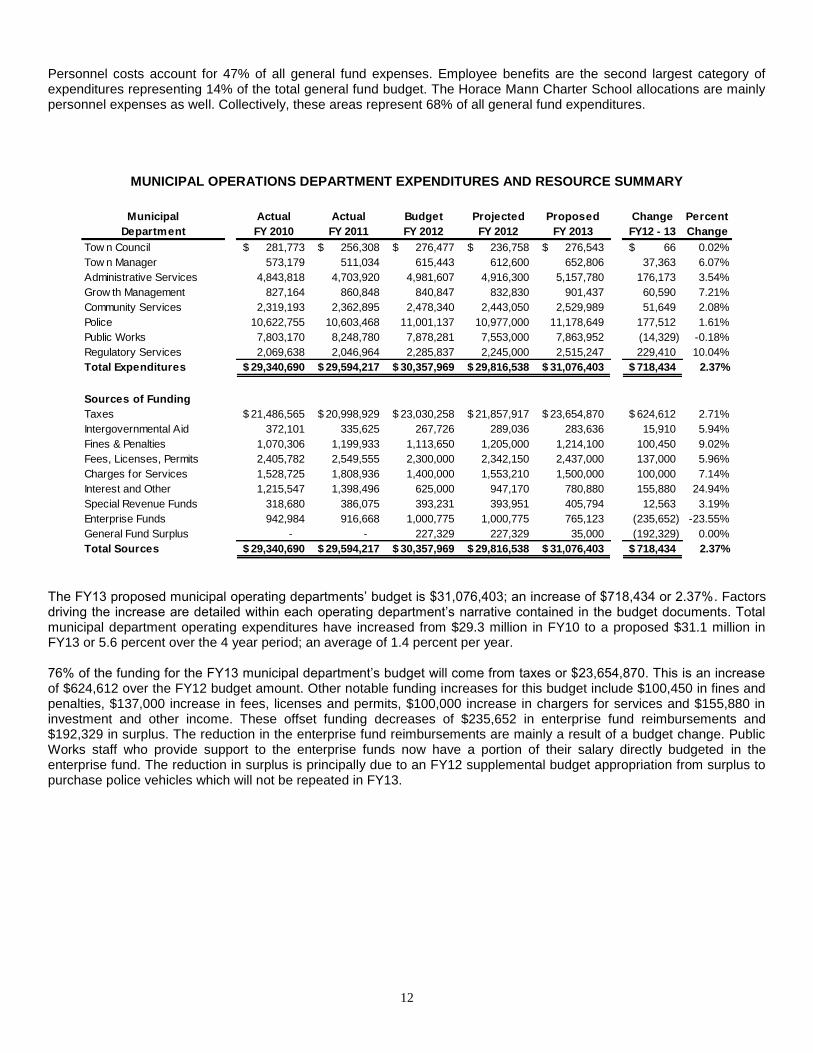
Personnel costs account for 47% of all general fund expenses. Employee benefits are the second largest category of expenditures representing 14% of the total general fund budget. The Horace Mann Charter School allocations are mainly personnel expenses as well. Collectively, these areas represent 68% of all general fund expenditures.
MUNICIPAL OPERATIONS DEPARTMENT EXPENDITURES AND RESOURCE SUMMARY
Municipal Actual Actual Budget Projected Proposed Change Percent
Department FY 2010 FY 2011 FY 2012 FY 2012 FY 2013 FY12 - 13 Change
Tow n Council 281,773$ 256,308$ 276,477$ 236,758$ 276,543$ 66$ 0.02%
Tow n Manager 573,179 511,034 615,443 612,600 652,806 37,363 6.07%
Administrative Services 4,843,818 4,703,920 4,981,607 4,916,300 5,157,780 176,173 3.54%
Grow th Management 827,164 860,848 840,847 832,830 901,437 60,590 7.21%
Community Services 2,319,193 2,362,895 2,478,340 2,443,050 2,529,989 51,649 2.08%
Police 10,622,755 10,603,468 11,001,137 10,977,000 11,178,649 177,512 1.61%
Public Works 7,803,170 8,248,780 7,878,281 7,553,000 7,863,952 (14,329) -0.18%
Regulatory Services 2,069,638 2,046,964 2,285,837 2,245,000 2,515,247 229,410 10.04%
Total Expenditures 29,340,690$ 29,594,217$ 30,357,969$ 29,816,538$ 31,076,403$ 718,434$ 2.37%
Sources of Funding
Taxes 21,486,565$ 20,998,929$ 23,030,258$ 21,857,917$ 23,654,870$ 624,612$ 2.71%
Intergovernmental Aid 372,101 335,625 267,726 289,036 283,636 15,910 5.94%
Fines & Penalties 1,070,306 1,199,933 1,113,650 1,205,000 1,214,100 100,450 9.02%
Fees, Licenses, Permits 2,405,782 2,549,555 2,300,000 2,342,150 2,437,000 137,000 5.96%
Charges for Services 1,528,725 1,808,936 1,400,000 1,553,210 1,500,000 100,000 7.14%
Interest and Other 1,215,547 1,398,496 625,000 947,170 780,880 155,880 24.94%
Special Revenue Funds 318,680 386,075 393,231 393,951 405,794 12,563 3.19%
Enterprise Funds 942,984 916,668 1,000,775 1,000,775 765,123 (235,652) -23.55%
General Fund Surplus - - 227,329 227,329 35,000 (192,329) 0.00%
Total Sources 29,340,690$ 29,594,217$ 30,357,969$ 29,816,538$ 31,076,403$ 718,434$ 2.37%
The FY13 proposed municipal operating departments’ budget is $31,076,403; an increase of $718,434 or 2.37%. Factors driving the increase are detailed within each operating department’s narrative contained in the budget documents. Total municipal department operating expenditures have increased from $29.3 million in FY10 to a proposed $31.1 million in FY13 or 5.6 percent over the 4 year period; an average of 1.4 percent per year. 76% of the funding for the FY13 municipal department’s budget will come from taxes or $23,654,870. This is an increase of $624,612 over the FY12 budget amount. Other notable funding increases for this budget include $100,450 in fines and penalties, $137,000 increase in fees, licenses and permits, $100,000 increase in chargers for services and $155,880 in investment and other income. These offset funding decreases of $235,652 in enterprise fund reimbursements and $192,329 in surplus. The reduction in the enterprise fund reimbursements are mainly a result of a budget change. Public Works staff who provide support to the enterprise funds now have a portion of their salary directly budgeted in the enterprise fund. The reduction in surplus is principally due to an FY12 supplemental budget appropriation from surplus to purchase police vehicles which will not be repeated in FY13.

13
The Police Department is the largest municipal operation representing 36%. Public Works is the second largest at 25% and Administrative Services is third at 17%.
Taxes are the largest funding source for these operations providing 76% of the funding for the proposed FY13 budget. Fees, licenses and permits are the second largest category representing 8%.

14
MUNICIPAL OPERATIONS EXPENDITURES BY CATEGORY
Actual Actual Approved Projected Proposed Change Percent
Expense Category FY 2010 FY 2011 FY 2012 FY 2012 FY 2013 FY12 - 13 Change
Personnel 23,315,857$ 23,645,384$ 24,436,974$ 23,984,380$ 25,258,417$ 821,443$ 3.36%
Operating Expenses 5,180,487 5,460,124 5,030,117 4,948,158 5,153,186 123,069 2.45%
Operating Capital 844,345 488,709 890,878 884,000 664,800 (226,078) -25.38%
Total Expenditures 29,340,690$ 29,594,217$ 30,357,969$ 29,816,538$ 31,076,403$ 718,434$ 2.37%
81% of the municipal operating budget is comprised of personnel expenses. This category is increasing $821,443 in the proposed FY13 budget. Operating expenses are increasing $123,069 and represent 17% of municipal operating expenses. Additional funds are provided to cover the increased costs for software support and licensing fees, utilities, road striping, police uniforms and fuel. Operating capital is decreasing $226,078 to $664,800 for FY13. This represents 2% of the total municipal expenses.

15
MUNICIPAL OPERATING DEPARTMENT EXPENDITURES BY DIVISION
ACTUAL ACTUAL BUDGET PROJECTED PROPOSED
FY10 FY11 FY 12 FY 12 FY 13 $ %
Legislative & Executive
Tow n Council 281,773$ 256,308$ 276,477$ 236,758$ 276,543$ 66$ 0.02%
Tow n Manager 573,179 511,034 615,443 612,600 652,806 37,363 6.07%
Total Legislative & Executive 854,952 767,342 891,920 849,358 929,349 37,429 4.20%
Administrative Services Department
Finance Division 2,515,398 2,440,384 2,587,784 2,554,300 2,688,399 100,615 3.89%
Legal Division 396,028 419,733 426,867 422,000 443,374 16,507 3.87%
Human Resource Division 732,506 725,787 710,245 701,000 730,188 19,943 2.81%
Information Technology Division 1,199,885 1,118,016 1,256,711 1,239,000 1,295,819 39,108 3.11%
Total Administrative Services Department 4,843,818 4,703,920 4,981,607 4,916,300 5,157,780 176,173 3.54%
Growth Management
Administration - 178,776 263,100 262,330 273,838 10,738 4.08%
Regulatory Review 409,950 264,705 160,226 157,000 198,910 38,684 24.14%
Comprehensive Planning 185,627 135,728 116,594 114,000 88,137 (28,457) -24.41%
Economic Development 34,356 34,328 98,165 98,000 137,498 39,333 40.07%
Community Development 62,877 113,565 68,248 68,000 72,086 3,838 5.62%
Property Management 50,004 48,709 49,847 49,500 42,443 (7,404) -14.85%
Traff ic Management 84,350 85,037 84,667 84,000 88,525 3,858 4.56%
Total Growth Management Department 827,164 860,848 840,847 832,830 901,437 60,590 7.21%
Community Services Department
Recreation, Leisure & Aquatics Division 1,234,302 1,284,065 1,290,100 1,279,050 1,264,070 (26,030) -2.02%
Senior Services Division 362,078 370,205 349,121 340,000 363,921 14,800 4.24%
Marine & Environmental Services Division 722,813 708,625 839,119 824,000 901,998 62,879 7.49%
Total Community Services Department 2,319,193 2,362,895 2,478,340 2,443,050 2,529,989 51,649 2.08%
Police Department
Administration & Investigative Services Division 3,290,470 3,583,498 3,681,471 3,672,000 3,692,151 10,680 0.29%
Field Services Division 7,332,285 7,019,970 7,319,666 7,305,000 7,486,498 166,832 2.28%
Total Police Department 10,622,755 10,603,468 11,001,137 10,977,000 11,178,649 177,512 1.61%
Public Works Department
Administration & Technical Support 1,639,006 1,446,637 1,672,227 1,539,000 1,484,557 (187,670) -11.22%
Highw ay Division 3,657,002 3,983,549 3,305,599 3,220,000 3,390,457 84,858 2.57%
Structures and Grounds Division 2,507,162 2,818,594 2,900,455 2,794,000 2,988,938 88,483 3.05%
Total Public Works Department 7,803,170 8,248,780 7,878,281 7,553,000 7,863,952 (14,329) -0.18%
Regulatory Services Department
Building Services Division 672,519 721,125 807,524 788,700 851,595 44,071 5.46%
Conservation Division 280,526 288,868 354,461 351,000 368,336 13,875 3.91%
Consumer Affairs Division 473,266 352,838 402,627 397,800 507,895 105,268 26.15%
Health Division 643,327 684,133 721,225 707,500 787,421 66,196 9.18%
Total Regulatory Services Department 2,069,638 2,046,964 2,285,837 2,245,000 2,515,247 229,410 10.04%
TOTAL MUNICIPAL OPERATIONS 29,340,690 29,594,217 30,357,969 29,816,538 31,076,403 718,434 2.37%
CHANGE FY12 TO FY13
The largest operational increase is in the Regulatory Services Department as FTE’s are increasing by 1.20 and $28,150 of additional funds are provided for a new parking ticket processing contract and flu vaccinations. There is also an increase of 1.50 FTE’s in the Police Department for one sworn officer and an increase to the Domestic Violence Specialist position to full-time. Growth Management has a 0.50 FTE increase in personnel while Public Works and Community Service’s FTE’s are declining 2.25 and 0.50, respectfully. There are no changes to the FTE’s in Administrative Services, Town council or town manager operations.

16
SCHOOL OPERATION EXPENDITURES BY CATEGORY (LOCAL SCHOOLS ONLY)
Actual Actual Approved Projected Proposed Change Percent
Expenditure Category FY 2010 FY 2011 FY 2012 FY 2012 FY 2013 FY12 - FY13 Change
Personnel 33,011,408$ 34,088,862$ 35,219,056$ 35,173,824$ 36,271,997$ 1,052,941$ 2.99%
Operating Expenses 11,323,723 10,755,599 10,968,417 10,950,000 11,131,386 162,969 1.49%
Horace Mann Charter Schools 7,958,579 8,222,890 8,349,943 8,349,943 8,497,452 147,509 1.77%
Total Expenditures 52,293,710$ 53,067,351$ 54,537,416$ 54,473,767$ 55,900,835$ 1,363,419$ 2.50%
Sources of Funds
Taxes 44,207,612$ 45,407,038$ 47,052,688$ 46,989,039$ 48,416,107$ 1,363,419$ 2.90%
Intergovernmental Aid 7,589,756 7,146,363 7,184,728 7,184,728 7,184,728 - 0.00%
Interest and Other 496,342 513,950 300,000 300,000 300,000 - 0.00%
Total Sources 52,293,710$ 53,067,351$ 54,537,416$ 54,473,767$ 55,900,835$ 1,363,419$ 2.50%
65% percent of the school operating budget is in the form of personnel expenses. This amount is increasing $1,052,941 or 2.99% for FY13. 20% of the School’s operating budget is allocated for the two Horace Mann Charter Schools (HMCS). The allocation for the two HMCS is $147,509 more in FY13 or a 1.49% increase. A majority of the HMCS budget is for personnel as well. Operating expenses represent 15% of the budget. The entire FY13 budget increase of $1,363,419 will be provided from taxes as other funding sources are not changing.

17
ALL EDUCATION EXPENDITURES
INCLUDES LOCAL SCHOOL SYSTEM, REGIONAL SCHOOL DISTRICT, COMMONWEALTH CHARTER SCHOOLS AND SCHOOL CHOICE
Expenditure Actual Actual Approved Projected Proposed Change Percent
Category FY 2010 FY 2011 FY 2012 FY 2012 FY 2013 FY12 - 13 Change
Local School System 44,335,131$ 44,844,461$ 46,187,473$ 46,123,824$ 47,403,383$ 1,215,910$ 2.63%
Horace Mann Charter Schools 7,958,579 8,222,890 8,349,943 8,349,943 8,497,452 147,509 1.77%
Cape Cod Regional Technical High School 2,823,678 2,822,920 2,707,304 2,707,304 2,657,683 (49,621) -1.83%
Commonwealth Charter Schools 1,004,574 1,058,352 1,623,486 1,850,236 2,191,908 568,422 35.01%
School Choice Tuition 373,621 477,596 487,596 491,426 491,426 3,830 0.79%
All Education Expenditures 56,495,583$ 57,426,219$ 59,355,802$ 59,522,733$ 61,241,852$ 1,886,050$ 3.18%
Total expenditures for the direct education of students who live or go to school in Barnstable are budgeted at $61,241,852 for FY13. The local school system comprises a majority of the expenditures on education. Combined with the amount for the two Horace Mann Charter Schools; which receive their allocations out of the local district’s budget, they represent 91% of all direct expenditures on education. Assessments received for Barnstable children that attend the Cape Cod Regional Technical High School and Commonwealth Charter Schools represent 4% each, while the assessments for students attending other school districts through the School Choice program represent about 1% of all education expenditures. The significant increase to the Commonwealth Charter School assessment is a result of the expansion to a second campus at the school. This assessment has more than doubled since FY10 as the school has introduced a second campus. The school will be adding a third grade level in FY13 to the second campus and a fourth grade level in FY14.

18
OTHER REQUIREMENTS EXPENDITURE SUMMARY
Actual Actual Approved Projected Proposed Change Percent
Expenditure Category FY 2010 FY 2011 FY 2012 FY 2012 FY 2013 FY 12 - 13 Change
Debt Service
Principal 7,033,192 7,461,400 7,933,533 7,933,533$ 7,350,743$ (582,790)$ -7.35%
Interest 2,640,924 2,384,897 2,432,461 2,350,000 2,080,563 (351,898) -14.47%
Interest on tax refunds 11,797 30,207 25,000 15,000 25,000 - 0.00%
Total Debt Service 9,685,913 9,876,504 10,390,994 10,298,533 9,456,306 (934,688) -9.00%
Employee Benefits
Retirees Health Insurance 982,973 1,036,179 1,155,000 1,110,000 1,150,000 (5,000) -0.43%
Retired Teachers Health Insurance 2,457,661 2,474,696 2,319,247 2,319,247 1,999,215 (320,032) -13.80%
Health Insurance - Active Employees 4,889,912 5,162,374 5,659,302 5,600,000 5,617,417 (41,885) -0.74%
OPEB Trust Fund Contribution - - 50,000 50,000 200,000 150,000 300.00%
Medicare Tax 761,723 808,058 847,291 825,000 879,405 32,114 3.79%
Life Insurance - Active Employees 5,957 6,155 8,332 6,000 6,028 (2,304) -27.65%
Unemployment Insurance 172,205 145,216 200,000 150,000 380,000 180,000 90.00%
County Pension Assessment 5,730,624 5,990,911 6,553,491 6,553,000 6,971,781 418,290 6.38%
Worker's Compensation 668,180 698,101 950,500 950,500 1,000,000 49,500 5.21%
Total Employee Benefits 15,669,235 16,321,690 17,743,163 17,563,747 18,203,846 460,683 2.60%
Insurance
Fire/Casualty/Liability 961,424 1,046,802 1,055,000 1,060,000 1,139,000 84,000 7.96%
Boats/Equipment/Inland Marine 37,096 38,056 40,000 33,000 35,000 (5,000) -12.50%
Boiler and Machinery 25,745 29,400 30,000 31,000 32,000 2,000 6.67%
Motor Vehicles 180,906 167,632 175,000 175,000 180,000 5,000 2.86%
Total Insurance 1,205,171 1,281,890 1,300,000 1,299,000 1,386,000 86,000 6.62%
Grants
Libraries 1,473,565 1,473,565 1,488,238 1,488,238 1,525,444 37,206 2.50%
Tourism Grant 50,072 96,348 116,831 116,000 116,250 (581) -0.50%
Lombard Trust 47,300 48,246 50,658 50,658 50,658 - 0.00%
Total Grants 1,570,937 1,618,159 1,655,727 1,654,896 1,692,352 36,625 2.21%
Assessments and Other
Regional School District 2,823,678 2,822,920 2,707,304 2,707,304 2,657,683 (49,621) -1.83%
Commonw ealth Charter School Assessments 1,004,574 1,058,352 1,623,486 1,850,236 2,191,908 568,422 35.01%
School Choice Assessments 373,621 477,596 487,596 491,426 491,426 3,830 0.79%
Special Education 20,401 10,277 10,380 10,380 24,815 14,435 139.07%
Veteran's District Assessment & Benefit Payments 480,282 411,016 464,187 450,000 462,317 (1,870) -0.40%
County Tax & Cape Cod Commission 975,627 1,000,019 1,008,933 1,008,933 1,034,156 25,223 2.50%
Mosquito Control 290,012 294,390 299,782 299,782 311,291 11,509 3.84%
Air Pollution Control Districts 20,884 21,271 21,409 21,409 21,824 415 1.94%
RMV Non-Renew al Surcharge 77,300 66,340 66,340 66,340 68,680 2,340 3.53%
Cape Cod Regional Transit Authority 450,033 461,523 473,061 473,061 473,061 - 0.00%
Old Kings Highw ay 7,750 8,000 8,000 8,250 8,250 250 3.13%
Greenhead Fly Control District 4,820 4,820 5,000 4,820 5,000 - 0.00%
Celebrations 118,816 55,786 100,000 100,000 100,000 - 0.00%
Total Assessments and Other 6,647,798 6,692,310 7,275,478 7,491,941 7,850,411 574,933 7.90%
Transfers
Capital Trust Fund 2,601,565 2,452,521 3,859,618 3,859,618 3,110,690 (748,928) -19.40%
Sew er Construction Fund - - 1,767,250 1,767,250 1,775,000 7,750 0.44%
HYCC Enterprise Fund - - 30,000 30,000 60,000 30,000 100.00%
Total Transfers 2,601,565 2,452,521 5,656,868 5,656,868 4,945,690 (711,178) -12.57%
Appropriation Deficits
Snow & Ice Removal - - 927,677 - - (927,677) -100.00%
Abatements & Exemptions - - 108,964 20,000 20,000 (88,964) -81.65%
Total Deficits - - 1,036,641 20,000 20,000 (1,016,641) -98.07%
Total Expenditures 37,380,619$ 38,243,074$ 45,058,871$ 43,984,985$ 43,554,605$ (1,504,266)$ -3.34%
Other Requirements include general fund operating costs that are not part of the municipal or school department operations. This area of the budget is decreasing $1,504,266 from the approved FY12 budget. Notable decreases include $934,688 in debt service as some bonds have matured, $320,032 in retired teachers’ health insurance due to a

19
reconciliation of over assessments in prior years from the State, $49,621 in the Cape Cod Regional Technical High School assessment, $748,928 in the transfer to the Capital Trust Fund as the FY12 budget included a one-time additional allocation, and a $927,677 reduction in snow and ice removal costs as there is no FY12 deficit to include in the FY13 budget.

20
DEPARTMENT BUDGETS
1. POLICE DEPARTMENT The Police Department Budget represents 8% of the overall General Fund budget. This is the second largest operating budget after the School Department. 94% of the operation is financed with taxes with the other six percent raised through fines, fees, licenses, and administrative charges for outside detail work. $35,000 of general fund savings will be used to balance the FY13 proposed budget.
Summary of police department expenditures and funding sources
Actual Actual Approved Projected Proposed Change Percent
Expenditure Category FY 2010 FY 2011 FY 2012 FY 2012 FY 2013 FY12 - 13 Change
Personnel 9,800,692$ 9,834,742$ 9,989,259$ 9,968,000$ 10,434,449$ 445,190$ 4.46%
Operating Expenses 650,132 639,236 727,000 725,000 744,200 17,200 2.37%
Capital Outlay 171,931 129,490 284,878 284,000 - (284,878) -100.00%
Total Expenditures 10,622,755$ 10,603,468$ 11,001,137$ 10,977,000$ 11,178,649$ 177,512$ 1.61%
Full-time Equivalent Employees 126.26 126.26 124.26 125.76 1.50
Sources of Funds
Taxes 9,980,346$ 9,763,478$ 10,307,109$ 10,158,122$ 10,499,499$ 192,390$ 1.87%
Intergovernmental Aid 69,129 58,739 - - - - 0.00%
Fines & Penalties 190,728 191,297 150,000 175,000 175,000 25,000 16.67%
Fees, Licenses, Permits 98,797 178,902 95,000 90,000 175,000 80,000 84.21%
Charges for Services 261,127 388,894 240,000 300,000 240,000 - 0.00%
Interest and Other 22,628 22,158 4,150 49,000 4,150 - 0.00%
Special Revenue Funds - - 50,000 50,000 50,000 - 0.00%
General Fund Surplus - - 154,878 154,878 35,000 (119,878) -77.40%
Total Sources 10,622,755$ 10,603,468$ 11,001,137$ 10,977,000$ 11,178,649$ 177,512$ 1.61%
Summary of significant budget changes for police department The FY13 Police Department budget is increasing $177,512 or 1.6%. Personnel costs are increasing $445,190. This covers all contractual pay increases as well as an increase of 1.5 full-time equivalents. One sworn police officer position is being restored from an FY11 early retirement that was not filled in FY12 and the current part-time Domestic Violence Specialist position is being increased to full-time. Also included in the increase is $35,000 of additional overtime for the Street Crimes Unit operations. Operating expenses are increased to cover the rising cost of gasoline ($10,000) and $7,200 is provided in additional funding for uniforms as 5 new officers were hired under a Federal Grant program which does not cover the annual uniform allowance. These cost increases are offset by a reduction in operating capital of $284,878. The Police Department was provided advanced funding in FY12 for their FY13 vehicle replacements eliminating the need to budget for operating capital in FY13. A majority of this operation is funded through taxes and tax support will increase $192,390 in FY13. Estimated revenue from fines, licenses, fees and permits are also increasing by $105,000. General fund surplus used to fund the operation will decline by $119,878.
Police department appropriation order 2012-112 That the sum of $11,178,649 be appropriated for the purpose of funding the Town's FY 2013 Barnstable Police Department budget; and to meet such appropriation that $11,093,649 be raised from current year revenues and that $50,000 be transferred from the Embarkation Fee Special Revenue Fund, and that $35,000 be transferred from the general fund savings account as presented to the Town Council by the Town Manager.
21
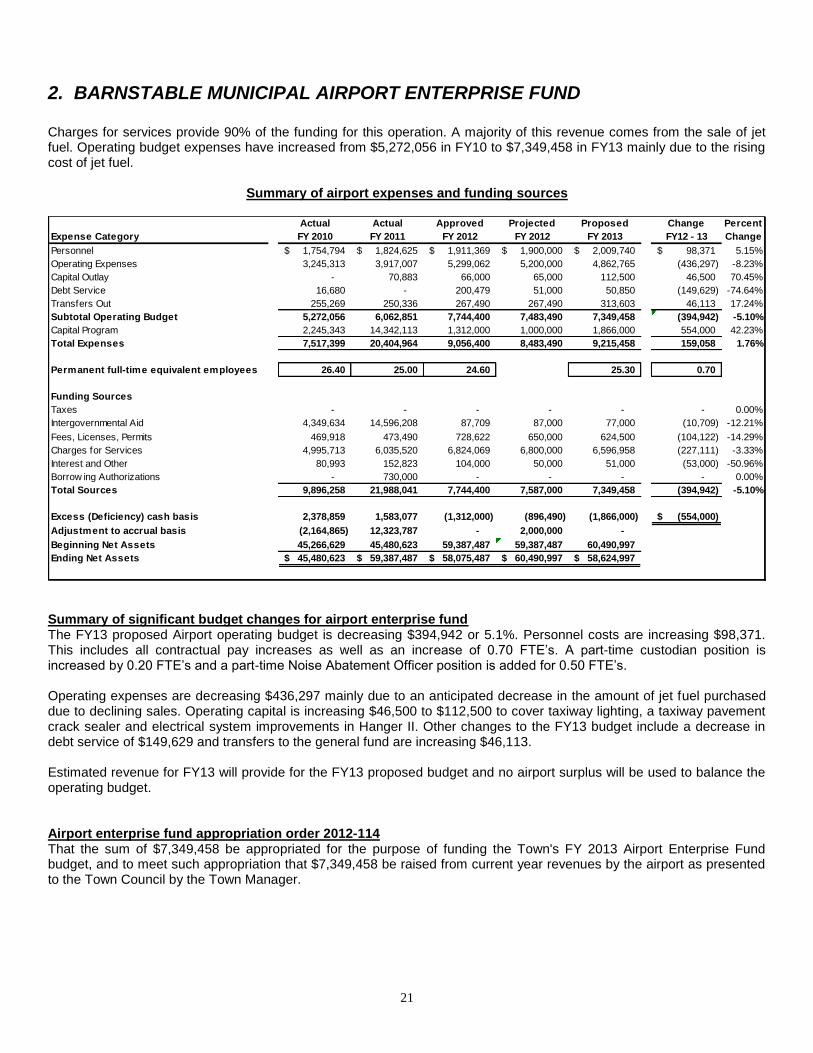
2. BARNSTABLE MUNICIPAL AIRPORT ENTERPRISE FUND Charges for services provide 90% of the funding for this operation. A majority of this revenue comes from the sale of jet fuel. Operating budget expenses have increased from $5,272,056 in FY10 to $7,349,458 in FY13 mainly due to the rising cost of jet fuel.
Summary of airport expenses and funding sources
Actual Actual Approved Projected Proposed Change Percent
Expense Category FY 2010 FY 2011 FY 2012 FY 2012 FY 2013 FY12 - 13 Change
Personnel 1,754,794$ 1,824,625$ 1,911,369$ 1,900,000$ 2,009,740$ 98,371$ 5.15%
Operating Expenses 3,245,313 3,917,007 5,299,062 5,200,000 4,862,765 (436,297) -8.23%
Capital Outlay - 70,883 66,000 65,000 112,500 46,500 70.45%
Debt Service 16,680 - 200,479 51,000 50,850 (149,629) -74.64%
Transfers Out 255,269 250,336 267,490 267,490 313,603 46,113 17.24%
Subtotal Operating Budget 5,272,056 6,062,851 7,744,400 7,483,490 7,349,458 (394,942) -5.10%
Capital Program 2,245,343 14,342,113 1,312,000 1,000,000 1,866,000 554,000 42.23%
Total Expenses 7,517,399 20,404,964 9,056,400 8,483,490 9,215,458 159,058 1.76%
Permanent full-time equivalent employees 26.40 25.00 24.60 25.30 0.70
Funding Sources
Taxes - - - - - - 0.00%
Intergovernmental Aid 4,349,634 14,596,208 87,709 87,000 77,000 (10,709) -12.21%
Fees, Licenses, Permits 469,918 473,490 728,622 650,000 624,500 (104,122) -14.29%
Charges for Services 4,995,713 6,035,520 6,824,069 6,800,000 6,596,958 (227,111) -3.33%
Interest and Other 80,993 152,823 104,000 50,000 51,000 (53,000) -50.96%
Borrow ing Authorizations - 730,000 - - - - 0.00%
Total Sources 9,896,258 21,988,041 7,744,400 7,587,000 7,349,458 (394,942) -5.10%
Excess (Deficiency) cash basis 2,378,859 1,583,077 (1,312,000) (896,490) (1,866,000) (554,000)$
Adjustment to accrual basis (2,164,865) 12,323,787 - 2,000,000 -
Beginning Net Assets 45,266,629 45,480,623 59,387,487 59,387,487 60,490,997
Ending Net Assets 45,480,623$ 59,387,487$ 58,075,487$ 60,490,997$ 58,624,997$
Summary of significant budget changes for airport enterprise fund The FY13 proposed Airport operating budget is decreasing $394,942 or 5.1%. Personnel costs are increasing $98,371. This includes all contractual pay increases as well as an increase of 0.70 FTE’s. A part-time custodian position is increased by 0.20 FTE’s and a part-time Noise Abatement Officer position is added for 0.50 FTE’s. Operating expenses are decreasing $436,297 mainly due to an anticipated decrease in the amount of jet fuel purchased due to declining sales. Operating capital is increasing $46,500 to $112,500 to cover taxiway lighting, a taxiway pavement crack sealer and electrical system improvements in Hanger II. Other changes to the FY13 budget include a decrease in debt service of $149,629 and transfers to the general fund are increasing $46,113. Estimated revenue for FY13 will provide for the FY13 proposed budget and no airport surplus will be used to balance the operating budget.
Airport enterprise fund appropriation order 2012-114 That the sum of $7,349,458 be appropriated for the purpose of funding the Town's FY 2013 Airport Enterprise Fund budget, and to meet such appropriation that $7,349,458 be raised from current year revenues by the airport as presented to the Town Council by the Town Manager.

22
3. EDUCATION The School department’s operating budget is 43% of the FY13 total general fund budget. Approximately 13% of the School Department’s operating budget is provided from state aid and other resources. The remaining 87% is provided from taxes. Sixty-five percent of the School Department’s operating budget is comprised of personnel costs of which eighty-one percent goes towards instructional services. Health insurance for active and retired employees as well as the retirement expense for non-teaching school employees is included under the “Other Requirements” section of the budget. The Commonwealth of Massachusetts pays the retirement expense for teachers. FY13 is the fourth year in a row in which the School Department has not required the use of the district’s savings account to cover reoccurring operating costs. Total expenditures have increased from $52.3 million in FY10 to $55.9 million in FY13 or 7% over the 4 year period.
Summary of school department expenditures and funding resources local district operations
Actual Actual Approved Projected Proposed Change Percent
Expenditure Category FY 2010 FY 2011 FY 2012 FY 2012 FY 2013 FY12 - FY13 Change
Personnel 33,011,408$ 34,088,862$ 35,219,056$ 35,173,824$ 36,271,997$ 1,052,941$ 2.99%
Operating Expenses 11,323,723 10,755,599 10,968,417 10,950,000 11,131,386 162,969 1.49%
Horace Mann Charter Schools 7,958,579 8,222,890 8,349,943 8,349,943 8,497,452 147,509 1.77%
Total Expenditures 52,293,710$ 53,067,351$ 54,537,416$ 54,473,767$ 55,900,835$ 1,363,419$ 2.50%
Permanent full-time equivalent employees 811.58 812.58 813.03 815.53 2.50
Sources of Funds
Taxes 44,207,612$ 45,407,038$ 47,052,688$ 46,989,039$ 48,416,107$ 1,363,419$ 2.90%
Intergovernmental Aid 7,589,756 7,146,363 7,184,728 7,184,728 7,184,728 - 0.00%
Interest and Other 496,342 513,950 300,000 300,000 300,000 - 0.00%
Total Sources 52,293,710$ 53,067,351$ 54,537,416$ 54,473,767$ 55,900,835$ 1,363,419$ 2.50%
Summary of significant budget changes for the school department The FY13 appropriation request for the Barnstable Public School Department is $55,900,835 or $1,363,419 more than the FY12 budget. FY13 represents the first year of budgeting employee health insurance under a central cost center and the FY12 budget, as well as the FY10 and FY11 actuals, has been restated to reflect this change. The proposed budget maintains all staff, programs, services and replaces retiring staff. In addition, the district has absorbed approximately twelve full-time equivalent positions that were funded during FY12 from the Education Jobs Fund Program (Ed Jobs). Ed Jobs was a one-time appropriation from the U.S. Department of Elementary and Secondary Education to States to save or create education jobs for the 2010-2011, 2011-2012 school years. Jobs funded under this program include those that provide educational and related services for early childhood, elementary, and secondary education. The Ed Jobs fund provided a useful tool in preserving core educational services until local and state aid stabilized. The School Department request submitted to the Town Council for approval is $55,900,835. While this figure represents the anticipated revenue allocation received from the town, it does not represent the full amount of funds required to fund the budget. In order to fund the full school department budget request of $57,915,364 the School Committee has authorized using funds from transportation fees, athletic fees, and reimbursements from the State for extraordinary special education costs (Circuit Breaker funds) and School Choice. The use of these reoccurring funds provide stability to on-going district programs while the multi-year budget development initiative implemented by the School Committee insures the district is living within its means.
School department appropriation order 2012-113 That the sum of $55,900,835 be raised and appropriated for the purpose of funding the Town's FY 2013 Barnstable Public Schools budget as presented to the Town Council by the Town Manager.

23
4. DEPARTMENT OF PUBLIC WORKS GENERAL FUND BUDGET The Public Works Department represents 6% of the total general fund budget. 97% of the funding for this department is provided from taxes. $56,000 of special revenue funds provides 1% of the total operating budget. These funds come from the Bismore Park parking receipts and embarkation fees. The Highway Division is the largest division in this department consuming 43% of the total budget. The proposed budget for FY13 is approximately $60,000 more than the actual expenditures in FY10. The FY11 expenditures included nearly $1 million more in snow and ice removal costs that did not occur in the FY12 budget year which accounts for the significant decrease in spending.
Summary of Public Works Department expenditures and funding sources
(General Fund)
Actual Actual Approved Projected Proposed Change Percent
Expenditure Category FY 2010 FY 2011 FY 2012 FY 2012 FY 2013 FY12 - 13 Change
Personnel 4,476,356$ 4,739,432$ 4,942,731$ 4,689,000$ 4,844,402$ (98,329)$ -1.99%
Operating Expenses 2,710,359 3,180,927 2,459,550 2,389,000 2,518,550 59,000 2.40%
Capital Outlay 616,455 328,421 476,000 475,000 501,000 25,000 5.25%
Total Expenditures 7,803,170$ 8,248,780$ 7,878,281$ 7,553,000$ 7,863,952$ (14,329)$ -0.18%
Permanent full-time equivalent employees 90.30 85.30 84.80 82.55 (2.25)
Sources of Funds
Taxes 7,199,716$ 7,621,435$ 7,340,960$ 7,005,659$ 7,652,945$ 311,985$ 4.25%
Fees, Licenses, Permits 182,132 179,927 155,000 165,000 155,000 - 0.00%
Interest and Other 3,581 2,191 - 20 - - 0.00%
Special Revenue Funds 68,680 110,131 56,007 56,007 56,007 - 0.00%
Enterprise Funds 349,061 335,096 326,314 326,314 - (326,314) -100.00%
Total Sources 7,803,170$ 8,248,780$ 7,878,281$ 7,553,000$ 7,863,952$ (14,329)$ -0.18%
Summary of significant budget changes for public works general fund operations The FY13 general fund operating budget for the Public Works Department is decreasing $14,329. Personnel costs are decreasing $98,329 as a total of $258,916 representing 3.05 FTE’s are budgeted under the enterprise funds for FY13. In addition, 0.48 FTE’s are added for a part-time Energy Coordinator position. It is anticipated that this position will eventually be funded from the solar array project to be installed at the Marstons Mills Transfer Station which should be operating by the end of FY13. Other additions include .20 FTE’s a position in Structure’s & Grounds (S&G) that was partially funded in the enterprise funds in FY12 and .10 FTE for an administrative assistant in S&G. These personnel changes net to a decrease of 2.27 FTE are for FY13 in the general fund portion of the budget. Operating expenses are increasing $59,000 to cover fuel and utility increases ($40,000) and $19,000 is provided for road striping costs. Operating capital is increasing $25,000 to provide funds for necessary improvements on various town-owned properties that are leased. Tax support for this operation is increasing $311,985 and enterprise fund charges are decreasing $326,314. The budget change of placing 3.05 FTE’s under the enterprise funds eliminates the chargeback made to the enterprise funds for portions of these individuals as performed in previous years. Public works department general fund appropriation order 2012-115 That the sum of $7,863,952 be appropriated for the purpose of funding the Town's FY 2013 Department of Public Works General Fund budget, and to meet such appropriation, that $7,807,945 be raised from current year revenue, $36,695 be transferred from the Embarkation Fee Special Revenue Fund and $19,312 be transferred from the Bismore Park Special Revenue Fund, as presented to the Town Council by the Town Manager.

24
5. DEPARTMENT OF PUBLIC WORKS SOLID WASTE ENTERPRISE FUND Solid waste expenses have increased from $2,433,771 in FY10 to $2,656,754 in FY13 or 9.2% over this four year period. Much of the cost increase is attributable to a higher level of service since the operation went to 7 days a week. 16% of the FY13 proposed operating budget is financed with surplus. Surplus was accumulated prior to the capping of the landfill in order to pay for loan issued to finance the capping. The FY13 loan payment is $315,540. About $120,000 of surplus is used as fee mitigation for FY13.
Summary of Solid Waste Division expenditures and funding sources
Actual Actual Approved Projected Proposed Change Percent
Expense Category FY 2010 FY 2011 FY 2012 FY 2012 FY 2013 FY12 - 13 Change
Personnel 906,220$ 891,966$ 1,022,713$ 1,003,761$ 1,090,475$ 67,762$ 6.63%
Operating Expenses 673,830 692,539 844,886 805,000 854,886 10,000 1.18%
Capital Outlay 98,892 1,944 - - 35,600 35,600 0.00%
Debt Service 411,664 415,465 403,713 403,713 405,598 1,885 0.47%
Transfers Out 343,165 345,199 344,094 344,094 270,195 (73,899) -21.48%
Total Expenses 2,433,771 2,347,113 2,615,406 2,556,568 2,656,754 41,348 1.58%
Permanent full-time equivalent employees 15.10 15.10 15.10 15.75 0.65
Sources of Funds
Charges for Services 2,061,516 2,086,778 1,950,000 2,099,000 2,138,500 188,500 9.67%
Interest and Other 50,822 118,946 116,000 81,500 82,000 (34,000) -29.31%
Total Sources 2,112,338 2,205,724 2,066,000 2,180,500 2,220,500 154,500 7.48%
Excess (Deficiency) cash basis (321,433) (141,389) (549,406) (376,068) (436,254) 113,152$ -20.60%
Adjustment to accrual basis 261,633 809,212 - 250,000
Beginning Net Assets 4,323,303 4,263,503 4,931,326 4,931,326 4,805,258
Ending Net Assets 4,263,503$ 4,931,326$ 4,381,920$ 4,805,258$ 4,369,004$
Summary of significant budget changes for solid waste operations The FY13 Solid Waste Enterprise Fund operating budget is increasing $41,348 or 1.6%. Personnel costs are increasing $67,762 and include an increase in 0.65 FTE’s as portions of positions previously funded in the general fund are partially budgeted here in FY13. Operating expenses are increasing $10,000 to cover diesel fuel increases and $35,600 in operating capital is provided for equipment and vehicle replacements. Offsetting these increases is a reduction of $73,899 in transfers to the general fund as this charge no longer includes the positions which are included in the personnel category. Estimated revenues are increasing $154,000 due to an increase in usage and an anticipated increase of $5 in the landfill sticker fee. This results in $436,254 of fund surplus being used to balance the budget. The surplus covers the cost of the landfill capping loan ($315,540) with the balance of $120,714 covering the cost of operations.
Solid Waste enterprise fund appropriation order 2012-116 That the sum of $2,656,754 be appropriated for the purpose of funding the Town's FY 2013 Department of Public Works Solid Waste Enterprise Fund budget, and to meet such appropriation that $2,220,500 be raised from current year revenues by the solid waste facility, and that $436,254 be transferred from the solid waste enterprise fund surplus, as presented to the Town Council by the Town Manager.

25
6. DEPARTMENT OF PUBLIC WORKS WATER POLLUTION ENTERPRISE FUND Operating expenses have increased from $4,480,559 in FY10 to $4,684,189 proposed in FY13 or 4.5% over the four year period. Utility charges provide 79% of the funding for the operating budget. $771,189 of fund surplus will be used to balance the operating budget and pay for the FY13 capital program of $77,000. Using surplus to balance the operating budget avoids a significant rate increase. There is no additional revenue included in the FY13 utility charge estimate from new customers.
Summary of Water Pollution Control expenses and funding sources
Actual Actual Approved Projected Proposed Change Percent
Expense Category FY 2010 FY 2011 FY 2012 FY 2012 FY 2013 FY12 - 13 Change
Personnel 897,916$ 958,916$ 1,038,453$ 1,010,000$ 1,123,130$ 84,677$ 8.15%
Operating Expenses 1,377,316 1,471,051 1,530,084 1,350,000 1,455,194 (74,890) -4.89%
Capital Outlay 51,982 41,171 90,000 90,000 90,000 - 0.00%
Debt Service 1,660,530 1,584,133 1,907,778 1,505,000 1,625,000 (282,778) -14.82%
Transfers Out 492,815 493,800 506,131 506,131 390,865 (115,266) -22.77%
Subtotal Operating Budget 4,480,559 4,549,071 5,072,446 4,461,131 4,684,189 (388,257) -7.65%
Capital Program 1,664,566 3,971,043 350,000 3,100,000 77,000 (273,000) -78.00%
Total Expenses 6,145,125 8,520,114 5,422,446 7,561,131 4,761,189 (661,257) -12.19%
Permanent full-time equivalent employees 14.10 14.10 14.10 15.15 1.05
Sources of Funds
Intergovernmental Aid 1,029,836 8,153,034 - 500,000 - - 0.00%
Fines & Penalties 89,067 95,537 100,000 95,000 80,000 (20,000) -20.00%
Fees, Licenses, Permits 14,385 18,685 15,000 20,000 15,000 - 0.00%
Charges for Services 3,495,801 3,617,705 3,675,000 3,650,000 3,695,000 20,000 0.54%
Interest and Other 271,033 261,324 275,000 225,000 200,000 (75,000) -27.27%
Borrow ing Authorizations - 300,000 300,000 - - (300,000) -100.00%
Total Sources 4,900,122 12,446,285 4,365,000 4,490,000 3,990,000 (375,000) -8.59%
Excess (Deficiency) cash basis (1,245,003) 3,926,171 (1,057,446) (3,071,131) (771,189) 286,257$ -27.07%
Adjustment to accrual basis 883,862 (4,454,200) - 2,000,000
Beginning Net Assets 24,322,085 23,960,944 23,432,915 23,432,915 22,361,784
Ending Net Assets 23,960,944$ 23,432,915$ 22,375,469$ 22,361,784$ 21,590,595$
Summary of significant budget changes for water pollution control operations The FY13 operating budget is decreasing $388,257 or 7.7%. Personnel costs are increasing $84,677. This covers contractual pay increases as well as an increase of 1.05 FTE’s as a portion of some positions previously funded in the general fund are partially budgeted here in FY13. Operating expenses are declining $74,890 principally due to decline in utility costs. Debt service is declining $282,778 and transfers to the general fund are declining $115,266 due to portions of general fund positions previously budgeted in the general fund being included in the personnel costs line of this budget in FY13. The FY13 proposed budget of $4,684,189 is funded from estimated revenues of $3,990,000 for FY13 and $694,189 of sewer fund surplus. The amount of surplus used to balance the operating budget is $313,257 less than the amount used to balance the FY12 budget.
Water pollution control enterprise fund appropriation order 2012-117 That the sum of $4,684,189 be appropriated for the purpose of funding the Town's FY 2013 Department of Public Works Water Pollution Control Enterprise Fund budget, and to meet such appropriation that $3,990,000 be raised from current year revenues by the water pollution control facility, and that $694,189 be transferred from the water pollution control enterprise fund surplus, as presented to the Town Council by the Town Manager.

26
7. DEPARTMENT OF PUBLIC WORKS WATER SUPPLY ENTERPRISE FUND Water fund expenses have increased from $2,462,832 in FY10 to $3,454,571 in FY13 or 40%. Increases in debt service and operating expenses associated with the repair and maintenance of a very old system have been the driving factors in the cost increases.
Summary of Water Supply Division expenses and funding sources
Actual Actual Approved Projected Proposed Change Percent
Expense Category FY 2010 FY 2011 FY 2012 FY 2012 FY 2013 FY12 - 13 Change
Personnel 88,693$ 128,800$ 144,361$ 144,000$ 249,181$ 104,820$ 72.61%
Operating Expenses 1,374,200 1,696,321 1,634,868 1,630,000 1,970,457 335,589 20.53%
Capital Outlay 120,052 198,597 160,000 160,000 160,000 - 0.00%
Debt Service 751,446 752,046 1,097,639 922,000 982,000 (115,639) -10.54%
Transfers Out 128,441 129,399 166,416 166,416 92,933 (73,483) -44.16%
Subtotal Operating Budget 2,462,832 2,905,163 3,203,284 3,022,416 3,454,571 251,287 7.84%
Capital Program 1,100,839 463,612 1,220,000 1,200,000 2,418,102 1,198,102 98.21%
Total Expenses 3,563,671 3,368,775 4,423,284 4,222,416 5,872,673 1,449,389 32.77%
Permanent full-time equivalent employees 1.00 1.00 1.50 2.90 1.40
Sources of Funds
Intergovernmental Aid 705,226 - 0.00%
Fines & Penalties 49,643 95,914 75,000 55,000 55,000 (20,000) -26.67%
Fees, Licenses, Permits 42,207 65,722 37,000 80,000 67,500 30,500 82.43%
Charges for Services 2,983,250 3,257,562 2,945,284 3,050,000 3,142,100 196,816 6.68%
Interest and Other 631,119 186,153 146,000 190,000 189,971 43,971 30.12%
Trust Funds - 2,695,000 - - - - 0.00%
Borrow ing Authorizations - - 1,050,000 1,050,000 2,120,000 1,070,000 101.90%
Total Sources 3,706,219 7,005,577 4,253,284 4,425,000 5,574,571 1,321,287 31.07%
Excess (Deficiency) cash basis 142,548 3,636,802 (170,000) 202,584 (298,102) (128,102)$ 0.00%
Adjustment to accrual basis 938,241 842,387 - - -
Beginning Net Assets 4,580,067 5,660,856 10,140,045 10,140,045 10,342,629
Ending Net Assets 5,660,856$ 10,140,045$ 9,970,045$ 10,342,629$ 10,044,527$
Summary of significant budget changes for water supply operations The Water Fund operating budget for FY13 is increasing $251,287 or 7.8%. Personnel costs are increasing $104,820 and include an increase in 1.4 FTE’s as portions of positions previously funded in the general fund are partially budgeted here in FY13. In addition, the Administrative Assistant position has been increased by .25 FTE’s. Operating expenses are increasing $335,589 to cover the cost of the management company’s contract increase which includes managing two new water storage tanks and two new pump stations. Offsetting these cost increases is a decrease in debt service of $115,639 and a decrease in transfers to the general fund of $73,483. Estimated operating revenue for the water enterprise fund for FY13 is sufficient to cover the operating budget and no surplus is being used. $298,102 of surplus will be used to fund the FY13 capital budget. Water supply enterprise fund appropriation order 2012-118 That the sum of $3,454,571 be appropriated for the purpose of funding the Town's FY 2013 Department of Public Works Water Supply Enterprise Fund budget, and to meet such appropriation that $3,454,571 be raised from current year revenues by the water supply operations, as presented to the Town Council by the Town Manager.

27
8. REGULATORY SERVICES DEPARTMENT Regulatory Services Department represents 1.9% of the total general fund budget. 75% of the operation’s costs are recovered through fees and 25% is paid for through taxation. The amount provided from special revenue funds (3%) comes from the Bismore Park parking receipts account to help offset the parking enforcement costs included in this general fund operation. The Building Division and Health Division are the two largest operations in this department representing 34% and 31% of the total budget, respectfully. Total expenditures have increased from $2,069,638 in FY10 to $2,515,247 in FY13 or 43%.
Summary of Regulatory Services Department expenditures and funding resources
Actual Actual Approved Projected Proposed Change Percent
Expenditure Category FY 2010 FY 2011 FY 2012 FY 2012 FY 2013 FY12 - 13 Change
Personnel 1,831,630$ 1,826,867$ 2,003,017$ 1,972,000$ 2,204,277$ 201,260$ 10.05%
Operating Expenses 238,008 220,097 282,820 273,000 310,970 28,150 9.95%
Capital Outlay - - - - - - 0.00%
Total Expenditures 2,069,638$ 2,046,964$ 2,285,837$ 2,245,000$ 2,515,247$ 229,410$ 10.04%
Permanent full-time equivalent employees 33.15 31.25 32.15 33.35 1.20
Sources of Funds
Taxes 189,181$ 36,815$ 535,651$ 334,594$ 629,341$ 93,690$ 17.49%
Fines & Penalties 100,919 111,401 80,000 120,000 120,000 40,000 50.00%
Fees, Licenses, Permits 1,712,256 1,811,701 1,578,600 1,698,000 1,672,600 94,000 5.95%
Charges for Services 1,647 1,606 - 1,600 - - 0.00%
Interest and Other 2,135 4,135 4,000 2,500 4,000 - 0.00%
Special Revenue Funds 60,000 77,806 84,086 84,806 85,806 1,720 2.05%
Enterprise Fund Reimbursements 3,500 3,500 3,500 3,500 3,500 - 0.00%
Total Sources 2,069,638$ 2,046,964$ 2,285,837$ 2,245,000$ 2,515,247$ 229,410$ 10.04%
Summary of significant budget changes for regulatory services department The FY13 Regulatory Services Department budget is increasing $229,410 or 10%. $201,260 of this increase is in personnel costs. This covers all contractual pay increase as well as an increase of 1.20 FTE’s. The increase in FTE’s includes the funding for a part-time (0.50) Hazardous Material Inspector that was previously paid for with mitigation funds received from the Cape Cod Commission that have expired. The continuation of this position will protect our vital water resources. The other 0.70 FTE increase results from transferring a portion of the Consumer Affairs Division Supervisor’s position to the general fund from the Weights & Measures revolving fund. This reflects where the position will be focusing its attention in FY13. Operating expenses are increasing $28,150 as additional funds are provided for a new parking ticket processing vendor that will increase our collection rate. This also includes $15,000 for flu vaccine as it is expected that the state will no longer provide this for free. An estimated increase in revenue from this operation in FY13 will cover $135,720 of the budget increase and tax support will increase $93,690 to $629,341. Regulatory Services Department appropriation order 2012-119 That the sum of $2,515,247 be appropriated for the purpose of funding the Town's FY 2013 Regulatory Services Department budget, and to meet such appropriation, that $2,429,441 be raised from current year revenue, $42,000 be transferred from the Wetlands Protection Special Revenue Fund and $43,806 be transferred from the Bismore Park Special Revenue Fund, as presented to the Town Council by the Town Manager.

28
9. COMMUNITY SERVICES DEPARTMENT GENERAL FUND BUDGET The Community Services Department represents 1.9% of the overall general fund operating budget. 39% of the budget is funded through taxes with 61% coming from various fees that are charged by the operations. 8% of the operation’s funding is provided from the special revenue Waterways Improvement Fund which is where all mooring fees collected are credited. The Recreation, Leisure & Aquatics Division is the largest area of the Community Services Department general fund operations. Total expenditures for this department have increased from $2,319,000 in FY10 to $2,530,000 in FY13 or 9% over the 4 year period.
Summary of Community Services Department expenditures and funding sources (General Fund)
Actual Actual Budget Projected Proposed Change Percent
Expenditure Category FY 2010 FY 2011 FY 2012 FY 2012 FY 2013 FY12-13 Change
Salaries and Wages 2,030,045$ 2,058,902$ 2,114,900$ 2,086,350$ 2,129,824$ 14,924$ 0.71%
Operating Expenses 263,298 300,060 338,440 331,700 341,365 2,925 0.86%
Operating Capital 25,850 3,933 25,000 25,000 58,800 33,800 135.20%
Total Expenditures 2,319,193$ 2,362,895$ 2,478,340$ 2,443,050$ 2,529,989$ 51,649$ 2.08%
Permanent full-time equivalent employees 25.76 24.61 24.20 23.70 (0.50)
Sources of Funds
Taxes 772,772$ 659,202$ 1,035,102$ 913,912$ 975,908$ (59,194)$ -5.72%
Fees, Licenses, Permits 76,696 85,152 76,100 71,000 76,100 - 0.00%
Charges for Services 1,264,083 1,416,268 1,159,000 1,250,000 1,259,000 100,000 8.63%
Interest and Other 5,910 4,135 5,000 5,000 5,000 - 0.00%
Special Revenue Funds 190,000 198,138 203,138 203,138 213,981 10,843 5.34%
Enterprise Fund Reimbursements 9,732 - - - - - 0.00%
Total Sources 2,319,193$ 2,362,895$ 2,478,340$ 2,443,050$ 2,529,989$ 51,649$ 2.08%
Summary of significant budget changes for Community Services Department general fund operations The Community Services Department general fund budget is increasing $51,649 in FY13, or 2.1%. Personnel costs are increasing $14,924 and there is a reduction of one-half of a full-time equivalent position. The Recreation Director’s position was eliminated and pieces of administrative positions are transferred from the HYCC enterprise fund to more accurately reflect where the employees have been allocating their time. This results in a reduction of 0.5 full-time equivalents. Operating expenses are increasing $2,925 and operating capital is increasing $33,800 to $58,500. This will be used for the replacement of one vehicle, new boards for lifeguards and picnic area improvements at the Veteran’s Beach space. Tax support is decreasing $59,194 for this operation as the estimate on charges for services is increasing due to increased usage as well as funding from special revenue funds. Community Services Department general fund operations appropriation order 2012-120 That the sum of $2,529,989 be appropriated for the purpose of funding the Town's FY 2013 Community Services Department budget, and to meet such appropriation, that $2,316,008 be raised from current year revenue, and that $213,981 be transferred from the Mooring Fee Special Revenue Fund as presented to the Town Council by the Town Manager.

29
10. DEPARTMENT OF COMMUNITY SERVICES GOLF COURSE ENTERPRISE FUND
Summary of Golf Course Enterprise Fund expenses and funding sources
Actual Actual Budget Projected Proposed Change Percent
Expenditure Category FY 2010 FY 2011 FY 2012 FY 2012 FY 2013 FY12-13 Change
Personnel 1,157,657$ 1,139,687$ 1,283,580$ 1,175,000$ 1,208,614$ (74,966)$ -5.84%
Operating Expenses 867,256 920,550 1,025,692 920,000 1,006,975 (18,717) -1.82%
Operating Capital 28,000 105,309 110,000 51,100 22,000 (88,000) -80.00%
Debt Service 599,967 380,411 381,611 381,611 382,411 800 0.21%
Transfers Out 225,000 225,000 300,000 300,000 250,000 (50,000) -16.67%
Total Expenditures 2,877,880 2,770,957 3,100,883 2,827,711 2,870,000 (230,883) -7.45%
Permanent full-time equivalent employees 18.35 15.85 15.85 15.75 (0.10)
Sources of Funds
Charges for Services 2,890,681 2,812,616 3,098,883 2,840,000 2,864,000 (234,883) -7.58%
Interest and Other 2,618 6,774 2,000 6,000 6,000 4,000 200.00%
Total Sources 2,893,299 2,819,390 3,100,883 2,846,000 2,870,000 (230,883) -7.45%
Excess (Deficiency) cash basis 15,419 48,433 - 18,289 - -$
Adjustment to accrual basis 220,000 158,498 - 100,000 -
Beginning Net Assets 10,182,701 10,418,120 10,625,051 10,625,051 10,743,340
Ending Net Assets 10,418,120$ 10,625,051$ 10,625,051$ 10,743,340$ 10,743,340$
Summary of significant budget changes for Golf Course Enterprise Fund The golf course operations are decreasing $230,883 for FY13 or 7.5%. A decrease in play which correlates into declining revenue of this amount results in the budget reduction. Reductions have been made to full-time equivalents (0.1), seasonal wages and overtime resulting in a personnel cost decrease for FY13 of $74,966. Operating expenses have been reduced by $18,717, operating capital by $88,000 and the transfer to the general fund is reduced $50,000. No reserves will be used in FY13 to balance the operating budget as current year estimated receipts are sufficient to cover the proposed operating budget. Golf Course Enterprise Fund appropriation order 2012-121 That the sum of $2,870,000 be appropriated for the purpose of funding the Town's FY 2013 Golf Course Enterprise Fund budget; and to meet such appropriation that $2,870,000 be raised from current year revenues by the golf course facilities as presented to the Town Council by the Town Manager.

30
11. DEPARTMENT OF COMMUNITY SERVICES HYCC ENTERPRISE FUND
. Summary of Hyannis Youth and Community Center expenditures and funding sources
Actual Actual Budget Projected Proposed Change Percent
Expense Category FY 2010 FY 2011 FY 2012 FY 2012 FY 2013 FY12-13 Change
Personnel 614,175$ 489,565$ 751,789$ 564,000$ 721,912$ (29,877)$ -3.97%
Operating Expenses 654,363 569,567 687,286 589,000 618,744 (68,542) -9.97%
Debt Service 1,526,030 1,491,270 1,458,629 1,408,629 1,425,988 (32,641) -2.24%
Total Expenses 2,794,568 2,550,402 2,897,704 2,561,629 2,766,644 (131,060) -4.52%
Permanent full-time equivalent employees 8.27 9.50 8.90 9.50 0.60
Source of Funding
Taxes - - 30,000 30,000 60,000 30,000 100.00%
Intergovernmental Aid 200,436 - - - - - 0.00%
Fees, Licenses, Permits 376,560 395,525 594,400 356,000 379,568 (214,832) -36.14%
Charges for Services 668,528 758,119 862,275 685,000 650,081 (212,194) -24.61%
Interest and Other 163,570 174,664 202,500 285,281 179,360 (23,140) -11.43%
Trust Funds 1,526,030 1,241,270 1,208,529 1,208,529 1,425,988 217,459 17.99%
Total Sources 2,935,124 2,569,578 2,897,704 2,564,810 2,694,997 (202,707) -7.00%
Excess (Deficiency) cash basis 140,556 19,176 - 3,181 (71,647) (71,647)$
Adjustment to accrual basis 9,125,742 287,416 - 250,000 -
Beginning Net Assets - 9,266,298 9,572,890 9,572,890 9,826,071
Ending Net Assets 9,266,298$ 9,572,890$ 9,572,890$ 9,826,071$ 9,754,424$
Summary of significant budget changes for HYCC Enterprise Fund The FY13 operating budget for the HYCC is decreasing $131,060 or 4.5%. Declining revenue estimates result in the lower proposed budget. To offset the decline in revenue personnel costs are budgeted $29,877 less in FY13 and operating expenses have been reduced by $68,542. Also contributing to the reduced budget is a decrease in the debt service of $32,641. The estimated revenue for FY13 includes an increase in the amount of meals and rooms tax of $30,000, a reduction of $450,166 in estimated user charges and an increase of $217,459 in the amount of the transfer from the Capital Trust Fund to pay the construction loans. A total of $71,647 of enterprise fund reserves is being used to balance the operating budget. HYCC Enterprise Fund appropriation order 2012-122 That the sum of $2,766,644 be appropriated for the purpose of funding the Town's FY 2013 Hyannis Youth and Community Center Enterprise Fund budget; and to meet such appropriation that $1,209,009 be raised from current year revenues by the Hyannis Youth and Community Center operations, and that $60,000 be raised from the general fund, and that $1,425,988 be transferred from the Capital Trust Fund, and that $71,647 be transferred from the Hyannis Youth & Community Center enterprise fund surplus as presented to the Town Council by the Town Manager.

31
12. DEPARTMENT OF COMMUNITY SERVICES MARINA ENTERPRISE FUND
Summary of Marina Enterprise Fund expenditures and funding sources
Actual Actual Budget Projected Proposed Change Percent
Expense Category FY 2010 FY 2011 FY 2012 FY 2012 FY 2013 FY12-13 Change
Personnel 192,032$ 193,360$ 207,727$ 205,000$ 213,476$ 5,749$ 2.77%
Operating Expenses 87,115 89,097 110,150 107,000 139,457 29,307 26.61%
Operating Capital - 37,150 50,000 48,000 20,000 (30,000) -60.00%
Debt Service 161,933 157,933 229,933 172,000 188,393 (41,540) -18.07%
Transfers Out 43,857 47,413 54,702 54,702 55,674 972 1.78%
Subtotal Operating Budget 484,937 524,953 652,512 586,702 617,000 (35,512) -5.44%
Capital Program 48,503 2,464,671 110,000 340,000 80,000 (30,000) -27.27%
Total Expenses 533,440 2,989,624 762,512 926,702 697,000 (65,512) -8.59%
Permanent full-time equivalent employees 1.40 1.45 1.45 1.45 -
Sources of Funds
Intergovernmental Aid - 1,965,196 - 190,000 - - 0.00%
Fees, Licenses, Permits 505,014 577,743 563,000 570,000 563,500 500 0.09%
Charges for Services 11,516 8,847 10,500 12,000 7,500 (3,000) -28.57%
Interest and Other 44,378 70,891 33,000 40,000 22,000 (11,000) -33.33%
Special Revenue Funds - 24,000 24,000 24,000 24,000 - 0.00%
Borrow ing Authorizations - 525,000 - - - - 0.00%
Total Sources 560,908 3,171,677 630,500 836,000 617,000 (13,500) -2.14%
Excess (Deficiency) cash basis 27,468 182,053 (132,012) (90,702) (80,000) 52,012$
Adjustment to accrual basis (14,275) 1,851,441 - 300,000 -
Beginning Net Assets 2,176,541 2,189,734 4,223,228 4,223,228 4,432,526
Ending Net Assets 2,189,734$ 4,223,228$ 4,091,216$ 4,432,526$ 4,352,526$
Summary of significant budget changes for Marina Enterprise Fund The FY13 Marina Enterprise Fund operating budget is decreasing $35,512 or 5.4%. The reduction is a result of a decrease in debt service and operating capital. $20,000 has been provided in the FY13 budget to continue a dock replacement program. The operating expense increase of $29,307 includes $27,907 in depreciation. A capital program of $80,000 in FY13 for the permitting of a dredging project has already been approved by the Town Council. This will be funded from the enterprise fund’s reserves. No reserves will be used in FY13 to balance the operating budget as current year estimated receipts are sufficient to cover the proposed operating budget. Current year estimated receipts include $24,000 from the Bismore Park special revenue fund to offset the cost of monitoring and maintaining the Bismore Park area by this operation. Marina Enterprise Fund appropriation order 2012-123 That the sum of $617,000 be appropriated for the purpose of funding the Town's FY 2013 Marina Enterprise Fund budget; and to meet such appropriation that $593,000 be raised from current year revenues by the marina facilities and that $24,000 be transferred from the Bismore Park Special Revenue Fund as presented to the Town Council by the Town Manager.

32
13. DEPARTMENT OF COMMUNITY SERVICES SANDY NECK ENTERPRISE FUND
Summary of Sandy Neck operating expenses and funding sources
Actual Actual Budget Projected Proposed Change Percent
Expense Category FY 2010 FY 2011 FY 2012 FY 2012 FY 2013 FY12-13 Change
Personnel 351,614$ 358,548$ 367,324$ 365,000$ 401,948$ 34,624$ 9.43%
Operating Expenses 74,961 105,054 95,250 90,000 97,750 2,500 2.62%
Operating Capital 22,967 26,115 21,500 21,000 21,500 - 0.00%
Debt Service 22,000 - 106,200 111,700 94,500 (11,700) -11.02%
Transfers Out 45,426 57,052 68,418 68,418 68,744 326 0.48%
Subtotal Operating Budget 516,968 546,769 658,692 656,118 684,442 25,750 3.91%
Capital Program 38,074 1,348,146 - - - - 0.00%
Total Expenses 555,042 1,894,915 658,692 656,118 684,442 25,750 3.91%
Permanent full-time equivalent employees 2.75 2.70 2.70 2.75 0.05
Sources of Funds
Fees, Licenses, Permits 386,512 379,827 375,000 390,000 410,000 35,000 9.33%
Charges for Services 174,768 194,835 187,500 190,000 203,400 15,900 8.48%
Interest and Other 54,824 119,210 63,500 63,000 63,500 - 0.00%
Borrow ing Authorizations - 1,265,000 - - - - 0.00%
Total Sources 616,104 1,958,872 626,000 643,000 676,900 50,900 8.13%
Excess (Deficiency) cash basis 61,062 63,957 (32,692) (13,118) (7,542) 25,150$
Adjustment to accrual basis 38,724 56,900 - 60,000 -
Beginning Net Assets 461,424 561,210 682,067 682,067 728,949
Ending Net Assets 561,210$ 682,067$ 649,375$ 728,949$ 721,407$
Summary of significant budget changes for Sandy Neck Enterprise Fund The FY13 Sandy Neck Enterprise Fund operating budget is increasing $25,750 or 3.9%. Personnel costs are increasing $34,624 as additional funds are provided for new seasonal positions and an increase in pay for other seasonal positions. This is partially offset by a reduction of $11,700 in debt service. Estimated revenue for FY13 is increasing to $676,900. A small amount of enterprise fund reserves are used to balance the budget ($7,542). This is $25,150 less than the amount used to balance the FY12 budget. Sandy Neck Enterprise Fund appropriation order 2012-124 That the sum of $684,442 be appropriated for the purpose of funding the Town's FY 2013 Sandy Neck Park Enterprise Fund budget; and to meet such appropriation that $676,900 be raised from current year revenues by the Sandy Neck Park operations, and that $7,542 be transferred from the Sandy Neck enterprise fund surplus as presented to the Town Council by the Town Manager.

33
14. GROWTH MANAGEMENT DEPARTMENT The Growth Management Department represents 0.7% of the total general fund operating budget. Taxes provided 96% of this operation’s funding. Administration, which includes all department expenses, is the largest budget area for this operation at 30% of the budget. Comprehensive planning is the next largest program area at 21%. Total expenditures have increased from $827,164 in FY10 to $901,437 in FY13 or 9% over this four year period.
Summary of Growth Management Department expenditures and funding resources
Actual Actual Approved Projected Proposed Change Percent
Expenditure Category FY 2010 FY 2011 FY 2012 FY 2012 FY 2013 FY12 - 13 Change
Personnel 769,298$ 772,637$ 741,147$ 733,830$ 801,737$ 60,590$ 8.18%
Operating Expenses 57,866 88,211 99,700 99,000 99,700 - 0.00%
Capital Outlay - - - - - - 0.00%
Total Expenditures 827,164$ 860,848$ 840,847$ 832,830$ 901,437$ 60,590$ 7.21%
Full-time Equivalent Employees 13.15 12.35 11.50 12.00 0.50
Sources of Funds
Taxes 808,209$ 830,826$ 767,847$ 797,705$ 865,437$ 97,590$ 12.71%
Fees, Licenses, Permits 18,955 30,002 73,000 35,125 36,000 (37,000) -50.68%
Interest and Other - 20 - - - - 0.00%
Total Sources 827,164$ 860,848$ 840,847$ 832,830$ 901,437$ 60,590$ 7.21%
Summary of significant budget changes for the Growth Management Department The proposed FY13 budget for the Growth Management Department is $901,437. This is an increase of $60,590 over the FY 12 approved budget. The growth in personnel costs includes an increase of 0.50 full-time equivalents as a position that was formerly funded through the State’s Adams Grant Program is being added to this budget in order to continue the Town’s investment in its downtown Arts Programs. There are no changes to the department’s operating expenses. Tax support will increase $97,590 in FY13 in order to fund this department’s operations.
Growth Management Department appropriation order 2012-125 That the sum of $901,437 be raised and appropriated for the purpose of funding the Town's FY 2013 Growth Management Department budget as presented to the Town Council by the Town Manager.

34
15. TOWN COUNCIL DEPARTMENT The Town Council budget represents less than one quarter of one percent of the overall general fund budget. Seventy nine percent of the budget is funded with tax support. The other 21 percent is financed by enterprise funds. Total expenditures for the Town Council’s operation have decreased from $281,773 in FY10 to $276,543 in FY13. Projected expenditures for FY12 are $39,000 less than the FY12 budget as one of the staff positions in the office has been vacant for several months.
Summary of Town Council expenditures and funding sources
Actual Actual Approved Projected Proposed Change Percent
Expenditure Category FY 2010 FY 2011 FY 2012 FY 2012 FY 2013 FY12 - 13 Change
Personnel 247,624 240,524 247,777 211,000$ 247,843$ 66$ 0.03%
Operating Expenses 34,149 15,784 28,700 25,758 28,700 - 0.00%
Capital Outlay - - - - - - 0.00%
Total Expenditures 281,773$ 256,308$ 276,477$ 236,758$ 276,543$ 66$ 0.02%
Full-time Equivalent Employees 2.00 2.00 2.00 2.00 0.00
Sources of Funds
Taxes 239,023$ 213,444$ 226,015$ 186,296$ 219,341$ (6,674)$ -2.95%
Charges for Services - 29 - - - - 0.00%
Enterprise Funds 42,750 42,835 50,462 50,462 57,202 6,740 13.36%
Total Sources 281,773$ 256,308$ 276,477$ 236,758$ 276,543$ 66$ 0.02%
Summary of significant budget changes for Town Council operations The proposed budget for FY13 is $276,543 or $66 more than the FY12 approved budget. The budget includes funding for two full-time staff positions; the same as the FY12 budget. Operating expenses are level funded with the FY12 amount of $28,700. Funding for this operation is comprised of taxes and enterprise fund charges. Tax support is declining $6,674 as enterprise fund support is increasing $6,740. Town Council Department appropriation order 2012-126 That the sum of $276,543 be raised and appropriated for the purpose of funding the Town's FY 2013 Town Council budget as presented to the Town Council by the Town Manager.

35
16. TOWN MANAGER DEPARTMENT The Town Manager budget represents one-half on one percent of the overall General Fund budget. Eighty two percent of the budget is financed with taxes with the remaining 18 percent financed by enterprise funds, fees and permits issued by this operation. Total expenditures for the Town Manager’s operations have increased from $573,000 in FY10 to $653,000 in FY13; or 14%. The large increase in the FY12 approved budget and FY12 projected expenditures over the FY10 and FY11 actual expenditures include the additional funds necessary for the former Town Manager’s severance package. In addition, the FY13 proposed budget includes 9 months of salary for the former Town Manager. The FY14 budget should realize a significant decrease as the cost of the severance package will be completed in the FY13.
Summary of Town Manager expenditures and funding sources
Actual Actual Approved Projected Proposed Change Percent
Expenditure Category FY 2010 FY 2011 FY 2012 FY 2012 FY 2013 FY12 - 13 Change
Personnel 382,962 396,784 483,111$ 481,000$ 520,474$ 37,363$ 7.73%
Operating Expenses 190,217 114,250 132,332 131,600 132,332 - 0.00%
Capital Outlay - - - - - - 0.00%
Total Expenditures 573,179$ 511,034$ 615,443$ 612,600$ 652,806$ 37,363$ 6.07%
Full-time Equivalent Employees 4.50 4.50 4.50 4.50 0.00
Sources of Funds
Taxes 474,098$ 403,679$ 429,944$ 427,101$ 538,065$ 108,121$ 25.15%
Fees, Licenses, Permits 35,023 24,677 31,500 32,000 31,500 - 0.00%
Charges for Services - 5 - - - - 0.00%
Interest and Other 116 17,426 1,000 500 1,000 - 0.00%
Enterprise Funds 63,942 65,247 80,548 80,548 82,241 1,693 2.10%
General Fund Surplus - - 72,451 72,451 - (72,451) -100.00%
Total Sources 573,179$ 511,034$ 615,443$ 612,600$ 652,806$ 37,363$ 6.07%
Summary of significant budget changes for Town Manager operations The FY13 proposed budget is $37,363 more than the FY12 approved budget representing a 6% increase. This budget includes funding for 4.5 full-time employees as well as 9 months of salary for the former Town Manager. Operating expenses are level funded at $132,332. Funding sources are comprised of taxes, enterprise funds and permits. Tax support is increasing $108,121 for FY13. This covers the FY13 budget increase and replaces the general fund surplus used to balance the FY12 budget. Town Manager Department appropriation order 2012-127 That the sum of $652,806 be raised and appropriated for the purpose of funding the Town's FY 2013 Town Manager budget as presented to the Town Council by the Town Manager.

36
17. ADMINISTRATIVE SERVICES DEPARTMENT The Administrative Services Department represents four percent of the overall general fund budget. Taxes provide 44% of the funding for this operation followed by 18% from fines and penalties, 155 from intergovernmental aid, 12% from enterprise funds and the remaining 11% from fees and interest on investments. The Finance Division is the largest operation in this department representing 52% of the total budget. This includes the two elective offices of the Town Clerk and Town Collector. The Information Technology operation represents 25% of the department budget with Human Resources and the Legal Division comprising the remaining 23%. Expenses have increased from $4.844 million in FY10 to $5.158 million in FY13, or 6.5% over a four year period.
Summary of Administrative Services Department expenditures and funding sources
Actual Actual Approved Projected Proposed Change Percent
Expenditure Category FY 2010 FY 2011 FY 2012 FY 2012 FY 2013 FY12 - 13 Change
Personnel 3,777,250$ 3,775,496$ 3,915,032$ 3,843,200$ 4,075,411$ 160,379$ 4.10%
Operating Expenses 1,036,458 901,559 961,575 973,100 977,369 15,794 1.64%
Capital Outlay 30,109 26,865 105,000 100,000 105,000 - 0.00%
Total Expenditures 4,843,818$ 4,703,920$ 4,981,607$ 4,916,300$ 5,157,780$ 176,173$ 3.54%
Permanent full-time equivalent employees 61.30 61.30 61.30 61.30 -
Sources of Funds
Taxes 1,823,220$ 1,470,050$ 2,387,630$ 2,034,528$ 2,274,334$ (113,296)$ -4.75%
Intergovernmental Aid 302,972 276,886 267,726 289,036 283,636 15,910 5.94%
Fines and Penalties 778,659 897,235 883,650 910,000 919,100 35,450 4.01%
Fees, Licenses, Permits 281,923 239,194 290,800 251,025 290,800 - 0.00%
Charges for Services 1,868 2,134 1,000 1,610 1,000 - 0.00%
Interest and Other 1,181,177 1,348,431 610,850 890,150 766,730 155,880 25.52%
Enterprise Funds 473,999 469,990 539,951 539,951 622,180 82,229 15.23%
Total Sources 4,843,818$ 4,703,920$ 4,981,607$ 4,916,300$ 5,157,780$ 176,173$ 3.54%
Summary of administrative department significant budget changes There are no significant changes to the Administrative Services Department for FY13. The FY13 budget is increasing $176,173 or 3.5% over the approved FY12 budget. Personnel costs are increasing $160,379 or 4%. This includes funds to cover all contractual pay increases covering 61.3 full-time equivalents.
Operating expenses are $15,794 more than the FY12 budget. Additional funds are provided for increases in software support and licensing fees ($10,244) and $5,550 for office furniture replacement in the Town Clerk operations. Operating capital is level funded at $105,000. This funds the replacement of computers and laser printers throughout the municipal operations as well as the cost of creating additional capacity and redundancy for our Information Technology systems.
Tax support for this operation is decreasing $113,296 as other funding sources are increasing. The largest increase is $150,000 in investment income as investment returns have improved. Funding from enterprise funds are increasing $82,000 and an increase in fine and penalty revenue of $35,000 is also projected.
The intergovernmental aid category includes aid received for exemptions provided to the elderly, blind, surviving spouses and veterans. These exemptions are processed by the Assessing operations.
Administrative Services Department appropriation order 2012-128 That the sum of $5,157,780 be raised and appropriated for the purpose of funding the Town's FY 2013 Administrative Services Department budget as presented to the Town Council by the Town Manager.

37
18. GENERAL FUND OTHER REQUIREMENTS This area of the budget comprises 33% of the total general fund expenditures for FY13. Total expenditures have grown from $37,380,619 in FT10 to $43,554,605 in FY13. The growth is concentrated in the transfers and employee benefits categories. Transfers include the new meals tax and increased room’s tax that have been dedicated for sewer expansions and are transferred to other town funds. This amounts to almost $1.8 million annually with FY12 being the first year of implementation. Most of the increase in employee benefits is centered on the county pension assessments and health insurance. Taxes provide 81% of the funding source for this area of the budget. Intergovernmental aid provides 14% which is mostly derived from school construction reimbursements from the Massachusetts School Building Authority. These reimbursements will expire when the corresponding debt payments expire. A total of $400,000 in general fund surplus will be used to balance this area of the budget. This includes $380,000 for unemployment insurance and $20,000 for overlay deficits. Employee benefits are the largest area comprising 42% of the total budget. Debt service and assessments are the next largest categories totaling 22% and 18%, respectively. Transfers include general fund revenues dedicated for the capital program which go into the Capital Trust Fund and Sewer Enterprise Fund.
Summary of Other Requirements expenditures and funding sources
Actual Actual Approved Projected Proposed Change Percent
Expenditure Category FY 2010 FY 2011 FY 2012 FY 2012 FY 2013 FY 12 - 13 Change
Debt Service 9,685,913 9,876,504 10,390,994 10,298,533 9,456,306 (934,688) -9.00%
Employee Benefits 15,669,235 16,321,690 17,743,163 17,563,747 18,203,846 460,683 2.60%
Insurance 1,205,171 1,281,890 1,300,000 1,299,000 1,386,000 86,000 6.62%
Grants 1,570,937 1,618,159 1,655,727 1,654,896 1,692,352 36,625 2.21%
Assessments and Other 6,647,798 6,692,310 7,275,478 7,491,941 7,850,411 574,933 7.90%
Transfers 2,601,565 2,452,521 5,656,868 5,656,868 4,945,690 (711,178) -12.57%
Deficits - - 1,036,641 20,000 20,000 (1,016,641) -98.07%
Total Other Requirements 37,380,619$ 38,243,074$ 45,058,871$ 43,984,985$ 43,554,605$ (1,504,266)$ -3.34%
Sources of Funds
Taxes 29,995,757$ 30,954,388$ 34,022,119$ 32,852,400$ 35,403,521$ 1,381,402$ 4.06%
Intergovernmental Aid 5,891,839 5,834,125 6,141,859 6,233,104 6,136,806 (5,053) -0.08%
Interest and Other 218,496 121,692 233,412 238,000 228,000 (5,412) -2.32%
Special Revenue Funds 108,408 133,250 130,966 130,966 149,626 18,660 14.25%
Enterprise Funds 793,369 849,619 1,004,515 1,004,515 921,652 (82,863) -8.25%
Trust Funds 372,750 350,000 331,000 331,000 315,000 (16,000) -4.83%
General Fund Surplus - - 3,195,000 3,195,000 400,000 (2,795,000) -87.48%
Total Sources 37,380,619$ 38,243,074$ 45,058,871$ 43,984,985$ 43,554,605$ (1,504,266)$ -3.34%
Debt Service Major capital improvements within the Capital Improvement Program will be funded through the issuance of notes and bonds and repayment of the debt issuance is included in the debt service appropriation. This budget does not include debt associated with enterprise fund operations. Debt service for enterprise fund operations is included in each respective enterprise fund. Additionally, this budget does not include debt service on land acquisitions made by the Community Preservation Fund (CPF). The CPF, a special revenue fund, pays for its own debt service out of surtaxes added to the Town’s real estate tax bills. The chart below details the General Fund debt service budget by type of capital improvement.

38
Debt service for school construction is the largest component of this expenditure. This includes loans on the high school expansion and renovation project, the Barnstable Intermediate School renovation, the construction of the Barnstable Horace Mann Charter School as well as several other smaller renovation projects. Debt service on loans for municipal building improvements, dredging, wharfs and piers are the next largest categories. Eighty-seven percent of debt service expenditures are concentrated in these three areas. Debt service appropriation order 2012-129 That the sum of $9,456,306 be appropriated for the purpose of funding the Town's FY 2013 General Fund Debt Service budget, and to meet such appropriation, that $9,306,680 be raised from current year revenue, and that $68,253 be transferred from the Embarkation Fee Special Revenue Fund, and that $81,373 be transferred from the Bismore Park Special Revenue Fund, as presented to the Town Council by the Town Manager.

39
Employee Benefits and Insurance This category of expenditures includes life insurance, health insurance, Medicare, retirement assessments, unemployment insurance, worker’s compensation insurance as well as an annual contribution to an Other Post-Employment Benefits Trust Fund.
Health insurance for active and retired employees is the largest expenditure in this area of the budget. Collectively, they represent 49% of all employee benefits spending. This includes the contribution to the Town’s trust fund for other-post employment benefits which is budgeted at $200,000 for FY13. The Town’s annual required contribution (ARC), as calculated by actuaries, for fully funding its other post-employment benefit obligation is approximately $5.5 million. This level of funding cannot be achieved immediately without significant cuts to services or increases in the tax levy. Health insurance for active employees comprises 63% of all health insurance expenses while retires make of 35%. The county retirement assessment is the second largest expenditure in this category representing 38% of the total budget. These assessments have increased considerably over the past few years due to the declining investment performance of pension assets. The Town has been able to mitigate some of the increase by adopting a new payment schedule that saves approximately $125,000 per year.
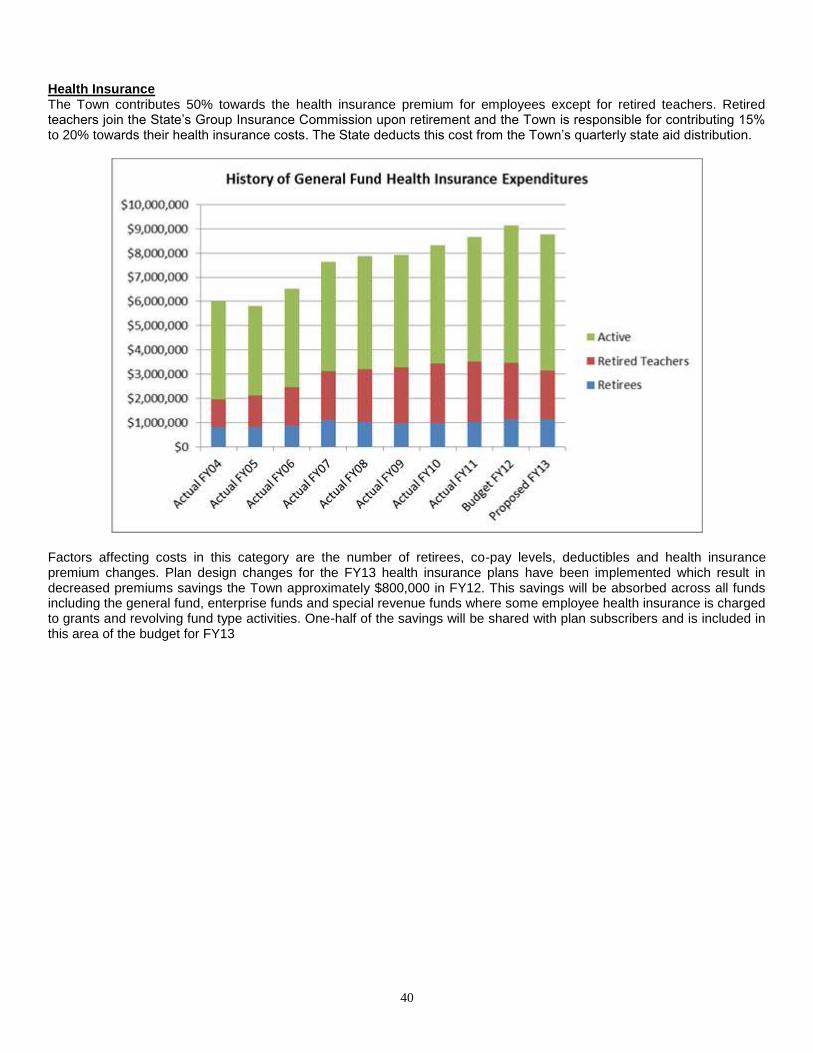
40
Health Insurance The Town contributes 50% towards the health insurance premium for employees except for retired teachers. Retired teachers join the State’s Group Insurance Commission upon retirement and the Town is responsible for contributing 15% to 20% towards their health insurance costs. The State deducts this cost from the Town’s quarterly state aid distribution.
Factors affecting costs in this category are the number of retirees, co-pay levels, deductibles and health insurance premium changes. Plan design changes for the FY13 health insurance plans have been implemented which result in decreased premiums savings the Town approximately $800,000 in FY12. This savings will be absorbed across all funds including the general fund, enterprise funds and special revenue funds where some employee health insurance is charged to grants and revolving fund type activities. One-half of the savings will be shared with plan subscribers and is included in this area of the budget for FY13

41
Unemployment The Town self-insures for unemployment costs. There are no significant layoffs anticipated in FY13. Unemployment costs are significantly higher in FY13 due to reclassifying the School Department’s unemployment expense from the operating budget to the employee benefits budget. .
Pension Assessments & Non Contributory Pension The Town belongs to the Barnstable County Retirement Association (BCRA). Each year the County Retirement Board notifies each member town with the amount of its share of the county retirement pension expense. This assessment includes the normal costs for current retirees, an amount for the amortization of the unfunded liability of the system and the expense of running the system. Additionally, the Town has one retiree collecting a pension that retired before the Town joined the BCRA. This cost is also included in this category. Pension assessments are expected to continue to rise in the neighborhood of 4.5% to 8% per year depending upon the investment performance of the system’s assets. The county pension system conducts an actuarial calculation every other year of the unfunded liability for the system which will readjust the assessment levels. The assessments have increased more $3 million over the past 10 years.
Worker's Compensation The Town began self-insuring for worker's compensation in FY12. This expense covers all active Town employees including those working for the School Department and enterprise funds. Costs have risen significantly due to a number of
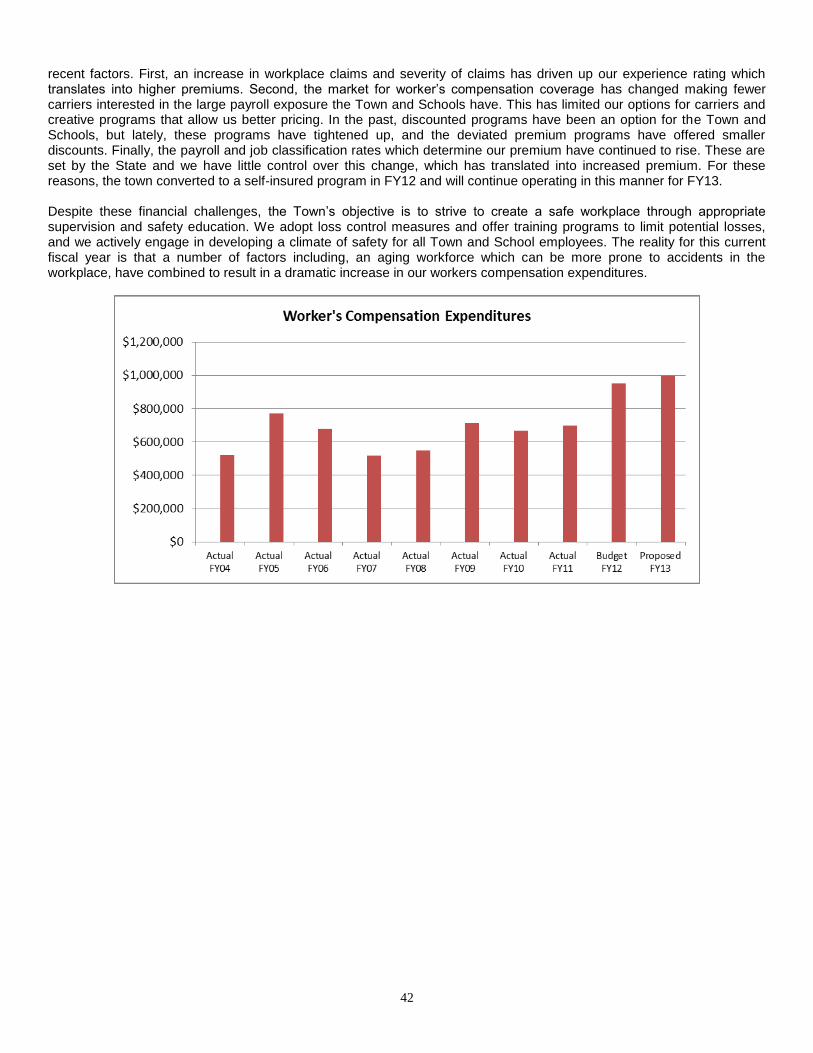
42
recent factors. First, an increase in workplace claims and severity of claims has driven up our experience rating which translates into higher premiums. Second, the market for worker’s compensation coverage has changed making fewer carriers interested in the large payroll exposure the Town and Schools have. This has limited our options for carriers and creative programs that allow us better pricing. In the past, discounted programs have been an option for the Town and Schools, but lately, these programs have tightened up, and the deviated premium programs have offered smaller discounts. Finally, the payroll and job classification rates which determine our premium have continued to rise. These are set by the State and we have little control over this change, which has translated into increased premium. For these reasons, the town converted to a self-insured program in FY12 and will continue operating in this manner for FY13. Despite these financial challenges, the Town’s objective is to strive to create a safe workplace through appropriate supervision and safety education. We adopt loss control measures and offer training programs to limit potential losses, and we actively engage in developing a climate of safety for all Town and School employees. The reality for this current fiscal year is that a number of factors including, an aging workforce which can be more prone to accidents in the workplace, have combined to result in a dramatic increase in our workers compensation expenditures.

43
Property And Casualty Insurance The Town procures premium based liability, property, casualty, automobile, specialty and fire insurance on all its land, building and equipment. The total listed value of the Town’s “fixed asset” holdings exceeds $400 million. In addition, specialty coverages including Public Officials Liability, School Board Legal Liability, Aviation Liability, limited pollution coverage and Police accident and Health insurance are secured each year to protect the activities and employees of the Town, School and Enterprise operations. In addition, many of these coverages extend over the boards and commissions as well as the many volunteers who participate in local municipal operations annually. Each year the actual renewal premium amounts fluctuate based on past experience and coverage needs. These Factors affect the cost of insurance and include claims history, insurance market conditions, deductible levels and insured values. In addition to the incremental rise in the insured value of our existing property and buildings, new buildings have been added to the policy in recent years (Bismore Visitor Center, the Hyannis Youth & Community Center, and airport terminal and air traffic control tower). This escalating value directly affects premiums as it broadens our coverage. The total cost of insurance has grown from $866,000 in FY04 to $1.386 million in FY13. This is a 60% increase, an average of 6% per year.
Employee Benefits and Insurance Appropriation Order 2012-130 That the sum of $19,589,846 be appropriated for the purpose of funding the Town’s FY 2013 Employee Benefits & Insurance budget, and to meet such appropriation, that $18,894,846 be raised from current year revenue, $315,000 be transferred from the Pension Reserve Trust Fund, and $380,000 be transferred from the general fund savings account, as presented to the Town Council by the Town Manager.

44
Libraries and Other Grants Included in this category is the funding provided to the Town’s seven village libraries, funding for a tourism promotion contract to enhance the Town’s economy, and rent paid to the Lombard Trust for land used by the Town. Each library has its own Board of Trustees and the Town exercises no control over their operations. The Town is a major source of funding for the village libraries. The tourism grant is funded from the local portion of the Hotel/Motel tax collected by the Town. The FY13 proposed budget includes a tourism grant amount that represents 7.5% of the total estimated rooms tax to be collected by the Town using a 4% rooms tax rate. The grant to the libraries is increasing 2.5% and the payment to the Lombard Trust remains the same at $50,658.
Library Appropriation Order 2012-131 That the sum of $1,525,444 be raised and appropriated for the purpose of funding the Town’s FY 2013 Library Grant as presented to the Town Council by the Town Manager.
Other Grants Appropriation Order 2012-132 That the sums of $116,250 and $50,658 be raised and appropriated for the purpose of funding the Town’s FY 2013 Tourism Grant and Lombard Land Lease budgets; respectively, as presented to the Town Council by the Town Manager.

45
Assessments The Town participates in four districts, namely: the Cape Cod Technical Regional High School, the Veteran's District, the Old King's Highway Historic District, and the Cape Cod Greenhead Fly Control District. These assessments are based on the Town’s share of the cost of running these operations. The largest assessment is the Cape Cod Technical Regional High School District. Members appointed by the Town Council represent the Town on the Regional School Committee. The Veteran's District administers to our Veterans needs and this appropriation represents our share of the administrative cost and direct benefits paid to veterans.
Also included in this category are state and county assessments. County assessments consist of the Town’s portion of the county’s operating budget and the Cape Cod Commission. The assessment for the Cape Cod Commission is excluded from Proposition 2½ taxing limitations and is added to the tax levy every year. State assessments include such items as mosquito control projects, regional transit authorities, and other smaller items. These cost must be budgeted, however, no appropriation by the Town Council is required since the state deducts the assessments from the Town’s quarterly aid distributions. Finally, this category also includes a budget for school choice and commonwealth charter school assessments. The Barnstable School District participates in the state’s school choice program. The school choice program allows parents to send their children to schools in communities other than the city or town in which they reside. Tuition is paid by the sending district to the receiving district. Districts may elect not to enroll school choice students if no space is available. Commonwealth charter schools are independent public schools designed to encourage innovative educational practices. Charter schools are funded by tuition charges assessed against the school districts where the students reside. The state provides partial reimbursement to the sending districts for the tuition costs incurred.
Assessments Appropriation Order 2012-133 That the sum of $3,233,250 be raised and appropriated for the purpose of funding the Town’s FY 2013 Assessments budget, as presented to the Town Council by the Town Manager.
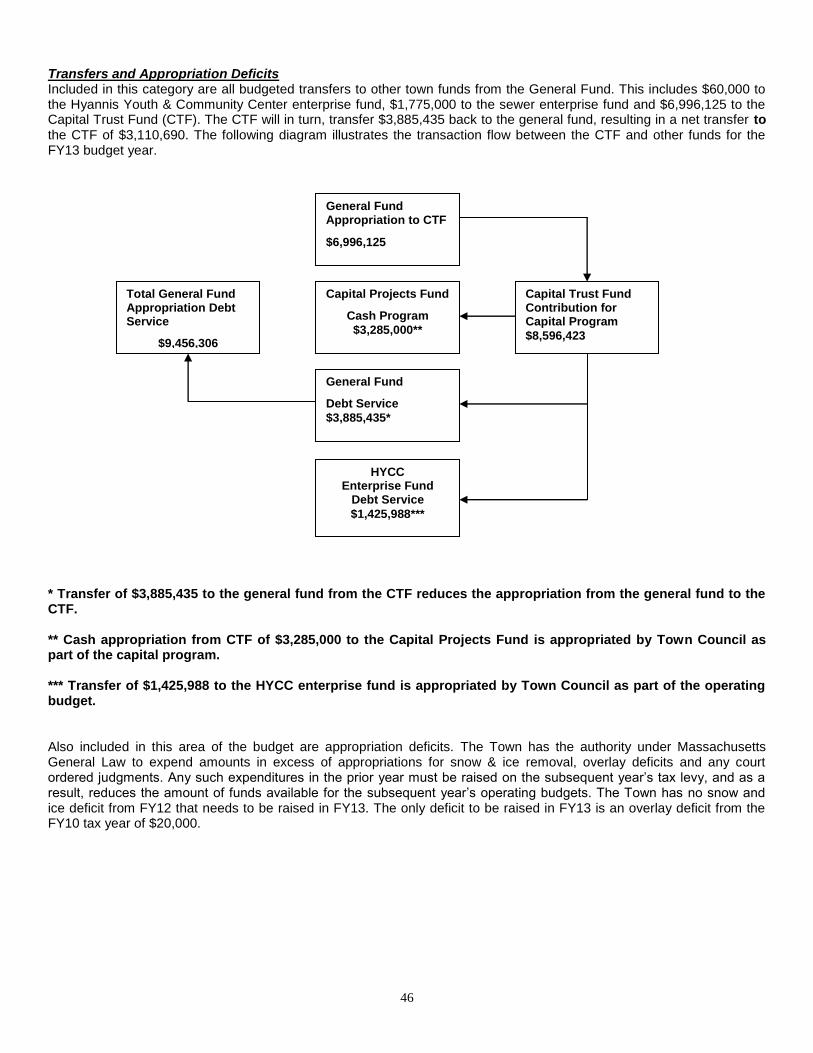
46
Transfers and Appropriation Deficits Included in this category are all budgeted transfers to other town funds from the General Fund. This includes $60,000 to the Hyannis Youth & Community Center enterprise fund, $1,775,000 to the sewer enterprise fund and $6,996,125 to the Capital Trust Fund (CTF). The CTF will in turn, transfer $3,885,435 back to the general fund, resulting in a net transfer to the CTF of $3,110,690. The following diagram illustrates the transaction flow between the CTF and other funds for the FY13 budget year.
* Transfer of $3,885,435 to the general fund from the CTF reduces the appropriation from the general fund to the CTF. ** Cash appropriation from CTF of $3,285,000 to the Capital Projects Fund is appropriated by Town Council as part of the capital program. *** Transfer of $1,425,988 to the HYCC enterprise fund is appropriated by Town Council as part of the operating budget. Also included in this area of the budget are appropriation deficits. The Town has the authority under Massachusetts General Law to expend amounts in excess of appropriations for snow & ice removal, overlay deficits and any court ordered judgments. Any such expenditures in the prior year must be raised on the subsequent year’s tax levy, and as a result, reduces the amount of funds available for the subsequent year’s operating budgets. The Town has no snow and ice deficit from FY12 that needs to be raised in FY13. The only deficit to be raised in FY13 is an overlay deficit from the FY10 tax year of $20,000.
General Fund Appropriation to CTF
$6,996,125
Capital Projects Fund
Cash Program
$3,285,000**
General Fund
Debt Service
$3,885,435*
Capital Trust Fund Contribution for Capital Program
$8,596,423
Total General Fund Appropriation Debt Service
$9,456,306
HYCC Enterprise Fund
Debt Service
$1,425,988***

47
Transfers Appropriation Order 2012-134 That the sum of $4,945,690 be raised and appropriated for the purpose of funding the Town’s FY 2013 Transfers budget, as presented to the Town Council by the Town Manager.
1) And that the following sums be transferred from the Town’s enterprise accounts for the purpose of reimbursing
administrative, employee benefit and insurance costs budgeted within the General Fund: Water Pollution: $390,865 Solid Waste: $270,195 Water: $92,933 Airport: $558,365 Golf Course: $250,000 Marinas: $55,674 Sandy Neck: $68,744
2) And further, that the sum of $20,000 be transferred from the General Fund Savings Account all for the purpose of funding the Town’s FY 2013 General Fund budget as presented to the Town Council by the Town Manager.
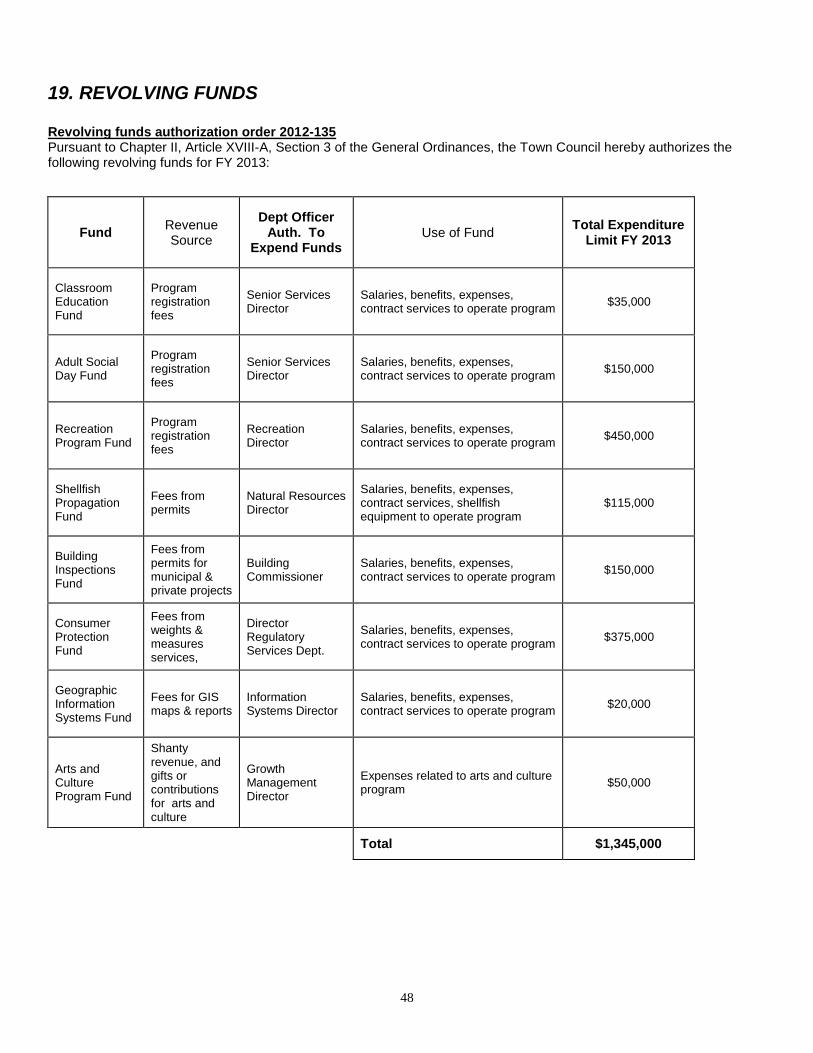
48
19. REVOLVING FUNDS Revolving funds authorization order 2012-135 Pursuant to Chapter II, Article XVIII-A, Section 3 of the General Ordinances, the Town Council hereby authorizes the following revolving funds for FY 2013:
Fund Revenue Source
Dept Officer Auth. To
Expend Funds Use of Fund
Total Expenditure Limit FY 2013
Classroom Education Fund
Program registration fees
Senior Services Director
Salaries, benefits, expenses, contract services to operate program
$35,000
Adult Social Day Fund
Program registration fees
Senior Services Director
Salaries, benefits, expenses, contract services to operate program
$150,000
Recreation Program Fund
Program registration fees
Recreation Director
Salaries, benefits, expenses, contract services to operate program
$450,000
Shellfish Propagation Fund
Fees from permits
Natural Resources Director
Salaries, benefits, expenses, contract services, shellfish equipment to operate program
$115,000
Building Inspections Fund
Fees from permits for municipal & private projects
Building Commissioner
Salaries, benefits, expenses, contract services to operate program
$150,000
Consumer Protection Fund
Fees from weights & measures services,
Director Regulatory Services Dept.
Salaries, benefits, expenses, contract services to operate program
$375,000
Geographic Information Systems Fund
Fees for GIS maps & reports
Information Systems Director
Salaries, benefits, expenses, contract services to operate program
$20,000
Arts and Culture Program Fund
Shanty revenue, and gifts or contributions for arts and culture
Growth Management Director
Expenses related to arts and culture program
$50,000
Total $1,345,000

49
POSITION SUMMARY Includes General Fund, Enterprise Funds and grant position in the School Department
DEPARTMENT FY 04 FTE’s FY 05 FTE’s FY 06 FTE’s FY 07 FTE’s FY 08 FTE’s FY 09 FTE’s FY 10 FTE’s FY 11 FTE's FY 12 FTE's FY 13 FTE's
Town Council 2.00 2.00 2.00 2.00 2.00 2.00 2.00 2.00 2.00 2.00
Town Manager 6.00 5.00 5.00 5.00 5.00 5.00 4.50 4.50 4.50 4.50
Administrative Services 68.33 66.90 65.90 66.00 65.75 63.75 61.40 61.30 61.30 61.30
Finance (restated for school consolidation) 28.80 28.50 27.50 27.50 27.50 27.50 27.25 27.25 27.25 27.25
Tow n Collector 7.00 7.00 7.00 7.00 7.00 6.00 5.00 5.00 5.00 5.00
Tow n Clerk 5.50 5.50 5.50 5.50 5.50 5.50 5.50 5.50 5.50 5.50
Legal 4.53 4.65 4.65 4.75 4.75 4.75 4.65 4.55 4.55 4.55
Human Resources (restated for school consolidation) 8.50 8.25 8.25 8.25 8.00 8.00 8.00 8.00 8.00 8.00
Information Technology 14.00 13.00 13.00 13.00 13.00 12.00 11.00 11.00 11.00 11.00
Community Services 43.87 42.99 42.99 50.37 51.37 52.79 56.53 54.66 53.90 54.05
Recreation 9.00 9.33 9.33 9.33 9.33 10.33 6.55 6.55 8.20 7.70
Golf Enterprise Fund 11.00 11.00 11.00 18.00 19.00 19.00 18.35 15.85 15.85 15.75
Senior Services 9.04 8.21 8.21 8.21 8.21 8.21 8.21 7.61 6.35 6.35
Youth Services 0.00 0.00 0.00 0.38 0.38 0.80 0.80 0.80 0.80 0.90
Marine & Environmental Affairs 10.68 10.30 10.30 10.30 10.30 10.30 10.20 10.20 9.65 9.65
Marina Enterprise Fund 1.40 1.40 1.40 1.40 1.40 1.40 1.45 1.45 1.45 1.45
Sandy Neck Enterprise Fund 2.75 2.75 2.75 2.75 2.75 2.75 2.70 2.70 2.70 2.75
HYCC Enterprise Fund 0.00 0.00 0.00 0.00 0.00 8.27 9.50 8.90 9.50
Growth Management 11.75 9.50 15.00 15.55 14.15 14.15 13.00 12.35 11.50 12.00
Administration 0.00 0.00 0.00 0.00 0.00 0.00 2.50 2.50 2.50
Regulatory Review 4.00 3.50 8.00 8.50 7.00 7.00 7.00 3.35 3.00 3.50
Comprehensive Planning 4.00 3.50 3.50 3.50 3.50 3.50 2.50 2.00 1.50 1.00
Economic Development 0.00 0.00 1.00 0.65 0.65 0.65 0.65 1.65 1.65 2.15
Community Development 2.75 1.50 1.00 1.00 1.00 1.00 1.00 1.00 1.00 1.00
Property Management 0.00 0.00 0.50 0.90 1.00 1.00 0.85 0.85 0.85 0.85
Traff ic & Parking Management 1.00 1.00 1.00 1.00 1.00 1.00 1.00 1.00 1.00 1.00
Police 134.25 139.00 139.00 139.48 139.48 137.48 126.26 126.26 124.26 125.76
Administrative & Investigative Services 37.10 37.10 37.10 37.58 37.58 37.58 35.50 34.00 33.50 35.00
Field Services 97.15 101.90 101.90 101.90 101.90 99.90 90.76 92.26 90.76 90.76

50
POSITION SUMMARY CONTINUED Includes General Fund, Enterprise Funds and grant position in the School Department
DEPARTMENT FY 04 FTE’s FY 05 FTE’s FY 06 FTE’s FY 07 FTE’s FY 08 FTE’s FY 09 FTE’s FY 10 FTE’s FY 11 FTE's FY 12 FTE's FY 13 FTE's
Public Works 118.00 113.90 113.90 119.50 119.50 120.50 115.50 115.50 115.75 116.35
Administration & Tech Support 17.00 15.00 15.00 15.00 15.00 16.00 16.00 15.50 15.50 12.95
Highw ay 41.00 39.50 39.50 39.50 39.50 39.50 35.50 35.50 35.50 35.50
Structures & Grounds 35.00 34.80 34.80 34.80 34.80 34.80 33.80 33.80 33.80 34.10
Solid Waste Enterprise Fund 10.50 10.50 10.50 15.10 15.10 15.10 15.10 15.10 15.10 15.75
Water Pollution Control Enterprise Fund 14.50 14.10 14.10 14.10 14.10 14.10 14.10 14.10 14.10 15.15
Water Supply Enterprise Fund 0.00 0.00 0.00 1.00 1.00 1.00 1.00 1.50 1.75 2.90
Regulatory Services 31.00 30.00 32.00 31.66 31.66 34.65 33.15 31.25 32.15 33.35
Building & Zoning 11.50 11.50 12.50 12.50 12.50 12.50 11.50 12.15 12.50 12.50
Conservation 4.00 4.00 4.00 4.00 4.00 4.00 4.00 4.00 4.00 4.00
Consumer Affairs 6.00 6.00 6.00 6.00 6.00 6.50 6.50 3.95 4.50 5.20
Health 9.50 8.50 9.50 9.16 9.16 11.65 11.15 11.15 11.15 11.65
Airport Enterprise Fund 25.80 25.80 26.40 26.40 26.40 26.40 26.40 25.00 24.60 25.30
SUBTOTAL GENERAL FUND 375.05 369.54 376.04 377.21 375.56 376.97 351.37 347.62 345.51 346.06
SUBTOTAL ENTERPRISE FUNDS 65.95 65.55 66.15 78.75 79.75 79.75 87.37 85.20 84.45 88.55
TOTAL MUNICIPAL OPERATIONS 441.00 435.09 442.19 455.96 455.31 456.72 438.74 432.82 429.96 434.61
Schools 935.24 903.24 903.24 911.30 903.54 891.38 811.58 812.58 813.03 815.53
Administration (restated for school consolidation) 12.60 12.60 12.60 6.00 6.00 6.00 6.00 6.00 6.00 6.00
Instructional Services 792.14 762.14 762.14 774.05 763.16 751.00 686.20 686.20 686.03 638.90
Health Services 14.00 14.00 14.00 14.00 16.50 16.50 16.50 16.50 14.90 14.93
Transportation 28.00 28.00 28.00 24.00 23.00 23.00 21.00 21.00 21.00 24.00
Food Services 14.00 14.00 14.00 15.25 14.38 14.38 13.38 13.38 15.00 13.00
Athletics 2.00 2.00 2.00 2.00 3.00 3.00 3.00 3.00 3.00 3.00
Other Student Services 6.00 6.00 6.00 6.00 6.00 6.00 6.60 7.60 7.60 48.46
Maintenance of Plant 58.50 56.50 56.50 62.00 63.50 63.50 51.90 51.90 52.50 59.24
Netw ork & Technology 8.00 8.00 8.00 8.00 8.00 8.00 7.00 7.00 7.00 8.00
TOTAL ALL DEPARTMENTS 1376.24 1338.33 1345.43 1367.26 1358.85 1348.10 1250.32 1245.40 1242.99 1250.14
Note: As part of the FY05 budget a total of 6 FTE's w ere transferred to the Finance Division and 3 FTE's to the
Human Resources Division as a result of consolidation w ith the School Department. These positions w ere
transferred out of the School Administration section.