fy 2013 budget department of science and technology
DESCRIPTION
DOST MANDATE Provide central direction, leadership and coordination of all and technological efforts and ensure that the results therefrom are geared and utilized in areas of maximum economic and social benefits for the people. Key Result Areas of DOST in Support of its Mandate 1.S&T for Economic Development Enhancing Productivity Building Capacity to Create New Products and Services 2.S&T Human Resources Development 3.S&T for Disaster Risk Reduction and Climate Change Adaptation and MitigationTRANSCRIPT

FY 2013 BUDGETDepartment of Science and Technology

The Key Result Areas of the President’s Social Contract
1. Transparent, Accountable and Participatory Governance
2. Poverty Reduction and Empowerment of the Poor and Vulnerable
3. Just and Lasting Peace and the Rule of Law4. Rapid, Inclusive and Sustained Economic
Growth5. Integrity of the Environment and Climate
Change Adaptation and Mitigation

DOST MANDATEProvide central direction, leadership and coordination of all and technological efforts and ensure that the results therefrom are geared and utilized in areas of maximum economic and social benefits for the people.
Key Result Areas of DOST in Support of its Mandate
1. S&T for Economic Development• Enhancing Productivity• Building Capacity to Create New Products and Services
2. S&T Human Resources Development3. S&T for Disaster Risk Reduction and Climate
Change Adaptation and Mitigation

S&T Priority Program Thrusts1. Use S&T to Solve
Pressing National Problems
✓ ✓ ✓ ✓
2. Develop Appropriate Technologies to Create Growth in the Countyside
✓ ✓
3. Improve Industry Competitiveness ✓ ✓
4. Use S&T to Enhance Government and Social Services
✓ ✓ ✓ ✓ ✓
5. Enhance Capacity in Emerging Technology ✓ ✓
Good Governan
cePove
rty Reducti
onEco
nomic Deve
lopment
Rule of Law
Climate
Change

• R&D Programs• Capability Building and Infrastructure
Support for Priority Industries• Small Enterprises Technology Upgrading
Program (SETUP)• ICTO Programs
S&T FOR ECONOMIC DEVELOPMENT

R&D ProgramsAgriculture, Food and Natural Resources
• S&T Management Approaches Against Fusarium wilt on Cavendish Banana in Mindanao
• Varietal Improvement of Economically Important Crops like banana, coconut, sugarcane, abaca
• Integrated and Sustainable Development of Shrimp, Milkfish, Tilapia and Mudcrab Industries
• Rice Upgrading Program• Biofertilizers• Protein Enrichment of Copra Meal (PECM) as Feed for Swine and
Poultry • Bamboo Development Program• Filipinnovation on Coral Reef Restoration Program
S&T FOR ECONOMIC DEVELOPMENT

• Drug Discovery and Development• Development of Diagnostic Kits for Priority
Diseases• Telehealth (RxBox)• Ovicidal/Larvicidal Trap for Dengue Control• Complementary Baby Food (Sulong Pinoy)• Brown Rice Processing and Shelf Life Optimization• Local Production of Technetium 99m Generator
S&T FOR ECONOMIC DEVELOPMENT
R&D ProgramsMajor R&D Programs for Health and Nutrition

• Local Design and Fabrication of Food Processing Equipment• Local Design and Installation of Automated Guideway Transit
System• Local Design and Fabrication of Instrumentation for Industry,
Agriculture, Health and Environment• Sago Resource Utilization into value added products towards a
Sunrise Bio-industry in Mindanao• S&T Support for the Upgrading of the Cacao and Cocoa Industries• Nanotechnology: Composite Materials, Solar Applications,
Electronics Applications• Processing of Natural Tropical Fibers• Responsible Mining Technologies
S&T FOR ECONOMIC DEVELOPMENTR&D Programs
Major R&D Programs in Industry and Energy

Immersion Freezer
Local Design and Fabrication of Food Processing Equipment
Spray Dryer
Vacuum Frying Machine
Vacuum Packing Machine
Water Retort
S&T FOR ECONOMIC DEVELOPMENTR&D Programs

Automated Guideway Transit
S&T FOR ECONOMIC DEVELOPMENTR&D Programs

Capability Building and Infrastructure Support for Industries
• Establishment of an Advanced Device and Materials Testing Laboratory for the Semiconductor and Electronics Industries (ADMATEL) at ITDI
• Establishment of a Product Development Center in Electronics• Establishment of a Tool and Die Center at the MIRDC• Establishment of an Automotive Parts Development and
Testing Center at the MIRDC• Establishment of Core Facilities for Genomics R&D: DNA
Sequencing and Bio-informatics• Upgrading of the Furniture Testing Center at FPRDI• Skills Training for High Precision Processes and
Instrumentation
S&T FOR ECONOMIC DEVELOPMENT

S&T FOR ECONOMIC DEVELOPMENT
Establishment of an Advanced Device and
Materials Testing Laboratory for the Semiconductor and
Electronics Industries (ADMATEL) at ITDI
13 of 3
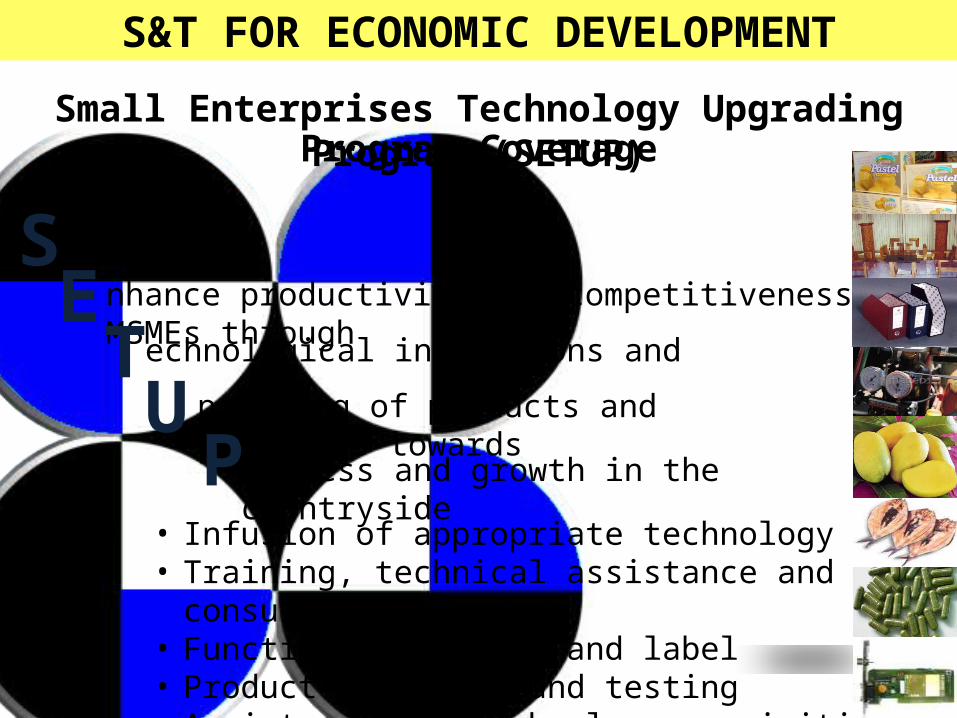
S trategy to
E nhance productivity and competitiveness of MSMEs through
T echnological innovations and
U pgrading of products and processes towards
Progress and growth in the countryside
How? • Infusion of appropriate technology• Training, technical assistance and consultancy services• Functional packages and label• Product standards and testing• Assistance for technology acquisition
S&T FOR ECONOMIC DEVELOPMENT
Small Enterprises Technology Upgrading Program (SETUP)Program Coverage

Particulars CY 2010 CY 2011 CY 2012* CY2013**
Total Assistance (in PhPM) 173.9 163.2 400 500
No. of Funded Projects 276 262 541 575
Total Project Cost of Funded Projects (in PhPM) 143.5 145.6 313.2 500
No. of S&T Intervention provided 2,657 2,509 3,216 3,297
No. of jobs generated (1 job=1 year employment)
5,574 5,274 7,382 8,039
Funding Assistance per job generated 31,193 30,939.27 54,186 62,197
Salary earned per job generated (mo. salary est. at P300/day x 22days/mo x 12mos/yr)
79,200 79,200 79,200 79,200
Salary earned less assistance per job generated 48,007 48,261 25,014 17,003
Return on Assistance Provided 154% 156% 46% 27%
* Actual Accomplishment as of June 30, 2012 plus target for July-December 2012**CY2013 Target
S&T FOR ECONOMIC DEVELOPMENT
Small Enterprises Technology Upgrading Program (SETUP)Program Performance

DOST Regional Office
CY2013 Budget
(in PhPM)
No. of Projects
DOST Regional Office
CY2013 Budget
(in PhPM)
No. of Projects
DOST-NCR 30.7 32 DOST-VII 34.1 44
DOST-CAR 30.3 42 DOST-VIII 21.1 40
DOST-I 22.3 32 DOST-IX 35.2 29
DOST-II 43.4 35 DOST-X 21.9 33
DOST-III 32.5 43 DOST-XI 33.0 30
DOST-IVA 32.1 37 DOST-XII 44.6 30
DOST-IVB 27.1 37 DOST-XIII 24.4 48
DOST-V 25.5 24 TOTAL 500 575DOST-VI 36.8 39
S&T FOR ECONOMIC DEVELOPMENT
Small Enterprises Technology Upgrading Program (SETUP)Program Targets and Budget per Region

S&T FOR ECONOMIC DEVELOPMENT
ICTO PROGRAMS
National ICT Governance ProgramPolicy Development, Public Advocacy, Standards Development, ICT Statistics Research
e-Government Programe-Serbisyo Project, e-Bayad Project, Public Key Infrastructure Data Center Upgrading
ICT Industry Development Program
Talent Development Program, Stepping Up the Value Chain Program, Next Wave Cities Program, Domestic ICT Industry Development Program, ICT-enabled Creative Industries Development Program, ICT Industry Marketing Research Program
Internet for all Program Super wi-fi Pilot Project
Cyber Security ProgramCyber Emergency Response Teams (CERT)

S&T HUMAN RESOURCES DEVELOPMENT
PhD S&T Scholarships
MS S&T Scholarships
Undergraduate S&T Scholarships
Secondary Level Scholarships
Accelerated Science and TechnologyHuman Resource Development Program (ASTHRDP)Engineering Research for Development and Technology (ERDT)Capacity Building in Science EducationDOST-SEI Merit Scholarship ProgramRA 7687 Scholarship Program
Philippine Science High School System
DOST SCHOLARSHIP PROGRAMS
Programs 2010 2011
2012
2013Targets
Actual (as of 30 June
2012)
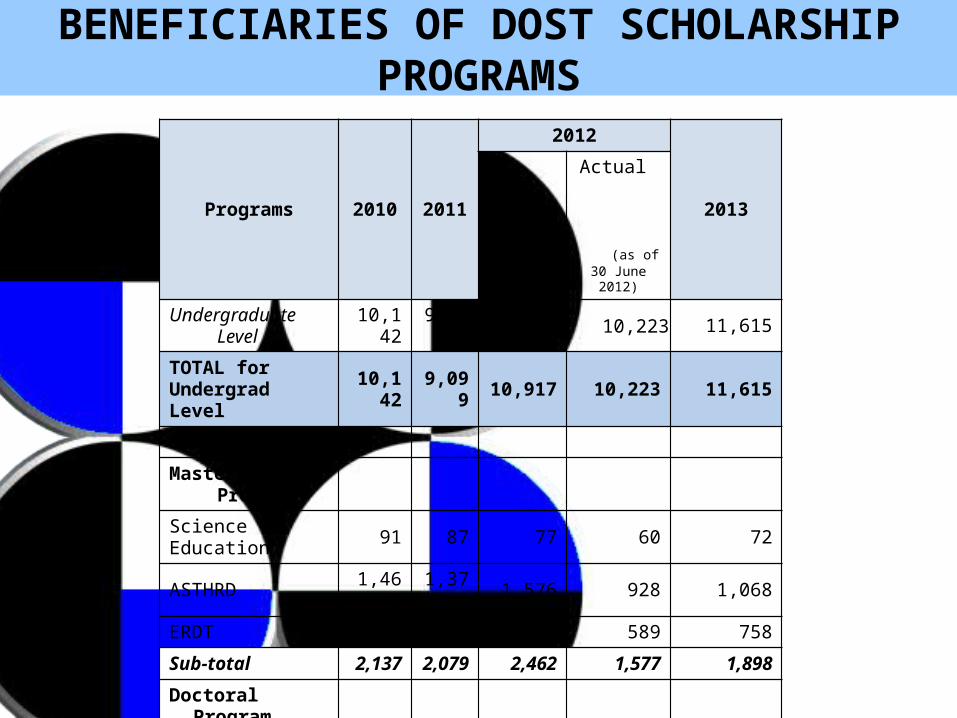
Undergraduate Level 10,142 9,099 10,917 10,223 11,615
TOTAL for Undergrad Level 10,142 9,099 10,917 10,223 11,615
Graduate Level
Masters Program
Science Education 91 87 77 60 72
ASTHRD 1,469 1,371 1,576 928 1,068
ERDT 577 621 809 589 758
Sub-total 2,137 2,079 2,462 1,577 1,898
Doctoral Program
Science Education 81 93 109 92 127
ASTHRD 314 306 359 197 336
ERDT 94 114 163 117 180
Sub-total 489 513 631 406 643TOTAL for Grad Level 2,626 2,592 3,093 1,983 2,541
BENEFICIARIES OF DOST SCHOLARSHIP PROGRAMS

Year
Undergrad
Scholarships
Graduate ScholarshipsScience Education ASTHRD ERDT TOTAL
MS PhD Sub-total MS PhD Sub-
total MS PhD Sub-total MS PhD Total
1994-1999 3,506 - 42 42 -
-
-
- - -
- 42 42
2000 2,186 - 5 5 -
-
-
- - -
- 5 5
2001 1,815 - 9 9 -
-
-
- - -
- 9 9
2002 1,485 - 14 14 -
-
-
- - -
- 14 14
2003 1,929 - 6 6 -
-
-
- - -
- 6 6
2004 1,782 - 12 12 -
-
-
- - -
- 12 12
2005 2,134 - 8 8 -
-
-
- - -
- 8 8
2006 2,094 - 7 7 -
-
-
- - -
- 7 7
2007 1,667 12 3 15 -
-
- - -
- 12 3 15
2008 1,482 2 8 10 51 6 57 18 - 18 71 14 85
2009 1,274 13 5 18 107
12
119
28 -
28
148 17 165
2010 1,215 2 4 6 169 21 190 35 1 36 206 26 232
2011 1,482 10 4 14 195 20 215 73 6 79 278 30 308 2012
(Targets) 1,830 25 12 37 772 148 920 146 24 170 943 184 1,127
DOST SCHOLAR GRADUATES

Source: S&T HUMAN RESOURCE DEVELOPMENT PLAN, 2003-2010
Strategies within the next 3 years to accelerate S&T HUMAN RESOURCE DEVELOPMENT
• Distance Education (e-learning)• Straight MS/PhD Programs• Research Degree Programs• Sandwich Program (Local and Abroad)• Expansion of Existing Consortia• Expansion of Balik-Scientist Program• Twining with Universities Abroad• Grants for Theses and Dissertations• Employment Contracts for Graduates of DOST-PhD
Scholarships

Southern Mindanao
Ilocos Region
Cagayan Valley
Bicol Region
Central Mindanao Region
Eastern Visayas Region
National Capital Region
Western Visayas
Central Visayas Region
SOCCSKSARGEN
Central Luzon
Cordillera Administrative Region
CARAGA20132014
The Philippine Science High School System

Performance Indicator
2010 Actual
2011 Actual
2012 Actual
2013 Target
No. of Scholars Supported
3,527 3,837 4,133 4,361
No. of graduates 744 737 747 912
Percentage of graduates enrolled in S&T Courses
96% 99% 95% 95%
All PSHS campuses to be included in the top 20 schools passing the UPCAT
Top 1-11
ranks
Top 1-9 ranks
Top 1-9 ranks
Top 10 ranks
Percentage of graduates passing the UPCAT
87% 91% 92% 95%
344
363
40
Engineering/Technology
Science/Mathematics
Other Courses
5.35%
48.59%46.05%
Courses Taken by 2012 PSHS System
Graduates
PSHS PERFORMANCE

LEGEND:AWS (155)ARG (87)Radar (10)Upper Air Stations (6)Marine Buoy (2)MTSAT/WAFSAWOS (1)Wind Profiler (1) VSAT
S&T FOR DISASTER RISK REDUCTION
PAGASATECHNOLOGIES

Legend:
Manned Seismic Stations
Unmanned Seismic Stations
Proposed Seismic Stations
Volcano Observatories
Tsunami Wet Sensor
Tsunami Tide Gauges
Proposed Tsunami Wet Sensors Proposed Sea Level Detection Sensors – JICA
Proposed Sea Level Detection Sensors – Japan Grant Aid
PHIVOLCS MONITORING NETWORK
S&T FOR DISASTER RISK REDUCTION

S&T FOR DISASTER RISK REDUCTION

Rain gauges
CommunicationsPlatform
Water levelsensor
National Operational Assessment of Hazards(Project NOAH)
DREAMFloodNETSensors/Comm Development
Weather Media
3D Mapping
Flood simulation
Rain forecasting
River basin modeling
WeatherChannel
SMS, online platforms, etc.
Launched on 06 July 2012 in Marikina City
S&T FOR DISASTER RISK REDUCTION

LegendBuayan_Malungon River Basin
Davao River Basin
Agus River Basin
Jalaur River Basin
Ilog Hilabangan River Basin
Cotabato_River_Basin
Tagum River Basin
Tagoloan River Basin
Panay River Basin
Bicol River Basin
Agno River Basin
Pampanga River Basin
Abulug_River_Basin
Abra_River_Basin
Cagayan River Basin
CDORiverWtrshd
Agusan River Basin
17 Major River Basins of the Philippines
/
0 210 420 630 840105Kilometers
Luzon
Visayas
Mindanao
• The Philippines’ total land area is about 300,000 km2
• The Program estimates a LiDAR coverage of 107,318 km2 (about 33%)
• Current flight plans estimate total requirement of 3,086 flying hours
• Estimated at 800m flying height
• Number of flying hours for top 4 flood plain priority
• Agno = 140 hours
• Pampanga = 470 hours
• Iligan = 47 hours
• CDO = 27 hours
• The choice of target catchment areas were determined from previous flooding disaster records (source: NDRRMC).
S&T FOR DISASTER RISK REDUCTION
DREAM LiDAR

Other Programs:• Doppler radar R&D and capability
development • Infrastructure disaster proofing• Enhancement of quake (seismic) mapping• Storm surge Innundation mapping of
Philippine coastal areas• Urban flooding system
S&T FOR DISASTER RISK REDUCTION
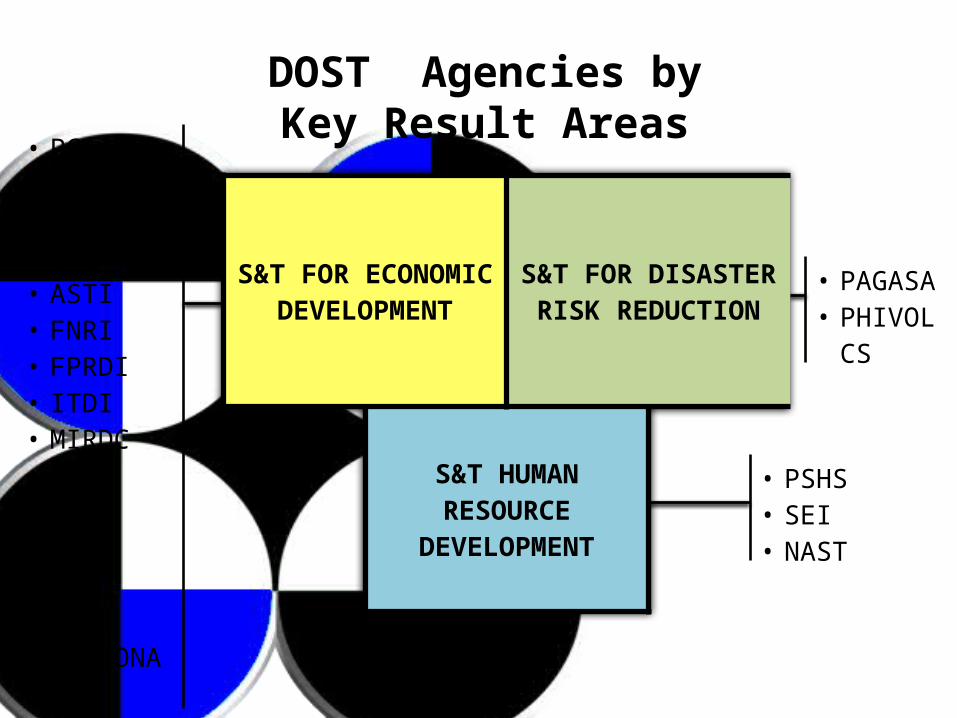
DOST Agencies byKey Result Areas• PCAARRD
• PCHRD• PCIEERD• NRCP• ASTI• FNRI• FPRDI• ITDI• MIRDC• PNRI• PTRI• TAPI• TRC• STII• REGIONAL
OFFICES• ICTO
• PSHS• SEI• NAST
• PAGASA• PHIVOLCS
S&T FOR ECONOMIC DEVELOPMENT
S&T FOR DISASTER RISK REDUCTION
S&T HUMAN RESOURCE
DEVELOPMENT

₱10.090BPROPOSED 2013 BUDGET

S&T FOR ECONOMI
C DEVELOP
MENT₱6.145B(
61%)
S&T FOR DISAS-
TER RISK
REDUC-TION
₱1.699B (17%)
S&T HUMAN
RE-SOURCE DEVEL-
OPMENT₱2.246B
(22%)
₱10.090B
Budget Allocation byKey Result Areas

CY 2013 per NEPP10,089,802
PS, P2,159,78621%
MOOE,
P6,828,26568%
CO, P1,101,75111%
CY’s 2012- 2013 BUDGETBY ALLOTMENT CLASS (P’000)
CY 2012 per GAAP9,348,459
PS, P2,632,79228%
MOOE,
P5,732,91561%
CO, P982,752
11%

2012Per GAA
% of Total
2013 per NEP
% of Total
Increase/ (Decrease)
% to Increase/
(Decrease)
PS 2,632,792 28% 2,159,786 21% (473,006) (18%)
MOOE 5,732,915 61% 6,828,265 68% 1,095,350 19%
CO 982,752 11% 1,101,751 11% 118,999 12%
TOTAL 9,348,459 100% 10,089,802 100% 741,343 8%
COMPARATIVE BUDGET BY ALLOTMENT CLASS (P’000)

PS MOOE CO TOTALS&T for Economic Development
1,396,679 4,582,249 165,981 6,144,909 5,726,940 417,969 7%
OSEC 322,620 2,034,099 12,500 2,369,219 2,048,514 320,705 16%ASTI 36,090 35,713 15,000 86,803 80,917 5,886 7%FNRI 79,047 112,213 30,000 221,260 159,448 61,812 39%FPRDI 87,154 19,734 11,235 118,123 81,730 36,393 45%ITDI 145,326 104,966 21,300 271,592 245,638 25,954 11%ICTO 257,182 216,649 473,831 1,288,163 (814,332) -63%MIRDC 94,931 534,235 10,850 640,016 244,504 395,512 162%NRCP 18,553 27,769 7,130 53,452 56,260 (2,808) -5%PNRI 100,715 56,844 31,000 188,559 140,461 48,098 34%PTRI 37,383 16,247 6,000 59,630 53,627 6,003 11%PCAARRD 97,800 741,579 8,466 847,845 346,351 501,494 145%PCHRD 29,109 209,193 500 238,802 262,288 (23,486) -9%PCIEERD 37,392 408,811 1,000 447,203 595,852 (148,649) -25%STII 24,678 22,531 47,209 37,528 9,681 26%TAPI 28,699 41,666 11,000 81,365 85,659 (4,294) -5%
Agency 2013 Budget Per NEP 2012 Per GAA Increase/ (Decrease) (%)
FY 2012-2013 COMPARATIVE BUDGET (P’000)

PS MOOE CO TOTALS & T HRD 323,926 1,696,256 225,480 2,245,662 2,117,834 127,828 6%NAST 6,890 44,213 180 51,283 42,787 8,496 20%PSHS 291,926 281,730 224,100 797,756 705,435 92,321 13%SEI 25,110 1,370,313 1,200 1,396,623 1,369,612 27,011 2%
S&T for Disaster Risk Reduction
439,181 549,760 710,290 1,699,231 1,503,685 195,546 13%
PAGASA 355,167 463,367 643,671 1,462,205 1,283,646 178,559 14%PHIVOLCS 84,014 86,393 66,619 237,026 220,039 16,987 8%GRAND TOTAL
2,159,786 6,828,265 1,101,751 10,089,802 9,348,459 741,343 8%
Agency 2013 Budget Per NEP 2012 Per GAA Increase/ (Decrease) (%)
FY 2011-2012 COMPARATIVE BUDGET (P’000)

THANK YOU.