fy 2012 results - listed companyaxiata.listedcompany.com/misc/axiata_presentation_4q2012.pdf · -...
TRANSCRIPT

FY 2012 Results
21 February 2013
Dato’ Sri Jamaludin Ibrahim, President & Group CEO
James Maclaurin, Group CFO

FY 2012 2
Executive SummaryExcellent year: Very strong growth in all metrics, all countries; Exceeded all Headline KPIs; Proposed dividend of 23 sen per share (inclusive of 8 sen interim dividend paid) and special dividend of RM1.0bn
Overall results shows a strong FY growth:• FY growth : Revenue +7.3% ; EBITDA +4.2% ; PAT +6.2% • YoY growth : Revenue +4.3% ; EBITDA +2.1% ; PAT +4.9% • QoQ growth : Revenue -2.0% ; EBITDA +0.04% ; PAT -18.7%
Group posted even stronger results @ constant currency:• FY growth : Revenue +11.7% ; EBITDA +8.3% ; PAT +9.4% • YoY growth : Revenue +11.0% ; EBITDA +8.5% ; PAT +10.4% • QoQ growth : Revenue -0.6% ; EBITDA +1.7% ; PAT -17.6%
Overall Group performance exceeded all Headline KPIs :• Revenue growth : +7.3% ; (KPI: 5.3%)• EBITDA growth : +4.2% ; (KPI: 1.8%)• ROIC : +11.9% ; (KPI: 11.3%)• ROCE : +9.4% ; (KPI: 8.9%)
OFCF grew 4.9% to RM1.5bn
2012 was an investment year, focusing on data investment at key OpCos• Continuous Data (excl. SMS and VAS) FY growth for Celcom (19%), XL (50%), Dialog (53%) and
Robi (50%)
Axiata has proposed a progressive increase in its dividend payout from 60% in FY2011 to 70% in FY2012, DPS of 23 sen (inclusive of 8 sen interim dividend paid), with a one-off Special Dividend of RM 1 billion (DPR of 36% and DPS of 12 sen). The total payment will likely exceed RM3.0bn compared to RM1.6bn in 2011

FY 2012 3
Key Group Highlights:FY2012: Operating companies performed very well; Mostly double-digit growth –Either Top or Top 2 in all metrics in 2012; increased dividends at XL and Dialog
• Outstanding double-digit revenue growth of 27%, Normalised EBITDA and PAT grew 51% and 43% respectively• Strong subscriber growth in Robi (34% YoY)• Strong progress in all aspects of business especially marketing and distribution
• Outstanding double-digit revenue growth of 24%, EBITDA 13% while PAT 23%• Data revenue (excluding SMS and VAS) grew 53% while voice revenue grew 11%• Proposed final dividend of 33cents, an increased on 32% compared to FY2011 resulting a dividend yield of 3.5% at
a market price of LKR9.30
• Outstanding double-digit revenue growth of 15%, EBITDA 4% whilst PAT declined 2%. Profitability partly affected by SMS interconnect and the expansion of data infrastructure impacting network opex and depreciation
• Data revenue (excluding SMS and VAS) grew 50% and contribution to total revenue at 16%, up from 12% in 2011. FY SMS grew 16%
• Proposed to increase the dividend payment to 40% of 2012 normalised net income, subject to approval at the upcoming AGM.
• Solid performance with EBITDA tracking revenue growth at 7% and PAT growing at 6% • Strong progress in year made in all aspects of the business especially IT, distribution and people development• Data revenue (excluding SMS and VAS) grew 19%, contributes 15% to total revenue, up from 14% in 2011. Voice
revenue grew 4%
Growth number based on results in local currency in respective operating markets Robi - Normalised for SIM tax, Forex, 2G license cost and late payment fee
• Integration of Hello to Smart is well underway• Acquisition completed on 19th February 2013

FY 2012 4
• At Group level, due to XL - SMS interconnect, higher data costs and continuedinvestments in data, FY EBITDA margin impacted by ~2%
- SMS interconnect (at XL) revenue contribution is 1.6% of group revenue while havingminimal impact on EBITDA
• Accelerated investments in data networks drove capex higher and impacted profitabilityacross group (especially XL)
- Ongoing efforts to increase data capacity utilization (3G network) and optimize data pricingto improve data margins
- Data profitability is still low but margins are improving with scale. Data revenue (acrossgroup) has increased by 29% in FY 2012
- Capex / Revenue across the group for 2012 was 26% (27% in 2011) and is expected havea downward trend
• Adverse exchange rate movements have negatively impacted the FY2012 results- Adverse impact on revenue growth of -4.4pp (RM722mn)- Negative impact on EBITDA growth of -4.1pp (RM290mn)- Negative impact on PAT growth of -3.2pp (RM88mn)
• 4th quarter trend at XL is a concern- Marked increase in the competitive intensity in 2nd half of 2012, which is expected to
continue in the 1st half of 2013- Late delivery of capex in 4Q at XL will spill over and affect 2013 capex trend
Challenges and mitigating factorsIncreasing competitive environment and data investments in Indonesia

FY 2012 5
Results at a glance: Strong FY growthStrong FY Revenue growth: OCF grows despite heavy data capex investment
RM mn 4Q FY 4Q YoYgrowth
QoQgrowth
FYgrowth
Revenue 4,449 17,652 4.3% -2.0% 7.3%
EBITDA 1,849 7,424 2.1% 0.04% 4.2%
EBITDA margin % 41.6% 42.1% -0.9pp 0.9pp -1.2pp
PAT 658 2,880 4.9% -18.7% 6.2%
PATAMI 571 2,513 4.9% -19.6% 7.1%
NormalisedPATAMI 651 2,784 11.5% -10.8% 9.7%
Capex 1,340 4,598 -4.1% 26.4% 3.6%
Operating cash flow* 196 1,489 -19.0% -58.0% 4.9%
* FCF less taxes and net interest
Financial highlights
FY 2012 6
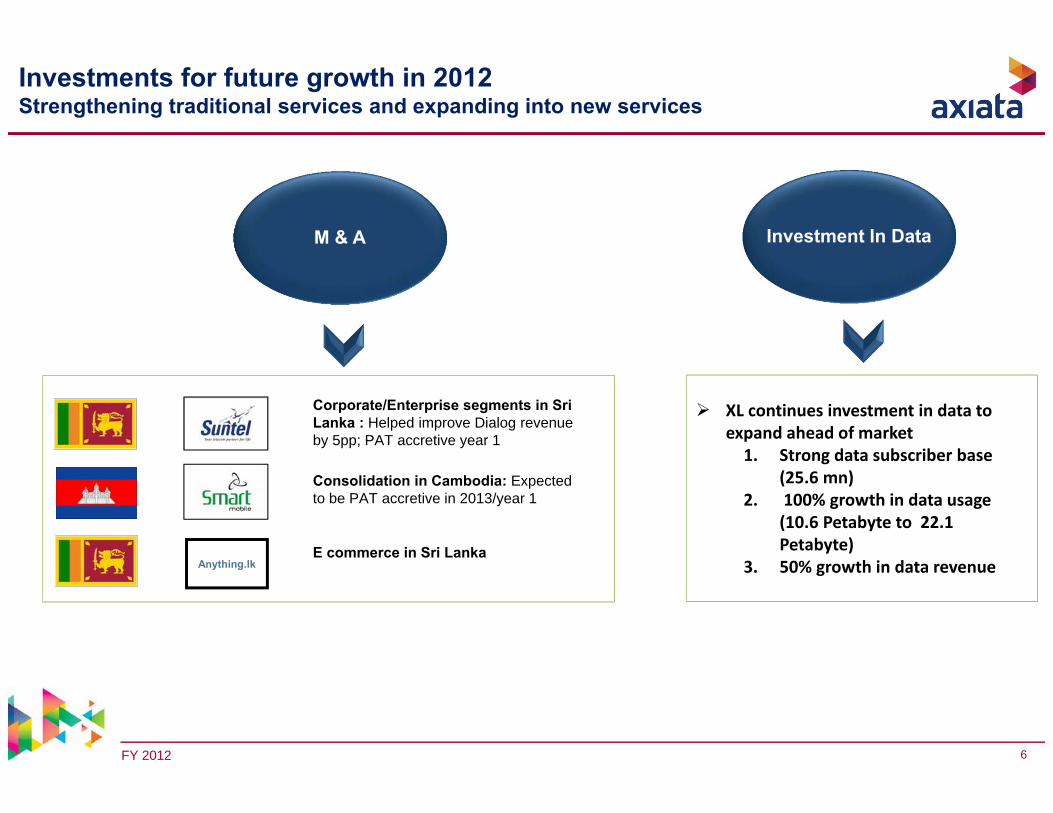
M & A
XL continues investment in data to expand ahead of market1. Strong data subscriber base
(25.6 mn)2. 100% growth in data usage
(10.6 Petabyte to 22.1 Petabyte)
3. 50% growth in data revenue
Investment In Data
Investments for future growth in 2012Strengthening traditional services and expanding into new services
Anything.lk
Corporate/Enterprise segments in Sri Lanka : Helped improve Dialog revenue by 5pp; PAT accretive year 1
Consolidation in Cambodia: Expected to be PAT accretive in 2013/year 1
E commerce in Sri Lanka

FY 2012 7
123 722
677 243
602 ‐
528 ‐
RevenueFY 2011
Voice SMS Pure Data VAS Others Forex RevenueFY 2012
‐‐
‐ 141
‐
303 151
533 ‐
358
Revenue FY2011
Voice SMS Pure Data VAS Others Revenue FY2012
Revenue growth across all major products including Voice and SMS
16,448
17,652
16,448
17,652
@ Constant currency
• Voice revenue growth mainly driven by Celcom and Robi due to higher subscriber despite flat ARPU.
• Despite YoY lower SMS usage (impact due to introduction of “SMS interconnect” charges) in Indonesia, smart pricing
(dynamic location based pricing) helps to grow SMS revenue in most markets
• Data revenue growth driven largely by XL and Celcom
• VAS revenue impact due to regulatory changes and VAS accounting changes at XL
• Others include the infrastructure, wholesale, Interconnect revenue in Indonesia and non- core revenue (such as TV,
fixed line etc.)
In R
M m
n
In R
M m
n
@ Actual rate
Notes: Numbers may not add up due to rounding
FY 2012 8
• Numbers based on management estimates• All financials are including Multinet results
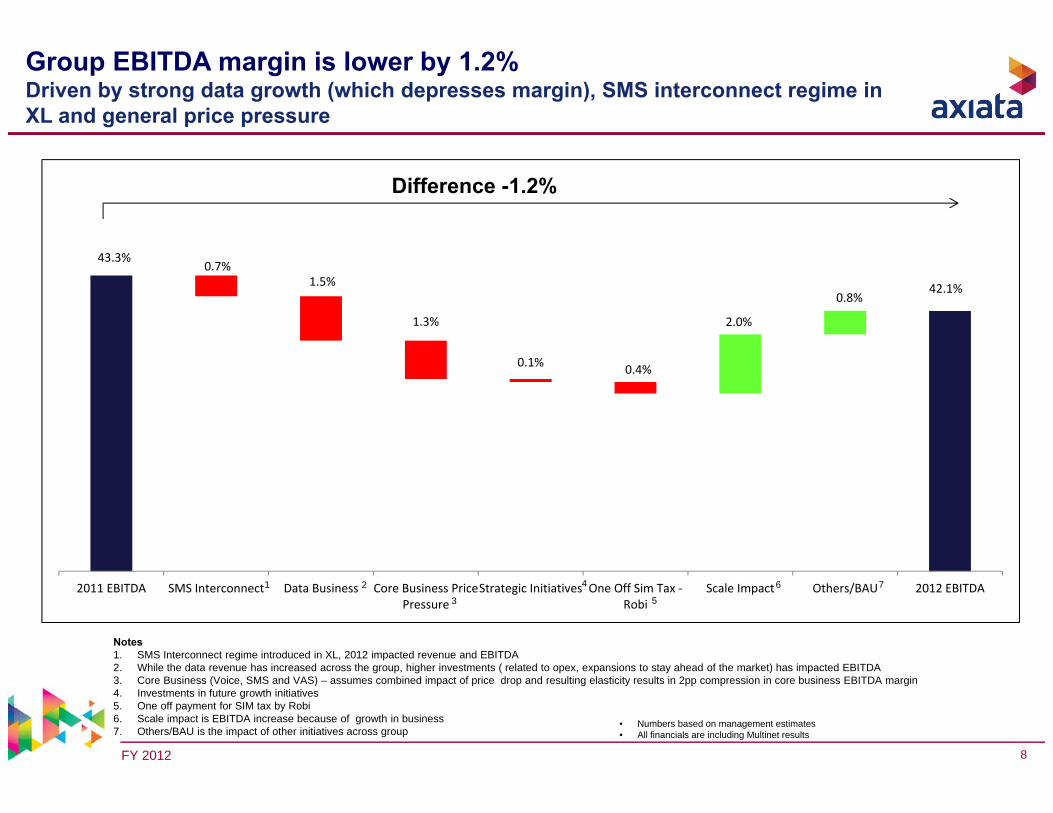
Group EBITDA margin is lower by 1.2%Driven by strong data growth (which depresses margin), SMS interconnect regime inXL and general price pressure
42.1%
0.7%1.5%
1.3%
0.1% 0.4%
2.0%
0.8%
43.3%
2011 EBITDA SMS Interconnect Data Business Core Business PricePressure
Strategic Initiatives One Off Sim Tax ‐Robi
Scale Impact Others/BAU 2012 EBITDA
Difference -1.2%
1 2
3
4
5
6 7
Notes1. SMS Interconnect regime introduced in XL, 2012 impacted revenue and EBITDA2. While the data revenue has increased across the group, higher investments ( related to opex, expansions to stay ahead of the market) has impacted EBITDA 3. Core Business (Voice, SMS and VAS) – assumes combined impact of price drop and resulting elasticity results in 2pp compression in core business EBITDA margin4. Investments in future growth initiatives5. One off payment for SIM tax by Robi6. Scale impact is EBITDA increase because of growth in business7. Others/BAU is the impact of other initiatives across group

FY 2012 9
7,124
7,424 276 11 14 60 18 29
EBITDA
FY20
11
Celcom XL
Dialog
Robi
Hello
Inter‐Co
Elim
ination/
Multin
et
EBITDA
FY20
12
Group EBITDA: FY2011→ FY2012 FY EBITDA increased by +4.2%; main contribution to growth came from Celcom and Robi
FY2011 EBITDA FY2012 EBITDAFY movement
EBITDA INCREASED BY RM300MN
EBITDA growth: +4.2%
RM Million
EBITDA FY2011 FY Growth Rates EBITDA FY2012Celcom 3,084 Celcom 3,360 XL 3,326 XL 3,315 Dialog 451 Dialog 437 Robi 396 Robi 456 Hello (0.4) Hello 18 Inter‐Co Elimination/Multinet (133) Inter‐Co Elimination/Multinet (162) GROUP 7,124 GROUP 7,424
+8.9%‐0.3%‐3.1%+15.2%
+5111.3%‐22.6%+4.2%
(+276)(-11)(-14)(+60)(+18)(-29)(+300)

FY 2012 10
2,712 2,969 3,188 2,880 114 69 70 105 140 39 219 166 26 208 49 191
FY20
11
FORE
X Lo
ss
Acq
uisi
tion
of Id
ea
XL S
ever
ance
paym
ent
Cel
com
ass
etim
pairm
ent
Cel
com
tax
ince
ntiv
e
MTC
E an
d M
ultin
etge
nera
l pro
visi
on
Nor
mal
ised
FY2
011
Ope
ratio
ns
Nor
mal
ised
FY2
012
Cel
com
& D
ialo
g ta
xim
pact
Cel
com
pen
alty
on
Suku
k
Cel
com
& H
ello
asse
t im
pairm
ent
One
-off
Rob
i SIM
Tax
FORE
X Lo
ss
FY20
12
Normalised Group PAT: FY2011→FY2012 Adjusting for exceptional items, normalised PAT increased by +7.3% (vs increased by+6.2% non-normalised)
Normalised FY2011 PAT Normalised FY2012 PATUnderlying Operational Performance
RM Million
FY Growth +6.2%
Normalised Growth: +7.3%
OPERATIONAL CONTRIBUTION INCREASED BY RM219MN
Norm PAT FY2011 FY Growth Rates Norm PAT FY2012Celcom 1,746 Celcom 1,953 XL 1,107 XL 991 Dialog 158 Dialog 147 Robi 34 Robi 82 Hello (43) Hello (29) Associates & Others (33) Associates & Others 44 GROUP 2,969 GROUP 3,188
+11.9%‐10.5%‐7.0%+141.2%+32.6%+233.3%+7.3%
(+207)(-116)(-11)(+48)(+14)(+77)(+219)

FY 2012 11
RM and USD strengthened against all OpCo currencies in 2012 but stabilised in Q3 and Q4
Currency fluctuations impact to translated RM revenue is 4.4%.FY2012 post-tax foreign exchange loss was RM191mn.
Vs. RM Vs. USD Vs. RM Vs. USD
Indonesia Rupiah, IDR -3.34% -1.23% -5.17% -6.37%
Sri Lanka Rupee, LKR +0.18% +2.37% -12.40% -13.50%
Bangladesh Taka, BDT -1.33% +0.83% -8.86% -10.01%
US Dollar, USD -2.14% - +1.27% -
Singapore Dollar, SGD -0.14% +2.05% +1.89% +0.60%
Pakistan Rupee, PKR -3.79% -1.68% -5.80% -6.98%
Indian Rupee, INR -0.21% +1.98% -11.65% -12.76%
Malaysia Ringgit, RM - -2.14% - +1.27%
OpCo Currency Vs RM, USD – Avg Q4’12 vs Q3’12
OpCo Currency Vs RM, USD – FY’12 vs FY’11
FY 2012 12
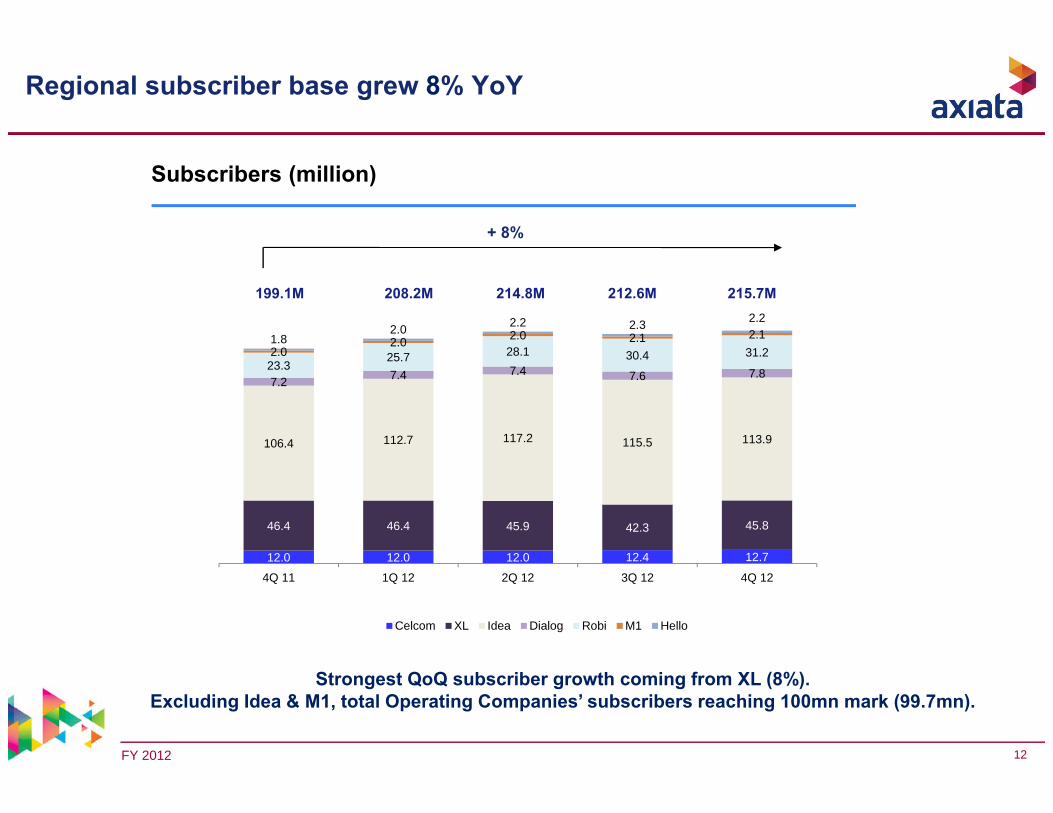
12.0 12.0 12.0 12.4 12.7
46.4 46.4 45.9 42.3 45.8
106.4 112.7 117.2 115.5 113.9
7.2 7.4 7.4 7.6 7.823.325.7 28.1 30.4 31.22.02.0 2.0 2.1 2.11.82.0 2.2 2.3 2.2
4Q 11 1Q 12 2Q 12 3Q 12 4Q 12
Celcom XL Idea Dialog Robi M1 Hello
Regional subscriber base grew 8% YoY
Subscribers (million)
+ 8%
208.2M 214.8M 212.6M 215.7M199.1M
Strongest QoQ subscriber growth coming from XL (8%).Excluding Idea & M1, total Operating Companies’ subscribers reaching 100mn mark (99.7mn).

FY 2012 13
156
182
100
110
120
130
140
150
160
170
180
190
FY‐2011 FY‐2012
5.9
5.2
‐
1
2
3
4
5
6
7
FY‐2011 FY‐2012
Pricing pressure compensated by MoU increase shows we still have a bit of elasticity left in key markets especially in specific localities
MoU
in m
n
Voi
ce re
venu
e/m
in (R
M s
en)
- 12%
Total outgoing minutes sold by Axiata Opcos have increased by 17%, with a broad based increase in all Opcos
Voice revenue/min has dropped by 12%(in RM). On a constant currency basis, the revenue/min fell by only 8%
17%
Internal Estimates

FY 2012 14
Traditional Voice & SMS business remains resilient while data provides growth momentum
* Others include OpCo’s other revenue (including interconnect & roaming revenue at XL) and Corporate Center activities
Note:Dialog figures restated after FRS adjustments (FY2011/12)Celcom figures reclassified (FY2011)^ XL net VAS revenue (FY2012)
Data revenue has grown 29% YoY, leading the “core mobile service” revenue increase by 6% YoY. VAS revenue decline YoYwas due to decline in XL. “Others” revenue impacted by the SMS interconnect revenue in Indonesia
RM mn FY 2011 FY 2012 2011 vs 2012Voice 9,175 9,478 3%% of Service revenue 63.7% 62.2% (1.5) pp
SMS 2,403 2,554 6%% of Service revenue 16.7% 16.8% + 0.1 pp
VAS 999 858 ‐14%% of Service revenue 6.9% 5.6% (1.3) pp
Data 1,816 2,348 29%% of Service revenue 12.6% 15.4% + 2.8 pp
Total Service revenue 14,393 15,238 6%
Others* 2,055 2,413 17%% of Total Revenue 12.5% 13.7% + 1.2 pp
Total Revenue 16,448 17,652 7%
^

FY 2012 15
41%36%
48%50%
11% 14%
2011 2012Basic Phones Featured Phones Smartphones
Data is expected to grow faster across Axiata markets, facilitated by higher smartphone adoption in all markets
23% and 14% subscribers using smartphone in Celcom and XL respectively in FY 2012
Note:Based on 4 major Opcos’ internal dataTotal rounded up to 100%
27% growth in Smartphones

FY 2012 16
415
784 745
789
510
2,687
2,827
2000
2100
2200
2300
2400
2500
2600
2700
2800
2900
‐
100
200
300
400
500
600
700
800
900
4Q 11 1Q 12 2Q 12 3Q 12 4Q 12 FY 11 FY 12
FCFRM mn
Despite continued aggressive investment in Data Capex, Axiata’s Free Cash Flow (FCF) has grown
Capex ( RM mn ) FY 2011 FY 2012
Celcom 965 1,015
XL 2,665 2,910
Dialog 175 396
Robi 602 227
Hello 13 21
Others 19 28
Total 4,438 4,598
OFCFRM mn5%
Note: Numbers may not add up due to roundingFCF=EBITDA-CapexOFCF= EBITDA- Capex- Net Interest-Tax
5%
1,420
1,489
242
425 400 467
196
‐
100
200
300
400
500
600
700
4Q 11 1Q 12 2Q 12 3Q 12 4Q 12 FY 11 FY 121000
1100
1200
1300
1400
1500
1600
FY 2012 17
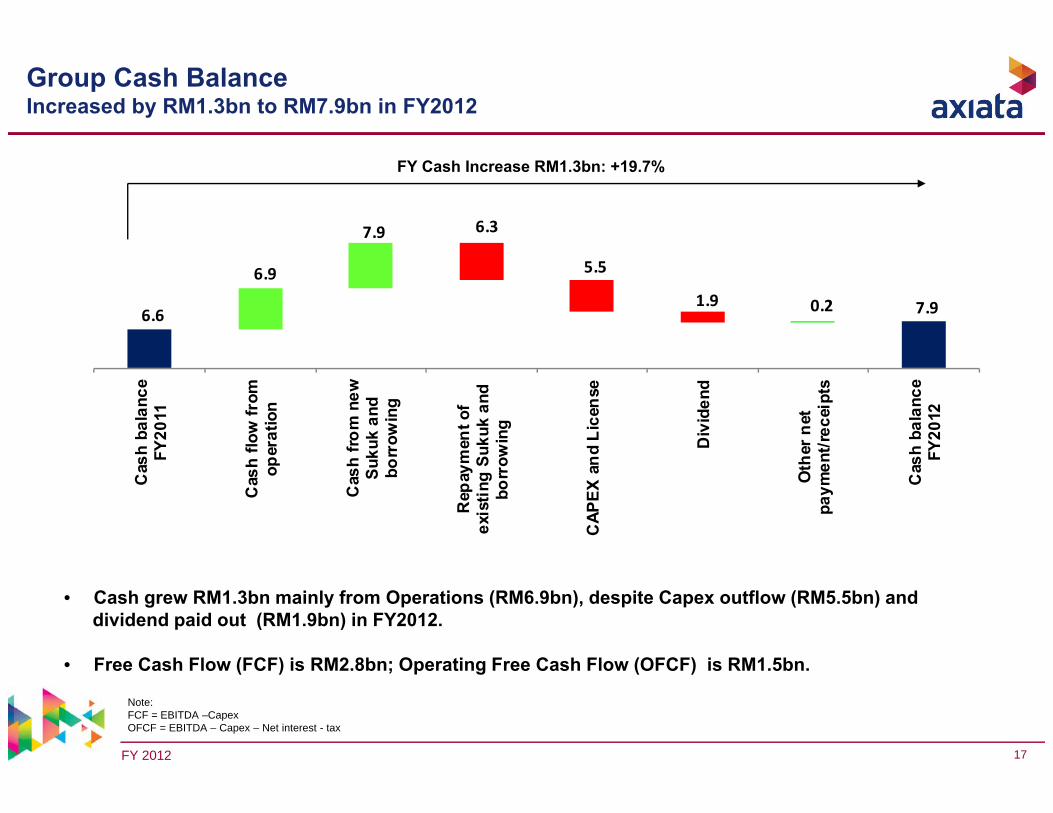
Group Cash Balance Increased by RM1.3bn to RM7.9bn in FY2012
6.6 7.9
6.9
7.9 6.3
5.5
1.9 0.2
Cas
h ba
lanc
eFY
2011
Cas
h flo
w fr
omop
erat
ion
Cas
h fro
m n
ewSu
kuk
and
borr
owin
g
Rep
aym
ent o
fex
istin
g Su
kuk
and
borr
owin
g
CAP
EX a
nd L
icen
se
Div
iden
d
Oth
er n
etpa
ymen
t/rec
eipt
s
Cas
h ba
lanc
eFY
2012
FY Cash Increase RM1.3bn: +19.7%
• Cash grew RM1.3bn mainly from Operations (RM6.9bn), despite Capex outflow (RM5.5bn) and dividend paid out (RM1.9bn) in FY2012.
• Free Cash Flow (FCF) is RM2.8bn; Operating Free Cash Flow (OFCF) is RM1.5bn.
Note:FCF = EBITDA –CapexOFCF = EBITDA – Capex – Net interest - tax

FY 2012 18
1.61 1.57 1.58
1.801.70
0.680.53
0.71 0.64 0.64
31-Dec-11 31-Mar-12 30-Jun-12 30-Sep-12 31-Dec-12
Gross debt to EBITDA Net debt to EBITDA
6,617 7,497
6,480
8,622 7,906
31‐Dec‐11 31‐Mar‐12 30‐Jun‐12 30‐Sep‐12 31‐Dec‐12
Cash and BankRM' Million
Group Balance Sheet Strong progress in balance sheet optimisation made in 2012. Axiata group consolidated gross debt remains in preferred ratings band (S&P/Moody’s)
o Gross debt decreased by RM756mn QoQ mainly coming from Robi(RM455mn) and XL (RM380mn) due to debts repayment.
o Credit rating remained unchanged - for the Group is Baa2 (Moody’s) and BBB (S&P).
o Average cost of debt fell by 5.2% to 4.4% during 2012 translating to RM101mn savings
o Cash & bank decreased by RM716mn QoQ mainly due to dividend paid in 31st
October 2012.
o Free Cash Flow (FCF) is RM2.8bn; Operating Free Cash Flow (OFCF) is RM1.5bn.
o QoQ Net Debt to EBITDA remain stable at 0.6x

FY 2012 19
FY2012 Headline KPI’s: All KPI’s achieved during 2012
*Capex is not a Headline KPI. Note: Headline KPI’s do not take into account potential currency fluctuations.
FY2012 Headline KPIs
FY2012 Achievement
FY2012 @ Constant Rate
Revenue growth 5.3% 7.3% 11.7%
EBITDA growth 1.8% 4.2% 8.3%
ROIC (%) 11.3% 11.9% 12.1%
ROCE (%) 8.9% 9.4% 9.6%
Capex* RM4.4bn RM4.6bn -
Exceeded all Headline KPIs for FY2012
(RM5.0bn guidance 3Q12)

FY 2012 20
Proposed dividend of 70% DPR of the Group Normalised PATAMI for FY2012, which results in a DPS of 23 sen (inclusive of 8 sen interim dividend paid). This is coupled with a proposed Special Dividend of RM 1.0bn translating into additional DPR of 36% and DPS of 12 sen
Dividend Yield =5.5% *Total Dividend = RM 2.9bn*DPS = 35 sen*
Dividend Yield = 2.1%Total Dividend = RM 0.85 bnDPS = 10sen
Share prices used in computing div yields: For FY 2010 =RM 4.75 , FY 2011= RM4.875 FY 2012 = RM 6.30 (6M VWAP as of 05th Feb 2013) * Inclusive of the special dividend paid
• Axiata has proposed a progressive increase in its dividend payout from 60% in FY2011 to 70% in FY2012, DPS of 23 sen (inclusive of 8 sen interim dividend paid), with a one-off Special Dividend of RM 1 billion (DPR of 36% and DPS of 12 sen). The total payment will likely exceed RM3.0bn compared to RM1.6bn in 2011
Dividend Yield = 3.9%Total Dividend = RM 1.5bnDPS = 19sen
Inaugural Dividend Announcement
Step increase in DPR with the growth in Group Net FCF
Increase in DPR with a one off special dividend
DPR 30%
DPR 60%DPR 70%
Progressively increasing DPR (subject to Group
net FCF growth)
FY 2012 21
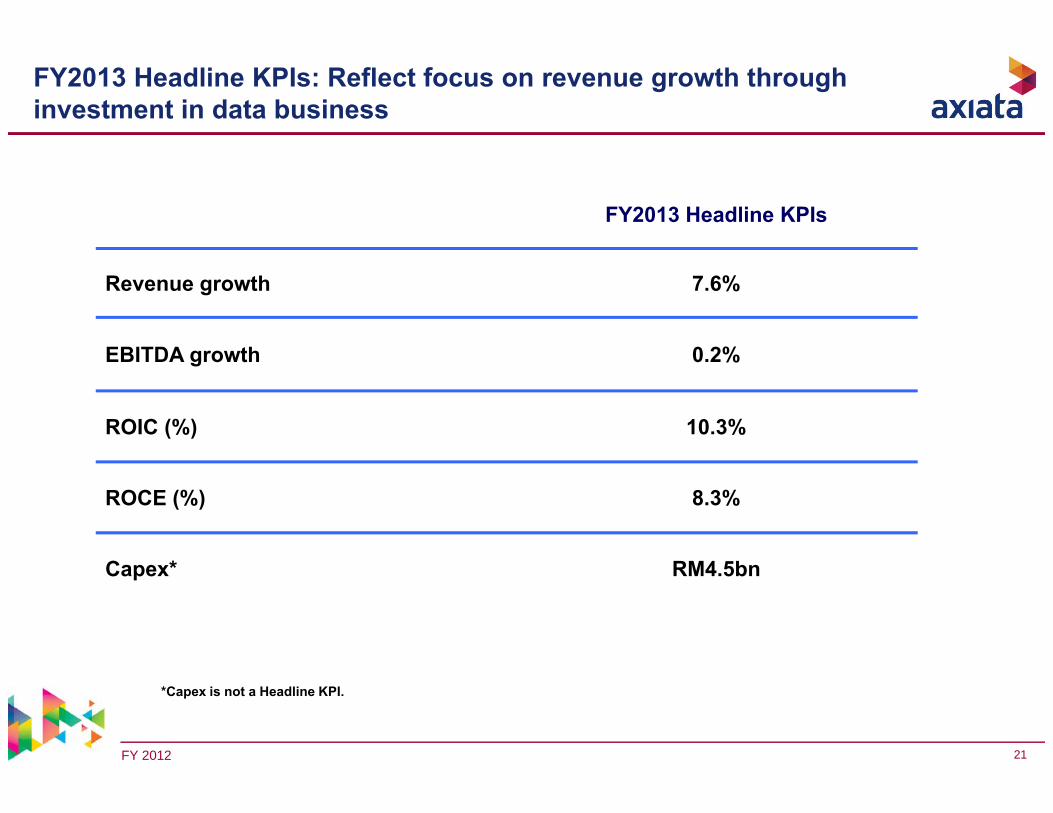
FY2013 Headline KPIs: Reflect focus on revenue growth through investment in data business
*Capex is not a Headline KPI.
FY2013 Headline KPIs
Revenue growth 7.6%
EBITDA growth 0.2%
ROIC (%) 10.3%
ROCE (%) 8.3%
Capex* RM4.5bn
FY 2012 22
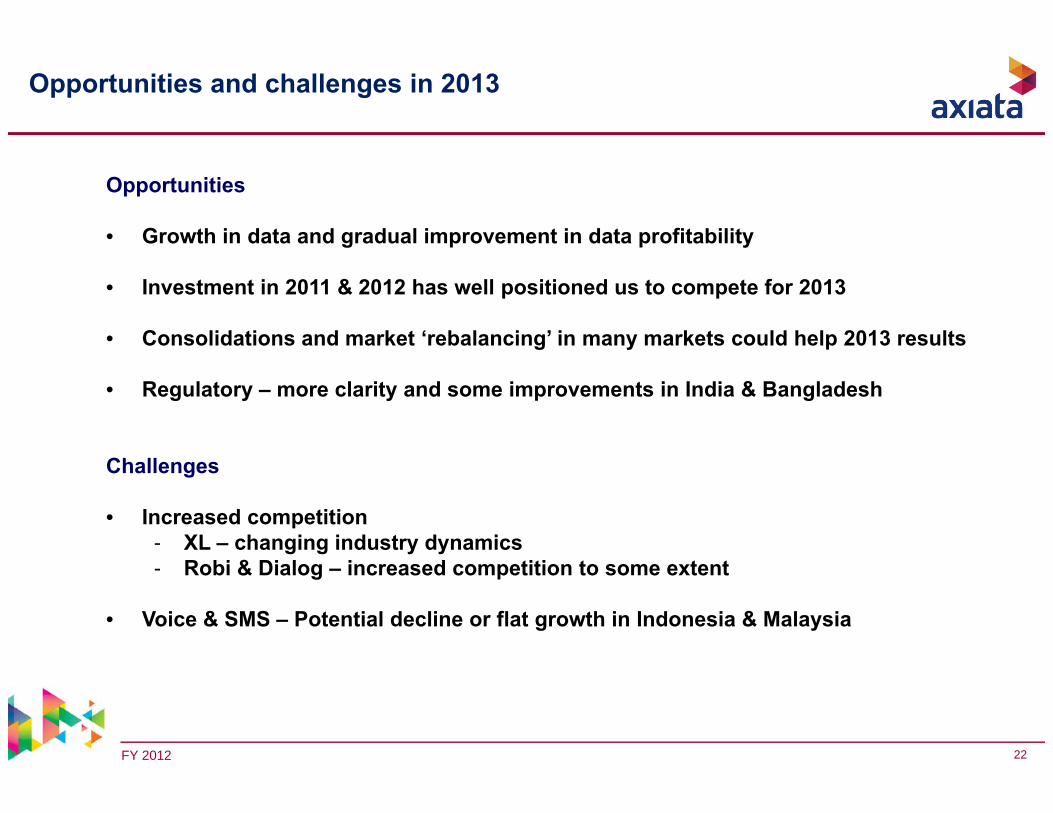
Opportunities
• Growth in data and gradual improvement in data profitability
• Investment in 2011 & 2012 has well positioned us to compete for 2013
• Consolidations and market ‘rebalancing’ in many markets could help 2013 results
• Regulatory – more clarity and some improvements in India & Bangladesh
Challenges
• Increased competition- XL – changing industry dynamics- Robi & Dialog – increased competition to some extent
• Voice & SMS – Potential decline or flat growth in Indonesia & Malaysia
Opportunities and challenges in 2013
FY 2012 23
Thank You

FY 2012 24
2% 0.04% 11% 7% 4% 10%
2% 2% 13% 7% 7% 5%
5% 8% 24% 15% 4% 9%
4% 11% 0.3% 24% 13% 29%
1% >100% 94% 27% 28% 43%
Revenue EBITDA Revenue EBITDA
Group
Celcom
XL
Dialog
Robi
NormalisedPAT1
Q o Q Performance FY2012 Performance
Financial snapshot : 4Q 2012
Note: Growth number based on results in local currency in respective operating markets1. Group and Celcom: PATAMI and others: PAT. PAT/PATAMI normalized as per appendix
NormalisedPAT1

FY 2012 25
Group Financial PerformanceRevenue : Strong FY growth of 7%
Revenue (RM mn)
• Celcom and XL make up 83% of 2012 Group revenue whilst Robi and Dialog contributed equally at 8%
• At constant currency:• YoY – revenue growth would have
been higher at +11.0% (vs +4.3%)• QoQ – revenue decline would have
been lower at -0.6% (vs -2.0%)• FY – revenue growth would have
been higher at + 11.7% (vs +7.3%)
+4% +7%
-2%
4,264 4,247 4,417 4,539 4,449
16,44817,652
4Q 11 1Q 12 2Q 12 3Q 12 4Q 12 FY 11 FY 12
Note: 1Q12-3Q12 Revenue are restated figures for impact on XL net VAS revenue
FY 2012 26
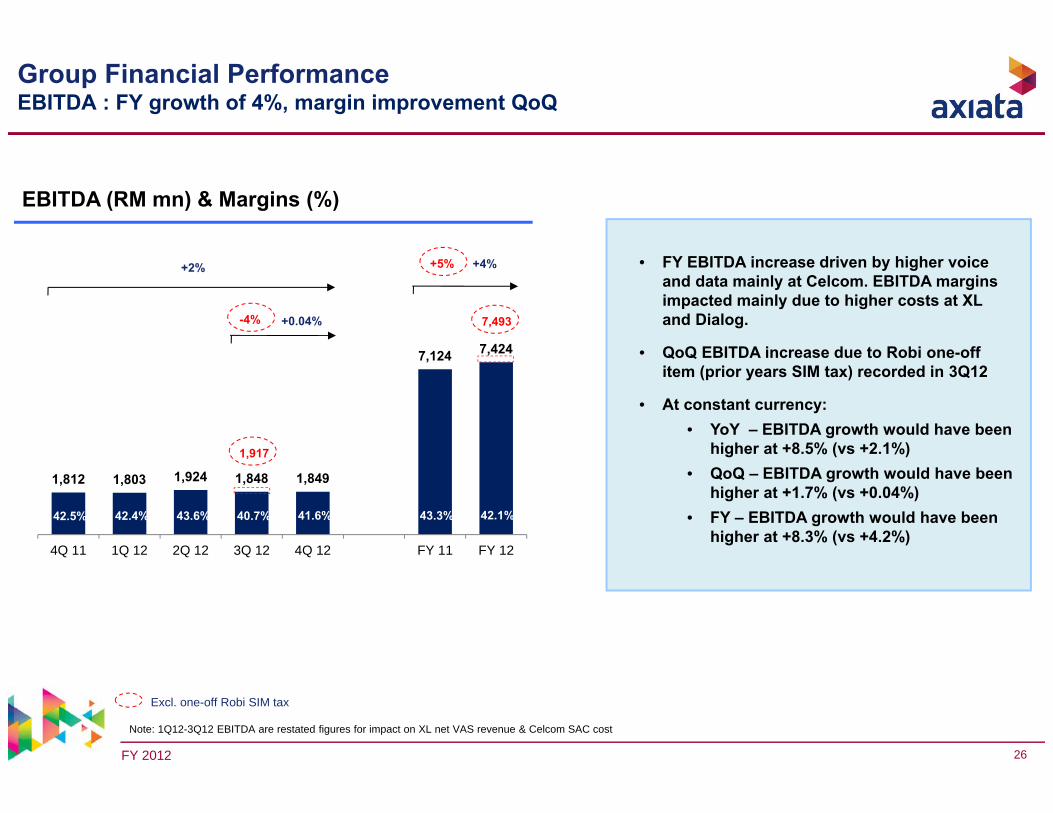
1,812 1,803 1,924 1,848 1,849
7,124 7,424
4Q 11 1Q 12 2Q 12 3Q 12 4Q 12 FY 11 FY 12
EBITDA (RM mn) & Margins (%)
• FY EBITDA increase driven by higher voice and data mainly at Celcom. EBITDA margins impacted mainly due to higher costs at XL and Dialog.
• QoQ EBITDA increase due to Robi one-off item (prior years SIM tax) recorded in 3Q12
• At constant currency:• YoY – EBITDA growth would have been
higher at +8.5% (vs +2.1%)• QoQ – EBITDA growth would have been
higher at +1.7% (vs +0.04%)• FY – EBITDA growth would have been
higher at +8.3% (vs +4.2%)
Group Financial PerformanceEBITDA : FY growth of 4%, margin improvement QoQ
+2% +4%
+0.04%
40.7% 41.6%42.5% 42.4% 43.3% 42.1%43.6%
1,917
7,493
+5%
-4%
Excl. one-off Robi SIM tax
Note: 1Q12-3Q12 EBITDA are restated figures for impact on XL net VAS revenue & Celcom SAC cost

FY 2012 27
545 566 667 710 571
2,346 2,513
4Q 11 1Q 12 2Q 12 3Q 12 4Q 12 FY 11 FY 12
Group Financial PerformancePATAMI : Strong growth of 7% in 2012
• Strong FY growth of 7.1% mainly from higher contribution from Celcom
• At constant currency:• YoY – PATAMI increase would have been
higher at +9.5% (vs +4.9%)• QoQ – PATAMI decrease would have been
lower at -18.8% (vs -19.6%)• FY – PATAMI increase would have been
higher at +10.0% (vs +7.1%)
PATAMI (RM mn)
+5% (Normalised +12%) +7% (Normalised +10%)
-20% (Normalised -11%)

FY 2012 28
16,448
17,652 511
408 103 200 9 27
Revenu
eFY20
11
Celcom XL
Dialog
Robi
Hello
Inter‐Co
Elim
ination/
Multin
et
Revenu
eFY20
12
Group Revenue: FY2011→FY2012 FY Revenue increased by +7.3%
FY2011 Revenue FY2012 RevenueFY movement
RM Million
REVENUE INCREASED BY RM1,204MN
Revenue growth: +7.3%
Revenue FY2011 FY Growth Rates Revenue FY2012Celcom 7,182 Celcom 7,693 XL 6,512 XL 6,920 Dialog 1,264 Dialog 1,367 Robi 1,270 Robi 1,470 Hello 120 Hello 129 Inter‐Co Elimination/Multinet 100 Inter‐Co Elimination/Multinet 73 GROUP 16,448 GROUP 17,652
+7.1%+6.3%+8.1%+15.7%+7.9%‐26.5%+7.3%
(+511)(+408)(+103)(+200)(+9)(-27)(+1,204)
FY2012 reflects XL Net VAS Revenue. No restatement to FY2011. (Audited accounts Revenue FY 2011 RM16,291)
FY 2012 29
2,346 2,539 2,784 2,513
73 69 47 105 140 39 245 158 26 208 34 161
FY20
11
FORE
X Lo
ss
Acq
uisi
tion
of Id
ea
XL S
ever
ance
paym
ent
Cel
com
ass
etim
pairm
ent
Cel
com
tax
ince
ntiv
e
MTC
E an
d M
ultin
etge
nera
l pro
visi
on
Nor
mal
ised
FY2
011
Ope
ratio
ns
Nor
mal
ised
FY2
012
Cel
com
& D
ialo
g ta
xim
pact
Cel
com
pen
alty
on
Suku
k
Cel
com
& H
ello
asse
t im
pairm
ent
One
-Off
Rob
i SIM
Tax
FORE
X Lo
ss
FY20
12
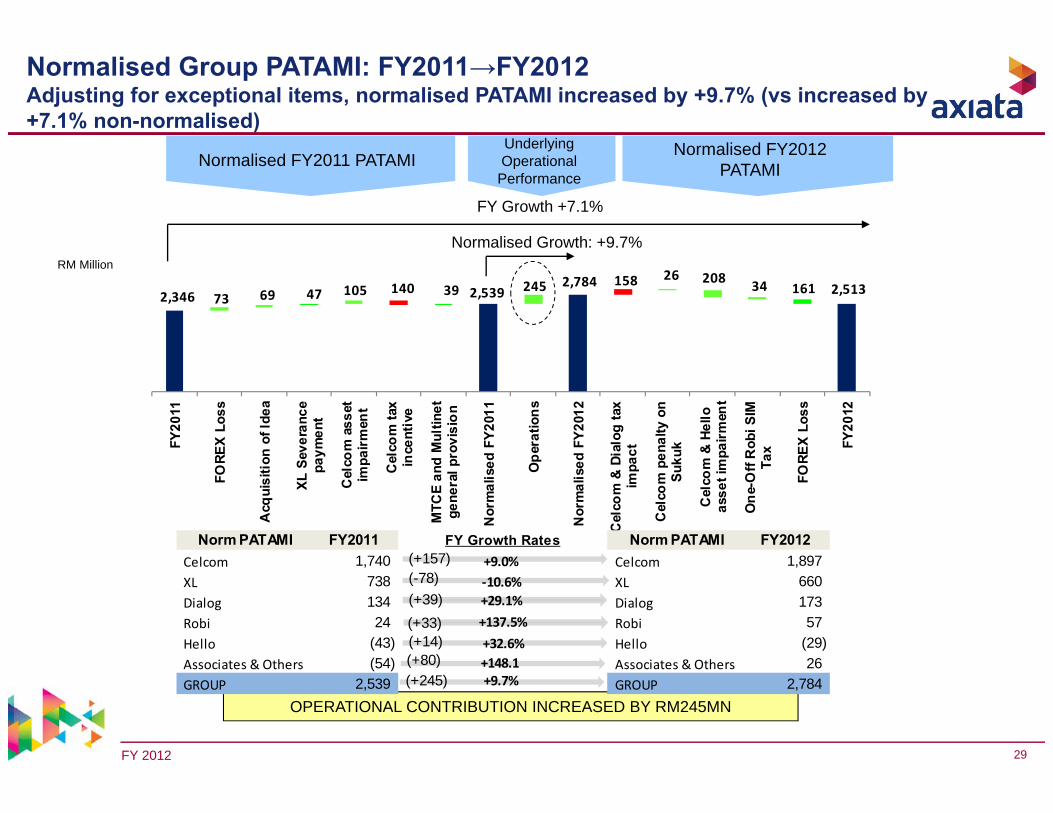
Normalised Group PATAMI: FY2011→FY2012 Adjusting for exceptional items, normalised PATAMI increased by +9.7% (vs increased by+7.1% non-normalised)
Normalised FY2011 PATAMI Normalised FY2012 PATAMI
Underlying Operational Performance
RM Million
FY Growth +7.1%
Normalised Growth: +9.7%
OPERATIONAL CONTRIBUTION INCREASED BY RM245MN
Norm PATAMI FY2011 FY Growth Rates Norm PATAMI FY2012Celcom 1,740 Celcom 1,897 XL 738 XL 660 Dialog 134 Dialog 173 Robi 24 Robi 57 Hello (43) Hello (29) Associates & Others (54) Associates & Others 26 GROUP 2,539 GROUP 2,784
+9.0%‐10.6%+29.1%+137.5%+32.6%+148.1+9.7%
(+157)(-78)(+39)(+33)(+14)(+80)(+245)

FY 2012 30
710 730 651
571 18 91
26 33 34 79 10 66
24
Q3'
12
FORE
X Lo
ss
Cel
com
& D
ialo
gta
x im
pact
Cel
com
pen
alty
on S
ukuk
Cel
com
ass
etim
pairm
ent
Rob
i SIM
Tax
Nor
mal
ised
Q3'
12
Ope
ratio
ns
Nor
mal
ised
Q4'
12
Cel
com
tax
ince
ntiv
e
Cel
com
ass
etim
pairm
ent
FORE
X Lo
ss
Q4'
12
Normalised Q4’12 PATAMINormalised Q3’12 PATAMI
Normalised Growth: -10.8%
QoQ Growth -19.6%
RM Million
OPERATIONAL CONTRIBUTION DECREASED BY RM79MN
Normalised Group PATAMI: QoQ 3Q12 → 4Q12 Adjusting for exceptional items, normalised PATAMI decreased by -10.8% (vsdecreased by -19.6% non-normalised)
Underlying Operational Performance
Norm PATAMI Q3'12 QoQ Growth Rates Norm PATAMI Q4'12Celcom 491 Celcom 490 XL 166 XL 123 Dialog 42 Dialog 11 Robi 18 Robi 31 Hello (8) Hello (3) Associates & Others 21 Associates & Others (1) GROUP 730 GROUP 651
‐0.2%‐26.2%‐73.6%+71.7%+68.9%
‐104.8%‐10.8%
(-1)(-43)(-31)(+13)(+5)(-22)(-79)

FY 2012 31
Key OPCOs Revenue and EBITDA Composition
FY2012 REVENUE & EBITDA Breakdown (%)FY2011 REVENUE & EBITDA Breakdown (%)
REVENUE
EBITDA
REVENUE
EBITDA
Note : Contribution % was derived from Group consolidated figures. FY 2011 figures not restated.
Celcom 44%
XL39%
Dialog8%
Robi8%
Hello1%
Celcom 43%
XL46%
Dialog6%
Robi5%
Celcom 44%
XL39%
Dialog8%
Robi8%
Hello1%
Celcom 44%
XL44%
Dialog6%
Robi6%
Hello0.2%
FY 2012 32
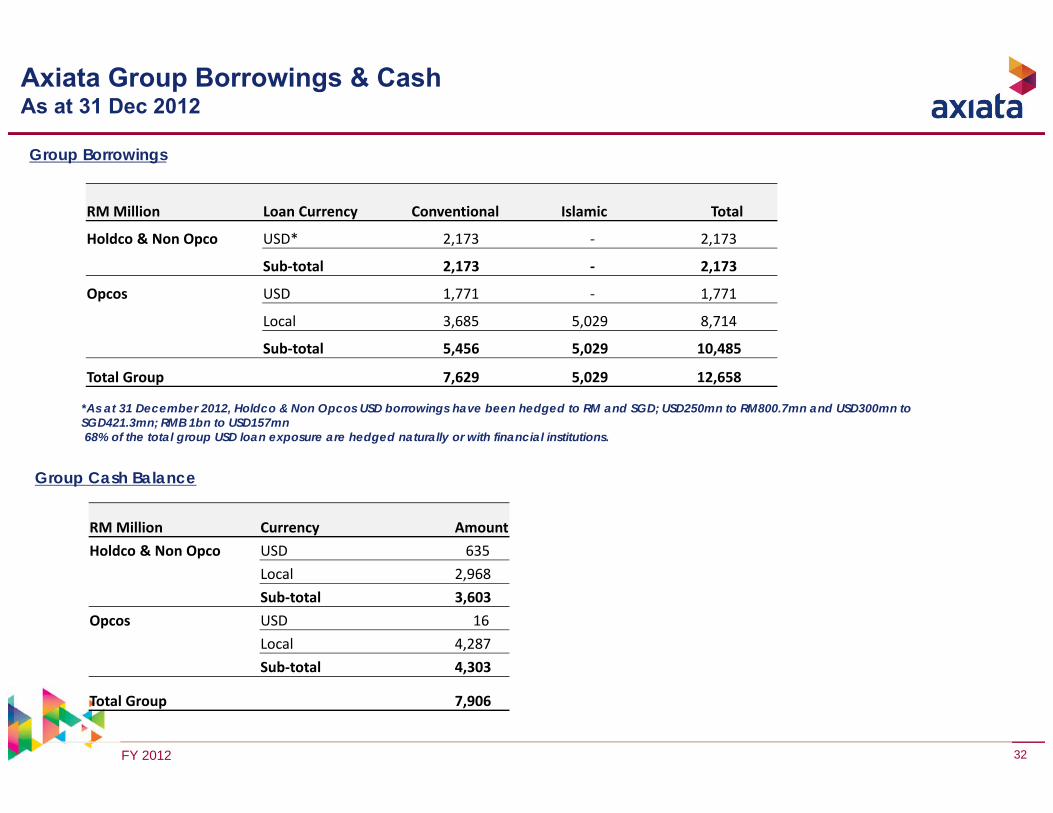
Axiata Group Borrowings & CashAs at 31 Dec 2012
*As at 31 December 2012, Holdco & Non Opcos USD borrowings have been hedged to RM and SGD; USD250mn to RM800.7mn and USD300mn toSGD421.3mn; RMB 1bn to USD157mn68% of the total group USD loan exposure are hedged naturally or with financial institutions.
Group Borrowings
Group Cash Balance
RM Million Currency AmountHoldco & Non Opco USD 635
Local 2,968Sub‐total 3,603
Opcos USD 16Local 4,287Sub‐total 4,303
Total Group 7,906
RM Million Loan Currency Conventional Islamic Total
Holdco & Non Opco USD* 2,173 ‐ 2,173
Sub‐total 2,173 ‐ 2,173
Opcos USD 1,771 ‐ 1,771
Local 3,685 5,029 8,714
Sub‐total 5,456 5,029 10,485
Total Group 7,629 5,029 12,658
FY 2012 33
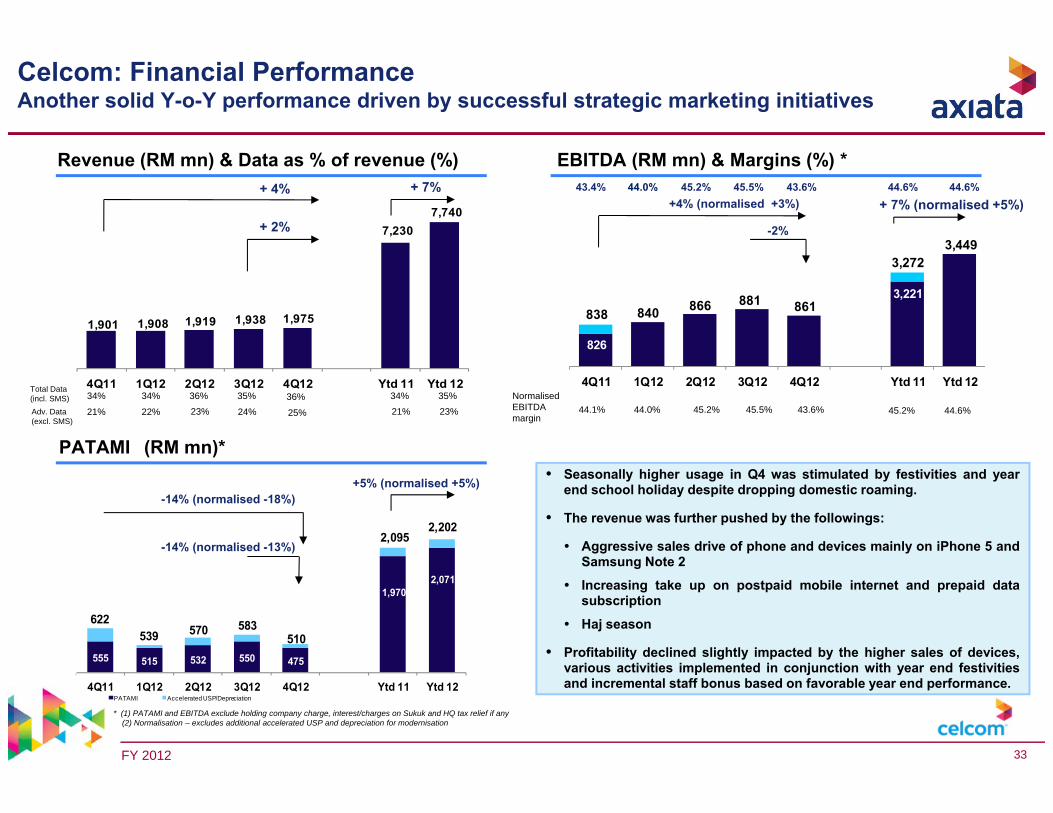
555 515 532 550 475
1,9702,071
622539 570 583
510
2,0952,202
4Q11 1Q12 2Q12 3Q12 4Q12 Ytd 11 Ytd 12PATAMI Accelerated USP/Depreciation
1,901 1,908 1,919 1,938 1,975
7,2307,740
4Q11 1Q12 2Q12 3Q12 4Q12 Ytd 11 Ytd 12
838 840 866 881 861
3,2723,449
826
3,221
4Q11 1Q12 2Q12 3Q12 4Q12 Ytd 11 Ytd 12
PATAMI (RM mn)*
EBITDA (RM mn) & Margins (%) *+ 4%
* (1) PATAMI and EBITDA exclude holding company charge, interest/charges on Sukuk and HQ tax relief if any(2) Normalisation – excludes additional accelerated USP and depreciation for modernisation
Revenue (RM mn) & Data as % of revenue (%)
+4% (normalised +3%)
-2% + 2%
-14% (normalised -13%)
43.4% 45.5% 43.6%45.2%44.0%
Celcom: Financial Performance Another solid Y-o-Y performance driven by successful strategic marketing initiatives
44.0% 45.2% 43.6%45.5%44.1%Normalised EBITDA margin
Total Data (incl. SMS)Adv. Data (excl. SMS)
36%
23%
34% 35% 36%34%
22% 24% 25%21%
-14% (normalised -18%)
+ 7%
45.2% 44.6%
+ 7% (normalised +5%)
34%
21%
35%
23%
44.6%44.6%
+5% (normalised +5%) • Seasonally higher usage in Q4 was stimulated by festivities and year
end school holiday despite dropping domestic roaming.
• The revenue was further pushed by the followings:
• Aggressive sales drive of phone and devices mainly on iPhone 5 andSamsung Note 2
• Increasing take up on postpaid mobile internet and prepaid datasubscription
• Haj season
• Profitability declined slightly impacted by the higher sales of devices,various activities implemented in conjunction with year end festivitiesand incremental staff bonus based on favorable year end performance.
FY 2012 34
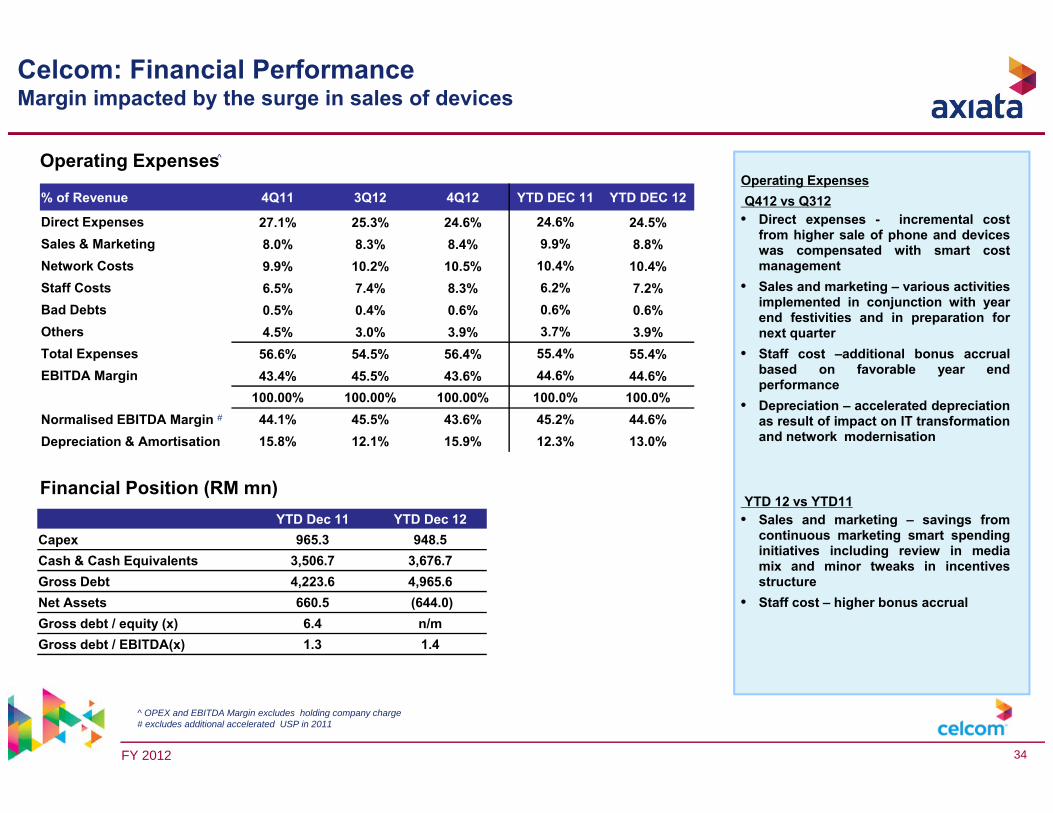
% of Revenue 4Q11 3Q12 4Q12 YTD DEC 11 YTD DEC 12
Direct Expenses 27.1% 25.3% 24.6% 24.6% 24.5%Sales & Marketing 8.0% 8.3% 8.4% 9.9% 8.8%Network Costs 9.9% 10.2% 10.5% 10.4% 10.4%Staff Costs 6.5% 7.4% 8.3% 6.2% 7.2%Bad Debts 0.5% 0.4% 0.6% 0.6% 0.6%Others 4.5% 3.0% 3.9% 3.7% 3.9%Total Expenses 56.6% 54.5% 56.4% 55.4% 55.4%EBITDA Margin 43.4% 45.5% 43.6% 44.6% 44.6%
100.00% 100.00% 100.00% 100.0% 100.0%Normalised EBITDA Margin 44.1% 45.5% 43.6% 45.2% 44.6%Depreciation & Amortisation 15.8% 12.1% 15.9% 12.3% 13.0%
Operating Expenses
Financial Position (RM mn)
^ OPEX and EBITDA Margin excludes holding company charge# excludes additional accelerated USP in 2011
Celcom: Financial PerformanceMargin impacted by the surge in sales of devices
#
^
YTD Dec 11 YTD Dec 12Capex 965.3 948.5 Cash & Cash Equivalents 3,506.7 3,676.7 Gross Debt 4,223.6 4,965.6 Net Assets 660.5 (644.0)Gross debt / equity (x) 6.4 n/mGross debt / EBITDA(x) 1.3 1.4
Operating Expenses Q412 vs Q312• Direct expenses - incremental cost
from higher sale of phone and deviceswas compensated with smart costmanagement
• Sales and marketing – various activitiesimplemented in conjunction with yearend festivities and in preparation fornext quarter
• Staff cost –additional bonus accrualbased on favorable year endperformance
• Depreciation – accelerated depreciationas result of impact on IT transformationand network modernisation
YTD 12 vs YTD11• Sales and marketing – savings from
continuous marketing smart spendinginitiatives including review in mediamix and minor tweaks in incentivesstructure
• Staff cost – higher bonus accrual

FY 2012 35
Broadband PerformanceSolid growth boost by the increasing take up of bundling offerings and prepaid subscription, fueled by the emergent usage of smart phone
937 947994
1,0281,047
937
1,047
65 63 63 60 6066
61
4Q11 1Q12 2Q12 3Q12 4Q12 YTD 11 YTD 12Subs ARPU
200 215 225 239 249
770
927
4Q11 1Q12 2Q12 3Q12 4Q12 YTD 11 YTD 12
REVENUE (RM Mn) SUBSCRIBERS * ( ‘000)
+ 25% + 12%
* Subscribers and ARPU are based on postpaid monthly unlimited plan only
+ 2%+4%
+ 20% + 12%

FY 2012 36
96 96 95 93 92 94 94
37 37 37 38 36 36 36
51 51 51 51 49 50 50
0
10
20
30
40
50
60
020406080
100120140160180
4Q11 1Q12 2Q12 3Q12 4Q12 YTD 11 YTD 12
Postpaid Prepaid Blended
2,732 2,780 2,837 2,851 2,879
9,247 9,171 9,195 9,540 9,802
4Q11 1Q12 2Q12 3Q12 4Q12Postpaid Prepaid
Celcom: Operational PerformanceARPU remained consistent albeit intensified market competition
Subscribers (000’s) ARPU (RM)
• Prepaid continue to regain traction indicated by thepositive response towards X2 and new Celcom Firstwhilst postpaid mainly from data plan
11,952 12,391 12,68112,031Total Subs 11,980
+2%
Net Adds
+6%
MOU/sub (min)
Prepaid-28-76
48Postpaid
360346
14
290262
28
542498
43
7923
56
366 371 403 371310
361 363
194 212 227 238200 176
219
228244
263 270
223 212249
209212 217
231
203220
4Q11 1Q12 2Q12 3Q12 4Q12 YTD 11 YTD 12Postpaid PrepaidBlended (inc domestic roaming) Blended (exc domestic roaming)

FY 2012 37
4,917 4,925 5,315 5,664 5,375
18,468 21,278
4Q11 1Q12 2Q12 3Q12 4Q12 YTD 11 YTD 12
646 667 794 734 570
2,830 2,765
4Q11 1Q12 2Q12 3Q12 4Q12 YTD 11 YTD 12
PATAMI
2,319 2,391 2,545 2,505 2,304
9,348 9,745
4Q11 1Q12 2Q12 3Q12 4Q12 YTD 11 YTD 12EBITDA
EBITDA (Rp bn) & Margins (%) *+ 9%
* (1) Revenue has been restated to reflect changes in Audited Financial Statement which VAS revenue using net basis(2) Normalisation EBITDA exclude provision for severance payment(3) Normalisation PAT – excludes unrealized forex transaction, provision for severance payment and accelerated depreciation
Revenue (Rp bn) & Data as % of revenue (%)* -1% (Normalized -3%)
- 8%- 5%
-22% (normalized -24%)*
49% 43%47% 44%48%
XL: Financial Performance Strong YoY Revenue growth with positive performance across all services
• XL closed the year of 2012 with strong growth YoYand positive growth in all services. Data growthremain strong at 50% YoY, while Voice and SMS grew6% and 16% respectively.
• Focus on data execution, XL has successfully rolledout 11,179 BTS in 2012 with 74% were 3G Node Bs,bringing total node B to 13,142 by year end.
• Normalized net income in FY11 and FY12 were Rp3.2trillion and Rp2.9 trillion respectively.
Adv. Data (excl. SMS)* 19%17%16% 17% 18%
-12% (normalized -22%)*
+ 15% 4% (Normalized 1%)
15% 17%
46%51%
-2% (normalized -9%)*
PAT (Rp bn)*

FY 2012 38
FY 11 FY 12
CAPEX (Capitalized) 7,052 9,036 Cash & Cash Equivalents 998 792 Gross Debt 10,726 13,520 Net Assets 13,693 15,370 Net debt / equity (x) 0.7 0.8 Net debt / EBITDA (x) 1.0 1.3
Operating Expenses
Financial Position (Rp bn)
% of Revenue 4Q 11 3Q 12 4Q 12 FY 11 FY 12Direct Expenses 11.3% 16.0% 17.3% 10.9% 14.6%Sales & Marketing 7.9% 6.2% 6.9% 6.7% 6.1%Network Costs 22.7% 24.9% 23.5% 20.9% 24.5%Staff Costs 6.0% 3.7% 4.7% 6.5% 4.4%Bad Debts 0.1% 0.2% 0.3% 0.1% 0.2%Others 3.7% 3.3% 2.8% 3.2% 3.2%Total Expenses 51.7% 54.2% 55.3% 48.3% 52.8%EBITDA Margin 47.2% 44.2% 42.9% 50.6% 45.8%Depreciation & Amortisation 23.6% 22.7% 24.3% 25.4% 23.8%
XL: Financial PerformanceMargins in 4Q12 impacted by SMS interconnect & changes in revenue mix
Operating Expenses • Direct expense increased YoY
and QoQ mainly due to SMSinterconnection charges whichstarted in Jun’12.
• Sales & Marketing increased dueto higher sales commission dueto higher sales of starter packand reload.
• Network cost increased YoYmainly due to higher rentalexpense related to continuousdeployment in datainfrastructure
• Lower Staff cost related totransfer of employees tomanaged service partner
• Bad debt increased due toallowance made related to towerleasing.

FY 2012 39
306 313 328 341 355
46,053 46,128 45,525 41,997 45,395
4Q11 1Q12 2Q12 3Q12 4Q12Postpaid Prepaid
XL: Operational PerformanceXL’s efforts to improve position in the market showed positive traction
Subscribers (000’s) ARPU (Rp thousand )*
245 220
196 182 188 190 197
4Q11 1Q12 2Q12 3Q12 4Q12 YTD 11 YTD 12
• Stable blended ARPU whilst increase in MOU due toactions taken to improve XL’s relative positioning inmarket.
• XL’s data subs has now reached 56% of total subs,increased from 55% a year ago
45,853 45,75046,359 42,339Total Subs 46,441
8%
Net Adds
-1%
Outgoing MOU/sub (minutes)
-588 3,4112,923 82 -3,515
168 155 147 141 139
179
145
29 28 30 32 32 30 31 30 29 31 33 33 31 31
4Q11 1Q12 2Q12 3Q12 4Q12 YTD 11 YTD 12
Postpaid Prepaid Blended
* (1) Revenue has been restated to reflect changes in Audited Financial Statement which VAS revenue using net basis

FY 2012 40
4,733 4,531 4,711 4,929 4,382
16,448 18,554
‐
2,000
4,000
6,000
8,000
10,000
12,000
14,000
16,000
18,000
20,000
4Q 11 1Q 12 2Q 12 3Q 12 4Q 12 FY 2011 FY 2012
34%40% 35% 33%
33%36%
29%
1,339
(531)
879
4,745
929
4,888 6,021
4Q 11 1Q 12 2Q 12 3Q 12 4Q 12 FY 2011 FY 2012
11,949 12,855 14,066 14,447 14,978
45,412
56,345
4Q 11 1Q 12 2Q 12 3Q 12 4Q 12 FY 2011 FY 2012
+4%
Revenue1 (SLR mn) EBITDA (SLR mn) & margins (%)
PAT (SLR mn)
Dialog Group: Financial Performance
+13%
+23% (Normalised +29%) -31% (Normalised +21%)
+25%
Strong performance in all FY12 financial metrics driven by significant revenue increaseYTD PAT improved significantly due to higher EBITDA; Normalised PAT up 29% YTD
Revenue increased by 4% QoQ and 24% YTD. Group Revenue grewfor the fifteenth consecutive quarter driven by growth in Mobileand International revenue
YTD EBITDA and PAT increased by 13% and 23% respectively dueto higher revenue. FY12 PAT performance includes a forex loss ofRs2.4bn compared to a forex loss of Rs506mn in FY 11
Q4 EBITDA impacted by one- off costs related to modernisation ofthe company’s expansive service centre network (Rs470mn) andhigher marketing spend. Profitability further impacted byimpairment charges of Rs 931mn due to modernisation andupgrade of legacy network elements to match latest technologystandards
Normalised PAT grew by 29% YTD on the back of EBITDAimproving by Rs 2.8bn
+24%
-11%
-7%
-80% (Normalised -0.3%)
• FY 12 : Normalised for the translational forex loss (Rs 2,176mn), acquisition related expenses (Rs343Mn) and deferred tax reversal of Rs 2,277mn• Q4 : Normalised for one-off costs of Rs470mn, impairment charge of Rs931mn and the translational forex gain (Rs 315mn)
1 DBN Revenue being reclassified to be in line with Group classifications
FY 2012 41
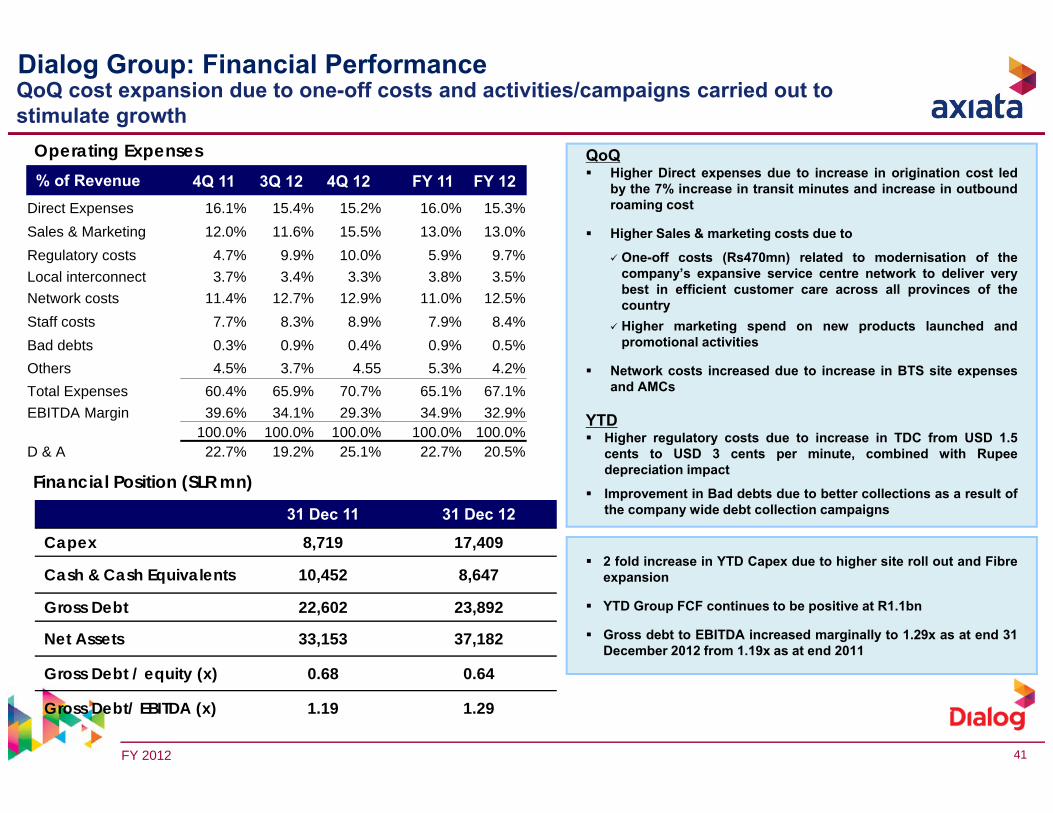
QoQ cost expansion due to one-off costs and activities/campaigns carried out to stimulate growth
Operating Expenses
Dialog Group: Financial Performance
Financial Position (SLR mn)
31 Dec 11 31 Dec 12
Capex 8,719 17,409
Cash & Cash Equivalents 10,452 8,647
Gross Debt 22,602 23,892
Net Assets 33,153 37,182
Gross Debt / equity (x) 0.68 0.64
Gross Debt/ EBITDA (x) 1.19 1.29
% of Revenue 4Q 11 3Q 12 4Q 12 FY 11 FY 12Direct Expenses 16.1% 15.4% 15.2% 16.0% 15.3%Sales & Marketing 12.0% 11.6% 15.5% 13.0% 13.0%Regulatory costs 4.7% 9.9% 10.0% 5.9% 9.7%Local interconnect 3.7% 3.4% 3.3% 3.8% 3.5%Network costs 11.4% 12.7% 12.9% 11.0% 12.5%Staff costs 7.7% 8.3% 8.9% 7.9% 8.4%Bad debts 0.3% 0.9% 0.4% 0.9% 0.5%Others 4.5% 3.7% 4.55 5.3% 4.2%Total Expenses 60.4% 65.9% 70.7% 65.1% 67.1%EBITDA Margin 39.6% 34.1% 29.3% 34.9% 32.9%
100.0% 100.0% 100.0% 100.0% 100.0%D & A 22.7% 19.2% 25.1% 22.7% 20.5%
QoQ Higher Direct expenses due to increase in origination cost led
by the 7% increase in transit minutes and increase in outboundroaming cost
Higher Sales & marketing costs due to
One-off costs (Rs470mn) related to modernisation of thecompany’s expansive service centre network to deliver verybest in efficient customer care across all provinces of thecountry
Higher marketing spend on new products launched andpromotional activities
Network costs increased due to increase in BTS site expensesand AMCs
YTD Higher regulatory costs due to increase in TDC from USD 1.5
cents to USD 3 cents per minute, combined with Rupeedepreciation impact
Improvement in Bad debts due to better collections as a result ofthe company wide debt collection campaigns
2 fold increase in YTD Capex due to higher site roll out and Fibreexpansion
YTD Group FCF continues to be positive at R1.1bn
Gross debt to EBITDA increased marginally to 1.29x as at end 31December 2012 from 1.19x as at end 2011
FY 2012 42
869 909 830
964 1,004
6,320 6,464 6,495 6,605 6,821
4Q 11 1Q 12 2Q 12 3Q 12 4Q 12
Postpaid Prepaid
7,189 7,373 7,432
339 346 350 358 354325
352
‐
20
40
60
80
100
120
140
160
180
200
220
240
260
280
300
320
340
360
380
400
4Q 11 1Q 12 2Q 12 3Q 12 4Q 12 FY 2011 FY 2012
Blended
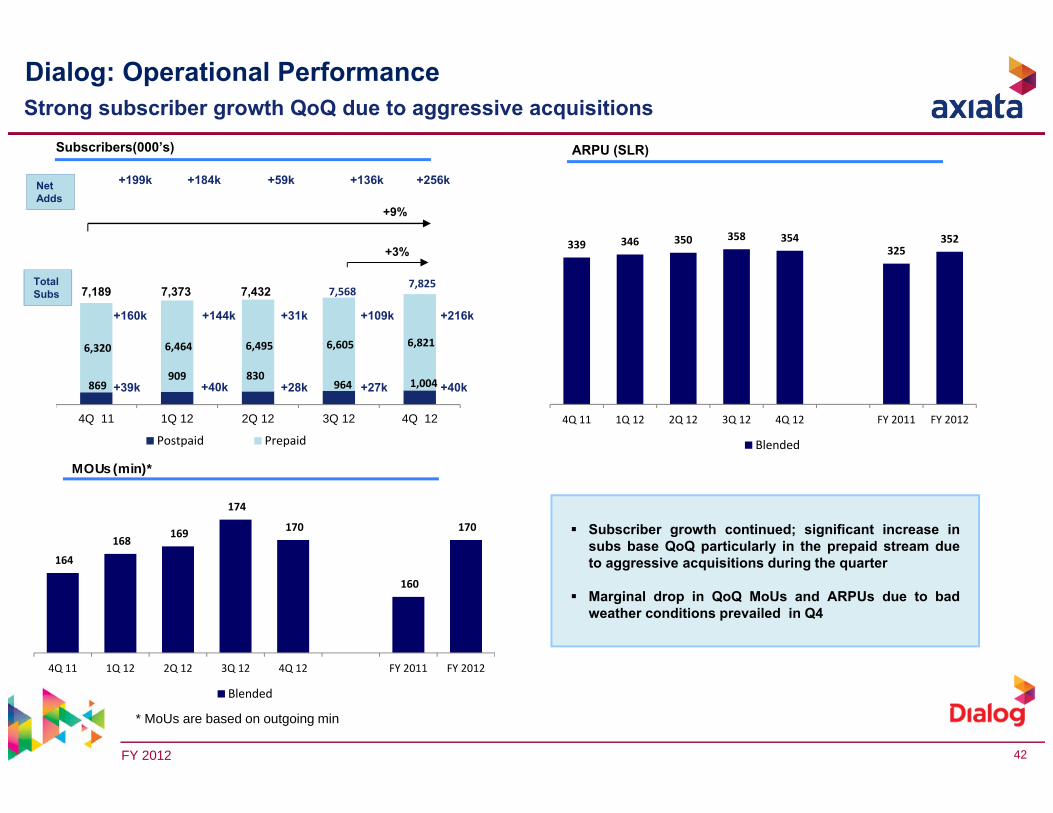
Dialog: Operational Performance
Subscribers(000’s)
+3%
+9%
ARPU (SLR)
MOUs (min)*
* MoUs are based on outgoing min
Strong subscriber growth QoQ due to aggressive acquisitions
Total Subs
Net Adds
+184k
164
168 169
174
170
160
170
150
155
160
165
170
175
4Q 11 1Q 12 2Q 12 3Q 12 4Q 12 FY 2011 FY 2012
Blended
+136k
+27k
+109k
Subscriber growth continued; significant increase insubs base QoQ particularly in the prepaid stream dueto aggressive acquisitions during the quarter
Marginal drop in QoQ MoUs and ARPUs due to badweather conditions prevailed in Q4
+160k
+39k
+199k
+144k
+40k
+59k
+28k
+31k
7,568
+256k
+40k
+216k
7,825
FY 2012 43
561
97 259
606
1,1751,500
2,136
-706
116 207
-660
1,249
-827
911
4Q 11 1Q 12 2Q 12 3Q 12 4Q 12 YTD 11 YTD 12
3,756 4,663
14,490
2,603 2,827 3,2444,285
1,938
9,576
12,295
4Q 11 1Q 12 2Q 12 3Q 12 4Q 12 YTD 11 YTD 12
33.7%8,174 8,936 9,627 10,146 10,243
30,684
38,953
4Q 11 1Q 12 2Q 12 3Q 12 4Q 12 YTD 11 YTD 12
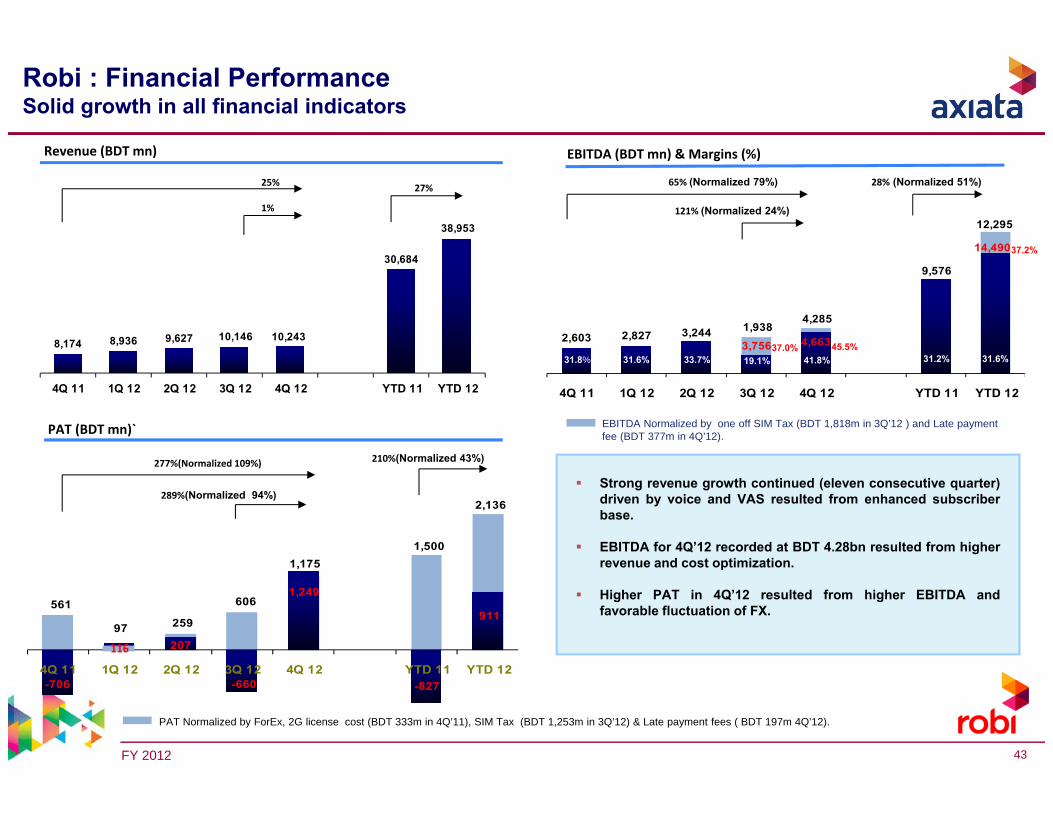
Robi : Financial PerformanceSolid growth in all financial indicators
Revenue (BDT mn) EBITDA (BDT mn) & Margins (%)
PAT (BDT mn)`
1%
25%
277%(Normalized 109%)
289%(Normalized 94%)
121% (Normalized 24%)
65% (Normalized 79%)
31.6%31.6% 41.8%31.8%
28% (Normalized 51%)27%
19.1% 31.2%
210%(Normalized 43%)
PAT Normalized by ForEx, 2G license cost (BDT 333m in 4Q’11), SIM Tax (BDT 1,253m in 3Q’12) & Late payment fees ( BDT 197m 4Q’12).
Strong revenue growth continued (eleven consecutive quarter)driven by voice and VAS resulted from enhanced subscriberbase.
EBITDA for 4Q’12 recorded at BDT 4.28bn resulted from higherrevenue and cost optimization.
Higher PAT in 4Q’12 resulted from higher EBITDA andfavorable fluctuation of FX.
EBITDA Normalized by one off SIM Tax (BDT 1,818m in 3Q’12 ) and Late payment fee (BDT 377m in 4Q’12).
37.0% 45.5%
37.2%
116

FY 2012 44
Operating Expenses
Financial Position (BDT mn)
31 Dec 11 31 Dec 12
Capex 14,922 8,150
Cash & Cash Equivalents 1,931 4,649
Gross Debt 27,014 14,659
Net Assets 14,452 32,940
Gross debt / Equity (x) 1.87 0.45
Gross debt / EBITDA (x) 2.82 1.19
Robi : Financial PerformanceOperational efficiency improved cost structure
QoQ:
Lower direct expenses as we had materializedSIM Tax of 2006-2007 BDT 1,818m in Sep’12.
Higher sales & marketing cost driven by EIDand Puja TV commercials for the intensity of thecompetition.
Network cost increased for the increase in nosof network sites along with the revised tariff forpower and electricity w.e.f. Sep’12.
Others includes an one off late payment chargeto BTRC BDT 377M.
YoY Higher direct expenses resulted from the
materialization of SIM Tax of 2006-2007 BDT1,818m along with higher lifting and higherrevenue sharing .
Sales & Marketing expenses decreased mainlyfor A&P optimization.
% of Revenue 4Q 11 3Q 12 4Q 12 YTD 11 YTD 12
Direct Expenses 37.8% 56.7% 27.9% 38.8% 42.1%Sales & Marketing 7.3% 3.8% 4.2% 6.8% 4.1%Network Costs 11.2% 9.6% 11.2% 10.8% 10.3%Staff Costs 5.2% 5.2% 5.8% 6.1% 5.5%Bad Debts 0.0% 0.0% 0.0% 0.0% 0.0%Others 6.7% 5.6% 9.0% 6.2% 6.4%Total Expenses 68.2% 80.9% 58.2% 68.8% 68.4%
EBITDA Margin 31.8% 19.1% 41.8% 31.2% 31.6%100.0% 100.0% 100.0% 100.0% 100.0%
D & A 20.4% 17.8% 18.1% 19.6% 18.5%
Financial Position:
Scheduled repayment and lower capeximproved debt position.

FY 2012 45
23,100 25,559 27,916 30,166 30,924
154 172 196 218 252
23,254 25,731 28,112 30,383 31,176
4Q 11 1Q 12 2Q 12 3Q 12 4Q 12Prepaid Postpaid
866k 1,525k 1,547k 1,590k 238k
512 529572
673
558 529583
169 172 168 163 156 175 165
172 175 172 168 160178
169
4Q 11 1Q 12 2Q 12 3Q 12 4Q 12 YTD 11 YTD 12
Postpaid Prepaid Blended
ARPU (BDT)
MOU/sub (min)
Robi : Operational PerformanceContinued subscriber growth….
+34%
Subscribers (000’s)
+3%
+204k+853k +1,569k
+22k +34k+13k
Net Adds
TotalSubs
+1,507k
+18k
Note: ARPU, MoU/Sub are based on active subscriber base. Total Subs means sold subscribers to date.
334 376452
649
452 348
482
161 171 169 156 141 161 159
163173 172
161144
163 163
4Q 11 1Q 12 2Q 12 3Q 12 4Q 12 YTD 11 YTD 12Postpaid Prepa id Blended
Implementation of post activation process for prepaid segmentfrom Oct’12 resulted lower activation and/or lower Net Adds.
Lower chargeable MOU along with the higher subscriber basereduced the ARPU QoQ.
+24k
+1,523k

FY 2012 46
Latelz and Hello are currently at #2 and #4 positions based on subscriber market share
Latelz and Hello have more than doubled their market shares since June 2010
Latelz has strong momentum and extensive network and sales reach
_________________Sources: Third‐party research(1) Number inclusive of Applifone in both June 2010 and June 2012. “Smart Mobile” is the brand name of Latelz
Market Position
Highly competitive market with 8 operators – Only Latelz, Hello and Metfone increased their market share over the past 2 years
% Change in Market Share (June 2010 to June 2012)
-44%
104%139%
9%
-69%
3%
-38%-17%
Metfone Beeline Excell QB Mobitel Mfone
#1 #2 #3 #4 #5 #6 #7 #8Ranking
(1)
Hello and Smart are the top performers in the market
June 2012June 2010
35%
2%7%
2% 1%
19%13%
21%
Metfone Mobitel Hello Beeline Mfone QB Excell
#1 #2 #3 #4 #5 #6 #7 #8
(1)
33%
8% 7%4%
1%
33%
6%9%
Mobitel Metfone Mfone Beeline Hello QB Excell
#1 #2 #3 #4 #5 #6 #7 #8
(1)
Market Position
FY 2012 47
35%
19%
7%
2% 2%1%
21%
13%
34%
Metfone Mobitel Beeline Mfone QB Excell
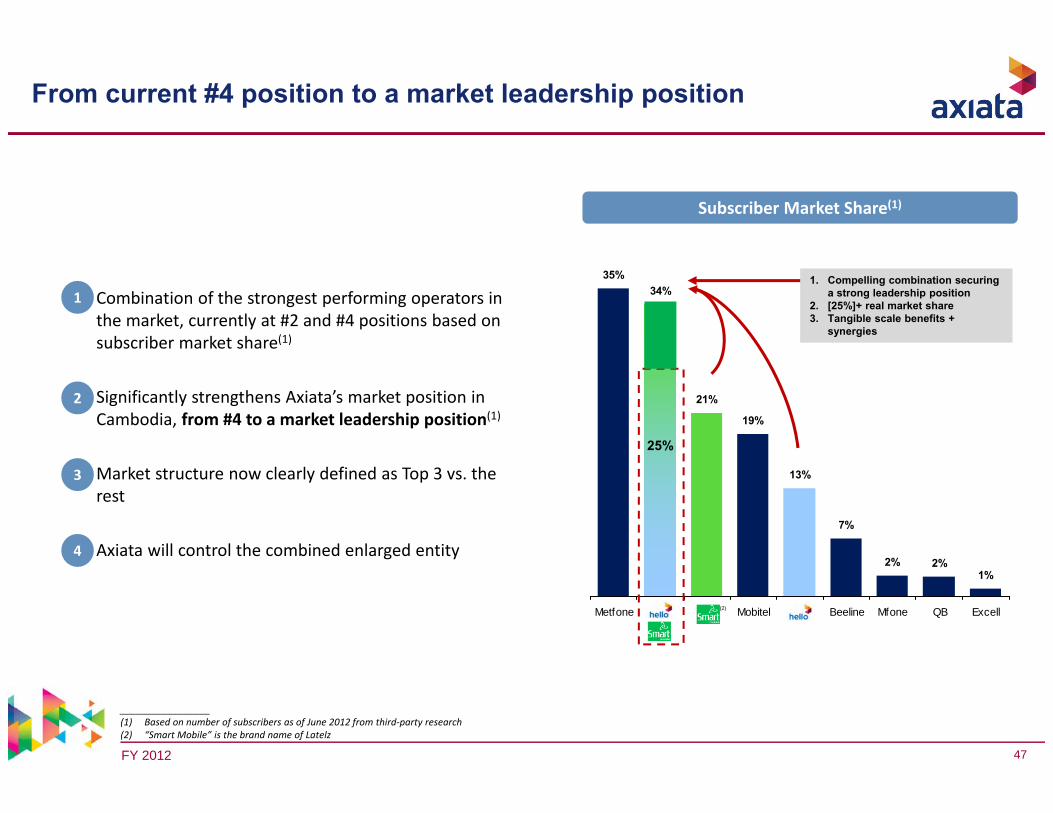
Combination of the strongest performing operators in the market, currently at #2 and #4 positions based on subscriber market share(1)
Significantly strengthens Axiata’s market position in Cambodia, from #4 to a market leadership position(1)
Market structure now clearly defined as Top 3 vs. the rest
Axiata will control the combined enlarged entity
Subscriber Market Share(1)
_________________(1) Based on number of subscribers as of June 2012 from third‐party research(2) “Smart Mobile” is the brand name of Latelz
(2)
1. Compelling combination securing a strong leadership position
2. [25%]+ real market share3. Tangible scale benefits +
synergies
1
2
3
4
25%
From current #4 position to a market leadership position

FY 2012 48
Overview of combined businessSmart / Hello side-by-side analysis
Key Operating Metrics Key Financial Metrics
Subs
Total Outgoing MOUs (mm)
Blended ARPU(U$)
BTS (2G)
Revenue(US$mm)(1)
EBITDA(US$mm)(1)
Capex(US$mm)(1)
PAT(US$mm)(1)
3,706,800
5,610,000
2011
1H12
305
387
2011
1H12
4.45
3.74
2011
1H12
1261
1388
2011
1H12
68.3
45.1
2011
1H12
1.4
7.3
2011
1H12
20.0
11.8
2011
1H12
(32.0)
(4.0)
2011
1H12
(1) Latelz 2011 numbers based on audited financials; 1H2012 numbers based on unaudited Latelz management reports; Hello numbers based on Company financials

FY 2012 49
Latelz has operated under its main “Smart Mobile” brand name since 2004– Acquired Applifone (“StarCell” brand) in December 2010
from TeliaSonera with integration completed in approximately 6 months More than doubled its subscriber market share since January 2011 Latelz’ key operating model features:
– Low cost model with stringent capex management– High impact brand, reach and network– Aggressive in targeted markets and tariffs
Latelz’ superior license conditions:– 25 year period vs. Hello’s BTO status; more favourable license fee
structure Latelz currently owns:
– GSM license with 15MHz (GSM1800) and 3.6MHz (GSM900)– 3G license with 10MHz (UMTS2100), ISP license with 70MHz (WiMAX)
Approximately 350 employees with an industry leading revenue/employee
– Close competitor for #1 position in terms of subscriber market share(1)
– More than 2x network coverage
– More than 2x MOUs
– More than 2x revenues
– Strong and complementary spectrum position
– Enhanced nationwide points of sales
– Brand complementarity
Latelz Highlights Significant Positive Impact on Axiata’s Position
Tangible Synergies Rationale for Synergies
Remove Duplication Marketing, sales, service points, human resources, general & administrative – rationalize to achieve target cost ratios
Network Optimization Cost reduction based on best practices from both companies
Enhanced Revenue Potential Improved pricing power, lower competitive intensity, higher on-net traffic, optimized tariff plans for increased scale
_________________(1) Based on number of subscribers as of June 2012 from third‐party research
Driving scale benefits and tangible synergies

FY 2012 50
HIGHLIGHTSCOMPANY
Regional Mobile: Performance Highlights
Strong take-up of smartphone plans with tiered data bundles.
Revenue EBITDA PAT
EBITDARevenue Subs PAT5%
QUARTER ON QUARTER PERFORMANCE
Note: Idea and wholly owned subsidiaries on a consolidated basis.
Higher revenue driven by increase in voice and data usage, including IDD and inbound roaming.
EBITDARevenue Subs PAT
29% 2% 15% 14%
5%
70% 67%3%
1% 4%
6%
Subs
Concluded 1800MHz spectrum auction in November 2012, winning back spectrum in all 7 affected service areas

FY 2012 51
HIGHLIGHTSCOMPANY
Regional Mobile: Performance Highlights
Innovative plans to attract and retain customers, including recharge offers and data bundles
Smartphones now account for 75% of total postpaid customer base
Revenue Subs EBITDA PAT
EBITDARevenue Subs PAT7%
EBITDA7%Revenue Subs PAT16%
YEAR TO DATE on YEAR TO DATE PERFORMANCE
16%
92%6%
Note: Idea and wholly owned subsidiaries on a consolidated basis.
45%
27% 68%>100%
5% 3% 11%1%
Continues to invest and strengthen its data services to support growing data take-up rate
company confidential52
Thank You
www.axiata.com
Axiata Group Berhad