fy 2010 statistical year book - department of justice
TRANSCRIPT

U.S. Department of JusticeExecutive Office for Immigration Review
FY 2010Statistical Year Book
Prepared by the Office of Planning, Analysis, & TechnologyJanuary 2011
Contact InformationOffice of Legislative and Public Affairs
5107 Leesburg Pike, Suite 1902Falls Church, VA 22041
(703) 305-0289(703) 605-0365 (fax)
DISCLAIMER
The Statistical Year Book has been prepared as a public service by the Executive Office for Immigration Review (EOIR) andis strictly informational in nature. In no way should any information in the Year Book, in whole or in part, be regarded as legal adviceor authority, or be understood in any way to enlarge upon, or otherwise modify or interpret, any existing legal authority, including, butnot limited to, the Immigration and Nationality Act and Title 8 of the Code of Federal Regulations.
The Statistical Year Book is updated annually. The legend at the bottom of each page reflects the last revision date for thatpage. Yearly updates are available electronically through the EOIR website at www.justice.gov/eoir.

FY 2010 STATISTICAL YEAR BOOKTABLE OF CONTENTS
Tab
FY 2010 Highlights A
Immigration Courts:Total Matters Received and Completed B Proceedings Received and Completed by Type C Proceedings Completed by Disposition D Proceedings Completed by Nationality EProceedings Completed by Language F Proceedings Completed by Representation Status G Failures to Appear H Asylum Cases Received and Completed I Asylum Grants by Nationality J Disposition of Asylum Cases K Expedited Asylum Cases LConvention Against Torture MProceedings Completed with Applications for Relief NProceedings Completed for Detained Cases OInstitutional Hearing Program Case Processing PImmigration Judge Grants of Voluntary Departure QApplications for Relief other than Asylum R
Board of Immigration Appeals:Total Cases Received and Completed SCases Received and Completed by Type TImmigration Judge Decision Appeals Completed by Nationality UImmigration Judge Decision Appeals Completed by Representation Status VImmigration Judge Decision Appeals Completed for Detained Cases W
Immigration Courts and Board of Immigration Appeals:Immigration Judge Decisions (Proceedings) Appealed X
Pending Caseload Y
Office of the Chief Administrative Hearing Officer:Total Cases Received and Completed Z
Appendix: Glossary of Terms

ii
FY 2010 STATISTICAL YEAR BOOKLIST OF FIGURES AND TABLES
PageList of Figures:Figure 1 - Total Immigration Court Matters Received and Completed B2 Figure 2 - Immigration Court Matters Received by Type B7 Figure 3 - Immigration Court Matters Completed by Type B7 Figure 4 - Immigration Judge Proceedings Completed by Completion Type D1 Figure 5 - Immigration Judge Decisions by Disposition D2 Figure 6 - FY 2010 Court Proceedings Completed by Nationality E1 Figure 7 - FY 2006 Court Proceedings Completed by Language F1 Figure 8 - FY 2010 Court Proceedings Completed by Language F1 Figure 9 - Court Proceedings Completed: Percentage of Represented Cases G1 Figure 10 - Failure to Appear Rates H1 Figure 11 - Failure to Appear Rates for Never Detained Aliens H2 Figure 12 - Failure to Appear Rates for Released Aliens H3 Figure 13 - Immigration Court Asylum Receipts: Affirmative and Defensive I1 Figure 14 - Asylum Cases: Receipts and Completions I2 Figure 15 - FY 2010 Asylum Grants by Nationality J1 Figure 16 - Immigration Courts: Asylum Grant Rate K1 Figure 17 - Immigration Courts: Affirmative Grant Rate K2 Figure 18 - Immigration Courts: Defensive Grant Rate K2 Figure 19 - Asylum Completions by Disposition K3Figure 19A - Immigration Courts: Withholding of Removal Grant Rate K4Figure 19B - Immigration Courts: Asylum or Withholding of Removal
Grant Rate K5Figure 20 - Expedited Asylum Receipts Compared to Total Asylum Receipts L1 Figure 21 - Expedited Asylum Receipts and Completions L2 Figure 22 - Immigration Court Proceedings: Percent Completions with
Applications N1 Figure 23 - Immigration Court Proceedings Completed: Detained and Total O1 Figure 24 - IHP Cases Received and Completed P1 Figure 25 - Total BIA Cases Received and Completed S1 Figure 26 - BIA Receipts by Type of Appeal S2 Figure 27 - BIA Completions by Type of Appeal S2 Figure 28 - FY 2010 BIA Completions by Nationality U1 Figure 29 - IJ Appeal Decisions: Percentage of Represented Cases V1 Figure 30 - IJ Case Appeal Decisions: Detained and Total W1 Figure 31 - Immigration Judge Decisions (Proceedings) Appealed X1 Figure 32 - Immigration Court Pending Proceedings by Year Received Y1Figure 33 - BIA Pending Cases by Year Filed Y2Figure 34 - OCAHO Cases Received and Completed Z1

iii
FY 2010 STATISTICAL YEAR BOOKLIST OF FIGURES AND TABLES
Page
List of Tables:Table 1 - Total Immigration Court Matters Received by Court for
FY 2009 and FY 2010 B3Table 1A - Total Immigration Court Receipts by Court and Type of Matter for
FY 2010 B4Table 2 - Total Immigration Court Matters Completed by Court for
FY 2009 and FY 2010 B5 Table 2A - Total Immigration Court Completions by Court and Type of Matter for
FY 2010 B6Table 3 - Immigration Court Proceedings Received by Case Type C3 Table 4 - Immigration Court Proceedings Completed by Case Type C4 Table 5 - Court Proceedings Completed by Nationality: Top 25
Nationalities for FY 2006 – FY 2010 E2 Table 6 - Asylum Receipts and Completions by Court for FY 2010 I3Table 7 - Asylum Grants By Nationality: Top 25 Nationalities for
FY 2006 – FY 2010 J2 Table 8 - FY 2010 Asylum Grant Rate by Immigration Court K6 Table 9 - FY 2010 Convention Against Torture Cases by Disposition M1 Table 10 - FY 2010 Convention Against Torture Completions by Court M2 Table 11 - FY 2010 Immigration Court Completions (Proceedings) With
Applications for Relief N2 Table 12 - FY 2010 Immigration Court Completions (Proceedings) for
Detained Cases O3 Table 13 - IHP Completions by Disposition P2 Table 14 - IJ Removal Decisions Compared to Voluntary Departure Decisions Q1 Table 15 - Grants of Relief R3 Table 16 - BIA Receipts by Type T2 Table 17 - BIA Completions by Type T2 Table 18 - IJ Decision Appeals Completed by Nationality: Top 25
Nationalities for FY 2006 – FY 2010 U2 Table 19 - Breakdown of BIA Detained Completions W2

Executive Office for Immigration Review Office of Planning, Analysis, and TechnologyFY 2010 Statistical Year Book January 2011A1
FY 2010 HIGHLIGHTS
! Immigration court receipts increased by 12 percent between FY 2006(351,051) and FY 2010 (392,888). (Figure 1, Page B2)
! Immigration court completions decreased by four percent between FY 2006(366,080) and FY 2010 (353,247). However, completions in FY 2010increased by seven percent from FY 2007. (Figure 1, Page B2)
! Mexico, Guatemala, El Salvador, Honduras, and China were the leadingnationalities of immigration court completions during FY 2010, representing67 percent of the total caseload. (Figure 6, page E1)
! Spanish was the most frequently spoken language for immigration courtcase completions during FY 2010 at over 66 percent. (Figure 8, page F1)
! Forty-three percent of aliens whose cases were completed in immigrationcourts during FY 2010 were represented. (Figure 9, page G1)
! Asylum applications filed with the immigration courts decreased by 42
percent from FY 2006 to FY 2010. Affirmative receipts decreased by 35percent while defensive receipts decreased by 56 percent. (Figure 13,page I1)
! In FY 2010, the New York, NY; Los Angeles, CA; San Francisco, CA;Miami, FL; and Orlando, FL, immigration courts received 62 percent of thetotal asylum applications filed with the courts. (Table 6, page I3)
! Four nationalities were among the top 10 nationalities granted asylum eachyear during the five-year period FY 2006-10: China, Colombia, India, andEthiopia. (Table 7, page J2)
! The grant rate for asylum applications was 51 percent in FY 2010. Thegrant rate was 61 percent for affirmative applications and 35 percent fordefensive applications. (Figures 16, 17, and 18, pages K1 and K2)
! In FY 2010, the percentage of asylum cases in which either asylum orwithholding of removal was granted was 60 percent. (Figure 19-B, pageK5)
! In FY 2010, 25 percent of proceedings completed at the immigration courtshad an application for relief. (Figure 22, page N1)
! Forty-four percent of FY 2010 immigration court completions involveddetained aliens. (Figure 23, page O1)

Executive Office for Immigration Review Office of Planning, Analysis, and TechnologyFY 2010 Statistical Year Book January 2011A2
! The number of appeals to the BIA from IJ Decisions is down for the fifthconsecutive year. (Figure 26, page S2)
! Receipts of appeals of DHS decisions increased 99 percent from FY 2009to FY 2010. Receipts of appeals from DHS decisions on visa petitionsincreased 115 percent for the same time period. (Figure 26, page S2;Table 16, page T2)
! BIA had a 10 percent decrease in receipts between FY 2006 (39,743) andFY 2010 (35,787). (Table 17, page T2)
! Mexico, China, El Salvador, Guatemala, and Haiti accounted for 56 percentof BIA immigration judge decision appeals completed in FY 2010. (Figure28, page U1)
! Seventy-nine percent of BIA appeals completed in FY 2010 were forrepresented aliens. (Figure 29, page V1)
! In FY 2010, eight percent of immigration judge decisions were appealed tothe BIA. (Figure 31, page X1)
! OCAHO case receipts increased from FY 2009 (31) to FY 2010 (91). (Figure 34, page Z1)
! OCAHO case completions increased from FY 2009 (25) to FY 2010 (53). (Figure 34, page Z1)

Executive Office for Immigration Review Office of Planning, Analysis, and TechnologyFY 2010 Statistical Year Book January 2011 B1
Immigration Courts:Total Matters Received and Completed
An alien charged by the Department of Homeland Security (DHS) with a violationof immigration law is issued a charging document. The most common chargingdocuments are the Notice to Appear (NTA) and the Notice of Referral to immigrationjudge. When the charging document is filed by DHS with the immigration court,jurisdiction over the case transfers from DHS to the Executive Office for ImmigrationReview (EOIR), which has oversight over the immigration courts located throughout theUnited States. Once an alien has been ordered removed by EOIR, DHS carries out theremoval. EOIR does not maintain statistics on alien removals from the United States.
During court proceedings, aliens appear before an immigration judge and eithercontest or concede the charges against them. In some instances, the immigration judgeadjourns the case and sets a continuance date; for example, the judge may allow thealien time to obtain representation or to file an application for relief. After hearing acase, the immigration judge renders a decision. The immigration judge may order thealien removed, or may grant relief such as cancellation of removal, asylum, adjustmentof status, etc. If the immigration judge decides that removability has not beenestablished by DHS, he or she may terminate the proceedings.
In addition to proceedings, immigration judges consider other matters such asbonds and motions.
• Bond redetermination hearings are held when an alien in custody seeksrelease on his or her own recognizance, or seeks a reduction in the amount ofbond. In some cases, bond redetermination hearings are held before EOIRreceives the charging document from DHS. During bond redeterminationhearings, the judge may decide to lower, raise, maintain, or eliminate thebond amount set by DHS, or to change bond conditions.
• Either the alien or DHS may request by motion that a case previously heardby an immigration judge be reopened or reconsidered. Generally, aliens orDHS file motions to reopen or reconsider because of changed circumstances.
For the purposes of this Year Book, the term “immigration court matters” includesproceedings (deportation, exclusion, removal, credible fear, reasonable fear, claimedstatus, asylum only, rescission, continued detention review, Nicaraguan Adjustment andCentral American Relief Act (NACARA), and withholding only), bond redeterminations,and motions to reopen or reconsider. Receipts are defined as the total number ofproceedings, bond redeterminations, and motions to reopen or reconsider received bythe immigration courts during the reporting period. Completions include immigrationjudge decisions on proceedings, bond redeterminations, motions, and other completions such as administrative closings and changes of venue.

Executive Office for Immigration Review Office of Planning, Analysis, and TechnologyFY 2010 Statistical Year Book January 2011 B2
As shown in Figure 1 above, the number of matters received by the immigrationcourts decreased between FY 2006 and FY 2007 by four percent. The increase inreceipts from FY 2007 to FY 2010 was 17 percent. Immigration court matterscompleted decreased by 10 percent from FY 2006 to FY 2007 followed by an increaseof seven percent from FY 2007 to FY 2010.
While some courts showed increases in receipts over FY 2009 levels, othersshowed decreases. In Table 1, on the following page, courts with increases of 25percent or more are highlighted in blue and courts with a decrease of 25 percent ormore are highlighted in red. The immigration court in New Orleans, LA, showed thelargest percentage increase in receipts at 38 percent. The immigration court inGuaynabo (San Juan), Puerto Rico, showed the largest percentage decrease, down 35percent. Table 1A identifies receipts for FY 2010 by type of matter.
Table 2 provides a comparison of FY 2009 and FY 2010 completions byimmigration court. Courts with increases in completions of 25 percent or more arehighlighted in blue, and those with decreases of 25 percent or more are highlighted inred. New Orleans, LA, showed the largest percentage increase at 63 percent. EastMesa, CA, showed the largest percentage decrease at 32 percent. Receipts andcompletions showed virtually no change nationwide between FY 2009 and FY 2010.Table 2A identifies completions for FY 2010 by type of matter.
Total Immigration Court MattersReceived and Completed
300,000
320,000
340,000
360,000
380,000
400,000
FY 06 FY 07 FY 08 FY 09 FY 10
Receipts Completions
Figure 1
Receipts CompletionsFY 06 351,051 366,080FY 07 335,961 329,643FY 08 352,159 340,599FY 09 393,185 354,145FY 10 392,888 353,247
Total Immigration Court Matters

Executive Office for Immigration Review Office of Planning, Analysis, and TechnologyFY 2010 Statistical Year Book January 2011 B3
Table 1 - Total Immigration Court Matters Received by Court for FY 2009 and FY 2010
Immigration Court FY 2009 FY 2010 Rate of ChangeARLINGTON, VIRGINIA 7,274 7,197 -1%ATLANTA, GEORGIA 7,699 6,864 -11%BALTIMORE, MARYLAND 5,276 5,160 -2%BATAVIA SPC, NEW YORK 2,153 2,283 6%BLOOMINGTON (ST. PAUL), MINNESOTA 5,262 5,390 2%BOSTON, MASSACHUSETTS 8,544 9,092 6%BUFFALO, NEW YORK 2,697 2,749 2%CHARLOTTE, NORTH CAROLINA 5,272 4,658 -12%CHICAGO, ILLINOIS 12,826 15,345 20%CLEVELAND, OHIO 7,503 5,704 -24%DALLAS, TEXAS 8,868 10,017 13%DENVER, COLORADO 12,942 12,211 -6%DETROIT, MICHIGAN 5,945 5,903 -1%EAST MESA, CALIFORNIA 2,481 1,682 -32%EL CENTRO SPC, CALIFORNIA 2,599 2,349 -10%EL PASO SPC, TEXAS 6,239 5,095 -18%EL PASO, TEXAS 7,697 8,947 16%ELIZABETH SPC, NEW JERSEY 2,233 2,982 34%ELOY, ARIZONA 13,071 9,968 -24%FISHKILL - NEW YORK STATE DOC, NEW YORK 354 290 -18%FLORENCE SPC, ARIZONA 8,351 6,440 -23%GUAYNABO (SAN JUAN), PUERTO RICO 2,852 1,859 -35%HARLINGEN, TEXAS 13,480 13,734 2%HARTFORD, CONNECTICUT 2,493 1,995 -20%HONOLULU, HAWAII 1,495 1,082 -28%HOUSTON SPC, TEXAS 14,921 13,248 -11%HOUSTON, TEXAS 6,082 6,916 14%IMPERIAL, CALIFORNIA 1,297 1,303 0%KANSAS CITY, MISSOURI 4,479 5,486 22%KROME NORTH SPC, FLORIDA 12,437 12,291 -1%LANCASTER, CALIFORNIA 8,625 7,627 -12%LAS VEGAS, NEVADA 4,399 4,902 11%LOS ANGELES, CALIFORNIA 20,495 21,645 6%LOS FRESNOS (PORT ISABEL SPC), TEXAS 3,500 3,251 -7%MEMPHIS, TENNESSEE 3,877 4,000 3%MIAMI, FLORIDA 14,014 13,007 -7%NEW ORLEANS, LOUISIANA 1,026 1,412 38%NEW YORK CITY, NEW YORK 23,255 23,495 1%NEWARK, NEW JERSEY 10,068 9,576 -5%OAKDALE FEDERAL DETENTION CENTER, LOUISIANA 14,622 13,314 -9%OMAHA, NEBRASKA 5,948 5,725 -4%ORLANDO, FLORIDA 4,398 4,473 2%PHILADELPHIA, PENNSYLVANIA 3,331 3,345 0%PHOENIX, ARIZONA 4,902 6,106 25%PORTLAND, OREGON 1,646 1,840 12%SAIPAN, NORTHERN MARIANAS ISLANDS 0 120 New CourtSALT LAKE CITY, UTAH 3,430 3,216 -6%SAN ANTONIO, TEXAS 17,158 19,267 12%SAN DIEGO, CALIFORNIA 4,922 3,848 -22%SAN FRANCISCO, CALIFORNIA 11,451 15,024 31%SEATTLE, WASHINGTON 3,702 4,674 26%STEWART DETENTION FACILITY, GEORGIA 7,113 9,036 27%TACOMA, WASHINGTON 9,772 9,248 -5%TUCSON, ARIZONA 5,468 5,654 3%ULSTER - NEW YORK STATE DOC, NEW YORK 613 525 -14%VARICK SPC, NEW YORK 3,017 2,532 -16%YORK, PENNSYLVANIA 7,611 7,786 2%TOTAL 393,185 392,888 0%

Executive Office for Immigration Review Office of Planning, Analysis, and TechnologyFY 2010 Statistical Year Book January 2011 B4
Table 1A - Total Immigration Court Receipts by Court and Type of Matter for FY 2010Immigration Court Proceedings Bonds Motions Total Matters
ARLINGTON, VIRGINIA 6,506 283 408 7,197ATLANTA, GEORGIA 5,431 842 591 6,864BALTIMORE, MARYLAND 4,330 506 324 5,160BATAVIA SPC, NEW YORK 1,331 946 6 2,283BLOOMINGTON (ST. PAUL), MINNESOTA 4,211 1,079 100 5,390BOSTON, MASSACHUSETTS 6,858 1,479 755 9,092BUFFALO, NEW YORK 2,473 124 152 2,749CHARLOTTE, NORTH CAROLINA 3,843 562 253 4,658CHICAGO, ILLINOIS 13,860 1,090 395 15,345CLEVELAND, OHIO 5,055 438 211 5,704DALLAS, TEXAS 9,146 512 359 10,017DENVER, COLORADO 8,872 3,112 227 12,211DETROIT, MICHIGAN 4,245 1,478 180 5,903EAST MESA, CALIFORNIA 982 692 8 1,682EL CENTRO SPC, CALIFORNIA 1,648 684 17 2,349EL PASO SPC, TEXAS 4,004 1,060 31 5,095EL PASO, TEXAS 8,145 634 168 8,947ELIZABETH SPC, NEW JERSEY 2,045 905 32 2,982ELOY, ARIZONA 7,257 2,668 43 9,968FISHKILL - NEW YORK STATE DOC, NEW YORK 280 0 10 290FLORENCE SPC, ARIZONA 4,466 1,943 31 6,440GUAYNABO (SAN JUAN), PUERTO RICO 1,477 202 180 1,859HARLINGEN, TEXAS 11,082 2,171 481 13,734HARTFORD, CONNECTICUT 1,857 23 115 1,995HONOLULU, HAWAII 787 238 57 1,082HOUSTON SPC, TEXAS 10,978 2,204 66 13,248HOUSTON, TEXAS 6,542 9 365 6,916IMPERIAL, CALIFORNIA 1,282 3 18 1,303KANSAS CITY, MISSOURI 4,926 432 128 5,486KROME NORTH SPC, FLORIDA 8,278 3,910 103 12,291LANCASTER, CALIFORNIA 4,788 2,816 23 7,627LAS VEGAS, NEVADA 4,503 262 137 4,902LOS ANGELES, CALIFORNIA 19,144 436 2,065 21,645LOS FRESNOS (PORT ISABEL SPC), TEXAS 2,276 938 37 3,251MEMPHIS, TENNESSEE 3,809 41 150 4,000MIAMI, FLORIDA 11,750 1 1,256 13,007NEW ORLEANS, LOUISIANA 1,340 0 72 1,412NEW YORK CITY, NEW YORK 21,757 1 1,737 23,495NEWARK, NEW JERSEY 7,474 1,325 777 9,576OAKDALE FEDERAL DETENTION CENTER, LOUISIANA 9,487 3,764 63 13,314OMAHA, NEBRASKA 4,500 1,073 152 5,725ORLANDO, FLORIDA 4,061 1 411 4,473PHILADELPHIA, PENNSYLVANIA 3,051 0 294 3,345PHOENIX, ARIZONA 5,871 3 232 6,106PORTLAND, OREGON 1,741 51 48 1,840SAIPAN, NORTHERN MARIANAS ISLANDS 120 0 0 120SALT LAKE CITY, UTAH 3,007 166 43 3,216SAN ANTONIO, TEXAS 15,586 3,240 441 19,267SAN DIEGO, CALIFORNIA 3,571 35 242 3,848SAN FRANCISCO, CALIFORNIA 13,478 1,096 450 15,024SEATTLE, WASHINGTON 4,446 0 228 4,674STEWART DETENTION FACILITY, GEORGIA 8,029 980 27 9,036TACOMA, WASHINGTON 6,387 2,832 29 9,248TUCSON, ARIZONA 5,632 0 22 5,654ULSTER - NEW YORK STATE DOC, NEW YORK 501 2 22 525VARICK SPC, NEW YORK 1,487 986 59 2,532YORK, PENNSYLVANIA 5,333 2,382 71 7,786TOTAL 325,326 52,660 14,902 392,888

Executive Office for Immigration Review Office of Planning, Analysis, and TechnologyFY 2010 Statistical Year Book January 2011 B5
Table 2 - Total Immigration Court Matters Completed by Court for FY 2009 and FY 2010
Immigration Court FY 2009 FY 2010 Rate of ChangeARLINGTON, VIRGINIA 6,692 7,156 7%ATLANTA, GEORGIA 6,731 6,681 -1%BALTIMORE, MARYLAND 4,834 4,453 -8%BATAVIA SPC, NEW YORK 2,132 2,204 3%BLOOMINGTON (ST. PAUL), MINNESOTA 4,735 5,042 6%BOSTON, MASSACHUSETTS 7,641 8,581 12%BUFFALO, NEW YORK 2,615 2,737 5%CHARLOTTE, NORTH CAROLINA 2,886 4,426 53%CHICAGO, ILLINOIS 10,253 10,350 1%CLEVELAND, OHIO 7,454 5,375 -28%DALLAS, TEXAS 7,687 8,899 16%DENVER, COLORADO 11,549 10,637 -8%DETROIT, MICHIGAN 5,909 5,685 -4%EAST MESA, CALIFORNIA 2,484 1,678 -32%EL CENTRO SPC, CALIFORNIA 2,573 2,408 -6%EL PASO SPC, TEXAS 6,093 4,786 -21%EL PASO, TEXAS 6,612 7,528 14%ELIZABETH SPC, NEW JERSEY 2,284 2,661 17%ELOY, ARIZONA 12,947 9,784 -24%FISHKILL - NEW YORK STATE DOC, NEW YORK 369 337 -9%FLORENCE SPC, ARIZONA 7,859 6,684 -15%GUAYNABO (SAN JUAN), PUERTO RICO 2,418 2,088 -14%HARLINGEN, TEXAS 13,475 11,266 -16%HARTFORD, CONNECTICUT 2,187 1,890 -14%HONOLULU, HAWAII 1,383 1,143 -17%HOUSTON SPC, TEXAS 14,427 13,211 -8%HOUSTON, TEXAS 4,685 5,212 11%IMPERIAL, CALIFORNIA 1,237 1,178 -5%KANSAS CITY, MISSOURI 3,523 5,052 43%KROME NORTH SPC, FLORIDA 12,046 12,220 1%LANCASTER, CALIFORNIA 8,105 7,705 -5%LAS VEGAS, NEVADA 4,284 3,944 -8%LOS ANGELES, CALIFORNIA 17,374 21,174 22%LOS FRESNOS (PORT ISABEL SPC), TEXAS 3,107 3,246 4%MEMPHIS, TENNESSEE 2,620 3,127 19%MIAMI, FLORIDA 12,980 14,532 12%NEW ORLEANS, LOUISIANA 625 1,016 63%NEW YORK CITY, NEW YORK 16,109 17,717 10%NEWARK, NEW JERSEY 7,871 8,249 5%OAKDALE FEDERAL DETENTION CENTER, LOUISIANA 14,356 12,655 -12%OMAHA, NEBRASKA 5,356 4,981 -7%ORLANDO, FLORIDA 6,299 5,591 -11%PHILADELPHIA, PENNSYLVANIA 2,566 2,540 -1%PHOENIX, ARIZONA 3,565 3,664 3%PORTLAND, OREGON 1,036 1,089 5%SAIPAN, NORTHERN MARIANAS ISLANDS 0 53 New CourtSALT LAKE CITY, UTAH 3,335 3,035 -9%SAN ANTONIO, TEXAS 15,868 16,300 3%SAN DIEGO, CALIFORNIA 4,739 3,384 -29%SAN FRANCISCO, CALIFORNIA 9,325 10,772 16%SEATTLE, WASHINGTON 3,327 3,452 4%STEWART DETENTION FACILITY, GEORGIA 7,269 8,363 15%TACOMA, WASHINGTON 9,812 9,139 -7%TUCSON, ARIZONA 5,351 5,436 2%ULSTER - NEW YORK STATE DOC, NEW YORK 669 528 -21%VARICK SPC, NEW YORK 2,997 2,350 -22%YORK, PENNSYLVANIA 7,480 7,853 5%TOTAL 354,145 353,247 0%

Executive Office for Immigration Review Office of Planning, Analysis, and TechnologyFY 2010 Statistical Year Book January 2011 B6
Table 2A - Total Immigration Court Completions by Court and Type of Matter for FY 2010Immigration Court Proceedings Bonds Motions Total Matters
ARLINGTON, VIRGINIA 6,484 255 417 7,156ATLANTA, GEORGIA 5,257 828 596 6,681BALTIMORE, MARYLAND 3,613 479 361 4,453BATAVIA SPC, NEW YORK 1,278 920 6 2,204BLOOMINGTON (ST. PAUL), MINNESOTA 3,913 1,032 97 5,042BOSTON, MASSACHUSETTS 6,322 1,506 753 8,581BUFFALO, NEW YORK 2,465 124 148 2,737CHARLOTTE, NORTH CAROLINA 3,629 554 243 4,426CHICAGO, ILLINOIS 8,913 1,052 385 10,350CLEVELAND, OHIO 4,751 427 197 5,375DALLAS, TEXAS 8,057 501 341 8,899DENVER, COLORADO 7,326 3,092 219 10,637DETROIT, MICHIGAN 4,082 1,419 184 5,685EAST MESA, CALIFORNIA 986 683 9 1,678EL CENTRO SPC, CALIFORNIA 1,707 683 18 2,408EL PASO SPC, TEXAS 3,766 986 34 4,786EL PASO, TEXAS 6,770 593 165 7,528ELIZABETH SPC, NEW JERSEY 1,740 886 35 2,661ELOY, ARIZONA 7,231 2,508 45 9,784FISHKILL - NEW YORK STATE DOC, NEW YORK 328 0 9 337FLORENCE SPC, ARIZONA 4,683 1,970 31 6,684GUAYNABO (SAN JUAN), PUERTO RICO 1,705 205 178 2,088HARLINGEN, TEXAS 8,768 2,023 475 11,266HARTFORD, CONNECTICUT 1,751 27 112 1,890HONOLULU, HAWAII 827 254 62 1,143HOUSTON SPC, TEXAS 11,002 2,148 61 13,211HOUSTON, TEXAS 4,818 11 383 5,212IMPERIAL, CALIFORNIA 1,157 3 18 1,178KANSAS CITY, MISSOURI 4,574 354 124 5,052KROME NORTH SPC, FLORIDA 8,217 3,901 102 12,220LANCASTER, CALIFORNIA 4,820 2,861 24 7,705LAS VEGAS, NEVADA 3,556 253 135 3,944LOS ANGELES, CALIFORNIA 18,721 397 2,056 21,174LOS FRESNOS (PORT ISABEL SPC), TEXAS 2,275 932 39 3,246MEMPHIS, TENNESSEE 2,933 41 153 3,127MIAMI, FLORIDA 13,225 1 1,306 14,532NEW ORLEANS, LOUISIANA 947 0 69 1,016NEW YORK CITY, NEW YORK 16,000 1 1,716 17,717NEWARK, NEW JERSEY 6,133 1,305 811 8,249OAKDALE FEDERAL DETENTION CENTER, LOUISIANA 9,009 3,586 60 12,655OMAHA, NEBRASKA 3,871 955 155 4,981ORLANDO, FLORIDA 5,204 1 386 5,591PHILADELPHIA, PENNSYLVANIA 2,255 0 285 2,540PHOENIX, ARIZONA 3,427 2 235 3,664PORTLAND, OREGON 986 52 51 1,089SAIPAN, NORTHERN MARIANAS ISLANDS 53 0 0 53SALT LAKE CITY, UTAH 2,834 155 46 3,035SAN ANTONIO, TEXAS 12,721 3,176 403 16,300SAN DIEGO, CALIFORNIA 3,106 31 247 3,384SAN FRANCISCO, CALIFORNIA 9,365 964 443 10,772SEATTLE, WASHINGTON 3,209 0 243 3,452STEWART DETENTION FACILITY, GEORGIA 7,401 939 23 8,363TACOMA, WASHINGTON 6,342 2,768 29 9,139TUCSON, ARIZONA 5,417 0 19 5,436ULSTER - NEW YORK STATE DOC, NEW YORK 504 2 22 528VARICK SPC, NEW YORK 1,313 976 61 2,350YORK, PENNSYLVANIA 5,460 2,319 74 7,853TOTAL 287,207 51,141 14,899 353,247

Executive Office for Immigration Review Office of Planning, Analysis, and TechnologyFY 2010 Statistical Year Book January 2011 B7
Figures 2 and 3 below provide information on the types of matters received and completedby the immigration courts. Proceedings make up the bulk of the courts’ work, but the courts alsoprocess significant numbers of bonds and motions to reopen and reconsider. For both mattersreceived and matters completed the number of bonds has significantly increased from FY 2006to FY 2010 while proceedings and motions to reopen and reconsider have gone up and downthroughout the five year time span.
Immigration Court Matters ReceivedBy Type
0
100,000
200,000
300,000
400,000
500,000
FY 06 FY 07 FY 08 FY 09 FY 10
Proceedings Bonds Motions
Figure 2
Proceedings Bonds Motions TotalFY 06 308,652 30,099 12,300 351,051FY 07 279,430 42,664 13,867 335,961FY 08 292,013 45,918 14,228 352,159FY 09 327,928 51,645 13,612 393,185FY 10 325,326 52,660 14,902 392,888
Immigration Court Matters Received
Immigration Court Matters CompletedBy Type
0
100,000
200,000
300,000
400,000
FY 06 FY 07 FY 08 FY 09 FY 10
Proceedings Bonds Motions
Figure 3
Proceedings Bonds Motions TotalFY 06 324,040 29,740 12,300 366,080FY 07 273,468 42,313 13,862 329,643FY 08 281,216 45,126 14,257 340,599FY 09 290,435 50,333 13,377 354,145FY 10 287,207 51,141 14,899 353,247
Immigration Court Matters Completed

Executive Office for Immigration Review Office of Planning, Analysis, and TechnologyFY 2010 Statistical Year Book January 2011 C1
Immigration Courts:Proceedings Received and Completed by Type
This section of the Statistical Year Book provides further details on proceedings by type. As noted in Tab B, proceedings, motions, and bond redeterminations make upthe various types of matters considered by the immigration courts.
Until April 1, 1997, the two major types of proceedings conducted by immigrationcourts were exclusion proceedings and deportation proceedings. Individuals chargedby the former Immigration and Naturalization Service (INS) (now reorganized underDHS) as excludable were placed in exclusion proceedings. Exclusion cases generallyinvolved a person who tried to enter the United States, but was stopped at the point ofentry because INS found the person to be inadmissible. Deportation cases usuallyarose when INS alleged that an alien had entered the country illegally, or had enteredlegally, but then violated one or more conditions of his or her visa.
Provisions of the Illegal Immigration Reform and Immigrant Responsibility Act of1996 (IIRIRA), which became effective on April 1, 1997, established five new types ofproceedings:
• Removal Proceedings. Under removal proceedings (which replacedexclusion and deportation proceedings), DHS must file a Notice to Appear(NTA) to initiate the proceedings.
• Credible Fear Review. Arriving aliens with no documents or fraudulentdocuments are subject to expedited removal by DHS. If an arriving alienwho is subject to the expedited removal provisions expresses either anintention to apply for asylum or a fear of returning to the country ofremoval, the alien is referred for a “credible fear” interview by a DHSasylum officer. Aliens found by the asylum officer not to have a crediblefear of persecution may request a review by an immigration judge. If thejudge determines there is “credible fear,” the judge will vacate the DHSorder of expedited removal, and the alien will be placed in removalproceedings.
• Reasonable Fear Review. DHS has the authority to order theadministrative removal of certain aggravated felons, and to reinstateorders of removal for aliens previously removed. If an alien who has beenordered administratively removed, or whose prior order of removal hasbeen reinstated expresses a fear of returning to the country of removal, aDHS asylum officer makes a “reasonable fear” determination. Aliensfound by the asylum officer not to have a reasonable fear of persecutionmay request a review by an immigration judge. If the judge determinesthere is “reasonable fear,” the alien will be placed in withholding onlyproceedings.

Executive Office for Immigration Review Office of Planning, Analysis, and TechnologyFY 2010 Statistical Year Book January 2011 C2
• Claimed Status Review. If an alien in expedited removal proceedingsbefore DHS claims to be a U.S. citizen, to have been lawfully admitted forpermanent residence, to have been admitted as a refugee, or to havebeen granted asylum, and DHS determines that the alien has no suchclaim, he or she can obtain a review of that claim by an immigration judge.
• Asylum-Only. An asylum only case is initiated when an arriving crewmanor stowaway is not eligible to apply for admission into the United States,but wants to request asylum. These proceedings also cover Visa WaiverProgram beneficiaries and individuals ordered removed from the UnitedStates on security grounds.
Additional types of proceedings include:
• Rescission. DHS issues a Notice of Intent to Rescind an individual’spermanent resident status, and the individual has the right to contest thecharge before an immigration judge.
• Continued Detention Review. In response to a United States SupremeCourt decision in Zadvydas v. Davis, a new type of proceeding wasestablished regarding the continued detention of aliens who are subject tofinal orders of removal. In these cases the alien has already been orderedremoved, but DHS is unable to effect the removal (e.g., lack of a traveldocument, no diplomatic relations with the receiving country, etc.). Theonly issue for the immigration judge to decide in Continued DetentionReview cases is whether or not the alien should remain in custody.
• NACARA. Certain aliens may apply for suspension of deportation or cancellation of removal under section 203 of the Nicaraguan Adjustment and Central American Relief Act (NACARA).
• Withholding Only. A previous removal/deportation/exclusion order has been reinstated by DHS or the alien has been ordered removed (administratively) by DHS (based upon a conviction for an aggravated felony) and the alien expresses a fear of persecution or torture if returned to the country of removal and that claim is reviewed by an asylum officer. The asylum officer has concluded that the alien has a reasonable fear ofpersecution or torture or an immigration judge conducted a ReasonableFear Review proceeding and found that “reasonable fear of persecution or torture” exists. The immigration judge’s Reasonable Fear finding automatically initiates a Withholding Only hearing.

Executive Office for Immigration Review Office of Planning, Analysis, and TechnologyFY 2010 Statistical Year Book January 2011 C3
Table 3 shows all types of proceedings received by the immigration courtsbetween FY 2006 and FY 2010.
Table 3 - Immigration Court Proceedings Received by Case Type
Type of Proceeding FY2006 FY 2007 FY 2008 FY 2009 FY 2010
Deportation 3,648 4,030 4,185 3,592 3,597
Exclusion 385 453 436 379 315
Removal 302,906 272,824 285,419 321,729 318,435
Credible Fear 411 825 702 885 1,165
Reasonable Fear 78 131 172 241 398
Claimed Status 69 77 53 43 51
Asylum Only 959 814 707 621 532
Rescission 30 33 30 56 59
Continued Detention Review 6 6 5 1 1
NACARA 28 42 14 22 8
Withholding Only 132 195 290 359 765
Total 308,652 279,430 292,013 327,928 325,326

Executive Office for Immigration Review Office of Planning, Analysis, and TechnologyFY 2010 Statistical Year Book January 2011 C4
Table 4 shows all types of proceedings completed by the immigration courts forthe period FY 2006 to FY 2010. Note that proceedings completed do not reflect onlyimmigration judge decisions. These numbers include other completions such astransfers and changes of venue. As shown in Tab D, “other completions” accounted for22 percent of the proceedings completed in FY 2010.
Table 4 - Immigration Court Proceedings Completed by Case Type
Type of Proceeding FY 2006 FY 2007 FY 2008 FY 2009 FY 2010
Deportation 4,148 4,088 3,974 3,730 3,690
Exclusion 462 427 500 397 364
Removal 317,240 266,712 274,635 284,164 280,420
Credible Fear 411 822 696 884 1,143
Reasonable Fear 77 127 171 231 394
Claimed Status 64 81 54 37 54
Asylum Only 1,456 993 842 647 567
Rescission 29 24 31 26 49
Continued Detention Review 6 5 6 1 1
NACARA 18 31 34 20 18
Withholding Only 129 158 273 298 507
Total 324,040 273,468 281,216 290,435 287,207

Executive Office for Immigration Review Office of Planning, Analysis, and TechnologyFY 2010 Statistical Year Book January 2011
D1
Immigration Courts:Proceedings Completed by Disposition
After a hearing, the immigration judge either renders an oral decision or reservesthe decision and issues a decision at a later date. In rendering a decision, theimmigration judge may order the alien removed from the United States, grant some formof relief, or terminate the proceedings if removability has not been established by DHS.
In addition to decisions, there are other possible proceeding outcomes which arereported here as “other completions.” Some cases are administratively closed and theimmigration judge does not render a decision on the merits. Administrative closuresand cases transferred to a different hearing location or granted a change of venue arecounted as “other completions.”
Figure 4 provides a breakdown of proceedings from FY 2006 to FY 2010 by typeof completion – either through an immigration judge decision or through an “othercompletion,” such as an administrative closure or change of venue.
IJ Proceedings CompletedBy Completion Type
050,000
100,000150,000200,000250,000300,000350,000
FY 06 FY 07 FY 08 FY 09 FY 10
Decisions Other Completions
Figure 4
IJ Proceedings Completed
FY 06 273,761 50,279 324,040FY 07 223,085 50,383 273,468FY 08 229,463 51,753 281,216FY 09 232,385 58,050 290,435FY 10 222,909 64,298 287,207
Decisions TotalOther Completions

Executive Office for Immigration Review Office of Planning, Analysis, and TechnologyFY 2010 Statistical Year Book January 2011
D2
Figure 5 provides a breakout of decisions by disposition type. Immigrationjudges first decide whether or not the charges against an alien should be sustained. Ifthe charges are not sustained or if the alien has established eligibility for naturalization,the judge terminates the case. If charges are sustained, the judge decides whether toorder the alien removed from the United States or to grant relief. In some cases, theimmigration judge may permit the alien to depart the United States voluntarily. Ordersof voluntary departure are included as removals. There are also a few immigrationjudge decisions classified as “other” decisions.
Immigration Judge DecisionsBy Disposition
050,000
100,000150,000200,000250,000300,000
FY 06 FY 07 FY 08 FY 09 FY 10
Termination Relief Other Removal
Figure 5
IJ Decisions by Disposition
Number % of Total Number % of Total Number % of Total Number % of Total Number % of TotalFY 06 15,985 5.8 34,411 12.6 222,211 81.2 1,154 0.4 273,761 100.0FY 07 21,146 9.5 30,264 13.6 170,291 76.3 1,384 0.6 223,085 100.0FY 08 17,033 7.4 28,369 12.4 182,720 79.6 1,341 0.6 229,463 100.0FY 09 17,035 7.3 28,664 12.3 185,410 79.8 1,276 0.5 232,385 100.0FY 10 24,317 10.9 30,838 13.8 166,424 74.7 1,330 0.6 222,909 100.0
TotalOtherRemovalReliefTermination

Executive Office for Immigration Review Office of Planning, Analysis, and TechnologyFY 2010 Statistical Year Book January 2011
E1
Immigration Courts:Proceedings Completed by Nationality
Immigration court staff record in EOIR’s data system the nationality of aliens whoappear before immigration judges. Data in this section provide information on thepredominant nationalities for completed proceedings.
In FY 2010, the top 10 nationalities accounted for approximately 76 percent of allproceedings completed as shown in Figure 6. A total of 224 nationalities wererepresented in the FY 2010 immigration judge completions. Mexico and CentralAmerican countries are consistently among the predominant nationalities of immigrationcourt completions. Table 5, on the following page, provides information on the top 25nationalities each year for the period FY 2006 through FY 2010. For the five-yearperiod, eight of the top 10 nationalities remained the same: Mexico, Guatemala, ElSalvador, Honduras, China, Haiti, Colombia, and Cuba.
FY 2010 Court Proceedings CompletedBy Nationality
Honduras 5.05%China 4.11%Haiti 2.18%
Dominican Republic 1.92%
Colombia 1.71%
Cuba 1.53%
Jamaica 1.34%
All Others 24.43%
El Salvador 7.30%
Guatemala 7.52%
Mexico 42.91%
Figure 6
Nationality Cases % of TotalMexico 123,239 42.91%Guatemala 21,612 7.52%El Salvador 20,980 7.30%Honduras 14,498 5.05%China 11,800 4.11%Haiti 6,258 2.18%Dominican Republic 5,509 1.92%Colombia 4,897 1.71%Cuba 4,389 1.53%Jamaica 3,850 1.34%All Others 70,175 24.43%Total 287,207 100.00%
FY 2010 Court Proceedings Completed by Nationality

Executive Office for Immigration Review Office of Planning, Analysis, and TechnologyFY 2010 Statistical Year Book January 2011
E2
Table 5 - Court Proceedings Completed by NationalityTop 25 Nationalities: FY 2006 - FY 2010
Rank FY 2006 FY 2007 FY 2008 FY 2009 FY 2010
1 Mexico Mexico Mexico Mexico Mexico
2 El Salvador El Salvador El Salvador Guatemala Guatemala
3 Honduras Guatemala Guatemala El Salvador El Salvador
4 Guatemala Honduras Honduras Honduras Honduras
5 China China China China China
6 Brazil Cuba Haiti Haiti Haiti
7 Cuba Haiti Cuba Colombia DominicanRepublic
8 Haiti Colombia Colombia DominicanRepublic Colombia
9 Colombia DominicanRepublic
DominicanRepublic Cuba Cuba
10 Nicaragua Nicaragua Brazil Jamaica Jamaica
11 DominicanRepublic
Brazil Jamaica Ecuador India
12 India India Ecuador Brazil Ecuador
13 Indonesia Jamaica India India Brazil
14 Pakistan Ecuador Nicaragua Peru Philippines
15 Jamaica Pakistan Philippines Philippines Peru
16 Ecuador Indonesia Peru Nicaragua Nicaragua
17 Venezuela Peru Venezuela Venezuela Venezuela
18 Peru Venezuela Pakistan Pakistan Pakistan
19 Philippines Philippines Indonesia Russia Canada
20 Albania Nigeria Canada Nigeria Russia
21 Nigeria Russia Nigeria Indonesia Nigeria
22 Costa Rica Canada Russia Canada Kenya
23 Russia Albania Vietnam Ethiopia Ghana
24 Egypt Egypt Ghana Ghana Vietnam
25 Canada Ethiopia Trinidad andTobago
Vietnam South Korea

Executive Office for Immigration Review Office of Planning, Analysis, and TechnologyFY 2010 Statistical Year Book January 2011F1
Immigration Courts:Proceedings Completed by Language
Figure 7 below shows a breakdown of FY 2006 immigration court proceedingscompleted by language. Of the 253 languages spoken in court proceedings during FY 2006,90 percent were in the following five languages: Spanish, English, Portuguese, Mandarin,and Creole.
Figure 8 below shows comparable data for FY 2010. Although four of the top fivelanguages were the same, there was more diversity in languages in FY 2010. A total of 283different languages were spoken in court proceedings in the immigration courts during FY2010. The top five languages accounted for 91 percent of the proceedings completed in FY2010.
FY 2010 highlights include:
• Spanish language cases were 66 percent of the total caseload, a decrease of fourpercent since FY 2006.
• In the “Other” category, Russian, Portuguese, and Arabic represented the three mostfrequently spoken languages.
• The number of different languages used in court proceedings has increased by12 percent over FY 2006.
FY 2006 Court Proceedings Completed By Language
Spanish70.02%
English11.65%
Portuguese3.24%
Mandarin2.80%
Creole2.06%
Other10.23%
Figure 7
FY 2010 Court Proceedings Completed By Language
Spanish66.38%
English17.09%
Mandarin 3.07%
Unknown2.63%
Other9.12%
Creole1.71%
Figure 8

Executive Office for Immigration Review Office of Planning, Analysis, and TechnologyFY 2010 Statistical Year Book January 2011G1
Immigration Courts:Proceedings Completed by Representation Status
The Immigration and Nationality Act states that individuals in removal proceedingsbefore an immigration judge may be represented by counsel, but at no expense to thegovernment. Prior to representing an alien before the immigration court, representativesmust file a Notice of Appearance with the court.
Many individuals in removal proceedings are indigent and cannot afford a privateattorney. Some seek free or pro bono representation, while others proceed withoutcounsel on their own, or pro se. Of great concern to EOIR is the large number ofindividuals appearing pro se. Immigration judges, in order to ensure that such individualsunderstand the nature of the proceedings, as well as their rights and responsibilities, musttake extra care and spend additional time explaining this information. An individual mayask for a continuance of a proceeding to obtain counsel.
As shown in Figure 9, less than half of the aliens whose proceedings werecompleted during the period FY 2006 – FY 2010 were represented. The percentage ofrepresented aliens for FY 2006 to FY 2010 ranged from 35 percent to 43 percent.
Court Proceedings CompletedPercentage of Represented Cases
43%35%
40% 43%40%
0%
20%
40%
60%
80%
100%
FY 06 FY 07 FY 08 FY 09 FY 10
Figure 9
Represented Unrepresented TotalFY 06 114,684 209,356 324,040FY 07 117,186 156,282 273,468FY 08 113,169 168,047 281,216FY 09 114,829 175,606 290,435FY 10 122,465 164,742 287,207
Representation in Immigration Courts

Executive Office for Immigration Review Office of Planning, Analysis, and TechnologyFY 2010 Statistical Year Book January 2011
H1
Immigration Courts:Failures to Appear
When an alien fails to appear for a hearing, the immigration judge may conductan in absentia (in absence of) hearing and order the alien removed from the UnitedStates. Before the immigration judge orders the alien removed in absentia, the DHSAssistant Chief Counsel must establish by clear, unequivocal, and convincing evidencethat the alien is removable. Further, the immigration judge must be satisfied that noticeof time and place of the hearing were provided to the alien or the alien’s representative.
Figure 10 compares immigration judge decisions and failures to appear. Of theimmigration judge decisions rendered in FY 2010, 12 percent involved aliens who failedto appear. The failure to appear rate decreased 22 percent from FY 2006 to FY 2007.The number of aliens who failed to appear decreased by 65 percent over the sameperiod. The failure to appear rate has remained fairly consistent from FY 2007 to FY2010.
Failure to Appear* Rates
38%16% 12%13% 11%
0%
20%
40%
60%
80%
100%
FY 06 FY 07 FY 08 FY 09 FY 10
Figure 10
In Absentia Orders IJ Decisions Failure to Appear RateFY 06 102,849 273,761 38%FY 07 35,576 223,085 16%FY 08 29,853 229,463 13%FY 09 25,338 232,385 11%FY 10 26,790 222,909 12%
Failure to Appear* Rates
*Prior to FY 2009, administrative closures were included to calculate the failure to appearrate. However, due to a larger percentage of administrative closures not relating directly tofailure to appear, the failure to appear rate is calculated using immigration judge decisionsand in absentia orders only.
Executive Office for Immigration Review Office of Planning, Analysis, and TechnologyFY 2010 Statistical Year Book January 2011
H2
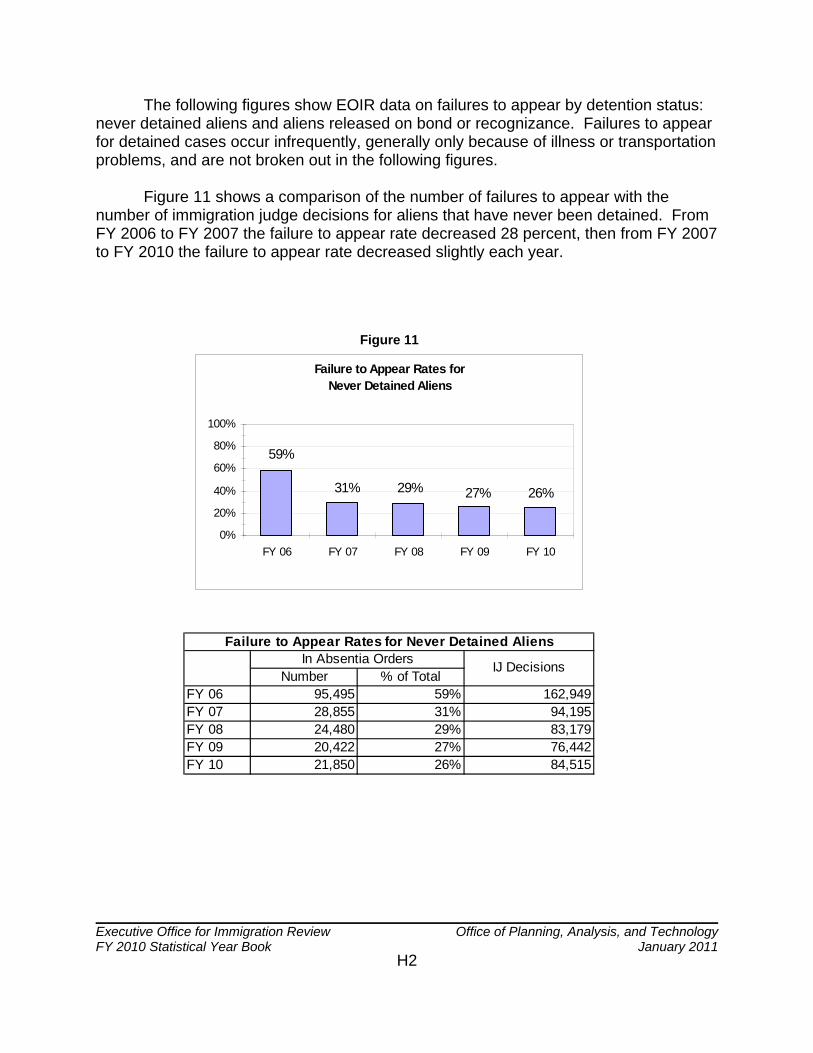
The following figures show EOIR data on failures to appear by detention status:never detained aliens and aliens released on bond or recognizance. Failures to appearfor detained cases occur infrequently, generally only because of illness or transportationproblems, and are not broken out in the following figures.
Figure 11 shows a comparison of the number of failures to appear with thenumber of immigration judge decisions for aliens that have never been detained. FromFY 2006 to FY 2007 the failure to appear rate decreased 28 percent, then from FY 2007to FY 2010 the failure to appear rate decreased slightly each year.
Failure to Appear Rates forNever Detained Aliens
26%
59%
31% 29% 27%
0%
20%
40%
60%
80%
100%
FY 06 FY 07 FY 08 FY 09 FY 10
Figure 11
Failure to Appear Rates for Never Detained AliensIn Absentia Orders
Number % of TotalFY 06 95,495 59% 162,949FY 07 28,855 31% 94,195FY 08 24,480 29% 83,179FY 09 20,422 27% 76,442FY 10 21,850 26% 84,515
IJ Decisions

Executive Office for Immigration Review Office of Planning, Analysis, and TechnologyFY 2010 Statistical Year Book January 2011
H3
Failures to appear for aliens released on bond or on their own recognizance areshown in Figure 12. From FY 2006 to FY 2010 the failure to appear rate has decreasedeach year. This decrease is consistent with the overall rate depicted in Figure 10.
Failure to Appear Rates for Released Aliens
32%21%22%
29%23%
0%
20%
40%
60%
80%
100%
FY 06 FY 07 FY 08 FY 09 FY 10
Figure 12
In Absentia OrdersNumber % of Total
FY 06 6,772 32% 20,901FY 07 6,188 29% 21,257FY 08 4,902 23% 21,260FY 09 4,592 22% 20,729FY 10 4,653 21% 22,523
Failure to Appear Rates for Released Aliens
IJ Decisions
Executive Office for Immigration Review Office of Planning, Analysis, and TechnologyFY 2010 Statistical Year Book January 2011I1
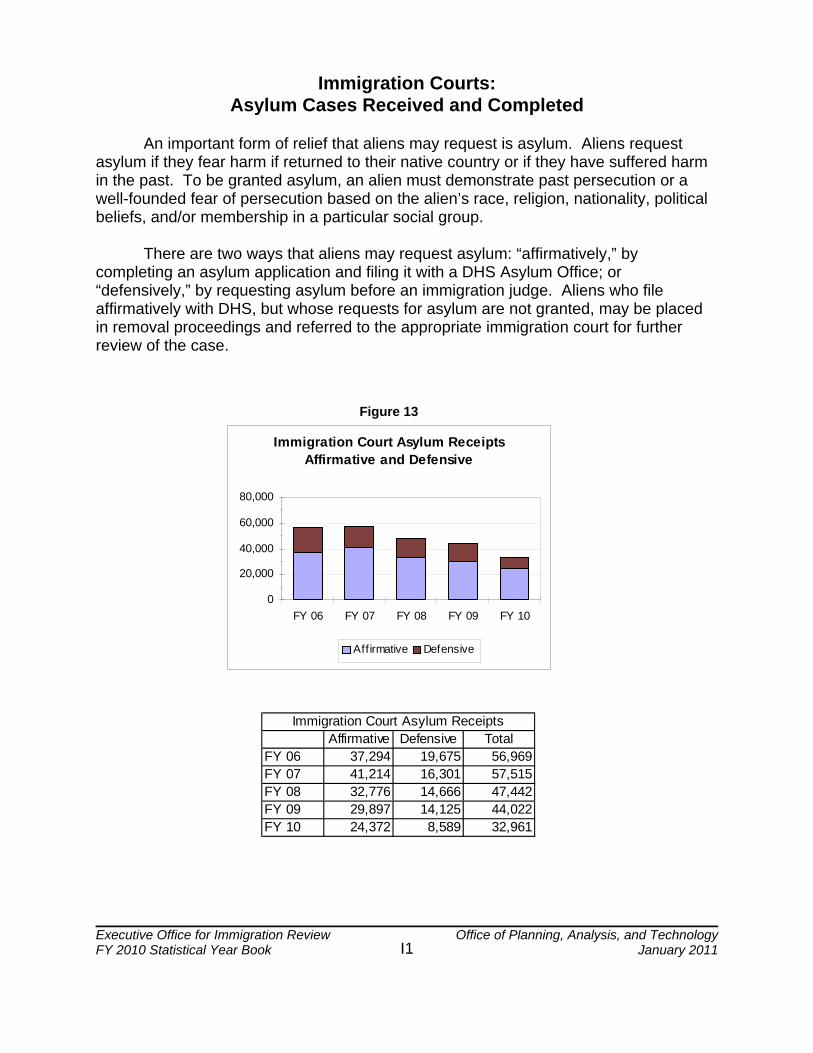
Immigration Courts:Asylum Cases Received and Completed
An important form of relief that aliens may request is asylum. Aliens requestasylum if they fear harm if returned to their native country or if they have suffered harmin the past. To be granted asylum, an alien must demonstrate past persecution or awell-founded fear of persecution based on the alien’s race, religion, nationality, politicalbeliefs, and/or membership in a particular social group.
There are two ways that aliens may request asylum: “affirmatively,” bycompleting an asylum application and filing it with a DHS Asylum Office; or“defensively,” by requesting asylum before an immigration judge. Aliens who fileaffirmatively with DHS, but whose requests for asylum are not granted, may be placedin removal proceedings and referred to the appropriate immigration court for furtherreview of the case.
Immigration Court Asylum ReceiptsAffirmative and Defensive
0
20,000
40,000
60,000
80,000
FY 06 FY 07 FY 08 FY 09 FY 10
Affirmative Defensive
Figure 13
Affirmative Defensive TotalFY 06 37,294 19,675 56,969FY 07 41,214 16,301 57,515FY 08 32,776 14,666 47,442FY 09 29,897 14,125 44,022FY 10 24,372 8,589 32,961
Immigration Court Asylum Receipts

Executive Office for Immigration Review Office of Planning, Analysis, and TechnologyFY 2010 Statistical Year Book January 2011I2
As shown in Figure 14 below, asylum receipts declined by 42 percent and asylumcompletions declined by 30 percent from FY 2006 to FY 2010.
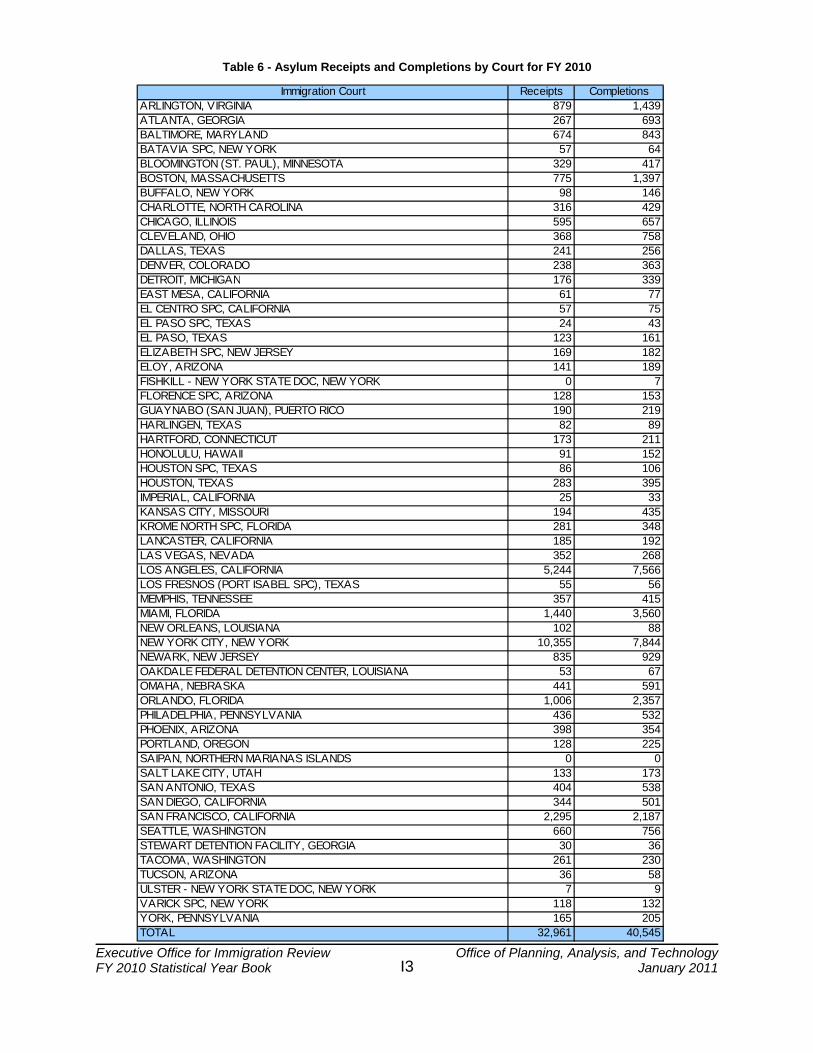
Table 6, shown on page I3, provides information on FY 2010 asylum receipts andcompletions by immigration court. In FY 2010 the New York, NY; Los Angeles, CA; SanFrancisco, CA; Miami, FL; and Orlando, FL, immigration courts received 62 percent ofasylum filings. In FY 2010, only six immigration courts had more asylum receipts thancompletions.
Asylum CasesReceipts and Completions
30,000
35,000
40,000
45,000
50,000
55,000
60,000
65,000
FY 06 FY 07 FY 08 FY 09 FY 10
Receipts Completions
Figure 14
Asylum Receipts and CompletionsReceipts Completions
FY 06 56,969 57,864FY 07 57,515 55,762FY 08 47,442 46,181FY 09 44,022 44,668FY 10 32,961 40,545
Executive Office for Immigration Review Office of Planning, Analysis, and TechnologyFY 2010 Statistical Year Book January 2011I3
Table 6 - Asylum Receipts and Completions by Court for FY 2010
Immigration Court Receipts CompletionsARLINGTON, VIRGINIA 879 1,439ATLANTA, GEORGIA 267 693BALTIMORE, MARYLAND 674 843BATAVIA SPC, NEW YORK 57 64BLOOMINGTON (ST. PAUL), MINNESOTA 329 417BOSTON, MASSACHUSETTS 775 1,397BUFFALO, NEW YORK 98 146CHARLOTTE, NORTH CAROLINA 316 429CHICAGO, ILLINOIS 595 657CLEVELAND, OHIO 368 758DALLAS, TEXAS 241 256DENVER, COLORADO 238 363DETROIT, MICHIGAN 176 339EAST MESA, CALIFORNIA 61 77EL CENTRO SPC, CALIFORNIA 57 75EL PASO SPC, TEXAS 24 43EL PASO, TEXAS 123 161ELIZABETH SPC, NEW JERSEY 169 182ELOY, ARIZONA 141 189FISHKILL - NEW YORK STATE DOC, NEW YORK 0 7FLORENCE SPC, ARIZONA 128 153GUAYNABO (SAN JUAN), PUERTO RICO 190 219HARLINGEN, TEXAS 82 89HARTFORD, CONNECTICUT 173 211HONOLULU, HAWAII 91 152HOUSTON SPC, TEXAS 86 106HOUSTON, TEXAS 283 395IMPERIAL, CALIFORNIA 25 33KANSAS CITY, MISSOURI 194 435KROME NORTH SPC, FLORIDA 281 348LANCASTER, CALIFORNIA 185 192LAS VEGAS, NEVADA 352 268LOS ANGELES, CALIFORNIA 5,244 7,566LOS FRESNOS (PORT ISABEL SPC), TEXAS 55 56MEMPHIS, TENNESSEE 357 415MIAMI, FLORIDA 1,440 3,560NEW ORLEANS, LOUISIANA 102 88NEW YORK CITY, NEW YORK 10,355 7,844NEWARK, NEW JERSEY 835 929OAKDALE FEDERAL DETENTION CENTER, LOUISIANA 53 67OMAHA, NEBRASKA 441 591ORLANDO, FLORIDA 1,006 2,357PHILADELPHIA, PENNSYLVANIA 436 532PHOENIX, ARIZONA 398 354PORTLAND, OREGON 128 225SAIPAN, NORTHERN MARIANAS ISLANDS 0 0SALT LAKE CITY, UTAH 133 173SAN ANTONIO, TEXAS 404 538SAN DIEGO, CALIFORNIA 344 501SAN FRANCISCO, CALIFORNIA 2,295 2,187SEATTLE, WASHINGTON 660 756STEWART DETENTION FACILITY, GEORGIA 30 36TACOMA, WASHINGTON 261 230TUCSON, ARIZONA 36 58ULSTER - NEW YORK STATE DOC, NEW YORK 7 9VARICK SPC, NEW YORK 118 132YORK, PENNSYLVANIA 165 205TOTAL 32,961 40,545

Executive Office for Immigration Review Office of Planning, Analysis, and TechnologyFY 2010 Statistical Year Book January 2011
J1
Immigration Courts:Asylum Grants by Nationality
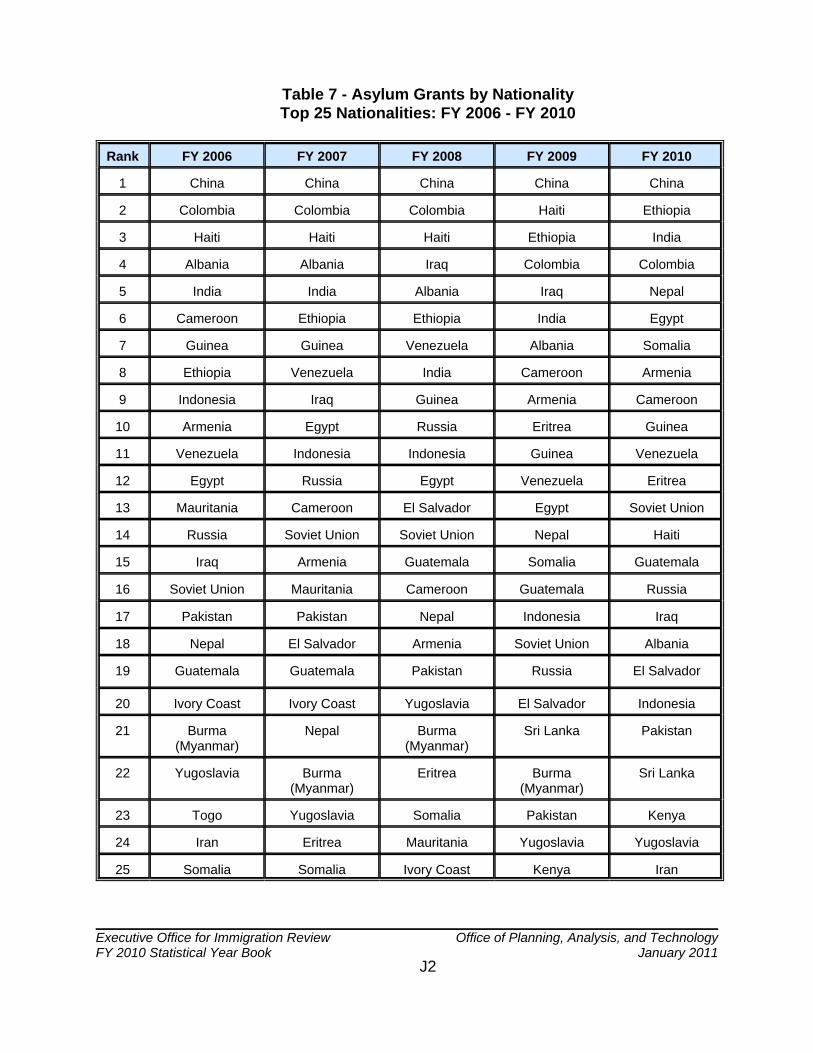
This section provides information on asylum grants by nationality. Figure 15displays the top 10 nationalities granted asylum in FY 2010. In FY 2010, the top 10nationalities accounted for 60 percent of all asylum grants. China accounted for 38percent of all asylum grants. A total of 148 nationalities were represented among casesgranted asylum in FY 2010. Table 7, on the following page, provides information forcomparative purposes on the top nationalities granted asylum for the period FY 2006 toFY 2010. Four nationalities were represented among the top 10 nationalities grantedasylum each year during the five-year period: China, Colombia, India, and Ethiopia. Formore complete information on asylum data by nationality see: http://www.justice.gov/eoir/efoia/FY10AsyStats.pdf.
FY 2010 Asylum GrantsBy Nationality
China 38.45%
All Others 40.02%
Ethiopia 4.12%
India 2.44%
Colombia 2.37%Nepal 2.33%
Guinea 1.88%
Cameroon 1.99%
Armenia 2.09%
Somalia 2.11%Egypt 2.19%
Figure 15
Nationality Cases % of TotalChina 3,795 38.45%Ethiopia 407 4.12%India 241 2.44%Colombia 234 2.37%Nepal 230 2.33%Egypt 216 2.19%Somalia 208 2.11%Armenia 206 2.09%Cameroon 196 1.99%Guinea 186 1.88%All Others 3,950 40.02%Total 9,869 100.00%
FY 2010 Asylum Grants by Nationality
Executive Office for Immigration Review Office of Planning, Analysis, and TechnologyFY 2010 Statistical Year Book January 2011
J2
Table 7 - Asylum Grants by NationalityTop 25 Nationalities: FY 2006 - FY 2010
Rank FY 2006 FY 2007 FY 2008 FY 2009 FY 2010
1 China China China China China
2 Colombia Colombia Colombia Haiti Ethiopia
3 Haiti Haiti Haiti Ethiopia India
4 Albania Albania Iraq Colombia Colombia
5 India India Albania Iraq Nepal
6 Cameroon Ethiopia Ethiopia India Egypt
7 Guinea Guinea Venezuela Albania Somalia
8 Ethiopia Venezuela India Cameroon Armenia
9 Indonesia Iraq Guinea Armenia Cameroon
10 Armenia Egypt Russia Eritrea Guinea
11 Venezuela Indonesia Indonesia Guinea Venezuela
12 Egypt Russia Egypt Venezuela Eritrea
13 Mauritania Cameroon El Salvador Egypt Soviet Union
14 Russia Soviet Union Soviet Union Nepal Haiti
15 Iraq Armenia Guatemala Somalia Guatemala
16 Soviet Union Mauritania Cameroon Guatemala Russia
17 Pakistan Pakistan Nepal Indonesia Iraq
18 Nepal El Salvador Armenia Soviet Union Albania
19 Guatemala Guatemala Pakistan Russia El Salvador
20 Ivory Coast Ivory Coast Yugoslavia El Salvador Indonesia
21 Burma(Myanmar)
Nepal Burma(Myanmar)
Sri Lanka Pakistan
22 Yugoslavia Burma(Myanmar)
Eritrea Burma(Myanmar)
Sri Lanka
23 Togo Yugoslavia Somalia Pakistan Kenya
24 Iran Eritrea Mauritania Yugoslavia Yugoslavia
25 Somalia Somalia Ivory Coast Kenya Iran

Executive Office for Immigration Review Office of Planning, Analysis, and TechnologyFY 2010 Statistical Year Book January 2011
K1
Immigration Courts:Disposition of Asylum Cases
During removal proceedings an alien may request asylum as relief from removal. The immigration judge must then decide whether to deny or grant an alien’s applicationfor asylum. If the asylum applicant fails to appear for a scheduled court hearing, theapplication is considered abandoned. In other instances, the asylum applicant choosesto withdraw his or her application for asylum. EOIR tracks each of these possibleoutcomes as completed cases: grants, denials, withdrawals, and abandoned applicationsfor asylum.
A substantial number of closed cases do not fall into one of the four categorieslisted above, and are counted as “other” asylum completions, e.g., change of venue toanother court. Further, in some instances, an alien with a pending asylum claim mayapply for and be granted another type of relief besides asylum, and this is also recordedas an “other” completion.
Figure 16 provides the asylum grant rate for the past five years. The grant rate iscalculated as a percentage of asylum claims decided on the merits, i.e., grants anddenials. The grant rate has increased from FY 2006 (45%) to FY 2010 (51%).
Immigration CourtsAsylum Grant Rate
48% 51%46%45% 45%
0%
20%
40%
60%
80%
100%
FY 06 FY 07 FY 08 FY 09 FY 10
Figure 16
Grants Denials Grant RateFY 06 13,304 16,477 45%FY 07 12,859 14,874 46%FY 08 10,881 13,167 45%FY 09 10,298 11,334 48%FY 10 9,869 9,554 51%
Asylum Grant Rate

Executive Office for Immigration Review Office of Planning, Analysis, and TechnologyFY 2010 Statistical Year Book January 2011
K2
There is some difference in the grant rates depending on whether the asylumapplication was filed affirmatively or defensively. There are two ways that aliens mayrequest asylum: “affirmatively,” by completing an asylum application and filing it with aDHS Asylum Office; or “defensively,” by requesting asylum before an immigration judge. From FY 2006 to FY 2010, grant rates for affirmative asylum claims were higher thangrant rates for defensive claims. The grant rate for affirmative asylum claims hassignificantly increased from FY 2006 to FY 2010, where defensive claims have remainedfairly consistent. Figures 17 and 18 show the grant rates for affirmative and defensiveasylum claims.
Immigration CourtsAffirmative Grant Rate
61%55%51%51% 51%
0%
20%
40%
60%
80%
100%
FY 06 FY 07 FY 08 FY 09 FY 10
Figure 17
Grants Denials Grant RateFY 06 9,530 9,020 51%FY 07 8,427 7,953 51%FY 08 7,356 7,051 51%FY 09 7,262 5,940 55%FY 10 7,088 4,508 61%
Immigration Court Affirmative Grant Rate
Immigration CourtsDefensive Grant Rate
36% 35%37%34% 39%
0%
20%
40%
60%
80%
100%
FY 06 FY 07 FY 08 FY 09 FY 10
Figure 18
Grants Denials Grant RateFY 06 3,774 7,457 34%FY 07 4,426 6,921 39%FY 08 3,520 6,116 37%FY 09 3,030 5,394 36%FY 10 2,771 5,046 35%
Immigration Court Defensive Grant Rate

Executive Office for Immigration Review Office of Planning, Analysis, and TechnologyFY 2010 Statistical Year Book January 2011
K3
Figure 19 illustrates graphically all asylum case completions broken out bydisposition. Each of the dispositions has shown a significant decrease from FY 2006 toFY 2010. These decreases are mutually related to the overall decrease in asylumcompletions.
Asylum CompletionsBy Disposition
0
5,000
10,000
15,000
20,000
FY 06 FY 07 FY 08 FY 09 FY 10
Grants Denials Withdraw n Abandoned Other
Figure 19
Grants Denials Withdrawn Abandoned Other TotalFY 06 13,304 16,477 10,324 3,918 13,841 57,864FY 07 12,859 14,874 8,405 3,985 15,639 55,762FY 08 10,881 13,167 7,676 3,449 11,008 46,181FY 09 10,298 11,334 7,264 3,406 12,366 44,668FY 10 9,869 9,554 7,194 1,799 12,129 40,545
Asylum Completions by Disposition
Executive Office for Immigration Review Office of Planning, Analysis, and TechnologyFY 2010 Statistical Year Book January 2011
K4
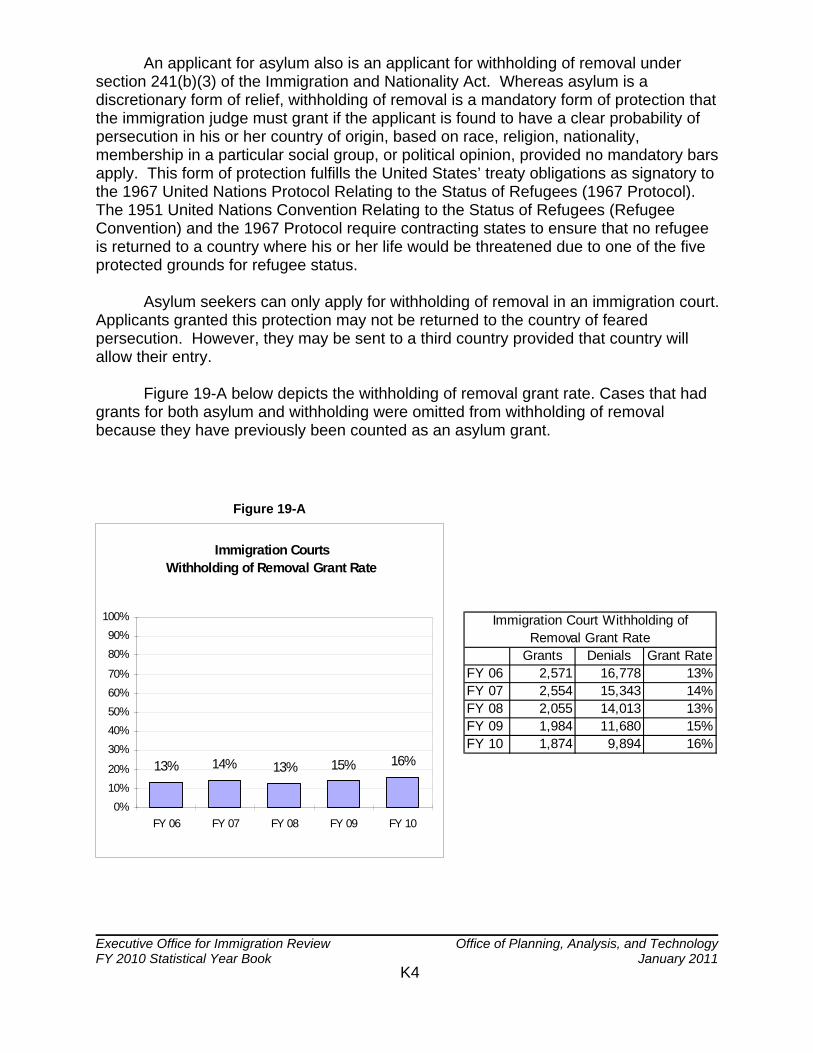
An applicant for asylum also is an applicant for withholding of removal undersection 241(b)(3) of the Immigration and Nationality Act. Whereas asylum is adiscretionary form of relief, withholding of removal is a mandatory form of protection thatthe immigration judge must grant if the applicant is found to have a clear probability ofpersecution in his or her country of origin, based on race, religion, nationality,membership in a particular social group, or political opinion, provided no mandatory barsapply. This form of protection fulfills the United States’ treaty obligations as signatory tothe 1967 United Nations Protocol Relating to the Status of Refugees (1967 Protocol).The 1951 United Nations Convention Relating to the Status of Refugees (RefugeeConvention) and the 1967 Protocol require contracting states to ensure that no refugeeis returned to a country where his or her life would be threatened due to one of the fiveprotected grounds for refugee status.
Asylum seekers can only apply for withholding of removal in an immigration court.Applicants granted this protection may not be returned to the country of fearedpersecution. However, they may be sent to a third country provided that country willallow their entry.
Figure 19-A below depicts the withholding of removal grant rate. Cases that hadgrants for both asylum and withholding were omitted from withholding of removalbecause they have previously been counted as an asylum grant.
Immigration CourtsWithholding of Removal Grant Rate
15%13%13% 14% 16%
0%10%20%
30%40%50%60%70%
80%90%
100%
FY 06 FY 07 FY 08 FY 09 FY 10
Figure 19-A
Grants Denials Grant RateFY 06 2,571 16,778 13%FY 07 2,554 15,343 14%FY 08 2,055 14,013 13%FY 09 1,984 11,680 15%FY 10 1,874 9,894 16%
Immigration Court Withholding of Removal Grant Rate

Executive Office for Immigration Review Office of Planning, Analysis, and TechnologyFY 2010 Statistical Year Book January 2011
K5
Figure 19-B shows the percentage of cases in which asylum or withholding ofremoval was granted. The grant rate has increased eight percent from FY 2006 to FY2010.
Table 8, on the following page, provides information on the FY 2010 asylum grantrate for each individual immigration court.
Immigration CourtsAsylum or Withholding of Removal Grant Rate
60%56%54%52% 53%
0%
10%
20%
30%
40%
50%
60%
70%
80%
90%
100%
FY 06 FY 07 FY 08 FY 09 FY 10
Figure 19-B
Asylum GrantsWithholding of
Removal Grants
Denials of Both Asylum and Withholding of
RemovalGrant Rate
FY 06 13,304 2,571 14,452 52%FY 07 12,859 2,554 13,048 54%FY 08 10,881 2,055 11,630 53%FY 09 10,298 1,984 9,625 56%FY 10 9,869 1,874 7,906 60%
Immigration Court Asylum or Withholding of Removal Grant Rate

Executive Office for Immigration Review Office of Planning, Analysis, and TechnologyFY 2010 Statistical Year Book January 2011
K6
Table 8 - FY 2010 Asylum Grant Rate by Immigration Court
Immigration Court Grants Denials Grant RateARLINGTON, VIRGINIA 455 136 77%ATLANTA, GEORGIA 40 133 23%BALTIMORE, MARYLAND 281 177 61%BATAVIA SPC, NEW YORK 4 38 10%BLOOMINGTON (ST. PAUL), MINNESOTA 44 147 23%BOSTON, MASSACHUSETTS 271 336 45%BUFFALO, NEW YORK 17 46 27%CHARLOTTE, NORTH CAROLINA 45 104 30%CHICAGO, ILLINOIS 180 172 51%CLEVELAND, OHIO 126 319 28%DALLAS, TEXAS 42 57 42%DENVER, COLORADO 61 102 37%DETROIT, MICHIGAN 72 125 37%EAST MESA, CALIFORNIA 34 29 54%EL CENTRO SPC, CALIFORNIA 11 43 20%EL PASO SPC, TEXAS 1 25 4%EL PASO, TEXAS 1 75 1%ELIZABETH SPC, NEW JERSEY 47 61 44%ELOY, ARIZONA 9 125 7%FISHKILL - NEW YORK STATE DOC, NEW YORK 0 7 0%FLORENCE SPC, ARIZONA 14 78 15%GUAYNABO (SAN JUAN), PUERTO RICO 1 17 6%HARLINGEN, TEXAS 8 30 21%HARTFORD, CONNECTICUT 48 99 33%HONOLULU, HAWAII 58 55 51%HOUSTON SPC, TEXAS 3 64 4%HOUSTON, TEXAS 66 148 31%IMPERIAL, CALIFORNIA 2 22 8%KANSAS CITY, MISSOURI 43 97 31%KROME NORTH SPC, FLORIDA 12 217 5%LANCASTER, CALIFORNIA 24 72 25%LAS VEGAS, NEVADA 42 43 49%LOS ANGELES, CALIFORNIA 1,167 1,426 45%LOS FRESNOS (PORT ISABEL SPC), TEXAS 5 34 13%MEMPHIS, TENNESSEE 119 111 52%MIAMI, FLORIDA 353 709 33%NEW ORLEANS, LOUISIANA 16 42 28%NEW YORK CITY, NEW YORK 4,215 1,313 76%NEWARK, NEW JERSEY 264 239 52%OAKDALE FEDERAL DETENTION CENTER, LOUISIANA 1 38 3%OMAHA, NEBRASKA 49 180 21%ORLANDO, FLORIDA 286 668 30%PHILADELPHIA, PENNSYLVANIA 92 97 49%PHOENIX, ARIZONA 55 62 47%PORTLAND, OREGON 53 50 51%SAIPAN, NORTHERN MARIANAS ISLANDS 0 0 0%SALT LAKE CITY, UTAH 30 43 41%SAN ANTONIO, TEXAS 113 124 48%SAN DIEGO, CALIFORNIA 165 145 53%SAN FRANCISCO, CALIFORNIA 523 512 51%SEATTLE, WASHINGTON 200 274 42%STEWART DETENTION FACILITY, GEORGIA 0 20 0%TACOMA, WASHINGTON 53 105 34%TUCSON, ARIZONA 22 9 71%ULSTER - NEW YORK STATE DOC, NEW YORK 0 4 0%VARICK SPC, NEW YORK 23 51 31%YORK, PENNSYLVANIA 3 99 3%TOTAL 9,869 9,554 51%

Executive Office for Immigration Review Office of Planning, Analysis, and TechnologyFY 2010 Statistical Year Book January 2011L1
Immigration Courts:Expedited Asylum Cases
There are two ways that aliens may request asylum: “affirmatively,” bycompleting an asylum application and filing it with a DHS Asylum Office; or“defensively,” by requesting asylum before an immigration judge. Aliens who fileaffirmatively with DHS, but whose requests for asylum are not granted, are placed inremoval proceedings and referred to the appropriate immigration court for a hearing.
Asylum regulations implemented in 1995 called for asylum applications to beprocessed within 180 days after filing. The Illegal Immigration Reform and ImmigrantResponsibility Act (IIRIRA) of 1996 reiterated that time frame and calls for theadministrative adjudication of an asylum application within 180 days of the applicationfiling date, absent exceptional circumstances. This process is time sensitive becausethe asylum applicant may not apply for employment authorization until 150 days afterfiling, and DHS then has 30 days to grant or deny employment authorization. Theapplicant can only be granted employment authorization if the asylum application hasnot been decided within 180 days of filing, provided there are no delays caused by thealien. Consequently, expedited processing of asylum applications occurs when (1) analien files “affirmatively” at a DHS Asylum Office and the application is referred to EOIRwithin 75 days of filing; or (2) an alien files an asylum application “defensively” withEOIR.
As shown in Figure 20 below, expedited asylum cases have decreased by 28percent from FY 2006 to FY 2010. Total asylum receipts have decreased by 42 percentfrom FY 2006 to FY 2010.
Expedited Asylum Receipts Compared to Total Asylum Receipts
0 10,000 20,000 30,000 40,000 50,000 60,000 70,000
FY 10
FY 09
FY 08
FY 07
FY 06
Total Asylum Receipts Number of Expedited Asylum Receipts
Figure 20
Number of Expedited Asylum Receipts
Total Asylum Receipts
FY 06 35,391 56,969FY 07 31,688 57,515FY 08 29,952 47,442FY 09 30,846 44,022FY 10 25,401 32,961
Expedited Asylum Receipts

Executive Office for Immigration Review Office of Planning, Analysis, and TechnologyFY 2010 Statistical Year Book January 2011L2
Depicted in Figure 21 below are the number of receipts and completions forexpedited asylum cases between FY 2006 and FY 2010.
Expedited Asylum Receipts and Completions
25,000
30,000
35,000
40,000
FY 06 FY 07 FY 08 FY 09 FY 10
Receipts Completions
Figure 21
Receipts CompletionsFY 06 35,391 38,819FY 07 31,688 34,281FY 08 29,952 28,495FY 09 30,846 26,582FY 10 25,401 27,827
Expedited Asylum Receipts and Completions FY 2006 - FY 2010

Executive Office for Immigration Review Office of Planning, Analysis, and TechnologyFY 2010 Statistical Year Book January 2011
M1
Immigration Courts:Convention Against Torture
In 1999, the Department of Justice implemented regulations regarding the UnitedNations Convention Against Torture and other Cruel, Inhuman or Degrading Treatmentor Punishment (Convention Against Torture or CAT). Under these regulations, aliens inremoval, deportation, or exclusion proceedings may claim that they “more likely thannot” will be tortured if removed from the United States. The regulation providesjurisdiction to the immigration courts to hear these claims, and provides jurisdiction tothe BIA to hear appeals from the immigration courts’ decisions regarding CAT claims.
There are two forms of protection under the 1999 regulations:
• The regulation established a new form of withholding of removal which isgranted to an alien who establishes that he or she would be tortured in theproposed country of removal.
• The second protection concerns aliens who would be tortured in the countryof removal, but who are barred from withholding of removal. These aliensmay be granted deferral of removal, a form of protection that is more easilyand quickly terminated if it becomes possible to remove the alien.
As shown in Table 9 below, the immigration courts adjudicated 24,754 CATapplications during FY 2010. Of those, 489 CAT cases were granted, the majority ofwhich were granted withholding.
Table 9 - FY 2010 Convention Against Torture Cases by DispositionGranted
Denied Other Withdrawn Abandoned TotalWithholding Deferral Total
395 94 489 9,082 8,501 5,877 805 24,754
Table 10 on the following page shows a breakdown of CAT completions byimmigration courts. The New York City, NY; Los Angeles, CA; Miami, FL; Orlando, FL;and San Francisco, CA, immigration courts combined completed approximately 59percent of the total FY 2010 CAT cases.

Executive Office for Immigration Review Office of Planning, Analysis, and TechnologyFY 2010 Statistical Year Book January 2011
M2
Table 10 - FY 2010 Convention Against Torture Completions by Court Immigration Court Completions
ARLINGTON, VIRGINIA 467ATLANTA, GEORGIA 105BALTIMORE, MARYLAND 382BATAVIA SPC, NEW YORK 67BLOOMINGTON (ST. PAUL), MINNESOTA 273BOSTON, MASSACHUSETTS 503BUFFALO, NEW YORK 76CHARLOTTE, NORTH CAROLINA 266CHICAGO, ILLINOIS 309CLEVELAND, OHIO 531DALLAS, TEXAS 139DENVER, COLORADO 104DETROIT, MICHIGAN 374EAST MESA, CALIFORNIA 84EL CENTRO SPC, CALIFORNIA 73EL PASO SPC, TEXAS 26EL PASO, TEXAS 92ELIZABETH SPC, NEW JERSEY 181ELOY, ARIZONA 196FISHKILL - NEW YORK STATE DOC, NEW YORK 35FLORENCE SPC, ARIZONA 145GUAYNABO (SAN JUAN), PUERTO RICO 135HARLINGEN, TEXAS 105HARTFORD, CONNECTICUT 122HONOLULU, HAWAII 63HOUSTON SPC, TEXAS 83HOUSTON, TEXAS 182IMPERIAL, CALIFORNIA 24KANSAS CITY, MISSOURI 97KROME NORTH SPC, FLORIDA 433LANCASTER, CALIFORNIA 181LAS VEGAS, NEVADA 140LOS ANGELES, CALIFORNIA 4,023LOS FRESNOS (PORT ISABEL SPC), TEXAS 83MEMPHIS, TENNESSEE 260MIAMI, FLORIDA 2,694NEW ORLEANS, LOUISIANA 67NEW YORK CITY, NEW YORK 4,306NEWARK, NEW JERSEY 663OAKDALE FEDERAL DETENTION CENTER, LOUISIANA 72OMAHA, NEBRASKA 97ORLANDO, FLORIDA 1,970PHILADELPHIA, PENNSYLVANIA 353PHOENIX, ARIZONA 48PORTLAND, OREGON 111SAIPAN, NORTHERN MARIANAS ISLANDS 1SALT LAKE CITY, UTAH 42SAN ANTONIO, TEXAS 463SAN DIEGO, CALIFORNIA 416SAN FRANCISCO, CALIFORNIA 1,613SEATTLE, WASHINGTON 694STEWART DETENTION FACILITY, GEORGIA 19TACOMA, WASHINGTON 242TUCSON, ARIZONA 7ULSTER - NEW YORK STATE DOC, NEW YORK 50VARICK SPC, NEW YORK 197YORK, PENNSYLVANIA 270TOTAL 24,754

Executive Office for Immigration Review Office of Planning, Analysis, and TechnologyFY 2010 Statistical Year Book January 2011N1
Immigration Courts:Proceedings Completed with Applications for Relief
Some aliens who are found deportable may be eligible for relief from removal. Aliens apply for various forms of relief by completing the appropriate application. Specific types of relief for aliens in proceedings are discussed in other sections of thisYear Book. Asylum is addressed in more detail in Tabs I, J, K, and L. Otherapplications for relief are addressed in Tab R. Tab M provides information aboutprotection afforded certain aliens under the United Nations Convention Against Torture. For the purpose of this Year Book, voluntary departure (discussed in Tab Q) is notconsidered an application for relief.
Figure 22 provides information on the percent of cases where the alien filed anapplication for relief. Generally, cases with no applications for relief are processedfaster and expend fewer court resources.
Table 11 on page N2 shows the number and percentage of proceedingscompleted with applications for relief at each immigration court in FY 2010. Typically,courts along the United States border, courts co-located with DHS detention facilities,and courts which handle Institutional Hearing Program cases involving criminal aliensreceive fewer applications for relief. Courts with a low percentage of applications forrelief (10 percent or less) are shown in red. Courts where 50 percent or more of thecompletions involved applications for relief are shown in blue.
Immigration Court Proceedings Percent Completions w ith Applications
25% 25% 25%26% 29%
0%
10%
20%
30%
40%
50%
60%
70%
80%
90%
100%
FY 06 FY 07 FY 08 FY 09 FY 10
Figure 22
Court Completions (Proceedings) with and without Applications for Relief
FY 06 83,344 26% 240,696 74% 324,040FY 07 78,490 29% 194,978 71% 273,468FY 08 69,835 25% 211,381 75% 281,216FY 09 71,419 25% 219,016 75% 290,435FY 10 71,924 25% 215,283 75% 287,207
With Applications Without Applications TotalPercent with Applications
Percent Without Applications

Executive Office for Immigration Review Office of Planning, Analysis, and TechnologyFY 2010 Statistical Year Book January 2011N2
Table 11 - FY 2010 Immigration Court Completions (Proceedings) With Applications for Relief
ARLINGTON, VIRGINIA 6,484 2,086 32%ATLANTA, GEORGIA 5,257 1,062 20%BALTIMORE, MARYLAND 3,613 1,594 44%BATAVIA SPC, NEW YORK 1,278 115 9%BLOOMINGTON (ST. PAUL), MINNESOTA 3,913 686 18%BOSTON, MASSACHUSETTS 6,322 2,677 42%BUFFALO, NEW YORK 2,465 376 15%CHARLOTTE, NORTH CAROLINA 3,629 796 22%CHICAGO, ILLINOIS 8,913 1,472 17%CLEVELAND, OHIO 4,751 1,035 22%DALLAS, TEXAS 8,057 991 12%DENVER, COLORADO 7,326 1,013 14%DETROIT, MICHIGAN 4,082 733 18%EAST MESA, CALIFORNIA 986 162 16%EL CENTRO SPC, CALIFORNIA 1,707 231 14%EL PASO SPC, TEXAS 3,766 295 8%EL PASO, TEXAS 6,770 724 11%ELIZABETH SPC, NEW JERSEY 1,740 252 14%ELOY, ARIZONA 7,231 1,887 26%FISHKILL - NEW YORK STATE DOC, NEW YORK 328 44 13%FLORENCE SPC, ARIZONA 4,683 632 13%GUAYNABO (SAN JUAN), PUERTO RICO 1,705 680 40%HARLINGEN, TEXAS 8,768 605 7%HARTFORD, CONNECTICUT 1,751 593 34%HONOLULU, HAWAII 827 275 33%HOUSTON SPC, TEXAS 11,002 530 5%HOUSTON, TEXAS 4,818 1,743 36%IMPERIAL, CALIFORNIA 1,157 196 17%KANSAS CITY, MISSOURI 4,574 790 17%KROME NORTH SPC, FLORIDA 8,217 1,187 14%LANCASTER, CALIFORNIA 4,820 547 11%LAS VEGAS, NEVADA 3,556 650 18%LOS ANGELES, CALIFORNIA 18,721 10,613 57%LOS FRESNOS (PORT ISABEL SPC), TEXAS 2,275 234 10%MEMPHIS, TENNESSEE 2,933 715 24%MIAMI, FLORIDA 13,225 5,688 43%NEW ORLEANS, LOUISIANA 947 234 25%NEW YORK CITY, NEW YORK 16,000 10,371 65%NEWARK, NEW JERSEY 6,133 1,756 29%OAKDALE FEDERAL DETENTION CENTER, LOUISIANA 9,009 279 3%OMAHA, NEBRASKA 3,871 824 21%ORLANDO, FLORIDA 5,204 3,128 60%PHILADELPHIA, PENNSYLVANIA 2,255 827 37%PHOENIX, ARIZONA 3,427 843 25%PORTLAND, OREGON 986 365 37%SAIPAN, NORTHERN MARIANAS ISLANDS 53 2 4%SALT LAKE CITY, UTAH 2,834 343 12%SAN ANTONIO, TEXAS 12,721 1,091 9%SAN DIEGO, CALIFORNIA 3,106 1,353 44%SAN FRANCISCO, CALIFORNIA 9,365 3,598 38%SEATTLE, WASHINGTON 3,209 1,203 37%STEWART DETENTION FACILITY, GEORGIA 7,401 102 1%TACOMA, WASHINGTON 6,342 494 8%TUCSON, ARIZONA 5,417 123 2%ULSTER - NEW YORK STATE DOC, NEW YORK 504 80 16%VARICK SPC, NEW YORK 1,313 468 36%YORK, PENNSYLVANIA 5,460 531 10%TOTAL 287,207 71,924 25%
Percent With Applications
# of Completions With Applications
Total Completions
Immigration Court

Executive Office for Immigration Review Office of Planning, Analysis, and TechnologyFY 2010 Statistical Year Book January 2011
O1
Immigration Courts:Proceedings Completed for Detained Cases
Under the Immigration and Nationality Act, DHS has authority to detain an alienpending a decision on whether or not the alien is removable. Immigration courtsconduct hearings for both detained and non-detained aliens, and EOIR maintains dataon the custody status of aliens in proceedings.
Detention locations include DHS Service Processing Centers, DHS contractdetention facilities, state and local government jails, and Bureau of Prisons institutions. For the purpose of this Year Book, Institutional Hearing Program (IHP) cases areconsidered detained cases (IHP is discussed further in Tab P). Figure 23 belowprovides a comparison of detained completions to total proceedings completed. Thepercent detained increased yearly from FY 2006 to FY 2009. In FY 2010, the percentof detained completions decreased by six percent from FY 2009.
Immigration Court ProceedingsCompleted: Detained and Total
0 50,000 100,000 150,000 200,000 250,000 300,000 350,000
FY 10
FY 09
FY 08
FY 07
FY 06
Proceedings for Detained Aliens Total Proceedings Completed
Figure 23
Immigration Court (Proceedings) Completions
FY 06 95,783 324,040 30%FY 07 115,816 273,468 42%FY 08 134,416 281,216 48%FY 09 144,970 290,435 50%FY 10 125,580 287,207 44%
Proceedings Completed for Detained Aliens (Including IHP)Proceedings for Detained Aliens
Total Proceedings Completed
Percent Detained
Executive Office for Immigration Review Office of Planning, Analysis, and TechnologyFY 2010 Statistical Year Book January 2011
O2
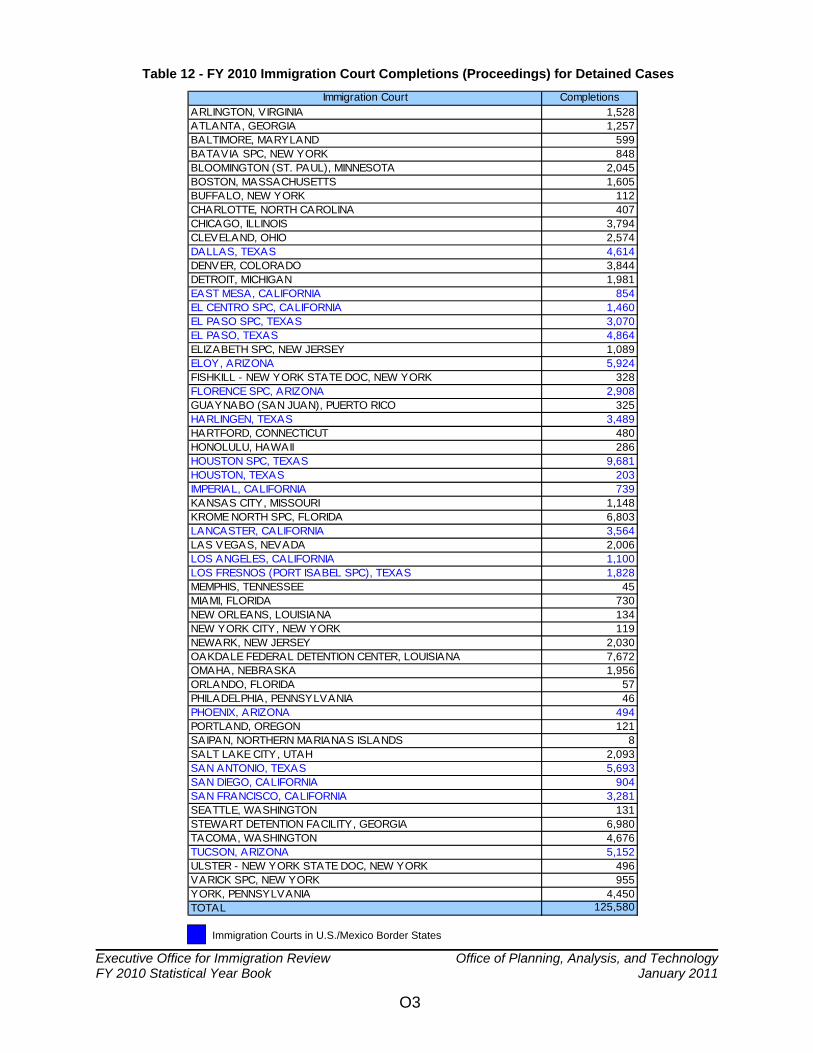
Table 12 on the following page provides information, by immigration court, on FY2010 detained completions. The immigration courts in Houston SPC, TX; Oakdale, LA;Stewart Detention, GA; Krome, FL; Eloy, AZ; San Antonio, TX; and Tucson, AZ, eachcompleted more than 5,000 detained proceedings in FY 2010. Overall, immigrationcourts located in three border states – Texas, Arizona, and California – accounted for 48percent of the detained completions in FY 2010. Courts in those three states arehighlighted in blue in Table 12.
Executive Office for Immigration Review Office of Planning, Analysis, and TechnologyFY 2010 Statistical Year Book January 2011
O3
Table 12 - FY 2010 Immigration Court Completions (Proceedings) for Detained Cases
Immigration Courts in U.S./Mexico Border States
Immigration Court CompletionsARLINGTON, VIRGINIA 1,528ATLANTA, GEORGIA 1,257BALTIMORE, MARYLAND 599BATAVIA SPC, NEW YORK 848BLOOMINGTON (ST. PAUL), MINNESOTA 2,045BOSTON, MASSACHUSETTS 1,605BUFFALO, NEW YORK 112CHARLOTTE, NORTH CAROLINA 407CHICAGO, ILLINOIS 3,794CLEVELAND, OHIO 2,574DALLAS, TEXAS 4,614DENVER, COLORADO 3,844DETROIT, MICHIGAN 1,981EAST MESA, CALIFORNIA 854EL CENTRO SPC, CALIFORNIA 1,460EL PASO SPC, TEXAS 3,070EL PASO, TEXAS 4,864ELIZABETH SPC, NEW JERSEY 1,089ELOY, ARIZONA 5,924FISHKILL - NEW YORK STATE DOC, NEW YORK 328FLORENCE SPC, ARIZONA 2,908GUAYNABO (SAN JUAN), PUERTO RICO 325HARLINGEN, TEXAS 3,489HARTFORD, CONNECTICUT 480HONOLULU, HAWAII 286HOUSTON SPC, TEXAS 9,681HOUSTON, TEXAS 203IMPERIAL, CALIFORNIA 739KANSAS CITY, MISSOURI 1,148KROME NORTH SPC, FLORIDA 6,803LANCASTER, CALIFORNIA 3,564LAS VEGAS, NEVADA 2,006LOS ANGELES, CALIFORNIA 1,100LOS FRESNOS (PORT ISABEL SPC), TEXAS 1,828MEMPHIS, TENNESSEE 45MIAMI, FLORIDA 730NEW ORLEANS, LOUISIANA 134NEW YORK CITY, NEW YORK 119NEWARK, NEW JERSEY 2,030OAKDALE FEDERAL DETENTION CENTER, LOUISIANA 7,672OMAHA, NEBRASKA 1,956ORLANDO, FLORIDA 57PHILADELPHIA, PENNSYLVANIA 46PHOENIX, ARIZONA 494PORTLAND, OREGON 121SAIPAN, NORTHERN MARIANAS ISLANDS 8SALT LAKE CITY, UTAH 2,093SAN ANTONIO, TEXAS 5,693SAN DIEGO, CALIFORNIA 904SAN FRANCISCO, CALIFORNIA 3,281SEATTLE, WASHINGTON 131STEWART DETENTION FACILITY, GEORGIA 6,980TACOMA, WASHINGTON 4,676TUCSON, ARIZONA 5,152ULSTER - NEW YORK STATE DOC, NEW YORK 496VARICK SPC, NEW YORK 955YORK, PENNSYLVANIA 4,450TOTAL 125,580

Executive Office for Immigration Review Office of Planning, Analysis, and TechnologyFY 2010 Statistical Year Book January 2011
P1
Immigration Courts:Institutional Hearing Program Case Processing
The Institutional Hearing Program (IHP) is a cooperative effort between EOIR;DHS; and various federal, state, and municipal corrections agencies. The goal of theIHP is to complete proceedings for incarcerated criminal aliens serving federal or statesentences prior to their release from prison or jail. This allows DHS to remove alienswith final removal orders expeditiously at the time of their release from incarceration.
In FY 2010, DHS filed charging documents with the immigration courts forincarcerated aliens in 75 different institutions. Immigration judges and court stafftraveled to these institutions to conduct IHP hearings.
Figure 24 provides information on IHP receipts and completions for FY 2006 - FY2010. IHP receipts declined by 21 percent from FY 2006 to FY 2010. IHP completionsdecreased by 23 percent from FY 2006 to FY 2010.
IHP CasesReceived and Completed
5,0005,5006,0006,5007,0007,5008,0008,5009,000
FY 06 FY 07 FY 08 FY 09 FY 10
Receipts Completions
Figure 24
Receipts CompletionsFY 06 7,314 7,556FY 07 7,559 7,103FY 08 7,150 7,261FY 09 6,430 6,450FY 10 5,747 5,794
IHP Cases

Executive Office for Immigration Review Office of Planning, Analysis, and TechnologyFY 2010 Statistical Year Book January 2011
P2
Table 13 provides a breakdown of IHP completions by disposition – eitherthrough an immigration judge decision or through an “other completion,” such as anadministrative closure or change of venue.
Table 13IHP Completions by Disposition
FY 06 FY 07 FY 08 FY 09 FY 10
Total Decisions in IHP Cases 6,021 5,482 5,612 4,928 4,415
Removal 5,762 5,234 5,373 4,713 4,287
Termination 192 209 180 137 102
Relief 54 24 33 31 16
Other 13 15 26 47 10
Other Completions 1,535 1,621 1,649 1,522 1,379
Total Completions 7,556 7,103 7,261 6,450 5,794

Executive Office for Immigration Review Office of Planning, Analysis, and TechnologyFY 2010 Statistical Year Book January 2011
Q1
Immigration Courts:Immigration Judge Grants of Voluntary Departure
Under certain circumstances, an immigration judge may allow an alien to departthe United States voluntarily. An alien allowed to depart voluntarily concedesremovability, but is not barred from future re-entry. Failure to depart within the timegranted subjects the alien to a fine, and makes the alien ineligible for voluntarydeparture and several forms of relief for a ten-year period.
Prior to the completion of proceedings, aliens may request voluntary departurein lieu of removal. The immigration judge has discretion to grant up to 120 days for thealien to depart voluntarily if the alien is able to pay for his or her removal, and if he orshe is not removable as an aggravated felon or a terrorist.
Immigration judges also have discretion in certain cases to grant voluntarydeparture in lieu of removal at the conclusion of proceedings. If the judge finds that thealien has been present in the United States for one year immediately preceding theissuance of the Notice to Appear, has been a person of good moral character for thepast five years, is not removable under aggravated felony or terrorist grounds, and hasthe means to depart the United States and intends to do so, the immigration judge maygrant up to 60 days for the alien to depart voluntarily. Aliens allowed to departvoluntarily are not barred from re-entry.
Voluntary departure is considered a form of removal, not a type of relief. Immigration judge decisions on proceedings (as discussed in Tab D) include grants ofvoluntary departure under removal. Table 14 shows the percentage of removal ordersthat are grants of voluntary departure.
Table 14 - IJ Removal Decisions Compared to Voluntary Departure Decisions
FY 06 222,211 22,212 10%FY 07 170,291 23,971 14%FY 08 182,720 26,684 15%FY 09 185,410 26,878 14%FY 10 166,424 27,560 17%
Total Removal Decisions
Voluntary Departure Decisions
Percent Voluntary Departure Decisions

Executive Office for Immigration Review Office of Planning, Analysis, and TechnologyFY 2010 Statistical Year Book January 2011R1
Immigration Courts:Applications for Relief other than Asylum
Although asylum is the most common form of relief requested before animmigration judge, other forms of relief are also granted to eligible aliens. (See Tabs I-Lfor information on asylum, and Tab M for information on protection granted under theConvention Against Torture.)
This tab describes other forms of relief such as adjustment of status; suspensionand cancellation; and Section 212(c) relief. The Illegal Immigration Reform andImmigrant Responsibility Act of 1996 (IIRIRA) provided a new form of relief calledcancellation of removal. Cancellation of removal was intended to replace the formerImmigration and Nationality Act Section 212(c) waiver and suspension of deportation. Table 15 on page R3 provides information on relief granted under the followingprovisions.
• Adjustment of Status is a type of relief from deportation, removal, or exclusion, foran alien who is eligible for lawful permanent resident status based on a visapetition approved by DHS. Normally, the visa petition has been filed by a UnitedStates citizen spouse.
• Prior to the passage of IIRIRA, Section 212(c) of the Immigration and NationalityAct provided relief from deportation for long-term lawful permanent residents whohad committed a crime. In order to be eligible to apply for 212(c) relief, anapplicant had to show that he or she had been a lawful permanent resident for atleast seven years, had served less than five years of a sentence if the underlyingcrime was classified as an aggravated felony, had been rehabilitated, and had noother criminal record. If an applicant in exclusion or deportation proceedings isable to establish these factors, the immigration judge has discretion to grant reliefunder 212(c).
• Suspension of Deportation is another pre-IIRIRA form of discretionary relief. Certain aliens in deportation proceedings who have maintained continuousphysical presence in the United States for specific periods of time, and have metthe other statutory requirements may be granted suspension of deportation andadjustment of status to that of lawful permanent resident. The total number ofadjustments to lawful permanent resident status under suspension of deportationor cancellation of removal is limited to a 4,000 annual cap under IIRIRA. Applicants for suspension of deportation who applied for this relief prior to theimplementation of IIRIRA, or who meet certain conditions of the NicaraguanAdjustment and Central American Relief Act (NACARA) are not subject to thecap.

Executive Office for Immigration Review Office of Planning, Analysis, and TechnologyFY 2010 Statistical Year Book January 2011R2
• As noted above, Cancellation of Removal is a form of relief provided by IIRIRA. There are two IIRIRA provisions addressing cancellation of removal:
• Permanent Residents. Under the first provision, a lawful permanentresident facing removal on criminal grounds who has been lawfullyadmitted for permanent residence for at least five years, and who hasresided continuously in the United States for seven years after a lawfuladmission may request cancellation, provided he or she has no aggravatedfelony convictions.
• Non-Permanent Residents. Under the second provision, applicantsphysically present in the United States for a continuous period of 10 yearswho have not been convicted of a criminal offense may seek cancellationof removal and adjustment of status to permanent resident alien. Theapplicant must demonstrate exceptional and extremely unusual hardship toa citizen or lawful permanent resident alien spouse, parent, or child. IIRIRA limits to 4,000 annually the total number of adjustments to lawfulpermanent resident status under suspension of deportation or cancellationof removal. Applicants for cancellation of removal who meet certainconditions are not subject to the cap.
Table 15, on the following page, reflects grants of relief under the variousprovisions described above during the period FY 2006 - FY 2010.

Executive Office for Immigration Review Office of Planning, Analysis, and TechnologyFY 2010 Statistical Year Book January 2011
R3
Table 15Grants of Relief:
Adjustment of Status; 212(c) Waivers; Suspension of Deportation; and Cancellation of Removal
Relief Granted to LawfulPermanent Residents Relief Granted to Non-Lawful Permanent Residents
Relief GrantedUnder Section
212(c)
Cancellation ofRemoval
Not Subject to Annual Cap of 4,000 Grants Subject to Annual Cap of 4,000Grants
Adjustment ofStatus to LPR
Suspension ofDeportation
Cancellation ofRemoval
Suspension ofDeportation
Cancellation ofRemoval
FY 2006 1,437 2,972 11,353 143 527 118 3,138
FY 2007 1,405 3,202 7,279 119 562 63 2,939
FY 2008 1,048 3,029 7,105 100 412 0 3,025
FY 2009 857 2,926 7,364 75 471 0 3,477
FY 2010 857 3,716 8,475 87 505 0 3,982

Executive Office for Immigration Review Office of Planning, Analysis, and TechnologyFY 2010 Statistical Year Book January 2011S1
Board of Immigration Appeals:Total Cases Received and Completed
The Board of Immigration Appeals (BIA) has nationwide jurisdiction to hearappeals from certain decisions rendered by immigration judges or certain DHS officials. Published BIA decisions are binding on all DHS officers and immigration judges unlessmodified or overruled by the Attorney General or a federal court. Unpublished decisionsof the BIA are binding on the immigration judge or DHS with regard to the individualcase at issue unless overruled or modified by the Attorney General or a federal court.
The majority of cases reviewed by the BIA involve decisions made byimmigration judges in removal, deportation, or exclusion proceedings, and for thepurposes of this Statistical Year Book are referred to as immigration judge appeals. These appeals are filed directly with the BIA in Falls Church, VA, and must be filedwithin 30 days of the immigration judge’s decision.
Other types of cases over which the BIA has jurisdiction include appeals ofcertain DHS decisions involving (1) family-based visa petitions adjudicated by DHSofficials; (2) fines and penalties imposed upon carriers for violations of immigration laws;and (3) waivers of inadmissibility for non-immigrants under §212(d)(3) of theImmigration and Nationality Act. For the purposes of this Statistical Year Book, appealsfrom these DHS decisions are referred to as DHS decision appeals.
As shown in Figure 25, BIA case receipts decreased by 17 percent from FY 2006to FY 2009. During this same period, case completions decreased by 20 percent.Receipts increased from FY 2009 to FY 2010 while completions remained about thesame.
Total BIA CasesReceived and Completed
25,00030,00035,000
40,00045,00050,000
FY 06 FY 07 FY 08 FY 09 FY 10
Receipts Completions
Figure 25
Receipts CompletionsFY 06 39,743 41,475FY 07 36,606 35,394FY 08 33,469 38,369FY 09 32,891 33,102FY 10 35,787 33,305
Total BIA Cases

Executive Office for Immigration Review Office of Planning, Analysis, and TechnologyFY 2010 Statistical Year Book January 2011S2
As noted earlier, BIA handles two types of cases: those generated from animmigration judge decision, and those generated from a DHS decision. Figures 26 and27 below provide information on the types of cases received and completed by the BIA. Appeals of immigration judge decisions make up the bulk of the BIA’s work. Receipts ofappeals of IJ decisions decreased by 19 percent from FY 2006 to FY 2010 whilecompletions of appeals from IJ decisions decreased by 25 percent. Receipts of appealsfrom DHS decisions increased by 99 percent from FY 2009 to FY 2010. Completions ofappeals from DHS decisions increased by 59 percent for the same time period.
BIA ReceiptsBy Type of Appeal
0
10,000
20,000
30,000
40,000
50,000
FY 06 FY 07 FY 08 FY 09 FY 10
Appeals from DHS Decisions Appeals from IJ Decisions
Figure 26
BIA Receipts
FY 06 6,143 33,600 39,743FY 07 4,309 32,297 36,606FY 08 3,021 30,448 33,469FY 09 4,313 28,578 32,891FY 10 8,591 27,196 35,787
Appeals from DHS Decisions
Appeals from IJ Decisions
Total Appeals
BIA CompletionsBy Type of Appeal
05,000
10,00015,00020,00025,00030,00035,00040,000
FY 06 FY 07 FY 08 FY 09 FY 10
Appeals from DHS Decisions Appeals from IJ Decisions
Figure 27
BIA Completions
FY 06 5,127 36,348 41,475FY 07 4,643 30,751 35,394FY 08 3,557 34,812 38,369FY 09 3,707 29,395 33,102FY 10 5,877 27,428 33,305
Appeals from DHS Decisions
Appeals from IJ Decisions
Total Appeals

Executive Office for Immigration Review Office of Planning, Analysis, and TechnologyFY 2010 Statistical Year Book January 2011 T1
Board of Immigration Appeals:Cases Received and Completed by Type
The BIA has nationwide jurisdiction to hear appeals from certain decisionsrendered by immigration judges or DHS officials. The BIA has jurisdiction over thefollowing types of cases arising from immigration judge decisions:
• Case appeals from the decisions of immigration judges in removal,deportation, and exclusion proceedings at the court level;
• Appeals filed from the decisions of immigration judges on motions to reopen;
• Motions to reopen cases already decided by the BIA;
• Appeals pertaining to bond, parole, or detention; and
• Interlocutory appeals relating to important jurisdictional questions regardingthe administration of the immigration laws or recurring problems in thehandling of cases by immigration judges.
The BIA also has jurisdiction to review appeals arising from certain decisionsrendered by DHS officials. These types of appeals are listed below.
• Family-based visa petitions adjudicated by DHS district directors or regionalservice center directors;
• Waivers of inadmissibility for non-immigrants under §212(d)(3) of theImmigration and Nationality Act; and
• Fines and penalties imposed upon air carriers for violations of immigrationlaws.
As shown in Table 16, on the following page, appeals received from immigrationjudge decisions have declined each year from FY 2006 to FY 2010. Appeals receivedfrom DHS decisions decreased each year from FY 2006 to FY 2008 then increased inFY 2009 and again in FY 2010. From FY 2009 to FY 2010 appeals received from DHSdecisions on visa petitions increased 115 percent. The data in Table 17 shows thatfrom FY 2006 to FY 2010 there has been an overall decrease in the number ofcompletions of appeals from immigration judge decisions.

Executive Office for Immigration Review Office of Planning, Analysis, and TechnologyFY 2010 Statistical Year Book January 2011 T2
Table 16 provides a breakdown of the types of cases received by the BIA betweenFY 2006 and FY 2010.
Table 16 - BIA Receipts by Type FY 2006 FY 2007 FY 2008 FY 2009 FY 2010
Total Appeals from IJ Decisions 33,600 32,297 30,448 28,578 27,196 Case Appeal 20,282 18,343 17,759 16,644 15,556 Appeal of IJ Motion to Reopen 1,546 1,967 1,941 1,834 1,899 Motion to Reopen-BIA 9,266 8,965 8,376 7,826 7,529 Bond Appeal 613 716 729 1,063 1,110 Bond MTR 0 5 18 38 23 Interlocutory Appeal 98 146 165 174 203 Circuit Court Remand 1,792 2,154 1,457 997 876 Special Circumstance 3 1 3 2 0Total Appeals from DHS Decisions 6,143 4,309 3,021 4,313 8,591 Decisions on Visa Petitions 5,918 3,980 2,851 3,985 8,569 212 Waiver Decisions 75 139 117 27 21 Decisions on Fines and Penalties 150 190 53 301 1
Grand Total 39,743 36,606 33,469 32,891 35,787
Table 17 provides a breakdown of the types of cases completed by the BIA between FY 2006 and FY 2010.
Table 17 - BIA Completions by TypeFY 2006 FY 2007 FY 2008 FY 2009 FY 2010
Total Appeals from IJ Decisions 36,348 30,751 34,812 29,395 27,428 Case Appeal 23,544 17,802 21,928 17,885 16,069 Appeal of IJ Motion to Reopen 1,964 1,083 1,936 1,526 2,000 Motion to Reopen-BIA 8,839 8,717 8,315 7,622 7,372 Bond Appeal 610 709 725 1,040 1,025 Bond MTR 0 1 15 32 25 Interlocutory Appeal 104 129 193 178 191 Circuit Court Remand 1,284 2,309 1,696 1,110 746 Special Circumstance 3 1 4 2 0Total Appeals from DHS Decisions 5,127 4,643 3,557 3,707 5,877 Decisions on Visa Petitions 4,993 4,410 3,199 3,377 5,857 212 Waiver Decisions 68 131 131 29 20 Decisions on Fines and Penalties 66 102 227 301 0
Grand Total 41,475 35,394 38,369 33,102 33,305

Executive Office for Immigration Review Office of Planning, Analysis, and TechnologyFY 2010 Statistical Year Book January 2011U1
Board of Immigration Appeals:Immigration Judge Decision Appeals Completed by Nationality
This section provides information on appeal completions by nationality. Onlycompletions of immigration judge decision appeals are included in these data; appealsof DHS decisions are not included. In FY 2010, the top 10 nationalities accounted for68 percent of all completions as shown in Figure 28. A total of 189 nationalities wererepresented in the FY 2010 completions. Data in Table 18, on the following page,compares the predominant nationalities for completed immigration judge appeals infiscal years 2006-2010. For the five-year period, seven nationalities ranked among thetop 10 each year: Mexico, China, Haiti, El Salvador, Guatemala, Colombia, andIndonesia.
FY 2010 BIA CompletionsBy Nationality
Mexico 20.41%
China 13.09%
El Salvador 7.81%
Guatemala 7.64%Haiti 7.11%
Indonesia 1.93%
All Other 32.29%
Jamaica 2.29%
Colombia 2.36%
India 2.33%
Honduras 2.74%
Figure 28
FY 2010 IJ Appeals Completed by NationalityNationality Cases % of Total
Mexico 5,599 20.41%China 3,591 13.09%El Salvador 2,141 7.81%Guatemala 2,096 7.64%Haiti 1,950 7.11%Honduras 751 2.74%Colombia 648 2.36%India 638 2.33%Jamaica 628 2.29%Indonesia 530 1.93%All Other 8,856 32.29%Total 27,428 100.00%

Executive Office for Immigration Review Office of Planning, Analysis, and TechnologyFY 2010 Statistical Year Book January 2011U2
Table 18 - BIA - IJ Decision Appeals Completed by NationalityTop 25 Nationalities: FY 2006 - FY 2010
Rank FY 2006 FY 2007 FY 2008 FY 2009 FY 2010
1 Mexico Mexico Mexico Mexico Mexico
2 China China China China China
3 Haiti Haiti Haiti Haiti El Salvador
4 Colombia Colombia El Salvador El Salvador Guatemala
5 Guatemala El Salvador Guatemala Guatemala Haiti
6 El Salvador Guatemala Colombia Colombia Honduras
7 Indonesia Indonesia India Honduras Colombia
8 India India Indonesia India India
9 Pakistan DominicanRepublic Honduras Indonesia Jamaica
10 Albania Jamaica DominicanRepublic
Jamaica Indonesia
11 DominicanRepublic
Albania Jamaica DominicanRepublic
DominicanRepublic
12 Jamaica Pakistan Venezuela Venezuela Venezuela
13 Honduras Honduras Pakistan Pakistan Nigeria
14 Nigeria Venezuela Albania Nigeria Pakistan
15 Philippines Nigeria Nigeria Albania Philippines
16 Armenia Philippines Philippines Philippines Nicaragua
17 Venezuela Armenia Peru Peru Peru
18 Cameroon Ethiopia Armenia Nicaragua Ecuador
19 Peru Peru Nicaragua Ecuador Albania
20 Bangladesh Guinea Cameroon Cameroon Brazil
21 Ethiopia Cameroon Bangladesh Ethiopia Armenia
22 Russia Bangladesh Ethiopia Guinea Cameroon
23 Guyana Mauritania Ecuador Mauritania Russia
24 Egypt Russia Guinea Armenia Cuba
25 Mauritania Iraq Brazil Russia Ethiopia

Executive Office for Immigration Review Office of Planning, Analysis, and TechnologyFY 2010 Statistical Year Book January 2011
V1
Board of Immigration Appeals:Immigration Judge Decision Appeals Completed by Representation
Status
The Immigration and Nationality Act states that individuals who have appealedthe decision in their removal proceedings may be represented by counsel, but at noexpense to the government. Before representing an alien before the BIA,representatives must file a Notice of Appearance with the BIA.
Many individuals who file appeals with the BIA are indigent and cannot afford aprivate attorney. Some seek free or pro bono representation, while others proceedwithout counsel on their own, or pro se. The percentage of represented appellate casescompleted is higher than the percentage of represented cases at the immigration courtlevel.
As shown in Figure 29, the representation rate increased each year from FY2006 with a 65 percent representation rate to FY 2010 with a 79 percent representationrate. Only appeals of immigration judge decisions are included in these data.
IJ Appeal DecisionsPercentage of Represented Cases
76%65%
71% 77% 79%
0%
20%
40%
60%
80%
100%
FY 06 FY 07 FY 08 FY 09 FY 10
Figure 29
Represented Unrepresented TotalFY 06 23,539 12,809 36,348FY 07 21,816 8,935 30,751FY 08 26,393 8,419 34,812FY 09 22,605 6,790 29,395FY 10 21,531 5,897 27,428
Represented Before the BIA

Executive Office for Immigration Review Office of Planning, Analysis, and TechnologyFY 2010 Statistical Year Book January 2011
W1
Board of Immigration Appeals:Immigration Judge Decision Appeals Completed for Detained Cases
Under the Immigration and Nationality Act, DHS has authority to detain an alienpending a decision on whether or not the alien is removable. EOIR maintains data onthe custody status of aliens in proceedings. The BIA handles detained cases (includingaliens in the Institutional Hearing Program) as priority cases.
Depicted in Figure 30 is the number of immigration judge case appeal decisions between FY 2006 and FY 2010 along with the number of immigration judge case appealdecisions that involved detainees. The figures for detained appeal decisions alsoinclude IHP cases. Detained case appeal decisions have remained fairly consistentfrom FY 2006 to FY 2010, however, the total IJ case appeal decisions have decreasedby 32 percent for the same time period causing the percent detained to increase.
IJ Case Appeal Decisions Detained and Total
0 5,000 10,000 15,000 20,000 25,000
FY 10
FY 09
FY 08
FY 07
FY 06
Total Case Appeal Decisions Detained Case Appeal Decisions
Figure 30
Detained IJ Case Appeal Decisions (Including IHP)
FY 06 3,434 23,544 15%FY 07 3,387 17,802 19%FY 08 3,458 21,928 16%FY 09 3,361 17,885 19%FY 10 3,337 16,069 21%
Percent Detained
Detained Case Appeal Decisions (Including IHP)
Total IJ Case Appeal Decisions

Executive Office for Immigration Review Office of Planning, Analysis, and TechnologyFY 2010 Statistical Year Book January 2011
W2
Table 19 shows a breakdown of total detained case appeals completed by theBIA, and of those, the number who were serving sentences at an IHP location. In FY2010, 11 percent of detained BIA completions involved aliens whose removal ordershad been issued prior to their release from a federal, state, or municipal correctionsfacility. The percentage of IHP completions declined from FY 2006 to FY 2010. Thisdrop in the percentage of IHP completions is caused by a decrease in the number ofIHP completions and the total detained completions staying fairly consistent.
Table 19Breakdown of BIA Detained Completions
Total Detained Completions
IHPCompletions
Percent IHPCompletions
FY 2006 3,434 602 18%
FY 2007 3,387 465 14%
FY 2008 3,458 471 14%
FY 2009 3,361 449 13%
FY 2010 3,337 380 11%

Executive Office for Immigration Review Office of Planning, Analysis, and TechnologyFY 2010 Statistical Year Book January 2011
X1
Immigration Courtsand
Board of Immigration Appeals:Immigration Judge Decisions (Proceedings) Appealed
The majority of cases reviewed by the BIA involve decisions made byimmigration judges in removal, deportation, or exclusion proceedings. Either DHS orthe alien may file an appeal. Appeals must be filed within 30 days of the immigrationjudge’s decision. Only a relatively small percentage of immigration judge decisions areappealed to the BIA. Figure 31 below compares immigration judge decisions with thenumber of case appeals received (aliens) at the BIA for fiscal years 2006 through 2010. All other figures and tables in Tabs S-W reflect cases (which can involve multiplealiens). In this instance, reporting on aliens who appealed is a more accuraterepresentation of appeal rate.
Immigration Judge Decisions (Proceedings) Appealed
050,000
100,000150,000
200,000250,000300,000
FY 06 FY 07 FY 08 FY 09 FY 10
IJ Decisions Case Appeals Received (Aliens)
Figure 31
IJ Decisions (Proceedings) Appealed
FY 06 273,761 24,580 9%FY 07 223,085 21,900 10%FY 08 229,463 20,691 9%FY 09 232,385 19,052 8%FY 10 222,909 17,578 8%
IJ Decisions Case Appeals Received (Aliens)
Percent Appealed

Executive Office for Immigration Review Office of Planning, Analysis, and TechnologyFY 2010 Statistical Year Book January 2011
Y1
Immigration Courts and
Board of Immigration Appeals:Pending Caseload
As in any court system, EOIR’s workload depends on the number of matters filedbefore it. DHS determines EOIR’s initial caseload by filing charging documents allegingaliens’ illegal presence in the United States. The nature and number of the proceedingsand the number of appeals from immigration court decisions are determined by theparties themselves. In addition, changes to the immigration laws or regulations, andDHS policies and budgeting, have a dramatic impact on EOIR’s workload.
Figure 32 presents information on the pending proceedings at the immigrationcourts based on the year the proceeding was received at the court. The age of pendingcases is decreasing. Proceedings received prior to FY 2009 account for 20 percent ofthe total number of pending proceedings.
Immigration Court Pending ProceedingsBy Year Received
0
20,00040,000
60,00080,000
100,000
120,000140,000
160,000
Pre FY 06 FY 06 FY 07 FY 08 FY 09 FY 10
Figure 32
Year Received Pending 09/30/10Pre FY 06 3,362
FY 06 6,036FY 07 16,206FY 08 28,168FY 09 64,987FY 10 143,863Total 262,622
Immigration Court Pending Proceedings

Executive Office for Immigration Review Office of Planning, Analysis, and TechnologyFY 2010 Statistical Year Book January 2011
Y2
Figure 33 below depicts the age of the BIA’s pending caseload. The age ofpending cases has decreased. Cases received before FY 2009 account for threepercent of the pending caseload.
BIA Pending CasesBy Year Filed
0
4000
8000
12000
16000
20000
24000
Pre FY 06 FY 06 FY 07 FY 08 FY 09 FY 10
Figure 33
Year Filed Pending 09/30/10Pre FY 06 50
FY 06 130FY 07 180FY 08 425FY 09 6,327FY 10 23,000Total 30,112
BIA Pending Cases
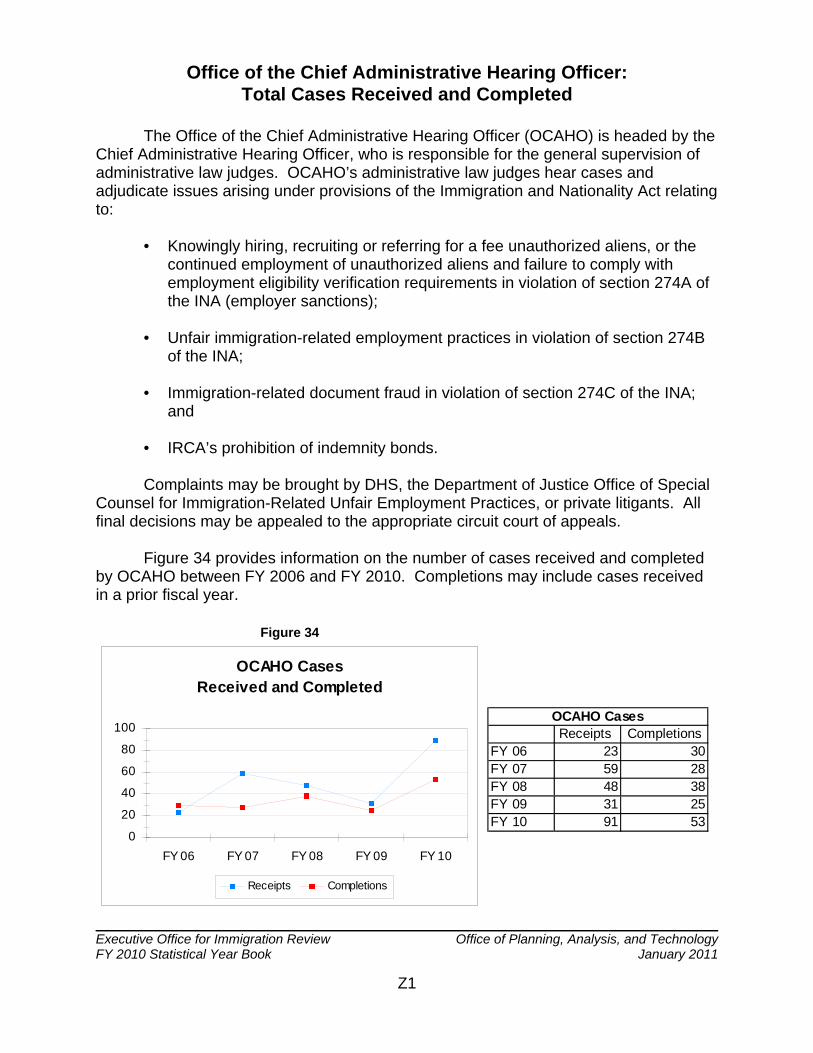
Executive Office for Immigration Review Office of Planning, Analysis, and TechnologyFY 2010 Statistical Year Book January 2011
Z1
Office of the Chief Administrative Hearing Officer:Total Cases Received and Completed
The Office of the Chief Administrative Hearing Officer (OCAHO) is headed by theChief Administrative Hearing Officer, who is responsible for the general supervision ofadministrative law judges. OCAHO’s administrative law judges hear cases andadjudicate issues arising under provisions of the Immigration and Nationality Act relatingto:
• Knowingly hiring, recruiting or referring for a fee unauthorized aliens, or the continued employment of unauthorized aliens and failure to comply withemployment eligibility verification requirements in violation of section 274A ofthe INA (employer sanctions);
• Unfair immigration-related employment practices in violation of section 274Bof the INA;
• Immigration-related document fraud in violation of section 274C of the INA;and
• IRCA’s prohibition of indemnity bonds.
Complaints may be brought by DHS, the Department of Justice Office of SpecialCounsel for Immigration-Related Unfair Employment Practices, or private litigants. Allfinal decisions may be appealed to the appropriate circuit court of appeals.
Figure 34 provides information on the number of cases received and completedby OCAHO between FY 2006 and FY 2010. Completions may include cases receivedin a prior fiscal year.
OCAHO CasesReceived and Completed
0
20
40
60
80
100
FY 06 FY 07 FY 08 FY 09 FY 10
Receipts Completions
Figure 34
Receipts CompletionsFY 06 23 30FY 07 59 28FY 08 48 38FY 09 31 25FY 10 91 53
OCAHO Cases
Executive Office for Immigration Review Office of Planning, Analysis, and TechnologyFY 2010 Statistical Year Book Appendix A - Glossary of Terms
January 2011
GLOSSARY OF TERMS
Disclaimer
This Glossary has been compiled as an addendum to the FY 2010 Statistical Year Bookof the Executive Office for Immigration Review (EOIR). Its intent is to define terms asthey are used in the Year Book, and is strictly informational in nature. These terms mayhave further meaning in the context of other immigration matters. This Glossary is notintended, in any way, to be a substitute for a careful study of the pertinent laws andregulations. This Glossary does not carry the weight of law or regulation. This Glossaryis not intended, nor should it be construed in any way, as legal advice, nor does itextend or limit the jurisdiction of EOIR as established by law and regulation.

Executive Office for Immigration Review Office of Planning, Analysis, and TechnologyFY 2010 Statistical Year Book Appendix A - Glossary of Terms
January 20112
A
AbandonedIf an applicant for relief fails to appear for a court hearing, or fails to provide anyrequired information within the time frame allowed without good cause, the application isconsidered abandoned. In addition, if an applicant fails to timely file an application forrelief, the immigration judge may deem that application waived.
Accredited RepresentativeA non-attorney who is authorized to practice before the immigration courts, the Board ofImmigration Appeals (BIA), and/or the Department of Homeland Security. Accreditedrepresentatives are granted accreditation by the BIA. To be granted BIA accreditation,accredited representatives must be affiliated with an organization that has beenrecognized by the BIA. See Recognized Organization.
Adjustment of StatusA type of relief from deportation, removal, or exclusion for an alien who is eligible forlawful permanent resident status based on a visa petition approved by the Departmentof Homeland Security. The status of an alien may be adjusted by the Attorney General,in his discretion, to that of a lawful permanent resident if a visa petition on behalf of thealien has been approved, an immigrant visa is immediately available at the time of thealien’s application for adjustment of status, and the alien is not otherwise inadmissible tothe United States.
Administrative ClosureAdministrative closure of a case is used to temporarily remove the case from animmigration judge’s calendar or from the Board of Immigration Appeals’ docket.Administrative closure of a case does not result in a final order. It is merely anadministrative convenience which allows the removal of cases from the calendar inappropriate situations. A case may not be administratively closed if opposed by either ofthe parties.
Administrative Law JudgesAdministrative Law Judges (ALJs) in the Office of the Chief Administrative HearingOfficer (OCAHO) hear cases and adjudicate issues arising under the provisions of theINA relating to: (1) knowingly hiring, recruiting or referring for a fee unauthorized aliens, or the continued employment of unauthorized aliens and failure to comply withemployment eligibility verification requirements in violation of section 274A of the INA(employer sanctions); (2) unfair immigration-related employment practices in violation ofsection 274B of the INA; (3) immigration-related document fraud in violation of section274C of the INA; and (4) IRCA’s prohibition of indemnity bonds. Complaints arebrought by the Department of Homeland Security, the Office of Special Counsel forImmigration-Related Unfair Employment Practices in the Department of Justice, orprivate individuals as prescribed by statute.

Executive Office for Immigration Review Office of Planning, Analysis, and TechnologyFY 2010 Statistical Year Book Appendix A - Glossary of Terms
January 20113
Affirmative Asylum ApplicationAn asylum application initially filed with the Department of Homeland Security, U.S.Citizenship and Immigration Services (USCIS). Contrast Defensive Asylum Application.
Aggravated FelonyAs defined by section 101(a)(43) of the Immigration and Nationality Act, aggravatedfelony includes, but is not limited to, murder; rape or sexual abuse of a minor; drugtrafficking; firearms or explosive materials trafficking; money laundering; crimes ofviolence for which the term of imprisonment, even if suspended, is at least one year ormore; theft or burglary; demands for ransom; child pornography; gambling; tax fraud;prostitution; transportation for prostitution purposes; commercial bribery; counterfeiting;forgery; stolen vehicle trafficking; obstruction of justice; perjury; bribery of a witness; andfailure to appear to answer for a criminal offense.
Appeal from Decision of an Immigration JudgeIn an appeal from a decision of an immigration judge, the appealing party, which couldbe an alien, the Department of Homeland Security, or both, states why he or shedisagrees with the immigration judge’s decision. By filing an appeal, the appealing partyasks the Board of Immigration Appeals to review the immigration judge’s decision.
Appeal from Decision of a Department of Homeland Security (DHS) DistrictDirectorIn an appeal from a decision of a DHS U.S. Citizenship and Immigration Services’District Director, the respondent states why he or she disagrees with a District Director’sdecision. By filing an appeal, the respondent asks the Board of Immigration Appeals toreview the District Director’s decision.
Application for ReliefAliens may request a number of forms of relief or protection from removal such asasylum, withholding of removal, protection under the Convention Against Torture,adjustment of status, or cancellation of removal. Many forms of relief require the aliento fill out an appropriate application.
AsylumAn alien, who is physically present in the United States or who arrives in the UnitedStates irrespective of such alien status, may be eligible for asylum if he or she can showthat he or she is a “refugee” and is not subject to any statutory prohibitions. TheImmigration and Nationality Act generally defines a refugee as any person who isoutside his or her country of nationality or, in the case of a person having no nationality,is outside any county in which such person last habitually resided, and who is unable orunwilling to return to, and is unable or unwilling to avail himself or herself of theprotection of that country, because of persecution or a well-founded fear of persecutionon account of race, religion, nationality, membership in a particular social group, orpolitical opinion. Aliens generally must apply for asylum within one year of arrival in the

Executive Office for Immigration Review Office of Planning, Analysis, and TechnologyFY 2010 Statistical Year Book Appendix A - Glossary of Terms
January 20114
United States. In the absence of exceptional circumstances, final administrativeadjudication of the asylum application, not including administrative appeal, must becompleted within 180 days after the date the application is filed.
Asylum GrantsAn asylum grant allows the alien to remain in the United States and provides certainbenefits and derivative asylum status for any spouse or child. An asylee can apply tothe Department of Homeland Security for lawful permanent resident status underImmigration and Nationality Act section 209(b) after he or she has been physicallypresent in the United States for a period of one year after the date of the asylum grant.
Asylum-only ProceedingsCertain aliens are not entitled to a removal hearing under section 240 of the Immigrationand Nationality Act, yet these aliens are entitled to an asylum-only hearing before animmigration judge. If an alien who is not entitled to a removal hearing under section 240of the Immigration and Nationality Act requests asylum (and has not been grantedasylum by the Department of Homeland Security (DHS), if eligible), DHS will file a FormI-863, Notice of Referral to an Immigration Judge, with the immigration court. Theimmigration judge may not consider forms of relief other than asylum, withholding ofremoval, and withholding of removal under the Convention Against Torture (CAT). Aliens eligible for asylum-only hearings include crewmen, stowaways, Visa WaiverProgram beneficiaries, and those ordered removed from the United States on securitygrounds. Asylum-only cases will be heard, to the maximum extent practical, within thesame time frame as asylum claims in removal cases, i.e, within 180 days. The Board ofImmigration Appeals has jurisdiction over appeals from immigration judge decisions inasylum-only cases. See Withholding-only Proceedings.
B
Board of Immigration Appeals The Board of Immigration Appeals (BIA) is the highest administrative body forinterpreting and applying immigration laws. The BIA has been given nationwidejurisdiction to hear appeals from certain decisions rendered by immigration judges andby Department of Homeland Security (DHS), U.S. Citizenship and Immigration Services’District Directors in a wide variety of proceedings in which the U.S. government is oneparty and the other party is either an alien, a citizen, or a business firm. In addition, theBIA is responsible for the recognition of organizations and accreditation ofrepresentatives requesting permission to practice before the BIA, the immigrationcourts, and/or DHS. BIA decisions are binding on all DHS officers and immigrationjudges unless modified or overruled by the Attorney General or a federal court.
BondThe Department of Homeland Security (DHS) may detain a respondent who is inremoval or deportation proceedings and may condition his or her release from custodyupon the posting of a bond to ensure the respondent's appearance at the hearing. The
Executive Office for Immigration Review Office of Planning, Analysis, and TechnologyFY 2010 Statistical Year Book Appendix A - Glossary of Terms
January 20115
amount of money set by DHS as a condition of release is known as a bond. A bondmay be also set by an immigration judge as a condition for allowing a respondent tovoluntarily leave the country.
Bond Redetermination HearingWhen the Department of Homeland Security (DHS) has set a bond amount as acondition for release from custody, or has determined not to release the alien on bond,the respondent has the right to ask an immigration judge to redetermine the bond. In abond redetermination hearing, the judge can raise, lower, or maintain the amount of thebond, however, the Immigration and Nationality Act provides that bond of at least$1,500 is required before an alien may be released. In addition, the immigration judgecan eliminate the bond; or change any of the conditions over which the immigrationcourt has authority. The bond redetermination hearing is completely separate from theremoval or deportation hearing. It is not recorded and has no bearing on thesubsequent removal or deportation proceeding. The respondent and/or DHS mayappeal the immigration judge’s bond redetermination decision to the Board ofImmigration Appeals.
C
Cancellation of RemovalThere are two different forms of cancellation of removal:
(A) Cancellation of removal for certain lawful permanent residents who were admittedmore than five years ago, have resided in the United States for seven or more years,and have not been convicted of an aggravated felony. See section 240A(a) of theImmigration and Nationality Act. Application for this form of discretionary relief is madeduring the course of a hearing before an immigration judge.
(B) Cancellation of removal and adjustment of status for certain non-permanent residentaliens who have maintained continuous physical presence in the United States for 10years and have met all the other statutory requirements for such relief. See section240A(b) of the Immigration and Nationality Act. Application for this form of discretionaryrelief is made during the course of a hearing before an immigration judge. The status ofan alien who is granted cancellation of removal for certain non-permanent residentaliens is adjusted to that of an alien lawfully admitted for permanent residence.
CaseIn an immigration proceeding before an immigration judge, a “case” involves one alien.
In an appeal before the Board of Immigration Appeals, a “case” involves one lead alienand may also include other family members.
In a proceeding before an Administrative Law Judge in the Office of the ChiefAdministrative Hearing Officer, a “case” involves a complainant and a respondent. In

Executive Office for Immigration Review Office of Planning, Analysis, and TechnologyFY 2010 Statistical Year Book Appendix A - Glossary of Terms
January 20116
cases brought under Immigration and Nationality Act section 274A and section 274C,the complainant is the Department of Homeland Security, and the respondent is anemployer. In Immigration and Nationality Act section 274B cases, the complainant iseither the Office of Special Counsel for Immigration-Related Unfair EmploymentPractices or certain private individuals, and the respondent is an employer, asprescribed by statute.
Change of VenueImmigration judges, for good cause shown, may change venue (move the proceeding toanother immigration court) only upon motion by one of the parties, after the chargingdocument has been filed with the immigration court. The regulation provides thatvenue may be changed only after one of the parties has filed a motion to change venueand the other party has been given notice and an opportunity to respond.
Claimed Status ReviewIf an alien in expedited removal proceedings claims under oath to be a U.S. citizen, tohave been lawfully admitted for permanent residence, to have been admitted as arefugee, or to have been granted asylum, and the Department of Homeland Securitydetermines that the alien has no such claim, he or she can obtain a review of that claimby an immigration judge.
Coercive Population ControlThe Illegal Immigration Reform and Immigrant Responsibility Act of 1996 (IIRIRA) changed the definition of “refugee” to include, as a form of political opinion, those whohave a well-founded fear of persecution or have suffered persecution on account ofCoercive Population Control (CPC) policies. Previously, up to a total of 1,000 refugeeadmissions and asylum grants were made each fiscal year to applicants who raisedclaims based on CPC. If applicants for asylum met the criteria for a CPC grant, theywere given conditional asylum and were given a final grant of asylum when a numberbecame available. Effective May 11, 2005, under the REAL ID Act, the annual cap waslifted on asylum grants based on CPC. See Conditional Asylum Grants.
CompletionsWithin the context of the Office of the Chief Immigration Judge, a matter is consideredcompleted once an immigration judge renders a decision. Proceedings may also becompleted for other reasons, such as administrative closures, changes of venue, andtransfers.
For matters before the Board of Immigration Appeals, a case is considered completedonce the Board renders a final decision.
For matters before the Office of the Chief Administrative Hearing Officer, a case iscompleted when the Administrative Law Judge issues a final decision disposing of allremaining issues and the time for appeal has ended.

Executive Office for Immigration Review Office of Planning, Analysis, and TechnologyFY 2010 Statistical Year Book Appendix A - Glossary of Terms
January 20117
Conditional Asylum GrantsSection 207(a)(5) of the Immigration and Nationality Act, as amended by the IllegalImmigration Reform and Immigrant Responsibility Act of 1996, provided that for anyfiscal year no more than 1,000 aliens could be admitted as refugees or granted asylumpursuant to a determination that the alien was or would be persecuted for resistance tocoercive population control methods. An alien who was eligible for a grant of asylumbased on coercive population control methods received a grant conditioned on anadministrative determination by the Department of Homeland Security that a numberwas available. Effective May 11, 2005, under the REAL ID Act, the annual cap waslifted on asylum grants based on coercive population control methods. See CoercivePopulation Control.
ContinuanceThe adjournment of a proceeding to a subsequent day or time.
Continued Detention ReviewA proceeding established in response to the 2001 Supreme Court’s decision inZadvydas v. Davis, in which the immigration judge decides whether or not the alienshould remain in custody.
Convention Against TortureOn March 22, 1999, the Department of Justice implemented regulations regarding theUnited Nations’ Convention Against Torture and Other Cruel, Inhuman or DegradingTreatment or Punishment (Convention Against Torture or CAT). Under this regulation,aliens in removal, deportation, or exclusion proceedings may claim that they “more likelythan not” will be tortured if removed from the United States and may apply forwithholding of removal under CAT. Among other things, the regulation providesjurisdiction to the immigration courts and the Board of Immigration Appeals for reviewingthese claims. See Deferral of Removal and Withholding-only Proceedings.
Credible Fear ReviewIf an alien seeking to enter the United States has no documents or no valid documentsto enter, but expresses a fear of persecution or torture, or an intention to apply forasylum, that alien will be referred to a Department of Homeland Security asylum officerfor a credible fear determination. If the asylum officer determines that the alien has notestablished a credible fear of persecution or torture and a supervisory asylum officerconcurs, the alien may request review of that determination by an immigration judge. That review must be concluded as expeditiously as possible, to the maximum extentpracticable within 24 hours, but in no event later than seven days after the date of thedetermination by the supervisory asylum officer. No appeal to the Board of ImmigrationAppeals may be taken from the immigration judge’s decision finding no credible fear ofpersecution or torture. If the immigration judge determines that the alien has a crediblefear of persecution or torture, the alien will be placed in removal proceedings to applyfor asylum.

Executive Office for Immigration Review Office of Planning, Analysis, and TechnologyFY 2010 Statistical Year Book Appendix A - Glossary of Terms
January 20118
Custody StatusWhether an alien is in actual custody (detained) or is at liberty. This Year Bookdescribes three custody categories: detained, never detained (EOIR has no record ofthe alien having been detained), and released (detained, then released on bond,recognizance, or some other condition).
D
DecisionA determination and order arrived at after consideration of facts and law, by either animmigration judge, the Board of Immigration Appeals, or the Office of the ChiefAdministrative Hearing Officer.
Defensive Asylum ApplicationAn asylum application initially filed with the immigration court after the alien has beenput into proceedings to remove him or her from the United States. Contrast AffirmativeAsylum Application.
Deferral of RemovalIf an immigration judge concludes that it is more likely than not that a removable alienwill be tortured in a country, but the alien is ineligible for withholding of removal underthe Convention Against Torture (CAT), the alien’s removal will be deferred. The alien’sremoval is deferred only to the country in which it has been determined that the alien islikely to be tortured. However, the alien may be removed at any time to another countrywhere he or she is not likely to be tortured. In addition, deferral of removal is effectiveonly until it is terminated. The major difference between deferral of removal andwithholding of removal is that there is a streamlined termination process for deferral ofremoval.
DenialsWhen an immigration judge denies an alien’s application for relief from removal.
Department of Homeland Security (DHS)On March 1, 2003, DHS absorbed the functions of the former Immigration andNaturalization Service (INS), among other agencies. Three major components of DHShave functions which relate closely to the Executive Office for Immigration Review. U.S.Citizenship and Immigration Services (USCIS) processes all immigrant and non-immigrant benefits, incorporating the adjudication and naturalization functions of theformer INS. U.S. Immigration and Customs Enforcement (ICE) is charged with theenforcement of federal immigration laws, and includes functions of the formerinvestigations and detention and removal components of INS. U.S. Customs andBorder Protection (CBP) absorbed the border patrol and inspections functions of theformer INS. See Immigration and Naturalization Service.
Executive Office for Immigration Review Office of Planning, Analysis, and TechnologyFY 2010 Statistical Year Book Appendix A - Glossary of Terms
January 20119
Deportation ProceedingsPrior to April 1, 1997, a deportation case usually arose when the former Immigrationand Naturalization Service (INS) (now Department of Homeland Security) alleged that arespondent entered the country illegally by crossing the border without being inspectedby an immigration officer. Deportation cases also occurred when INS alleged that arespondent entered the country legally with a visa but then violated one or moreconditions of the visa. When INS became aware of a respondent believed to bedeportable, they issued a charging document called an Order to Show Cause (OSC). An OSC is the charging document that was used prior to April 1, 1997. A deportationproceeding actually began when the OSC was filed with an immigration court. In suchproceedings, the government, represented by INS, had to prove that a respondent wasdeportable for the reasons stated in the OSC. As of April 1, 1997, deportation andexclusion proceedings were replaced by removal proceedings. Contrast Exclusion andRemoval Proceedings.
Detained The Executive Office for Immigration Review (EOIR) maintains data on the custodystatus of aliens in proceedings. Detained aliens are those in the custody of theDepartment of Homeland Security (DHS) or other entities. For the purpose of this YearBook, EOIR also includes in its statistical data on detained aliens, the number ofincarcerated aliens in the Institutional Hearing Program. Immigration court hearings fordetained aliens are conducted in DHS Service Processing Centers, contract detentionfacilities, state and local government jails, and Bureau of Prisons institutions. SeeCustody Status.
Detention of an AlienThe confinement of an alien by the Department of Homeland Security or other entities.
DispositionIn immigration proceedings, the latest ruling on an alien’s removability.
District Director (DD)Under the former Immigration and Naturalization Service (INS), the District Director(DD) was the highest ranking immigration official in each of the INS’s 30+ districts. TheINS was transferred out of the Department of Justice to the Department of HomelandSecurity on March 1, 2003. The DDs are located organizationally under the U.S.Citizenship and Immigration Services. The DD has the delegated authority to grant ordeny most applications and petitions, except those that are specifically delegated toasylum officers.
Executive Office for Immigration Review Office of Planning, Analysis, and TechnologyFY 2010 Statistical Year Book Appendix A - Glossary of Terms
January 201110
E
Exclusion ProceedingsPrior to April 1, 1997, an exclusion case involved a person who tried to enter the UnitedStates but was stopped at the port of entry because the former Immigration andNaturalization Service (INS) (now Department of Homeland Security) found the personto be inadmissible. The INS District Director could either detain the applicant or "parole"the applicant into the country; i.e., release from detention and allow to remain free untilcompletion of the hearing. In either case, the applicant technically had not entered thecountry as a matter of law. Beginning April 1, 1997, deportation and exclusionproceedings were replaced by removal proceedings. Contrast Deportation andRemoval Proceedings.
Executive Office for Immigration Review (EOIR)The Executive Office for Immigration Review (EOIR) was created on January 9, 1983,through an internal Department of Justice (DOJ) reorganization which combined theBoard of Immigration Appeals with the immigration judge function, which was previouslyperformed by Special Inquiry Officers of the former Immigration and NaturalizationService (INS) (now Department of Homeland Security). The Office of the ChiefAdministrative Hearing Officer (OCAHO) was added in 1987. EOIR is responsible foradjudicating immigration cases. Specifically, under delegated authority from theAttorney General, EOIR interprets and administers federal immigration laws byconducting immigration court proceedings, appellate reviews, and administrativehearings. EOIR consists of three components: the Office of the Chief ImmigrationJudge, which is responsible for managing the numerous immigration courts locatedthroughout the United States where immigration judges adjudicate individual cases; theBoard of Immigration Appeals, which primarily conducts appellate reviews ofimmigration judge decisions; and the Office of the Chief Administrative Hearing Officer,which adjudicates certain immigration-related civil money penalty and document fraudcases. EOIR is committed to providing fair, expeditious, and uniform application of thenation's immigration laws in all cases.
Expedited AsylumAsylum regulations implemented in 1995 mandated that asylum applications beprocessed within 180 days after filing either at a Department of Homeland Security(DHS), U.S. Citizenship and Immigration Services, Asylum Office or at an immigrationcourt. The Illegal Immigration Reform and Immigrant Responsibility Act of 1996 (IIRIRA)reiterated the 180-day rule. Consequently, expedited processing of asylum applicationsoccurs when (1) an alien files “affirmatively” at an Asylum Office on or after January 4,1995, and the application is referred to the Executive Office for Immigration Review(EOIR) by DHS within 75 days of the filing; or (2) an alien files an application“defensively” with EOIR on or after January 4, 1995.

Executive Office for Immigration Review Office of Planning, Analysis, and TechnologyFY 2010 Statistical Year Book Appendix A - Glossary of Terms
January 201111
F
Failure to AppearA failure to appear is when either party to a proceeding does not arrive or make anappearance at a court proceeding. Failure to appear by the respondent results in an inabsentia order of removal. See In Absentia.
FilingA filing occurs with the actual receipt of a document by the appropriate immigrationcourt, the Board of Immigration Appeals, or the Office of the Chief AdministrativeHearing Officer.
Fines and PenaltiesCertain provisions of the Immigration and Nationality Act render individuals and carriersliable for transporting unauthorized aliens in the United States. Fines may be assessedby certain Department of Homeland Security officials. The respondent is notified inwriting of the decision and, if adverse, of the reasons for the decision. The respondentmay appeal this decision to the Board of Immigration Appeals.
Fiscal YearA 12-month period for which an organization plans the use of its funds. In the U.S.government, the fiscal year runs from October 1 through September 30.
G
Grant of ReliefWhen an immigration judge or the Board of Immigration Appeals awards a form of relieffor which the alien has applied.
Grant of Motion There are many types of motions in immigration proceedings. However, only two typesare tracked in the Statistical Year Book: motions to reopen and motions to reconsider. A motion to reconsider is granted when an immigration judge or the Board ofImmigration Appeals (BIA) allows a reconsideration of the decision based on a possibleerror in law or fact, or a change in the law. A motion to reopen is granted when animmigration judge or the BIA allows a proceeding to be reopened because of new factsor evidence in a case.
I
Illegal Immigration Reform and Immigrant Responsibility Act of 1996 (IIRIRA)Among other things, IIRIRA focused on enforcement of immigration laws bystreamlining the procedures that were previously required to remove aliens from theUnited States. To date, IIRIRA made the most extensive and significant changes to the

Executive Office for Immigration Review Office of Planning, Analysis, and TechnologyFY 2010 Statistical Year Book Appendix A - Glossary of Terms
January 201112
immigration laws of the United States since the 1952 enactment of the Immigration andNationality Act.
Immigration and Nationality ActThe Immigration and Nationality Act consolidated previous immigration laws into onecoordinated statute. As amended, the Immigration and Nationality Act provides thefoundation for immigration law in effect today. The Immigration and Nationality Actdeals with the immigration, temporary admission, naturalization, and removal of aliens.
Immigration and Naturalization Service (INS)Until its transition to the Department of Homeland Security (DHS) on March 1, 2003,INS was the agency responsible for administering immigration and nationality lawsrelating to the temporary admission, immigration, naturalization, and removal of aliens. Specifically, INS inspected aliens to determine their admissibility into the United States,adjudicated requests of aliens for benefits under the law, guarded against illegal entryinto the United States, removed aliens in this country who were in violation of the law,examined alien applicants seeking to become citizens, and enforced immigration-relatedemployment verification and document fraud laws. See Department of HomelandSecurity.
Immigration CourtEach immigration court is staffed with one or more immigration judges who conductimmigration hearings. An administrative control immigration court is one that createsand maintains Records of Proceedings for immigration courts within an assignedgeographical area. Management functions of the immigration court are supervised by aCourt Administrator.
Immigration Judge The term immigration judge means an attorney whom the Attorney General appoints asan administrative judge within the Executive Office for Immigration Review, Office of theChief Immigration Judge, qualified to conduct specified classes of proceedings,including exclusion, deportation, removal, asylum, bond redetermination, rescission,withholding, credible fear, reasonable fear, and claimed status review. Immigrationjudges act as the Attorney General’s delegates in deciding the matters before them andexercise the powers and duties delegated to them by the Immigration and NationalityAct and by the Attorney General through regulation. Immigration judge decisions areadministratively final unless appealed or certified to the Board of Immigration Appeals.
Immigration Reform and Control Act of 1986 (IRCA)Among other things, IRCA addressed the problem of undocumented aliens by imposingsanctions on employers who hired or continued to employ them, and legalizing thestatus of certain undocumented entrants who had arrived prior to January 1, 1982. TheImmigration and Naturalization Service (now Department of Homeland Security) alsowas provided with significant new resources to enforce the immigration laws through

Executive Office for Immigration Review Office of Planning, Analysis, and TechnologyFY 2010 Statistical Year Book Appendix A - Glossary of Terms
January 201113
IRCA. IRCA also created protections for workers against discrimination based oncitizenship status and national origin.
In AbsentiaA Latin phrase meaning “in the absence of.” An in absentia hearing occurs when analien fails to appear for a hearing and the immigration judge conducts the hearingwithout the alien present and orders the alien removed from the United States. Animmigration judge shall order removed in absentia any alien who, after written notice ofthe time and place of proceedings and the consequences of failing to appear, fails toappear at his or her removal proceeding. The DHS must establish by clear,unequivocal, and convincing evidence that the written notice was provided and that thealien is removable. See Failure to Appear.
InadmissibleThe Illegal Immigration Reform and Immigrant Responsibility Act of 1996 (IIRIRA)replaced the term “excludable” with the term “inadmissible.” Section 212 of theImmigration and Nationality Act defines classes of aliens ineligible to receive visas andineligible for admission. Aliens who, at the time of entry, are within one of these classesof inadmissible aliens are removable.
Institutional Hearing Program (IHP)The Immigration Reform and Control Act of 1986 requires the Attorney General toexpeditiously commence immigration proceedings for alien inmates convicted of crimesin the United States. To meet this requirement, the Department of Justice establishedthe IHP where removal hearings are held inside correctional institutions prior to the aliencompleting his or her criminal sentence. The IHP is a collaborative effort between theExecutive Office for Immigration Review and the Department of Homeland Security andvarious federal, state, and local corrections agencies throughout the country.
Interlocutory AppealsAn interlocutory appeal is an appeal taken to the Board of Immigration Appeals from apreliminary ruling of an immigration judge before the judge renders a final decision inthe case. Common examples include rulings on the admissibility of evidence orrequests to change venue.
L
Lawful Permanent Resident (LPR)An alien who has been conferred permanent resident status.
M
MattersMatters before the immigration courts and the Board of Immigration Appeals include allproceedings, bond redeterminations, and motions to reopen or reconsider.

Executive Office for Immigration Review Office of Planning, Analysis, and TechnologyFY 2010 Statistical Year Book Appendix A - Glossary of Terms
January 201114
MotionA motion is a formal request from either party (the alien or the Department of HomelandSecurity) in proceedings before the immigration court, or the Board of ImmigrationAppeals, to carry out an action or make a decision. Motions include, for example,motions for change of venue, motions for continuance, motions to terminateproceedings, etc. Only motions to reopen or reconsider are reported in this StatisticalYear Book.
N
NationalityFor purposes of the EOIR Statistical Yearbook, nationality indicates the country that thealien is from.
Nicaraguan Adjustment and Central American Relief Act of 1997 (NACARA)Under section 202 of NACARA, certain nationals of Nicaragua and Cuba in the UnitedStates were eligible to adjust their immigration status to become lawful permanentresidents. In addition, section 203 of NACARA provides special rules regardingapplications for suspension of deportation and cancellation of removal by certainGuatemalan, Salvadoran, and particular former Soviet bloc nationals.
Non-detainedThe status of an alien who is not in the custody of the Department of Homeland Securityor the Institutional Hearing Program. See Released.
Notice to Appear (NTA)The document (Form I-862) used by the Department of Homeland Security (DHS) tocharge an alien with being removable from the United States. Jurisdiction vests andproceedings commence when an NTA is filed with an immigration court by DHS. Priorto the enactment of the Illegal Immigration Reform and Immigrant Responsibility Act of1996, the charging document was known as an Order to Show Cause.
Notice of Intent To RescindIn a rescission case, the Department of Homeland Security issues a Notice of Intent toRescind an individual’s permanent resident status, and the individual has the right tocontest the charge in rescission proceedings. See Rescission Proceedings.
O
Office of the Chief Administrative Hearing Officer (OCAHO)OCAHO’s jurisdiction includes cases involving allegations of: (1) knowingly hiring,recruiting or referring for a fee unauthorized aliens, or the continued employment ofunauthorized aliens and failure to comply with employment eligibility verificationrequirements of section 274A of the INA (employer sanctions); (2) unfair immigration-

Executive Office for Immigration Review Office of Planning, Analysis, and TechnologyFY 2010 Statistical Year Book Appendix A - Glossary of Terms
January 201115
related employment practices in violation of section 274B of the INA; (3) immigration-related document fraud in violation of section 274C of the INA; and (4) IRCA’sprohibition of indemnity bonds. OCAHO is headed by a Chief Administrative HearingOfficer (CAHO) who provides overall program direction, articulates policies andprocedures, establishes priorities and administers the hearing process presided over byAdministrative Law Judges (ALJs). The CAHO conducts administrative review of ALJs'decisions in the areas of employer sanctions and document fraud, and may modify orvacate those ALJ decisions. Complaints are brought by the Department of HomelandSecurity, the Office of Special Counsel for Immigration-Related Unfair EmploymentPractices, or private individuals as prescribed by statute.
Office of the Chief Immigration Judge (OCIJ)OCIJ provides overall program direction, articulates policies and procedures, andestablishes priorities for immigration judges. The Chief Immigration Judge carries outthese responsibilities with the assistance and support of a Deputy Chief ImmigrationJudge, numerous Assistant Chief Immigration Judges, a Chief Clerk’s Office, aLanguage Services Unit, and other personnel that coordinate the management andoperation of the immigration courts. See Immigration Judge.
P
Pro BonoA Latin phrase meaning “for the public good.” In a legal context, this phrase meanslegal representation done or performed free of charge. Because aliens in removalproceedings are not entitled to publicly-funded legal assistance, some attorneys offertheir services on a pro bono basis.
Pro SeA Latin phrase meaning that the party represents him or herself in legal proceedingswithout an attorney or representative.
ProceedingThe legal process conducted before the immigration court and Board of ImmigrationAppeals.
R
Reasonable Fear ReviewReasonable Fear Review proceedings are available to aliens who have been orderedremoved by the Department of Homeland Security (DHS) under section 238 of theImmigration and Nationality Act (covering aliens who are not lawful permanent residentsand have been convicted of an aggravated felony) and under section 241(a)(5) of theImmigration and Nationality Act (covering aliens who are the subjects of previouslyissued final orders of removal). Under this process, an alien who has been orderedremoved by DHS and expresses a fear of persecution or torture will have his or her

Executive Office for Immigration Review Office of Planning, Analysis, and TechnologyFY 2010 Statistical Year Book Appendix A - Glossary of Terms
January 201116
claim screened by an asylum officer. If the asylum officer determines that the alien hasnot established a reasonable fear of persecution or torture, the alien may request areview of that determination by an immigration judge. That review must be concludedwithin ten days after the asylum officer refers the case to the immigration court, unlessthere are exceptional circumstances. No appeal to the Board of Immigration Appealsmay be taken from the immigration judge’s finding that an alien does not have areasonable fear of persecution or torture. If an immigration judge determines that thealien has a reasonable fear of persecution or torture, the alien will be placed inwithholding-only proceedings.
ReceiptsThe number of judicial filings received by the Executive Office for Immigration Review. For the immigration courts, receipts include bond redetermination hearings,proceedings, and motions. For the Board of Immigration Appeals, receipts includecase, bond, motion, and interlocutory appeals, as well as certain appeals of Departmentof Homeland Security decisions. For the Office of the Chief Administrative HearingOfficer, receipts represent the number of new complaints filed.
Recognized OrganizationA non-profit religious, charitable, social service, or similar organization formallyrecognized by the Board of Immigration Appeals as such under the provisions of 8C.F.R. section 1292.2. See Accredited Representative.
Reconsider, Motion toAliens may request, by motion, the reconsideration of a case previously heard by animmigration judge or the Board of Immigration Appeals (BIA). A motion to reconsidereither identifies an error in law or fact in a prior proceeding or identifies a change in lawand asks the immigration judge or BIA to re-examine its ruling. A motion to reconsideris based on the existing record and does not seek to introduce new facts or evidence.
ReleasedA released alien is an individual who was detained at some point during proceedingsand subsequently was released on bond or on their own recognizance.
Relief from RemovalIn hearings before an immigration judge, an alien may be able to seek relief fromremoval. Various types of relief may be sought, including asylum, withholding ofremoval, protection under the Convention Against Torture, cancellation of removal, oradjustment of status. Many forms of relief require the alien to fill out an appropriateapplication.
RemovableThe Illegal Immigration Reform and Immigrant Responsibility Act of 1996 (IIRIRA) replaced the terms “excludable” and “deportable” with the umbrella term “removable.” An alien may be found to be removable from the United States by an immigration judge

Executive Office for Immigration Review Office of Planning, Analysis, and TechnologyFY 2010 Statistical Year Book Appendix A - Glossary of Terms
January 201117
or the Board of Immigration Appeals. Additionally, some aliens are determined to beremovable by the Department of Homeland Security, e.g., in expedited removal oradministrative removal proceedings. Only aliens found removable by the ExecutiveOffice for Immigration Review are reported in this Year Book.
Removal ProceedingsAn immigration court proceeding begun on or after April 1, 1997, seeking to either stopcertain aliens from being admitted to the United States or to remove them from theUnited States. A removal case usually arises when the Department of HomelandSecurity (DHS) alleges that a respondent is inadmissible to the United States, hasentered the country illegally by crossing the border without being inspected by animmigration officer, or has violated the terms of his or her admission. The DHS issues acharging document called a Notice to Appear (Form I-862) and files it with animmigration court to begin a removal proceeding.
Reopen, Motion toAliens may request, by motion, the reopening of a case previously heard by animmigration judge or the Board of Immigration Appeals (BIA). A motion to reopen asksan immigration judge or the BIA to consider new and previously unavailable facts orevidence in a case.
RepresentedA represented individual has an attorney or accredited representative act as his agent inproceedings before the immigration courts or the Board of Immigration Appeals.
Rescission Proceedings A less common type of proceeding is related to rescinding lawful permanent residentstatus. If, within five years of granting adjustment of status, the Department ofHomeland Security (DHS) discovers that the respondent/applicant was not entitled tolawful permanent resident (LPR) status when it was granted, DHS issues a Notice ofIntent to Rescind. If the respondent/applicant requests a hearing before an immigrationcourt, DHS will file the Notice with the immigration court, and the proceeding to rescindthe individual's LPR status commences. As with deportation cases, the government hasthe burden of proof to show that rescission is warranted. If an individual loses LPRstatus, he or she then is usually subject to removal proceedings. Although rescissionproceedings still exist after April 1, 1997, DHS may also place an LPR into removalproceedings. An order of removal is sufficient to rescind the alien's status. See Noticeof Intent to Rescind.
RespondentA party to an immigration proceeding against whom charges have been lodged and findings may be made.

Executive Office for Immigration Review Office of Planning, Analysis, and TechnologyFY 2010 Statistical Year Book Appendix A - Glossary of Terms
January 201118
S
Suspension of DeportationSuspension of Deportation was a discretionary form of relief for certain aliens indeportation proceedings who had maintained continuous physical presence in theUnited States for seven years and had met the other statutory requirements for suchrelief. See former section 244 of the Immigration and Nationality Act. Application forthis relief was made during the course of a hearing before an immigration judge. Thestatus of an alien who was granted this relief was adjusted to that of an alien lawfullyadmitted for permanent residence. In 1997, the Illegal Immigration Reform andImmigrant Responsibility Act of 1996 replaced suspension of deportation withcancellation of removal. See Cancellation of Removal, Illegal Immigration Reform andImmigrant Responsibility Act of 1996 (IIRIRA).
T
Termination A termination is a type of completion in which a case is closed by an immigration judgeor the Board of Immigration Appeals without a final order of removal or deportation. Acase is terminated when the respondent is found not removable as DHS charged.
U
UnrepresentedAn individual in proceedings may represent himself or herself before an immigrationcourt or the Board of Immigration Appeals instead of being represented by an attorneyor accredited representative. See Pro Se.
V
Visa PetitionA visa petition is the first step toward obtaining lawful permanent residence for aforeign-born individual or family. It is usually filed by a U.S. citizen, lawful permanentresident, or employer on behalf of an alien. Visa petitions filed by individuals present inthe United States are adjudicated by the Department of Homeland Security (DHS),United States Citizenship and Immigration Services (USCIS) and, once approved, maybe revoked or revalidated by DHS under certain circumstances. (Visa petitions filed byindividuals outside the United States are adjudicated by the Department of State.) Insome instances, if a visa petition that was filed with USCIS is denied or revoked, or therevalidation of a visa petition is denied, an appeal may be taken to the Board ofImmigration Appeals (BIA). For visa petition appeals within the BIA’s jurisdiction,USCIS is initially responsible for management of the appeal, including the briefing

Executive Office for Immigration Review Office of Planning, Analysis, and TechnologyFY 2010 Statistical Year Book Appendix A - Glossary of Terms
January 201119
process. The BIA’s role in the appeal process does not begin until the completed recordis received from USCIS.
Voluntary DepartureVoluntary departure is the departure of an alien from the United States without an orderof removal. The departure may or may not have been preceded by a hearing before animmigration judge. An alien allowed to voluntarily depart concedes removability but isnot barred from seeking admission at a port of entry in the future. Failure to departwithin the time granted results in a fine and a 10-year bar against the alien applying forseveral forms of relief from removal.
W
Withdrawal of an AppealAn appealing party may, at any time prior to the entry of a decision by the Board ofImmigration Appeals, voluntarily withdraw his or her appeal. The decision made in thecase shall be final to the same extent as if no appeal had been taken.
Withdrawal of an Application for ReliefAn alien in proceedings may, at any time prior to a decision in his or her case,voluntarily withdraw any application for relief filed on his or her behalf.
Withholding of RemovalPursuant to section 241(b)(3) of the Immigration and Nationality Act, an alien may notbe removed to a particular country if the alien can establish that his or her life orfreedom would be threatened in that country because of the alien’s race, religion,nationality, membership in a particular social group, or political opinion. A request forasylum is deemed to include a request for withholding of removal under the applicableregulations. Withholding-only ProceedingsAn alien in administrative removal proceedings under section 238 of the Immigrationand Nationality Act (covering aliens who are not lawful permanent residents and havebeen convicted of an aggravated felony) and aliens subject to reinstatement of removalunder section 241(a)(5) of the Immigration and Nationality Act are now able to apply forwithholding of removal under section 241(b)(3) of the Immigration and Nationality Act,as well as under Article 3 of the Convention Against Torture, after a screening processby a Department of Homeland Security asylum officer. In a withholding-onlyproceeding, an immigration judge may only consider the alien’s application forwithholding of removal under section 241(b)(3) of the Immigration and Nationality Actand the Convention Against Torture pursuant to 8 C.F.R. sections 1208.16 and1208.17. The Board of Immigration Appeals has jurisdiction over appeals fromimmigration judge decisions in withholding-only cases. See Asylum-only Proceedings.

NATIONALITY RECEIVED GRANTED DENIED ABANDONED WITHDRAWN OTHER
Office of Planning, Analysis, and Technology
U.S. Department of JusticeExecutive Office for Immigration Review
Immigration CourtsFY 2010 Asylum Statistics
51 6 10 2 5 16AFGHANISTAN
175 148 104 10 26 58ALBANIA
15 1 5 0 3 4ALGERIA
1 0 0 0 0 0ANDORRA
7 2 9 1 0 4ANGOLA
2 0 1 0 1 0ANTIGUA AND BARBUDA
35 8 14 8 11 15ARGENTINA
232 206 99 28 57 141ARMENIA
4 0 4 0 1 3AUSTRALIA
3 0 0 0 2 1AUSTRIA
32 9 9 3 5 16AZERBAIJAN
19 0 4 0 8 6BAHAMAS
3 2 0 1 1 7BAHRAIN
178 48 27 6 54 61BANGLADESH
4 0 1 0 0 1BARBADOS
0 0 0 0 1 0BE REMOVED FROM THE UNITED STATES
68 40 16 3 8 21BELARUS
11 6 5 2 2 6BELGIUM
12 2 13 0 4 6BELIZE
13 3 3 0 2 4BENIN
1 0 1 0 0 0BERMUDA
13 2 1 0 0 3BHUTAN
21 8 8 0 7 10BOLIVIA
32 4 17 1 3 10BOSNIA-HERZEGOVINA
7 0 0 0 1 0BOTSWANA
147 17 58 21 36 37BRAZIL
1 0 0 0 0 0BRITISH VIRGIN ISLANDS
46 20 16 4 10 22BULGARIA
86 49 15 0 13 14BURKINA FASO
106 80 20 1 11 43BURMA (MYANMAR)
14 7 3 0 4 4BURUNDI
Page 1 of 7 January 2011 (SYB)

NATIONALITY RECEIVED GRANTED DENIED ABANDONED WITHDRAWN OTHER
Office of Planning, Analysis, and Technology
U.S. Department of JusticeExecutive Office for Immigration Review
Immigration CourtsFY 2010 Asylum Statistics
59 27 11 4 6 16BYELORUSSIA (BELARUS)
22 13 14 1 10 18CAMBODIA
245 196 57 13 15 100CAMEROON
16 5 4 1 3 9CANADA
1 1 0 0 0 0CAYMAN ISLANDS
18 10 4 0 2 4CENTRAL AFRICAN REPUBLIC
10 28 5 2 5 5CHAD
22 1 7 0 2 10CHILE
10,087 3,795 1,522 181 285 1,606CHINA
1 0 0 0 0 0COCOS ISLAND
563 234 380 76 220 285COLOMBIA
1 1 2 0 0 0COMORO ISLANDS
105 56 25 3 15 20CONGO
12 0 5 2 4 5COSTA RICA
7 2 1 1 0 1CROATIA
167 9 106 18 65 138CUBA
0 0 1 0 0 0CYPRUS
9 4 7 0 1 0CZECH REPUBLIC
2 0 0 0 0 5CZECHOSLOVAKIA
23 12 22 3 4 14DEMOCRATIC REPUBLIC OF CONGO
1 0 0 0 1 0DENMARK
9 1 2 1 0 5DJIBOUTI
7 0 2 1 1 2DOMINICA
63 11 30 2 11 23DOMINICAN REPUBLIC
2 0 1 0 0 0EAST GERMANY
243 7 63 7 49 35ECUADOR
393 216 40 13 34 99EGYPT
1,780 146 1,103 285 1,080 1,773EL SALVADOR
4 0 0 0 2 0EQUATORIAL GUINEA
283 179 29 0 3 54ERITREA
5 2 7 0 1 2ESTONIA
Page 2 of 7 January 2011 (SYB)

NATIONALITY RECEIVED GRANTED DENIED ABANDONED WITHDRAWN OTHER
Office of Planning, Analysis, and Technology
U.S. Department of JusticeExecutive Office for Immigration Review
Immigration CourtsFY 2010 Asylum Statistics
614 407 106 5 27 127ETHIOPIA
1 0 0 1 0 0FALKLAND ISLANDS
2 0 1 0 0 0FEDERATED STATES OF MICRONESA
52 18 15 1 11 20FIJI
0 0 0 0 0 1FINLAND
17 1 2 2 2 8FRANCE
1 0 0 0 0 0FRENCH GUIANA
11 2 1 0 0 3GABON
171 42 41 1 53 36GAMBIA
0 1 0 0 0 0GAZA STRIP
30 32 17 7 18 11GEORGIA
50 11 14 4 9 10GERMANY
59 8 31 1 10 18GHANA
0 1 0 0 0 0GIBRALTAR
5 1 4 1 1 1GREECE
12 0 1 1 0 0GRENADA
0 0 1 0 0 0GUADELOUPE
1,611 166 1,004 248 1,194 1,085GUATEMALA
397 186 76 7 58 78GUINEA
5 1 2 0 0 0GUINEA BISSAU
44 3 13 1 17 25GUYANA
820 167 496 132 347 2,238HAITI
0 0 1 0 0 0HOLLAND
526 65 364 49 133 234HONDURAS
3 0 1 0 1 0HONG KONG
27 1 9 13 1 3HUNGARY
1,002 241 224 33 119 233INDIA
326 116 293 36 112 167INDONESIA
205 83 46 6 44 80IRAN
161 149 46 4 25 35IRAQ
6 1 0 0 1 1IRELAND
Page 3 of 7 January 2011 (SYB)

NATIONALITY RECEIVED GRANTED DENIED ABANDONED WITHDRAWN OTHER
Office of Planning, Analysis, and Technology
U.S. Department of JusticeExecutive Office for Immigration Review
Immigration CourtsFY 2010 Asylum Statistics
38 10 17 2 5 12ISRAEL
7 5 9 2 1 2ITALY
216 66 44 11 39 42IVORY COAST (COTE D'IVOIRE)
147 6 79 4 18 46JAMAICA
7 0 3 0 1 0JAPAN
62 19 30 6 24 25JORDAN
2 0 1 0 1 4KAMPUCHEA
58 17 12 5 7 16KAZAKHSTAN
297 90 116 15 44 76KENYA
64 10 5 2 8 13KIRGHIZIA (KYRGYZSTAN)
28 6 2 0 0 3KOSOVO
9 3 6 1 3 4KUWAIT
46 7 17 1 13 23LAOS
12 0 4 0 1 2LATVIA
49 26 41 7 21 27LEBANON
0 0 1 0 0 0LESOTHO
124 25 45 5 29 61LIBERIA
10 5 1 0 1 1LIBYA
10 2 8 2 11 5LITHUANIA
2 1 0 0 0 1MACAU
23 10 6 0 5 10MACEDONIA
1 0 0 0 2 0MADAGASCAR
11 2 0 0 0 0MALAWI
20 8 6 0 5 3MALAYSIA
232 74 50 0 42 55MALI
0 0 0 1 0 0MALTA
141 59 47 15 11 49MAURITANIA
3 0 0 0 0 0MAURITIUS
3,231 49 508 174 1,671 671MEXICO
312 46 34 16 22 81MOLDAVIA (MOLDOVA)
2 1 0 0 0 1MONACO
Page 4 of 7 January 2011 (SYB)

NATIONALITY RECEIVED GRANTED DENIED ABANDONED WITHDRAWN OTHER
Office of Planning, Analysis, and Technology
U.S. Department of JusticeExecutive Office for Immigration Review
Immigration CourtsFY 2010 Asylum Statistics
217 50 33 4 7 48MONGOLIA
4 0 0 0 0 0MONTENEGRO
32 3 19 2 11 8MOROCCO
4 0 1 0 1 7NAMIBIA
755 230 109 6 9 88NEPAL
4 4 3 2 1 0NETHERLANDS
2 0 0 0 0 0NETHERLANDS ANTILLES
2 1 2 0 0 0NEW ZEALAND
163 15 106 26 59 60NICARAGUA
41 4 14 4 5 12NIGER
133 35 70 5 29 50NIGERIA
15 1 2 1 0 1NIUE
0 2 0 0 0 0NO NATIONALITY
7 0 1 2 0 1NORTH KOREA
1 1 2 0 0 0NORWAY
396 113 123 11 78 118PAKISTAN
4 1 3 0 0 2PALESTINE
5 1 1 0 3 0PANAMA
2 2 3 0 3 0PARAGUAY
0 1 0 0 0 0PEOPLE'S REPUBLIC OF BENIN
126 25 93 10 52 62PERU
121 5 48 1 62 71PHILIPPINES
30 2 20 0 25 8POLAND
7 0 2 0 4 2PORTUGAL
0 0 0 0 1 0QATAR
73 27 20 4 10 33ROMANIA
574 159 111 42 73 182RUSSIA
34 25 4 2 6 10RWANDA
0 0 1 1 1 0SAMOA
0 0 0 0 0 1SAN MARINO
14 3 1 1 2 0SAUDI ARABIA
Page 5 of 7 January 2011 (SYB)

NATIONALITY RECEIVED GRANTED DENIED ABANDONED WITHDRAWN OTHER
Office of Planning, Analysis, and Technology
U.S. Department of JusticeExecutive Office for Immigration Review
Immigration CourtsFY 2010 Asylum Statistics
187 18 28 2 29 30SENEGAL
19 23 14 0 2 6SERBIA MONTENEGRO
1 1 2 1 2 0SEYCHELLES
75 27 48 7 10 32SIERRA LEONE
8 0 3 0 1 2SINGAPORE
8 1 2 0 4 2SLOVAK REPUBLIC
1 2 0 0 1 2SLOVENIA
445 208 57 12 12 93SOMALIA
16 2 13 1 6 4SOUTH AFRICA
23 4 16 5 10 13SOUTH KOREA
514 176 36 13 27 83SOVIET UNION
6 0 2 0 1 5SPAIN
228 111 51 9 14 42SRI LANKA
8 0 3 2 0 2ST. KITTS, WEST INDIES
8 0 2 2 0 0ST. LUCIA
3 0 1 0 1 2ST. VINCENT AND THE GRENADINES
133 85 22 3 11 34STATELESS - ALIEN UNABLE TO NAME A COUNTRY
101 35 25 4 12 26SUDAN
11 0 1 0 3 5SURINAME
1 0 0 0 0 0SWAZILAND
7 1 0 1 1 1SWEDEN
1 0 4 0 1 0SWITZERLAND
36 13 17 4 22 15SYRIA
10 1 1 0 5 2TAIWAN
41 9 7 1 5 6TAJIKISTAN (TADZHIK)
23 3 11 1 5 6TANZANIA
21 4 3 0 10 12THAILAND
3 0 0 0 0 1THE REPUBLIC OF THE MARSHALL ISLANDS
48 45 20 2 9 36TOGO
4 0 3 0 12 8TONGA
37 1 9 5 4 19TRINIDAD AND TOBAGO
Page 6 of 7 January 2011 (SYB)

NATIONALITY RECEIVED GRANTED DENIED ABANDONED WITHDRAWN OTHER
Office of Planning, Analysis, and Technology
U.S. Department of JusticeExecutive Office for Immigration Review
Immigration CourtsFY 2010 Asylum Statistics
4 0 5 0 3 4TUNISIA
63 12 30 3 5 21TURKEY
24 7 5 3 0 0TURKMENISTAN
1 0 1 0 0 0TURKS AND CAICOS ISLANDS
55 26 22 0 4 14UGANDA
201 62 64 9 33 74UKRAINE
4 0 0 0 0 0UNITED ARAB EMIRATES
30 2 3 0 6 14UNITED KINGDOM
59 7 34 0 9 19UNKNOWN NATIONALITY
19 0 2 6 7 2URUGUAY
152 54 54 14 30 57UZEBEKISTAN
398 181 207 26 108 156VENEZUELA
62 9 28 1 22 39VIETNAM
38 7 11 1 6 20YEMEN
107 85 23 1 14 31YUGOSLAVIA
15 4 7 3 1 1ZAIRE
6 7 3 0 2 6ZAMBIA
109 52 48 6 19 29ZIMBABWE
32,961 9,869 9,554 1,799 7,194 12,129TOTAL
Page 7 of 7 January 2011 (SYB)
NATIONALITY RECEIVED GRANTED DENIED ABANDONED WITHDRAWN OTHER
Office of Planning, Analysis, and Technology
U.S. Department of JusticeExecutive Office for Immigration Review
Immigration CourtsFY 2009 Asylum Statistics
38 7 6 1 2 19AFGHANISTAN
324 213 122 12 36 71ALBANIA
27 6 13 1 7 9ALGERIA
27 6 7 2 2 10ANGOLA
1 0 0 0 0 0ANTIGUA AND BARBUDA
44 10 13 8 19 20ARGENTINA
323 201 98 20 82 115ARMENIA
0 1 0 0 0 0ARUBA
2 0 0 0 1 0AUSTRALIA
1 1 1 0 0 0AUSTRIA
37 14 7 3 7 11AZERBAIJAN
9 0 7 0 2 0BAHAMAS
9 0 0 0 0 0BAHRAIN
248 51 52 8 44 56BANGLADESH
3 0 0 0 0 1BARBADOS
1 1 0 0 1 0BE REMOVED FROM THE UNITED STATES
91 34 10 4 5 22BELARUS
23 7 8 1 0 6BELGIUM
24 2 7 2 2 1BELIZE
16 4 4 0 1 4BENIN
4 0 0 0 0 0BERMUDA
6 5 0 0 1 2BHUTAN
28 1 10 2 8 4BOLIVIA
42 17 12 7 6 15BOSNIA-HERZEGOVINA
1 0 0 0 0 0BOTSWANA
214 22 65 16 39 41BRAZIL
2 0 0 0 0 1BRUNEI
86 42 21 14 10 35BULGARIA
91 39 6 2 7 21BURKINA FASO
163 108 23 5 7 30BURMA (MYANMAR)
31 15 10 1 0 4BURUNDI
Page 1 of 7 January 2011 (SYB)

NATIONALITY RECEIVED GRANTED DENIED ABANDONED WITHDRAWN OTHER
Office of Planning, Analysis, and Technology
U.S. Department of JusticeExecutive Office for Immigration Review
Immigration CourtsFY 2009 Asylum Statistics
82 39 8 4 6 19BYELORUSSIA (BELARUS)
42 11 25 1 6 11CAMBODIA
404 211 83 19 24 98CAMEROON
23 11 5 0 2 9CANADA
1 0 0 0 1 0CAPE VERDE
35 16 8 1 1 17CENTRAL AFRICAN REPUBLIC
65 40 9 2 13 15CHAD
19 6 7 2 2 3CHILE
9,916 3,448 1,649 196 238 1,624CHINA
0 0 1 0 0 0COCOS ISLAND
996 368 504 133 252 319COLOMBIA
190 49 24 7 11 54CONGO
15 1 4 5 3 5COSTA RICA
12 1 5 0 1 1CROATIA
254 15 100 10 77 140CUBA
1 0 0 0 0 0CYPRUS
8 2 1 2 3 1CZECH REPUBLIC
3 0 2 0 2 5CZECHOSLOVAKIA
48 10 12 2 0 8DEMOCRATIC REPUBLIC OF CONGO
15 5 1 1 1 0DJIBOUTI
3 0 1 1 0 1DOMINICA
85 3 27 0 12 19DOMINICAN REPUBLIC
0 0 3 0 0 0EAST GERMANY
252 6 28 6 37 47ECUADOR
414 174 58 11 29 70EGYPT
4,078 120 1,233 566 1,091 2,733EL SALVADOR
2 0 1 0 0 0EQUATORIAL GUINEA
322 198 23 5 5 47ERITREA
19 8 9 4 3 19ESTONIA
800 410 112 19 26 123ETHIOPIA
81 29 24 8 11 12FIJI
Page 2 of 7 January 2011 (SYB)
NATIONALITY RECEIVED GRANTED DENIED ABANDONED WITHDRAWN OTHER
Office of Planning, Analysis, and Technology
U.S. Department of JusticeExecutive Office for Immigration Review
Immigration CourtsFY 2009 Asylum Statistics
4 4 1 0 4 2FINLAND
9 1 4 1 4 4FRANCE
10 0 1 0 1 0GABON
216 49 53 6 33 57GAMBIA
136 24 28 5 8 41GEORGIA
38 1 8 3 0 9GERMANY
86 8 27 3 9 20GHANA
1 0 0 0 0 0GIBRALTAR
7 0 0 0 1 1GREECE
3 0 1 0 1 2GRENADA
3,721 159 1,156 633 1,333 1,420GUATEMALA
486 194 98 7 49 95GUINEA
11 3 3 0 1 3GUINEA BISSAU
68 0 23 3 16 21GUYANA
1,900 410 1,586 281 259 716HAITI
1 0 0 0 0 0HOLLAND
832 46 401 76 116 232HONDURAS
3 1 4 0 0 0HONG KONG
16 1 2 3 3 3HUNGARY
1 0 0 0 0 1ICELAND
1,121 263 231 44 100 224INDIA
590 157 336 62 122 159INDONESIA
227 92 48 9 48 79IRAN
354 364 49 5 26 59IRAQ
1 0 0 0 0 0IRELAND
56 17 18 3 14 23ISRAEL
14 0 9 0 6 5ITALY
292 96 65 14 65 81IVORY COAST (COTE D'IVOIRE)
181 2 80 6 19 38JAMAICA
7 2 4 0 7 1JAPAN
95 20 38 4 21 35JORDAN
Page 3 of 7 January 2011 (SYB)

NATIONALITY RECEIVED GRANTED DENIED ABANDONED WITHDRAWN OTHER
Office of Planning, Analysis, and Technology
U.S. Department of JusticeExecutive Office for Immigration Review
Immigration CourtsFY 2009 Asylum Statistics
4 1 5 0 3 1KAMPUCHEA
84 20 9 2 2 21KAZAKHSTAN
377 97 94 20 36 66KENYA
80 7 5 1 6 14KIRGHIZIA (KYRGYZSTAN)
1 0 1 0 0 1KIRIBATI
32 7 1 0 2 1KOSOVO
21 5 3 0 1 9KUWAIT
65 13 26 4 3 31LAOS
13 2 2 2 6 4LATVIA
115 9 46 10 20 36LEBANON
1 0 0 0 0 0LESOTHO
210 31 55 13 20 75LIBERIA
6 5 2 0 1 2LIBYA
16 1 6 1 2 15LITHUANIA
1 0 0 0 1 1MACAU
42 15 16 1 3 5MACEDONIA
4 2 2 0 0 1MADAGASCAR
11 2 4 1 6 4MALAWI
19 1 12 2 2 9MALAYSIA
1 0 0 0 0 0MALDIVES
243 71 64 6 51 76MALI
1 1 0 0 0 1MALTA
327 95 44 20 14 205MAURITANIA
2 0 0 0 0 0MAURITIUS
3,335 65 365 639 1,743 559MEXICO
285 22 17 14 11 55MOLDAVIA (MOLDOVA)
9 0 0 0 0 5MONACO
277 28 43 3 7 46MONGOLIA
0 0 1 0 0 0MONTENEGRO
47 4 13 5 6 12MOROCCO
7 0 5 0 0 0NAMIBIA
Page 4 of 7 January 2011 (SYB)
NATIONALITY RECEIVED GRANTED DENIED ABANDONED WITHDRAWN OTHER
Office of Planning, Analysis, and Technology
U.S. Department of JusticeExecutive Office for Immigration Review
Immigration CourtsFY 2009 Asylum Statistics
1 0 0 0 0 0NAURU
762 172 81 9 16 57NEPAL
6 0 4 0 0 2NETHERLANDS
1 0 0 0 1 0NETHERLANDS ANTILLES
0 0 1 1 2 0NEW CALEDONIA
1 0 0 0 3 0NEW ZEALAND
286 19 135 34 81 83NICARAGUA
73 14 13 3 8 27NIGER
192 29 73 9 32 51NIGERIA
10 3 4 1 1 3NIUE
0 0 1 0 0 0NORFOLK ISLAND
5 1 2 1 2 2NORTH KOREA
2 0 0 0 0 0NORWAY
1 0 0 0 2 5OMAN
566 104 115 15 72 152PAKISTAN
14 0 5 1 6 2PALESTINE
14 1 5 2 3 1PANAMA
9 2 1 0 4 1PARAGUAY
1 0 0 0 0 0PEOPLE'S REPUBLIC OF BENIN
207 39 82 7 48 39PERU
184 13 57 8 50 31PHILIPPINES
1 0 0 0 0 0PITCAIRN ISLANDS
35 5 16 7 13 27POLAND
2 1 1 0 0 4PORTUGAL
1 0 0 0 0 1QATAR
92 31 31 17 12 27ROMANIA
735 128 111 66 48 240RUSSIA
76 24 4 0 0 25RWANDA
3 0 0 0 0 0SAMOA
6 3 1 0 0 2SAUDI ARABIA
163 25 30 2 21 45SENEGAL
Page 5 of 7 January 2011 (SYB)
NATIONALITY RECEIVED GRANTED DENIED ABANDONED WITHDRAWN OTHER
Office of Planning, Analysis, and Technology
U.S. Department of JusticeExecutive Office for Immigration Review
Immigration CourtsFY 2009 Asylum Statistics
43 47 14 0 2 14SERBIA MONTENEGRO
0 0 1 0 0 0SEYCHELLES
152 29 38 3 26 75SIERRA LEONE
2 4 1 0 0 1SINGAPORE
10 1 0 0 2 10SLOVAK REPUBLIC
9 0 0 1 0 3SLOVENIA
1 0 0 0 0 0SOLOMON ISLANDS
338 168 40 12 6 76SOMALIA
29 3 10 1 3 6SOUTH AFRICA
72 1 6 1 12 10SOUTH KOREA
467 154 39 15 32 97SOVIET UNION
5 3 0 1 2 1SPAIN
373 112 59 12 22 64SRI LANKA
2 0 0 0 1 1ST. KITTS, WEST INDIES
8 0 0 0 0 1ST. LUCIA
1 0 3 0 0 0ST. VINCENT AND THE GRENADINES
274 82 20 7 11 56STATELESS - ALIEN UNABLE TO NAME A COUNTRY
124 40 33 2 10 41SUDAN
9 0 1 0 0 0SURINAME
1 0 0 0 0 0SWAZILAND
3 5 2 0 0 2SWEDEN
5 0 0 0 0 0SWITZERLAND
56 18 12 4 23 12SYRIA
7 1 2 0 2 1TAIWAN
50 8 2 0 1 8TAJIKISTAN (TADZHIK)
31 6 9 2 5 12TANZANIA
20 1 8 0 7 5THAILAND
0 0 0 0 0 1THE REPUBLIC OF THE MARSHALL ISLANDS
164 39 23 1 11 78TOGO
9 0 1 0 4 1TONGA
43 0 18 0 7 10TRINIDAD AND TOBAGO
Page 6 of 7 January 2011 (SYB)

NATIONALITY RECEIVED GRANTED DENIED ABANDONED WITHDRAWN OTHER
Office of Planning, Analysis, and Technology
U.S. Department of JusticeExecutive Office for Immigration Review
Immigration CourtsFY 2009 Asylum Statistics
7 0 6 2 5 4TUNISIA
92 18 10 3 3 23TURKEY
23 14 4 0 7 11TURKMENISTAN
1 0 0 0 0 0TURKS AND CAICOS ISLANDS
80 28 21 5 2 16UGANDA
303 26 56 13 30 79UKRAINE
0 0 0 4 0 0UNITED ARAB EMIRATES
38 6 15 3 7 7UNITED KINGDOM
91 7 40 1 19 11UNKNOWN NATIONALITY
15 0 0 4 4 1URUGUAY
183 65 48 22 21 50UZEBEKISTAN
615 192 297 60 134 147VENEZUELA
79 10 31 0 16 23VIETNAM
0 0 0 0 0 1WESTERN SAHARA
59 7 9 1 6 15YEMEN
193 101 40 5 12 25YUGOSLAVIA
12 8 1 0 0 0ZAIRE
21 5 6 0 2 3ZAMBIA
229 69 51 12 24 53ZIMBABWE
44,022 10,298 11,334 3,406 7,264 12,366TOTAL
Page 7 of 7 January 2011 (SYB)

NATIONALITY RECEIVED GRANTED DENIED ABANDONED WITHDRAWN OTHER
Office of Planning, Analysis, and Technology
U.S. Department of JusticeExecutive Office for Immigration Review
Immigration CourtsFY 2008 Asylum Statistics
40 28 13 0 4 13AFGHANISTAN
304 324 180 18 54 79ALBANIA
35 5 12 4 3 6ALGERIA
14 8 4 1 1 7ANGOLA
2 0 1 0 1 1ANTIGUA AND BARBUDA
70 14 41 20 17 11ARGENTINA
362 144 102 19 76 75ARMENIA
0 0 1 0 0 0AUSTRALIA
4 0 11 0 2 1AUSTRIA
37 12 3 2 9 8AZERBAIJAN
12 2 3 0 5 1BAHAMAS
4 0 0 1 1 4BAHRAIN
258 81 39 3 41 50BANGLADESH
2 0 1 0 0 0BARBADOS
3 0 1 1 0 0BE REMOVED FROM THE UNITED STATES
67 39 12 0 3 16BELARUS
26 9 2 4 2 6BELGIUM
13 1 4 0 0 1BELIZE
20 2 0 1 2 3BENIN
1 0 0 0 0 0BERMUDA
10 4 0 0 0 1BHUTAN
40 6 2 1 4 12BOLIVIA
56 6 24 5 8 4BOSNIA-HERZEGOVINA
1 0 0 0 0 0BOTSWANA
191 31 58 37 57 33BRAZIL
1 0 0 0 0 1BRITISH INDIAN OCEAN TERRITORY
119 48 23 13 14 38BULGARIA
93 23 12 3 12 10BURKINA FASO
211 126 30 4 2 23BURMA (MYANMAR)
23 12 15 1 3 2BURUNDI
54 41 7 1 10 13BYELORUSSIA (BELARUS)
Page 1 of 7 January 2011 (SYB)

NATIONALITY RECEIVED GRANTED DENIED ABANDONED WITHDRAWN OTHER
Office of Planning, Analysis, and Technology
U.S. Department of JusticeExecutive Office for Immigration Review
Immigration CourtsFY 2008 Asylum Statistics
34 7 16 6 11 16CAMBODIA
486 161 99 17 24 101CAMEROON
19 3 8 0 6 10CANADA
2 0 2 0 4 0CAPE VERDE
25 13 6 1 0 4CENTRAL AFRICAN REPUBLIC
96 24 8 3 0 12CHAD
20 1 2 2 7 9CHILE
9,223 3,456 1,763 114 224 1,195CHINA
1 0 0 0 0 0COCOS ISLAND
1,213 547 810 160 443 420COLOMBIA
3 0 0 0 0 2COMORO ISLANDS
112 70 40 12 8 35CONGO
21 1 8 6 5 4COSTA RICA
10 0 2 0 1 2CROATIA
379 23 79 28 112 150CUBA
0 1 0 0 0 0CYPRUS
20 3 5 5 3 8CZECH REPUBLIC
7 3 1 5 8 11CZECHOSLOVAKIA
46 24 14 1 6 3DEMOCRATIC REPUBLIC OF CONGO
1 0 1 0 3 0DENMARK
7 1 1 0 0 2DJIBOUTI
5 0 0 1 0 0DOMINICA
71 1 24 6 8 14DOMINICAN REPUBLIC
6 1 1 0 0 0EAST GERMANY
147 13 39 10 31 19ECUADOR
415 185 56 5 29 53EGYPT
6,068 173 1,474 604 1,107 2,532EL SALVADOR
0 9 0 0 0 1EQUATORIAL GUINEA
298 120 25 1 5 24ERITREA
15 3 12 6 6 3ESTONIA
764 315 142 16 31 77ETHIOPIA
Page 2 of 7 January 2011 (SYB)

NATIONALITY RECEIVED GRANTED DENIED ABANDONED WITHDRAWN OTHER
Office of Planning, Analysis, and Technology
U.S. Department of JusticeExecutive Office for Immigration Review
Immigration CourtsFY 2008 Asylum Statistics
1 0 2 0 0 0FEDERATED STATES OF MICRONESA
82 24 19 5 20 28FIJI
1 0 1 0 0 3FINLAND
13 0 5 0 8 5FRANCE
6 0 4 1 1 2GABON
188 53 54 1 56 51GAMBIA
2 0 0 0 0 0GAZA STRIP
75 26 23 6 11 15GEORGIA
34 4 13 0 3 1GERMANY
72 12 25 3 12 20GHANA
1 0 1 0 0 1GIBRALTAR
4 0 2 0 0 1GREECE
1 1 1 0 0 0GRENADA
1 0 0 0 0 0GUADELOUPE
4,978 168 1,277 624 1,208 1,158GUATEMALA
504 242 168 9 71 70GUINEA
5 2 4 0 2 1GUINEA BISSAU
66 2 44 2 11 18GUYANA
3,316 529 2,037 492 435 1,358HAITI
1 0 0 0 0 0HOLLAND
888 73 377 93 127 248HONDURAS
4 0 1 0 3 0HONG KONG
33 1 1 8 1 2HUNGARY
1 0 0 0 0 0ICELAND
1,014 272 282 34 114 168INDIA
996 195 438 40 108 158INDONESIA
242 71 43 9 54 60IRAN
487 410 47 8 27 48IRAQ
1 0 0 0 0 0IRELAND
65 16 32 1 4 13ISRAEL
20 0 6 0 5 3ITALY
Page 3 of 7 January 2011 (SYB)

NATIONALITY RECEIVED GRANTED DENIED ABANDONED WITHDRAWN OTHER
Office of Planning, Analysis, and Technology
U.S. Department of JusticeExecutive Office for Immigration Review
Immigration CourtsFY 2008 Asylum Statistics
290 92 92 8 63 46IVORY COAST (COTE D'IVOIRE)
143 3 73 2 26 25JAMAICA
10 1 3 1 8 3JAPAN
102 19 37 5 25 26JORDAN
3 5 1 1 2 4KAMPUCHEA
48 14 16 5 11 12KAZAKHSTAN
366 60 75 9 41 68KENYA
40 6 3 1 2 9KIRGHIZIA (KYRGYZSTAN)
1 1 0 0 0 0KIRIBATI
15 2 7 0 0 0KOSOVO
11 2 7 1 2 3KUWAIT
85 4 28 3 9 19LAOS
13 3 9 5 7 7LATVIA
110 20 53 13 28 27LEBANON
1 0 0 0 0 1LESOTHO
162 32 39 7 38 33LIBERIA
11 2 1 0 1 1LIBYA
37 1 13 19 13 14LITHUANIA
1 0 3 0 1 1MACAU
28 11 18 0 6 8MACEDONIA
4 2 1 0 1 2MADAGASCAR
9 0 4 0 2 5MALAWI
38 2 7 0 3 6MALAYSIA
4 4 0 0 0 0MALDIVES
280 28 63 2 49 43MALI
1 0 0 0 0 0MALTA
1 0 0 0 0 0MARTINIQUE
109 94 129 22 17 44MAURITANIA
1 0 1 0 0 0MAURITIUS
3,527 73 249 387 1,598 411MEXICO
160 16 11 5 7 21MOLDAVIA (MOLDOVA)
Page 4 of 7 January 2011 (SYB)

NATIONALITY RECEIVED GRANTED DENIED ABANDONED WITHDRAWN OTHER
Office of Planning, Analysis, and Technology
U.S. Department of JusticeExecutive Office for Immigration Review
Immigration CourtsFY 2008 Asylum Statistics
0 2 1 1 2 0MONACO
184 42 29 7 7 31MONGOLIA
0 0 1 0 0 0MONTSERRAT
39 23 21 5 12 13MOROCCO
1 0 1 0 1 1MOZAMBIQUE
1 0 1 0 1 0NAMIBIA
456 152 65 5 8 45NEPAL
9 1 2 2 1 1NETHERLANDS
6 0 0 1 0 0NEW CALEDONIA
3 0 0 0 0 0NEW ZEALAND
375 23 135 103 89 194NICARAGUA
45 8 11 2 3 10NIGER
194 28 88 5 35 35NIGERIA
15 11 2 0 2 2NIUE
4 1 1 0 0 3NO NATIONALITY
3 3 0 6 1 1NORTH KOREA
0 0 0 0 2 1NORWAY
2 1 0 0 0 0OMAN
475 142 142 19 79 101PAKISTAN
6 1 5 2 3 4PALESTINE
10 1 6 0 0 2PANAMA
0 0 1 0 0 0PAPUA NEW GUINEA
6 1 0 1 3 0PARAGUAY
0 1 1 0 0 0PEOPLE'S REPUBLIC OF BENIN
225 51 104 22 67 62PERU
221 15 31 3 42 43PHILIPPINES
46 7 11 8 24 21POLAND
10 1 4 1 4 8PORTUGAL
4 3 1 0 0 0QATAR
128 55 30 20 22 49ROMANIA
512 200 113 44 81 136RUSSIA
Page 5 of 7 January 2011 (SYB)

NATIONALITY RECEIVED GRANTED DENIED ABANDONED WITHDRAWN OTHER
Office of Planning, Analysis, and Technology
U.S. Department of JusticeExecutive Office for Immigration Review
Immigration CourtsFY 2008 Asylum Statistics
35 20 11 0 0 5RWANDA
1 0 1 0 2 0SAMOA
1 1 0 0 0 0SAN MARINO
10 5 8 0 3 1SAUDI ARABIA
128 18 40 3 16 16SENEGAL
66 24 19 1 6 9SERBIA MONTENEGRO
6 0 4 0 0 1SEYCHELLES
133 47 72 5 11 45SIERRA LEONE
7 2 0 0 2 1SINGAPORE
5 0 2 5 2 4SLOVAK REPUBLIC
3 3 0 0 0 0SLOVENIA
0 0 1 0 0 0SOLOMON ISLANDS
227 101 62 7 11 60SOMALIA
30 1 18 0 5 7SOUTH AFRICA
22 1 7 2 5 3SOUTH KOREA
330 173 58 14 37 85SOVIET UNION
10 1 4 0 2 0SPAIN
360 87 74 13 30 32SRI LANKA
1 0 0 0 0 0ST. KITTS, WEST INDIES
1 1 1 0 0 0ST. LUCIA
5 0 1 0 0 0ST. VINCENT AND THE GRENADINES
214 59 36 5 7 24STATELESS - ALIEN UNABLE TO NAME A COUNTRY
125 30 17 7 12 28SUDAN
2 0 2 1 3 5SURINAME
15 2 4 0 1 0SWEDEN
2 0 0 0 0 0SWITZERLAND
63 11 24 6 18 9SYRIA
15 0 6 0 7 4TAIWAN
19 1 3 0 2 2TAJIKISTAN (TADZHIK)
25 5 21 1 5 6TANZANIA
31 4 13 0 5 7THAILAND
Page 6 of 7 January 2011 (SYB)

NATIONALITY RECEIVED GRANTED DENIED ABANDONED WITHDRAWN OTHER
Office of Planning, Analysis, and Technology
U.S. Department of JusticeExecutive Office for Immigration Review
Immigration CourtsFY 2008 Asylum Statistics
1 0 0 0 0 0THE REPUBLIC OF THE MARSHALL ISLANDS
84 63 31 3 10 25TOGO
7 0 1 1 3 4TONGA
51 6 17 2 12 7TRINIDAD AND TOBAGO
11 1 6 0 6 4TUNISIA
85 11 17 1 9 19TURKEY
29 15 2 3 4 3TURKMENISTAN
0 0 0 0 0 1TURKS AND CAICOS ISLANDS
84 33 11 8 8 18UGANDA
191 59 60 21 33 56UKRAINE
2 0 0 0 0 1UNITED ARAB EMIRATES
37 3 11 3 5 9UNITED KINGDOM
91 5 28 0 6 17UNKNOWN NATIONALITY
13 1 5 5 3 5URUGUAY
219 67 44 12 18 54UZEBEKISTAN
1 0 0 1 0 0VANUATU
787 306 379 59 147 148VENEZUELA
106 7 45 2 16 27VIETNAM
2 0 0 0 0 1WESTERN SAHARA
35 8 28 1 9 11YEMEN
200 128 32 6 24 48YUGOSLAVIA
10 3 0 0 1 2ZAIRE
23 5 5 0 3 2ZAMBIA
201 68 40 14 24 32ZIMBABWE
47,442 10,881 13,167 3,449 7,676 11,008TOTAL
Page 7 of 7 January 2011 (SYB)

NATIONALITY RECEIVED GRANTED DENIED ABANDONED WITHDRAWN OTHER
Office of Planning, Analysis, and Technology
U.S. Department of JusticeExecutive Office for Immigration Review
Immigration CourtsFY 2007 Asylum Statistics
60 22 14 8 10 18AFGHANISTAN
564 420 245 11 61 162ALBANIA
31 6 9 3 5 12ALGERIA
0 1 0 0 1 0ANDORRA
23 7 7 1 4 4ANGOLA
3 0 0 0 0 1ANTIGUA AND BARBUDA
106 15 52 20 33 24ARGENTINA
507 179 112 18 71 106ARMENIA
0 0 1 0 0 0ARUBA
5 0 1 0 1 0AUSTRALIA
2 0 0 0 0 1AUSTRIA
35 23 11 1 4 14AZERBAIJAN
8 1 5 1 4 3BAHAMAS
5 0 6 0 0 3BAHRAIN
229 100 95 12 58 81BANGLADESH
0 0 0 0 0 1BE REMOVED FROM THE UNITED STATES
68 32 23 5 9 19BELARUS
17 4 4 0 6 5BELGIUM
17 0 3 1 1 6BELIZE
12 2 3 0 0 3BENIN
0 0 1 0 0 1BERMUDA
7 0 1 0 0 2BHUTAN
37 3 12 0 5 5BOLIVIA
50 18 14 0 6 12BOSNIA-HERZEGOVINA
0 1 1 0 0 0BOTSWANA
250 33 85 36 44 44BRAZIL
1 0 1 0 0 0BRITISH INDIAN OCEAN TERRITORY
177 67 40 12 19 54BULGARIA
108 20 20 0 6 11BURKINA FASO
184 129 40 8 8 25BURMA (MYANMAR)
47 13 20 2 2 11BURUNDI
Page 1 of 7 January 2011 (SYB)

NATIONALITY RECEIVED GRANTED DENIED ABANDONED WITHDRAWN OTHER
Office of Planning, Analysis, and Technology
U.S. Department of JusticeExecutive Office for Immigration Review
Immigration CourtsFY 2007 Asylum Statistics
85 44 14 8 12 22BYELORUSSIA (BELARUS)
56 13 33 4 17 23CAMBODIA
424 205 135 9 35 83CAMEROON
38 9 7 2 4 12CANADA
6 0 1 1 1 2CAPE VERDE
0 1 0 0 0 0CAYMAN ISLANDS
22 13 10 2 1 5CENTRAL AFRICAN REPUBLIC
45 21 8 2 3 8CHAD
29 1 1 6 3 4CHILE
8,665 4,552 1,663 153 306 1,324CHINA
1,718 683 1,240 173 601 682COLOMBIA
3 0 2 0 0 0COMORO ISLANDS
138 73 40 7 19 37CONGO
23 5 3 3 2 8COSTA RICA
8 2 7 0 6 4CROATIA
449 26 79 29 138 357CUBA
1 0 0 0 0 0CYPRUS
18 0 0 11 2 3CZECH REPUBLIC
18 2 8 7 2 17CZECHOSLOVAKIA
45 23 13 5 9 6DEMOCRATIC REPUBLIC OF CONGO
4 0 0 0 1 0DENMARK
5 1 2 0 0 0DJIBOUTI
3 0 2 0 0 1DOMINICA
60 5 24 6 23 28DOMINICAN REPUBLIC
148 10 39 12 32 39ECUADOR
419 234 67 14 50 90EGYPT
10,025 139 1,610 538 965 2,900EL SALVADOR
2 0 0 0 0 0EQUATORIAL GUINEA
202 120 28 3 8 36ERITREA
21 13 18 5 7 15ESTONIA
684 352 145 16 48 85ETHIOPIA
Page 2 of 7 January 2011 (SYB)

NATIONALITY RECEIVED GRANTED DENIED ABANDONED WITHDRAWN OTHER
Office of Planning, Analysis, and Technology
U.S. Department of JusticeExecutive Office for Immigration Review
Immigration CourtsFY 2007 Asylum Statistics
1 0 0 0 0 0FEDERATED STATES OF MICRONESA
96 24 23 3 33 33FIJI
16 2 0 2 3 1FINLAND
22 3 8 0 3 2FRANCE
5 4 5 1 0 0GABON
316 59 53 9 65 80GAMBIA
0 0 1 0 0 0GAZA STRIP
80 27 36 11 12 35GEORGIA
25 4 13 2 5 5GERMANY
72 8 21 5 12 18GHANA
1 0 0 0 0 0GIBRALTAR
14 12 4 1 1 1GREECE
3 0 0 0 1 0GRENADA
0 0 0 0 0 1GUADELOUPE
8,473 136 1,244 788 977 1,380GUATEMALA
651 325 158 23 58 83GUINEA
9 3 1 0 0 5GUINEA BISSAU
99 15 40 2 12 29GUYANA
4,483 586 2,360 565 355 2,366HAITI
1,134 86 465 88 161 251HONDURAS
6 2 0 1 0 1HONG KONG
16 0 1 1 4 13HUNGARY
942 359 374 70 130 256INDIA
1,181 211 571 53 172 197INDONESIA
244 108 70 14 44 59IRAN
521 279 61 10 20 85IRAQ
1 0 1 1 0 1IRELAND
79 18 17 6 9 18ISRAEL
24 0 8 0 6 4ITALY
403 135 99 17 59 64IVORY COAST (COTE D'IVOIRE)
115 4 46 6 34 45JAMAICA
Page 3 of 7 January 2011 (SYB)

NATIONALITY RECEIVED GRANTED DENIED ABANDONED WITHDRAWN OTHER
Office of Planning, Analysis, and Technology
U.S. Department of JusticeExecutive Office for Immigration Review
Immigration CourtsFY 2007 Asylum Statistics
11 2 4 0 2 7JAPAN
100 16 40 6 28 22JORDAN
4 0 0 0 3 1KAMPUCHEA
53 31 9 1 4 20KAZAKHSTAN
258 51 82 10 45 71KENYA
22 7 1 1 8 12KIRGHIZIA (KYRGYZSTAN)
0 0 0 0 1 0KIRIBATI
8 3 0 0 0 0KOSOVO
18 3 7 1 2 2KUWAIT
68 6 22 6 26 32LAOS
20 6 7 1 5 13LATVIA
157 29 48 5 27 49LEBANON
2 0 2 0 0 1LESOTHO
190 53 60 26 47 55LIBERIA
4 2 4 0 0 1LIBYA
66 4 13 14 12 54LITHUANIA
5 0 0 0 0 0MACAU
50 27 17 3 8 10MACEDONIA
4 4 3 0 0 1MADAGASCAR
11 3 3 0 4 5MALAWI
28 4 13 1 2 4MALAYSIA
353 60 47 2 38 49MALI
1 0 0 0 0 2MALTA
208 174 154 67 27 99MAURITANIA
2 0 1 1 0 0MAURITIUS
3,080 49 288 252 2,164 488MEXICO
62 7 12 6 1 7MOLDAVIA (MOLDOVA)
10 3 0 0 0 2MONACO
132 49 49 1 4 17MONGOLIA
2 0 0 0 0 1MONTENEGRO
1 0 0 0 0 0MONTSERRAT
Page 4 of 7 January 2011 (SYB)

NATIONALITY RECEIVED GRANTED DENIED ABANDONED WITHDRAWN OTHER
Office of Planning, Analysis, and Technology
U.S. Department of JusticeExecutive Office for Immigration Review
Immigration CourtsFY 2007 Asylum Statistics
54 4 5 2 11 10MOROCCO
2 1 0 0 0 0MOZAMBIQUE
7 0 0 0 1 0NAMIBIA
372 131 82 9 17 47NEPAL
6 2 4 0 0 2NETHERLANDS
766 23 164 350 66 1,103NICARAGUA
48 10 7 1 8 6NIGER
197 39 63 7 35 67NIGERIA
21 1 2 0 0 2NIUE
3 0 0 0 0 0NO NATIONALITY
10 2 0 0 1 2NORTH KOREA
3 0 0 0 1 0NORWAY
1 2 0 0 0 1OMAN
452 140 167 22 122 144PAKISTAN
17 3 7 0 0 1PALESTINE
14 1 6 3 2 4PANAMA
1 0 0 0 0 0PAPUA NEW GUINEA
2 0 3 0 5 2PARAGUAY
3 0 0 0 0 0PEOPLE'S REPUBLIC OF BENIN
304 54 144 30 67 74PERU
191 9 63 3 59 60PHILIPPINES
0 1 0 0 0 0PITCAIRN ISLANDS
71 7 13 13 39 67POLAND
14 0 4 1 3 7PORTUGAL
1 1 5 0 0 0QATAR
231 31 39 27 28 161ROMANIA
590 209 132 48 77 208RUSSIA
44 22 7 6 6 8RWANDA
2 0 1 0 0 0SAMOA
17 5 6 0 10 7SAUDI ARABIA
124 30 38 3 16 21SENEGAL
Page 5 of 7 January 2011 (SYB)
NATIONALITY RECEIVED GRANTED DENIED ABANDONED WITHDRAWN OTHER
Office of Planning, Analysis, and Technology
U.S. Department of JusticeExecutive Office for Immigration Review
Immigration CourtsFY 2007 Asylum Statistics
91 27 19 3 4 5SERBIA MONTENEGRO
5 1 0 0 1 1SEYCHELLES
194 48 65 7 19 66SIERRA LEONE
7 1 1 1 1 0SINGAPORE
17 2 5 4 5 11SLOVAK REPUBLIC
9 0 1 0 2 5SLOVENIA
3 0 1 0 0 1SOLOMON ISLANDS
241 109 53 19 16 64SOMALIA
32 8 15 3 0 11SOUTH AFRICA
37 1 5 3 3 7SOUTH KOREA
479 191 62 39 29 118SOVIET UNION
6 0 1 0 4 7SPAIN
237 89 51 5 14 39SRI LANKA
1 0 1 0 0 1ST. KITTS, WEST INDIES
5 0 1 1 0 0ST. LUCIA
0 0 1 0 0 0ST. VINCENT AND THE GRENADINES
178 79 34 3 6 30STATELESS - ALIEN UNABLE TO NAME A COUNTRY
82 19 20 0 9 34SUDAN
9 1 3 3 4 4SURINAME
10 0 7 1 0 5SWEDEN
0 4 0 0 0 0SWITZERLAND
75 23 33 3 16 22SYRIA
5 1 0 0 0 0TAIWAN
13 5 2 2 1 4TAJIKISTAN (TADZHIK)
40 16 16 2 9 12TANZANIA
34 3 7 1 4 11THAILAND
106 82 49 4 21 36TOGO
15 0 2 0 2 1TONGA
44 1 15 2 5 18TRINIDAD AND TOBAGO
11 1 9 1 7 3TUNISIA
65 23 15 0 5 15TURKEY
Page 6 of 7 January 2011 (SYB)

NATIONALITY RECEIVED GRANTED DENIED ABANDONED WITHDRAWN OTHER
Office of Planning, Analysis, and Technology
U.S. Department of JusticeExecutive Office for Immigration Review
Immigration CourtsFY 2007 Asylum Statistics
23 12 16 1 5 4TURKMENISTAN
65 50 23 7 8 20UGANDA
241 40 49 15 29 93UKRAINE
2 0 0 0 0 3UNITED ARAB EMIRATES
23 3 4 1 7 6UNITED KINGDOM
36 2 11 2 5 5UNKNOWN NATIONALITY
28 0 13 7 5 13URUGUAY
207 74 56 15 33 63UZEBEKISTAN
812 317 463 34 171 275VENEZUELA
98 10 32 1 23 38VIETNAM
48 8 28 6 10 11YEMEN
245 125 58 11 34 52YUGOSLAVIA
12 5 4 1 0 1ZAIRE
15 7 8 2 4 12ZAMBIA
162 97 62 12 23 31ZIMBABWE
57,515 12,859 14,874 3,985 8,405 15,639TOTAL
Page 7 of 7 January 2011 (SYB)

NATIONALITY RECEIVED GRANTED DENIED ABANDONED WITHDRAWN OTHER
Office of Planning, Analysis, and Technology
U.S. Department of JusticeExecutive Office for Immigration Review
Immigration CourtsFY 2006 Asylum Statistics
61 25 10 2 10 14AFGHANISTAN
790 497 392 27 90 194ALBANIA
21 13 22 3 7 11ALGERIA
1 2 0 0 0 0ANDORRA
21 16 19 0 1 6ANGOLA
0 0 0 0 0 1ANGUILLA
0 0 0 0 0 1ANTIGUA AND BARBUDA
110 9 112 7 45 51ARGENTINA
534 289 161 55 79 154ARMENIA
2 0 0 0 0 0ARUBA
5 0 0 0 1 1AUSTRALIA
13 0 0 1 1 1AUSTRIA
34 27 15 3 2 17AZERBAIJAN
9 0 4 0 1 4BAHAMAS
9 0 8 1 4 0BAHRAIN
305 113 84 23 71 99BANGLADESH
3 1 2 1 1 1BARBADOS
1 0 0 0 0 0BE REMOVED FROM THE UNITED STATES
96 54 26 8 11 35BELARUS
32 5 2 0 4 10BELGIUM
14 1 3 3 6 7BELIZE
7 1 3 0 0 4BENIN
0 0 0 0 0 1BERMUDA
0 1 0 0 0 0BHUTAN
24 2 3 3 6 6BOLIVIA
45 7 17 1 6 13BOSNIA-HERZEGOVINA
1 0 0 0 0 0BOTSWANA
211 33 94 27 46 54BRAZIL
0 0 3 0 0 0BRITISH INDIAN OCEAN TERRITORY
1 0 0 0 0 2BRITISH VIRGIN ISLANDS
159 72 40 10 14 44BULGARIA
Page 1 of 7 January 2011 (SYB)

NATIONALITY RECEIVED GRANTED DENIED ABANDONED WITHDRAWN OTHER
Office of Planning, Analysis, and Technology
U.S. Department of JusticeExecutive Office for Immigration Review
Immigration CourtsFY 2006 Asylum Statistics
56 13 8 1 9 15BURKINA FASO
237 157 44 7 15 47BURMA (MYANMAR)
38 13 10 2 0 8BURUNDI
93 52 21 4 8 30BYELORUSSIA (BELARUS)
50 9 49 3 10 14CAMBODIA
462 357 167 15 31 139CAMEROON
43 9 3 1 3 7CANADA
4 0 1 0 3 3CAPE VERDE
1 0 0 0 0 0CAYMAN ISLANDS
30 10 21 1 5 12CENTRAL AFRICAN REPUBLIC
63 16 7 1 4 7CHAD
15 2 6 2 1 7CHILE
9,130 4,048 2,115 229 287 1,565CHINA
2,119 782 1,646 288 687 951COLOMBIA
127 89 46 6 16 52CONGO
17 1 3 0 3 11COSTA RICA
4 1 3 0 2 4CROATIA
597 26 79 47 203 287CUBA
1 1 0 0 0 0CYPRUS
19 2 4 1 1 8CZECH REPUBLIC
37 2 5 3 7 18CZECHOSLOVAKIA
50 24 26 7 10 16DEMOCRATIC REPUBLIC OF CONGO
11 6 1 0 1 0DJIBOUTI
3 0 2 1 1 0DOMINICA
72 1 19 0 27 26DOMINICAN REPUBLIC
1 0 0 0 0 1EAST GERMANY
121 11 29 9 31 29ECUADOR
430 239 63 16 58 75EGYPT
8,073 95 1,006 464 610 1,860EL SALVADOR
9 1 0 0 0 0EQUATORIAL GUINEA
227 96 29 2 6 78ERITREA
Page 2 of 7 January 2011 (SYB)

NATIONALITY RECEIVED GRANTED DENIED ABANDONED WITHDRAWN OTHER
Office of Planning, Analysis, and Technology
U.S. Department of JusticeExecutive Office for Immigration Review
Immigration CourtsFY 2006 Asylum Statistics
38 3 5 5 8 8ESTONIA
735 345 167 6 53 96ETHIOPIA
0 0 1 0 0 0FEDERATED STATES OF MICRONESA
85 45 51 6 45 46FIJI
0 1 0 0 1 0FINLAND
13 2 8 0 12 3FRANCE
11 5 1 0 0 4GABON
259 46 34 3 65 74GAMBIA
1 0 0 0 1 0GAZA STRIP
91 59 46 6 21 28GEORGIA
39 9 3 0 3 1GERMANY
64 6 23 4 7 18GHANA
1 1 1 0 0 0GIBRALTAR
9 3 1 1 1 1GREECE
2 0 0 0 2 1GRENADA
5,326 161 886 555 615 1,014GUATEMALA
552 356 203 33 54 75GUINEA
7 2 4 0 2 3GUINEA BISSAU
133 16 77 11 38 37GUYANA
6,059 569 2,520 576 355 1,325HAITI
1,349 65 422 68 133 195HONDURAS
1 0 2 0 0 1HONG KONG
13 2 3 0 1 7HUNGARY
1,044 450 457 60 153 278INDIA
929 314 1,088 78 332 295INDONESIA
349 117 85 17 63 95IRAN
394 192 126 6 24 59IRAQ
2 0 0 0 0 0IRELAND
61 25 22 2 14 31ISRAEL
16 2 9 0 7 1ITALY
313 159 81 8 34 58IVORY COAST (COTE D'IVOIRE)
Page 3 of 7 January 2011 (SYB)

NATIONALITY RECEIVED GRANTED DENIED ABANDONED WITHDRAWN OTHER
Office of Planning, Analysis, and Technology
U.S. Department of JusticeExecutive Office for Immigration Review
Immigration CourtsFY 2006 Asylum Statistics
127 3 45 5 34 48JAMAICA
5 3 5 0 7 8JAPAN
103 27 45 1 30 38JORDAN
2 11 9 1 7 7KAMPUCHEA
65 25 14 3 10 12KAZAKHSTAN
253 60 120 15 36 78KENYA
28 20 9 2 2 9KIRGHIZIA (KYRGYZSTAN)
1 0 0 0 0 1KIRIBATI
7 4 2 0 1 1KOSOVO
20 4 7 0 5 5KUWAIT
75 11 37 0 29 27LAOS
32 12 8 3 8 9LATVIA
107 26 48 4 49 58LEBANON
1 0 0 1 2 0LESOTHO
216 59 65 14 33 97LIBERIA
6 1 4 1 0 0LIBYA
93 18 19 10 10 34LITHUANIA
2 0 2 0 0 0MACAU
42 20 22 1 8 15MACEDONIA
8 1 1 0 2 3MADAGASCAR
13 0 0 0 0 3MALAWI
21 4 8 0 7 2MALAYSIA
252 62 37 6 32 38MALI
3 1 0 0 0 1MALTA
361 219 194 49 34 186MAURITANIA
0 0 1 0 0 2MAURITIUS
2,818 49 296 155 4,158 619MEXICO
40 2 8 0 7 16MOLDAVIA (MOLDOVA)
2 0 0 0 0 0MONACO
137 39 31 4 4 19MONGOLIA
35 8 23 3 7 10MOROCCO
Page 4 of 7 January 2011 (SYB)

NATIONALITY RECEIVED GRANTED DENIED ABANDONED WITHDRAWN OTHER
Office of Planning, Analysis, and Technology
U.S. Department of JusticeExecutive Office for Immigration Review
Immigration CourtsFY 2006 Asylum Statistics
1 0 0 0 1 0MOZAMBIQUE
0 0 2 0 0 0NAMIBIA
316 165 70 8 19 46NEPAL
13 0 0 0 2 1NETHERLANDS
0 0 0 1 0 1NEW CALEDONIA
0 0 0 0 1 0NEW ZEALAND
2,087 15 120 361 57 622NICARAGUA
33 10 24 3 8 15NIGER
219 30 90 3 43 58NIGERIA
5 0 2 0 0 1NIUE
1 0 0 0 0 0NO NATIONALITY
1 0 0 0 0 0NORFOLK ISLAND
14 6 0 0 0 0NORTH KOREA
8 0 0 0 1 0OMAN
587 178 251 17 168 184PAKISTAN
8 0 7 4 1 2PALESTINE
13 7 4 1 3 4PANAMA
0 0 0 1 0 0PAPUA NEW GUINEA
21 2 5 1 0 5PARAGUAY
342 88 141 20 78 99PERU
182 17 68 8 102 61PHILIPPINES
1 0 0 0 0 0PITCAIRN ISLANDS
238 4 23 68 45 122POLAND
16 5 2 5 7 13PORTUGAL
0 0 2 0 1 1QATAR
255 43 34 13 30 45ROMANIA
560 203 133 46 83 186RUSSIA
46 24 9 1 2 5RWANDA
2 0 0 0 0 0SAMOA
2 0 2 0 0 0SAN MARINO
36 13 3 0 2 8SAUDI ARABIA
Page 5 of 7 January 2011 (SYB)

NATIONALITY RECEIVED GRANTED DENIED ABANDONED WITHDRAWN OTHER
Office of Planning, Analysis, and Technology
U.S. Department of JusticeExecutive Office for Immigration Review
Immigration CourtsFY 2006 Asylum Statistics
98 15 43 9 10 16SENEGAL
59 21 14 4 4 12SERBIA MONTENEGRO
6 1 3 0 0 4SEYCHELLES
200 79 107 17 27 103SIERRA LEONE
4 2 3 0 0 4SINGAPORE
38 1 2 3 2 17SLOVAK REPUBLIC
1 1 3 0 0 1SLOVENIA
271 116 63 54 18 102SOMALIA
29 20 15 5 15 17SOUTH AFRICA
51 1 5 1 7 8SOUTH KOREA
463 188 65 41 37 113SOVIET UNION
9 0 8 0 1 2SPAIN
209 85 47 15 35 32SRI LANKA
0 1 0 0 0 0ST. CHRISTOPHER-NEVIS
2 0 1 0 0 0ST. KITTS, WEST INDIES
1 0 1 0 1 0ST. LUCIA
2 0 0 0 1 1ST. VINCENT AND THE GRENADINES
112 86 26 8 9 33STATELESS - ALIEN UNABLE TO NAME A COUNTRY
97 45 28 3 15 37SUDAN
14 2 1 0 2 4SURINAME
0 0 1 0 0 1SWAZILAND
11 0 0 0 1 2SWEDEN
5 0 0 0 1 0SWITZERLAND
81 20 33 3 16 15SYRIA
10 2 2 0 1 1TAIWAN
7 4 2 0 1 1TAJIKISTAN (TADZHIK)
38 17 15 2 6 11TANZANIA
35 0 6 1 15 3THAILAND
1 0 0 0 0 0THE REPUBLIC OF PALAU
200 145 76 12 24 73TOGO
14 0 1 1 2 1TONGA
Page 6 of 7 January 2011 (SYB)

NATIONALITY RECEIVED GRANTED DENIED ABANDONED WITHDRAWN OTHER
Office of Planning, Analysis, and Technology
U.S. Department of JusticeExecutive Office for Immigration Review
Immigration CourtsFY 2006 Asylum Statistics
52 3 8 3 11 19TRINIDAD AND TOBAGO
26 0 8 1 8 8TUNISIA
68 34 26 3 24 20TURKEY
48 23 9 2 3 11TURKMENISTAN
0 0 1 0 0 0TURKS AND CAICOS ISLANDS
74 36 32 1 11 33UGANDA
265 45 98 29 35 72UKRAINE
3 6 0 1 1 0UNITED ARAB EMIRATES
21 2 8 0 7 17UNITED KINGDOM
12 1 1 0 0 0UNKNOWN NATIONALITY
16 0 15 2 1 10URUGUAY
240 95 62 17 28 50UZEBEKISTAN
1,039 279 585 68 158 219VENEZUELA
106 10 45 3 28 28VIETNAM
61 10 29 3 23 27YEMEN
198 154 83 11 29 64YUGOSLAVIA
13 5 11 1 3 4ZAIRE
32 8 4 6 3 16ZAMBIA
200 56 70 19 35 49ZIMBABWE
56,969 13,304 16,477 3,918 10,324 13,841TOTAL
Page 7 of 7 January 2011 (SYB)