fxpb
DESCRIPTION
Forex trading system that work really well.TRANSCRIPT

Copyright 2010 All Rights Reserved
http://www.forexprofitsbanker.com

P a g e | 2
CONTENTS
DISCLAIMER
1. INTRODUCTION TO THE FOREX MARKET 1.1. Forex Basics
1.2. The Structure Of Forex Market
2. THE LOGISTICS OF FOREX TRADING 2.1. How to Make Money Trading Forex
2.2. How PL Calculated
2.3. Orders Type
2.4. Forex Lingo
3. MAJOR CURRENCIES 3.1. United States Dollar
3.2. Euro
3.3. Japanese Yen
3.4. Great Britain Pound
3.5. Swiss Franc
3.6. Commodity Currencies
4. TECHNICAL ANALYSIS 4.1. Introduction
4.2. Japanese Candlestick
4.3. Support And Resistance
4.4. Trend Lines
4.5. Channels
4.6. Common Chart Indicators
4.7. Multiple Timeframe
5. FUNDAMENTAL ANALYSIS

P a g e | 3
5.1. Introduction
5.2. Monetary Policy and Fiscal Policy
5.3. Balance Of Payment
5.4. Economic Releases
5.5. Interest Rates
6. MONEY MANAGEMENT 6.1. Introduction
6.2. Learn To Protect Capital First
6.3. Setting Profit Expectation
6.4. Position Sizing
7. TRADING SYSTEM 7.1. Trading System I: The Methodology
7.2. Trading System I: The Method
7.3. Trading System I: Trade Example
7.4. Money Management
7.5. Trading System II: The Methodology
7.6. Trading System II: The Method
7.7. Trading System II: Trade Example
8. COMMON MISTAKES 8.1. Psychology of Trading
8.2. Common Mistakes
9. PUTTING IT ALL TOGETHER 9.1. Creating A Business Plan
9.2. Maintaining A Trading Journal
FINAL THOUGHT

P a g e | 4
DISCLAIMER
The information provided in this eBook are based upon past market results. Because the market is constantly
changing, the method presented in this eBook may change, cease or expand with time. We hope that the skills
and knowledge acquired from this manual will provide you with the ability to adapt to inevitable market
evolution. However, we cannot be held responsible for changes that may affect the results of this method.
Screenshots in this eBook were taken from past market price movements. All product names, logos and
artwork are copyrights of their respective owners. None of the owners have sponsored or endorsed this
publication.
While all attempts have been made to verify information provided, the author assumes no responsibility for
errors, omissions, or contrary interpretation of the subject matter herein. Any perceived slights of peoples or
organizations are unintentional. The purchaser or reader of this publication assumes responsibility for the use
of these materials and information. No guarantees of income are made. The author reserves the right to make
changes and assumes no responsibility or liability whatsoever on behalf of any purchaser or reader of these
materials.
It should not be assumed that the methods, techniques, or indicators presented will be profitable or that they
will not result in losses. Past results of any individual trader or trading systems published are not indicative of
future returns by that trader or system, and are not indicative of future returns which be realized by you. In
addition, the indicators, strategies and all other features of Me (collectively, the "Information") are provided for
informational and educational purposes only and should not be construed as investment advice. Examples
presented are for educational purposes only. Such set-ups are not solicitations of any order to buy or sell.
Accordingly, you should not rely solely on the Information in making any investment. Rather, you should use
the Information only as a starting point for doing additional independent research in order to allow you to
form your own opinion regarding investments. You should always check with your licensed financial advisor
and tax advisor to determine the suitability of any investment.
MY TRADING STRATEGY 2 DAY TRADING SYSTEM
This eBook is electronically distributed and each copy is secured with digital signed certificate
All rights reserved. No part of this document shall be reproduced, stored in a retrieval system or transmitted by
any means, which includes but is not limited to any electronic means, mechanical, photocopying, recording,
scanning or otherwise without written permission from forexprofitsbanker.com

P a g e | 5
CHAPTER 1
INTRODUCTION TO THE
FOREX MARKET
"Give a man a fish and he will eat for the day. Teach a man to fish and he will eat for a lifetime." Chinese Proverb

P a g e | 6
1.1 FOREX BASICS
What is FOREX?
The (FX) Foreign Exchange market is the world largest financial market, with a volume of above $4 trillion a
day. Forex trading consists of buying of one currency and simultaneous selling of other. The volume and
liquidity provided by the Forex market surpasses aggregated trading volume of all worlds’ stock markets
including $25 billion a day volume that New York Stock Exchange trades, this manifest how enormous the
Foreign Exchange really is.
What is traded on the Foreign Exchange market?
Forex trading consists simultaneous buying of one currency and the selling of other. In Forex trading traders
open an account with a FX broker or dealer which facilitates the buying and selling of Currencies, and they
traded in pairs; for instance the Euro and the US dollar (EUR/USD) or the Great Britain Pound and the US
Dollar (GBP/USD).
Assume that buy of a currency as purchasing a share in that respective country. For instance, when we buy
Great Britain Pound we are in effect purchasing a share in the Britain economy. The value of currency is an
undeviating reflection of what the market believes about the present and upcoming health of the economy.
Which Currencies Are Traded?
Some of the most admired currencies which are of mainly developed economies are listed below with their
symbols:
Symbol Country Currency Nickname
USD United States Dollar Buck
EUR Euro members Euro Fiber
JPY Japan Yen Yen
GBP Great Britain Pound Cable
CHF Switzerland Franc Swissy
CAD Canada Dollar Loonie
AUD Australia Dollar Aussie
NZD New Zealand Dollar Kiwi

P a g e | 7
When Can Currencies Be Traded?
The spot FX market is truly dissimilar from all the financial markets around the globe. Different financial
centre, banks, individuals and institutions exchange currencies 24 hours a day excluding slight gaps on the
weekends.
Time Zone New York GMT
Tokyo Open 7:00 pm 0:00
Tokyo Close 4:00 am 9:00
London Open 3:00 am 8:00
London Close 12:00 pm 17:00
New York Open 8:00 am 13:00
New York Close 5:00 pm 22:00

P a g e | 8
1.2 THE STRUCTURE OF FOREX MARKET
Exchange Rates
Generally, exchange rate of currencies are determined by the health of that’s country’s economy in association
to the other countries’ economies.
FX Spot market does not have a physical location neither a central exchange. It is considered an Over The
Counter (OTC) or Interbank market, because the trades are executed electronically, within a network of banks,
constantly over a 24-hour period which is not the case in other financial markets including the New York Stock
Exchange.
Numerous firms enable traders like us ‘retail trader’ to trade Forex market. The pre-requisites of Forex trading
are trivial and only require a computer, a high-speed Internet connection, and the information contained
within this eBook.
The Forex market (OTC)
In the OTC market orders are cleared or processed on a central exchange but are routed between different
participant who they want to trade with depending on the attractiveness of quotes, trading conditions and
reputation of the trading counterpart.
The United States dollar is the most actively traded currency, with a share of 89% of all transactions. Whereas,
Euro is the second most actively traded currency at around 37% and Japanese Yen at 20%.
Why Trade Foreign Currencies?
There are numerous benefits and advantages of trading Forex. Follow are just a list of few pros of trading Forex
and are paramount reason why so many people are choosing this market.
No commissions. There are no fees included with trades made on Forex exchange including any of the
following clearing fees, exchange fees, government fees, and brokerage fees. However Brokers are remunerated
for their services through bid-ask spread which we will discuss later.
No middlemen. Spot Forex trading is an OTC market which eliminates the need for middlemen and allows you
to trade directly with the market responsible for the pricing on a particular currency pair.
No fixed lot size. Spot Forex offers very flexible contract or lots size. You can determine your own contract size
and can start trading with a minimum of $250 and in some cases with even less.
Low transaction costs. The transaction cost which is the bid/ask spread is trivial and is typically under 0.1
percent. Larger dealer offers even more attractive transaction cost. However the spread vary from currency
pairs, brokers and market conditions.

P a g e | 9
A 24-hour market. Forex market is open 24 hours with different financial centre, banks, individuals and
institutions exchanging currencies 24 hours a day excluding slight gaps on the weekends. Forex enables you to
choose when you want to trade, either in morning, noon or night.
No one can corner the market. Unlike stock exchange and other financial market foreign exchange market
has great volume with innumerous participants and there is no single entity including the center banks of
developed countries that can control the market price for a elongated period.
Leverage. A small amount could be set as margin to control larger contract value. Leverage provides trader
the ability to maximize their gains, and at the same time maintain risk capital to a lowest amount. For instance,
a broker that offers 400:1 leverage means that $50 margin funds would enable a trader’s control full standard
lot that is to buy or sell $100,000 worth of currencies.
High Liquidity. Forex market is enormous and extremely liquid financial market. Your order is
instantaneously executed with only a simple click of the mouse under normal market conditions.
Free “Demo” Accounts, News, Charts, and Analysis. Most online Forex brokers offer tons of value added
services including 'demo' accounts to practice trading as well as real-time market new along with breaking
Forex news and charting services.
“Mini” and “Micro” Trading: Online Forex brokers offer "mini" and “micro” lot sizes or trading accounts.
Accounts can be opened instantly with a minimum deposit of $200 or even less.

P a g e | 10
CHAPTER 2
THE LOGISTICS OF FOREX
TRADING
"Continuous effort, not strength or intelligence, is the key to unlocking our potential." Liane Cordes
P a g e | 11
2.1 HOW TO MAKE MONEY TRADING FOREX
Forex trading consists of simultaneously buying and selling of currencies. It is very simple process to place a
trade in Forex market. The logistics and mechanics of Forex trading is very similar to other market (like stock
market), therefore if you have prior experience in trading then this should be very simple for you to
understand.
Forex trading revolves around exchange of one currency for another. So if you anticipate that the value of one
currency might increase so you buy that currency and sell the other.
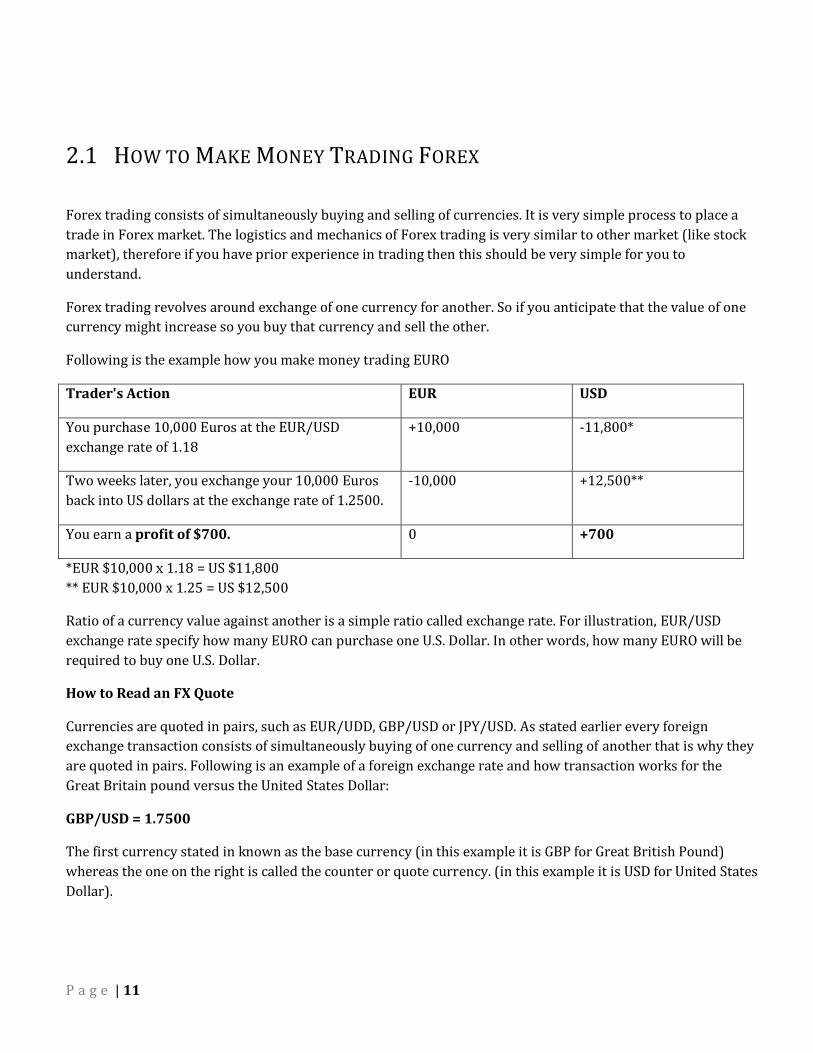
Following is the example how you make money trading EURO
Trader's Action EUR USD
You purchase 10,000 Euros at the EUR/USD
exchange rate of 1.18
+10,000 -11,800*
Two weeks later, you exchange your 10,000 Euros
back into US dollars at the exchange rate of 1.2500.
-10,000 +12,500**
You earn a profit of $700. 0 +700
*EUR $10,000 x 1.18 = US $11,800
** EUR $10,000 x 1.25 = US $12,500
Ratio of a currency value against another is a simple ratio called exchange rate. For illustration, EUR/USD
exchange rate specify how many EURO can purchase one U.S. Dollar. In other words, how many EURO will be
required to buy one U.S. Dollar.
How to Read an FX Quote
Currencies are quoted in pairs, such as EUR/UDD, GBP/USD or JPY/USD. As stated earlier every foreign
exchange transaction consists of simultaneously buying of one currency and selling of another that is why they
are quoted in pairs. Following is an example of a foreign exchange rate and how transaction works for the
Great Britain pound versus the United States Dollar:
GBP/USD = 1.7500
The first currency stated in known as the base currency (in this example it is GBP for Great British Pound)
whereas the one on the right is called the counter or quote currency. (in this example it is USD for United States
Dollar).

P a g e | 12
The exchange rate denotes how many in terms of units of the quote currency should be paid to purchase one
unit of the base currency. For this example and the rate shown you would have to pay exactly 1.7500 United
Stated Dollar to buy 1 GBP.
Where as in case of selling the exchange rate denote how many in terms of unit of the quote currency you will
get for selling out the base currency. So in this example if you sell 1 GBP you will get 1.7500 USD.
As it name implies the base currency is the “Basis” of the transaction buy or sell. This simply means that you
buy the base currency and concurrently sell the quote currency.
If you anticipate that the base currencies will strength against the counter currency you will open a buy trade.
In opposite manner you will place a sell trade if you believe that the base currency will weaken against the
quote currency.

P a g e | 13
2.2 HOW P/L CALCULATED
This topic will cover trivial mathematics to help you calculate profits and losses. You will also learn what is pip
and lots.
What is a Pip?
Pip is the most common unit and the smallest possible increment in the value of currency pair. If the value of
EUR/USD changes from 1.2250 to 1.2251, this means a 1 pip appreciation in the value of EUR/USD. The last
decimal place of a quotation is called pip. It also helps to indentify your profits or loss.
Each currency has its own value, which makes it is mandatory to compute the value of a pip for that particular
currency. In currencies pairs where the USD (United States Dollar) is the base currency (or quoted first) the
calculation would be as follows.
Let’s assume USD/JPY current rate is at 119.80 (note USD/JPY currency pair only have two decimal places,
whereas most of the other pairs have four decimal places)
In the case of USD/JPY, 1 pip would represent 00.01
Therefore,
USD/JPY:
119.80
.01 divided by exchange rate = pip value
.01 / 119.80 = 0.0000834
This looks like a very long number but later we will discuss lot size.
USD/CHF:
1.5250
.0001 divided by exchange rate = pip value
.0001 / 1.5250 = 0.0000655
USD/CAD:
1.4890
.0001 divided by exchange rate = pip value
.0001 / 1.4890 = 0.00006715
In the case where the US Dollar is not quoted first and we want to get the US Dollar value, we have to add one
more step.

P a g e | 14
EUR/USD:
1.2200
.0001 divided by exchange rate = pip value
so
.0001 / 1.2200 = EUR 0.00008196
but we need to get back to US dollars so we add another calculation which is
EUR x Exchange rate
So
0.00008196 x 1.2200 = 0.00009999
When rounded up it would be 0.0001
GBP/USD:
1.7975
.0001 divided by exchange rate = pip value
So
.0001 / 1.7975 = GBP 0.0000556
But we need to get back to US dollars so we add another calculation which is
GBP x Exchange rate
So
0.0000556 x 1.7975 = 0.0000998
When rounded up it would be 0.0001
You might be bit overwhelmed but this is put to only explain how to calculate pip value. Almost all brokers will
do all this tedious calculation automatically. However it is good to know how it works.
In the next section, we will discuss how these seemingly insignificant amounts can add up.
What is Lot?
Spot Forex transaction is in lots. Lots are the number of unit of base currency that you buy or sell. The standard
lot size is 100,000; the mini lot size is 10,000 whereas micro lot size is 1,000. As previously explained the
smallest increment of that currency that could be measure is known as Pip. Forex trader trade large amounts of
any picky currency so that the smallest increment could produce significant profit or loss.

P a g e | 15
Let’s suppose we will be trading standard 100,000 lot size. We will now recalculate some of the above example
to check how it influences the pip value.
USD/JPY at an exchange rate of 119.90
(.01 / 119.80) x $100,000 = $8.34 per pip
USD/CHF at an exchange rate of 1.4555
(.0001 / 1.4555) x $100,000 = $6.87 per pip
In cases where the United States Dollar is not base currency (quoted first), the formula will be is slightly
different.
EUR/USD at an exchange rate of 1.1930
(.0001 / 1.1930) X EUR 100,000 = EUR 8.38 x 1.1930 = $9.99734 rounded up will be $10 per pip
GBP/USD at an exchange rate or 1.8040
(.0001 / 1.8040) x GBP 100,000 = 5.54 x 1.8040 = 9.99416 rounded up will be $10 per pip.
How to calculate Profit And Losses?
Let take an example in which we buy United Stated Dollar (USD) and Sell Swiss Francs (CHF).
The rate of the pair will quoted like 1.4525 / 1.4530. As we will be buying United States dollar we will be
working on the 1.4530 which in fact is the rate at which other traders are prepared to sell.
Let say, you buy 1 standard of 100,000 lot size at 1.4530.
After some time the price moves from 1.4530 to 1.4550 and then you decide to close the trade.
Therefore the new quote for the USD/CHF will be 1.4550 / 1.455. As now you are closing the trade which
means you will now sell in order to close the trade therefore you will take the second 1.4550 price. Which is the
price other traders are prepared to buy at.
The difference between 1.4530 and 1.4550 is .0020 or 20 pips.
Using the formula from before, we have (.0001/1.4550) x $100,000 = $6.87 per pip x 20 pips = $137.40
Note, when you place a trade you are subject to spread which is the bid / offer price.
You will open a buy trade based on offer price and when you place sell trade it would be based on bid price.
To summarize when you buy to enter a trade you pay the spread but not when you exit the trade. Same is true
with sell, when you sell to enter a trade you pay the spread but not when the sell trade is closed.
What is leverage?
If you are not familiar with leverage you might be wondering how small investor can contribute such large
amounts of money as stated in lot sizes. Assume your broker as a bank who gives you, $100,000 to buy and sell

P a g e | 16
currencies and requires only a good faith deposit (margin) of $1,000. This is how leverage works it let you
control large contract sizes with small good faith deposit (margin) to amplify your profits.
The amount of leverage provided varies from brokers to brokers.
Once you have funded you account to trade the broker will let you know how much they require per contract
traded.
For instance every 1,000 that you put in margin allow you to trade 1 standard lot of 100,000.
As previous stated the leverage which directly affects the minimum security (margin) vary from broker to
broker. So a broker that require 1% margin means that for every $100,000 traded the broker will put $1,000 as
a security deposit (margin) on the position.
What is margin Call?
If in case your account equity drops below margin requirement (usable margin) due to loss on open positions
your broker will close open positions. This will help prevent your account going into negative balance.
Example #1
Let’s assume you open an online Forex trading with a deposit of $2,000. You place a trade of 1 standard lot size
on EUR/USD, which on this instance requires a $1,000 in margin. Since you started trading with $2,000 and
$1000 was kept a side as a margin requirement for the open trade. Then the remaining usable margin will be
$1,000, this means any losses will be deducted from your usable margin. If your losses exceeds you usable
margin which in this case is $1,000 you will automatically get a margin call and all open positions will be
closed.
P a g e | 17
2.3 ORDERS TYPE
In simple terms the order type refers how trade will be entered or exited. In this topic we will discuss what
different orders types that can be placed are. Some of the broker might not allow additional order type other
then the basic buy or sell.
Order Types
Basic Order Types
Following is a list of basic order types which includes market order, limit order and stop-loss order.
Market order
A market order is an order type which allows placing buy or sell trade at the present market price. For
instance, if EUR/USD is presently trading at 1.2200 and you want to place a buy trade at this price then you will
click the buy button on your trading platform to immediately implement a buy trade at that exact price.
Limit order
To place limit order you need to set price and duration if the currency price reaches your specified price with
the duration then a new buy or sell trade will be placed.
Stop-loss order
The stop loss order is a limit order which is specified to an open trade. The purpose of stop loss order is to
close a trade is the price goes against you at certain level. Stop loss order is extremely important to limit your
risk.
Additional Order Types
GTC (Good ‘til canceled)
Once a GTC order is placed it will remain active unless you make a decision to cancel it. The broker will not
have privilege to cancel it anytime. Therefore you should remember and monitor the GTC order that you have
scheduled.
GFD (Good for the day)
A GFD order stay active until the end of the current trading day.
OCO (Order cancels other)
OCO order consists of two interlinked order with price and duration placed above or below the prevailing
market price. If one of the orders is carried outs then the other order is canceled.

P a g e | 18
P a g e | 19
2.4 FOREX LINGO
Major and Minor Currencies
The most highly traded currencies which are G7 currencies and Swiss Francs are called major currencies. USD,
EUR, JPY, GBP, CHF, CAD, NZD and AUD are list of major currencies.
All Currencies excluding stated above are referred to as minor currencies.
Base Currency
The first currency in any currency pair is called the base currency. It denotes the value base currency measured
against quote currency (second currency in the pair). For example, if GBP/USD = 1.7500. Then the first
currency stated in known as the base currency (in this example it is GBP for Great British Pound) whereas the
one on the right is called the counter or quote currency. (In this example it is USD for United States Dollar).
The exchange rate denotes how many in terms of units of the quote currency should be paid to purchase one
unit of the base currency. For this example and the rate shown you would have to pay exactly 1.7500 United
Stated Dollar to buy 1 GBP.
Quote Currency
The second currency in any currency pair is called quote currency. It may also be suitable to call it the pip
currency as any profit or loss is articulated in this currency.
Pip
Pip is the most common unit and the smallest possible increment in the value of currency pair. If the value of
EUR/USD changes from 1.2250 to 1.2251, this means a 1 pip appreciation in the value of EUR/USD. The last
decimal place of a quotation is called pip. It also helps to indentify your profits or loss.
Bid Price
The bid price is the price at which you open a sell trade (sell the base currency) or in other words market
makers are prepared to buy at bid price.
Ask Price
The ask price is the price at which you open buy trade (Buy the base currency) or in other words market maker
are prepared to sell at ask price.
For instance, in the pair EUR/USD 1.2312/17, the ask price is 1.2317. This means you can buy one Euro for
1.2817 U.S. dollars. The ask price is also set to be the offer price.

P a g e | 20
Bid/Ask Spread
The difference between bid and ask price is called the spread. The broker is compensated for their services via
spread.
Quote Convention
Exchange rates in the Forex market are expressed using the following format:
Base currency / Quote currency Bid / Ask
Transaction Cost
The bid and ask spread is also referred as the transaction cost.
Following is the formula for calculating the transaction cost:
Transaction cost = Ask Price – Bid Price
Cross Currency
A cross currency pair is a pair in which neither base nor counter currency is USD. Such pairs portray irregular
price actions since it is same as opening two USD trades. For instance, simultaneous buying of EUR/USD and
selling GBP/USD is equivalent to buying EUR/GBP.
Margin
Whenever you open a new trade a certain percentage of account balance will be set aside, as the initial margin
requirement. The margin can be considered as good faith deposit which is refunded when the trade is closed.
Margin requirement vary with leverage which differ from brokers to brokers. If a broker offers a 200:1
leverage this means that the margin requirement is only 0.5 %. Therefore, only $500 will be set aside as a
margin requirement in order to open $100,000 standard lot.
Leverage
Leverage could be defined as the ability to control large dollar amounts with a relatively small amount of
capital. Leverage provided varies from broker to broker ranging from 2:1 to 500:1.
Increased buying power due to leverage can increase your profits but leverage should be used carefully as the
loss also magnifies using leverage.
Margin Call
If in case your account equity drops below margin requirement (usable margin) due to loss on open positions
your broker will close open positions. This will help prevent your account going into negative balance.

P a g e | 21
CHAPTER 3
MAJOR CURRENCIES
"Life unexamined, is not worth living." Democritus
P a g e | 22
3.1 UNITED STATES DOLLAR
United States is the world largest individual economy. It may not be false to say that the US dollar is the
king of currencies. The price of major commodities is quoted in United States dollar. More than 60% of the
world currency reserves held by central banks of different countries to back their liabilities are in USD.
Over 80% of all the currency transactions that take place involve USD. Therefore traders pay utmost
importance to current situation of United States Economy. The health of US economy not only has direct
affect on the USD but also on the other currencies of the world.
United States dollar is the most actively traded currency pairs. According to BIS (Bank of International
Settlements) currency pair’ including USD accounts up to 67% of the daily turnover in the currency market.
Central Banks and governments of different countries hold USD as their primary reserve currency, hence
USD accounts up to 63% of the world reserves currency. An important fact to note is many countries,
especially countries in Asia (including China) maintain large reserves of the USD which they use to peg the
value of their currencies against USD. The reason for doing so is to stabilize their currency and to lower the
value of their currencies artificially in order to make their export items more competitive overseas.
In addition, many individuals, business and multinational corporations located overseas hold United States
dollar for trade purposes and United States dollar is considered more stable than their home country’s
currency.
Oil, silver, gold and many other commodities are priced in USD, which makes it mandatory to have or
exchange to USD first prior purchase of such products.

P a g e | 23
3.2 EURO
Euro is the second most actively traded currency and is the official currency of 16 member nations in the
European Union (EU) which consists of total 27 member states. The states which have Euro as their official
currency are: Austria, Belgium, Cyprus, Finland, France, Germany, Greece, Ireland, Italy, Luxembourg, Malta,
the Netherlands, Portugal, Slovakia, Slovenia, and Spain.
The euro is administrated and managed by European Central Bank (ECB) based in Frankfurt and the Euro
System which is composed of central banks of Euro zone.
European Central Bank (ECB) works as an independent central Bank and sets monitory policy.
Euro facilitated lowering trade barriers, economic cooperation and integrating the economies of the major
countries in Europe.
Another important factor for trader to understand is that each member state that has euro as their official
currency are slickly bound to the monetary policy laid down by ECB. Therefore member states can not have
extremely different interest rates and inflation. Moreover member states are required to maintain banded peg
exchange rate and to allow their currency value fluctuation inside a narrow band.
European Monitory Union (EMU) nations are free to set their fiscal policy.

P a g e | 24
3.3 JAPANESE YEN
Japanese Yen (JPY) is the third most actively traded currency, after United States Dollar and Euro. Apart from
this it is also widely used as a reserve currency after the USD, EUR and GBP. Japanese Yen has very low interest
rate which makes it suitable for carry trades and borrowing.
Japan economy is the second world largest individual economy and just behind US. It is important to
understand economy of Japan to grasp a clear fundament of the Yen. From fundamental standpoint Japanese
economy is different from US economy, Japan have extremely few natural resources. After World War II Japan
found another way to overtake the world this was not by military force but by economic development.
Japan heavily relies on imported natural resources including oil, gas and other commodities. This is an
important factor to understand as Japan imports 100% of its oil from exporting countries thus an increase in
the price of oil has direct impact on the value Japanese Yen.
Another important thing to understand is that Japan economy relies on exports of goods such as cars and
electronics, as a result a string JPY means Japanese goods and services become more expensive and less
attractive for overseas consumers, which might harm Japanese exports.
In order to avoid any harm to Japanese economy Bank Of Japan (BOJ) intervene the Forex market to keep away
the Yen from raising.
P a g e | 25
3.4 GREAT BRITAIN POUND
Great Britain Pound (GBP) is the third largest reserve currency and fourth most actively traded currency.
UK economy is mostly service based economy with grave importance on financial services. UK earns
significant revenue from oil and natural gas exports.
United Kingdom is a member of the EU (European Union) buy it has not adopted Euro as its currency
therefore not tied with European Monetary Policy (EMU).
Bank of England (BoE) is the central bank of England. The two main functions of bank of England is
monetary stability and financial stability.
Pound is very active in the crosses specially EUR/GBP as EU is UK’s largest trading partner.
P a g e | 26
3.5 SWISS FRANC
Switzerland is one of the richest countries with world’s most stable economy. Switzerland is considered a safe
haven for investors and has renowned banking secrecy. It has a service based economy, with low
unemployment rate and budget deficit. Swiss practices including economic policies mainly conform to EU
standards.
As Switzerland is considered safe haven for investors, money flows into Switzerland at the time of geo-political
uncertainty.
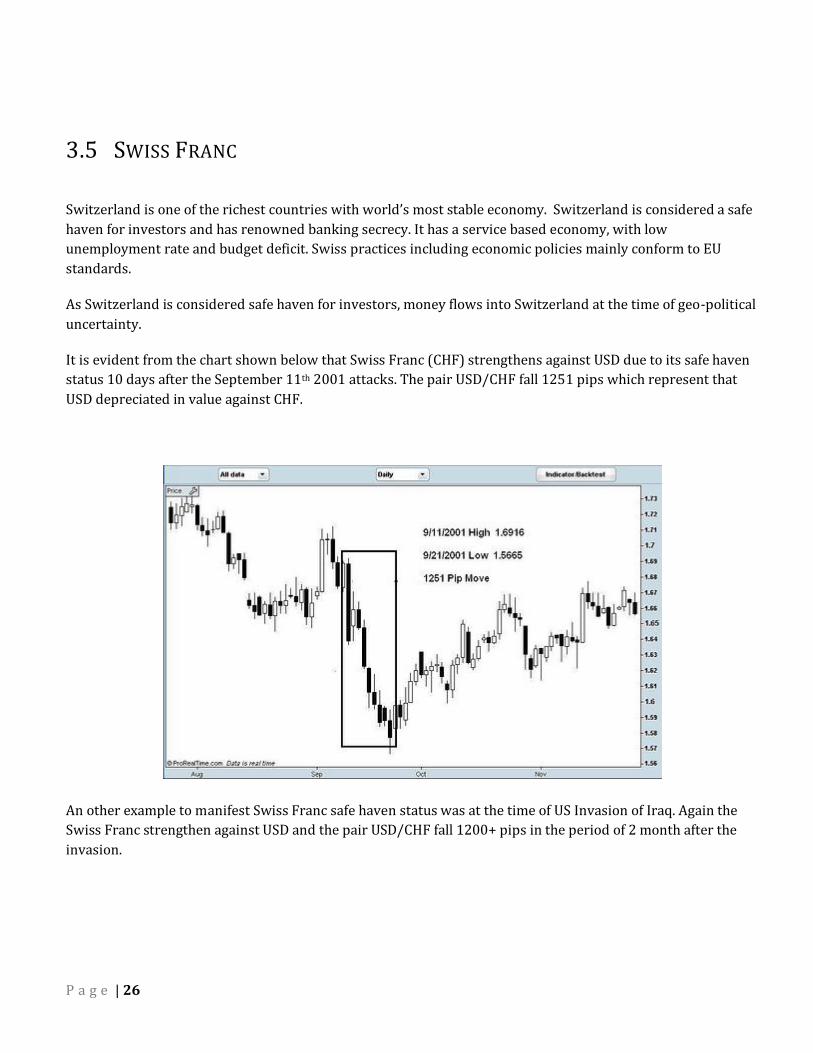
It is evident from the chart shown below that Swiss Franc (CHF) strengthens against USD due to its safe haven
status 10 days after the September 11th 2001 attacks. The pair USD/CHF fall 1251 pips which represent that
USD depreciated in value against CHF.
An other example to manifest Swiss Franc safe haven status was at the time of US Invasion of Iraq. Again the
Swiss Franc strengthen against USD and the pair USD/CHF fall 1200+ pips in the period of 2 month after the
invasion.

P a g e | 27
The second most import factor to understand regarding Swiss Franc (CHF) is its strong correlation with the
Euro. As evident from the graph below USD/CHF and EUR/USD pair have negative correlation. Which means
when Euro strengthens CHF also appreciate in value.
As you have notice in the chart shown above both pairs have 90% of strong negative correlation. This is
due to the fact that Switzerland and European Union has strong economic ties.

P a g e | 28
3.6 COMMODITY CURRENCIES
Canadian Dollar
Canada is the ninth largest economy and one of the wealthiest nations in the world. Canada has massive
manufacturing sector and net exports of natural resources (especially oil and gold).
The economy of Canada relies heavily on exports which makes closely tied with the international economy
especially United States. United States is the leading trading partner and exports flow from Canada to United
States of more than 81%.
Canada is the 14th largest producer of oil, 5th largest producer of gold and chief exporter of oil to the prime
consumer of oil (United States). Shift in prices of commodities has a direct affect on the exchange rate of CAD.
This means all else being equal; a rise in the price of oil will result into a stronger CAD and weaker USD.
Exports of commodities are key factor to gauge Canadian economy, however in recent years Canadian service
sectors has massively expanded. According to Wikipedia service sector accounts up to /3rds of the country’s
economic output. In other terms it means that a slowdown in United States economy can hurt Canadian
Economy and its currency even if the commodities remain high.

P a g e | 29
Australian Dollar
Australia has a prosperous economy and Australian Dollar is the sixth most actively traded currency.
Australia GDP consist of more than 68% of service sector, 4.7% from agriculture and mining which account for
65% of the country’s exports. Australia is the 3rd largest exporter of gold and the value of its currency has high
tendency to move with the price of commodities especially gold.
Australian economy and currency is similar to Canadian Dollar and economy in many ways, however unlike
Canada, Australia’s largest export market is Asia especially Japan and China.
This gives Australian dollar exposure to Asia. The AUD/USD monthly charts shows remained strong through
the current crisis, and the pair has moved 25 Years high.
AUD/USD Monthly:
P a g e | 30
New Zealand Dollar
New Zealand economy greatly depends on international trade, primarily Australia and follows market
economy. Other major trade partners of New Zealand are United States, China and Japan. New Zealand
population and thus domestic market is very small. It rely heavily on exports of good, therefore a slowdown in
their imports economy can directly affect New Zealand Dollar.
Like other commodities exporting countries New Zealand has vast agricultural natural resources like Food,
wood, wool, paper and dairy products. New Zealand Dollar (NZD) value is heavily influenced by the commodity
prices and health of its importing economies. New Zealand is also strongly focused on tourism.
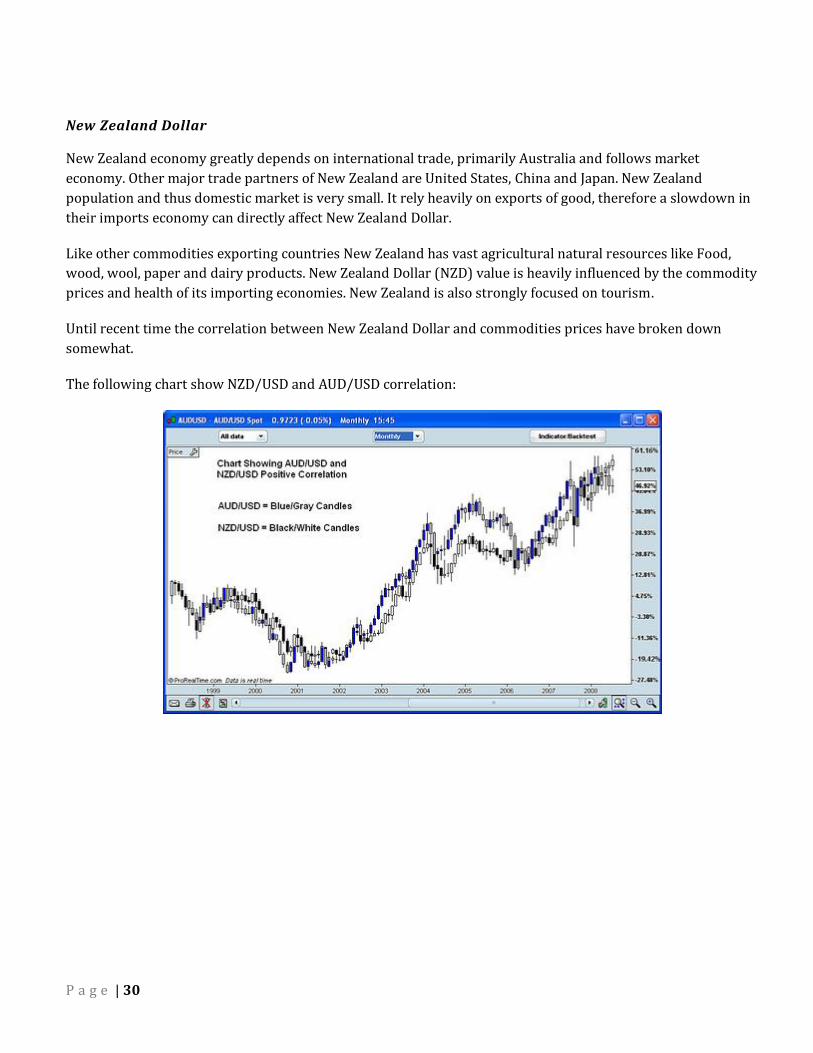
Until recent time the correlation between New Zealand Dollar and commodities prices have broken down
somewhat.
The following chart show NZD/USD and AUD/USD correlation:

P a g e | 31
CHAPTER 4
TECHNICAL ANALYSIS
"The gem cannot be polished without friction, nor man perfected without trials." Confucius

P a g e | 32
4.1 INTRODUCTION
Study of price movement by analyzing historic price action usually in the form of charts is called technical
analysis. Trader usually looks at price action usually in chart form and anticipate future price of the instrument.
A technical indicator is a form of chart plotted using mathematical formula which is derived from the price
and/or the traded volume of the financial security. The graphs are usually above or below the instrument price
and are helpful in forecasting future price movement of the instrument.
Technical indicators can be classified into two broad categories that is lagging and leading indicators.
Leading indicators are calculated in an effort to anticipate the future movement of price. As leading indicators
try to measure price movement from recent data, these indicator are prone to errant signals and it is usually
recommended to use such indicators when there is no clear trend in the market.
Lagging indicator pay emphasis on where the market has been and therefore what will be the future price.
Lagging indicator produce least errant signal but at a cost of delayed entry. Lagging indicators are believe to
work better in trending markets.
P a g e | 33
4.2 JAPANESE CANDLESTICK
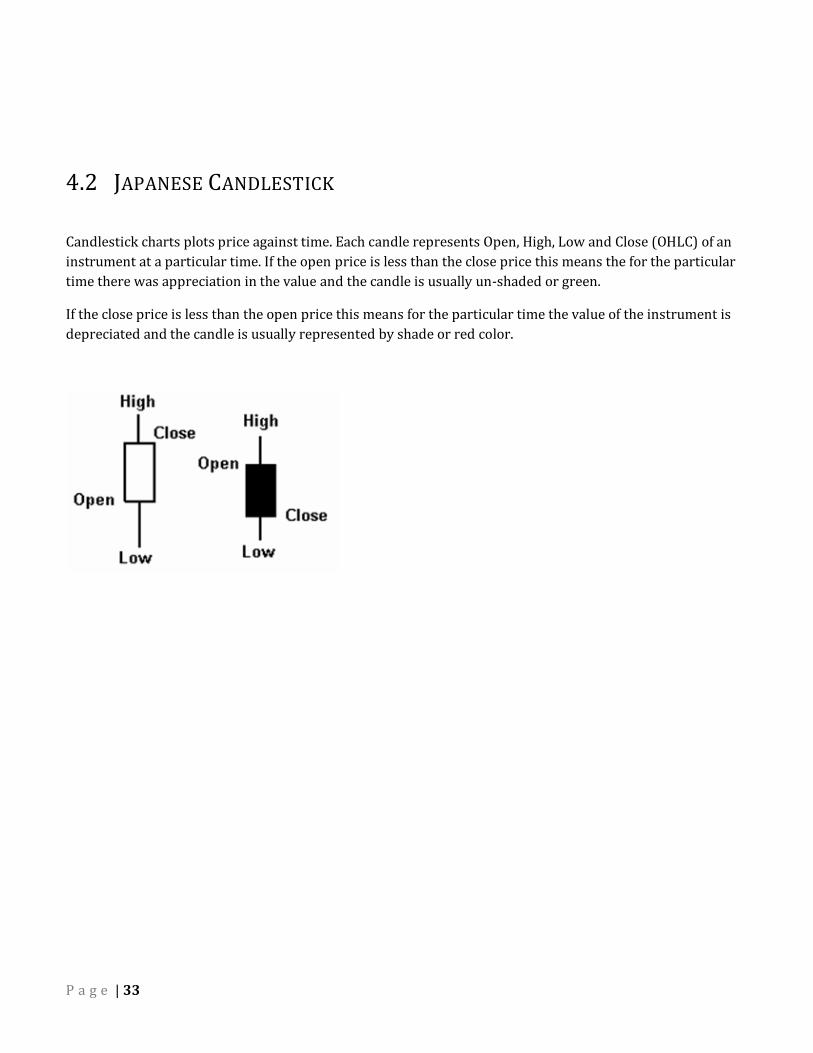
Candlestick charts plots price against time. Each candle represents Open, High, Low and Close (OHLC) of an
instrument at a particular time. If the open price is less than the close price this means the for the particular
time there was appreciation in the value and the candle is usually un-shaded or green.
If the close price is less than the open price this means for the particular time the value of the instrument is
depreciated and the candle is usually represented by shade or red color.

P a g e | 34
4.3 SUPPORT AND RESISTANCE
Support
Support is the price level where the price action tends to find a support for falling further. At this level there is
enough demand from buyers to keep the price from declining further.
Resistance
Resistance is opposite of support. It the the price level of a particular instrument where there is not enough
demand from the buyer to keep the price to surpass this level.
There are numerous ways to determine support and resistance. One basic way for identifying support and
resistance (S&R) is by analyzing the chart to see were the price hit a particular level multiple time without
breaking it and retraces back. If the price touches the support or resistance multiple time without breaking it
the more strong the support or resistance becomes.
A very basic strategy that traders use to trade using support and resistance is they buy at support and sell just
before the resistance level.

P a g e | 35
4.4 TREND LINES
Trend lines are another most commonly used technical analysis.
In its basic form, traders draw a line below the price in an uptrend (when the prices are moving upward) in
order to identify support areas (valleys).
Where as in downtrend (when prices are moving down) trader draw a line above the price to identify peaks
(resistance areas).
When you are trying to look out for possible set ups, it is a good point to note that you must also
identify the clear trend lines to filter away low probability set ups, even when the indicators are
giving you the go-ahead. We know that there are many types of chart pattern formations, but I do not
take much consideration into them. What I am looking out for are the ascending (upwards) and
descending (downwards) trend lines.

P a g e | 36
4.5 CHANNELS
Channels are created by drawing a parallel line at the same angle of the trend line.
To create an ascending channel (when prices are moving upward), we have to simply draw a parallel line
above the price at the same angle of the upward trend line.
To create a descending channel (when prices are moving downward), we have to simply draw a parallel line
below the price at the same angle of the downward trend line.
The channel also shows the range at which the price fluctuate when in an uptrend or down trend.
Following chart shows how channel are created in an uptrend, downtrend and sideways (when there is no
clear trend and the prices are range bounded.
P a g e | 37
4.6 COMMON CHART INDICATORS
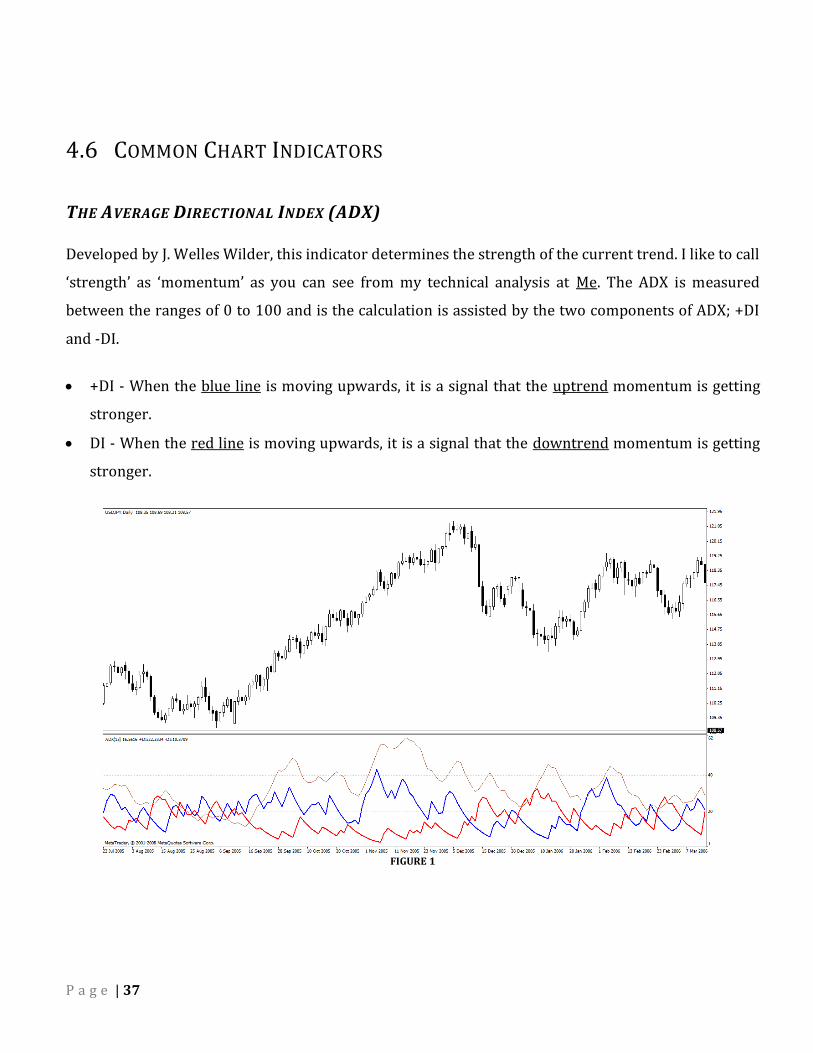
THE AVERAGE DIRECTIONAL INDEX (ADX)
Developed by J. Welles Wilder, this indicator determines the strength of the current trend. I like to call
‘strength’ as ‘momentum’ as you can see from my technical analysis at Me. The ADX is measured
between the ranges of 0 to 100 and is the calculation is assisted by the two components of ADX; +DI
and -DI.
+DI - When the blue line is moving upwards, it is a signal that the uptrend momentum is getting
stronger.
DI - When the red line is moving upwards, it is a signal that the downtrend momentum is getting
stronger.
FIGURE 1

P a g e | 38
The usual practice is when ADX is below the 20 mark, it indicates that the market is non-trending with
low volumes while a cross above the 20 mark signals the start of a possible trend; be it up or down
trend. If the ADX is above the 40 mark but falling, it could possibly indicate a retracement from the
trend. Please note that ADX itself is not entirely a trend indicator but rather, it calculates the
momentum of the prevailing trend.
How does ADX apply to trading system?
This system makes full use of the momentum shift and optimizes the point of entry at the turn of the tide. There is no way (yes I am assertive on this) of catching 100% of the reversal or trend continuation unless you are talking about stocks trading where if you are one of the major shareholders of a company, you can manipulate the price action. Nonetheless, using the method will help you to catch about 65-70% of the market momentum. If you have been checking on the daily technical analysis, you should know by now what I mean by “momentum is weak” and “momentum is strong” etc. The n period for ADX I set for this trading system is 13-period ADX.
P a g e | 39
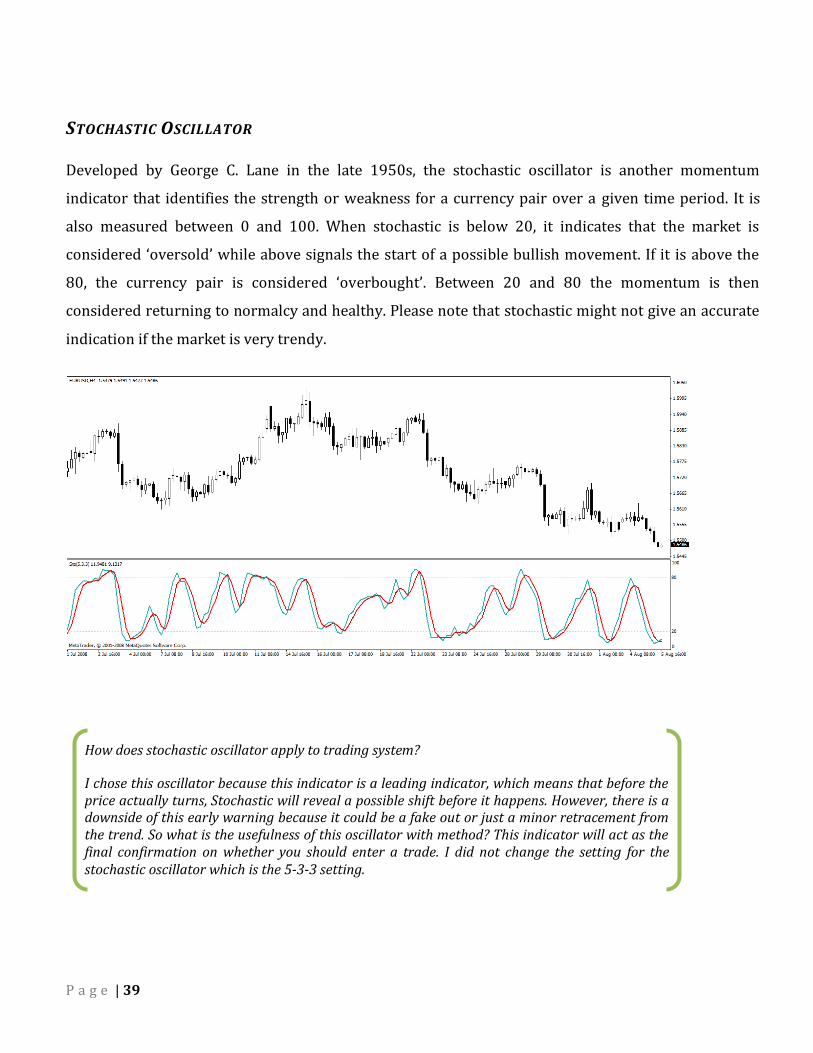
STOCHASTIC OSCILLATOR
Developed by George C. Lane in the late 1950s, the stochastic oscillator is another momentum
indicator that identifies the strength or weakness for a currency pair over a given time period. It is
also measured between 0 and 100. When stochastic is below 20, it indicates that the market is
considered ‘oversold’ while above signals the start of a possible bullish movement. If it is above the
80, the currency pair is considered ‘overbought’. Between 20 and 80 the momentum is then
considered returning to normalcy and healthy. Please note that stochastic might not give an accurate
indication if the market is very trendy.
How does stochastic oscillator apply to trading system?
I chose this oscillator because this indicator is a leading indicator, which means that before the price actually turns, Stochastic will reveal a possible shift before it happens. However, there is a downside of this early warning because it could be a fake out or just a minor retracement from the trend. So what is the usefulness of this oscillator with method? This indicator will act as the final confirmation on whether you should enter a trade. I did not change the setting for the stochastic oscillator which is the 5-3-3 setting.
P a g e | 40
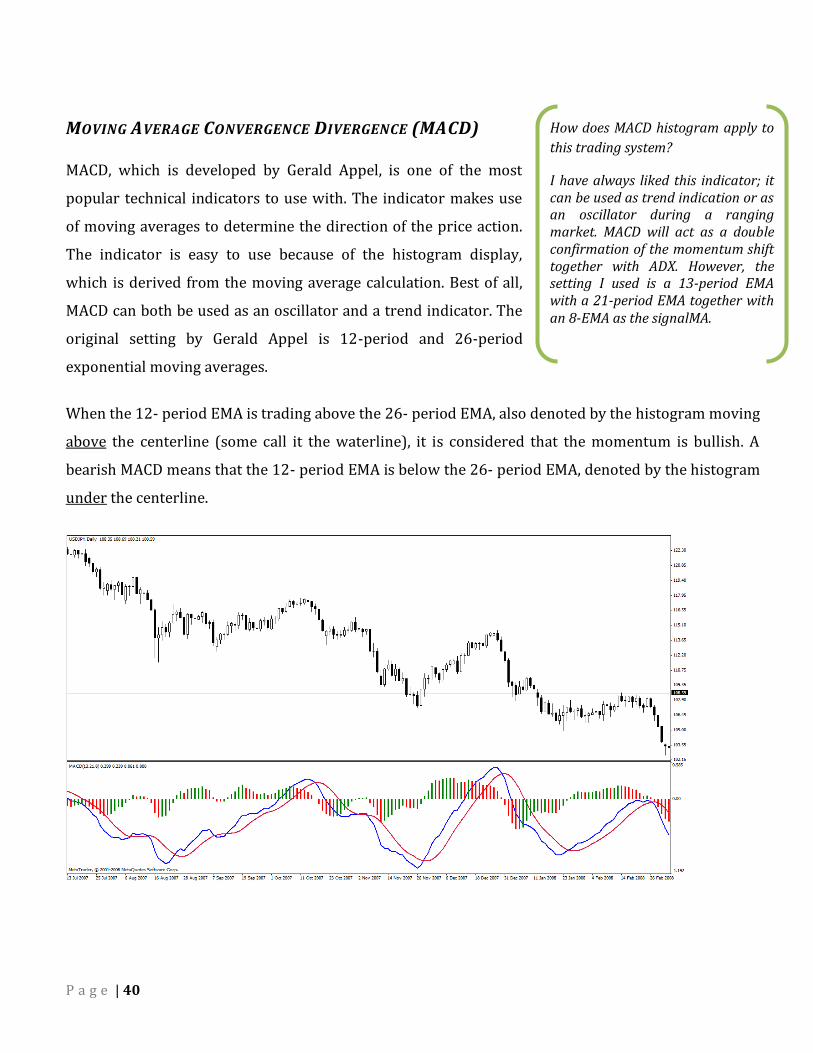
MOVING AVERAGE CONVERGENCE DIVERGENCE (MACD)
MACD, which is developed by Gerald Appel, is one of the most
popular technical indicators to use with. The indicator makes use
of moving averages to determine the direction of the price action.
The indicator is easy to use because of the histogram display,
which is derived from the moving average calculation. Best of all,
MACD can both be used as an oscillator and a trend indicator. The
original setting by Gerald Appel is 12-period and 26-period
exponential moving averages.
When the 12- period EMA is trading above the 26- period EMA, also denoted by the histogram moving
above the centerline (some call it the waterline), it is considered that the momentum is bullish. A
bearish MACD means that the 12- period EMA is below the 26- period EMA, denoted by the histogram
under the centerline.
How does MACD histogram apply to
this trading system?
I have always liked this indicator; it can be used as trend indication or as an oscillator during a ranging market. MACD will act as a double confirmation of the momentum shift together with ADX. However, the setting I used is a 13-period EMA with a 21-period EMA together with an 8-EMA as the signalMA.

P a g e | 41
AVERAGE DAILY TRADING RANGE (ADTR)
Average Daily Trading Range is the difference between the high and low prices in one trading day.
Tracking this range can tell us whether the currency pair is volatile or not. We can also use the ADTR
factor to plan our trade within a day. Let’s take a look at the illustration below that you will get to see
on the MetaTrader4 platform. It is not a must because some other proprietary platforms also provide
the daily range information. If your trading platform does not include daily range, you might want to
install a demo MT platform just to use it for charting purpose. I recommend FXDD as the calculation of
daily range and weekly pivots are derived from their server time, which is GMT+3.
How does ADTR apply to this trading system?
I want to share with you that the average daily trading range is just a guide to whether should you enter a trade if the price action is too near the ADTR. While it is not critical, however, it is a good thing to take note of it so that you can decide not to follow the rules of this system if you are not comfortable with the already formed ADTR late into the day. The method is not affected by the ADTR; it is just an additional precautionary measure for you to consider.

P a g e | 42
PIVOT POINTS
I choose to use weekly pivots is because the calculation on the weekly is not so much difference even
if your broker server time is different from the one I used for charting purpose. Using the weekly
pivots, we can determine the sensitive areas for the week ahead to plan your trading strategies. I use
it in additional to the Fibonacci support and resistance levels -which will be discussed later- to
identify multiple confluences of these important lines.
FIGURE 2
The calculations of the pivot points are as follow:
Resistance Level 3 = High + 2*(Pivot-Low) Resistance Level 2 = Pivot + (RLv1-SLv1) Resistance Level 1 = 2 * Pivot - Low Pivot Point = (High of the week + Close of the week + Low of the week) / 3 Support Level 1 = 2 * Pivot - High Support Level 2 = Pivot - (RLv1-SLv1) Support Level 3 = Low - 2*(High-Pivot)

P a g e | 43
FIBONACCI RETRACEMENT AND EXTENSION LEVELS
We have come to Fibonacci support and resistance levels, the last part of the technical tools required
for My Trading Strategy 2. This topic is also the most important of all. Before I explain on how to make
use of this wonderful numbers, let’s take a look at how to calculate the
Fibonacci numbers.
The Fibonacci series of numbers are 1 , 1 , 2 , 3 , 5 , 8 , 13 , 21 , 34 , 55 ,
89 , 144 and so on to infinite. Now you must be thinking how to derive
from 1 to 2, and 2 to 3 then to 5 etc. Did you make the correct guess
that the next number is 8? If you don’t know, here is the calculation; it
is simply by adding two previous numbers and once you get the
current number, the next number is then calculated by adding the
previous and current number that you have just got. In this example,
we got our next number 8 by adding 3 and 5 together. So what is the
next number after 8? Right, it is 13 (5+8=13).
In the Forex market, Fibonacci numbers are used in terms of percentage ratio. It is by using the
numbers we derived above and then dividing those numbers to get the percentage ratio.
Let‘s look at how the percentage are calculated, for example 8, 13, 21, 34, 55, 89.
Now you use the above and divide them 1 by 1;
08/13 = 0.61538461538461538461538461538462
13/21 = 0.61904761904761904761904761904762
21/34 = 0.61764705882352941176470588235294
34/55 = 0.61818181818181818181818181818182
55/89 = 0.61797752808988764044943820224719
How do pivots and Fibonacci
support and resistance lines
apply to this trading system?
When we decide to enter a trade, we need to see where are the sensitive levels that we need to take note of. The weekly pivots in my opinion are not that critical as compared to Fibonacci support and resistance. However, I want to use the pivots to identify potential confluence of these lines to avoid any additional risks. It proves to be useful.

P a g e | 44
As you can see from the above, all results are near the magical
percentage of 61.8%. Now do you see why it is so sensitive and
often mentioned in technical analysis and matters to most traders?
It is usually seen as a critical support or resistance line depending
on what the trend is. Break of this level would usually see the price
action move towards the 100% level to complete the retracement.
For the 38.2% ratio, it is calculated by dividing one number in the
Fibonacci series by the number that is found two places to the right.
For example:
13/34 = 0.38235294117647058823529411764706.
The 23.6% ratio is calculated by dividing one number in the Fibonacci series by the number that is
three places to the right. For example:
21/89 =
0.23595505617977528089887640449438.
My views on 23.6%, 50% and
78.6% lines:
While the 23.6% is considered a Fibonacci level, the 50% and 78.6% are not but it seems the market react to them at times. For myself, I would really consider these lines only if the range is very wide as in calculated on a longer term basis. Then these levels could be seen as more sensitive than shorter time frames.
How to determine if the Fibonacci support and
resistance levels have been breached?
If you have drawn the lines using the daily chart, then only the daily completion of the candle will gives a stronger signal that the level has been breached. If it is drawn on the weekly, you will have to wait till the completion of the weekly candle to confirm the break.

P a g e | 45
By looking at the last part of this section, you should know that I view it as very important
information to share with. Let’s go on to how to trade the Fibonacci levels in the Forex market (I will
share with you how to combine this method with My Trading Strategy 2 later on).
As we know, Fibonacci levels are usually drawn on the daily, weekly and monthly charts. But do you
know that you can also draw the retracement levels on the 4-hour chart if suitable scenario is given?
Moreover, these minor Fibonacci levels are worth to consider when you determine your entries and
exits. So how do we draw the lines on intraday charts? Let’s take a look at this example below:

P a g e | 46
The above illustration is a 4-hour chart of Euro-Yen currency pair. As you can see, this Fibonacci
retracement levels would not be able to draw if you switched to the daily chart. However, once you
switch to the 1-hour or 4-hour chart, you can plot out the retracement lines and can be seen clearly on
the chart. This chart was taken at time of GMT 0035H 8th August Friday while writing this amazing My
Trading Strategy 2 method. As the momentum has turned to the downside on the 4-hour chart, on the
1-hour chart using the FB2 method, I have already gotten in the trade with a possible target of 165.31
(16 July Low) which is also near the 161.8% extension of this retracement. The break of the 61.8%
together with the indicators in FB2 confirmed that the price action is going down and as it did, once it
plunged through the 61.8% level, you can see that the sellers are keen to push the price lower
towards the 100% retracement.

P a g e | 47
Several candles later, you can see that the price action has forced down its way lower towards the
161.8% Fibonacci extension level. This proves that Fibonacci lines are proven support and resistance
levels to consider with. If you have not been studying on these important lines, now is your time to
learn how to plot out those lines to know what is going on clearer.
FIBONACCI CONFLUENCE SUPPORT AND RESISTANCE LEVELS
After we know what are the Fibonacci retracement and extension lines, the advanced stage is to know
how to identify the confluences of these lines between smaller and bigger price movements.

P a g e | 48
As you can see from the above USDJPY chart, there are three possible Fibonacci retracements from
the low of 95.73 on 17th March 2008. A bigger Fibonacci high (denoted by red lines) was drawn at
124.13 on 22nd June 2007; a lower high (denoted by grey dotted lines) was drawn on 117.93 on 15th
October 2007 with the last one (denoted by blue dotted lines) drawn at 114.65 on 27th December
2007.
When the initial retracement started, there were confluences of 38.2% level (blue dotted line) and
23.6% level (red line) near the area between 102.44 and 102.96. The price action was unable to break
above this range and retraced back downwards to the 100.00 zone. One of the significant reasons
based on technical analysis was that the Fibonacci levels were on confluence mode, the lines of
resistance were strongly in agreement at that time of price action. How did I confirm that? I concluded
that with the combination of the indicators used by My Trading Strategy 2 system, which I will show
you later in details.

P a g e | 49
Next example I am going to show you are the confluence of Fibonacci retracement lines of two
opposite directions. On this GBPUSD chart (my favorite pair to trade), the red lines represent the
bigger price retracement from the low of 1.9336 to 2.1160 (if you can remember the important lines
without looking at the chart which what I am doing right now, you are in sync with the currency pair
and know what is going on inside out) while the dotted blue lines represent the downward
retracement from the high of 2.0156 to the low of 1.9363. From this backdated chart, the price
movement actually was halted near the 23.6% (red line) and 50% (blue dotted line) confluence of
retracements around 1.9758/66 area. This good support level was also confirmed by the My Trading
Strategy 2 technical indicators.

P a g e | 50
4.7 MULTIPLE TIMEFRAME
Multiple timeframe analysis means incorporating more than one time frame into your trading strategy. This
gives you edge and ensure you do not trade with trend against larger timeframe which might change trend of
the shorter time frame.
Once you found entry signal in you preferred timeframe it is recommended to make a strategic decision to go
long or short based on the direct of the trend of upper timeframe.
Follow chart shows how to incorporate multi timeframe analysis into your trading.
1 Hour
P a g e | 51
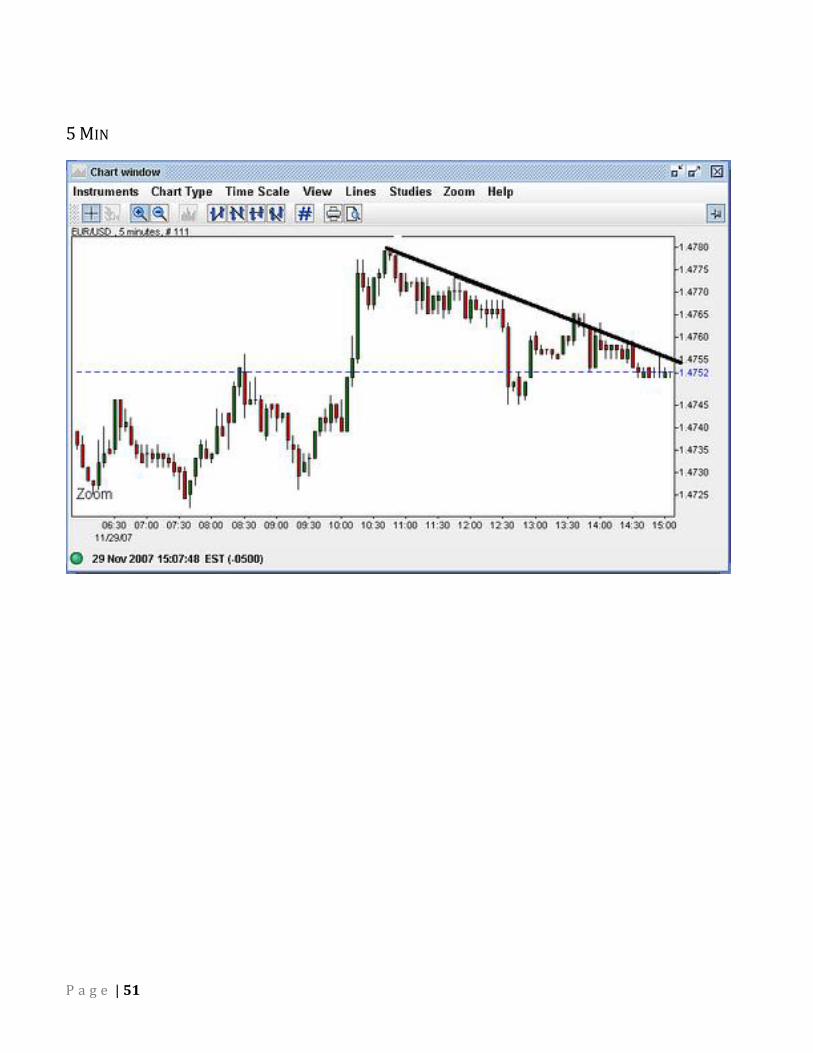
5 MIN

P a g e | 52
DAILY
After analyzing these charts we see the pair is in a down trend in 5 minute and the hourly chart however when
we move to daily chart it shows not only strong but also an extended uptrend. Therefore it is generally
accepted by trader not to trade against large timeframe trend.

P a g e | 53
CHAPTER 5
FUNDAMENTAL ANALYSIS
"He is foolish to blame the sea who is shipwrecked twice." Publilius Syrus

P a g e | 54
5.1 INTRODUCTION
Fundament analysis is a form of analysis in which general economy, and factors that affect supply and demand
are analyzed to make trading decisions. In simple terms it means that we study the health of the economy and
if the economy seems to be in good state then its currency value will appreciate. The chief reason for this is that
other counties and investors will have more trust in that country and additional capital will flow to the
economy.
A fundament analyst can focus on everything such as overall health of the economy, economic releases, IR
(interest rates), earnings, and production.
P a g e | 55
5.2 OVERVIEW OF US ECONOMY
When studying fundamental analysis it is important to have at least a brief knowledge of how an economy
especially United States economy works at USD is major currency.
According toInvestopeida.com economy could be defined as the following:
"The large set of inter-related economic production and consumption activities which aid in
determining how scarce resources are allocated. The economy encompasses everything relating to the
production and consumption of goods and services in an area."
United States Economy is the largest economy in the world which is often referred as free market or capitalist
economy. In a free market economy businesses are controlled by private sector (non government) including
production and distribution of goods as well as services. Moreover in free market economy prices are set by
supply and demand. Free market or capitalist economy is opposite if planned or socialist economies in which
manufacturing and distributions of goods and services are done as well as prices are set by the government.
Practically United States economy is blended economy as the government does handle some of the tasks which
cannot be passed to private sector such as military, road building, education and law enforcement.
It is important to understand that people usually prefer capitalism and free market economies therefore any
move toward capitalism will generally result into market rally whereas move away from capitalism will be
sensed by market as anti business and markets generally sell off.

P a g e | 56
5.3 MONETARY POLICY AND FISCAL POLICY
Fiscal Policy
Fiscal policy is any policy relating to government spending and taxation. Due to different reasons the economy
under goes repeated growth and contraction which can be broken down as the following.
1) Contraction
2) Trough
3) Expansion
4) Peak
(image source: Wikipedia.org)
Fiscal policy is an effective tool at government disposal in regulating the business cycle. Government spending
and taxation must be approved by both congress and the president.

P a g e | 57
Monetary Policy
Monetary policy is the process by which Federal Reserve in case of United States or monetary authority, central
bank, or government of a country controls the following:
1) Supply of money
2) Availability of money
3) Cost of borrowing money (Interest Rate)
These policies are set in order to achieve set of goals which are oriented towards stability and grown of the
country’s economy.
Interest rate and total supply of money have great impact on economy. Monetary policy is said to be
contractionary if it reduces money supply or raises IR (Interest Rate). Whereas, expansionary policy is used to
tackle unemployment, this is usually done by lowering the interest rate in inflation.

P a g e | 58
5.4 BALANCE OF PAYMENT
In long term stream of money from international trade, speculation and investment eventually decide the
value of a country currency. When there is an increase in demand for export products of a country and/or
investment opportunities look attractive to foreigners then all else being equal they currency should
appreciate.
Trade Flows
Flow of money in and out of a country due to global trade or commerce is called trade flows. In simple
terms it means that money flow from the importing country to exporters’ country for the goods and
services being delivered.
When a state imports goods this add money of the importing country to the market and generate demand
for the currency of the exporting nation. This is due to the fact that goods are usually purchased in the
currency of the country where they are manufactured or produced, so the country importing the goods
must exchange their currency.
Capital Flows
Flow of capital (money) as a result of investment into and out of countries is called capital flow. As in
previous topic we discussed flow of capital as a result of international trade however capital flow results
due to money flow due to investments such as stock and bond market, real estate and cross boarder
acquisitions and mergers.
Current Account
The formula for calculating the current account for a country is as following
When describing imports and exports you will often hear about current account surplus or a current
account deficit. When a value of country exports are more than they are importing is known as current
account surplus. Current account deficit is opposite of current account surplus. A country with current

P a g e | 59
account deficit will generally have a weaker currency, this means that the country is importing more than it
is exporting and the money flow out of the country.

P a g e | 60
Capital Account
The general formula for calculating the capital account is as following:
Ownership of foreign or domestic assets refers to things such as real estate, foreign and domestic
companies’ investment and cross border mergers and acquisitions. Portfolio investment refers to
investment in stocks and bonds. Whereas, other investments includes investment in loans and bank
accounts.
As we discussed in our lesson on capital flows, when a market in a country is outperforming the markets in
other areas of the world, money will flow into the country from foreigners seeking to participate in those
out sized returns. These capital flows are reflected in the country's capital account. This is the case whether
we are talking about a country's stock market, bond market, real estate market etc.
Countries with aggressive inflows or outflows of funds have straight influence on its currency. If other
things are kept constant then a country with major inflows create demand for the currency resulting into
the appreciation in the value of the currency.
Balance of Payment
In simple terms balance of payment refers to sum of all the transaction by a country with rest of the world.
By using balance of payment as an indicator Forex traders can achieve immense imminent into the
potential future price action of a country’s currency.

P a g e | 61
5.5 ECONOMIC RELEASES
It is important for a trader to understand major economic releases and their impact on trading. There are
numerous economic releases that are published every day to cover each economic release will be out of the
scope of the book however some basic economic are briefly touched below.
Gross Domestic Product
GDP which is also referred as Gross domestic income (GDI) is a gauge of national income and output of any
countries economy. For this reason trader and other market participants closely watch Gross Domestic Product
Number (GDP).
High rate of growth is a good indicator for the economy but if markets anticipate that the growth is not
sustainable without excess inflation, participant might reach negatively. You can read the analysis from
different sources including Bloomberg.com and dailyfx.com are best services available free of cost.
Non Farm Payrolls
Non Farm Payrolls (NFP), economic release is public each month on first Friday at 8:30. NFP is released by the
Bureau of Labor Statistics in United States which is meant to show the number of jobs added or vanished in the
economy over the period of one month. As the name implies NFP does not include jobs concerning to farming
industry.
When business are hiring people this means they are optimist about the future health of the economy. This is
expressed in form of NFP.
P a g e | 62
5.5 INTEREST RATES
Interest rate in currency trading is as important as current and future prospect factor that affect the long term
earning and direction of stock.
Currencies are highly reactive to economic news that may affect the interest rates of a country.
If the central bank of a country rises the interest rate this makes debt instrument for that country more
attractive. This means foreign investors are more likely to invest in the debt of that country as well as domestic
investors are less likely to look foreign countries for investment. Therefore, all else being equal the demand for
the debt of the country pull the value of its currency.
Conversely, when Interest rates decreases, there will be demand for the debt of the country due to lower
earning for investors; usually this will devalue currency and other debt instrument.

P a g e | 63
CHAPTER 6
MONEY MANAGEMENT
"Believe it can be done. When you believe something can be done, really believe, your mind
will find the ways to do it."
David Schwartz

P a g e | 64
6.1 INTRODUCTION
Money management is one of the most important aspects of trading. It is also the most overlooked part of
almost all type of trading. Money management rules not only facilitate us in protecting our capital but also,
make us gainful in a long term.
Trading without sensible money management rules is merely playing Russian roulette.

P a g e | 65
6.2 LEARN TO PROTECT CAPITAL FIRST
The primary goal of successful trading is the safeguarding of capital. In order to explain how difficult is to get
out off losses there is an example shown below:
Let’s assume a trader started with $10,000 and go down by $5,000. The percentage of capital he lost is 50%.
Now in order to get out of his losses and to breakeven even he need to made 100% return on $5,000. In order
words he has to be twice as successful to cover his draw down.
Initial Stop Loss
It is important to incorporate sensible risk management into trading. This can be achieved by setting stop loss
which you can afford to lose on a trade without any substantial affect on the account equity. This greatly vary
from strategy that one is trading and from traders to traders.
Dr Alexander Elder stated as following in his renowned book “Trading for a Living”.
“Many studies have shown that trading strategies and traders who risk more than 2% of their overall
trading capital on any one trade are rarely successful over the long term. From what I have seen most
traders risk way more than this on an individual trade basis, another large contributor to the high
failure rate among traders.”

P a g e | 66
6.3 SETTING PROFIT EXPECTATION
In order to build robust money management plan, the key components involved is lucrative trading
strategy and setting practical profit probability.
Risk to Reward Ratio
Yet another way to add to your odds of profitability is to always trade with a higher risk to reward ratio.
This means you are more likely to make 3 times more than what you are risking per trade. You can
significantly increase your chances of ending up profitability if you have 3:1 reward/risk ratio in your
trading strategy.
No of Trade Loss Win
1 $1,000
2 $ 3, 000
3 $1,000
4 $ 3, 000
5 $1,000
6 $ 3, 000
7 $1,000
8 $ 3, 000
9 $1,000
10 $ 3, 000
Total $ 5, 000 $ 15,000
In the example shown above your percentage of winning trades is only 50% but still you made a profit of
$10,000.

P a g e | 67
6.4 POSITION SIZING
Position sizing is the main topic for money management and vital component for successful trading. Position
sizing strategy can be classified into two broad categories martingale and anti martingale.
Martingale is a strategy for position sizing which increases the trade size as the trade suffer draw down or after
a losing trade. Anti-martingale strategy is opposite of martingale strategy, which increases position sizing after
winning trade or when the trade moves in trader favor.
Fixed Position Sizing
Many traders make the mistake of choosing an arbitrary number such as 1 standard lot per $5,000 capital or so
on when they take first step toward trading. Using fixed position sizing has many disadvantages it does not
take into account the dollar value and volatility characteristics of the instrument being traded. Moreover fixed
lot sizing does not allow a trader to trade large contract size on trades with high chances of winning and lower
the trade size on lower probability of success.
For instance a financial instrument of 100 unit with $20 value fluctuates 5% a day does not present the
risk/reward for a second instrument of 100 unit with $30 which fluctuate 1% a day.
% Risk Model
The next level of sophistication in determining your position size is by using percentage risk method. In % risk
based model contract size is determined by the risk on each trade in provisions of a percentage of your capital.
As we looked in our previous topic that traders who risk more than 2% of their capital on any one trade are
usually not successful overlong run.
For instance if a trader has $100,000 in his trading capital and identify from his historic analysis of the strategy
that 2% or $2000 of his trading capital is an appropriate amount to risk per trade.
% Volatility Model
Volatility based position sizing consider how much the price of a financial instrument fluctuates over a given
period of time. ATR (Average True Range) is an indicator which shows the volatility of any financial instrument
over a period of time. Value obtained from ATR can be used to determine your stop loss level in addition to the
position size of the instrument you are trading.
For instance, a trader has $100,000 in trading capital and he is look to buy EUR/USD which is at 1.3580. After
pulling up a chart of EUR/USD currency pair and adding the ATR it shows the value of 0.0084. As you

P a g e | 68
remember from our starting topic that 1 pip represent $10 when trading standard lot. So taking this into
consideration that volatility is dollar per contract for EUR/USD equals to $10 x 84 which is $840.
Therefore if the trader as risk appetite of 2% of his trading capital that he is willing to risk, then on volatility
basis this equals to $2000. This means under this model the trader can put approx. 2.3 standard lot.

P a g e | 69
CHAPTER 7
TRADING SYSTEM
"The truth of the matter is that you always know the right thing to do. The hard part is doing it" Norman Schwarzkopf

P a g e | 70
7.1 TRADING SYSTEM I: THE METHODOLOGY
What I have shown you earlier are the technical indicators and tools for My Trading Strategy 2. Now
you must be thinking why I chose all these indicators? Frankly, it is more of a personal preference and
the fact that these indicators are some of the popular indicators out there that caught my attention.
Basically, ADX has been known to act as a trend strength indicator together with MACD as well. The
Stochastic acts as an attacker in the immediate market condition whereby it will tell us whether the
momentum indicators are giving us the right signal to go in. Traditional charting analysis such as
trend lines support and resistance also must be taken into consideration as well. Also, the Fibonacci
retracement and extension levels are seen as the most important areas of support and resistance,
with additional pivot lines as pre-empt levels.
My Trading Strategy 2 can be regarded as being a systematic or discretionary trading system
depending on how you are going to use it. Of the earlier My Trading Strategy system, this second
system supersedes and is considered a much more superior trading strategy. This is why I took a long
time to document the whole complete method is this e-Book that you have purchased. I am glad that I
did.
My Trading Strategy 2 is a trading system to trade the Forex market. The method is affectionately
known as:
Momentum Assault (requires multiple time frames analysis)
GUIDE ON HOW TO USE ME MARKET ANALYSIS
In this section you will learn how to determine whether the momentum is strong, weak or neutral.
The support and resistance levels I will update as and when is needed. However, if you are
experienced enough, you can plot out the lines yourself although it takes a while to confirm these
lines.

P a g e | 71
I have split to three levels of gauging the momentum. From top down, My Trading Strategy 2 started
with the weekly, the daily and then the intra-day 4-hour time frame. The technical analysis will be
done on FXDD Meta Trader platform with all the indicators inserted to get the full picture.
Main Time Frames
Long term = weekly
Medium term = daily
Short term = 4-hour
Market Analysis - Forex Currency Outlook
The color-coded arrows highlight the immediate market momentum and overbought/oversold zones.
The overbought and oversold zones are not meant to tell you that the market has reached its bottom
or top, but rather, inform you that it is not advisable to enter at the direction of the movement if it is
in the zone.
Up arrows will indicate that the price action could be moving higher, usually signs of higher
prices ahead.
Down arrows usually indicate that lower movements ahead in future.
The colors represent the signal and its current situation of overbought/oversold condition:
Red arrow represents ascending trend with momentum in overbought zone.
Green arrow is the preferred level for opening a new position where the momentum is in healthy
zone and not being overbought.

P a g e | 72
Blue arrow indicates that the ascending trend could be
losing its steam as the momentum is moving against the trend.
This arrow is not recommended to enter any new positions
(existing positions should move your stops to protect your
profits).
For example, a Green Down arrow indicates that momentum
has recently turned negative from within overbought territory,
suggesting lower prices are ahead.
Green arrow shows that momentum is moving in the
direction of the arrow, but the signal is within an unconfirmed
zone and is neither overbought nor oversold. This indicator is
quite common and represents trend continuation or opening a
new position.
Red arrow shows that momentum is currently in an
oversold zone. Although the trend is progressing in the direction of the arrow, but consideration
should be given to exiting positions in the direction of the trend. Therefore, it can be used as a signal
to take profit. It is also not advisable to open a new position the market could quickly turn bad if it
reverses from oversold zone. Additionally, red arrow should not be considered to open an opposite
position because the market can stay in the oversold zone for a very long time if the trend is very
strong.
Blue arrow could imply that existing trend could be ending soon and therefore serve as an early
indicator to monitor a particular currency pair for a possible reversal in the near future.
Thoughts on deciding the
momentum factor:
What I have shown you are entirely
based on technical analysis.
However, at times to determine the
momentum, you will have to look
into what is going on with the
economic releases and the
immediate market momentum.
When the GBPUSD technical
outlook shows a bearish
momentum, a piece of good news
for the Dollar would inject further
downside. The difficult part is when
the data is a bad news, and you
have to do your research further to
confirm that the momentum should
persist.

P a g e | 73
7.2 TRADING SYSTEM I: THE METHOD
I hope you are still with me, if not please take a break and close this file because what I am going to
share with you now is the actual method that puts everything together of what I have mentioned.
Before I continue, I want to reiterate that this My Trading Strategy 2 trading system is one of the best
systems I have personally developed and used since last year 2007. This system could give you
potentially more than 500 pips (you decide the dollar value per pip) on a very good trendy market in
a single month. There are many e-Books that sell all sorts of strategies, systems and setups whatever
you may call them, but nothing comes close to My Trading Strategy 2 that I am going to share with
you, at least in my opinion. When I say it is proprietary, it is the truth. No trader know about this
system except for those who have purchased this FB2 manual including the person who is reading
now which is YOU. I am as happy as you do that you have picked up this manual, willing to give it a try
and rest assured that if you follow what I have shared with you, there is only one way to go in your
trading account; which is pips, pips and more pips.
Alright, let’s take a deep breath and proceed with the explanation of this My Trading Strategy 2
system.

P a g e | 74
Momentum Assault
Momentum Assault is a method that requires analysis on two time frames. It is a top-down approach
and trade with the primary trend. Below are the time frames you may consider.
Setup 1st time frame 2nd time frame
A 1-hour 4-hour
B 4-hour Daily
C Daily Weekly
TABLE 1
Although I have only indicated these time frames, however, you can also trade the smaller time
frames such as the 5-minute, 15-minute or 30-minute time. Personally, I rarely trade those time
frames because institutional traders do not trade these time frames and considered as ‘noise’.
The indicators needed for this method are ADX and MACD together with stochastic on the 1st time
frame to determine the strength of the trend or if it is a ranging market, with MACD and stochastic
oscillator on the 2nd time frame to confirm the entry. Trend lines, Fibonacci and pivot support and
resistance levels apply as usual. Now let’s look at the rules for buy and sell setups.
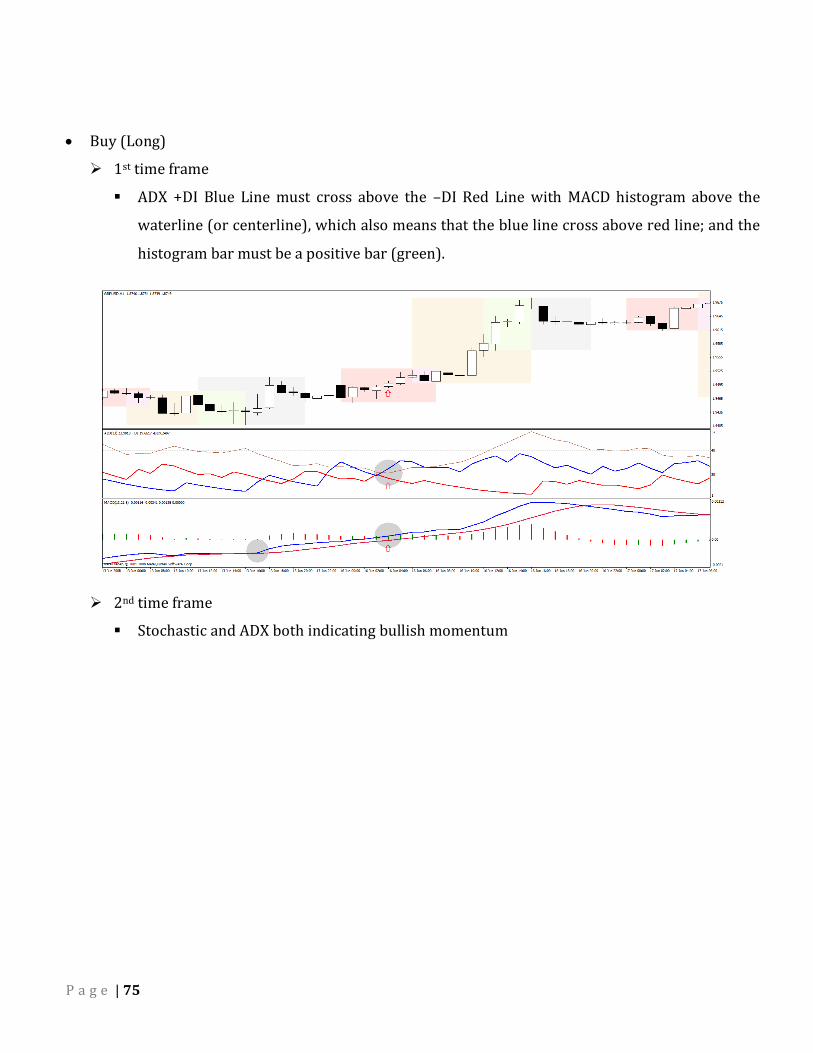
P a g e | 75
Buy (Long)
1st time frame
ADX +DI Blue Line must cross above the –DI Red Line with MACD histogram above the
waterline (or centerline), which also means that the blue line cross above red line; and the
histogram bar must be a positive bar (green).
2nd time frame
Stochastic and ADX both indicating bullish momentum

P a g e | 76
If all of the above conditions above agree,
Scenario A
At the next bar, wait for minor Fibonacci retracement (not more than 61.8%) from the
previous candle’s high on the chart. Open long position at the retracement and set your
stop loss at the recent swing low or near any important support levels.
Scenario B
If the price action does not retrace, open long position at any point of time (the lower
the better) after the bullish candle is formed and set stop loss at recent swing low or
near any important support levels as long as your percentage risk per trade allows.
Set a trailing stop equivalent to your stop-loss. Example: if your stop-loss is 30 pips, then your
trailing stop will be 30 pips.
Other than letting your trailing stop stops you out, you can also set your profit target 10-15
pips from any important resistance levels such as Fibonacci, trend lines or weekly pivots (you
can get all these support and resistance lines at Me website). You can also exit when the MACD
shows a crossover.
IMPORTANT: It is also advisable to take note of ascending and descending trend
lines break. For long signals, break of recent descending line with reversal of
indicators provide the best possible scenario to enter a trend. For sell signal, break
of recent ascending line is also recommended.

P a g e | 77
Sell (Short)
1st time frame
ADX –DI Red Line cross above the +DI Blue Line with MACD histogram must be below the
waterline (or centerline) which also means that the Blue Line cross below Red Line; and
the histogram bar must be a negative bar (red).
FIGURE 3
2nd time frame
Stochastic and MACD both indicating bearish momentum

P a g e | 78
FIGURE 4
If all of the above conditions above agree,
Scenario A
At the next bar, look out for minor Fibonacci retracement levels (not greater than 61.8%)
from the previous candle’s low on the chart. Open short position at the retracement level
and set your stop loss at the recent swing high or near any important resistance levels.
Scenario B
If the price action does not retrace, open short position at any point of time (the higher the
better) after the bearish candle is formed and set stop loss at recent swing high or near any
important resistance levels as long as your percentage risk per trade allows.
Set a trailing stop equivalent to your stop-loss. Example: if your stop-loss is 30 pips, then your
trailing stop will be 30 pips.
Set your profit target 10-15 pips from any important support levels such as Fibonacci, trend
lines or weekly pivots (you can get all these support and resistance lines at the Me website).
MACD crossover near the resistance levels ought to take into consideration as well.
IMPORTANT: If ADX on the 2nd time frame is going opposite direction compared to
the 1st time frame, then the ADX line on the 2nd time frame must show below the 40
marks (not strong) for the setup to be validated, or else no trade even if the
stochastic is showing the correct direction. ADX above 40 marks will supersede the
stochastic indicator.

P a g e | 79
7.3 TRADING SYSTEM I: TRADE EXAMPLE
GBPUSD 09 June 2008 +178 pips
On 09 June 2008 at 1600 GMT, ADX and MACD both indicated that the trend has changed to a
downward movement on the hourly chart (Figure 19 - 1st time frame). Before entering straight away,
I switched to the 4-hour chart (Figure 20 - 2nd time frame) to confirm the signal. Indeed, the stochastic
has crossed and turned lower and although ADX still indicating that the blue line is above the red line,
but it was way below the 40 marks. Hence, this setup was valid.

P a g e | 80
After confirming the final signal on the 2nd time frame, I switched over to hourly and waited for the
price to retrace. However, the next bar did not retrace so I entered at the low of the previous bar
which was 1.9722 with a stop-loss of 48 pips at 1.9770, 61.80% Fibonacci retracement from 1.9722 to
the recent high of 1.9800. The calculator included in this package was used to calculate the Fibonacci
levels.
Please note that I placed the stop-loss at 1.9770 because there was a resistance at 1.9766
which was the 23.6% Fibonacci retracement of 2.1160 to 1.9336. In this case, I felt that
the break of this level again should went up further towards 1.9800 area and I was not
prepared to lose that amount of pips (setting stop-loss at the recent high) for my risk per
trade. I could be wrong, but it turned out to be a good trade after all. Remember to set
your trailing stop as well.
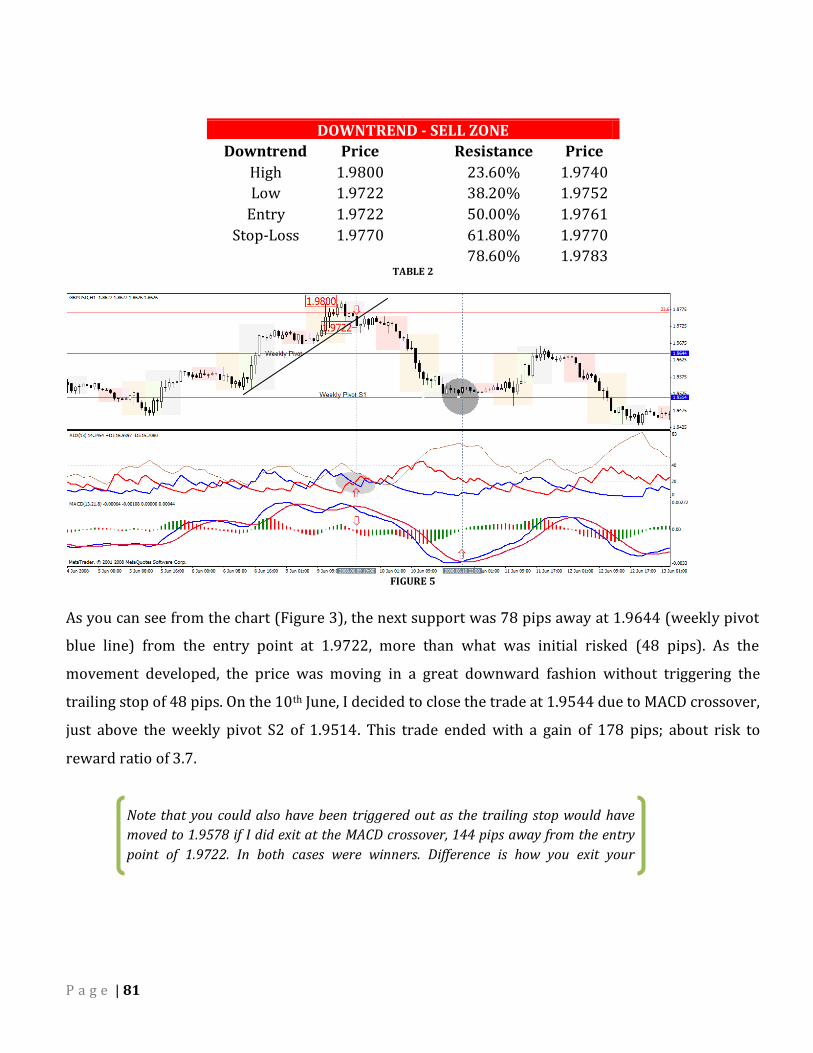
P a g e | 81
DOWNTREND - SELL ZONE
Downtrend Price
Resistance Price
High 1.9800
23.60% 1.9740
Low 1.9722
38.20% 1.9752
Entry 1.9722
50.00% 1.9761
Stop-Loss 1.9770
61.80% 1.9770
78.60% 1.9783
TABLE 2
FIGURE 5
As you can see from the chart (Figure 3), the next support was 78 pips away at 1.9644 (weekly pivot
blue line) from the entry point at 1.9722, more than what was initial risked (48 pips). As the
movement developed, the price was moving in a great downward fashion without triggering the
trailing stop of 48 pips. On the 10th June, I decided to close the trade at 1.9544 due to MACD crossover,
just above the weekly pivot S2 of 1.9514. This trade ended with a gain of 178 pips; about risk to
reward ratio of 3.7.
Note that you could also have been triggered out as the trailing stop would have
moved to 1.9578 if I did exit at the MACD crossover, 144 pips away from the entry
point of 1.9722. In both cases were winners. Difference is how you exit your
position.

P a g e | 82
GBPUSD 29 April 2008 +189 pips
FIGURE 6
On 29 April 2008, GBPUSD pair was on a downtrend, I got a possible setup as both momentum
indicators on ADX and MACD all pointed to the same direction on the hourly chart (see above). I then
proceed to switch to the 4-hour chart to confirm that the oscillator must show bearish momentum
and it did (see below) with break of recent ascending trend line.
FIGURE 7
Scenario B was formed when the price did not retrace but continued to move lower.

P a g e | 83
DOWNTREND - SELL ZONE
Downtrend Price
Resistance Price
High 1.9964
23.60% 1.9904
Low 1.9886
38.20% 1.9916
Entry 1.9886
50.00% 1.9925
Stop-Loss 1.9934
61.80% 1.9934
78.60% 1.9947
TABLE 3
I then set my stop loss at the 61.8% Fibonacci level with a stop-loss of 48 pips because the swing high
was too much for my risk per trade. Later the price continued its way down below the 23.6%
important support level but I did not close the trade due to the candle was still bearish and MACD
shows no sign of crossover yet. As the price continued to drop further, my trailing stop which was
equivalent to my stop-loss of 48 pips shifted lower, however, the price later retraced back and
eventually hit my protective stop at 1.9697, resulted a total of 189 pips gain with a risk to reward
ratio of 3.9.
FIGURE 8
Although I could have gotten out earlier when I saw there was support at the weekly
pivot S2 and MACD has crossed. However, knowing that 100 over pips already in the
pocket, I decided to take the additional risk to let it run but it did not turn out better.
This trade demonstrated that you can take further risk if you have already made more
than 1:1 ratio on the current position.

P a g e | 84
USDJPY 03 April 2008 +164 pips
Earlier you read about the Fibonacci confluence resistance on the USDJPY daily chart (Error!
Reference source not found.). How do we make use of multiple confluences to confirm that the
resistance was strong and if there were any possible trades of opportunity? Let’s continue with this
example by taking a look at the 4-hour chart which is the 1st time frame for this setup.
On the 3rd April 2008, we saw that there were confluences of the weekly pivot resistance level 1, the
38.2% level (blue dotted line) and 23.6% level (red line) near the area between 102.44 and 103.40.
The first indication of the Bull Run losing its steam was when the MACD crossed (shaded in grey)
below the waterline. However, as the ADX was still in the blue and ascending trend line is still intact,
no set up was called up. After few days later, the trend line was broken and we got a trade set up with
both ADX and MACD signaling a bearish momentum. We then switched over to the daily chart to
confirm whether the stochastic oscillator was in agreement with the 4-hour chart.

P a g e | 85
As you can see from the daily chart, the stochastic has already crossed lower and so it confirmed our
entry. ADX below the 40 marks also helped to validate the signal. We then look back to the 4-hour
chart to enter the trade.
From the 4-hour chart, we knew that there were several bounced off from the confluence resistance
which formed a high at 102.83. I entered at the break of the low at 102.16 with a stop-loss at the
61.8% Fibonacci retracement of 102.16 to 102.83 at 102.57, giving me a stop-loss of 41 pips. I also set
the trailing stop to 41 pips.
DOWNTREND - SELL ZONE
Downtrend Price
Resistance Price
High 102.83
23.60% 102.32
Low 102.16
38.20% 102.42
Entry 102.16
50.00% 102.50
Stop-Loss 102.57
61.80% 102.57
78.60% 102.69
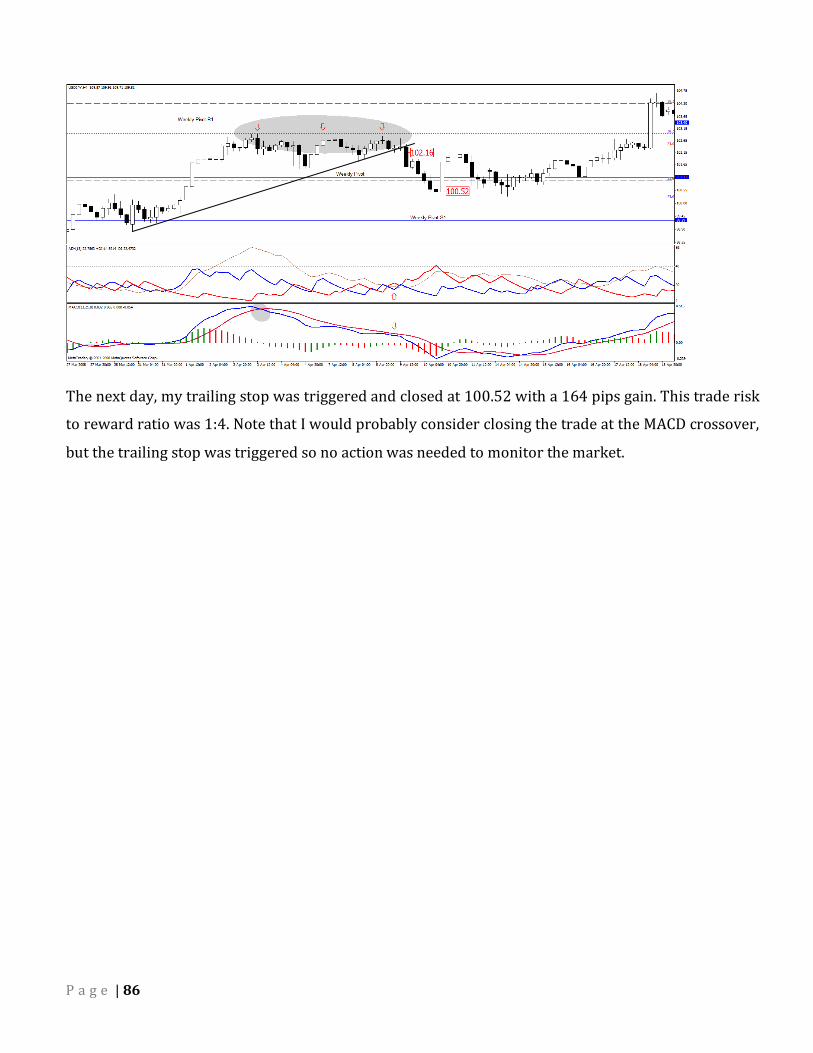
P a g e | 86
The next day, my trailing stop was triggered and closed at 100.52 with a 164 pips gain. This trade risk
to reward ratio was 1:4. Note that I would probably consider closing the trade at the MACD crossover,
but the trailing stop was triggered so no action was needed to monitor the market.

P a g e | 87
GBPUSD 30 April 2008 – almost a setup
Now this is an example of how a potential trade was denied by the 2nd time frame ADX signal. On 30th
April 2008, the GBPUSD currency pair as we can see from the chart below, the price action has turned
to the upside with both ADX and MACD showing bullish momentum together with the bullish candle.
With the 1st time frame (Figure 28) giving a potential setup, I switched to the 4-hour chart and wanted
to confirm if the stochastic has crossed above.
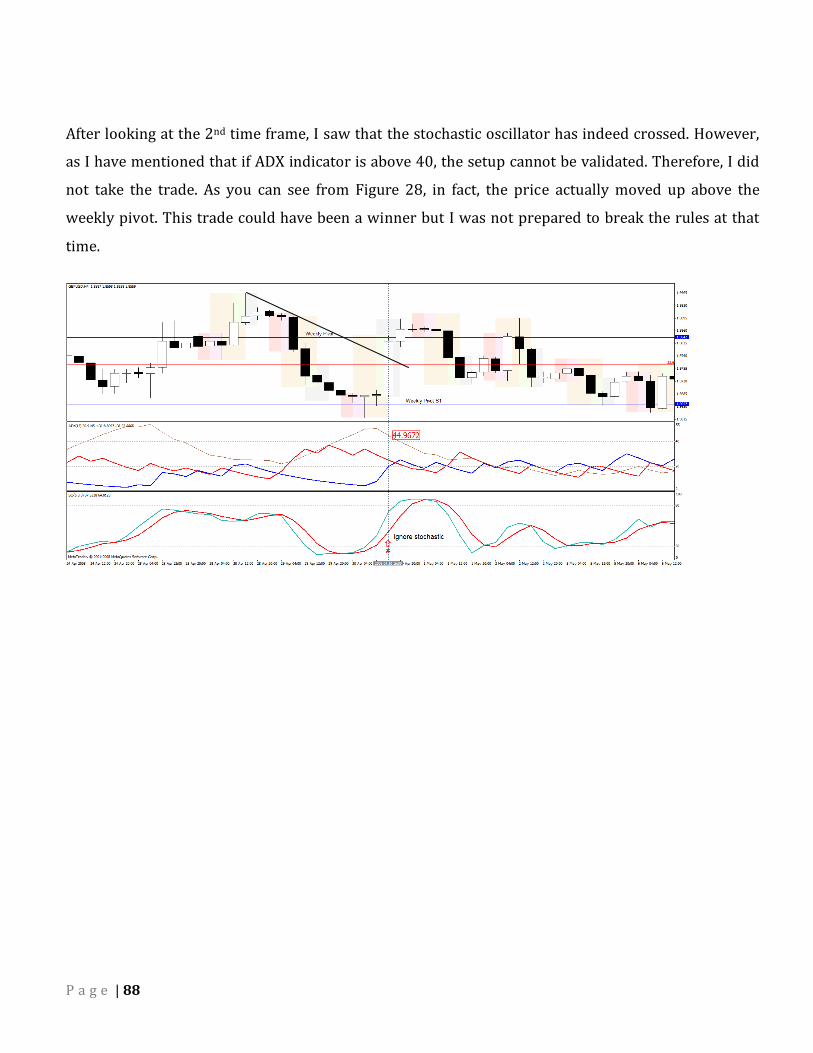
P a g e | 88
After looking at the 2nd time frame, I saw that the stochastic oscillator has indeed crossed. However,
as I have mentioned that if ADX indicator is above 40, the setup cannot be validated. Therefore, I did
not take the trade. As you can see from Figure 28, in fact, the price actually moved up above the
weekly pivot. This trade could have been a winner but I was not prepared to break the rules at that
time.

P a g e | 89
EURJPY 27 August 2008 +52 pips
THIS EXAMPLE WAS A BUY SET UP WHICH WAS DONE LIVE AT TIME OF WRITING RIGHT NOW AS
YOU CAN SEE FROM THE CHART BELOW. I ENTERED AT 160.53 WHICH WAS THE 23.6% OF THE
MINOR RETRACEMENT OF THE RECENT SWING LOW AT 160.04 AT THAT TIME. ADDITIONALLY, IF
YOU FLIP OVER TO LOOK AT THE 15-MINUTES OR 30-MINUTES, IT SHOWED CONFLUENCES OF
UPWARD MOMENTUM SO I FELT IT WAS THE RIGHT MOMENT TO ENTER THE TRADE. THE STOP-
LOSS WAS SET AT 160.04 (49 PIPS).
UPTREND - BUY ZONE
Uptrend Price
Support Price
High 160.69
23.60% 160.54
Low 160.04
38.20% 160.44
Entry 160.53
50.00% 160.37
Stop-Loss 160.04
61.80% 160.29
78.60% 160.18

P a g e | 90
Apart from that, of course, the 4-hour chart stochastic has crossed and ADX indicating a weak
downtrend (below 40) to confirm this setup before I entered the trade.
As time went by, the pair continued to move upwards and the trailing stop of 49 pips was eventually
triggered and stopped out at 161.05, yielded a gain of 52 pips. As you can see, the pair later shot up
and went as high touching the weekly pivot at 161.94. How I wished if it could have been better!
FIGURE 9

P a g e | 91
GBPUSD 27 August 2008 +78 pips
FIGURE 10
This was another trade I took on the same day as the EURJPY pair mentioned above. As we know that
the recent Dollar rally was a huge run, this trade coincided with the bigger picture and naturally it
was an easier set up with vote of confidence knowing that it is aligned with the long term trend. As
you can see from Figure 33, MACD has crossed and ADX was flat with bearish tone (-DI above +DI).
Therefore, I switched over to the 4-hour chart to confirm if the signal can be taken. Let’s take a look at
below Figure 34.

P a g e | 92
On the bigger time frame, we can see that the ADX was flat as well, together with stochastic still fresh
from the top of the overbought zone. This confirmed our setup. I then entered it at the break of the
weekly pivot S1 at 1.8411 with a stop loss of 48 pips at 1.8459.
DOWNTREND - SELL ZONE
Downtrend Price
Resistance Price
High 1.8488
23.60% 1.8429
Low 1.8411
38.20% 1.8440
Entry 1.8411
50.00% 1.8450
Stop-Loss 1.8459
61.80% 1.8459
78.60% 1.8472

P a g e | 93
Now in Figure 35, the price went further down and eventually I was stopped out with a 78-pip gain at
1.8333. The risk to reward ratio for this trade was 1.625.
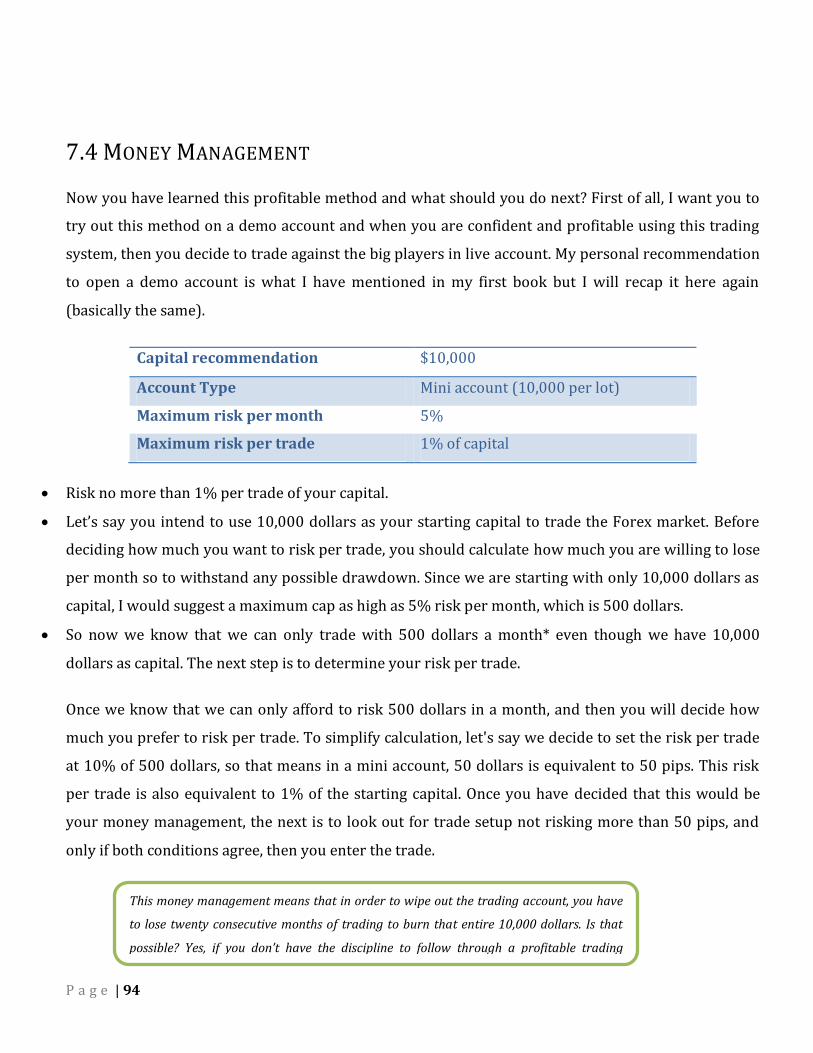
P a g e | 94
7.4 MONEY MANAGEMENT
Now you have learned this profitable method and what should you do next? First of all, I want you to
try out this method on a demo account and when you are confident and profitable using this trading
system, then you decide to trade against the big players in live account. My personal recommendation
to open a demo account is what I have mentioned in my first book but I will recap it here again
(basically the same).
Capital recommendation $10,000
Account Type Mini account (10,000 per lot)
Maximum risk per month 5%
Maximum risk per trade 1% of capital
Risk no more than 1% per trade of your capital.
Let’s say you intend to use 10,000 dollars as your starting capital to trade the Forex market. Before
deciding how much you want to risk per trade, you should calculate how much you are willing to lose
per month so to withstand any possible drawdown. Since we are starting with only 10,000 dollars as
capital, I would suggest a maximum cap as high as 5% risk per month, which is 500 dollars.
So now we know that we can only trade with 500 dollars a month* even though we have 10,000
dollars as capital. The next step is to determine your risk per trade.
Once we know that we can only afford to risk 500 dollars in a month, and then you will decide how
much you prefer to risk per trade. To simplify calculation, let's say we decide to set the risk per trade
at 10% of 500 dollars, so that means in a mini account, 50 dollars is equivalent to 50 pips. This risk
per trade is also equivalent to 1% of the starting capital. Once you have decided that this would be
your money management, the next is to look out for trade setup not risking more than 50 pips, and
only if both conditions agree, then you enter the trade.
This money management means that in order to wipe out the trading account, you have
to lose twenty consecutive months of trading to burn that entire 10,000 dollars. Is that
possible? Yes, if you don’t have the discipline to follow through a profitable trading
system.

P a g e | 95
7.5 TRADING SYSTEM II: THE METHODOLOGY
The book already cover basic indicators and chart analysis. In addition to My trading Strategy an additional
strategy is presented in the topics below. The forth coming strategy can be said as discretionary or systematic
trading system. However fundamental analysis can be incorporated into the strategy to gain high probability
with huge profit.
The strategy is short term trading strategy and has solid exit rules; to protect profit meanwhile allows riding
trend. The strategy hunts for momentum on smaller timeframe. Chart setup includes EMA (Exponential Moving
Average) and MACD (Moving Average Convergence Divergence).

P a g e | 96
7.6 TRADING SYSTEM II: THE METHOD
Strategy Setup
The strategy was developed to work on 15 minute chart. The strategy makes use of two indicators
including 20-period exponential moving average. Exponential Moving average is used as trend indicator, which
places more stress on recent values. MACD (Moving Average Convergence Divergence) is used in this strategy
to measure momentum. Default MACD histogram setting could be used which is 12, 26 and signal EMA = 9.
Long Trade Rule
1) Look for currency Pair with trading price less than 20 period EMA (exponential moving average).
2) Ensure MACD is in negative area.
3) Wait for the price to cross above 20-period EMA, and MACD to be in process of crossing into or has
crossed into the positive area, no longer than 10 bars ago.
4) Trigger long trade, 10 pips above 20-period EMA.
Stoploss Placement
Place stoploss 50 pips below the 20-period EMA. For aggressive trader stoploss could be placed at
swing low.

P a g e | 97
Exit Rule
Close half of the position when profit is equals to amount risked.
Trail stop at 20-period EMA or by higher breakeven pips.
Short Trade Rule
1. Look for currency pair with trading price above 20-period EMA (exponential moving average).
2. Ensure MACD is in positive region.
3. Wait for the price to cross below 20-period EMA, and MACD to be in process of crossing in the or has
crossed into the negative area, no longer than 10 bars ago.
4. Trigger short trade, 10 pips below 20-period EMA.
Stoploss Placement
Place stoploss 50 pips above the 20-period EMA. For aggressive trader stoploss could be placed at
swing high.
Exit Rule
Close half of the position when profit is equals to amount risked.
Trail stop at 20-period EMA or by higher breakeven pips.
Incorporating Fundaments
You can incorporate fundaments and other multi timeframe analysis into the strategy to increase the
predictability and profitability of the trading strategy. Importance of fundaments factors changes over time,
however some of the factor are outlined below which can be used to predict whether the currency pair will be
ranging or trending.
Following are some of the analysis that could be done on major currency pair, once a pair with strong
fundament is identified which has clear trend then the above strategy could be applied to it.
Risk reversals near choice or flipping between favoring calls and puts usually depict a ranging pair. Whereas
risk reversals strongly bid for puts and call indicating trending market.
Analyze SSI (Speculative sentiment index) to get bias on each pair.

P a g e | 98
7.7 TRADING SYSTEM II: TRADE EXAMPLE
GBPUSD 4 February 2009 +100 pips
Price crosses 10 pips above 20-period EMA, and MACD histogram shifted from negative to positive
area which denote momentum necessary for long trade.
This is one of the trade examples, using the strategy. Indicators gauges momentum and thus pin point
entry point. Whereas, money management enables the strategy to lock profit as well as ride the
underlying trend.
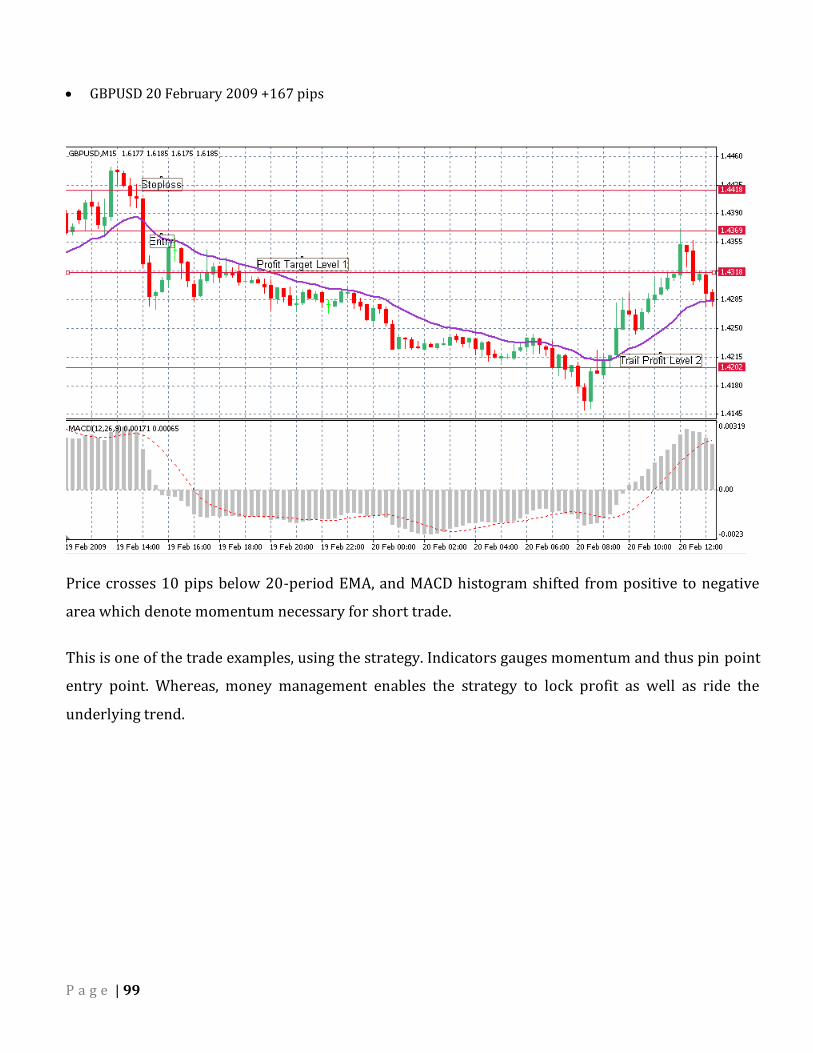
P a g e | 99
GBPUSD 20 February 2009 +167 pips
Price crosses 10 pips below 20-period EMA, and MACD histogram shifted from positive to negative
area which denote momentum necessary for short trade.
This is one of the trade examples, using the strategy. Indicators gauges momentum and thus pin point
entry point. Whereas, money management enables the strategy to lock profit as well as ride the
underlying trend.
P a g e | 100
CHAPTER 8
COMMON MISTAKES
"All I ask is the chance to prove that money can't make me happy." Spike Milligan
P a g e | 101
8.1 PSYCHOLOGY OF TRADING
Psychology of trading is yet another important aspect of trading. Many intelligent people lose large capital
while trading however in their non trading careers they are very success full and has accumulated large
sums of money.
The thing that separate winners from the losers in trading is not how accurately someone picks entry
points. But the factors how they will manage the trade after they have taken the trade and how they stick to
their money management plan once they are on the trade.
Large majority of the traders do not understand that psychology plays a vital role in money management
and they should conduit their emotions correctly while trading.
The Effect of Trading Losses
We are taught by the environment of the importance of always being right. There is always a fear in us of
not being wrong and the need to always be right. But this mentality does not go with trading.
Most trading systems that are proved successful takes lots of small losses and then make a big gain on a few
winning trades. Unfortunately most of the traders do not have mental toughness lot of losing trades and
give up the trading system prematurely, and hurl a profitable trading system without giving it an adequate
chance.
Destroy Your Trading Account
A common mistake in virtually all type of trading is holding a trade even the market continues to move
against the trade. It was quoted by the renowned economist John Keynes Maynard
“The markets can remain irrational longer than you can remain solvent”
Another major factor that differentiate successful trader from the one who is unsuccessful is that a wise
trader move to next trade when the market does not act according to his anticipation.

P a g e | 102
8.2 COMMON MISTAKES
NEVER RISK MORE THAN 2% PER TRADE
One of the cardinal rules which is also the most desecrated rules in trading is that traders lose substantial
amount of their account equity in one single trade by taking too much risk. You will find hundred of stories of
traders who lose years of profits on a single trade that goes terribly wrong. This is the chief cause why the 2%
stop-loss rule should not be violated.
The table below demonstrates that large losses are extremely difficult to overcome
Amount of Equity Loss Amount of Return Necessary to Re-store to Original
25% 33% 50% 100% 75% 400% 90% 1000%
Let’s assume you begin trading with $10,000 and loss 50% of your capital which in dollar terms is $5000. So in
order to breakeven and overcome the losses you now need 100% gain of on your remaining equity. The best
way to avoid this is to have proper risk management and to avoid large losses. For this reason the 2% rule hold
utmost importance in trading. If you limit 2% loss per trade this means that you can sustain 10 consecutive
losing streaks in a row with a total draw down of 20% of you account equity.
LOGIC WINS, IMPULSE KILLS
Trader blew up their account more by trading impulsively than by any other mistake. If you ask a beginner
trader the reason for taking a long position on a currency pair, you might hear the answer, “Because it has gone
down enough – so now it’s bound to go positive.” This is an example of impulsive trading and wishful thinking;
the trade decision is not based on a logical reason.
More money has been lost by trading impulsively than by any other means. Ask a novice why he went long on a
currency pair and you will frequently hear the answer, “’Cause it’s gone down enough - so it’s bound to
bounce.” We always roll our eyes at that type of response because it is not based on reason - it’s nothing more
than wishful thinking.
Trading impulsively is merely playing the game of Russian roulette. Logical trading is extra precise than
impulsive trading.
Trading impulsively is simply gambling. It can be a huge rush when the trader is on a winning streak, but just
one bad loss can make the trader give all of the profits and trading capital back to the market. Logical trader

P a g e | 103
will know where to take profit and stop loss if trade goes against him, whereas impulsive traders are only one
trade away from bankruptcy.
ADDING TO A LOSER
Most of the time trader increase their position size and keep on adding to them if trade goes against them. This
is a martingale technique in which traders desperately hope that a reversal will occur and their losses will
convert to profit. However doing so increases the exposure while the trade goes in loss. In such scenarios a
smart trader will typically close the position and head toward next trade.
NEVER LET A WINNER TURN INTO A LOSER
It is not uncommon to see a trade go up by 30 pips in couple of minute and then it completely reverses to hit
your stop loss at 40 pips in a short while.
Traders should learn to protect their profits. There are two easy ways to protect your capital and banking pips.
You can add trailing stop to your orders. The second method is to use multiple lots and exit positions on
different levels including a trailing stop.
There is nothing worse than watching your trade be up 30 points one minute, only to see it completely reverse
a short while later and take out your stop 40 points lower.

P a g e | 104
CHAPTER 9
PUTTING IT ALL TOGETHER
"The secret to creativity is knowing how to hide your sources." Albert Einstein

P a g e | 105
9.1 CREATING A BUSINESS PLAN
Many business fail due to their lack of planning and failure to create a business plan to follow. Creating a
business plan give the trader a sense of direction that they are trying to reach. It set goals, and plan to execute.
Most successful traders will agree that trading is not different than business and in order to be successful in
trading you should have clear and written business plan.
Following are some of the things which should be included into your business plan for trading.
What are your reasons for which you want to become a trader?
What do you hope to achieve from trading?
Be specific here. If the possibility of making a lot of money has drawn you towards trading then list out
how much money you want to make from trading and what you plan to do with that money if you make
it.
What are the things that are going to separate you from the large majority of traders who fail?
What are your biggest weaknesses?
How do you plan to address your weaknesses and leverage your strengths?
How much time can you devote towards actively following the market?
Do you plan to day trade, swing trade, position trade or a combination of the three? Does your choice
here reflect the time you have to devote to the markets?
What market or markets do you plan to trade and why?
At what times throughout the day are you going to spend actually trading, researching trades, and then
learning about the market?
What are your criteria for entering a trade?
What are your criteria for exiting a trade?
What is your money management strategy?
How will you know if one of the pieces of your strategy stops working?
After identifying that one of the pieces of your strategy has stopped working what will you do to
address it?
What trading software and equipment you will use to trade and how much is it?
What Broker/Brokers will you use?
Do you plan to add money to your account and if so where is that money going to come from?
If you are profitable do you plan to reinvest profits or withdraw some or all of them?
If you plan to trade full time how you will support yourself if you aren’t profitable right away.
How much money do you plan to start to trade with? Does the math work out when considering taxes,
all costs, living expenses and your initial trading balance?
Those who take time to think about and write down the business plan under these heading generally have a
higher chance of success.

P a g e | 106
9.2 MAINTAINING A TRADING JOURNAL
There is an old saying learn from your mistakes, for traders it mean to maintain a trading journal. Successful
trader looks at each experience or loss as a chance to learn and grow. Trader openness to leaning from their
trades differential profitable and unprofitable trader. A trader should be willing to put effort to prepare a
document for recoding his trades and from time to time review each trade.
Trading journals could be used to document trades. You can simply write down details of your trades in a
notebook or a word document. However using spread sheet software like (excel) provides you more flexibility
and handy analysis options.
Below are 10 things that in my opinion it is important to document about each trade. :
1. What were the market conditions for that day or trade?
2. Why you take the trade, entry date, time and price.
3. Reason for exiting the trade with date, time and price at which you close the trade.
4. Was the trade short terms or long term?
5. Comment on market condition from the time you entered till you close the position.
6. Money management rules that used for the trade.
7. If possible attach a chart with your analysis.
8. Address you weakness for the particular trade or day.
9. Address your strength for that day or trade.
10. You can also add additional comments which you though might be help full.
P a g e | 107
FINAL THOUGHT
I hope that you enjoyed reading my latest strategy. I still classified it under My Trading Strategy
trading systems because I do not want to confuse you with too many titles and names. That is also to
identify in the Forex market that whenever you hear about someone using My Trading Strategy
systems, you know that they are talking about Me.
Importantly, I am delighted that you have chosen My Trading Strategy 2 out of so many trading
systems out there. It is my pleasure and honor to share you my second strategy which I felt could be
your answer to profitable Forex trading. This eBook took quite a while to release because of the
complexity and additional effort to explain everything, not forgetting that the tediousness of cut and
paste the charts. I am not like some other online traders who hired professional writers to write out
their eBooks because I want to be sure of what I am trying to convey to you are what I am thinking
actually. In fact, if you have noticed, I actually put the explanation of the trading system on the first
part of this eBook because the initial part of reading is usually the most alert and absorb the most.
Lastly, while I did try my best to explain whatever I can put in words, I cannot assure that what you
have read here is the complete mind-mapping of what I am thinking. If you think that you need
further help on troubleshooting the trades that you have done, you may also want to consider after
the completion of reading this trading system, you may subscribe to my personal coaching via emails
at a very minimal fee for 6 months. Rest assured that I will answer all questions on the My Trading
Strategy systems within 24 hours.