fwra’s 2016 report - food waste reduction · pdf filesurvey methodology introduction 2...
TRANSCRIPT
FALL 2016
A joint project by the Food Marketing Institute, the Grocery Manufacturers Association & the National Restaurant Association
ANALYSIS OF U.S. FOOD WASTE AMONG FOOD MANUFACTURERS, RETAILERS, AND RESTAURANTS
2
Since 2012, the Food Waste Reduction Alliance (FWRA), a collaborative effort between the Food Marketing Institute (FMI), Grocery Manufacturers Association (GMA), and National Restaurant Association (NRA) has conducted a survey every two years to collect data from food manufacturers, food retailers and wholesalers, and restaurants in order to understand the current state of food waste as well as how the collection and processing of food waste has changed and progressed since previous surveys. This is the third report of from the FWRA which analyzes food waste data gathered from FMI, GMA, and NRA members to improve understanding of the scale and nature of food waste generation and disposal and to spur knowledge, innovation, and action to reduce food waste in the food supply chain.
This data was collected through a survey developed by the FWRA and sent to manufacturing, wholesale, retail, and restaurant companies by the FMI, GMA, and NRA. Deloitte Consulting LLP was engaged to lead interpretation and analysis of the results.
Variations in survey respondents over the years prevents year-on-year comparisons and means FWRA is unable to draw industry-wide trends from one report to the next. Looking forward, the FWRA membership has decided that this will be the final survey conducted so that the organization can focus instead on addressing many of the needs uncovered in the results.
About FMI
Food Marketing Institute proudly advocates on behalf of the food retail industry. FMI’s U.S. members operate nearly 40,000 retail food stores and 25,000 pharmacies, representing a combined annual sales volume of almost US$770 billion. Through programs in public affairs, food safety, research, education, and industry relations, FMI offers resources and provides valuable benefits to more than 1,225 food retail and wholesale member companies in the United States and around the world. FMI membership covers the spectrum of diverse venues where food is sold, including single-owner grocery stores, large multistore supermarket chains, and mixed retail stores. For more information, visit www.fmi.org, and for information regarding the FMI Foundation, visit www.fmifoundation.org.
ABOUT THIS REPORT

3
About GMA
The Grocery Manufacturers Association is the voice of more than 300 leading food, beverage, and consumer product companies that sustain and enhance the quality of life for hundreds of millions of people in the United States and around the globe. Based in Washington, D.C., GMA’s member organizations include internationally recognized brands as well as steadily growing, localized brands. Founded in 1908, GMA is an active, vocal advocate for its member companies and a trusted source of information about the industry and the products consumers rely on and enjoy every day. The association and its member companies are committed to meeting the needs of consumers through product innovation, responsible business practices, and effective public policy solutions developed through a genuine partnership with policymakers and other stakeholders. For more information, visit www.gmaonline.org.
About NRA
Founded in 1919, the National Restaurant Association is the leading business association for the restaurant industry, which comprises more than one million restaurant and foodservice outlets and a workforce of 14.4 million employees. The Association represents the industry in Washington, D.C., and advocate on its behalf. It operates the industry's largest trade show (NRA Show); leading food safety training and certification program (ServSafe); unique career-building high school program (the NRAEF's ProStart); as well as the Kids LiveWell program promoting healthful kids' menu options. For more information, visit Restaurant.org.
About Deloitte
Deloitte Consulting LLP’s Sustainability Offering works with clients to find new opportunities and manage risk by bringing expertise in energy, waste, and materials to operations and supply chains. Deloitte’s Sustainability professionals take a practical and business-focused approach to helping companies build sustainability into their strategy and operations as a way to improve and protect margins, build brand value, and enhance risk resilience with the goal of supporting business growth. We work with companies to evaluate and develop sustainable strategies that can help drive toward near-term and long-term results. By applying technical knowledge along with industry expertise and leading analytics solutions, our sustainability consultants have helped clients execute strategies that have led to more than $3Billion in value. https://www2.deloitte.com/us/en/pages/operations/solutions/about-our-sustainability-service.html
4
© COPYRIGHT 2016 by Food Marketing Institute, Grocery Manufacturers Association, and National Restaurant Association. Reproduction of “Analysis of U.S. Food Waste Among Food Manufacturers, Retailers, and Restaurants” in any form is prohibited except with prior written permission of the Food Marketing Institute (FMI), Grocery Manufacturers Association (GMA), and National Restaurant Association (NRA). FMI, GMA, and NRA do not guarantee the accuracy, adequacy, completeness, or availability of any information and are not responsible for any errors or omissions or for the results obtained from the use of such information. FMI, GMA, AND NRA GIVE NO EXPRESS OR IMPLIED WARRANTIES, INCLUDING, BUT NOT LIMITED TO, ANY WARRANTIES OF MERCHANTABILITY OR FITNESS FOR A PARTICULAR PURPOSE OR USE. In no event shall FMI, GMA, and NRA be liable for any ingredient, special, or consequential damages in connection with any use of “Analysis of U.S. Food Waste Among Food Manufacturers, Retailers, and Restaurants.”

5
Introduction 7 Survey Methodology 8 Definitions 9 Structure of Findings 11
Summary of Survey Findings 12 Survey Findings: Manufacturing Sector 12
Sector Context 13 Food Waste Diversion 14 Barriers to Diversion 17 Areas of Investment 19
Survey Findings: Retail/Wholesale Sector 20 Sector Context 20 Food Waste Diversion 21 Barriers to Diversion 24 Areas of Investment 26
Survey Findings: Restaurant Sector 27 Sector Context 27 Food Waste Diversion 28 Barriers to Diversion 31 Areas of Investment 34
Next Steps 35 Opportunities 35
Appendix 1: Assumptions & Accuracy 37 Appendix 2: Food Loss and Waste Standard Alignment 39 Appendix 3: 2016 Food Manufacturer and Retailer Food Donation & Food
Waste Survey 41
Appendix 4: 2016 Restaurant Food Donation & Food Waste Survey 46
TABLE OF CONTENTS
6
Figure 1. Environmental Protection Agency, Hierarchy of Food Recovery 10 Figure 2. Destination of Food Waste (in pounds), Manufacturing Respondents 2016 14 Figure 3. Destination of Food Waste (in pounds) by Company Size, Manufacturing Respondents
2016 14
Figure 4. Diverted Food Waste (in pounds), Manufacturing Respondents 2016 15 Figure 5. Diverted Food Waste (in pounds) by Company Size, Manufacturing Respondents 2016 16 Figure 6. Barriers to Donation, Manufacturing Respondents 2012-2016 17 Figure 7. Barriers to Recycling, Manufacturing Respondents 2012-2016 18 Figure 8. Areas of Investment, Manufacturing Respondents 2016 19 Figure 9. Destination of Food Waste (in pounds), Retail/Wholesale Respondents 2016 21 Figure 10. Destination of Food Waste (in pounds) by Company Size, Retail/Wholesale
Respondents 2016 21
Figure 11. Diverted Food Waste (in pounds), Retail/Wholesale Respondents 2016 22 Figure 12. Diverted Food Waste (in pounds) by Company Size, Retail/Wholesale Respondents
2016 23
Figure 13. Barriers to Donation, Retail/Wholesale Respondents 2012-2016 24 Figure 14. Barriers to Recycling, Retail/Wholesale Respondents 2012-2016 25 Figure 15. Areas of Investment, Retail/Wholesale Respondents 2016 26 Figure 16. Destination of Food Waste (in pounds), Restaurant Respondents 2016 28 Figure 17. Destination of Food Waste (in pounds) by Company Size, Restaurant Respondents
2016 28
Figure 18. Diverted Food Waste (in pounds), Restaurant Respondents 2016 29 Figure 19. Diverted Food Waste (in pounds) by Company Size, Restaurant Respondents 2016 30 Figure 20. Barriers to Donation, Restaurant Respondents 2012-2016 32 Figure 21. Barriers to Recycling, Restaurant Respondents 2012-2016 33 Figure 22. Areas of Investment, Restaurant Respondents 2016 34
TABLE OF FIGURES

7
In 2011, the Grocery Manufacturers Association (GMA), the Food Marketing Institute (FMI), and the National Restaurant Association (NRA) came together to form a coalition to address the issue of food waste in the United States. This coalition, the Food Waste Reduction Alliance (FWRA), has three main goals, to:
Reduce the amount of food waste generated;
1. Increase the amount of safe, nutritious food donated to those in need; and
2. Recycle unavoidable food waste, diverting it from landfills.
FWRA currently has four workstreams focused on meeting these goals: 1) measuring and assessing food waste in the U.S., 2) identifying new technologies and solutions to help reduce food waste and divert waste from landfills, 3) identifying and advocating for policies that incentivize or expand the ability to donate and recycle food waste, and 4) communicating our efforts to relevant stakeholders.1
As a part of our workstream around measuring and assessing food waste, FWRA conducts a survey every two years to collect data from food manufacturers, food retailers and wholesalers, and restaurants in order to understand the current state of food waste as well as how the collection and processing of food waste has changed and progressed since previous surveys. The following report details the findings of FWRA’s third survey conducted in 2016. We are excited to share the progress made across food industries to reduce food waste.
1 About Our Work, Food Waste Reduction Alliance.
INTRODUCTION
8
Restaurant Respondents
Number of Respondents 28
Respondents’ Self-Reported Annual Sales $92.4B
Industry Annual Sales $ 783B5
Percentage of U.S. Industry Represented (Based on Sales) 11.8%
Manufacturing Respondents
Number of Respondents 9
Respondents’ Self-Reported Annual Sales2
$55.8B
Industry Annual Sales $896.0B3
Percentage of U.S. Industry Represented (Based on Sales)
6.2%
Retail/Wholesale Respondents
Number of Respondents 24
Respondents’ Self-Reported Annual Sales $300.2B
Industry Annual Sales $851.1B4
Percentage of U.S. Industry Represented (Based on Sales) 35.3%
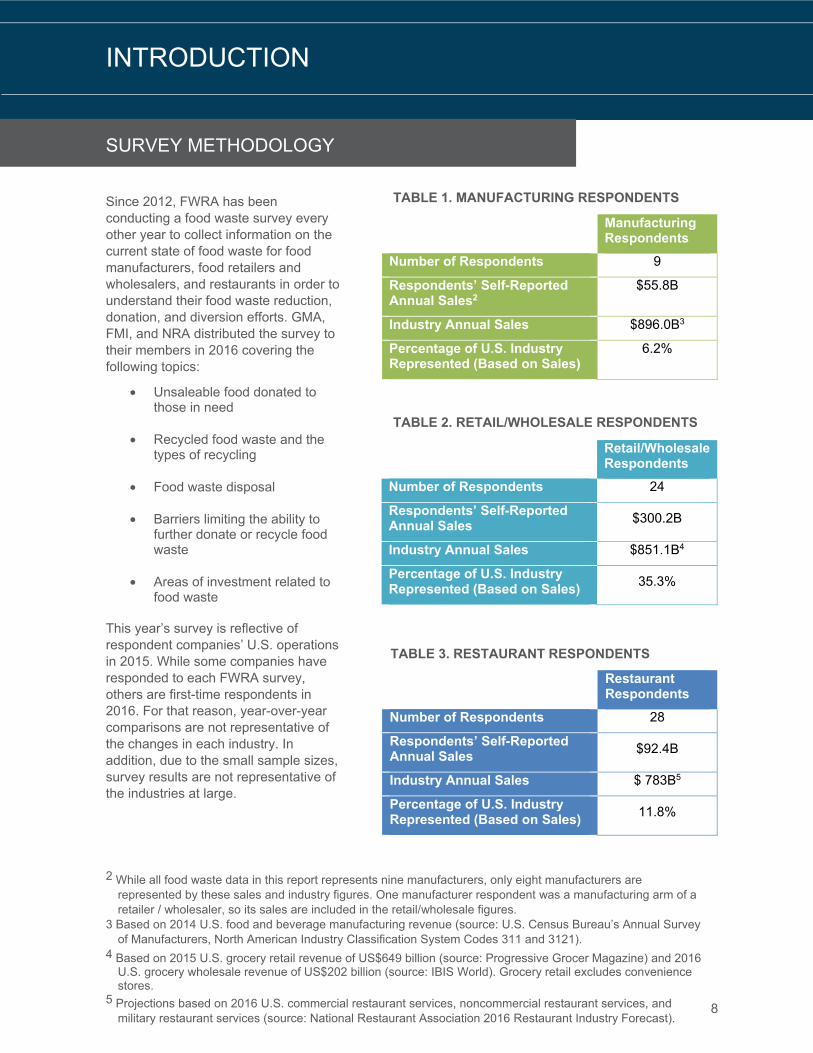
Since 2012, FWRA has been conducting a food waste survey every other year to collect information on the current state of food waste for food manufacturers, food retailers and wholesalers, and restaurants in order to understand their food waste reduction, donation, and diversion efforts. GMA, FMI, and NRA distributed the survey to their members in 2016 covering the following topics:
• Unsaleable food donated to those in need
• Recycled food waste and the types of recycling
• Food waste disposal
• Barriers limiting the ability to further donate or recycle food waste
• Areas of investment related to food waste
This year’s survey is reflective of respondent companies’ U.S. operations in 2015. While some companies have responded to each FWRA survey, others are first-time respondents in 2016. For that reason, year-over-year comparisons are not representative of the changes in each industry. In addition, due to the small sample sizes, survey results are not representative of the industries at large.
TABLE 1. MANUFACTURING RESPONDENTS
TABLE 2. RETAIL/WHOLESALE RESPONDENTS
TABLE 3. RESTAURANT RESPONDENTS
SURVEY METHODOLOGY
INTRODUCTION
2 While all food waste data in this report represents nine manufacturers, only eight manufacturers are represented by these sales and industry figures. One manufacturer respondent was a manufacturing arm of a retailer / wholesaler, so its sales are included in the retail/wholesale figures.
3 Based on 2014 U.S. food and beverage manufacturing revenue (source: U.S. Census Bureau’s Annual Survey of Manufacturers, North American Industry Classification System Codes 311 and 3121).
4 Based on 2015 U.S. grocery retail revenue of US$649 billion (source: Progressive Grocer Magazine) and 2016 U.S. grocery wholesale revenue of US$202 billion (source: IBIS World). Grocery retail excludes convenience stores.
5 Projections based on 2016 U.S. commercial restaurant services, noncommercial restaurant services, and military restaurant services (source: National Restaurant Association 2016 Restaurant Industry Forecast).

9
INTRODUCTION
DEFINITIONS
Please refer to the below definitions of food waste related terminology used throughout this report. These definitions have been updated to align with the new World Resources Institute Food Loss and Waste Protocol, one of many steps FWRA is taking to support the Protocol.6
• Food waste: Any solid or liquid food substance, raw or cooked, which is discarded, or intended or required to be discarded. Food waste includes the organic residues (such as carrot or potato peels) generated by the processing, handling, storage, sale, preparation, cooking, and serving of food.
• Food waste diversion: Pertains to all food that is not sold or consumed, which could be diverted to a higher value use than landfill or incineration. This includes:
o Unsaleable food donation given to food banks and other organizations that serve people in need; and7
o Food waste reuse and recycling, e.g., composting, conversion to animal feed, reuse of waste oils to produce fuel, etc.
• Food waste disposal: Food or food scraps that are transported to traditional disposal facilities, such as landfills, municipal waste incinerators, and wastewater treatment plants.
• Food waste generation: The sum of food waste diversion and food waste disposal.
• Unsaleable food: Consumer products that are removed from the primary channel of distribution for any reason and that may or may not be processed through product reclamation centers. Unsaleable food may be generated throughout the manufacturing and retail value chain, as described in the following examples. Mistakes during production may result in food that is perfectly safe and edible, but unable to be sold because of quality, overproduction, or labeling issues. Product ingredients and semi-finished products that are unsuitable for retail but are safe for human consumption may also be donated. The outer packaging of grocery items may become damaged during distribution and retail operations, thus making them unsuitable for sale but still perfectly safe to eat. Fresh food such as day-old bread, produce with blemishes, prepared foods, and other perishable items that are near sell-by dates may also be unsuitable for sale, but safe for consumption.
6 More information on the Food Loss & Waste Protocol is available at http://flwprotocol.org/. 7 Not all companies track their saleable and unsaleable food donations as separate figures, so the amount of
donated food cited in this report does include some saleable food. Where possible, only unsaleable food is included.

10
DEFINITIONS
INTRODUCTION
As part of the efforts to reduce overall food waste and the amount of food waste disposed of, the Environmental Protection Agency (EPA) developed a Food Recovery Hierarchy that ranks, from most preferred to least preferred, the efforts to reduce and divert food waste. While not all diversion methods are appropriate for all types of food waste, this hierarchy provides a guide for companies and organizations to try to choose the best approach to reduction or diversion method to do the most environmental, social, and economic good. See Figure 1 below for the EPA’s Food Recovery Hierarchy.8
FIGURE 1. ENVIRONMENTAL PROTECTION AGENCY, HIERARCHY OF FOOD RECOVERY
8 Food Recovery Hierarchy, U.S. Environmental Protection Agency
11
STRUCTURE OF FINDINGS
INTRODUCTION
The next section of this report provides an overall summary of the survey findings followed by dedicated findings sections for each of the three industries surveyed: manufacturing, retail/wholesale, and restaurant. Each industry section outlines overall destinations of food waste including donated, recycled, and disposed of food as well as the types of recycling diversions utilized by companies in the sector (e.g., composting, animal feed, etc.). In addition to food waste destinations, each section details both the sector’s top barriers to increasing both donation and recycling efforts as well as the sector’s top areas of investment related to food waste.
Following each individual sector’s findings, the report summarizes food waste trends and identifies common recommendations and opportunities for future improvement. Throughout the report, we have endeavored to provide insight into the progress being achieved in food waste reduction by individual companies and industries. While there is still tremendous opportunity to seize, we believe the improvements made to date are notable and exciting and set the stage for ongoing food waste reduction.

12
While there were a few similarities across sectors, findings from the 2016 FWRA Food Waste Survey differed by sector due to the unique attributes of each industry.
One resounding theme across all sectors was the challenge that many companies face in accurately measuring and tracking food waste. This year, 49% of respondents were unable to provide data regarding the quantity of food waste their companies disposed. Due to this data limitation, we are unable to get a clear picture of how disposed of food waste compares to the amount of food donated and amount of food waste recycled, even though data on donations and recycling is generally strong. This lack of data highlights a continued opportunity to improve baseline waste data collection across all three sectors.
Additional highlights across sectors include:
• Donated food made up 3.3% of total unsaleable food and 4% of the unsaleable food that was diverted from landfill. The largest percent of reported donated food came from the retail/wholesale sector.
• Animal feed and land application received the largest percentages of diverted food waste: 84% of food waste was diverted to these two destinations, primarily from the manufacturing sector.
• Transportation constraints was the most often cited barrier to donating and recycling—41% and 49% of respondents identified it as a barrier to donation and to recycling, respectively.
• 58% of respondents are investing in increasing food donation for those in need, making it the most often cited investment area.
• Investments made by respondents are high across all industries, with 40-50% or more respondents indicating investment in four out of five areas.
Significant progress and investments have been made in a variety of areas across sectors, but there are still many opportunities for improvement in food waste reduction and diversion. FWRA’s efforts to research and communicate best practices and new solutions in the food waste arena are key to engaging companies across all sectors to help them to share best practices and successes and address ongoing food waste challenges.
SUMMARY OF SURVEY FINDINGS

13
Size Definition # of Respondents
Small <$5 billion 2
Medium >$5 billion and <$10 billion 3
Large >$10 billion 3
SURVEY FINDINGS: MANUFACTURING SECTOR
SECTOR CONTEXT
In the 2016 survey, we received responses from nine food manufacturers with combined total annual sales of $55.8 billion.9 These manufacturers also represent over 275 manufacturing locations and over 760 food warehouses. Each manufacturer respondent was categorized by annual sales figures to analyze trends based on the size of the company. Below is a breakdown of manufacturing respondents by size (defined as sales):
SURVEY FINDINGS: MANUFACTURING SECTOR
• 94% of diverted food waste was repurposed as animal feed or for land application • The top barrier to food donations for manufacturing respondents was regulatory
constraints (56% of respondents) • The top barrier to food waste recycling for manufacturing respondents was insufficient
recycling options (78% of respondents) • The number of manufacturers investing in food waste related solutions is very similar
across all categories of investment, although large manufacturers have the highest rates of investment (100% of large manufacturers are investing in four of the five food waste investment areas)
TABLE 4. MANUFACTURING RESPONDENTS BY COMPANY SIZE
Within the manufacturing sector, there are industry-specific considerations that affect the type of food waste produced and determine both the advantages and challenges manufacturers encounter when looking to reduce or divert food waste. Unlike other food-related businesses, manufacturing food waste is generally much higher in volume and is generated at a limited number of locations. Additionally, manufacturers often have higher predictability in the quantity and types of food waste generated in a given amount of time. For example, a facility that makes frozen french fries will consistently have a high volume of potato peels as food waste.
While the predictability and limited locations of food manufacturers allows for better planning and control of food waste diversion, the type of food waste generated, such as peels and trimmings, limits manufacturers’ ability to easily donate unsaleable food. For this reason, manufacturers tend to divert significant volumes of food waste to recycling, especially land application and animal feed. In fact, it is estimated that 95% of the 21 million tons of annual US industrial food waste is recycled every year.10 As one survey respondent noted, they “are actively looking for options to reach Zero Waste-to-Landfill.”
9 Only eight manufacturers are represented by this sales figure as one manufacturer respondent was a manufacturing arm of a retailer / wholesaler and is included in the retail/wholesale figures. 10 A Roadmap to Reduce U.S. Food Waste by 20 Percent, refed.com.

14
The manufacturing sector respondents reported total food waste at over 10.6 billion pounds of food waste. This is largely due to the significant scale of food manufacturing operations. As seen in Figure 2, a significant portion of reported food waste, almost 97%, was recycled, while only 1.7% of food waste was disposed in landfill. The survey found that 1.5% of food was donated from these sector respondents, which equates to 156 million pounds of food donated. According to Feeding America, the nation’s largest network of food banks, the manufacturing sector as a whole donated over 800 million pounds of food to that organization in 2015. The difference between donation, recycling, and disposal is notable and confirms the unique operation features described above. On average, the manufacturing sector diverted 300 pounds of food waste per thousand dollars of company revenue.
SURVEY FINDINGS: MANUFACTURING SECTOR
FOOD WASTE DIVERSION
FIGURE 2. DESTINATION OF FOOD WASTE (IN POUNDS), MANUFACTURING RESPONDENTS, 2016
FIGURE 3. DESTINATION OF FOOD WASTE (IN POUNDS) BY COMPANY SIZE, MANUFACTURING RESPONDENTS, 2016
While there were not drastic differences in food waste destinations based on the size of the manufacturing companies, there were some slight differences as shown in Figure 3. The medium-sized manufacturers who responded to the survey reported donating considerably more (7%) than both small manufacturers (0.3%) and large manufacturers (2.6%) who responded. Although recycling continues to be the major food waste diversion destination for companies in the manufacturing sector, there may be an opportunity to grow the percentage of food donated across the sector based on some medium-sized manufacturers success donating at higher rates.

15
FOOD WASTE DIVERSION
SURVEY FINDINGS: MANUFACTURING SECTOR
In 2016, the manufacturing sector diverted close to 10.5 billion pounds of food waste away from landfill. A majority of this food waste was diverted to two types of recycling: 60% went to land application and 34% to animal feed, as seen in Figure 4. Animal feed has always received a large percentage of diverted manufacturing food waste due to the nature of the material coming out of these facilities and its priority status on the EPA hierarchy. The large amount of food waste diverted to land application in the 2016 results was largely driven by one small manufacturer and so may not be representative of the industry.
FIGURE 4. DIVERTED FOOD WASTE (IN POUNDS), MANUFACTURING RESPONDENTS, 2016

16
SURVEY FINDINGS: MANUFACTURING SECTOR
FOOD WASTE DIVERSION
Animal feed is the top diversion destination for both large and medium-sized manufacturers, receiving 77% and 58% of diverted food waste respectively. Additionally, large and medium-sized manufacturers divert relatively large percentages of food waste to composting (6% and 12%, respectively). See Figure 5 below for the breakdown of diverted waste by manufacturer size.
FIGURE 5. DIVERTED FOOD WASTE (IN POUNDS) BY COMPANY SIZE, MANUFACTURING RESPONDENTS, 2016

17
MANUFACTURING SECTOR
SUMMARY OF SURVEY FINDINGS (CONTINUED…)
BARRIERS TO DIVERSION
SURVEY FINDINGS: MANUFACTURING SECTOR
FIGURE 6. BARRIERS TO DONATION, MANUFACTURING RESPONDENTS, 2012-2016
Insu
fficie
nt re
frige
raon
and/
or st
orag
e at
Foo
d Ba
nk
Insu
fficie
nt re
frige
raon
and/
or st
orag
e on
site
Liabi
lity
Conc
erns
Regu
lato
ry C
onst
rain
ts
Tran
spor
taon
cons
train
ts(d
istan
ce, c
ost,
fleet
, etc
.)
Insu
fficie
nt re
frige
raon
and/
or st
orag
e at
Foo
d Ba
nk
Insu
fficie
nt re
frige
raon
and/
or st
orag
e on
site
Liabi
lity
Conc
erns
Regu
lato
ry C
onst
rain
ts
Tran
spor
taon
cons
train
ts(d
istan
ce, c
ost,
fleet
, etc
.)
Insu
fficie
nt re
frige
raon
and/
or st
orag
e at
Foo
d Ba
nk
Insu
fficie
nt re
frige
raon
and/
or st
orag
e on
site
Liabi
lity
Conc
erns
Regu
lato
ry C
onst
rain
ts
Tran
spor
taon
cons
train
ts(d
istan
ce, c
ost,
fleet
, etc
.)
Othe
r
% o
f Com
pani
es Id
enfy
ing
Barr
ier
to D
ona
on
Manufacturer survey respondents were also asked to identify what, if any, barriers existed to donating more food and recycling more food waste. The percent of manufacturing respondents who identified barriers to donation and recycling has increased from 2014 to 2016: In 2014, 60% of manufacturers identified barriers to donation and 63% identified recycling constraints. In 2016, 89% of manufacturers identified donation challenges and 100% of manufacturers identified barriers to recycling.11
The top barrier to donation identified by manufacturing respondents was regulatory constraints with a 56% positive response rate, as seen in Figure 6. Additionally, 44% of respondents indicated liability concerns as a challenge to donation. While regulatory constraints and liability concerns were both top barriers to donation for manufacturers in 2012 and 2014 (50% and 67% of respondents identified each, respectively), transportation constraints saw a decrease in responses from the previous surveys. In 2012 and 2014, 63% and 67% of manufacturing respondents respectively saw transportation constraints as a limitation to donating food, whereas in 2016 only 22% of respondents highlighted the same issue. Only small manufacturing companies highlighted transportation constraints at the same rate as 2014. Finally, food safety concerns were also highlighted by a number of manufacturers as a barrier to donation.
11 Please note that due to the differences in the types of respondents and their ability to track food waste destinations, year-over-year data is not directly comparable and highlights not only changes in barriers faced by respondents but also changes in respondents and their ability to track their food waste.
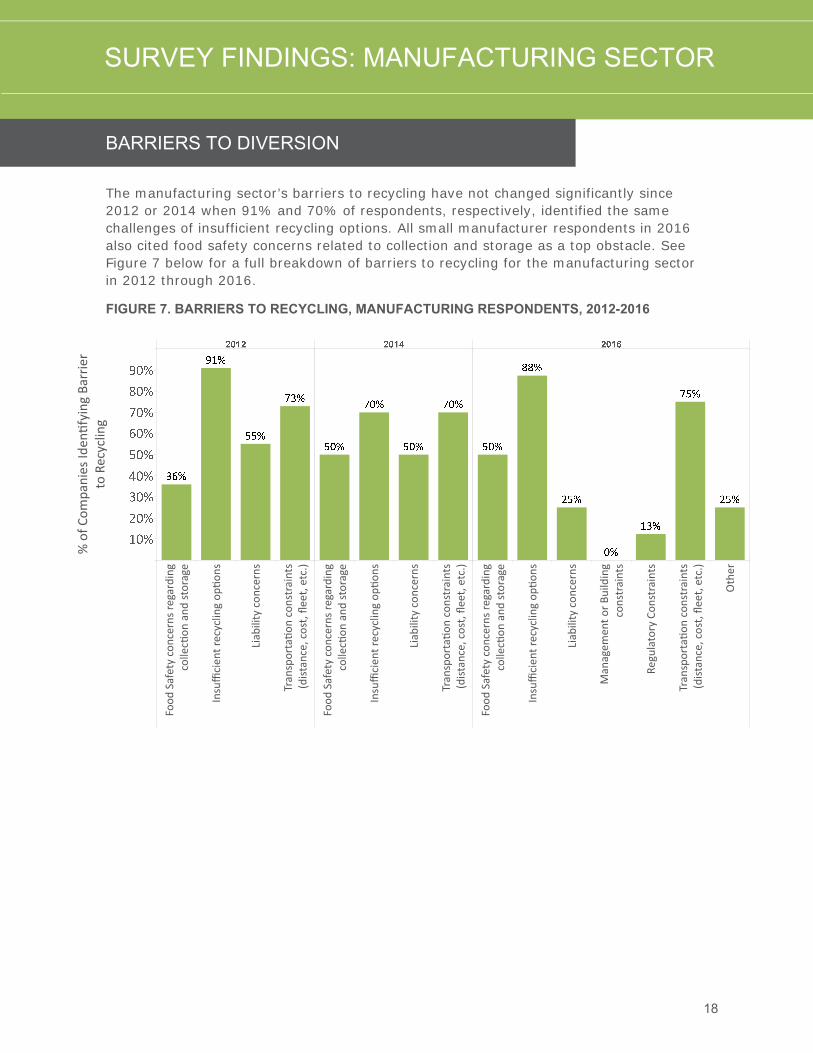
For manufacturers, the largest barrier to recycling is insufficient recycling options, with 78% of manufacturers identifying this as a challenge. Additionally, transportation constraints are a much larger issue for recycling with a 67% positive response rate. This could be due to the limited number of and typically rural locations of manufacturing facilities around the country.
18
BARRIERS TO DIVERSION
SURVEY FINDINGS: MANUFACTURING SECTOR
The manufacturing sector’s barriers to recycling have not changed significantly since 2012 or 2014 when 91% and 70% of respondents, respectively, identified the same challenges of insufficient recycling options. All small manufacturer respondents in 2016 also cited food safety concerns related to collection and storage as a top obstacle. See Figure 7 below for a full breakdown of barriers to recycling for the manufacturing sector in 2012 through 2016.
FIGURE 7. BARRIERS TO RECYCLING, MANUFACTURING RESPONDENTS, 2012-2016
Food
Saf
ety
conc
erns
rega
rdin
gco
llec
on a
nd st
orag
e
Insu
fficie
nt re
cycli
ng o
pon
s
Liabi
lity
conc
erns
Tran
spor
taon
cons
train
ts(d
istan
ce, c
ost,
fleet
, etc
.)
Food
Saf
ety
conc
erns
rega
rdin
gco
llec
on a
nd st
orag
e
Insu
fficie
nt re
cycli
ng o
pon
s
Liabi
lity
conc
erns
Tran
spor
taon
cons
train
ts(d
istan
ce, c
ost,
fleet
, etc
.)
Food
Saf
ety
conc
erns
rega
rdin
gco
llec
on a
nd st
orag
e
Insu
fficie
nt re
cycli
ng o
pon
s
Liabi
lity
conc
erns
Man
agem
ent o
r Bui
ldin
gco
nstr
aint
s
Regu
lato
ry C
onst
rain
ts
Tran
spor
taon
cons
train
ts(d
istan
ce, c
ost,
fleet
, etc
.)
Othe
r
% o
f Com
pani
es Id
enfy
ing
Barr
ier
to R
ecyc
ling

19
MANUFACTURING SECTOR
SUMMARY OF SURVEY FINDINGS (CONTINUED…)
AREAS OF INVESTMENT
SURVEY FINDINGS: MANUFACTURING SECTOR
FIGURE 8. AREAS OF INVESTMENT, MANUFACTURING RESPONDENTS, 2016
Finally, respondents were asked to identify any areas related to food waste in which their company is currently investing. Manufacturing respondents had fairly high rates of investment across the board, with 50% of respondents investing in each of the following categories: food waste reduction, food waste disposal, food donations, and food sent to animal feed. The only category with a slightly lower positive response rate was food recycling, with 44% of manufacturers highlighting it. Large manufacturers are investing in more areas: four out of the five areas of investment were identified by 100% of large manufacturing respondents (the only exception being food donations). See Figure 8 below for a full breakdown of investment areas for the manufacturing sector.
The other areas of investment that manufacturers highlighted are generally focused on increasing measurement, tracking, and reporting of food waste. Accurate tracking of food waste continues to be difficult for many companies, but respondents are investing to improve data collection through dedicated teams internally to develop tracking and measurement systems, working with third party companies to help track and report data, and implementing internal tracking systems to collect and house all waste stream data in a central location.

20
Size Definition # of Respondents
Small <$1 billion 12
Medium >$1 billion and <$10 billion 6
Large >$10 billion 6
SECTOR CONTEXT
SURVEY FINDINGS: RETAIL/WHOLESALE SECTOR
• 25% of diverted food was unsaleable food donated for human consumption • Diverted 24% of food waste to animal feed and another 24% to composting • The top barrier to both food donations and food waste recycling as identified by the
retail/wholesale sector was transportation constraints (46% of respondents) • 25% and 33% of retail/wholesale respondents did not identify any barriers to donation
and to recycling, respectively • Over 50% of all retail/wholesale respondents are investing in each category of food
waste related solutions with the exception of food sent to animal feed (only 46% of respondents)
In the 2016 survey, we received responses from 24 food retailers / wholesalers with a combined total annual sales of $300.2 billion. These retailers / wholesalers represent over 10,700 retail locations, 100 manufacturing locations, and over 130 food warehouses. We divided food retailer / wholesaler respondents into subgroups based on their annual sales figures in order to analyze trends based on the size of the company. Below is a breakdown of retail/wholesale respondents by size (as defined by sales):
TABLE 6. RETAIL/WHOLESALE RESPONDENTS BY COMPANY SIZE
The retail/wholesale sector has specific advantages and challenges when approaching food waste due to the sector’s business model and customer demands. Unlike other food businesses, retailers and wholesalers often have a broad range of types of food that are generally finished food products.
Additionally, retailers typically have many locations with multiple food related departments, each of which can have different processes or requirements for how food waste is handled or diverted. Finally, due to customer demands around variety, consistency, and freshness, retail can generate high volumes of food waste that is safe and edible but was simply overstocked, no longer meets appearance standards, or has damaged packaging.
The qualities and types of unsaleable food generated by the retail sector allows for much easier levels of donation, since it is already packaged. However, packaging creates barriers for recycling, which requires time consuming de-packaging before that food waste can go into a compost facility or anaerobic digester. Additionally, the challenges retailers and wholesalers encounter in food waste related efforts are often associated with the wide variety and unpredictability of unsaleable food generated in stores as well as the number of locations, and departments within such locations, that create a high level of variability in food waste processes and tracking.

21
FOOD WASTE DIVERSION
SURVEY FINDINGS: RETAIL/WHOLESALE SECTOR
RETAIL/WHOLESALE SECTOR
SUMMARY OF SURVEY FINDINGS (CONTINUED…)
FOOD WASTE DIVERSION
SURVEY FINDINGS: RETAIL/WHOLESALE SECTOR
The food retail/wholesale sector had the most even spread of food waste across destinations in 2016, as seen in Figure 9, including over 390 million pounds of food donations reported. At over 1.5 billion pounds of total reported diverted food waste, the retail/wholesale sector diverted 6.6 pounds of food waste per thousand dollars of company revenue.
FIGURE 9. DESTINATION OF FOOD WASTE (IN POUNDS), RETAIL/WHOLESALE RESPONDENTS, 2016
When looking at food waste destinations in the retail/wholesale sector, there are several trends among similar sized companies. While small retail/wholesale companies reported the highest percentages of diverted food waste, they also reported the lowest percentage of food donations with an overwhelming majority of their food waste going to recycling. Medium sized retailers / wholesalers recycled the lowest percentage of food waste, and large retailers / wholesalers donated the highest percentage of food. To see the comparison of food waste destinations across small, medium, and large-sized retailers / wholesalers, see Figure 10.
FIGURE 10. DESTINATION OF FOOD WASTE (IN POUNDS) BY COMPANY SIZE, RETAIL/WHOLESALE RESPONDENTS, 2016

22
FOOD WASTE DIVERSION
SURVEY FINDINGS: RETAIL/WHOLESALE SECTOR
FIGURE 11. DIVERTED FOOD WASTE (IN POUNDS), RETAIL/WHOLESALE RESPONDENTS, 2016
While large and medium-sized retail/wholesale companies saw similar distributions across donations, animal feed, and composting, small-sized retailers / wholesalers saw the majority of their diverted food waste, 62%, diverted to composting. This is likely due to a smaller number of locations which enables easier relationship building with local and regional composting companies. See Figure 12 below for the breakdown of retail/wholesale food waste diversion by company size.
In 2016, retail/wholesale sector respondents reported that over 1.1 billion pounds of food waste was diverted to recycling destinations. The most common forms of recycling diversions by retailers and wholesalers were to animal feed (24% of diverted waste) and composting or aerobic processes (23% of diverted waste). Both of these destinations received a similar amount of diverted food as donation (25% of diverted waste). See below in Figure 11 for a full breakdown of retail/wholesale diverted

23
FOOD WASTE DIVERSION
SURVEY FINDINGS: RETAIL/WHOLESALE SECTOR
FIGURE 12. DIVERTED FOOD WASTE (IN POUNDS) BY COMPANY SIZE, RETAIL/WHOLESALE RESPONDENTS, 2016
FOOD WASTE DIVERSION
SURVEY FINDINGS: RETAIL/WHOLESALE SECTOR

24
FIGURE 13. BARRIERS TO DONATION, RETAIL/WHOLESALE RESPONDENTS, 2012 - 2016
Insu
fficie
nt re
frige
raon
and/
or st
orag
e at
Foo
d Ba
nk
Insu
fficie
nt re
frige
raon
and/
or st
orag
e on
site
Liabi
lity
Conc
erns
Regu
lato
ry C
onst
rain
ts
Tran
spor
taon
cons
train
ts(d
istan
ce, c
ost,
fleet
, etc
.)
Insu
fficie
nt re
frige
raon
and/
or st
orag
e at
Foo
d Ba
nk
Insu
fficie
nt re
frige
raon
and/
or st
orag
e on
site
Liabi
lity
Conc
erns
Regu
lato
ry C
onst
rain
ts
Tran
spor
taon
cons
train
ts(d
istan
ce, c
ost,
fleet
, etc
.)
Insu
fficie
nt re
frige
raon
and/
or st
orag
e at
Foo
d Ba
nk
Insu
fficie
nt re
frige
raon
and/
or st
orag
e on
site
Liabi
lity
Conc
erns
Regu
lato
ry C
onst
rain
ts
Tran
spor
taon
cons
train
ts(d
istan
ce, c
ost,
fleet
, etc
.)
Othe
r
% o
f Com
pani
es Id
enfy
ing
Barr
ier
to D
ona
on
BARRIERS TO DIVERSION
SURVEY FINDINGS: RETAIL/WHOLESALE SECTOR
12 Please note that due to the differences in the types of respondents and their ability to track food waste destinations, year-over-year data is not directly comparable and highlights not only changes in barriers faced by respondents but also changes in respondents and their ability to track their food waste.
Retail/wholesale survey respondents also identified the key barriers that limit their ability to both donate unsaleable food and recycle food waste. This year, only 75% of respondents identified barriers to donation, and only 66% reported obstacles to recycling. In the 2014 survey, 100% and 92% of retail/wholesale respondents identified barriers to donation and recycling, respectively.12
Transportation constraints were the most cited impediment to donation—46% of retail/wholesale sector respondents identified it as a challenge. Large and medium-sized companies were much more likely to identify transportation constraints as an obstacle, with 83% and 67% of respondents respectively identifying this barrier. In contrast, 42% of small retailers / wholesalers cited insufficient refrigeration / storage onsite as a challenge. These differences in barriers could be associated with the differences in availability of resources in small, medium, and large companies as well as differences in the amount of food available for donation.
Other hurdles reported were both external and internal organizational challenges. Externally, respondents reported encountering a lack of food donation agencies in the area and a lack of agency volunteers able to pick up the food. Internally, retailers / wholesalers reported a lack of resources, oversight, and established processes limit their ability to properly facilitate donation efforts. See Figure 13 for the retail/wholesale respondents’ barriers to donating for 2012 through 2016.

25
FIGURE 14. BARRIERS TO RECYCLING, RETAIL/WHOLESALE RESPONDENTS, 2012 - 2016
Barriers to recycling food waste were similar to those respondents encountered when trying to donate higher rates of food. The most commonly cited challenge in recycling food waste was again transportation constraints with 46% of retail/wholesale respondents identifying these constraints as an obstacle. Additionally, 38% of respondents also indicated insufficient recycling options as a challenge. These top barriers follow the same trend as seen in previous years’ responses.
Respondents also described other impediments stemming from both external and internal sources. While insufficient options for recycling were often cited as stemming from lack of location proximity, companies also struggled to get the right resources and internal systems in place to execute a successful recycling program at their various locations. A final and additional challenge that was mentioned several times by respondents was the costs associated with recycling. Despite all these identified obstacles, one retailer / wholesaler noted progress being made in this arena, highlighting that “technology and providers in the recycling space are increasing year over year making processes easier.” See Figure 14 for the retail/wholesale respondents’ barriers to recycling for 2012 through 2016.
BARRIERS TO DIVERSION
SURVEY FINDINGS: RETAIL/WHOLESALE SECTOR

26
AREAS OF INVESTMENT
SURVEY FINDINGS: RETAIL/WHOLESALE SECTOR
Finally, respondents identified that a high percentage of retailers and wholesalers are investing across the board in food waste solutions. While the highest percentage of retailers and wholesalers, 71%, are investing in areas to improve food donations, a majority of respondents are also investing in areas related to food waste recycling (67%), food waste reduction (63%), and food waste disposal (58%). The lowest area of investment from retailers and wholesalers is in food sent to animal feed, but 46% of retailers and wholesalers still identified this as an area of investment. See Figure 15 below for retail/wholesale areas of investment.
FIGURE 15. AREAS OF INVESTMENT, RETAIL/WHOLESALE RESPONDENTS, 2016
10%20%30%40%50%60%70%80%90%
63%58%
71%67%
46%
Within these investment areas, many companies noted devoting capital and employee time into improving their food waste measurement and tracking. Examples included purchasing specific software to aid in information tracking and partnering with external organizations to review and analyze food waste data. Another often cited area of investment for retailers and wholesalers is implementing employee training to improve the adoption and success of food waste related practices.

27
Size Definition # of Respondents
Small <$100 million 11
Medium >$100 million and <$1 billion 4
Large >$1 billion 13
SURVEY FINDINGS: RETAIL/WHOLESALE SECTOR
SECTOR CONTEXT
SURVEY FINDINGS: RESTAURANT SECTOR
TABLE 7. RESTAURANT RESPONDENTS BY COMPANY SIZE
• 61% of diverted food waste from restaurants was recycled as bio-based materials / bio-chemical processing such as recycling used cooking oil
• The top barriers to food donations identified by restaurant respondents were liability concerns and transportation constraints (41% of respondents)
• The top barrier to food waste recycling identified by restaurant respondents was transportation constraints (44% of respondents)
• The areas of most investment across the restaurant sector are in food waste reduction and food donation (44% of respondents)
In the 2016 survey, we received responses from 28 restaurant companies with a combined total annual sales of $92.4 billion. These businesses represent more than 73,100 restaurant locations. We divided restaurant respondents into subgroups based on their annual sales in order to analyze trends based on company size. Below is a breakdown of restaurant respondents by size (as defined by sales):
There are unique considerations for restaurants that affect the type of food waste produced and create both advantages and challenges that restaurant and foodservice companies encounter when looking to reduce or divert food waste. The type and amount of food waste generated by a restaurant is largely dictated by the restaurant concept. For example, food is less commonly consumed on the premises at quick-service restaurants in comparison to full-service restaurants. Similarly, specials and seasonal menus in full-service restaurants can result in the type of unsaleable food being difficult to predict.
One of the most significant hurdles for restaurants, unlike manufacturers and retailers, is that food that becomes waste in restaurants has often been served to consumers. This creates distinct challenges in the way this food waste can be diverted. Prepared food that has not been served to customers can be considered for donation. However, there are food safety concerns and regulations for fresh versus packaged food that need to be considered—packaged foods are generally easier to donate because they have not faced as much risk of contamination. Also, transportation and storage infrastructure requirements are high for the successful donation of fresh food, and restaurants tend to have less storage space available than retail grocery stores or manufacturing facilities.
The other major challenge facing many restaurants is the high number of locations for many companies and the prevalence of the franchise model within the industry. While a large number of locations can prove difficult to oversee, franchises pose even greater limitations to a corporate restaurant’s ability to access or control food waste tracking data or processes. One respondent highlighted this challenge, noting, “We really struggle with collecting data on food waste generation and disposal because of our franchise model.”

28
As seen in Figure 16, restaurant respondents reported a food waste disposal rate of 93.7%. In 2016, 4.2% of reported food waste was recycled, and 2% of food was donated. Overall, 122.3 million pounds of food waste were diverted by restaurant respondents with on average 3.7 pounds of food waste diverted per thousand dollars of company revenue.
FOOD WASTE DIVERSION
SURVEY FINDINGS: RESTAURANT SECTOR
FIGURE 16. DESTINATION OF FOOD WASTE (IN POUNDS), RESTAURANT RESPONDENTS, 2016
Large and medium-sized restaurants’ breakdown of food waste destinations are very similar. However, small restaurant respondents had significantly higher rates of food waste diversion with almost 26% of unsaleable food being donated and 40% of food waste being recycled, as seen in Figure 17. This is perhaps due to the ability to more easily form relationships with local food recovery and recycling organizations or particularly dedicated employees within the restaurant.
FOOD WASTE DIVERSION
SURVEY FINDINGS: RESTAURANT SECTOR
FIGURE 17. DESTINATION OF FOOD WASTE (IN POUNDS) BY COMPANY SIZE, RESTAURANT RESPONDENTS, 2016
29
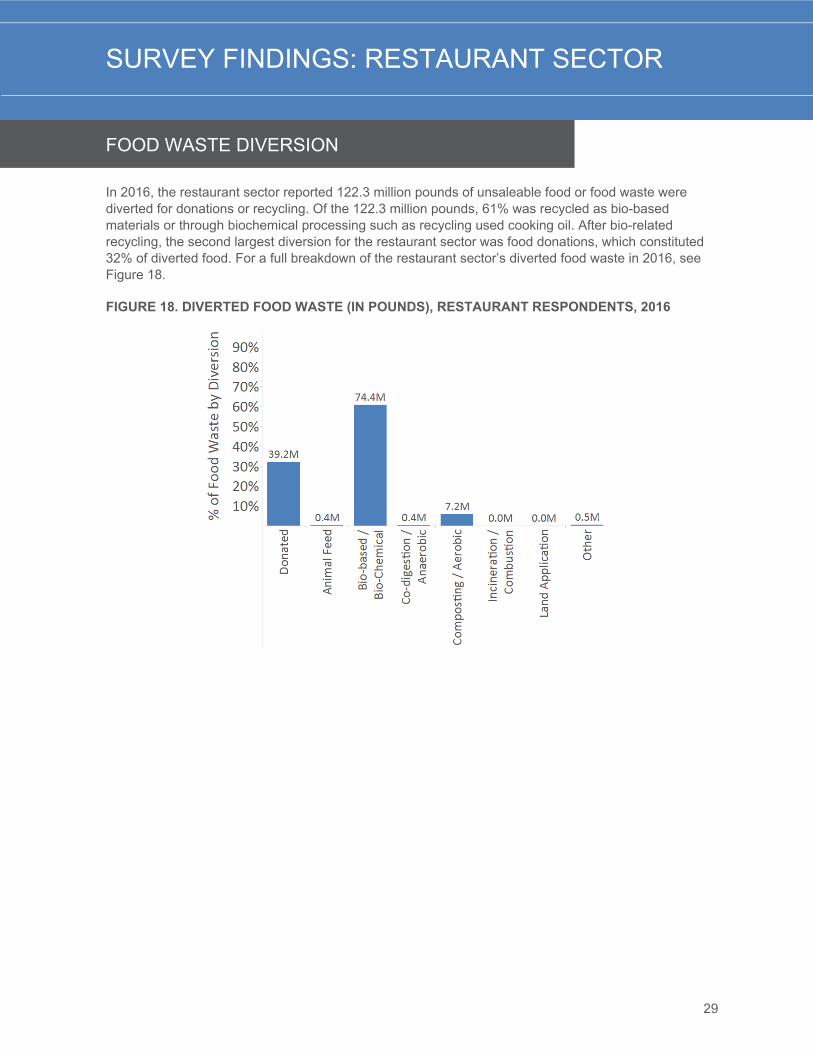
FIGURE 18. DIVERTED FOOD WASTE (IN POUNDS), RESTAURANT RESPONDENTS, 2016
FOOD WASTE DIVERSION
SURVEY FINDINGS: RESTAURANT SECTOR
In 2016, the restaurant sector reported 122.3 million pounds of unsaleable food or food waste were diverted for donations or recycling. Of the 122.3 million pounds, 61% was recycled as bio-based materials or through biochemical processing such as recycling used cooking oil. After bio-related recycling, the second largest diversion for the restaurant sector was food donations, which constituted 32% of diverted food. For a full breakdown of the restaurant sector’s diverted food waste in 2016, see Figure 18.

30
FOOD WASTE DIVERSION
SURVEY FINDINGS: RESTAURANT SECTOR
FOOD WASTE DIVERSION
SURVEY FINDINGS: RESTAURANT SECTOR
While bio-based materials / bio-chemical processing received a majority of the diverted food waste from the restaurant sector, this percentage of diverted food waste is mostly representative of large and medium-sized restaurant companies. Small restaurant respondents sent 54% of their food waste to composting or aerobic processing, and 7% of their diverted food waste was recycled via bio-based materials or through bio-chemical processing. For a full breakdown of restaurant diverted food waste by company size, see Figure 19.
FIGURE 19. DIVERTED FOOD WASTE (IN POUNDS) BY COMPANY SIZE, RESTAURANT RESPONDENTS, 2016

31
Per the responses to this year’s survey, restaurants continue to see barriers to donating food and recycling food waste. In 2016, 68% of restaurant respondents identified barriers to food donation, compared with 64% in 2014. In addition, in 2016, 85% of restaurant respondents identified obstacles to food waste recycling.13
For the restaurant sector, there are a variety of challenges that limit companies’ ability to donate food, as seen in Figure 20. While 43% of respondents identified transportation constraints, 39% also identified liability concerns and 39% indicated insufficient refrigeration and / or onsite storage as challenges. This is generally aligned with barriers reported in 2014. More large restaurants cited liability constraints (62% of respondents) compared to medium-sized companies, which identified insufficient refrigeration and / or storage onsite as a more frequent challenge (50% of respondents). Small restaurants most often cited other constraints to donation (45% of respondents), where they noted issues related to donation organizations including reliability and accessibility. One restaurant respondent voiced their frustration with donating, responding “I feel restaurants could be contributing significantly more than they are if it were made easier to do so by creating collection services and diminishing the threat of food-borne illness repercussions.”
Other barriers encountered by restaurants generally related to issues with external donation organizations or challenges posed by restaurant-specific business issues. Respondents of all sizes noted that food bank / donation partners are not always able to pick-up food donations when they are available, especially given the variation in amount and type of food available to donate by this sector. Internally, respondents noted that food donations often need to be repackaged to meet certain donation standards, which can be time intensive and may require employee training. Additionally, because restaurant companies can have many locations and potentially franchises, companies noted encountering difficulties coordinating programs and data collection at individual locations.
BARRIERS TO DIVERSION
SURVEY FINDINGS: RESTAURANT SECTOR
13 Please note that due to the differences in the types of respondents and their ability to track food waste destinations, year-over-year data is not directly comparable and highlights not only changes in barriers faced by respondents but also changes in respondents and their ability to track their food waste.

32
2014 2016
10%20%30%40%50%60%70%80%90%
33%
67%62%
56%
78%
14%
39% 39%
25%
43% 39%
BARRIERS TO DIVERSION
SURVEY FINDINGS: RESTAURANT SECTOR
FIGURE 20. BARRIERS TO DONATION, RESTAURANT RESPONDENTS, 2014 - 2016
Barriers to recycling for the restaurant sector again highlight the challenges related to transportation. Transportation constraints were identified by 43% of restaurant respondents as an obstacle to recycling more food waste, although this issue was more prevalent among large and medium-sized restaurants with 54% of large restaurants and 75% of medium-sized restaurants identifying this as a challenge. The second largest constraint identified by restaurant respondents was food safety concerns regarding collection and storage, which 36% of all surveyed restaurants noted as an issue. Small restaurant companies had the lowest percentage of respondents identifying barriers. The largest obstacles for small restaurants were food safety issues and regulatory constraints, as identified by 27% of small restaurant respondents.
Compared to 2014, 2016 saw a lower rate of identified recycling challenges in the restaurant sector. In the previous survey, top barriers were identified by at least 83% respondents, whereas the top constraint in 2016 was only identified by 43% of respondents. Additionally, from 2014 to 2016, there were decreases across the board in the identification of barriers to recycling. These changes might be reflective of true changes in the industry, but comparison is limited due to differences in respondents to the two surveys.

33
BARRIERS TO DIVERSION
SURVEY FINDINGS: RESTAURANT SECTOR
Other limits to recycling often related to the costs and incentives. Multiple restaurants noted the high cost of recycling as a challenge, while others reported that the misconceptions around the cost of recycling and the disincentives to recycling (such as low landfill fees) stood as challenges to motivating higher rates of recycling. See Figure 21 below for the restaurant sector’s top barriers to recycling in 2014 through 2016.
FIGURE 21. BARRIERS TO RECYCLING, RESTAURANT RESPONDENTS, 2014 - 2016
2014 2016
10%20%30%40%50%60%70%80%90%
42%
92%
25%
67%
84%
36%
18% 21% 21%
32%
43%
32%
34
AREAS OF INVESTMENT
SURVEY FINDINGS: RESTAURANT SECTOR
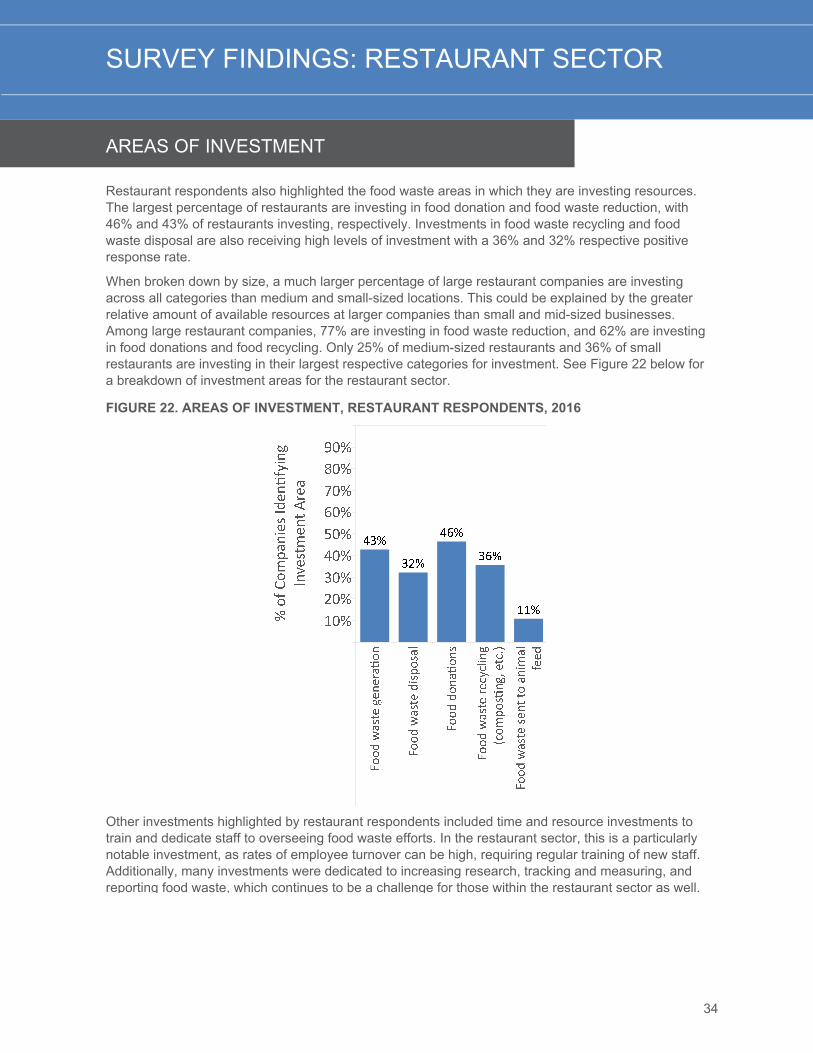
Restaurant respondents also highlighted the food waste areas in which they are investing resources. The largest percentage of restaurants are investing in food donation and food waste reduction, with 46% and 43% of restaurants investing, respectively. Investments in food waste recycling and food waste disposal are also receiving high levels of investment with a 36% and 32% respective positive response rate.
When broken down by size, a much larger percentage of large restaurant companies are investing across all categories than medium and small-sized locations. This could be explained by the greater relative amount of available resources at larger companies than small and mid-sized businesses. Among large restaurant companies, 77% are investing in food waste reduction, and 62% are investing in food donations and food recycling. Only 25% of medium-sized restaurants and 36% of small restaurants are investing in their largest respective categories for investment. See Figure 22 below for a breakdown of investment areas for the restaurant sector.
FIGURE 22. AREAS OF INVESTMENT, RESTAURANT RESPONDENTS, 2016
Other investments highlighted by restaurant respondents included time and resource investments to train and dedicate staff to overseeing food waste efforts. In the restaurant sector, this is a particularly notable investment, as rates of employee turnover can be high, requiring regular training of new staff. Additionally, many investments were dedicated to increasing research, tracking and measuring, and reporting food waste, which continues to be a challenge for those within the restaurant sector as well.

35
NEXT STEPS
With the results of this food waste survey, the FWRA continues to build a knowledge base that improves understanding of the state of food waste today in the food industry. Responses also highlighted numerous best practices and potential areas of collaboration to continue progress to reduce food waste generation and increase diversion. Below, opportunities are identified for potential improvements and collaborations based on the findings of this survey.
OPPORTUNITIES
Improve tracking: It is clear that measuring and tracking food waste is a challenge for food companies across sectors. Surveyed companies continue to invest in data collection tools to measure and track improvements including:
• Creating and implementing standardized measurement practices across all locations to ensure comparable data is collected across a company.
• Dedicating and training employees to oversee data collection to ensure there are appropriate, quality resources specifically assigned to these tasks. One restaurant respondent highlighted their investment in this area by noting that they “developed a food management process training and required all…locations in the U.S. to complete the web-based training” as well as having “toolkits and field liaisons to support locations and ensure that the standard operating procedures are being implemented.”
• Investing in software or other tracking systems to increase the ease of data collection and tracking as well as centralize the location for data from across the company.
Improved tracking, through the methods identified above by surveyed companies and others, will allow companies to better understand what types of food waste they are generating and to tailor food waste reduction and food waste diversion methods to organizational needs.
Increase internal analysis and investment: While this survey identified that there are still areas where food manufacturers, food retailers / wholesalers, and restaurants could make significant progress in their food waste related efforts, there seems to be a disconnect between many respondents’ sense of where barriers exist and where they are investing. Undertaking an internal review and analysis of food waste data can help companies better understand where they are generating the most food waste and where there are opportunities to invest more to either reduce this waste or divert it through recycling or donation.
For example, in this survey, while only 2% of reported restaurant food was donated, 34% of restaurant respondents did not identify any barriers to donation and 44% are making investments in this area. An increased understanding of food waste within a company will better allow a company to make targeted investments to improve its food waste related efforts.

36
NEXT STEPS
OPPORTUNITIES
Continue sharing best practices: There are significant differences both within industries at different sized companies as well as across sectors in where and how food waste is diverted. While some of these differences may be attributed to differences in sectors, there are also opportunities for improved sharing of best practices. Examples of opportunities for collaboration or sharing of best practices based on survey results include:
• Medium-sized manufacturers are donating food at higher rates than large and small manufacturers. Practices from these companies could help increase the overall percent of food donated from the manufacturing sector.
• Small retailers / wholesalers recycle a majority of their reported food waste via composting, while medium and large retail/wholesale companies compost a smaller percentage of their diverted food waste but have a broader portfolio of methods of recycling. While this could be due to the ease of developing relationships with composters for a smaller number of stores, sharing information across retailers and wholesalers of different sizes could help increase composting at larger companies while broadening the recycling efforts of smaller retailers.
• Small restaurants report composting at much higher rates than medium and large-sized restaurants, but recycling through bio-based materials or bio-chemical processing at much lower rates than their larger counterparts. Collaboration across the restaurant sector could help restaurants of all sizes learn best practices to ensure that all sizes of restaurants are maximizing recycling opportunities.
In addition to the ideas that came out of this year’s survey results, FWRA published a second volume of its Best Practices & Emerging Solutions Toolkit in November 2015 based on information collected from past surveys. This document contains thorough descriptions of best practices and strategies to help reduce food waste, solve barriers to donation, and divert food waste to a broader set of destinations. FWRA will publish a third version of that Toolkit in 2017, based on findings from this survey. As with past Toolkits, it will include new case studies and share proven solutions to help companies overcome the barriers identified in this survey and assessment.
.

37
Data Requested Percent of Manufacturers Responded14
Amount of food donated 100.0%
Amount of food waste recycled 100.0%
Amount of food waste disposed of 75.0%
Data Requested Percent of Retail/Wholesale Responded
Amount of food donated 95.8%
Amount of food waste recycled 95.8%
Amount of food waste disposed of 66.7%
Data Requested Percent of Restaurants Responded
Amount of food donated 96.6%
Amount of food waste recycled 79.3%
Amount of food waste disposed of 72.4%
APPENDIX
APPENDIX 1: ASSUMPTIONS & ACCURACY
When analyzing the 2016 survey data, certain assumptions were made around data availability and accuracy that could impact the results of this report.
Data Availability: Respondents were not always able to provide all information requested in the survey. Although some surveys were not complete, respondents’ information were included in the survey analysis if they were at least able to provide values around the amount of food donated by their company. Five surveys were started by companies but not included in the survey analysis as only preliminary information was included around company information. Tables 8, 9, and 10 provide information on data availability for the key survey data for 2016. Because a “blank” response could be interpreted as both a “zero pounds of waste” as well as a lack of response, the percent of companies responded is based upon the number of companies who answered each associated data request accuracy question (i.e., the percent of respondents for amount of food donated was based upon the number of respondents to the question asking for the accuracy of donation data).
TABLE 8. RESPONSE RATE, MANUFACTURING RESPONDENTS
TABLE 9. RESPONSE RATE, RETAIL/WHOLESALE RESPONDENTS
TABLE 10. RESPONSE RATE, RESTAURANT RESPONDENTS
14 Only eight manufacturers are represented by these response figures as one manufacturer respondent did not provide responses to the accuracy data based on their manufacturing data.

38
Data Requested 2016 2014 2012
Amount of food donated 7.75 7.33 7.96
Amount of food waste recycled 8.25 8.17 7.73
Amount of food waste disposed of 6.33 5.60 4.92
Data Requested 2016 2014 2012
Amount of food donated 6.83 7.27 6.95
Amount of food waste recycled 7.78 8.08 7.73
Amount of food waste disposed of 5.94 5.20 5.12
Data Requested 2016 2014 2012
Amount of food donated 7.00 7.14 Not collected
Amount of food waste recycled 5.74 5.50 Not collected
Amount of food waste disposed of 4.48 5.22 Not collected
Data Accuracy: Respondents were asked to estimate values for food donation, food waste recycling, and food waste disposal if exact values were not available. In order to understand data accuracy, respondents were asked to self-rate the accuracy of their data on a scale of 1-10 with 1 being the least accurate and 10 being the most accurate. Tables 11, 12, and 13 provide information on data accuracy for 2016 survey data as well as accuracy from past surveys.
TABLE 11. REPORTED DATA ACCURACY ON 1-10 SCALE, MANUFACTURING RESPONDENTS
TABLE 12. REPORTED DATA ACCURACY ON 1-10 SCALE, RETAIL/WHOLESALE RESPONDENTS
TABLE 13. REPORTED DATA ACCURACY ON 1-10 SCALE, RESTAURANT RESPONDENTS
While relative confidence in each type of data has remained the same in each sector, there have been slight fluctuations in the overall reported accuracy. Manufacturing saw an overall increase in accuracy, with manufacturers self-reporting higher accuracy for each category compared to 2014. Additionally, manufacturers continue to be more confident in their values around food waste recycled compared to other sectors. Retail/wholesale and restaurant respondents are most confident in the accuracy of their recycling data.
Across the board, data around disposed of food waste remains the data that companies are least confident in as most companies track total municipal solid waste without breaking the types of waste that contribute to the overall total. Retailers and wholesalers saw slight decreases in their confidence levels around their donation and recycling data. Restaurants continued to rate their accuracy the lowest, which could potentially be attributed to the large number of locations associated with many restaurant companies.
.

39
SUMMARY OF FLW STANDARD REQUIREMENTS
FWRA INVENTORY
1. Base FLW accounting and reporting on the principles of relevance, completeness, consistency, transparency, and accuracy
• Relevance: Data designed to inform waste reduction activities
• Completeness: Unknown – varies by respondent
• Consistency: Same methodology recommendations provided each year
• Transparency: Unknown – varies by respondent
• Accuracy: Self-reported by respondents – greater than 50% on all but one metric
2. Account for and report the physical amount of FLW expressed as weight
Reported in pounds
3. Define and report on the scope of the FLW inventory (see FLW Standard for additional details)
• Timeframe: Calendar year 2015 requested • Material type: Food and associated inedible
parts • Destinations:
Reused/Recycled: o Animal feed o Bio-based materials/biochemical processing
(e.g., recycling used cooking oil for biodiesel) o Co-digestion/anaerobic digestion o Composting/aerobic processes o Controlled combustion (incineration) for
onsite heat/energy recovery o Land application
Disposal: o Controlled combustion (municipal waste
incinerators) o Landfill o Sewer/wastewater treatment*
*Includes food products disposed by pouring down the sanitary sewer drain or otherwise transported to a wastewater treatment plant for disposal. Excludes
APPENDIX
APPENDIX 2: FOOD LOSS AND WASTE STANDARD ALIGNMENT
FWRA is excited about the release of the global Food Loss and Waste Accounting and Reporting Standard (FLW Standard), which provides guidance on how to account for and report food waste across companies and geographies. To that end, we have made efforts to align our survey with the FLW Standard and reflect below how it lines up with the requirements.

40
food/organic residuals disposed via sanitary sewers due to routine cleaning/sanitation.
• Boundary: o Food category: All food and beverages,
UNCPC2.1 Div. 21 – 24); (except bottled water, not sweetened or flavored; UNCPC2.1 Class 2441)
o Lifecycle stage: Direct operations, Survey respondent represent: Manufacture of food products (ISIC Group: 101-107,110); Retail of food and beverage (ISIC Class: 4711, 4721-4722); Accommodation and food service activities (ISIC Class: 561-563)
o Geography: U.S. (UN code: 840) o Organization: All locations o (Survey respondents collectively represent:
375 manufacturing locations, 890 warehouses, 10,700 stores, 73,100 restaurants)
• Related issues:
o Pre-harvest losses are out of scope of the inventory
o Cannot confirm if packaging or other non-FLW material was excluded
o Cannot confirm if weight of FLW reflects the state in which it was generated
4. Describe the quantification method(s) used Unknown – varies by respondent
5. If sampling and scaling of data are undertaken, describe the approach and calculation used, as well as the period of time over which sample data are collected (including starting and ending dates)
Unknown – varies by respondent
6. Provide a qualitative description and/or quantitative assessment of the uncertainty around FLW inventory results
See Appendix 1; also see “related issues” above
7. If assurance of the FLW inventory is undertaken (which may include peer review, verification, validation, quality assurance, quality control, and audit), create an assurance statement
Unknown – varies by respondent
8. If tracking the amount of FLW and/or setting an FLW reduction target, select a base year, identify the scope of the target, and recalculate the base year FLW inventory when necessary
Not applicable.

41
APPENDIX
APPENDIX 3: 2016 FOOD MANUFACTURER AND RETAILER FOOD DONATION & FOOD WASTE SURVEY
The Grocery Manufacturer’s Association (GMA) and Food Marketing Institute (FMI) are partnering with the National Restaurant Association (NRA) and other stakeholders in order to address the important issues of food insecurity and food waste in the United States. Together we have formed the Food Waste Reduction Alliance (FWRA) which has two goals - to increase the amount of unsaleable food donated to food banks and reduce the amount of food waste sent to landfills. The purpose of this survey is to better understand how much food is being donated, how much food waste is being recycled or recovered, and how much is sent to landfills and other waste disposal facilities in the United States.
Your participation in this simple survey is critical to the success of this important initiative. To ensure confidentiality, we have engaged Deloitte Consulting to handle all of the data. Results will only be presented to GMA, FMI, and NRA in the aggregate and without attribution to any company. The timeframe for this survey is calendar year 2015, so please provide 2015 data to all questions.
General Information: General information regarding the size of your company is needed in order to analyze and extrapolate the data after it is aggregated. Please provide a point of contact so that we may follow up with you, if needed. All information will be kept confidential using our third party consultant.
Question: Company name ________________________.
Question: Annual U.S. sales (US$) ________________ Fiscal Year __________.
Question: Number of U.S. employees (rounded to the nearest thousand) ______.
Question: Primary business: is your company (please only check one):
___ Primarily a food manufacturer
___ Primarily a food retailer
___ Primarily a food wholesaler
Question: How many food retail locations does your company operate? ________
Question: How many food manufacturing locations does your company operate? _____
Question: How many food Warehouse / Distribution locations does your company operate? _____
Question: Point of contact information (name) _________________________________
Question: Point of contact (phone number and email): ___________________________
Question: The FWRA conducted this same survey in 2012 and 2014. Has your company responded to this survey in the past?

42
Question: If you answered yes to the previous question, have there been any significant changes to your company that would affect comparability of this survey to the last survey? Please explain.
Unsaleable Food Donations for Human Consumption: The negative consequences of product shrink can be significantly mitigated when unsaleable food is safely donated for human consumption, which makes food donation an important part of overall strategy. Unsaleable food may be generated throughout the manufacturing and retail value chain. For instance, mistakes during production may result in food that is perfectly safe and delicious, but not saleable. Product ingredients and semi-finished products that are not suitable for retail but are safe for human consumption may also be donated. Fresh food items such as day old bread, produce with blemishes, prepared foods and other perishable items that are near sell-by dates may also be unsuitable for sale, but safe for consumption. Please only include unsaleable food in your answer below. Do not include food that is produced expressly for donation, purchased food provided by customers or employees expressly for donation, or any food that is donated to organizations if it is still suitable for retail sale.
Question: What is the total weight in pounds of unsaleable food donated for human consumption by all of your company’s U.S. operations during calendar year 2015? If you do not know the exact amount, please provide as accurate an estimate as possible.
Donations in pounds: _________________________ lbs.
Question: Please use the following scale to indicate the accuracy of your answer to the question above. Number one on the scale indicates that your answer is a best guess based on experience, not measured data. Number five indicates that your answer is based on some measured data used to extrapolate a somewhat accurate answer. Number ten means that your answer is based on actual measures that are believed to be very accurate.
Please circle one number: 1 – 2 – 3 – 4 – 5 – 6 – 7 – 8 – 9 – 10
Question: What are the barriers, either internal or external, that prevent your company from donating more unsaleable food? Please check all that apply below. Also, provide a brief explanation of how (or if) these barriers have changed over the last two years, what your company is doing to overcome these barriers, and whether barriers are resulting in more unsaleable food.
Liability concerns Yes____No____
Regulatory constraints Yes____No____
Insufficient refrigeration and/or storage onsite Yes____No____
Insufficient refrigeration and/or storage at Food Bank Yes____No____
Transportation constraints (distance, cost, fleet, etc.) Yes____No____
Other barriers (please list below) Yes____No____
Please explain here or attach a separate page: __________________________________

43
Food Waste Reuse and Recycling: For purposes of completing this survey, food waste is defined as: any solid or liquid food substance, raw or cooked, which is discarded, or intended or required to be discarded. Food wastes are the organic remnants generated by the processing, handling, storage, sale, preparation, cooking, and serving of foods. This definition includes all “material types” (i.e. food and inedible parts) as defined by the new Food Loss & Waste Protocol Accounting Standard (FLW Standard) which was developed by the World Resources Institute and available for download at www.wri.org.
Question: What is the total weight in pounds of food waste reused or recycled by all of your company’s U.S. operations during calendar year 2015? If you do not know exact amounts, please provide as accurate an estimate as possible. Please provide a total weight and breakdown by destination, if possible. The following destinations are taken from the new FLW Standard and a definition for each destination is included in the attached table.
Animal Feed _______ lbs.
Bio-based materials/biochemical processing _______ lbs.
Co-digestion/anaerobic digestion _______ lbs.
Composting/aerobic processes _______ lbs.
Incineration/combustion for onsite heat/energy recovery _______ lbs.
Land application _______ lbs.
All Other _______ lbs.
Total _______ lbs.
If applicable please describe “All Other” destinations listed above: ____________________________
Question: Please use the following scale to indicate the accuracy of your answers to the question above. Number one on the scale indicates that overall your answers are best guesses based on experience, not measured data. Number five indicates that your answers are based on some measured data used to extrapolate somewhat accurate answers. Number ten means that your answers are based on actual measures that are believed to be very accurate
Please circle one number: 1 – 2 – 3 – 4 – 5 – 6 – 7 – 8 – 9 – 10
Question: What are the barriers, either internal or external, that prevent your company from reusing and recycling more food waste? Please check all that apply below. Also provide a brief explanation of how (or if) these barriers have changed over the last two years and what your company is doing to overcome these barriers.
Liability concerns Yes____No____
Food safety concerns regarding collection and storage Yes____No____
Insufficient recycling options Yes____No____
Transportation constraints (distance, cost, fleet, etc.) Yes____No____
Other barriers (please list below) Yes____No____
Please explain here or attach a separate page: ____________________________

44
Food and Solid Waste Disposal: This includes all food wastes, as defined above, that are transported to traditional disposal facilities such as landfills, municipal waste incinerators and wastewater treatment plants. Include finished products that are disposed due to recall. Do not include food waste listed as reused or recycled in the question above. Also, do not include food/organic residuals disposed via sanitary sewers due to routine cleaning and sanitation; however, do include food products that are disposed by pouring down the sanitary sewer drain or otherwise transported to a wastewater treatment plant for disposal. If you do not know the exact amount of food waste disposed, please provide as accurate an estimate as possible.
Question: What is the total weight in pounds of food waste transported to disposal facilities such as landfills, municipal waste incinerators and wastewater treatment plants by all of your company’s U.S. operations during calendar year 2015?
Food waste disposed in pounds: _________________________ lbs.
Question: Please use the following scale to indicate the accuracy of your answer to the question above. Number one on the scale indicates that your answer is a best guess based on experience, not measured data. Number five indicates that your answer is based on some measured data used to extrapolate a somewhat accurate answer. Number ten means that your answer is based on actual measures that are believed to be very accurate.
Please circle one number: 1 – 2 – 3 – 4 – 5 – 6 – 7 – 8 – 9 – 10
Question: What is the total weight in pounds of all municipal waste (i.e. all garbage, including food waste) transported to disposal facilities such as landfills, municipal waste incinerators and wastewater treatment plants by all of your company’s U.S. operations during calendar year 2015?
Total waste disposal in pounds: _________________________ lbs.
Question: Please use the following scale to indicate the accuracy of your answer to the question above. Number one on the scale indicates that your answer is a best guess based on experience, not measured data. Number five indicates that your answer is based on some measured data used to extrapolate a somewhat accurate answer. Number ten means that your answer is based on actual measures that are believed to be very accurate.
Please circle one number: 1 – 2 – 3 – 4 – 5 – 6 – 7 – 8 – 9 – 10
Comparison Data
Question: Over the last two years has your company invested time and/or resources to more accurately measure any of the following?
Food waste generation Yes____ No____
Food waste disposal Yes____ No____
Food recycling (composting, anaerobic digestion, etc.) Yes____ No____
Food donations for human consumption Yes____ No____
Food sent to animal feed Yes____ No____
Other Yes____ No____
If you answered yes to any above, please explain what investments (time, resources, etc.) your company has made for more accurate measurement?

45
Feedback (Optional)
Question: Please provide feedback regarding any difficulties encountered with completing this survey or any suggestions for improving future surveys.
Food Waste Reuse and Recycling Destinations as found in the new Food Loss and Waste Protocol Accounting and Reporting Standard
• Animal feed: Diverting to feed animals, directly or after processing. • Bio-based materials /biochemical processing: Converting to industrial products. Examples
include creating fibers for packaging material, creating bioplastics (e.g., polylactic acid), making “traditional” materials such as leather or feathers (e.g., for pillows), and rendering fat, oil, or grease into a raw material to make products such as soaps, biodiesel, or cosmetics. “Biochemical processing” does not refer to anaerobic digestion or production of bioethanol through fermentation.
• Codigestion / anaerobic digestion: Breaking down biodegradable matter via bacteria in the absence of oxygen. This process generates biogas and nutrient-rich matter. Codigestion refers to the simultaneous anaerobic digestion of multiple organic wastes in one digester. This category includes fermentation (converting carbohydrates - such as glucose, fructose, and sucrose - via microbes into alcohols in the absence of oxygen).
• Composting / aerobic processes: Breaking down biodegradable matter via bacteria in oxygen-rich environments. Composting refers to the production of organic material (via aerobic processes) that can be used as soil amendment.
• Incineration: Combusting solid and liquid material in controlled incineration facilities. • Land application: Spreading, spraying, injecting, or incorporating organic matter onto or
below the surface of the land to take advantage of their soil enhancing qualities.

46
APPENDIX
APPENDIX 4: 2016 RESTAURANT FOOD DONATION & FOOD WASTE SURVEY
The National Restaurant Association (NRA) has partnered with the Grocery Manufacturer’s Association (GMA) and Food Marketing Institute (FMI) to address the important issues of food insecurity and food waste in the United States. Together we formed the Food Waste Reduction Alliance (FWRA), which has two goals - to increase the amount of unsaleable food donated to food banks and reduce the amount of food waste sent to landfills. The purpose of this survey is to better understand how much food is being donated, how much food waste is being recycled or recovered, and how much is sent to landfills and other waste disposal facilities in the United States.
Your participation in this simple survey is critical to the success of this important initiative. To ensure confidentiality, we have engaged Deloitte Consulting to handle all of the data. Results will only be presented to NRA, GMA, and FMI in the aggregate without attribution to any company.
The timeframe for this survey is calendar year 2015, so please provide 2015 data to all questions.
General Information: General information regarding the size of your company is needed in order to analyze the data, and to make industry-wide assumptions after the data is aggregated.
Question: Company name ____________________________.
Question: Annual U.S. sales __________________________.
Question: Number of U.S. employees (rounded to the nearest thousand ____________.
Question: Point of contact information (name, phone number and email)
_______________________________________________________________________.
Restaurant Brands in the United States:
Question: Brand Name(s): ________________________________________________.
Question: Total number of U.S. restaurant locations: ____________________________.
Question: Restaurant concept(s) (Quick Serve, Casual Dining, Fast Casual, Casual, Café/Bistro, Fine Dining, or Other): ___________________________________.
Question: Percent of U.S. Locations which are Company Owned and Franchisee Owned:
% Company Owned____________ % Franchisee Owned_____________
Question: The FWRA conducted this same survey in 2014. Has your company responded the survey in the past? _______________________________.

47
Question: If you answered yes to the previous question, have there been any significant changes to your company that would affect comparability of this survey to the last survey? ________________________________________________________________.
Question: If yes, please explain. ____________________________________________.
Unsaleable Food Donations for Human Consumption: Please only include unsaleable food in your answer below. Unsaleable food refers to food that would have been discarded but was instead donated to feed people. Do not include food that is prepared expressly for donation, for example through a holiday program or during a disaster recovery.
Question: What is the total amount in pounds of unsaleable food donated for human consumption by all of your company’s U.S. operations (including company owned, franchise locations, and distribution centers) in calendar year of 2015?
If you do not know the exact amount, please provide as accurate an estimate as possible.
Donations in pounds: _________________________ lbs.
Question: Please use the following scale to indicate the accuracy of your answer to the question above. Number one indicates that your answer is a best guess based on experience, not measured data. Number five indicates that your answer is based on some measured data used to extrapolate a somewhat accurate answer. Number ten means that your answer is based on actual measures that are believed to be very accurate.
Please circle one number: 1 – 2 – 3 – 4 – 5 – 6 – 7 – 8 – 9 – 10
Question: Are there barriers, either internal or external, that prevent your company from donating more food? For example: liability concerns, regulatory constraints, food bank limitations (i.e. insufficient refrigeration, transportation, etc.).
Yes____ No____
Question: If yes, please check all that apply and explain in the space below or by attaching a separate page.
Liability concerns Yes____ No____
Regulatory constraints Yes____ No____
Insufficient refrigeration and/or storage onsite Yes____ No____
Insufficient refrigeration and/or storage at Food Bank Yes____ No____
Transportation constraints (distance, cost, fleet, etc.) Yes____ No____
Other barriers (please list) Yes____ No____
Please explain here or attach a separate page:
______________________________________________________________________.

48
Question: Please rate your company’s interest In Participating in an Established Food Donation
Program
( ) No interest
( ) Low interest
( ) Moderate interest
( ) Very interested
( ) Don't know
() N/A (Already participate)
Food Waste Reuse and Recycling:
Food waste can be defined as any solid or liquid food substance, raw or cooked, which is discarded, or intended or required to be discarded. Food wastes are the organic residues generated by the processing, handling, storage, sale, preparation, cooking, and serving of foods. Pre-consumer food waste refers to waste produced in the production of a product and can often be referred to as back of the house waste. (Scraps, etc.) Post-consumer food waste refers to waste produced by the end user or customer and can often be referred to as front of the house food waste or plate waste. This definition of food waste includes all “material types” (i.e. food and inedible parts like bananas and
the peel) as defined by the new Food Loss & Waste Protocol Accounting Standard (FLW Standard) which was developed by the World Resources Institute and available for download at www.wri.org.
Question: What is the total amount in pounds of food waste that is reused or recycled by all of your company’s U.S. operations (including company owned, franchise locations, and distribution centers) during calendar year 2015? This includes composting, conversion to biodiesel or animal feed, etc. If you do not know exact amounts, please provide as accurate an estimate as possible. Please provide a total weight and breakdown by category or destination, if possible. The following destinations are from the FLW Standard. Please refer to the table at the end of this survey for definitions of each.
Pre-Consumer Post-Consumer
Animal Feed __________ lbs. ___________ lbs.
Bio-based materials/biochemical processing
(e.g. recycling used cooking oil for biodiesel) __________ lbs. ___________ lbs.
Co-digestion/anaerobic digestion __________ lbs. ___________ lbs.
Composting or aerobic processes __________ lbs. ___________ lbs.
Incineration/combustion for onsite heat/energy recovery ________ lbs. ___________ lbs.
Land application __________ lbs. ___________ lbs.
All other __________ lbs. ___________ lbs.
Total _____________ lbs. __________ lbs.
If applicable please describe “All Other” destinations listed above: ___________________________________

49
Question: Please use the following scale to indicate the accuracy of your answer to the question above. Number one indicates that your answer is a best guess based on experience, not measured data. Number five indicates that your answer is based on some measured data used to extrapolate a somewhat accurate answer. Number ten means that your answer is based on actual measures that are believed to be very accurate.
Please circle one number: 1 – 2 – 3 – 4 – 5 – 6 – 7 – 8 – 9 – 10
Barriers and challenges to recycling food waste
Question: Are there barriers, either internal or external, that prevent your company from reusing or recycling more food waste? For example; liability concerns, limited access to organics recyclers, food safety concerns, etc. Yes_____ No_____
Question: If yes, please check all that apply and explain in the space below or by attaching a separate page. Please also explain how or if these barrier have changed over the last two years and what if anything is your company doing to overcome these barriers.
Liability concerns Yes____ No____
Food safety concerns regarding collection and storage Yes____ No____
Insufficient recycling options Yes____ No____
Transportation constraints (distance, cost, etc.) Yes____ No____
Management or Building constraints Yes____ No____
Other (please describe) _____________________ Yes____ No____
Please explain here or attach a separate page: _________________________________.
Question: What percentage of your restaurant locations currently have organics recycling services (i.e. food waste recycling services)? ____________________________
What percentage of your restaurant locations currently have used cooking oil recycling services (i.e. cooking oil for biodiesel)? __________________________
Total Percentage____________________________
Question: Rate your company’s interest in providing organics recycling/food waste recycling
( ) No interest
( ) Low interest
( ) Moderate interest
( ) Very interested
( ) Don't know
() N/A (Already participate)

50
Food Waste Solid Waste Disposal: This includes all food wastes, as defined above, that are transported to traditional disposal facilities such as landfills, municipal waste incinerators and wastewater treatment plants. Do not include food waste listed as reused or recycled in the question above. Also, do not include food/organic residuals disposed via sanitary sewers due to routine cleaning and sanitation. If you do not know the exact amount of food waste disposed, please provide as accurate an estimate as possible.
Question: What is the total amount in pounds of food waste that is transported to disposal facilities such as landfills and municipal waste incinerators by all of your company's U.S. operations during calendar year 2015? Please answer for both pre and post-consumer waste to the best of your ability.
Pre-consumer waste ___________________lbs.
Post-consumer waste ___________________lbs.
Total ___________________lbs.
Question: Please use the following scale to indicate the accuracy of your answer to the question above. Number one indicates that your answer is a best guess based on experience, not measured data. Number five indicates that your answer is based on some measured data used to extrapolate a somewhat accurate answer. Number ten means that your answer is based on actual measures that are believed to be very accurate.
Please circle one number: 1 – 2 – 3 – 4 – 5 – 6 – 7 – 8 – 9 – 10
Question: What is the total amount in pounds of municipal solid waste (all garbage, including food waste) transported to disposal facilities such as landfills and municipal waste incinerators by all of your company's U.S. operations during calendar year 2015?
_______________________________________________________________________.
Question: Please use the following scale to indicate the accuracy of your answer to the question above. Number one indicates that your answer is a best guess based on experience, not measured data. Number five indicates that your answer is based on some measured data used to extrapolate a somewhat accurate answer. Number ten means that your answer is based on actual measures that are believed to be very accurate.
Please circle one number: 1 – 2 – 3 – 4 – 5 – 6 – 7 – 8 – 9 – 10
Comparison Data
Question: Over the last two years has your company invested time and/or resources to more accurately measure any of the following?
Food waste generation Yes____ No____
Food waste disposal Yes____ No____
Food recycling (composting, anaerobic digestion, etc.) Yes____ No____
Food donations for human consumption Yes____ No____
Food sent to animal feed Yes____ No____
Other Yes____ No____
Question: you answered yes to any above, please explain what investments (time, resources, etc.) your company has made for more accurate measurement?
____________________________________________________________________

51
Feedback (optional)
Question: Please provide feedback regarding any difficulties encountered with completing this survey or any suggestions for improving future surveys.
Please explain here or attach a separate page:
Food Waste Reuse/Recycling Destinations as found in the Food Loss and Waste Protocol Accounting and Reporting Standard
• Animal feed: Diverting to feed animals, directly or after processing. • Bio-based materials / biochemical processing: Converting to industrial products. Examples
include creating fibers for packaging material, creating bioplastics (e.g., polylactic acid), making “traditional” materials such as leather or feathers (e.g., for pillows), and rendering fat, oil, or grease into a raw material to make products such as soaps, biodiesel, or cosmetics. “Biochemical processing” does not refer to anaerobic digestion or production of bioethanol through fermentation.
• Codigestion / anaerobic digestion: Breaking down biodegradable matter via bacteria in the absence of oxygen. This process generates biogas and nutrient-rich matter. Codigestion refers to the simultaneous anaerobic digestion of multiple organic wastes in one digester. This category includes fermentation (converting carbohydrates - such as glucose, fructose, and sucrose - via microbes into alcohols in the absence of oxygen).
• Composting / aerobic processes: Breaking down biodegradable matter via bacteria in oxygen-rich environments. Composting refers to the production of organic material (via aerobic processes) that can be used as soil amendment.
• Incineration: Combusting solid and liquid material in controlled incineration facilities. • Land application: Spreading, spraying, injecting, or incorporating organic matter onto or
below the surface of the land to take advantage of their soil enhancing qualities.