fuzzy based sustainability indicator for product...
TRANSCRIPT

FUZZY BASED SUSTAINABILITY INDICATOR FOR PRODUCT DESIGN
AND DEVELOPMENT PROCESS
ABDUL RAHMAN HEMDI
A thesis submitted in fulfilment of the
requirements for the award of the degree of
Doctor of Philosophy (Mechanical Engineering)
Faculty of Mechanical Engineering
Universiti Teknologi Malaysia
APRIL 2013

iii !
ACKNOWLEDGEMENTS
In the name of Allah SWT, the Most Gracious and the Most Merciful, I thank
You for giving me the strength to complete this thesis. This thesis would not have
been completed without the support and assistance of many people.
First and foremost, my sincere gratitude and appreciation goes to my
supervisor, Assoc. Prof. Dr. Muhamad Zameri Bin Mat Saman and co-supervisor,
Professor Dr. Safian B. Sharif for their constructive ideas, criticisms, guidance, and
patience throughout the duration of preparing this thesis. They have successfully
guided me through some stressful times and were always willing to sharpen my
understanding of this thesis and other academic writings. It was a great privilege to
work under their supervision because their professional expertise and many
constructive and insightful comments had contributed tremendously in focusing my
thoughts and ideas.
I wish to thank Prof. Dr. Roslan B. Abdul Rahman (Dean of the Faculty of
Mechanical Engineering, UTM) and other faculty members as well as the support
staff of the Faculty of Mechanical Engineering, UTM, for their encouragement and
kind assistance rendered to me throughout my study. My gratitude also goes to
Ministry of Higher Education and Universiti Teknologi MARA for granting me the
scholarship and study leave to pursue this PhD. degree.
I wish to remember my beloved late parent, Hj. Hemdi bin Hamid and Hajah
Halijah bt. Hasbullah who were instrumental in this accomplishment. My greatest
pleasure would be to share this moment with them. Due appreciation is also extended
to my father and mother in-laws, and my other family members (sisters, brothers, and

iv !
in-laws) who have given me their prayers, encouragement, and unfailing support for
me to go through this journey.
A note of thanks also goes to all my colleagues at the Post-graduate Ph.D
Room – Feri Afrinaldi, Melfa Yola, Loh Wai Hong, Ong Cheow Hong, Muhammad
B. Azmi, Salwa Mahmood, Mohd Nasir, Mohd Azmin, Mohd Rasli, Hassan
AbdelWahab, Arshad A Salema, and many others for their moral support, guidance,
encouragement, and friendship.
Finally and most important, I would like to extend my gratitude and affection
to my beloved wife, Ilyani Farha Bt Mohammad, and childrens, Ahmad Safwan,
Hannah Safiyah and Muhammad Imran. Thank you for providing me with
overwhelming patience, support, love, encouragement, and inspiration that has
greatly facilitated the completion of this challenging work.

v
ABSTRACT
Traditionally, the remedial ‘end of pipe’ control was applied to reduce environmental impact during a product’s entire life. Unfortunately, this method requires too much time to fix the problem rather than preventing it. Therefore, shifting from corrective into prevention act is more essential in preserving our environment. The environmental consideration during design stage is the best preventive action to reduce the impacts. Additionally, economic and social factors also need to be considered in improving a product’s sustainability performance. Research has established the importance of developing a specific tool to fulfill the needs of a sustainable product. Several tools are available such as Eco Indicator 95 and 99, Life Cycle Index, Ten Golden Rules etc., however most of these tools only focus on one or two sustainability elements whereas sustainability requires the consideration of the environment, economic and social elements and the proposed method considers all three. Furthermore, sustainability elements involve various parameters including pollution, cost and energy, among others which then increase the complexity in decision making process. Subsequently, the quantitative and qualitative data of sustainability parameters further complicate this evaluation. In this study, a comprehensive method for evaluating sustainability is proposed to assist engineers and designers in making better decisions. A fuzzy approach has been applied in the sustainability evaluation because of its capability in reducing data uncertainty and simultaneous handling of qualitative and quantitative data. The sustainability input parameters from life cycle inventory databases such as European Life Cycle Database, Ecoinvent and others are converted into an index value which is known as sustainability indicator. A case study involving an automotive headlamp, passenger car and selection of a sustainable electrical power generation plant is presented. The results are also compared with Eco Indicator 99 to validate the accuracy of the assessment. From the comparison, it is found that the result of the developed sustainability indicator agrees with the Eco Indicator 99 approach. Therefore, the developed sustainability indicator is able to indicate the sustainability performance of a product and also highlight the critical area for improvement.
vi !
ABSTRAK
Secara tradisi, langkah pemulihan ‘end of pipe’ dilaksanakan bagi mengurangkan impak sesuatu produk terhadap alam sekitar. Malangnya, cara ini memerlukan tempoh masa yang lama untuk membaiki punca masalah daripada cuba menghindarinya. Oleh itu, untuk memelihara alam memerlukan perubahan tindakan daripada membaiki kepada menghindari. Cara yang terbaik untuk mengurangkan impak adalah dengan mengambil kira faktor alam sekitar semasa proses rekaan sesuatu produk bermula. Sementara itu, elemen ekonomi and sosial juga perlu di beri perhatian untuk meningkatkan kelestarian sesuatu barangan. Kajian telah menunjukkan kepentingan untuk membangunkan kaedah tersendiri bagi menghasilkan barangan lestari. Antara kaedah yang boleh digunakan ialah Eco Indicator 95 dan 99, Life Cycle Index, Ten Golden Rules dan lain-lain yang mana kebanyakannya hanya mengambil kira satu atau dua elemen kelestarian sedangkan ia memerlukan aspek keseluruhan seperti alam sekitar, ekonomi dan sosial dan kaedah yang dicadangkan mengambil kira ketiga-tiganya. Tambahan pula, kelestarian melibatkan pelbagai kriteria seperti pencemaran, kos, tenaga dan lain-lain yang mana boleh meningkatkan kesukaran dalam proses membuat keputusan. Dengan adanya data kuantitatif dan kualitatif lebih menyukarkan lagi proses penilaian ini. Didalam kajian ini, langkah yang mudah untuk menilai kelestarian diperkenalkan bagi membantu jurutera dan pereka dalam membuat keputusan yang terbaik. Kaedah “Fuzzy” telah digunakan didalam penilaian kelestarian kerana ia mampu mengurangkan ketidaktentuan data dan mampu menilai data dalam bentuk kualitatif dan kuantitatif. Kriteria lestari masukan daripada pangkalan data seperti European Life Cycle Database, Ecoinvent dan lain-lain ditukarkan kepada nilai indek yang kemudiannya dinamakan sebagai penunjuk kelestarian. Kajian kes tentang lampu hadapan kenderaan, kereta penumpang dan pemilihan loji kuasa elektrik lestari telah dijalankan. Hasil keputusan daripada kajian kes dibandingkan dengan Eco Indicator 99 untuk mengesahkan keberkesanan penilaian. Daripada hasil perbandingan, didapati ada keseragaman keputusan antara penunjuk kelestarian dan Eco Indicator 99. Oleh itu, penunjuk kelestarian yang dibangunkan mampu menilai potensi kelestarian sesuatu barangan serta mampu menunjukkan aspek kritikal untuk penambahbaikan.

vii
TABLE OF CONTENTS
CHAPTER TITLE PAGE
DECLARATION ii
ACKNOWLEDGEMENT iii
ABSTRACT v
ABSTRAK vi
TABLE OF CONTENTS vii
LIST OF TABLES xiv
LIST OF FIGURES xix
LIST OF ABBREVIATIONS xxvi
LIST OF SYMBOLS xxx
LIST OF APPENDICES xxxiii
1 INTRODUCTION 1
1.1 Background of the Study 1
1.2 Problem Definition 5
1.3 Research Questions 6
1.4 Objectives of the Study 7
1.5 Scope of the Study 8
1.6 Significant of the Study 8
1.7 Assumptions 10
1.8 Organization of the Thesis 10
2 LITERATURE REVIEW 12
2.1 Overview 12

viii
2.2 Concept of Sustainability 12
2.3 Sustainable Products 14
2.4 Measuring Product Sustainability 16
2.4.1 Evaluation Methods 17
2.4.1.1 Qualitative Method 18
2.4.1.2 Quantitative Method 19
2.4.2 Boundary of Analysis 21
2.4.2.1 Cradle-to-Gate Analysis 22
2.4.2.2 Cradle-to-Grave Analysis 23
2.5 Existing Methods and Tools for Sustainability
Assessment
24
2.5.1 Eco Indicator 95 24
2.5.2 Eco Indicator 99 24
2.5.3 Life Cycle Index (LiNX) 25
2.5.4 Green Pro 25
2.5.5 Green Pro I 26
2.5.6 Ten Golden Rules 26
2.5.7 Volvo’s Black, Grey and White Lists 26
2.5.8 Simplified LCA (SLCA) and Environmental
Responsible Product Assessment (ERPA)
27
2.5.9 Oil Point Method 28
2.6 Summary of Existing Sustainability Tools 28
2.7 Further Improvement 32
2.7.1 Sustainable Perspective 33
2.7.2 Cost Evaluation 33
2.7.3 Guide for Decision Making 34
2.7.4 Life Cycle Approach 35
2.8 Summary 36
3 ISSUES ON SUSTAINABILITY 37
3.1 Overview 37
3.2 Concept of Indicator 37
3.3 Sustainability Parameter / Sustainability Basic 40

ix
Indicator
3.3.1 Carbon Dioxide (CO2) 43
3.3.2 Nitrous Oxide (N2O) 44
3.3.3 Methane (CH4) 44
3.3.4 Nitrogen Dioxide (NO2) 44
3.3.5 Sulphur Dioxide (SO2) 45
3.3.6 Biochemical Oxygen Demand (BOD) 45
3.3.7 Phosphate (PO43-) 45
3.3.8 Nitrogen (N) 46
3.3.9 Solid Waste 46
3.3.10 Chemical Waste 47
3.3.11 Cost 47
3.3.12 Renewable Material 48
3.3.13 Nonrenewable Material 48
3.3.14 Renewable Energy 48
3.3.15 Nonrenewable Energy. 49
3.3.16 Carbon Monoxide (CO) 49
3.3.17 Particulate Matter (PM10) 50
3.3.18 Non Methane Volatile Organic Compound
(NMVOC)
50
3.3.20 Ammonia (NH3) 50
3.3.21 Lead (Pb) 51
3.3.22 Mercury (Hg) 51
3.3.23 Benzene (C6H6) 52
3.3.24 Arsenic (As) 52
3.3.25 Cadmium (Cd) 53
3.3.26 Nickel (Ni) 54
3.4 Categorizing the Sustainability Parameters 54
3.5 Sustainability in Malaysia 56
3.5.1 Green Technology Policy 57
3.5.2 SIRIM Eco-label 58
3.6 Legislation Relating to Sustainability 59
3.6.1 European Union Directive 59

x
3.6.2 Malaysia Environmental Quality Act 61
3.7 International Standard of Life Cycle Assessment,
ISO 14040
65
3.8 Life Cycle Database 69
3.8.1 US Life Cycle Inventory Database 70
3.8.2 European Life Cycle Database (ELCD) 70
3.8.3 Ecoinvent Database 71
3.9 Fuzzy Logic 71
3.10 Fuzzy Rule-based System 73
3.11 Summary 74
4 METHODOLOGY 76
4.1 Overview 76
4.2 General Procedure for Determining the
Sustainability Indicator
77
4.3 The Framework 78
4.4 Methodology for Developing the Sustainability
Indicator
78
4.4.1 Identifying the Sustainability Attributes or
Parameters
80
4.4.2 Boundary of Analysis 81
4.4.3 Elementary Input and Output from
Boundary
81
4.4.5 Classification of Sustainability Attributes 83
4.4.6 Assigning Sustainability Attributes Toward
Impact Categories
84
4.5 Determination of the Sustainability Indicator 86
4.5.1 Determination of Sustainability Sub-
element Index
88
4.5.1.1 Sustainability Input Parameter 89
4.5.1.2 Normalization Limit 89
4.5.1.3 Fuzzy Membership Function 90
4.5.1.4 Fuzzy Rules 97
xi
4.5.1.5 Fuzzification 107
4.5.1.6 Fuzzy Operator 107
4.5.1.7 Fuzzy Inference 108
4.5.1.8 Defuzzification 111
4.5.2 Determination of the Sustainability
Element Index
112
4.5.3 Determination of the Sustainability
Indicator
113
4.6 Life Cycle Assessment Index 114
4.7 Weightage 115
4.8 User Interface of the Sustainability Indicator 115
4.8.1 The GUI Main Page 117
4.8.2 The Environmental Assessment Page 120
4.8.3 The Economic Assessment Page 123
4.8.4 The Social Assessment Page 123
4.8.5 The Result Page 128
4.9 Validation 130
4.10 Summary 130
5 CASE STUDY AND RESULTS 132
5.1 Overview 132
5.2 Sustainability Assessment of the Automotive
Headlamp
133
5.2.1 Maximum and Minimum Values 137
5.2.2. Assessment Results of the Headlamp 139
5.2.3 Comparison of the Sustainability
Performance of Headlamp Components
152
5.3 Sustainability Assessment of Headlamp Parts 156
5.3.1 Headlamp Housing 156
5.3.1.1 Sustainability Assessment Results
for the Headlamp Housing
158
5.3.2 FTS Reflector 166
5.3.2.1 Sustainability Assessment Results 168

xii
for the FTS Reflector
5.3.3 Sustainability Assessment for the Bezel 177
5.3.3.1 Sustainability Assessment Results
for the Bezel
179
5.3.4 Sustainability Assessment for the Hall
Reflector
187
5.3.4.1 Sustainability Assessment Results
for the Hall Reflector
189
5.3.5 Sustainability Assessment for Outer Lens 198
5.3.5.1 Sustainability Assessment Results
for the Outer Lens
200
5.4 Passenger Car 208
5.4.1 Input Data for the Fuzzy Sustainability
Evaluation of the Passenger Car
210
5.4.2 Sustainability Element Assessment Results
for the Passenger Car
211
5.4.3 Sub Sustainability Element Results for the
Passenger Car
218
5.5 Validation 221
5.6 Case Study on the Comparison and Selection of a
Sustainable Alternative
227
5.6.1 Sustainability Assessment Results of the Power
Plant
230
5.7 Summary 235
6 DISCUSSION 236
6.1 Overview 236
6.2 Review of Achievement 236
6.3 Critical Appraisal 241
6.4 Summary 242
7 CONCLUSION 244
7.1 Conclusion 244

xiii
7.2 Future Work 247
REFERENCES 250
Appendices A – U 259 - 344

xiv
LIST OF TABLES
TABLE NO. TITLE PAGE
2.1 Example of quantitative evaluation using a scoring method
applied in the Life Cycle Index (LInX)
20
2.2 Summary of tools for measuring sustainability 28
2.3 Comparison of sustainable tools based on the selection of
sustainable element, boundary, and method of analysis
30
3.1 Numerical values used to classify the sustainability
performance to assist designers for material selection
39
3.2 Example of indicator values (millipoints per kg) for several
ferrous metals using Eco-indicator 99
39
3.3 Example of performance indicators or attributes of the
environmental aspect
42
3.4 Malaysian eco-labeling scheme standards 58
3.5 List of controlled substances prohibited from use as
propellants and blowing agents
62
3.6 Standard emission levels for petrol engines 63
3.7 Emission levels for vehicles carrying goods with weights
not exceeding 3.5 tons
63
3.8 Emission standards for new and existing petrol engine
models
63
3.9 Maximum noise level for two or three-wheel vehicles with
respect to the engine capacity
64
3.10 Maximum noise level for motor vehicle with more than
three wheels
65

xv
4.1 Classification of data for environmental sustainability 83
4.2 Classification of data for economic sustainability 83
4.3 Classification of data for social sustainability 84
4.4 The ranking and normalization limit of qualitative input
parameter for technology status
97
4.5 List of fuzzy rule for each sub-element of sustainability 98
4.6 Fuzzy rule to determine sub-sustainability element index
(global warming)
99
4.7 The fuzzy rule to determine sub-sustainability element
index (acidification)
100
4.8 The fuzzy rule to determine sub-sustainability element
index (eutrophication)
100
4.9 The fuzzy rule to determine sub-sustainability element
index (pollution)
101
4.10 The fuzzy rule to determine sub-sustainability element
index (resource)
101
4.11 The fuzzy rule to determine sub-sustainability element
index (energy)
102
4.12 The fuzzy rule to determine sub-sustainability element
index (cost)
102
4.13 The fuzzy rule to determine sub-sustainability element
index (human health)
103
4.14 The fuzzy rule to determine sub-sustainability element
index (heavy metal)
104
4.15 The fuzzy rule to determine sub-sustainability element
index (carcinogen)
105
4.16 Defining diagram for the fuzzy sustainability GUI
evaluation
116
5.1 Description of the headlamp component 134
5.2 Weight distribution of the headlamp 134
5.3 List of databases used for the sustainability evaluation of
the headlamp
134

xvi
5.4 Environmental input data for sustainability assessment of
the headlamp
135
5.5 Economic input data for sustainability assessment of the
headlamp
136
5.6 Social input data for sustainability assessment of the
headlamp
136
5.7 Maximum and minimum values for the automotive
headlamp
138
5.8 Results of the environmental assessment of the headlamp 139
5.9 Results of the economic assessment of the headlamp 144
5.10 Results of the social assessment of the headlamp 144
5.11 Sustainability element index for the headlamp 146
5.12 Sub sustainability element index for the headlamp 148
5.13 Normalization limit used in comparing the sustainability
performance of the headlamp components
152
5.14 Sustainability element index and sustainability index for the
headlamp component
154
5.15 Input data for the environmental analysis of the headlamp
housing
156
5.16 Input data for the economic analysis of the headlamp
housing
157
5.17 Input data for the social analysis of the headlamp housing 157
5.18 Sustainability element index and sustainability indicator for
the headlamp housing
158
5.19 Sub sustainability element index and life cycle index for the
headlamp housing
159
5.20 Input data for the environmental analysis of the FTS
reflector
167
5.21 Input data for the economic analysis of the FTS reflector 167
5.22 Input data for the social analysis of the FTS reflector 168
5.23 Sustainability element index and sustainability indicator for
the FTS reflector
173
xvii
5.24 Sub sustainability element index and life cycle index for the
FTS reflector
173
5.25 Input data for the environmental analysis of the bezel 177
5.26 Input data for the economic analysis of the bezel 178
5.27 Input data for the social analysis of the bezel 178
5.28 Sustainability element index and sustainability indicator for
the bezel
179
5.29 Sub sustainability element index and life cycle index for the
bezel
184
5.30 Input data for the environmental analysis of the hall
reflector
188
5.31 Input data for the economic analysis of the hall reflector 188
5.32 Input data for the social analysis of the hall reflector 188
5.33 Sustainability element index and sustainability indicator for
the hall reflector
194
5.34 Sub sustainability element index and life cycle index for the
hall reflector
194
5.35 Input data for the environmental analysis of the outer lens 198
5.36 Input data for the economic analysis of the outer lens 199
5.37 Input data for the social analysis of the outer lens 199
5.38 Sustainability element index and sustainability indicator for
the outer lens
200
5.39 Sub sustainability element index and life cycle index for the
outer lens
205
5.40 Life cycle data of the passenger car for sustainability
analysis
209
5.41 Input data for the environmental analysis of the passenger
car
210
5.42 Input data for the economic analysis of the passenger car 210
5.43 Input data for the social analysis of the passenger car 211
5.44 Sustainability element index and sustainability indicator for
the passenger car
212

xviii
5.45 Sub sustainability element index and life cycle index for the
passenger car
212
5.46 Summary of the life cycle assessment of the headlamp
using EcoIndicator 99
221
5.47 EcoIndicator 99 results for the headlamp component 224
5.48 Life cycle assessment results of the passenger car using
EcoIndicator 99
225
5.49 Data specification for five types of electrical power
generation plants
228
5.50 Classification and grouping of sustainability parameters for
the evaluation of power plant alternatives
228
5.51 List of the number of fuzzy rules to determine the
sustainability sub-element index
229
5.52 Sustainability sub-element indices of each power generation
alternative
230
5.53 Sustainability element indices for each power generation
alternative
233
5.54 Sustainability indicator for each power plant alternative 234
5.55 Ranking for the sustainable power plants 234
6.1 Summary of sustainability attributes, sub-attributes, and
parameters involved in sustainability evaluation
238

xix
LIST OF FIGURES
FIGURE NO. TITLE PAGE
1.1 Chain of product sustainability 3
2.1 Three pillars of sustainable development consisting of
economic growth, environmental protection, and social
progress
13
2.2 Three elements of sustainable development (from left to
right): the theory, the reality, and the change needed to
better balance the model
14
2.3 Environmental evaluation method applied in Canon Inc. 15
2.4 The Toyota vehicle is equipped with Seat Weldrive,
which can be used as a motorized wheelchair, thereby
fulfilling the company’s social responsibility
16
2.5 Classification of tools for measuring product
sustainability
17
2.6 Example of a design for environment guidelines derived
from the Ten Golden Rules
19
2.7 Evaluation of environmental impact using a graphical
method applied in the simplified life cycle assessment
(SLCA)
20
2.8 Definition of cradle-to-gate and cradle-to-grave boundary 22
2.9 Cradle-to-gate boundary, consisting of raw material
extraction and manufacturing stages
23

xx
2.10 Cradle-to-grave boundary, consisting of raw material
extraction, manufacturing, transportation, usage, and end-
of-life stage
23
3.1 Proposed scale for viability levels 38
3.2 Concept of sustainability indicators (0 indicates the worst
sustainability and 1 indicates the best sustainability)
40
3.3 Example of a product system for life cycle inventory
analysis
41
3.4 Example of set of unit processes within a product system 41
3.5 Categorizing and assigning sustainability attributes based
on its potential impact into the sustainable indicators
55
3.6 Categorizing and assigning parameters to indicator using
the Eco-indicator 99
56
3.7 Malaysian eco-label (SIRIM 2011) 58
3.8 Stages of life cycle assessment according to ISO 14040 66
3.9 Procedure for the life cycle impact assessment (LCIA)
phase
68
3.10 Block diagram of a single-output fuzzy rule-based system 74
4.1 The general procedure to determine the sustainability
indicator
77
4.2 Framework of product sustainability evaluation 79
4.3 Steps in identifying the sustainability attributes 80
4.4 The cradle to grave boundary analysis as applied into the
evaluation of sustainability indicator
81
4.5 Product system boundary (cradle to grave) containing
five sub-system boundaries representing every product
life cycle
82
4.6 Sustainability attributes for proposed indicator 85
4.7 Stages for developing sustainability indicator 87
4.8 Fuzzy operation to determine sustainability sub-element
index
88
4.9 The graph of triangular membership function of uA(x) 91
4.10 The three degrees of triangular input membership 92
xxi
4.11 The five output degrees of the triangular membership
functions L, LM, M, MH, and H)
93
4.12 Triangular input membership for qualitative data of
technology status
97
4.13 Degree of truth of statement - energy is high 107
4.14 The fuzzy operator (OR) is applied if the antecedent has
more than one part (or more than 1 input or attribute)
108
4.15 The application of implication operator (minimum)
resulting in the truncation of the output graph into the
fuzzy set
109
4.16 Aggregation of each of the three rules resulting in another
fuzzy set
110
4.17 Implication and aggregation processes using the Matlab
fuzzy toolbox
110
4.18 Result of defuzzification – a centroid of area under the
curve
111
4.19 General flow of fuzzy sustainability assessment GUI 118
4.20 Flow chart of the main page of sustainability indicator
GUI
119
4.21 Screenshot of the title or main page of the fuzzy
sustainability evaluation
119
4.22 Screenshot of the part description to enter the part detail
(left hand side) and selection of sustainability element to
be evaluated (right hand side)
120
4.23 Flow chart for the environmental assessment GUI 121
4.24 Screenshot for environmental input and the assessment
result for the sub-sustainability element index
122
4.25 Flow chart for the economic assessment GUI 124
4.26 Screenshot for economic input and the assessment result
for sub sustainability element index
125
4.27 Flow chart for the social assessment GUI 126
4.28 Screenshot for the social assessment 127

xxii
4.29 Flowchart of the overall sustainability assessment result
GUI
128
4.30 The page of the overall sustainability assessment result 129
5.1 Headlamp of the Proton Exora 133
5.2 Product structure of the headlamp 133
5.3 Fuzzy GUI for environmental assessment of the headlamp 140
5.4 Example of fuzzy inference to determine waste index,
Iwaste, which is determined from the nine fuzzy rules
142
5.5 Fuzzy GUI for economic assessment of headlamp 143
5.6 Fuzzy GUI for social assessment of the headlamp 145
5.7 Overall results of the fuzzy sustainability assessment for
the headlamp
147
5.8 Sustainability indicator of the environmental, economic,
and social elements for the automotive headlamp
149
5.9 Sustainability indicator for each life cycle of headlamp 149
5.10 Sustainability element index across the life cycle of the
headlamp
150
5.11 Sub sustainability element index for the headlamp 151
5.12 Sub sustainability element index of the headlamp during
the raw material extraction phase.
151
5.13 Comparison of the headlamp part in terms of
sustainability performance
154
5.14 Sustainability element index for each headlamp part 155
5.15 Weight distribution of the headlamp 155
5.16 GUI environmental assessment results for the headlamp
housing
160
5.17 GUI economic assessment results for the headlamp
housing
161
5.18 GUI social assessment results for the headlamp housing 162
5.19 Summary of the sustainability assessment results for the
headlamp housing
163

xxiii
5.20 (a) Sustainability element index for the headlamp
housing, (b) life cycle index for the headlamp housing, (c)
sustainability element index for each stage in the life
cycle of the headlamp housing
165
5.21 Sub sustainability element indices for each stage in the
life cycle of the headlamp housing: (a) raw material, (b)
manufacturing, (c) transportation, (d) usage, and (e) end
of life
166
5.22 GUI environment assessment results for the FTS reflector 169
5.23 GUI economic assessment results for the FTS reflector 170
5.24 GUI social assessment results for the FTS reflector 171
5.25 The GUI sustainability assessment results for the FTS
reflector
172
5.26 (a) Sustainability element index for the FTS reflector, (b)
life cycle index for the FTS reflector, (c) sustainability
element index for each life cycle of the FTS reflector
175
5.27 Sub sustainability element index for the FTS reflector of
each stage in the life cycle: (a) raw material, (b)
manufacturing, (c) transportation, (d) usage, and (e) end
of life
176
5.28 GUI environmental assessment results for the bezel 180
5.29 GUI economic assessment results for the bezel 181
5.30 GUI social assessment results for the bezel 182
5.31 GUI sustainability assessment results for the bezel 183
5.32 (a) Sustainability element index for the bezel, (b) life
cycle index for the bezel, (c) sustainability element index
for each stage in the life cycle of the bezel
185
5.33 Sub sustainability element indices for each stage in the
life cycle of the bezel: (a) raw material, (b)
manufacturing, (c) transportation, (d) usage, and (e) end
of life
187
5.34 GUI environmental assessment results for the hall
reflector
190

xxiv
5.35 GUI economic assessment results for the hall reflector 191
5.36 GUI social assessment results for the hall reflector 192
5.37 GUI sustainability assessment results for the hall reflector 193
5.38 (a) Sustainability element index for the hall reflector, (b)
life cycle index for the hall reflector, (c) sustainability
element index for each life cycle of the hall reflector
195
5.39 Sub sustainability element indices for each stage in the
life cycle of the hall reflector: (a) raw material, (b)
manufacturing, (c) transportation, (d) usage, and (e) end
of life
197
5.40 GUI environmental assessment results for the outer lens 201
5.41 GUI economic assessment results for the outer lens 202
5.42 GUI social assessment results for the outer lens 203
5.43 GUI sustainability assessment results for the outer lens 204
5.44 (a) Sustainability element index for the outer lens, (b) life
cycle index for the outer lens, (c) sustainability element
indices for each stage in the life cycle of the outer lens
206
5.45 Sub sustainability element indices for each stage in the
life cycle of the outer lens: (a) raw material, (b)
manufacturing, (c) transportation, (d) usage, and (e) end
of life
207
5.46 Results of the environmental assessment of the passenger
car
213
5.47 Results of the economic assessment of the passenger car 214
5.48 Results of the social assessment of the passenger car 215
5.49 Overall sustainability assessment results and indicator for
the passenger
216
5.50 (a) Sustainability element index for the passenger car, (b)
life cycle index for the passenger car, (c) sustainability
element indices for each stage in the life cycle of the
passenger car
218
xxv
5.51 Sub sustainability element indices for each stage in the
life cycle of the passenger car: (a) raw material, (b)
manufacturing, (c) transportation, (d) usage, and (e) end
of life
220
5.52 Life cycle assessment results of the headlamp using
EcoIndicator 99
222
5.53 Life cycle assessment results of the headlamp using the
fuzzy sustainability method
223
5.54 Assessment results of the headlamp component using
EcoIndicator 99
224
5.55 Assessment results of the headlamp part using the fuzzy
sustainability evaluation method
224
5.56 Assessment results of the passenger car using
EcoIndicator 99
226
5.57 Assessment results of the passenger car using the fuzzy
sustainability indicator method
226
5.58 Sub sustainability element indices for (a) coal (average),
(b) coal (NSPS), (c) coal (LEBS), (d) natural gas, and (e)
biomass power plant
232
5.59 Sustainability element performance for each power plant 233
5.60 Sustainability indicators for power generation plant
alternatives
234
xxvi
LIST OF ABBREVIATIONS
ABS - Acrylonitrile butadiene styrene
AHP - Analytical Hierarchy Procedure
BOD - Biochemical oxygen demand
BOM - Bill of material
C - Degree celcius
Cd - Cadmium
CF - Carbon Footprint
CFC - Chlorofluorocarbon
CFCl3 - Triklorofluorometana (CFC-11)
CF2Cl2 - Diklorodifluorometana (CFC-12)
C2F3Cl3 - Triklorotrifluoroetana (CFC-113)
C2F4Cl2 - Diklorotetrafluoroetana (CFC-114)
C2F5Cl - Kloropentafluoroetana (CFC-115)
CH4 - Methane,
CO - Carbon monoxide
CO2 - Carbon dioxide
CoC DFE - Center of Competence for Design for Environment
COSHH - Control of Substances Hazardous to Health Regulation
DfAD - Design for Assembly and Disassembly
DfE - Design for Environment
DfX - Design for X
EC - European Commission
EI 99 - Eco-indicator 99
ELCD - European Life Cycle Database

xxvii
ELV - End of Life Vehicle
EoL - End of Life
EPD - Environmental Product Declaration
ERPA - Environmental Responsible Product Assessment
EU - European Union
GUI - Graphic of user interface
H - High
HDPE - High-density polyethylene
HFC - Hydrofluorocarbon
Hg - Mercury
HSE - Health, safety and environment
IARC - International Agency for Research on Cancer
IPCC Intergovernmental Panel on Climate Change
IPP - Integrated Product Policy
ISO - International Standard Organization
L - low
LCA - Life cycle assessment
LCI - Life Cycle Inventory
LCIA - Life Cycle Impact Assessment
LCM - Life Cycle Management
LInX - Life Cycle Index
LM - Low to medium
kg - Kilo gram
kJ - Kilo joule
km - Kilometer
kWatt - Kilo watt
kWh - Kilo Watt . hour
L - Liter
LCA - Life Cycle Assessment
LEBS - Low emission boiler system
M - Medium
m - Meter
MDCM - Multi Criteria Decision Making

xxviii
MH - Medium to high
MJ - Mega Joule
MS - Malaysia standard
NH3 - Ammonia
NMVOC - Non methane volatile organic compound
NO2 - Nitrogen dioxide
NOx - Nitrous oxide
N2O - Nitrogen oxide
NREL - National Renewable Energy Laboratory
NSPS - New Source Performance Standard
O3 - Trioxygen or ozone
OP - Oil point
Pb - Lead
PBB - Polybrominated biphenyls
PBDE - Polybrominated diphenyl ethers
PBT - Polybutyleneterephthalate
PC - Polycarbonate
PCB - Polychlorinated biphenyls
PCT - Polychlorinated triphenyls
PET - Polyethylene terephthalate
PM10 - Particulate matter less than 10µm
PP - Polypropylene
PU Polyurethane
PVC - Polyvinyl chloride
REACH - Registration, Evaluation, Authorisation and Restriction of
Chemicals directive
RM - Ringgit Malaysia
RoHs - Restriction of Hazardous Substances
SIRIM - Standards and Industrial Research Institute of Malaysia
SLCA - Simplified Life Cycle Assessment
SO2 - Sulfur dioxide
SPM - Suspended particulate matter
t.km - Ton kilometer

xxix
US - United States
VOCs - Volatile organic compounds
WEEE - Waste of Electrical and Electronic Equipment directive
WHO - World Health Organization

xxx
LIST OF SYMBOLS
d - Current value
dmax - Maximum target / reference value
dmin - Minimum target / reference value
u - Normalization value
AND - Fuzzy operator (minimum)
OR - Fuzzy operator (maximum)
Igw - Global warming index
Iacid - Acidification index
Ieutro - Eutrophication index
Icost - Cost index
Ienergy - Energy index
Imaterial - Material index
Ihealth - Human health index
Ihm - Heavy metal index
Icarcinogen - Carcinogen index
Ienvi - Environmental index
Ieco - Economic index
Isocial - Social index
Isustain - Sustainability index
Lµ - LOW degree fuzzy membership function
MLµ - LOW to MEDIUM degree fuzzy membership function
Mµ - MEDIUM degree fuzzy membership function
HMµ - MEDIUM to HIGH degree fuzzy membership function
Hµ - HIGH degree fuzzy membership function
xxxi
( )xLµ - Degree of membership for x input value of LOW fuzzy
linguistic variable
( )xLMµ - Degree of membership for x input value of LOW to
MEDIUM fuzzy linguistic variable
( )xMµ - Degree of membership for x input value of MEDIUM
fuzzy linguistic variable
( )xMHµ - Degree of membership for x input value of MEDIUM to
HIGH fuzzy linguistic variable
( )xHµ - Degree of membership for x input value of HIGH fuzzy
linguistic variable
x - Fuzzy input variable
L - Fuzzy linguistic variable for LOW degree
LM - Fuzzy linguistic variable for LOW to MEDIUM degree
M - Fuzzy linguistic variable for MEDIUM degree
MH - Fuzzy linguistic variable for MEDIUM to HIGH degree
H - Fuzzy linguistic variable for HIGH degree
R - Number of fuzzy rule
n - Degree of input variables or number of input degrees
v - Number of input variables or number of facts in the
premise
X* - Defuzzified output or defuzzification
Ni(x) - Aggregated membership function
Ij - Index of stage 2 for j-th categories or sustainability
element index
Iij - Sub-element of sustainability index
w - Weightage
i - Sustainability sub element (global warming, pollution,
eutrophication, acidification, resource, energy, cost,
human health, heavy metal and carcinogen
j - Sustainability element (environment, economic and social)
wgw - Weight of global warming index
wacid - Weight of acidification index
weutro - Weight of eutrophication index

xxxii
wcost - Weight of cost index
wenergy - Weight of energy index
wmaterial - Weight of material index
whealth - Weight of human health index
whm - Weight of heavy metal index
Isustainability. - Sustainability indicator
wenvi - Weight of environment
weco - Weight of economic
wsocial - Weight of social
Ik - Life cycle index
k - Product life cycle (raw material extraction, manufacturing,
transportation, usage and end of life
Iik - Sub sustainability element index during k life cycle
i - Sub sustainability element
Iraw - Life cycle index during raw material extraction stage
Imfg - Life cycle index during manufacturing stage
Itransport Life cycle index during transportation stage
Iusage Life cycle index during usage stage
Ieol Life cycle index during end of life stage

xxxiii
LIST OF APPENDICES
APPENDIX TITLE PAGE
A Fuzzy membership function for qualitative input data 259
B Development of Fuzzy Rule 261
C Life cycle inventories for bezel 263
D Life cycle inventories for FTS reflector 267
E Life cycle inventories for hall reflector 271
F Life cycle inventories for housing 275
G Life cycle inventories for outer lens 279
H Sustainability input parameter for automotive
headlamp
283
I The sample calculation of total N2O emitted during
the life cycle of the automotive headlamp
284
J The sample calculation to obtain the economic input
data for headlamp
287
K The sample calculation to determine the carbon
monoxide (CO) input data for headlamp
290
L Sample calculation to determine sub sustainability
element index using fuzzy method
293
M Life cycle inventories for passenger car (raw material
extraction)
307
N Life cycle inventories for passenger car
(Manufacturing)
315
O Life cycle inventories for passenger car
(Transportation)
319

xxxiv
P Life cycle inventories for passenger car (Usage) 323
Q Life cycle inventories for passenger car (End of life) 324
R Assessment of automotive headlamp using Eco
Indicator 99
330
S Assessment of passenger car using Eco Indicator 99 332
T The set of fuzzy rules used for assessing the
sustainability indicator of power plant.
335
U List of publications 344

CHAPTER 1
INTRODUCTION
1.1 Background of the Study
Every year the human population grows, creating a negative impact on the
Earth. As the population grows, more domestic and non-domestic products are
produced due to higher demand. In addition, the mass production of products in
greater volumes heavily consumes energy and raw materials. As a result, the natural
resources for the future generation are depleting. Meanwhile, huge amounts of waste
and emissions are released during manufacturing, use, and end of the product life
cycle. The chemical and hazardous wastes from industries contaminate the natural
water stream such as rivers and seas, resulting in harmful effects on humans, plants,
and animals. Additionally, more land area is required to provide landfill for solid
waste disposal, buildings, and houses. The entire situation decreases the
sustainability of the world.
Sustainability can be defined as “a notion of viable futures,” which includes
aspects of the environment, public health, social equity, and justice (Blevis, 2007).
The detailed definition of sustainable development described by Karlsoon and
Luttropp (2006) is a “process of change in which the exploitation of resources, the
direction of investments, the orientation of technical development and institutional
2
change are all in harmony with the enhancement both the current and future potential
to meet human needs and aspirations.” In other words, current activities eventually
will have an impact on the next generation. As such, the efficient management of
activities is crucial to minimize the negative impact on the future generation
Sustainability depends on the size of population and impact. As the
population and impact continue to grow, the world becomes less sustainable. To
improve or maintain sustainability is a big challenge, because the population keeps
growing every year (United Nations, 2009). Another alternative approach of
maintaining world sustainability is to reduce the level of impact by designing and
producing sustainable products that have less impact on the future generation.
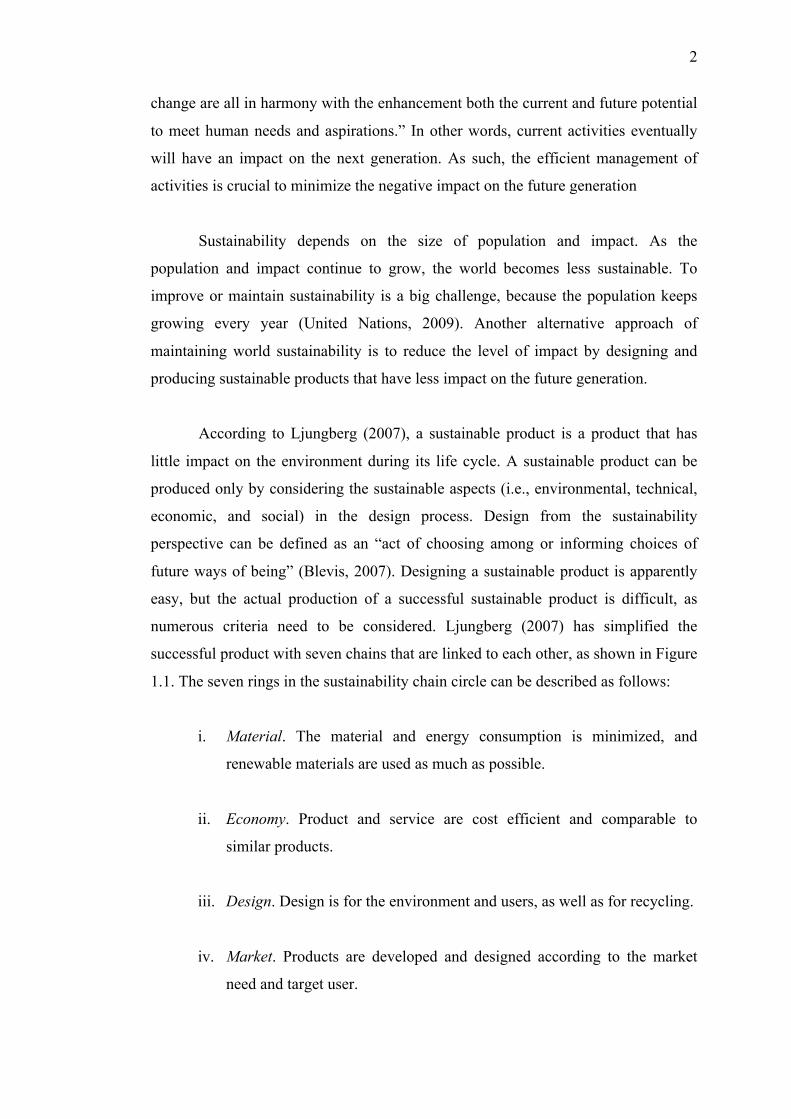
According to Ljungberg (2007), a sustainable product is a product that has
little impact on the environment during its life cycle. A sustainable product can be
produced only by considering the sustainable aspects (i.e., environmental, technical,
economic, and social) in the design process. Design from the sustainability
perspective can be defined as an “act of choosing among or informing choices of
future ways of being” (Blevis, 2007). Designing a sustainable product is apparently
easy, but the actual production of a successful sustainable product is difficult, as
numerous criteria need to be considered. Ljungberg (2007) has simplified the
successful product with seven chains that are linked to each other, as shown in Figure
1.1. The seven rings in the sustainability chain circle can be described as follows:
i. Material. The material and energy consumption is minimized, and
renewable materials are used as much as possible.
ii. Economy. Product and service are cost efficient and comparable to
similar products.
iii. Design. Design is for the environment and users, as well as for recycling.
iv. Market. Products are developed and designed according to the market
need and target user.

3
v. Equity. Trading equity and the impact on the local and global community
are considered.
vi. Technology. The extraction of raw materials, and the production,
lifetime, and quality of products are optimized.
vii. Ecology. Emissions and wastes are eliminated, and the environmental
impact is minimized.
Figure 1.1 Chain of product sustainability (Ljungberg, 2007)
Some benefits are present in producing a sustainable product. A sustainable
product not only minimizes the environmental burden, but also meets the market
needs and fulfills the national and international legislation. As environmental
awareness is now emerging, most countries adapt environmentally conscious
legislation in product development. In 2000, the European Union (EU) directive was
developed by considering the end-of-life vehicle (ELV). The automotive industry is a
concern of the EU because of its major manufacturing activities in the world. In
addition, the automotive industry involves several suppliers and other parts
manufacturers in producing a vehicle, and they have to follow the regulation of the
EU directive (Gerrard and Kandlikar, 2007). As a result of such regulation, the
automotive industry is expected to have a huge contribution in improving world
sustainability
The EU directive on ELVs was designed to reduce the waste disposal
problem caused by automotive industries. Article 7(b) of the ELV directive states,
Material
Economy
Design
Market Equity
Ecology
Techno-logy
Chain of Product
Sustainability
4
“no later than 1 January 2015, for all end-of life vehicles, the reuse and recovery
shall be increased to a minimum of 95% by an average weight per vehicle”. Within
the same time limit, the re-use and recycling shall be increased to a minimum of 85%
by an average weight per vehicle and year” (European Parliament, 2000). All the
vehicle producers and suppliers must comply with the legislation to allow them to
market their products to all European countries by 2015. Thus, most vehicle
manufacturers have to shift toward design for sustainability. Some of the big
automotive players, such as BMW, Toyota, and Opel, are already adopting
sustainable perspectives
Today, consumers’ product preference is not only based on functionality,
quality, and cost, but on the environmental aspect as well. Consumer awareness on
environmental issues is increasing and they are willing to pay for “green” or
environmentally conscious products, and this phenomenon creates new opportunities
in marketing strategies. Developing sustainable products can be the best strategy to
survive in today’s market. Moreover, developing green products will increase the
sales volume and profits. For example, BMW produced a vehicle whose components
can be reused, recycled, and remanufactured by considering the end-of-life of the
product (BMW Group, 2008). Other manufacturers such as Toyota are taking a
different route in product sustainability by integrating universal design in their cars
to fulfill the social aspect, which is one of the elements of sustainability (Toyota
Motor Co., 2007). Consequently, a sustainable product can be a competitive
advantage in the current market.
The sustainable perspective must be integrated into the design process at the
early stage of new product development to produce a sustainable product. The
adaptation of a sustainability perspective during the design phase helps in producing
a sustainable product with the ability to minimize waste and allow product
recyclability and longevity.

5
1.2 Problem Definition
Sustainability is proportionally inversed to the population and impact.
Reducing the world population is difficult; nevertheless, reducing the impact toward
the environment and humans is possible. One solution is to reduce the waste by
reusing, remanufacturing, and recycling. Another approach is to apply good
manufacturing practices by increasing process efficiency, reducing energy use, and
promoting a zero emission process. These measures are usually adopted at the
current life cycle stage. For example, recycling is undertaken only after the end-of-
life of a product, and energy reduction is only considered at the manufacturing and
use stage. In the short term, these approaches seem to be effective; however, these
actions should be undertaken at the earliest stage possible to maintain long-term
sustainability. These actions can be undertaken possibly during the product
development or product design phase.
At the design stage, the impact of each life cycle stage of the product toward
sustainability will be evaluated. With regard to the environmental aspect, the new
product must not produce and emit substances that have a high impact toward global
warming, biodiversity, and toxicity. In relation to the economic factors, the product
must be designed with minimum cost by reducing the use of materials, energy, and
other resources. At the same time, human health and safety must also be considered
during the design stage through methods such as eliminating the use of hazardous
materials and reducing nuisance by reducing noise level and particulate matter while
manufacturing the product.
Various legislations, such as the EU directive on the end of life vehicle
(ELV), restriction of hazardous substances (RoHS), and Kyoto Protocol, are being
introduced to protect the world sustainability. By enforcing such regulations, the
manufacturers have to comply to enable them to market their products globally.
Indirectly, these requirements have raised the awareness of the manufacturers,
shifting their perception toward producing environmentally conscious products.
Some examples of design methodologies that assist designers in producing green
products are design for recycling, design for assembly and manufacture, design for

6
environment, and life cycle design. However, most of these current methods only
focus on the environmental aspect, whereas sustainability requires a broader area
such as the inclusion of economic and social aspects. Thus, an opportunity arises for
researchers to explore a new research area to develop a methodology for sustainable
product design.
The sustainable perspective must be integrated at the early stage in the
product development process to produce a sustainable product. In this case, the role
of the designer is important in achieving this objective by considering the inclusion
of sustainable elements in their design (Yang and Song, 2006). However, inclusion
of the sustainable perspective is difficult because of the designers’ lack of knowledge
on environmental, economic, and social issues. As a result, evaluating their design in
terms of sustainability is impossible. Thus, a comprehensive tool is necessary to
assist the designers in designing and developing a sustainable product, and at the
same time, enabling the measurement of the sustainability level of design. By
evaluating product sustainability, the designers can easily identify the weakness of
their design for further improvement and select the best sustainable design alternative
(Almeida and Barros, 2006)
1.3 Research Questions
The research questions of this study are as follows
i. Is there any methodology on product sustainability assessment that
includes all the three main aspects (environmental, economic, and
social) and cost analysis in their assessment?
ii. How can both qualitative and quantitative data of sustainability
parameters be evaluated?

7
iii. Is the sustainability indicator able to identify the weaknesses and
strengths of a product, which then can aid product improvement?
iv. Is the indicator value able to visualize the sustainability performance?
1.4 Objectives of the Study
The following are the objectives of this study:
i. To develop a methodology for a sustainability indicator that will be
used to assess the sustainability performance of a product;
ii. To integrate the environmental, economic, and social aspects in the
evaluation of the sustainability indicator;
iii. To apply the fuzzy inference technique in the evaluation and
determine the sustainability performance of a product; and
iv. To verify the effectiveness of the sustainability indicator methodology
using several case studies.

8
1.5 Scope of the Study
The scopes of the study are as follows:
i. Three aspects of sustainability elements, such as environmental,
economic, and social factors are evaluated in the proposed
methodology.
ii. The boundary of analysis of the developed methodology is based on
the cradle-to-grave approach.
iii. The international standard for life cycle assessment, ISO 14040:2006
(Life Cycle Assessment) is used as the guideline in developing the
sustainability indicator.
1.6 Significance of the Study
The significance of the current study are as follows:
i. A new concept in product development is developed by considering
sustainable perspectives in the design process. The three elements of
sustainability, namely, environmental, economic, and social aspects, are
considered in the product development phase.
ii. The study is used to provide assistance in developing a sustainable
product and maintain world sustainability. The sustainability indicator is a
method for measuring the sustainability level of a product or process. By
knowing the sustainability performance, the critical area can be identified
and the necessary action can be taken for further improvement. Thus, the

9
sustainability indicator helps the designer to produce a sustainability
conscious product.
iii. The outcome of the study is expected to be applied in a new design
process to compete in the current market. Awareness of environmental
issues and knowledge is emerging among the public through various
advertisements on the internet and in the multimedia environment. The
customers’ product preference is now shifting from price concern to
environmental interest. Customers are willing to pay more for an
environmentally conscious product, thus creating a new market trend. As
such, the developed sustainability indicator is very useful in assisting the
manufacturer in marketing a product that has low environmental burden,
less cost, high profit, and less impact on the social aspect.
iv. The study can help the designers and manufacturers meet the national and
international legislations, such as the EU directive on the ELV, RoHS,
and Malaysia environment standards, for their products. Currently, most
countries are aware of world sustainability and the regulations developed
to maintain this sustainability. In Malaysia, the Environmental Act 1974
was enacted, which covers the waste, hazardous substances, and gaseous
emissions, among others. These legislations become a constraint for most
manufacturers and designers to create and market their products. The
developed fuzzy sustainability indicator can be used to help the designer
and manufacturer meet the local and international requirements. Criteria
such as solid waste, greenhouse gaseous, heavy metal, and chemical
waste are taken as the input parameters for sustainability evaluation.
Accordingly, measuring the sustainability performance also guides the
designers in meeting the regulation.
v. The sustainability evaluation method is to be used in decision making and
design improvement of a new or existing product. Hence, this method
guides the designer in developing a product with a high sustainability
performance.

10
1.7 Assumptions
The proposed sustainability indicator is implemented under several
assumptions:
i. The sustainability parameter evaluated depends on data availability, and
represents the sustainability performance of the product.
ii. The life cycle database used to determine the input value of the
sustainability parameter is valid and credible.
iii. The manufacturing cost is assumed to be the labor cost per unit part or
product.
iv. The benefit from recycling material is assumed to be the profit gain from
selling the material to the recycling company with the assumption cost of
RM 0.30 per kilogram.
v. The transportation cost is assumed to be the cost of fuel use to transport
the product.
1.8 Organization of the Thesis
This thesis consists of seven chapters. Chapter 1 presents the background of
the study, problem definition, objectives, and scope of the study, assumptions used,
and significance of the study.
Chapter 2 presents a detailed literature review covering a number of relevant
topics, such as the concept of sustainability, product sustainability, sustainability
11
elements and sub-elements, and current available methods for measuring
sustainability.
Chapter 3 elaborates several topics related to sustainability assessment, such
as the sustainability parameter, boundary of analysis, and concept of indicator, to
name a few. The local and international regulations and fuzzy inference system are
also discussed in this chapter.
Chapter 4 discusses a methodology for this research, which consists of the
development of the sustainability indicator. This chapter also discusses the fuzzy
technique used in the evaluation of product sustainability. In addition, it presents the
steps required to develop fuzzy sustainability assessment.
Chapter 5 presents the application of the developed fuzzy sustainability
assessment (sustainability indicator) method to analyze the sustainability
performance of the product.
Chapter 6 discusses the work that has been carried out in developing the
methodology of the fuzzy sustainability assessment. This chapter provides the whole
view of the research with its ultimate result.
Lastly, the Chapter 7 provides a summary of the main research outcomes of
this thesis, including the research implications. This chapter also reveals
opportunities for future research.

250
REFERENCES
Abele, E., Anderl, R., and Birkhofer, H. (2005).Environmentally-Friendly Product
Development: Methods and Tools, USA.:Springer-Verlag London Ltd.
Adams, W.M. (2006). The Future of Sustainability: Re-thinking Environment and
Development in the Twenty-first Century.Report of the IUCN Renowned
Thinkers Meeting.
Agency for Toxic Substances and Disease Registry (ATSDR)(2004).AmmoniaCas
#7664-41-7. [Brochure].Atlanta, GA: US Department of Health and Human
Services, Public Health Service.
Agency for Toxic Substances and Disease Registry(ATSDR)(2007a).BenzeneCas
#71-43-2.[Brochure]. Atlanta, GA: US Department of Health and Human
Service,Public Health Service.
Agency for Toxic Substances and Disease Registry(ATSDR) (2007b), ToxGuide for
Arsenic.[Brochure]. Atlanta, GA: US department of health and human
service, Public Health Service.
Agency for Toxic Substances and Disease Registry (ATSDR) (2007c).ToxGuide for
Nickel.[Brochure]. Atlanta, GA: US department of health and human
service,Public Health Service.
Almeida, P.F. and Barros, H.B. (2006). Towards Indicators of Sustainable Product
Design.Proceeding of 2006 IEEE International: Engineering Management
Conference. 17-20 September. 274-277.
Aroz, R., Hassan, M.N. and Ibrahim, N.A. (2003).Review of Air Pollution and
Health Impacts in Malaysia.Environmental Research, 92, 71-77.
Bardossy, A. and Duckstein, L. (1995). Fuzzy Rule-based Modelling with
Application to Geophysical, Biological and Engineering Systems. USA: CRC
Press.

251
Benetto, E., Dujet, C. andRousseaux, P. (2008).Integrating Fuzzy
MulticriteriaAnalysis and Uncertainty Evaluation in Life Cycle Assessment,
Environmental Modelling& Software, 23, 1461-1467.
Blevis, E. (2007).Sustainable Interaction Design: Invention & Disposal, Renewal &
Reuse,CHI 2007 Proceedings: Design Theory, April 28-May 3, San Jose,
USA. 503-512.
BMW Group (2000). Manual for Recycling-Optimised Product Development.
Germany. BMW Group.
BMW Group (2008). Sustainable Value Report 2007/2008. Germany. BMW Group.
British Standard Institution (1998).B.S. EN ISO 14041. London: British Standard
Institutions.
British Standard Institution (2006).B.S. EN ISO 14040. London: British Standard
Institutions
Byggeth, S. and Hochschorner, E. (2006). Handling Trade-offs in Ecodesign Tools
for Sustainable Product Development and Procurement.Journal of Cleaner
Production, 14, 1420-1430.
Canon Inc. (2008).Canon Sustainability Report 2008. Japan. Canon Inc.
Cornelissen, A.M.G., Van Den Berg, J., Koops, W.J., Grossman, M. and Udo, H.M.J.
(2001). Assessment of the Contribution of Sustainability Indicators to
Sustainable Development: A Novel Approach Using Fuzzy Set Theory.
Agriculture, Ecossystem and Environment, 86, 173-185.
Department of Environment (2006).Malaysia Environmental Quality Report
2006.Ministry of Natural Resources and Environment.Petaling Jaya,
Malaysia: Sasyaz Holding Sdn. Bhd.
Dunnick, J.K., Elwell, M.R., Radovsky, A.E., Benson, J.M., Hahn, F.F., Nikula, K.J.,
Barr, E.B., Hobbs, C.H.(1995) Comparative Carcinogenic Effects of Nickel
Subsulfide, Nickel Oxide or Nickel Sulfate HexahydrateChronic Exposures in
the Lung, Cancer Research, 55, 5251-5256
Ecoinvent Centre (2011). Ecoinvent Database,,Retrived from
http://www.ecoinvent.org/database/ on 10 Julai 2011
European Life Cycle Database, http://lca.jrc.ec.europa.eu/lcainfohub/datasetArea.vm,
retrivedon 20 feb 2012
European Parliament (2000).Directive 2000/53/EC of the European Parliament and
of the Council of 18 September 2000 on End-of Life Vehicle, Brussels.

252
European Parliament. (2002). The Control of Substances Hazardous to Health
Regulations, The Stationery Office Limited, UK.
European Parliament (2003a). Directive 2002/95/EC of the European Parliament
and of the Council of 27 January 2003 on Restriction of Hazardous
Substances, RoHS, Brussels.
European Parliament (2003b). Directive 2002/96/EC of the European Parliament
and of the Council of 27 January 2003 on Waste of Electrical and Electronic
Equipment, WEEE, Brussels.
European Parliament, (2006).Registration, Evaluation, Authorisation and Restriction
of Chemicals (REACH), Regulation (EC) No. 1907/2006.Official Journal of
the European Union, L 396/1-849.
Forster, P., V. Ramaswamy, P., Artaxo, T., Berntsen, R., Betts, D.W., Fahey, J.,
Haywood, J., Lean, D.C., Lowe, G.,Myhre, J.,Nganga, R.,Prinn, G., Raga, M.,
Schulz and Van Dorland, R., (2007). Changes in Atmospheric Constituents
and inRadiative Forcing. In Solomon, S., D. Qin, M. Manning, Z. Chen, M.
Marquis, K.B. Averyt, M.Tignor and H.L. Miller (eds.).Climate Change
2007:The Physical Science Basis. Contribution of Working Group I to the
Fourth Assessment Report of the Intergovernmental Panel on ClimateChange.
(pp. 131-217) USA : Cambridge University Press.
Fuji Xerox Co. (2007).Sustainability Report 2007: Toward sustainable society. Japan.
Gehin, A., Zwolinski, P. and Brissaud, D. (2008). A Tool to Implement Sustainable
End-of-life Strategies in the Product Development Phase.Journal of Cleaner
Production, 16, 566-576.
Gerrard, J. andKandlikar, M. (2007).Is European End-of-life Vehicle Legislation
Living Up to Expectation? Assessing the Impact of the ELV Directive on
‘Green’ Innovation and Vehicle Recovery.Journal of Cleaner Production, 15,
17-27.
Global Environment Centre, Solid Waste in Malaysia, retrieved from
http://www.gecnet.info/index.cfm?&menuid=83 on 20 Feb 2012
Giudice, F., Rosa, G.L. and Risitano, A. (2006).Product Design for the Environment,.
USA: CRC Press.
Goedkoop, M., Demmers, M. and Collignon, M. (1996), Eco Indicator 95: Manual
for Designer. Netherlands :Product Ecology Consultants (PRé).

253
Goedkoop, M. and Spriensma, R. (2001), Eco Indicator 99 A Damage Oriented
Method for Life Cycle Impact Assessment : Methodology Report.
(3rded.)Netherlands: Product Ecology Consultants (PRé),.
Graedel, T.E and Allenby, B.R. (2003) Industrial Ecology, New Jersey: Pearson
Education Inc.
Hur, T., Lee, J., Ryu, J. and Kwon, E. (2005).Simplified LCA and Matrix Methods in
Identifying the Environmental Aspects of a Product System, Journal of
Environmental Management, 75, 229-237.
Hirota, K. (Ed.) (1993).Industrial Application of Fuzzy Technology. Berlin: Springer-
Verlag.
Howarth, G. and Hadfield, M. (2006).A Sustainable Product Design Model.Material
and Design, 27, 1128-1133.
International Agency for Research on Cancer. (1998).IARC Monographs on the
Evaluation of Carcinogenic Risks to Humans: Overall Evaluations of
Carcinogenicity:An Updating of IARC Monographs, Volumes 1 to 42,
Supplement 7, World Health Organization.
Karlsoon, R. and Luttropp, C. (2006). EcoDesign: What’s Happening? An Overview
of the Subject Area of EcoDesign and of the Papers in This Special
Issues.Journal of Cleaner Production, 14, 1291-1298.
Kathirvale, S, Muhd Noor, M.Y, Sopian, K and Samsuddin, A.H. (2003)Energy
Potential from Municipal Solid Waste in Malaysia, Renewable Energy, 29,
559-567.
Kaufmann, A. and Gupta, M.M., (1985). Introduction to Fuzzy Arithmetic: Theory
and Applications. New York: Van Nostrand Reinhold Company Inc.
Keoleian, G.A (1994).Product Life Cycle Assessment to Reduce Health Risks and
Environmental Impacts.USA: Noyes Publication.
Khan, F.I., Natrajan, B.R. and Revathi, P. (2001).GreenPro: A New Methodology
for Cleaner and Greener Process Design.Journal of Loss Prevention in the
Process Industries, 14, 307-328.
Khan, F.I, Sadiq, R. and Husain, T.(2002).GreenPro-I: A Risk-based Life Cycle
Assessment and Decision-making Methodology for Process Plant Design.
Environmental Modellingand Software, 17, 669-692.

254
Khan, F.I., Sadiq, R. and Veitch, B. (2004). Life Cycle iNdeX (LInX): A New
Indexing Procedure for Process and Product Design and Decision-making.
Journal of Cleaner Production, 12, 59-76.
Klir, G.J. and Yuan, B.(1995). Fuzzy Sets and Fuzzy Logic: Theory and Application.
New Jersey: Prentice Hall.
Kumar, V. and Sutherland, J. W. (2008).Sustainability of the Automotive Recycling
Infrastructure: Review of Current Research and Identification of Future
Challenges. International Journal of Sustainable Manufacturing,.1,145-167.
Lenau, T. and Bey, N. (2001). Design of Environmentally Friendly Products Using
Indicators, Engineering Manufacture: Special Issue on Recycling in
Manufacture, Procceding of the Institution of Mechanical Engineers.
Li, J., Wu, Z. and Zhang, H.C.(2008), Application of Neural Network on
Environmental Impact Assessments Tools.International Journal Sustainable
Manufacturing, 1, 100-121.
Li, H.X. and Yen, V.C. (1995). Fuzzy Sets and Fuzzy Decision-making. USA: CRC
Press Inc.
Lin, C.T. and Lee, C.S.G. (1996). Neural Fuzzy Systems: A Neuro-Fuzzy Synergism
to Intelligent Systems. New Jersey: Prentice-Hall.
Lin, C.T., and Lu, Y.C. (1995).A Neural Fuzzy System with Linguistic Teaching
Signals.IEEE Transactions on Fuzzy Systems, 3(2).169-189.
Ljungberg, L. Y. (2007).Materials Selection and Design for Development of
Sustainable Products. Materials and Design.28, 466-479.
Lou, H.H., Huang, Y. and Zheng, K. (2009). Sustainability Under Severe
Uncertainty: A Methodological Study. Proceeding of 1st International
Congress on Sustainability Science and Engineering (ICOSSE). 9-12
August.Chincinati, USA.
Luttropp, C and Lagerstedt, J. (2006).EcoDesign and The Ten Golden Rules :
Generic Advice for Merging Environmental Aspects Into Product
Development.Journal of Cleaner Production, 14, 1396–1408.
Malaysia Federal Subsidiary Legislation, (1987)Environmental Quality Act 1974[Act
127]: Environmental Quality (Motor Vehicle Noise) Regulations, P.U.(A)
244/87. Malaysia: PercetakanNasional Malaysia Berhad.

255
Malaysia Federal Subsidiary Legislation, (1989) Environmental Quality Act 1974
[Act 127]:Environmental Quality (Scheduled wastes) Regulations, P.U.(A)
139/89. Malaysia: PercetakanNasional Malaysia Berhad.
Malaysia Federal Subsidiary Legislation, (1993) Environmental Quality Act 1974
[Act 127]: Environmental Quality (Prohibition on the use of
clorofluorocarbons and other gases as propellants and blowing agents)
Order 1993, P.U.(A) 434/93. Malaysia: PercetakanNasional Malaysia Berhad.
Malaysia Federal Subsidiary Legislation, (1996) Environmental Quality Act 1974
[Act 127]: Environmental Quality (Control of emission from petrol engines)
Regulations, P.U.(A) 543/96.Malaysia: PercetakanNasional Malaysia Berhad.
Malaysia Federal Subsidiary Legislation, (1999) Environmental Quality Act 1974
[Act 127]: Environmental Quality (Refrigerant management) Regulations,
P.U.(A) 451/99. Malaysia: PercetakanNasional Malaysia Berhad.
Mendel, J.M., (2001). Uncertain Rule-based Fuzzy Logic Systems: Introduction and
New Directions. New Jersey: Prentice-Hall.
Ministry of Energy, Green Technology and Water, (2011).National Green
Technology, Malaysia, Retrived from
http://www.kettha.gov.my/en/content/definition-green-technology on 20
December 2011.
Ministry of Energy, Water and Communications Malaysia (2006), National Energy
Balance 2006, Bandar BaruBangi, Malaysia: PusatTenaga Malaysia.
National Renewable Energy Laboratory, (2009). US Life Cycle Inventory Database
Roadmap,. United State: US Department of Energy.
Orsato, R.J and Wells, P. (2007).Introduction: The Automobile Industry
&Sustainability. Journal of Cleaner Production, 15, 989-993.
Ott, K. (2003). The Case for Strong Sustainability. In: Ott, K. andThapa, P. (Ed.).
Greifswald’s Environmental Ethics(pp. 59-64).Greifswald:
SteinbeckerVerlag Ulrich Rose.
Phillis, Y.A. and Andriantiatsaholiniaina, L.A. (2001). Sustainability: An Ill-defined
Concept and Its Assessment Using Fuzzy Logic, Ecological economic, 37,
435-456
Pujari, D. (2006).Eco-innovation and New Product Development: Understanding the
Influences on Market Performance, Technovation, 26, 76-85.
256
Rajaram, T. and Das, A. (2010). Modelling of Interactions AmongSustainability
Components of an Agro-ecosystem Using Local Knowledge Through
Cognitive Mapping and Fuzzy Inference System. Expert Systems with
Application, 37, 1734-1744.
Ross, T.J. (2010). Fuzzy Logic with Engineering Application.(3rded.) USA: John
Willey and Sons Ltd.
Saaty, T. L., (2008). Relative Measurement and Its Generalization in Decision
Making: Why Pairwise Comparisons are Central in Mathematics for the
Measurement of Intangible Factors – The Analytic Hierarchy / Network
Process. RASCAM (Review of the Royal Spanish Academy of Sciences, Series
A, Mathematics) 102 (2),: 251-318.
Sadiq,R. and Khan, F. I. (2006). An Integrated Approach for Risk-based Life Cycle
Assessment and Multi-criteria Decision Making – Selection, Design and
Evaluation of Cleaner and Greener Processes.Business Process Management
Journal, 12 (6), 770-792.
Senthil, K.D., Ong, S.K., Nee, A.Y.C. and Tan, Reginald B.H.(2003).A Proposed
Tool to Integrate Environmental and Economical Assessments of
Products.Environmental Impact Assessment Review, 23, 51-72.
Shepetukha, Y. and Olson, D.L. (2001) Comparative Analysis of Multi Attribute
Techniques Based on Cardinal and Ordinal Inputs, Mathematical and
Computer Modelling, 34, 229-241.
Singh, R.N. and Bailey, W.H. (1997). Fuzzy Logic Applications to Multisensory-
multitargetCorrelation, IEEE Transactions on Aerospace and Electronic
System, 33 (3), 752-769.
SIRIM (2011) Sirim Eco-labelling Scheme. [Brochure], issue1, rev 1.Retrieved from
http://www.sirim-qas.com.my/pdf/2011/brochure/SIRIM%20Eco-
Labelling%2017%20Nov%202011.pdf on 20 Feb 2012.
SIRIM (2004), SIRIM QAS International Launches Eco-Labelling
Scheme.Standards and Quality News, 11 (5), 11.
Tan, R.R., Culaba, A.B. and Aviso, K.B. (2008).A Fuzzy Linear Programming
Extension of the General Matrix-based Life Cycle Model.Journal of Cleaner
Production, 16, 1358-1367.

257
The Netherlands, (2000) Eco-indicator 99 Manual for designers: A damage oriented
method for life cycle impact assessment ,Ministry of Housing, Spatial
Planning and the Environment.
Toyota Motor Co. (2007). Sustainability Report 2007: Toward a New Feature for
People, Society and the Planet. Japan: Toyota Motor Corporation.
United Nations (2009). World Population Prospects: The 2008 Revision.Department
of Economic and Social Affairs, Population Division. New York.
United Nations General Assembly (1987).Report of the World Commission on
Environment and Development: Our Common Future. Document A/42/427 -
Development and International Co-operation: Environment. Retrieved from
http://www.un-documents.net/ocf-02.htm.on 15 Febuary 2009.
US Department of Labor, (2002), OSHA Fact Sheet: Carbon Monoxide Poisoning,
[Brochure], United State: Occupational Safety and Health Administration.
US Life Cycle Database, (2012) Retrieved from http://www.nrel.gov/lci/ on 20 Feb
2012.
Verghese, K and Hes, D. (2007).Qualitative and Quantitative Tool Development to
Support Environmentally Responsible Decisions.Journal of Cleaner
Production, 15, 814-818.
Volvo (2002).STD 100-0004: Volvo’s White List. Volvo Group.
Volvo(2005a).STD 100-0002: Volvo’s Black List. Volvo Group.
Volvo (2005b).STD 100-0003: Volvo’s GreyList. Volvo Group.
Wang, L.X., (1994). Adaptive fuzzy systems and control: Design and stability
analysis. New Jersey: Prentice-Hall.
Yanger, R.R. and Zadeh, L.A. (Eds.).(1992). An Introduction to Fuzzy Logic
Applications in Intelligent Systems. USA: Kluwer Academic Press.
Yang, Q.Z. and Song, B. (2006).Eco-Design for Product Lifecycle
Sustainability,IEEE International Conference on Industrial Informatics. 548-
553
Zadeh, L.A., (1973). Outline of a new approach to the analysis of complex systems
and decision process.IEEE transitions on systems, manangement and
cybernetic.SMC-3, 1, 28-44.
Zadeh, L.A., (2008). Is there a need for fuzzy logic?.Information sciences, 178,
2751-2779.
258
Zhou C.C., in, G.F and Hu, X.B. (2008). Multi-objective Optimization of Material
Selection for Sustainable Products: Artificial Neural Networks and Genetic
Algorithm Approach. Material and Design,
doi:10.1016/j.matdes.2008.06.006.
Zimmermann, H.J., (1991). Fuzzy Set Theory and Its Applications. USA: Kluwer
Academic Publisher.