futures & options for farm risk management mar apr maj jun jul aug sep okt nov dec jan arla...
TRANSCRIPT
Futures & Options for Farm Risk
Management
Torbjörn Iwarson, +46-76-050 83 65,
[email protected] twitter: @TorbjornIwarson

Forward contracts are not a recent invention
2
Confirmation on a forward contract on Barley
Delivery point: Mesopotamia, Anum-pisha and Namran-
sharur’s warehouse.
Delivery date: Month of Ulul, 19:th day, the year when
King Abieshuh finished a statue of Entemena as god
(1700 BC)
Ulul = August/September.
Source: Building the Global Market – A 4000 Year History of Derivatives, Edward Swan, Kluwer
Law, 2000
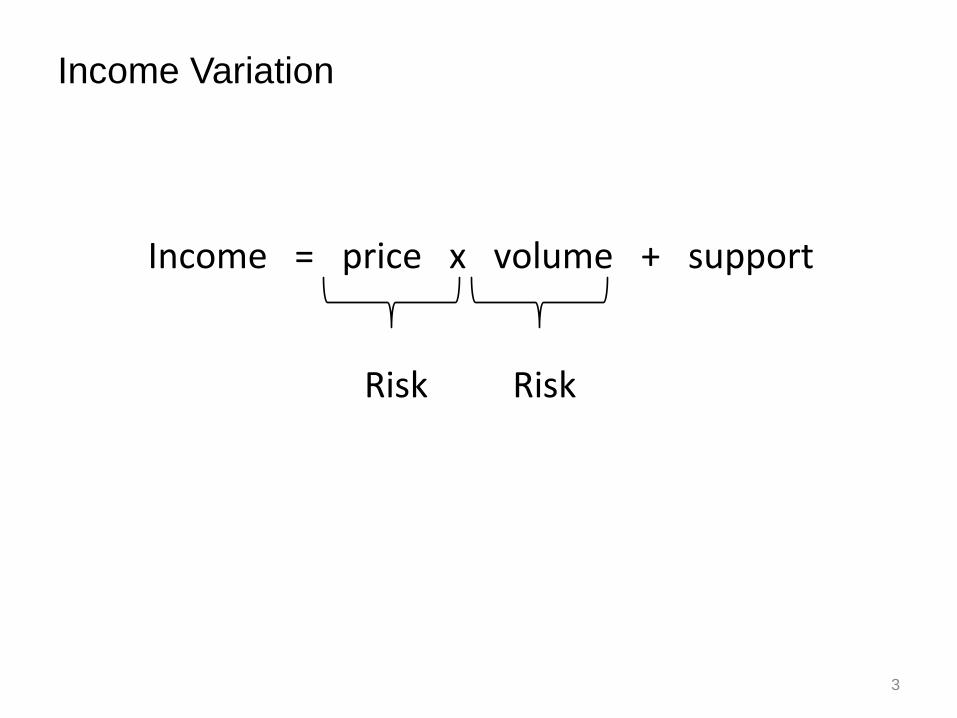
Income Variation
3
Income = price x volume + support
Risk Risk

Price volatil ity
74%
Yield / ha
volatil ity 10 yr
average 26%
Variability of yield and of price in Southern Sweden
4
0%
5%
10%
15%
20%
25%
30%
35%
40%
45%
1975
1978
1981
1984
1987
1990
1993
1996
1999
2002
2005
2008
Std
ev%
Yield/ha volatility
Price volatility

Market Risk is the worst, Irish Farmers say
5
Source: Joughrey, Thorne, et al, ”The Market Risk Perceptions and
Management of Irish Dairy Farmers”, WP presented at the AES Annual
Conference, April 2014

Hedged and unhedged farm
6
• Hedging reduces risk & makes it more attractive to farm
• More food is produced
• Food price becomes lower
Return
Risk
Farm, unhedged
Risk free rate
Farm, hedged
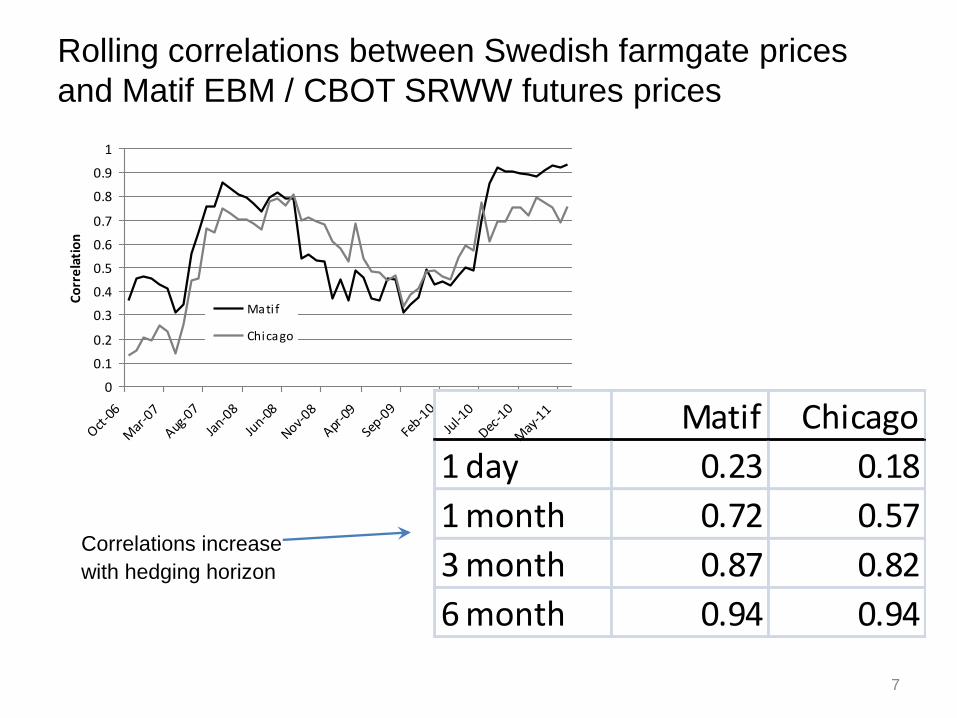
Rolling correlations between Swedish farmgate prices
and Matif EBM / CBOT SRWW futures prices
7
0
0.1
0.2
0.3
0.4
0.5
0.6
0.7
0.8
0.9
1
Oct-0
6
Mar
-07
Aug-0
7
Jan-0
8
Jun-0
8
Nov-08
Apr-0
9
Sep-0
9
Feb-1
0
Jul-1
0
Dec-1
0
May
-11
Correlation
Matif
Chicago
Matif Chicago
1 day 0.23 0.18
1 month 0.72 0.57
3 month 0.87 0.82
6 month 0.94 0.94
Correlations increase
with hedging horizon

You can hedge any Swedish grain with Matif Milling
Wheat
8
0
500
1000
1500
2000
2500
3000
3500
4000
4500
5000
okt-06 okt-07 okt-08 okt-09 okt-10
Oilseeds Malting Barley AstoriaMilling wheat Harnesk Feed wheatFood oats Feed oats

Risk management methods in the US ’Corn Belt’
US Grain Farmers use the following methods:
• 40% forward contracts
• 25% futures contracts
• 70% saved cash
• 37% diversified business
Source: Joy Harwood, Futures Markets and Risk Management, A US Perspective, OECD workshop on Income Risk
Management, Paris, May 2000
9

Additional insights can be drawn from Harwoods’ study
regarding exchange-traded forward contracts, futures:
• The size of farm and education are positively correlated
with the use of futures.
• The farmer’s (subjective) perception of risk reduction by
futures is positively correlated with the use of futures.
• Farmers with high debt levels use futures more often
than those with lower debt.
10

A study of Swedish Grain Growers’s hedging attitudes
• I did a survey of hedging attitudes on members of the
Swedish Growers Association at New Year 2011/12.
• 94 responses (from 200 surveys sent out).
• 28 questions with 75 response alternatives.
11
Before harvest Grain Rape seed
Hedged via forwards 74% 60%
Hedged via (OTC) futures 23% 13%
Average hedged overall 29%
After harvest Grain Rape seed
Hedged via forwards 65% 44%
Hedged via (OTC) futures 17% 11%

Making sense of the answers
• The first factor had all the explanatory power.
• The chairman of the Grain Growers’ Association called it
”businessmanship”.
• You can think of it as ”the force” from Star Wars. For
some individuals this force of ”businessmanship” runs
strong.
12
PCA Correlation Matrix, 74x74
Loading to factor..
Factor 1 Factor 2 ……..Factor 74
Answer 1 nn nn … nn
Answer 2 nn nn … nn
….
Answer 74 nn nn … nn

-0.8 -0.6 -0.4 -0.2 0 0.2 0.4 0.6 0.8
I do not understand forwardsI do not think Matif futures is a good hedge
I am not good at timing the marketPrice variation is a source of worry
I do not take advice from consultantsI do not have a custody account
I do not think CBOT futures protects wellI have 9 years of education only.
I do not use own analysisI manage to sell at the lower third of the price range
I mainly read ATL for market informationI manage to sell in the top third of the price range
Upper secondary educationI do not rent land
Live in Eastern SwedenLive in the middle of Sweden
Use grain on the farmFarm Debt / Equity ratio
I mainly read research from grain tradersI live in Western Sweden
AgeI am a member of a Futures Club
I live in Southern SwedenI rent land
I have hedged rape seed through a bank, but not this yearI hedge before harvest
I read mainly sites on the Web for market informationI mainly read Agronomics for market information
I use my own analysisI have a custody account (for securities)
I take advice from consultantsI have a Univeristy degree
My farm is largeI am good at timing the market
I read a bank's newsletter as my primary source of informationI am always able to sell in the upper third of the price range
Price variation is an exciting opportunityI think CBOT protects well
I sell a lot of grainI understand forward contracts
I think Matif protects wellShare hedged
The factor
loadings
13

Differences
14
Unlike the US study
Age does not matter (but education matters)
Financial leverage does not matter
It seems that poor farmers do not hedge, but rich farmers do.
This is contrary to the US study and to who buys ordinary
insurance.
Perhaps the use of futures is not seen as ”insurance” or ”risk
management”…. But as a marketing tool…

Use of derivatives…
…is not only about removing risk.
It is a marketing and farm optimization decision
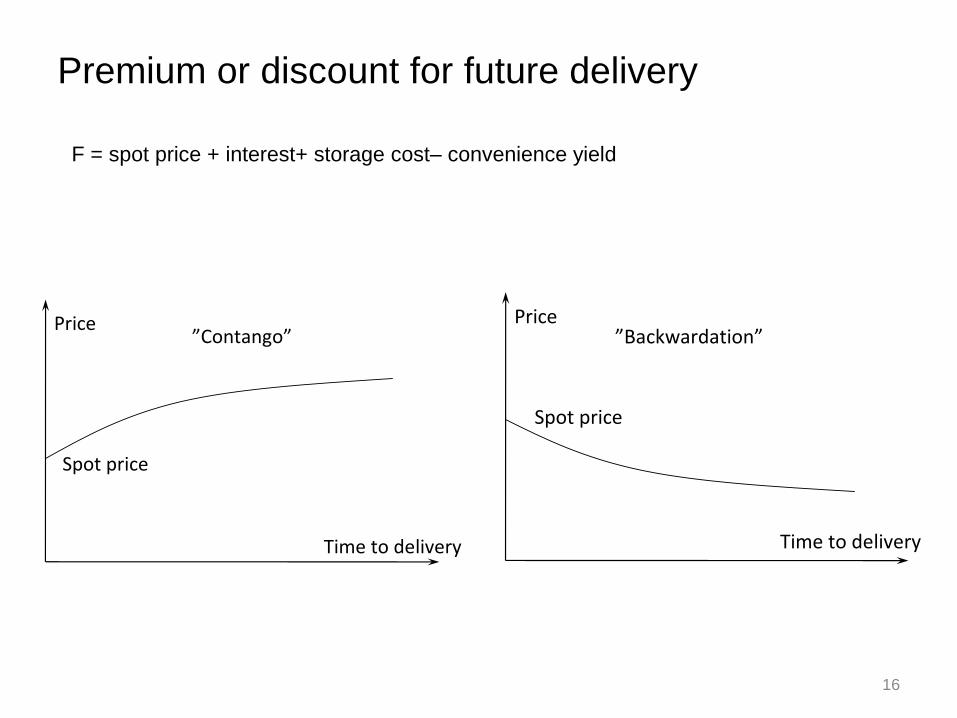
Premium or discount for future delivery
16
F = spot price + interest+ storage cost– convenience yield
Price
Time to delivery
Spot price
”Contango”Price
Time to delivery
Spot price
”Backwardation”

Forward curves for Matif European Milling Wheat
17

What if you sold December each November?
18

If we ’rolled’ a short futures position in Dec contracts…
• Start, end-November 2006: Spot price = 500 cents / bu
• Sell December 2007, Last day of November 2007, buy it back and sell December 2008. We get:
• Dec 2007 : -322.5 cents
• Dec 2008 : +186 cents
• Dec 2009 : +72 cents
• Dec 2010 : -18.75 cents
• Dec 2011 : +185.5 cents
• Dec 2012 : -190.75 cents
• Dec 2013 : +219.25 cents
• Total = +131.25 cents = +26% return from a short hedge!
• Spot price = 649.5 = +30% higher price!
19
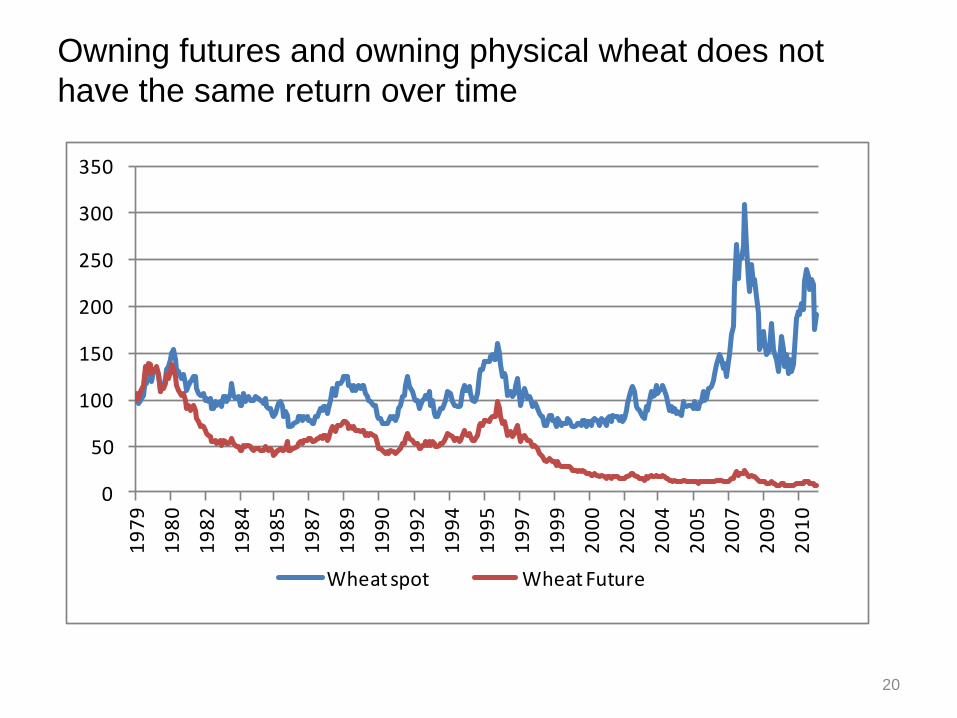
Owning futures and owning physical wheat does not
have the same return over time
20
0
50
100
150
200
250
300
350
19
79
19
80
19
82
19
84
19
85
19
87
19
89
19
90
19
92
19
94
19
95
19
97
19
99
20
00
20
02
20
04
20
05
20
07
20
09
20
10
Wheat spot Wheat Future

A summary of historical returns from being long
21
Since 1980 Wheat Corn Soybeans Lean Hogs
Spot price change 44% 142% 102% 71%
Forward price return -94% -91% -20% -84%
Per annum Wheat Corn Soybeans Lean Hogs
Spot price change 1.2% 2.8% 2.3% 1.7%
Forward price return -8.6% -7.2% -0.7% -5.6%
Of course, a farmer would be short, so
+8.6% p.a. on average for wheat

If futures are a MARKETING TOOL to farmers,
Commercials (farmers) sell when the price is high
22
0
50000
100000
150000
200000
250000
300000
350000
0
200
400
600
800
1000
1200
1400
Wheat Commercial short position, futures

Commercial net position and the wheat price
23
-60000
-40000
-20000
0
20000
40000
60000
80000
100000
0
200
400
600
800
1000
1200
1400
Wheat Commercial net position, futures

Hedging the Milk Price

25
The correlation between the Swedish price
and SMP+Butter futures is too low for outright
hedging.
But, since they are related, intelligent
hedges are possible, at the right moments
(Error correction models = speculation
hedge).

Forwards (bid side) in February and the development of
Arla’s price and the Eurex (now EEX) index (which
forwards settle against)
26
2.00 kr
2.50 kr
3.00 kr
3.50 kr
4.00 kr
4.50 kr
feb mar apr maj jun jul aug sep okt nov dec jan
Arla
EUREX Index
Futures feb 20

27
Source: Land Lantbruk, 26 September 2014
Hedged – made a huge profit

Farmers who sell futures on butter to hedge, seem to be
paying an insurance premium
28
0
1000
2000
3000
4000
5000
6000
7000m
aj-1
0
aug-
10
no
v-1
0
feb
-11
maj
-11
aug-
11
no
v-1
1
feb
-12
maj
-12
aug-
12
no
v-1
2
feb
-13
maj
-13
aug-
13
no
v-1
3
feb
-14
maj
-14
aug-
14
Spotcontract (Eur/ton) Futures return
The insurance (or risk) premium is about 12% per year.
Futures return is constructed by rolling the last day of the month before expiry.

Risk averse farmers are willing to accept a lower price in
return for certainty
29
A price of 0.30 Euro /
Kg, means that 2 cents
is about 6.5%.
Source: Joughrey, Thorne, et al, ”The Market Risk Perceptions and
Management of Irish Dairy Farmers”, WP presented at the AES Annual
Conference, April 2014

Milk futures development
• To hedge 100 kg of raw milk, sell 5 kg butter futures and
9 kg of SMP futures.
30
0
500
1000
1500
2000
2500
Butter Open Interest SMP Open Interest
Open Interest (number of contracts) has
increased very much since the exchange
started 5 years ago.

Conclusion
• The arrival of price volatility and futures has been an exciting
opportunity to excel to some, and the opposite for others.
• Futures and price discovery integrate geographical markets
very effectively.
• Hedging is risk reduction, marketing and investment.
– Long-term hedging returns can be positive or negative.
• It takes time. Learning is year by year, trial and error.
• In order to learn, some entrepreneur must educate the market
and be willing to take some risk.
• Many will trade forwards which are futures wrapped as
bilateral contracts, but the pricing goes back to exchanges.
• You cannot have a market without ”Non-commercials”.
31

Policy Advice
• Article 57 and 58 in MiFID2: Delete all of it, not just the previously stated purpose.
• Excempt commodity derivatives from EMIR.
• If you want to help farmers, encourage natural insurers, like pension funds, to carry their risk.
• Do not try to find and exploit loopholes, or create government-funded initiatives as compensation, to improve the position of the farmer, when you have the power to create good, and destroy bad laws for a free market solution.
32