future us trends in the adoption of light-duty automotive...
TRANSCRIPT

i
Future US Trends in the
Adoption of Light-Duty
Automotive Technologies
Integrated Final Report
Prepared for:
American Petroleum Institute
Prepared by:
H-D Systems
Washington, DC
September, 2013

ii
TABLE OF CONTENTS
Page
EXECUTIVE SUMMARY vii
1. INTRODUCTION
1.1 BACKGROUND 1
1.2 METHODOLOGY 2
1.3 ORGANIZATION OF THIS REPORT 3
2. US STANDARDS FOR FUEL ECONOMY AND GHG EMISSIONS
2.1 BACKGROUND 5
2.2 OVERVIEW OF GHG AND FUEL ECONOMY REGULATION 6
2.3 REGULATORY DESIGN AND STRINGENCY 7
2.4 OFF-CYCLE CREDITS 13
2.5 OTHER EMISSION CREDITS 14
2.6 ESTIMATED CO2 AND FUEL ECONOMY STANDARDS
WITH CREDITS 15
2.7 EU STANDARDS OR CO2 EMISSIONS FROM LIGHT VEHICLES 18
3. ADVANCED ENGINE TECHNOLOGIES
3.1 INTRODUCTION 21
3.2 VARIABLE VALVE ACTUATION 21
3.3 TURBOCHAGING AND SUPERCHARGING 25
3.4 INCREASED COMPRESSION RATIO 32
3.5 ENGINE FRICTION REDUCTION 36
3.6 IMPROVED LUBRICANTS 38
3.7 ADVANCED LIGHT DUTY DIESELS 39
4. BODY AND ACCESSORY TECHNOLOGY
4.1 WEIGHT REDUCTION 43
4.2 ROLLING RESISTANCE REDUCTION 45
4.3 AERODYNAMIC DRAG REDUCTION 46
4.4 ACCESSORY IMPROVEMENTS 47
5. ADVANCED TRANSMISSIONS
5.1 INTRODUCTION 49
5.2 SIX TO TEN SPEED AUTOMATIC TRANSMISSIONS 49

iii
5.3 AUTOMATED MANUAL TRANSMISSIONS 51
5.4 CONTINUOUSLY VARIABLE TRANSMISSIONS 53
5.5 TRANSMISSION EFFICIENCY IMPROVEMENTS 54
6. VEHICLE ELECTRIFICATION
6.1 STOP-START SYSTEMS 56
6.2 BELT STARTER ALTERNATOR (BAS) HYBRIDS 58
6.3 CRANKSHAFT MOUNTED MOTOR HYBRIDS 60
6.4 DUAL MOTOR “FULL” HYBRIDS 63
6.5 BATTERY ADVANCEMENTS AND IMPLICATIONS
FOR BEV/PHEV SALES 64
7. OEM COMPLIANCE STRATEGIES
7.1 INTRODUCTION 69
7.2 EPA TECHNOLOGY FORECAST TO MEET 2025 STANDARDS 69
7.3 MANUFACTURER SPECIFIC PRODUCT PLANS 74
7.4 FLEET SUMMARY 101
8. TECHNOLOGY PATHS AND COSTS OF COMPLIANCE WITH STANDARDS
8.1 METHODOLOGY 105
8.2 EPA UPDATES TO TECHNOLOGY IMPACT ON RETAIL PRICE 107
8.3 ESTIMATES OF COMPLIANCE COSTS 108
9. EFFECTS OF NEW TECHNOLOGIES ON FUEL REQUIREMENTS
9.1 OVERVIEW 115
9.2 GASOLINE DIRECT INJECTION 115
9.3 TURBO-CHARGED GDI ENGINES 118
9.4 HIGH CR AND HCCI TECHNOLOGY 120
9.5 IDLE STOP AND HYBRID TECHNOLOGY 122
9.6 OTHER FUEL EFFECTS 123
APPENDIX A: TECHNOLOGY COSTS AND BENEFITS 125
LIST OF ACRONYMS 128

iv
LIST OF FIGURES
2-1 FOOTPRINT OF A VEHICLE 6
2-2 CO2 TARGET CURVES FOR PASSENGER CARS 8
2-3 CO2 TARGET CURVES FOR LIGHT TRUCKS 8
2-4 ANNUAL FE INCREASE REQUIRED BY CAFE STANDARDS 9
2-5 COMPARISON OF EPA GHG STANDARDS AND NHTSA CAFÉ STANDARDS
IN MPG SPACE 11
3-1 GASOLINE ENGINE EVOLUTION PATHWAYS 22
3-2 GM IVLC SYSTEM FOR IMPALA 2.5L ENGINE 24
3-3 EATON ELECTRO-HYDRAULIC VALVE ACTUATION 25
3-4 ADVANCED TURBOCHARGER CONFIGURATIONS 26
3-5 MAHLE ESTIMATES OF CO2 REDUCTON POTENTIAL WITH ADVANCED
DI/ TURBO ENGINES 27
3-6 CURRENT EUROPEAN TURBO/DI ENGINE PERFORMANCE AND
POTENTIAL EVOLUTION 28
3-7 MERVEDES LEAN BURN DISI OPERATING AIR-FUEL RATIO MAP 31
3-8 COMPARISON OF BSFC vs. IMEP FOR MERCEDES ENGINES 32
3-9 MAZDA HIGH CR ENGINE EVOLUTION 33
3-10 MAZDA ACCOUNTING FOR SKYACTIV ENGINE BENEFITS 33
3-11 BSFC MAP FOR ACCORD HYBRID 2L ENGINE 34
3-12 NISSAN 13 CR 1.2L ENGINE TECHNOLOGIES 35
3-13 FRICTION REDUCTION TARGETS, MAZDA SKYACTIV-G TECHNOLOGY 37
3-14 FRICTION REDUCTION TECHNOLOGIES IN NEW NISSAN 1.2L ENGINE 38
4-1 PRIMARY, SECONDARY AND TOTAL COST OF WEIGHT REDUCTION 44
4-2 VEHICLE WEIGHT REDUCTION PLANS, MAZDA SKYACTIV BODY 45
4-3 WET GRIP vs. ROLLING RESISTANCE 46
4-4 COMPACT CAR DRAG REDUCTION EVOLUTION 47
5-1 FUEL CONSUMPTION REDUCTION FOR ADVANCED TRANSMISSIONS 50
5-2 ZF NEW 9-SPEED AUTOMATIC TRANSMISSION 51
5-3 VW/ AUDI 6-SPEED WET CLUTCH DSG TRANSMISSION 52
5-4 JATCO NEW GENERATION CVT8 SCHEMATIC OF TECHNOLOGY FEATURES 53
6-1 FE BENEFIT FOR ENGINE SHUTDOWN DURING COASTING ON FTP 57

v
6-2 ZF HYDRAULIC IMPULSE STORAGE 58
6-3 GM WEBSITE FLYER ON e-ASSIST TECHNOLOGY 59
6-4 1M2C HYBRID OPERATING MODES 60
6-5 JATCO 1M2C HYBRID TANSAXLE DEVELOPED FOR CVT8 61
6-6 GETRAG HYBRID AMT CONCEPT AND 1M2C ASSEMBLY 62
6-7 ESTIMATED COST ($/kWh) OF Li-ION BATTERIES TO 2030 65
6-8 BATTERY TECHNOLOGY DEVLOPMENT 67
7-1 FORD GLOBAL TECHNOLOGY MIGRATION PLAN 78
7-2 HONDA ANNOUNCEMENT ON EARTH DREAMS TECHNOLOGY 91
9-1 PM EMISSIONS OF GASOLINE TECHNOLOGIES RELATIVE TO STANDARDS 117
9-2 HONDA CORRELATION OF PM CONCENTRATION TO FUEL PM INDEX 118
9-3 OPTIMUM OCTANE NUMBER vs. BOOST PRESURE BMEP 119
9-4 TOYOTA CORRELATION OF LSPI TO AUTO-IGNITION TEMPERATURE
OF LUBRICATING OIL 120
9-5 RELATIONSHIP OF IGNITON TIMING TO FUEL OCTANE FOR
HCCI COMBUSTION 121
9-6HONDA REPRESENTATION OF HEV/PHEV CATALYST TEMPERATURE
RELATIVE TO CONVENTIONAL VEHICLE CATALYSTS TEMPERATURE
ON THE US06 TEST CYCLE 123
9-7 OXYGEN CONSUMPTION PROFILE OF FUELS ON ISO 7536 TEST 124

vi
LIST OF TABLES
2-1 TECHNOLOGIES WITH DEFINED OFF-CYCLE CREDITS 16
3-1 COMPARISON OF NATURALLY ASPIRATED AND TURBOCHARGED DISI
ENGINE FUEL ECONOMY FOR MY2012 29
3-2 MY2013 LIGHT DUTY DIESEL vs. GASOLINE MODELS’
FUEL ECONOMY COMPARISON 41
5-1 COMPARISON OF PERFORMANCE EQUIVALENT MY 2013
MIDSIZE CAR FUEL ECONOMY 54
7-1 MILD HYBRID AND HYBRID PENETRATION (%) IN EPA’S 2025 FOECAST 72
7-2 EPA TECHNOLOGY ADOPTION FORECAST FOR GM
CAR AND TRUCK FLEETS FOR 2025 75
7-3 EPA TECHNOLOGY ADOPTION FORECAST FOR HONDA
CAR AND TRUCK FLEETS FOR 2025 76
7-4 ENGINE TECHNOLOGY MIX (%) FOR CARS OVER TIME 103
7-5 ENGINE TECHNOLOGY MIX (%) FOR LIGHT TRUCKS OVER TIME 104
8-1 PRODUCT PLAN RELATED CAR FLEET TECHNOLOGY INTRODUCTION
TO 2020 110
8-2 PRODUCT PLAN RELATED LIGHT TRUCK FLEET TECHNOLOGY
INTRODUCTION TO 2020 111
8-3 “PRODUCT PLAN” AND COMPLIANCE RELATED CAR FLEET
TECHNOLOGY INTRODUCTION TO 2025 112
8-4 “PRODUCT PLAN” AND COMPLIANCE RELATED LIGHT TRUCK FLEET
TECHNOLOGY INTRODUCTION TO 2025 114

vii
EXECUTIVE SUMMARY
E.1 OVERVIEW
The Obama administration has promulgated GHG emission standards and equivalent fuel
economy standards for cars and light duty trucks to model year 2025. The regulation has been
publicly identified as a 54.5 mpg standard, which is derived from a tailpipe CO2 emissions
standard of 163 g/mi for 2025, and this is the average for the car + light truck new vehicle fleet.
The American Petroleum Institute is interested in understanding the details of these regulations
and their impact on vehicle technology. The goal of this study conducted by H-D Systems (HDS)
is to provide a comprehensive assessment of the incremental costs, market penetration, GHG
emissions reduction and/or fuel economy improvement potential associated with the
technologies planned for use in all new light-duty motor vehicles to 2025 and also to assess
their potential impact on fuel requirements. It should be noted that California has aligned its
GHG requirements with the Federal requirements, but manufacturers face a separate “Zero
Emission Vehicle” (ZEV) mandate in California. The details of the ZEV mandate are not
discussed in this report.
E.2 NEW FUEL ECONOMY AND GHG EMISSION STANDARDS
The light duty vehicle standards set minimum requirements for fuel economy and GHG emission
performance for all vehicles made and/ or imported for sale in the US by each manufacturer in a
particular model year (MY). Both the GHG and the Corporate Average Fuel Economy Standards
(CAFE) are based on the “footprint” of the vehicle (the product of the wheelbase and track
width) and are linear functions of the footprint with maximum and minimum values.
Manufacturers must meet the standard based on the sales weighted average footprint of all
vehicles sold in the US for the specific model year.
For a given vehicle, the fuel economy is inversely proportional to its tailpipe CO2 emissions
(which are the largest source of GHG emissions) for a given fuel type. Since most light duty
vehicles in the US operate on gasoline, the relationship between fuel economy in miles per
gallon (MPG) and CO2 emissions in grams per mile is given by the relationship:
MPG = 8887/CO2 in g/mi.
The EPA GHG emissions standards and NHTSA CAFE standards have supposedly been
harmonized, but there are still some open issues regarding compliance with both sets of
regulatory requirements. The footprint based GHG and fuel economy standards require about
4.1% annual fuel economy increase for cars from MY 2017 through 2021, and 4.3% annually for
MY 2022 through 2025 if the footprint stays constant. The piecewise linear function relating
MPG in each model year to footprint is different for cars and light trucks. The cars’ curves are
more or less evenly spaced apart from the smallest to the largest footprint, indicating that cars

viii
of all sizes are faced with a similar degree of fuel economy improvement target each year.
However, the light truck curves are quite different – the different model year curves are
noticeably squeezed together for larger footprint values where the majority of large pickup
trucks are concentrated. The regulation requires a much lower rate of fuel economy
improvement to 2021 for large trucks relative to small trucks or cars, presumably to ease the
compliance burden for domestic manufacturers who have high penetration in the large truck
market. After 2021, the required rate of improvement accelerates for large trucks.
According to the agency projections, the CAFE standards will require a combined average of
40.9mpg in MY 2021, and 49.6mpg in MY2025. EPA’s GHG standards, which are harmonized
with NHTSA’s CAFE standards using the equation above, are projected to require emission
levels of 163g/mi (CO2) in MY2025, which would be equivalent to 54.5 mpg, if the vehicles were
to meet this CO2 level all through fuel economy improvements. The agencies expect, however,
that a portion of these improvements will be made through other credits (discussed below) and
the actual tailpipe CO2 level expected by the agencies is about 234 g/mi in 2020 and 186 g/mi in
2025. These numbers are based on an estimate from the US Energy Information Administration
(EIA) that the percent of light-duty vehicles that are light trucks will fall drastically in the future
from 2008 levels of over 50, based on events in 2009/2010.
Because there are two vehicle categories, car and truck, and the standards are based on the
footprint attributes of future year vehicle sales, the exact GHG or MPG outcome from the
program is unknown until the final sales mix of vehicles sold in each MY is determined some
months after the end of the model year. More recently, the light truck share has rebounded in
the US in spite of high gasoline prices suggesting that the EIA may have been too optimistic in
its forecast of energy use reductions. On the other hand, the regulations have reclassified two-
wheel drive SUV models as passenger cars instead of trucks, potentially mitigating the effect of
the low truck penetration forecast.
The regulations also include a system of emission credits to help meet overall environmental
objectives in a manner that provides companies with maximum compliance flexibility. The
regulations include
Credit incentives for "game changing" technologies including hybridization for full-
size pick-ups, as well as for early introduction of these technologies.
Revised credit schemes for Compressed Natural Gas Vehicles (CNGVs), Plug-in
Hybrid Vehicles (PHEVs), and Flexible Fuel Vehicles (FFVs) to reflect the actual use
of electricity and/or alternative fuels (the current CAFE credits for FFVs, which are
independent of actual alternative fuel use, will expire in MY2020).
Credits for introducing technologies that provide fuel economy benefits in real life but
are not captured on the test cycle (the “off-cycle” credits). These credits are capped
at 10g/mi CO2 emissions

ix
A zero gram per mile allowance for battery electric and fuel cell vehicles up to a
sales ceiling that is unlikely to be exceeded to 2020 at least.
GHG credits for replacing the refrigerant in the air-conditioner with one having lower
global warming potential, as well as for improving air-conditioner efficiency and
reducing refrigerant leakage.
A new and very important CAFE program flexibility is that NHTSA is planning to allow CAFE
credits for “any adjustments that EPA allows” such as improvements related to mobile air
conditioning (A/C) efficiency and “off cycle” technologies. According to HDS estimates, these
credits can be obtained at low cost relative to many engine and transmission technologies
planned for the future and we anticipate that manufacturers will maximize the use of these
credits. However, EPA and NHTSA assume far more modest use of these credits to compute
tailpipe emissions.
HDS anticipates a larger use of credits than assumed by the agencies. Other factors such as
the upsizing of wheelbases that is occurring now as well as the larger share of light trucks than
anticipated by the agencies will reduce the MPG requirements for the 2025 fleet even further.
Our computations indicate that the actual requirement for 2025 will be about 204 g/mi CO2 or
43.6 mpg. While this is substantially less than the 54.5 mpg level referenced by EPA, it is still a
challenging standard. The actual fleet fuel economy in 2010 was 29.3 mpg or 29 mpg without
the flex-fuel vehicle credit and the 43.6 mpg requirement is about a 50% increase in fuel
economy from the 2010 baseline. Of course, this is an average across all manufacturers but
some manufacturers (notably the domestic manufacturers and European luxury car
manufacturers) face targets requiring 55+% improvement, while many Asian manufacturers will
be able to comply with improvements of 45% or less.
E.3 NEW TECHNOLOGY TO MEET 2020 AND 2025 STANDARDS
A previous report on technology to improve fuel economy to 2016 was completed by EEA/ICF (a
predecessor to HDS) for the API in 2008. The present analysis seeks to update the earlier
report with new information and insights on technological developments which have occurred
since2008, and does not, therefore, include comprehensive descriptions of all technologies. In
particular, advances in spark-ignition engine technology since the development of the last report
to API five years ago are very significant, and it now appears that most analysts had under-
estimated the potential for fuel efficiency improvement in conventional engines. While there are
developments in other areas as well, notably in transmission technology, we have focused more
on the engine developments as they could impact future fuel requirements.
A wide range of technological options are either under consideration or are being introduced for
the next generation of spark ignition engines. Examination of data on product plans shows that
manufacturers are proceeding on two divergent pathways. The first involves turbo-charging and
downsizing the engine. A more novel variant includes lean burn with turbo-charging and

x
downsizing the engine but this technology may have only limited market penetration to 2020.
The second path involves using high compression ratios and preventing knock by novel
methods such as the use of a Miller or Atkinson cycle with late intake valve closing. Both paths
also can involve using a common set of new technology such as variable valve actuation and
cooled EGR. The advantages and disadvantages of the pathways are examined below.
Direct Injection Turbocharged Engines
Stoichiometric direct injection spark ignition (DISI) engines are now being used by most OEMs
in the US. The technology trend is moving toward higher injection pressures and more
sophisticated injection strategies such pulsed-injection. There are many applications of DISI
with naturally aspirated engines but many manufacturers have also introduced DISI in
combination with turbo-charging and VVT as a package. With modest (20%) engine downsizing,
a fuel economy increase of about 10% should be expected. Suppliers such as Bosch have
claimed that with higher boost pressures, the Turbo-DI package will achieve up to 25% increase
in fuel economy if the engine is resized for constant performance. In combination with additional
technology packages and extreme downsizing, Mahle indicated that up to 35% improvement in
fuel economy is achievable. Further synergies can be found with other technologies including
electrification.
Many first generation Turbo DISI engines in the US market are representative of 18 Bar BMEP-
level technology. VW/Audi was one of the first OEMs to sell these engines (called TFSI) in the
mass market on a wide variety of vehicle platforms. The trend continues towards higher boost
pressures and most engines today with this technology have maximum BMEP levels of 18.5 to
20 bar. As of 2013, very few engines have crossed the 20 bar threshold, and among mass
market vehicles, only the GM 2L engine rated at 272HP has a BMEP of 25 bar. Luxury
European auto-makers like Audi, Porsche and BMW offer high performance models with
engines having a BMEP of 22 to 24 bar and maintain the CR at 10, but also require premium
fuel. In its regulatory analysis, EPA has selected this technology pathway as most cost-effective
and the forecasts suggest that 18 and 23 bar boost technology will be used on almost all Turbo
DISI vehicles with a smaller percentage at 27 bar boost.
Other automobile manufacturers (notably the Japanese) are more skeptical about the prospects
for downsized, turbocharged engines in the US market, and suggest that the technology may be
better suited to Europe with its high speed driving. Although suppliers such as Bosch and Mahle
have claimed large fuel economy benefits as noted above, the actual test results for the Ford
and European models with this technology suggest much less benefit. Comparison of vehicles
offering both engines in the market in 2012/13 show that the downsizing and turbo-charging
strategy with 19 bar boost provides a fuel economy benefit of only 8 to 9 percent at constant
performance over a naturally aspirated engine.

xi
Although EPA has estimated that by 2025, most automobile manufacturers will move to
downsized GDI/Turbo engines with 24 bar BMEP, this appears quite uncertain based on our
analysis. It is likely that as combustion chamber designs, head cooling and in-cylinder gas
motion are optimized, the boost level can be raised to over 20 bar without requiring premium
fuel. Boost to BMEP levels of 24 to 27 bar will require cooled EGR, which raises its own set of
problems in EGR thermal management and intake deposit control, and extreme engine
downsizing may also result in drivability penalties. We forecast that European manufacturers
and Ford will likely have 21-22 bar boost engines for the mass market and 24 to 27 bar boosted
engines in high performance applications by 2025, but we do not expect penetration levels for
Turbo DISI engines above 35% to 40% for the fleet as a whole.
Lean-Burn DISI Engines
The 1st generation lean burn DISI engines (marketed in Europe) achieved mixture formation
through a special combustion chamber design which is referred to as “wall-guided” mixture
formation. The technology did not achieve wide success since combustion was difficult to
control at different engine speeds. The newer technology variants use a centrally placed injector
to achieve a “spray guided” charge. This process uses a small spacing between the injector and
the spark plug electrode. Also, the air-fuel mixture formation near the spark plug takes place
almost independent of gas flow and piston movement. The spray guided systems, however, use
high pressure piezo-injectors to achieve the desired level of mixture control, with attendant high
injection system cost.
Luxury makers such as BMW and Mercedes have been using the spray guided DISI lean burn
engines in Europe with up to 20% fuel consumption improvement and there is renewed
optimism, that with proposed new gasoline sulfur regulations, the technology will migrate to the
US market1. We anticipate that Mercedes will have one or more lean burn engines in the US
market in MY 2016 and the technology will be in widespread use by these two manufacturers by
2020. Mercedes uses a sophisticated conical spray piezo-fuel injector and fuel injection is done
in multiple pulses. Up to 4 bar BMEP, the engine runs very lean at an overall lambda of over 3.
There is a transition region from 4 bar BMEP to 7 bar where the combustion mode is termed
“Homogeneous- Stratified” (HOS) where most of the mixture is homogeneous and the lambda is
about 2 but the region near the spark plug is near stoichiometric.
More recently, Mercedes has extended this concept to a 2L turbo-charged engine with a
maximum BMEP of 23 bar. The turbocharged lean burn engine also showed similar benefits
relative to a turbocharged stoichiometric engine, and typically, the fuel consumption benefit on
the EPA test cycle is similar to the benefit at 2.5 to 3 bar BMEP. This suggests that combining
the concepts of GDI/ Turbo with stratified lean-burn can provide a total fuel consumption benefit
of 20 to 25 percent from the engine alone, with 9 to 10% from turbo-charging and 10 to 15%
1 Daimler Press Release, “New V8 and V6 Engines from Mercedes-Benz”, May 6, 2010.

xii
from lean operation. However, the piezo fuel injector and the emission control system are
expensive, and lean burn technology will be restricted to luxury cars to 2020.
High Compression Ratio Engines
Theoretically, an engine’s efficiency will increase with increased Compression Ratio (CR).
Modern gasoline engines generally operate in a CR range from 10:1 to 11:1 but the trend is to
develop engines with higher CR, particularly with DI available to cool the charge mixture. Mazda
has announced the Skyactiv-G engine with CR of 14:1 and claims up to 15% increase in fuel
efficiency and torque. The technology was enabled by using a redesigned exhaust manifold that
minimizes hot residual gases, multi-hole DI injectors, injection pressure of 2,900psi and a re-
worked control system. Mazda has claimed that the brake specific fuel consumption (BSFC) is
close to that of a current diesel engine, and in a vehicle application, Mazda has demonstrated
fuel consumption reduction of 15%. However it appears that only 4.5 to 5 percent of the
improvement is attributed to the CR increase since the engine uses a Miller cycle at part load to
reduce pumping loss, while reduced friction loss and idle speed reduction, as well as reduced
accessory loss (in the oil pump and water pump), contribute to the 15% total.
In 2013, Honda introduced a 13 CR 2.0L 4 cylinder engine with PFI and cooled EGR, as well as
Atkinson cycle operation at part load by using a 2 stage VVLT system. The cooled EGR
suppresses knock and enables operation at near optimal spark timing without knock. Honda has
claimed a BSFC of 214 g/kW-hr which is one of the lowest levels ever achieved on a spark
ignition engine. In addition, the cooled EGR and VVLT system reduces pumping loss at part
load so that the engine has very good fuel consumption over a wide range of torque and speed.
Although the engine will be used only in the 2014 Accord hybrid, the engine power rating is only
a little lower than that of other 2L PFI engines, at 140 HP. In comparison, Mazda’s 2L DI engine
is rated at 154 HP. It is possible that the Accord hybrid engine strategy could be adapted to
conventional drivetrains with some modifications in the future.
Other Japanese manufacturers are also working on similar concepts such as high CR engines
with an Atkinson cycle instead of a Miller cycle. The Toyota Prius and other hybrid vehicle
models use the Atkinson cycle with a CR of about 12, but the power loss has restricted the use
of these engines to hybrid models exclusively. Nissan has introduced a 1.2L 3 cylinder engine
with 13 CR in Europe, and the engine is unique in that it also employs supercharging. In order to
enable use of high CR, many of the same technologies used by Mazda such as a high tumble
intake port, shallow cavity piston, a multi-hole GDI injector, and the Miller cycle are also used in
the Nissan engine. The engine also employs many new friction reduction technologies. The net
fuel economy improvement is substantial, with the Nissan Micra equipped with this engine
certified at 95 g/km CO2 on the NEDC cycle, which is approximately equivalent to 65 mpg on the
US combined cycle.
xiii
Our contacts with Japanese automobile industry staff suggest that high CR technology is the
preferred direction for the next generation of engines emerging from Japan. We expect high CR
engines with Miller or Atkinson cycles to be offered by Honda, Toyota and Nissan later this
decade. The next step with such engines is to use HCCI combustion which is a form of lean
burn that allows ultra-lean combustion at light loads. The technology becomes more feasible
with high CR and advanced valve control, and Mazda plans to introduce this technology by
2018. Other manufacturers are more cautious but optimistic about HCCI emerging around 2020.
Diesel Engines
Many of the improvements to turbo-charging and increasing BMEP discussed for SI engines
were first developed for diesel engines. The current VW 2Ldiesel sold in the US and rated at
140HP, is an older design with a single stage turbo that operates at 20 bar BMEP. Other, more
recent engines continue to use a single turbocharger but have a boost level of 24 bar BMEP.
While dual scroll and twin turbo versions of these engines have been introduced in the EU, only
the BMW twin turbo 3L I-6 engine is available in the US and the boost level is at 26.4 bar
BMEP. The next generation VW and BMW 2L twin-turbo diesels will also offer a version boosted
to 28 bar BMEP and will be rated at about 200 HP. The increased boost and power level has
enabled engine downsizing, while the use of variable nozzle turbos and twin turbos have
allowed higher boost at lower RPM to enable down-speeding. These improvements have
resulted in the diesel engine maintaining its fuel economy and CO2 emissions advantage over
gasoline engines. However, if lean burn, either in conventional or HCCI form is adopted for
gasoline engines, the fuel economy advantage of diesel engines will decline from about 30%
currently to 15 - 18%. GHG emissions advantages will be only around 3 to 6%, limiting the
diesels’ attractiveness to manufacturers.
Unfortunately, diesels have not been popular in the US outside of a few German models. In
particular, the diesel take rate in most car models with the exception of VW Passat and Jetta is
quite low. In these two car models and in several SUV models from Audi, Porsche, VW and
Mercedes, the take rates are quite similar at 25 to 30% of total model sales, but the take rates
on the Mercedes ML and BMW X5 SUV models are only 12%. The take rates on other car
models such as the Mercedes E class and the BMW 3 series are very low at less than 3%.
Overall diesel penetration in the first 4 months of 2013 is only 0.76% reflecting the fact that
diesels are offered only in a handful of models. The relative popularity in SUV models suggests
that diesel engines may be more successful in trucks than in cars and may be a good option for
pickup trucks in particular, since the larger heavy duty pickups have diesel penetration levels of
about 65 to 70%.
Other Technologies
Engine friction reduction is a continuously evolving technology capable of providing significant
fuel economy improvement. Engine developers are constantly looking to achieve further friction

xiv
reduction and some have reported very aggressive targets of as much as 50% friction reduction
in subsystems such as valve trains. Diamond-Like Coating (DLC) technology is a relatively new
trend in friction reduction. DLC is a family of coatings made up primarily of carbon chains in an
amorphous base material. In addition to friction reduction, the DLCs are known to improve self-
lubrication and resistance to wear. However, they are sensitive to some additive packages used
in current engine oils and may require special lubricant formulations.
New weight reduction studies are now publically available and EPA/NHTSA have recently
sponsored large efforts to update the analysis. In general, many of these studies now conclude
that the low-level weight reduction, in the range of 5% to 10%, can be accomplished with near
net “zero” cost, if the primary weight reduction is complemented by cost reduction from
secondary weight reduction in powertrain, structures and suspension. However, estimates of
higher levels of weight reduction feasibility to 20 and 25 percent, and particularly its cost
implications, are still highly variable among the published studies.
Another area that has emerged in the last 5 years is active thermal management of the
drivetrain. The new 2013 Dodge Ram features an active transmission warm-up system where
the transmission oil is heated to a controlled temperature by the engine coolant. Active grill
shutters and electrically heated engine coolant thermostats are also under consideration for
faster warm-up with the grill shutters being introduced in some 2013 models. The fuel economy
benefits are small on the FTP test where the cold start occurs at 75 F (about 0.5% benefit each
for the transmission and engine warm-up features) but these technologies are also eligible for
off-cycle credits for CAFE compliance, making them more valuable.
Since the last report to API, the transmission trend to increasing the ratio spread and number of
gears has occurred at a much faster pace than originally expected. The 6-speed automatic
transmission (6AT) is already the transmission of choice for most vehicles. Higher gear-count
transmissions such as eight-speed transmission (8AT) have been available in the market from
manufacturers such as Aisin and ZF and their products have transitioned into mainstream
platforms. Luxury vehicles from Europe have offered 7 speed and 8 speed transmissions since
2010.For the new transmissions, the fuel economy improvements are achieved not just by
increasing the gear count but also by using technologies such as a variable oil pump, improved
torque converter and optimized control strategy. ZF has released a new 9HP 9-speed FWD
transmission with ratio spread of 9.84.2 Starting in MY2014, we expect Chrysler will offer this
transmission in the compact van and in subsequent years, expand its availability to midsize
cars. ZF claims the technology will enable FWD vehicles to use downsized engines and will
achieve fuel efficiency gains up to 12% over a 5 speed transmission. GM and Ford have jointly
developed current 6AT technology and have indicated that they are working on 9 and 10-speed
2 ZF Product Brochure, 9HP 9-speed Automatic Transmission for Passenger Cars”, 2012

xv
automatics for broad use across their vehicle lineups. By 2025, we expect that these
transmissions will have largely replaced the six speed transmissions across the product lineup
The dual clutch transmission (DCT) is an automated manual where one set of gears is always
engaged to the engine to prevent torque interruption during gear shift. EPA has forecast this
technology as the most cost-effective transmission solution and estimates that it is significantly
cheaper to produce than a conventional automatic. Several new DCTs have entered the market
in 2012/2013. The new VW 7-speed DCT is claimed to have fuel consumption advantage of 7 to
12% relative to the 6-speed manual on the NEDC. However, the acceptance of the DCT in the
US market is in doubt. The dry clutch DCT recently introduced by Chrysler has had a poor
reception in the market and it is anticipated that Chrysler will switch to the 9-speed automatic by
2017. Even the wet clutch models have not been popular, and may observers think that the
DCT is better suited to Europe where customers are more used to manual transmissions. Given
the transmission plans of the domestic manufacturers, it appears that DCTs may be used only
in very small cars such as the Ford Fiesta, and by European models whose customers may
prefer the feel of the DCT.
The continuously variable transmission (CVT) has also shown some dramatic improvements
recently. Although Nissan has been the only manufacturer to adopt CVTs across much of their
fleet, we expect that recent improvements to CVTs will result in most other Japanese
manufacturers adopting this technology. The new CVT technology has produced major gains in
fuel economy. In 2013 model year, the Nissan Altima midsize car with a conventional 2.5L PFI
engine rated at 182 HP achieved a CAFE rating of 42.3 MPG, which is higher than most
compact cars and an amazing 20% better than the mid-size car average of about 35 mpg, and
about half of the improvement is attributed to the new CVT.
E.4 VEHICLE ELECTRIFICATION
Although most analysts had forecast slowly rising market share of hybrid and electric vehicles to
reach market penetration levels of 10% or more by 2015, hybrid market share has stalled at 3 to
3.5% of the total light vehicle market since 2009. Plug-in hybrid and battery electric vehicle
sales have been much lower than anticipated, and manufacturers are being forced to discount
prices steeply to achieve even the modest sales targets announced.
There seems to be increased interest in idle stop systems. Currently, the idle-stop designs in
the US market are mostly in European imports like VW and BMW, and utilize a special
strengthened starter motor that can pre-engage the engine when the engine comes to a stop.
The start-stop places a large demand on the batteries so the electrical system upgrades are
usually required with these systems. There is general agreement that idle stop systems provide
about 3% to 4% fuel economy improvement under the US city test but almost zero on the
highway test, so that CAFE benefit is only about 1.7% to 2%. The real world benefits can be

xvi
larger and many manufacturers are planning to apply for additional “off cycle” credits for this
technology. These credits could provide a good incentive for adoption of this technology.
Bosch has shown that the benefit should be about 4% on the city cycle and could be much
higher if stop-start functionality is combined with engine shut-off during coasting. They suggest
that shut-off during deceleration could improve the total benefit by 7% (to a total of 11%) on the
city cycle, and the net CAFE benefit may also increase more since there is some coasting
possible in the highway cycle. Manufacturers are of the opinion that a 4 to 5% total CAFE
benefit from second generation systems may be possible, and the low system cost of about
$300 could make it attractive. Second generation systems, incorporating engine shut-off during
coasting, are likely to appear in the post-2016 time frame.
Many manufacturers and EPA believe that a one electric motor hybrid where the motor can be
used for propulsion and for assisting the engine during acceleration is an attractive solution. A
number of products featuring this type of design have been introduced in the last 2 years but
none have been successful in the market. The transition from electric drive to engine power
results in some drivability deficiencies that make these systems unattractive to consumers. The
Prius type two-motor hybrids dominate hybrid sales both because of very good drivability and
good fuel economy.
Battery cost issues dominate the outlook for plug-in and electric vehicles. Before subsidies,
battery costs to automobile manufacturers for current Li-Ion batteries are about $600/kWh of
energy storage (about $500 with subsidies). HDS estimates that battery costs to auto-
manufacturers will remain approximately flat for the next 5 years since battery manufacturers
have to recover their investments in the first generation batteries, Second generation batteries
will emerge in the 2017-2018 time frame if the market for hybrids and PHEV/EV models grows
significantly. Typically, each generation of batteries must be produced for 5 to 6 years in order
to recoup investments in battery technology and related manufacturing process developments.
Although the next generation batteries will not use a different chemistry, improvements to the
anode and cathode, and improvements to cell packaging are expected to raise specific energy
levels by about 30%. Cost reductions will be of the same magnitude, bringing unsubsidized cost
to about $400/kWh.
Given our battery cost and price expectations, sales growth for PHEV and BEV models will be
determined only by additional vehicle choices and larger manufacturer subsidies driven by the
need to meet the ZEV mandate requirements. Based on these considerations, sales could
easily double from current levels to 80,000 BEV and 80,000 PHEV sales per year by 2020, but
this would be only about 0.5% of total light vehicle sales for each type. Our expectation for
market penetration is in the 0.5 to 1% range for 2020, and to 1 to 2% by 2025, depending on
fuel price falling to $3/gal or increasing to $4.50/gal to define the extremes.

xvii
E.5 MANUFACTURER PRODUCT PLANS
A detailed analysis of product plans which are reasonably firm through 2017/18 shows
manufacturers having very different technology plans and being in very different technology
positions. The manufacturers fall into three groups: the German manufacturers, the domestic
manufacturers and the Asians. All of their currently public product plans suggest a clear path for
2020 compliance but different futures for 2025 compliance.
The German manufacturers are very reliant on DI/ Turbo technology as the primary tool for
compliance with VW also reliant on the DCT as the transmission of choice. BMW and Mercedes
will also rely on lean burn to meet standards through 2020, along with the DCT for some
vehicles and 8 to 10 speed automatics for larger models. VW is unique among all manufacturers
in being reliant on diesel penetration levels of 25+% of their passenger car fleet to meet
standards. Our analysis indicates that downsizing and turbo-charging technology face serious
limitations in moving to ever smaller and more highly boosted engines, suggesting a very
difficult path for complying with 2025 standards. The high diesel sales strategy will allow VW to
comply with CAFE standards but it will have a more difficult time with GHG standards.
GM and Chrysler will have only modest reliance on DI/ Turbo technology and appear to be
examining more pathways to 2025 than the others. GM seems to be reliant on BAS mild hybrid
technology, but its relatively small benefit and high cost could lead to compliance problems for
GM in 2020 and beyond. Ford is more aggressively pursuing DI/ Turbo technology than the
other domestic manufacturers though not to the same extent as the Europeans. Instead, it plans
to use full hybrid technology as well as PHEV and BEV technology to meet standards. In the
LDT segment, GM and Chrysler, while facing compliance difficulties as early as 2017, also have
serious issues complying beyond 2020 as large pickups and SUVs are a large fraction of their
sales, and the relatively easy requirements for 2020 for such vehicles are ended with very
stringent requirements for 2025. Ford is in only a slightly easier position, but our analysis
suggests that all of the domestic manufacturers will be pushing for an easing of the 2025
standards during the mid-term review in 2017-18.
The Asian manufacturers are relying much more on advanced naturally aspirated engines
(some with high CR) and the CVT as their principal choices for cars and crossover SUV models
and appear to be in a strong position for over-complying with standards to 2020 using low cost
technology. In addition, Toyota (and to a lesser extent, Honda and Hyundai) has several
successful hybrid products that provide significant fuel economy credits. Nissan is investing on a
BEV strategy that may not be successful, but this may only affect their credit accumulation for
use in the post-2020 time frame, as their naturally aspirated engine plus CVT technology attains
very high fuel economy. In the post 2020 time frame, we expect that there will be a transition to
high CR + Miller or Atkinson cycle technology. This may allow manufacturers to meet the 2025
standards with no major reliance on hybrid or PHEV/BEV technology.

xviii
Based on a detailed study of market penetration by engine type, we have developed a forecast
for 2020. The forecast assumes that different manufacturers will have near constant market
share over the 2013 – 2020 period although technology market shares do not vary very much if
modest gains by Asian manufacturers are included in the forecast. The only major uncertainty is
V8 diesel introduction that could occur in 2019-20; if this does not happen, diesel penetration in
light trucks will be about 2%.Table E-1 shows the car and light-duty truck engine technology
forecasts, and we expect that about one-third of the fleet will use downsized GDI Turbo engines
by 2020, while the different vehicle electrification technologies will claim about 15% market
share, almost a doubling of the 7.8% market share in cars in 2013. However, we do not
anticipate substantial diesel market share in 2020, with only 2% of cars expected to be diesel
(which does represent a near doubling of current market share).
The major difference between cars and light trucks is in the area of hybrid vs. diesel penetration.
We anticipate vehicle electrification will continue to lag in light trucks, with only the small
crossovers being offered with hybrid and PHEV options. The 2020 CAFE standard for large light
trucks is quite lenient, but the 2025 standards are difficult so that domestic manufacturers (who
dominate this segment) may offer a V8 diesel before the end of the decade. We anticipate that
the diesel will be popular in pickup trucks and the large SUV models, so that market share could
increase rapidly in the 2018-20 time frame.
Table E-1: Engine Technology Mix (percent) for Cars/ Trucks over Time
CARS 2010 2013 2016 2020
PFI 92/ 92.5 79/ 87 65/ 70 37/ 34
GDI- NA 3/ 5.5 7/ 6 10/10 25/ 30
GDI – TURBO 4/ 1.7 12/ 8 18/ 13 35/ 20
GDI –LEAN BURN 0/ 0 0/ 0 1/ 0.5 3/ 2
HIGH CR- MILLER CYCLE 0/ 0 0.5/0.5 3/ 1.5 6/ 3
HIGH CR – HCCI 0/0 0/ 0 0/0 2/ 1
HYBRID 6/ 0.8 6.5/ 1.2 8/ 1.6 10/ 2.4
BAS HYBRID 0.1/0 0.3/ 0 1/ 0.5 2/ 1
PHEV 0/ 0 0.5/ 0 0.8/ 0.2 1.5/ 0.3
BEV 0 0.5 0.7/ 0.2 1.5/ 0.3
DIESEL 0.9/ 0.3 1.1/ 0.4 1.5/ 2.5 2/ 6

xix
As expected, the product plan technology penetrations allow the fleet fuel economy to slightly
exceed targets for 2016 and 2020. The CAFE target for fuel economy is 37.8 mpg for cars in
2016 and 43.9 mpg in 2020 and the values expected to be attained are 38.8 and 44.1 mpg
respectively. The 2020 fleet average is close to the target implying that some manufacturers will
have difficulty in complying and will be using carry-forward credits or paying fines in this case.
Our estimate of the total retail price increase for cars due to compliance in 2020 is about $720
over 2016, which is higher than EPA’s estimate, but costs are consistent due to the fact that
EPA assumes only a 25% markup from cost to price, while our markup is 60%.
A second major finding is that the costs of compliance for the 2016 standards are much reduced
from our earlier estimates provided to API in 2009. The new technology pathway and low cost
transmission improvements now suggest that the 2016 standards for cars will result in a retail
price increase of $635, which is only half the previous estimate, and even cheaper than the EPA
estimate of about $750. Part of the reduction is associated with the market shifts that have
occurred since 2008, but most of the reduction is associated with significant improvement in the
potential benefits of conventional technology which are available at very low cost. Neither the
2016 nor the 2020 standard requires significant increases in hybrid and EV/PHEV market
penetration in cars, and we anticipate that hybrid penetration in cars will increase from about 7%
today to about 12% in 2020.
The CAFE requirements for light trucks through 2020 are less stringent than those for cars,
which reduces the 2020 retail price effect of compliance to $630 more than the 2016 price. This
increment is higher than the EPA estimate, but still quite low and lower than the car estimate of
$720. The costs of compliance with the 2016 light truck standards are also substantially lower
than the estimate that we developed for API back in 2009, for much the same reasons as for
cars. Due to the unusual shape of the curves defining the standards as a function of the
footprint, which make it easier for larger trucks to comply, we estimate that GM, Ford and
Chrysler will have a relatively easier time complying with the light truck standard than with the
car standard and we forecast that they will actually exceed the truck standard and use the
excess credits towards satisfying the car regulations. We also do not anticipate significant
hybrid penetration in trucks and estimate 2020 penetration of about 2.5%, up from a little less
than 1% today. We do expect diesel penetration to grow significantly in trucks and estimate that
it will reach 6% in 2020 if Ford and GM introduce the V8 diesel in large pickups and SUV
models.
In summary, the analysis of technology compliance and costs show or suggest that
- The 2016 and 2020 standards can be attained at reasonably low cost (less than
$1400 in 2020) relative to a 2010 baseline and do not require significant levels of
vehicle electrification or diesel penetration
- The 2025 standards, even with all available credits, will be difficult to attain. The
standards for cars are potentially possible with penetration of hybrid and diesel

xx
vehicles of about 25%. The light truck standards are more daunting and will
require combined hybrid and diesel penetration of about 45%.
- The US automakers will likely fight to have the 2025 standards relaxed,
especially for light trucks, when the mid-term review takes place in 2017-18.
E.8 IMPACT ON FUELREQUIREMENTS
The effects of the changing engine technologies and the introduction of plug-in hybrids could
affect the requirements for specific fuel properties, and these requirements were explored in
detail through both a literature search and direct meetings with key manufacturers and
suppliers. Of course, auto-manufacturers design new technologies while accounting for existing
fuel specifications, and they adjust for any fuel property effects by making changes to engine
design and material specifications. Hence, the influences are generally modest and only point to
directional changes in fuel and lubricant specifications that may be advantageous in the future.
New engine technologies of interest include gasoline direct injection (GDI), GDI with turbo-
charging, high compression ratio, and idle stop. Secondary impacts may arise from new hybrid
and plug-in hybrid types. Impacts investigated include
GDI injector fouling and fuel coking due to higher tip temperature.
Intake valve deposits with GDI
Fuel octane and composition issues with GDI/ Turbo
Fuel Issues with high CR engines
Impact of fuel properties on PM emissions
Fuel coking at the tip and higher injector deposits at the tip have been improved by increased
cooling around the injector and by implementing a minimum injection quantity when combustion
chamber temperatures are high. Manufacturers agree that so far, coking has not been a
problem in the EU where GDI has been available for over a decade, but Bosch was of the
opinion that the European experience may not translate directly to the US, and specifically
mentioned that they had observed salt deposits in injector tips in US GDI engines.
Wall wetting by the fuel spray from GDI injectors has been minimized by significant
development in optimizing combustion chamber airflow and injector spray pattern. The use of
multi-hole injectors with pulsed sprays has also contributed to significant reduction in wall
wetting. Manufacturers acknowledge that GDI engines do have somewhat higher levels of oil
dilution by fuel but stated that the dilution level between oil changes was still within
specifications and is not an issue of any concern.
Intake valve deposit issues are not yet a major concern as manufacturers are using only
moderate quantities of external EGR and relying more heavily on internal EGR by adjusting cam

xxi
timing. Intake valve seals have been improved to reduce oil based deposit formation on intake
valves. However, manufacturers are wary of deposits with high EGR rates such as using cooled
EGR at wide open throttle to increase turbo boost, and feel that both intake deposits and valve
deposits would be an issue. Bosch believed that using a combination of both PFI and GDI would
be the ideal technology to avoid intake valve deposits.
Particulate Matter (PM) emissions from GDI engines have become a major issue after early GDI
engines were found to have to 5 to 10 times higher PM emissions relative to gasoline PFI
engines which emit less than 2 mg/mi. Research by Honda shows that PM emissions are well
correlated with the inverse of fuel vapor pressure at 443 K and this implies control of T90
fraction of gasoline. The analysis also found correlation with the double-bond index of the fuel
components. Other manufacturers support the view that the heavier fuel components have a
significant effect on PM emissions but also believe that this effect can be mitigated by
improvements in fuel-air mixing that can be achieved by using higher injection pressures, multi-
hole injectors and optimized injection for combustion chamber airflow. We do not anticipate the
need for PM traps to meet proposed future standards for PM emissions.
The demand for higher octane fuel due to turbo-charging could be a major issue. Although the
majority of mass-market vehicles with Turbo/DI will require only regular fuel, the experience in
the EU suggests that demand for premium fuel will be higher for these vehicles as consumers
perceive an advantage. Manufacturers confirm that the actual HP increase for a 4 octane point
increase in fuel RON is on the order of 2.5% to 3% which should be barely perceptible to
consumers, and suggest that consumer response is more image driven.
Some manufacturers are advocating a higher ethanol blend premium for turbo-GDI engines to
capture the benefit of the high latent heat of vaporization of ethanol. These manufacturers
believe that a E25 or E30 blend with 91 RON base gasoline blend stock will maximize the
benefits of RON increase and cooling from evaporation.
Low RPM pre-ignition is a problem with some Turbo-GDI engines and the pre-ignition does not
occur uniformly on every cycle but more randomly. Toyota’s research indicates that this may be
caused by the ejection of oil droplets into the combustion chamber from crevices, and they
correlated the frequency of occurrence of low speed pre-ignition with the auto-ignition
temperature of the lubricating oil. Other manufacturers are not a sure that the lubricant oil is the
complete explanation for this phenomenon, and some suggest wall wetting could be an issue.
In general, neither DI technology or Turbo-DI technology reduce exhaust gas temperature.
Honda presented data suggesting that hybrid and idle stop technologies reduce exhaust gas
temperature, leading to less capability for the catalyst to desorb the sulfur at high temperature
transients. This data is used to support the need for a low sulfur gasoline standard, but it is not
clear that this represents actual data or a theoretical expectation, since engine operating points
also change for hybrid vehicles. Other manufacturers stated that during engine operation,

xxii
temperatures are higher as the engine is operating at higher loads, and cooling of the exhaust
during engine shutdown is minimized due to lack of gas flow and insulation of exhaust.

1
1. INTRODUCTION
1.1 BACKGROUND
The Obama administration has set greenhouse gas (GHG) emission standards and equivalent
corporate average fuel economy (CAFE) standards for cars and light duty trucks to model year
2025. The American Petroleum Institute is interested in understanding the impact of these
regulations, and the goal of this study conducted by H-D Systems (HDS), is to conduct a
comprehensive assessment of the regulations and estimate the incremental costs, market
penetration, GHG emissions reduction and/or fuel economy improvement potential associated
with the technologies. In 2008, API had contracted with EEA/ICF1 to provide a similar analysis of
the 2016 standards. (All references are provided as footnotes). The objective of this effort is to
update the earlier report with information on new technologies that have emerged since 2008
and extend the forecast to 2025. Hence, the technology descriptions in this report are not
intended to be a comprehensive description of all technology that will be used to comply with
future fuel economy and greenhouse gas emission standards. In addition, the analysis also
examines the implications of new engine technologies for fuel requirements.
The new regulation has been publicly identified as a 54.5 mpg standard, which is derived from a
tailpipe CO2 emissions standard of 163 g/mi for 2025 and this is the average for the car + light
truck new vehicle fleet. Due to the inclusion of a number of credits for some technologies and
alternative fuels, the standards significantly overstate the stringency of the tailpipe CO2
emissions and the fuel economy values that must be actually attained for compliance.
Nevertheless, even the actual values are quite stringent in their requirement for improvement in
fuel economy over the 2010 to 2025 period (standards to 2016 were set in 2009, and the new
standards put in place in 2012 cover the 2017-2025 period). It should be noted that while
California has aligned its GHG emission requirements with the Federal requirements,
manufacturers face a separate “Zero Emission Vehicle” (ZEV) mandate in California but details
of the ZEV mandate are not discussed here.
Technology development will be influenced by both the US standard as well as the standards
set by the EU for European countries. For example, European auto-manufacturers and
1 EEA/ICF, Advanced Technologies to Improve Fuel Economy of Light Duty Vehicles, Report
to the API, November 2008.

2
suppliers are spearheading the development of highly boosted small displacement engines that
will see US application in the future. The EU standards for light vehicle tailpipe CO2 emissions
are currently the most stringent in the world for 2020. Although the US standards for 2025 are at
numerically similar levels to those applicable to light vehicles in the EU, the standards are not
directly comparable as the EU standard is based on a different test procedure and does not
include “commercial” vehicles like cargo vans and pickup trucks, whereas the US standards
cover both passenger and commercial vehicles. Both the EU and US standards are attribute
based, and since consumers in the EU and the US buy a different mix of vehicle types and
sizes, the relative stringency of the two sets of regulations cannot be determined from the
expected average CO2 emissions in each region.
1.2 METHODOLOGY
The analysis requires a comprehensive understanding of the Corporate Average Fuel Economy
(CAFE) and Green House Gas (GHG) regulations and detailed knowledge of new technologies
that can be used to meet the regulatory requirements to 2025. The technology understanding
coupled with insights on manufacturer product plans allow HDS to provide a reliable forecast to
2025, as explained below.
EPA and NHTSA have documented their analysis supporting the regulations in detail in the
Technical Assessment Report (TAR) and the Regulatory Impact Assessment (RIA), but even
these documents do not provide all of the details regarding technology assumptions on
performance, cost and adoption. As part of this effort to replicate and document the agencies’
analysis, HDS ran the EPA model called OMEGA and also interviewed EPA staff on specific
assumptions employed in cases where such assumptions were not provided in the
documentation. The reviews of the TAR and RIA and the results of the interviews are the basis
for our analyses of the standards and the agencies’ projections of future technology adoption.
The central part of this effort is our own estimation of costs and benefits of individual
technologies to improve fuel economy, which we have identified by extensive searches of
technical publications, manufacturers’ announcements and reports on government funded
research worldwide. Fuel efficiency benefits estimates are also based on the same sources,
which often report data from prototype versions of the technology, and also discuss the origins
of such benefits. Technology data is widely reported in auto-industry trade publications and in
the Society of Automotive Engineers’ journals and papers as well as in other European and
Japanese conferences, notably the ones held in Vienna and Aachen. HDS monitors all of these
publications on a continuous basis and staff members attend many of the conferences. In this

3
effort, we have assembled all of the data collected over the last few years to provide a review
and update of information on technology. A key activity for this report involved conducting
interviews with senior engineering staff at six auto-manufacturers and one Tier I supplier, who
are listed below.
Cost data on individual technologies were developed from four sources
(1) actual price comparisons between similar cars with and without a technology where
the technology is offered as an option;
(2) manufacturer or supplier cost inputs for add-on technology obtained from our
contacts with the industry;
(3) from engineering studies of technology costs; and
(4) from manufacturer submissions to regulatory bodies.
The six manufacturers interviewed were Toyota, Nissan, Honda and Mazda in Japan, and VW
and Daimler in Germany. Bosch was the only Tier I supplier interviewed. We also requested
interviews with GM and Ford but received no response.
Discussions with the manufacturers centered around new technology developments and their
performance, but product plans (which are highly confidential) were not discussed with
manufacturers. Product plan information has been developed from non-confidential sources
including reports in the trade press, management comments at auto-shows, and information
from suppliers on new contracts. These plans have been used to develop new technology
introduction plans at the vehicle make/model level and the technology plans have been utilized
to develop fuel economy forecasts at this level to 2018/19. HDS has modeled the synergy
effects of technology combinations using a lumped parameter model that is capable of
accounting for primary synergies in pumping and friction loss.
Information on the effects of these new technologies on fuel requirements available in open
literature is quite limited and virtually all of the information on this topic was developed from
information provided by manufacturers and Bosch during the interviews. Again, none of the
information is considered confidential.
1.3 ORGANIZATION OF THIS REPORT
The new CAFE and GHG standards for the US are detailed in section 2, while one subsection
provides a brief summary of the EU regulation. Sections 3, 4, 5 and 6 provide an update on the
technology that can be used to reduce fuel consumption and CO2 emissions to comply with

4
standards, with each section covering a particular aspect of the vehicle. Section 3 covers engine
technology, section 4 covers vehicle body related technology, section 5 covers transmission
technology and section 6 covers vehicle electrification.
All standards apply to each manufacturer and Section 7 provides the product plans for all major
manufacturers in the US market. EPA has developed its own analysis of the least cost
technology pathway to attain standards, and this is described in section 7.2. There are a
number of alternative technology pathways that can be followed (in terms of engine and
transmission technology) to comply with 2025 standards and there are significant differences in
the approach employed by different manufacturer groups. Since product plans are typically set
only for a 5 year planning horizon, there are no definitive plans for the 2019 to 2025 period.
However, the manufacturer specific plans to 2017/18 provide readers with insight into the likely
direction that these manufacturers will take to 2025, as well as the relative compliance burden
faced by the manufacturers, and these are described for the eight largest manufacturers (by
sales) in the US.
Section 8 integrates the findings from the technology analysis and product plan analysis to
provide an aggregate forecast at the car and light truck fleet level for 2016, 2020 and 2025 with
the last (2025) forecast based on an extension of manufacturer technology directions from
2020. The forecast provides a good estimate of the average cost to comply with the standards
and the relative difficulty of compliance. Section 9 provides some insight into potential effects on
fuel quality and composition requirements associated with the different technologies forecast to
2025.
Appendix A documents the technology incremental retail prices used in our analysis. A list of
acronyms is provided at the end of this report.

5
2. US STANDARDS FOR FUEL ECONOMY AND
GHG EMISSIONS
2.1 BACKGROUND
The U.S National Program proposal was announced by President Obama in May 2009. At that
time, the US National Program called for increasingly stringent fuel-economy standards
beginning in MY2012, reaching an estimated 34.1 mpg for the combined industry-wide fleet by
MY2016. A further round of standards for 2017-2025 was to be developed in a cooperative
activity by the Environmental Protection Agency (EPA) and the National Highway Traffic Safety
Administration (NHTSA) in consultation with the California Air Resources Board (CARB). In
November 2011, EPA and NHTSA jointly issued a proposal for the GHG and Corporate
Average Fuel Economy (CAFE) standards for 2017 through 2025, and the agencies released
the final regulations in October, 2012.
NHTSA issues the regulations in terms of fuel economy standard in miles per gallon, while EPA
sets a standard for GHG emissions in CO2 equivalent grams per mile. Most of the GHG
emissions from light vehicles (but not all) is associated with CO2 emissions from the tailpipe due
to fuel combustion. Hence, fuel economy and GHG emissions are closely related for a given
fuel, and if all GHG emissions are associated with tailpipe emissions of CO2 from a gasoline
vehicle, the conversion from miles per gallon to CO2 grams per mile is given by the inverse
relationship:
MPG = 8887/ CO2
The inverse relationship implies that reductions in CO2 (GHG) emissions are equivalent to
increases in fuel economy (MPG). The 2016 CO2 standard of 250 g/mi is equivalent to about
35.5 mpg, while the 2025 standard of 163 g/mi translates to the 54.5 mpg standard. GHG
emission from other sources such as the air conditioner and emissions of other GHGs such as
nitrous oxide and methane complicate the conversion, but these emissions are relatively small
compared the emissions of tailpipe CO2. Nevertheless, the emissions accounting by EPA for
GHG emissions regulations and the accounting for fuel economy regulations do differ, so that
harmonization of the regulations was required. While EPA and NHTSA have coordinated their
efforts, there are still some open issues regarding compliance with both sets of regulations. The

6
issuing of separate regulations by both the EPA and NHTSA is a duplication that could
eventually be ended by Congressional action, such as a repeal of DOT’s fuel economy
standards authority.
One aspect of this phase of the National Program that is unique is that CAFE standards for MYs
2022-2025 must be conditional, while EPA’s (and also California’s) standards for those model
years are legally binding. The 2007 Energy Independence and Security Act (EISA) requires
NHTSA to issue CAFE standards for “at least 1, but not more than 5, model years.” To maintain
the harmonization benefits of the National Program, NHTSA has adopted standards for all nine
model years from 2017-2025, but the last four years of standards are conditional. The
passenger car and light truck CAFE standards for MYs 2022-2025 will be determined with
finality in a Mid-Term Review process to be conducted in 2017-18. The mid-term review was a
key feature that enabled acceptance of the 2025 standard by the auto-manufacturers.
2.2 OVERVIEW OF GHG AND FUEL ECONOMY REGULATIONS
The light duty vehicle standards set minimum requirements for fuel economy and GHG emission
performance for all vehicles made and/ or imported for sale in the US by each manufacturer in a
particular model year (vehicle model year can be designated by a manufacturer subject to some
constraints on when the vehicle is produced). GHG and fuel economy performance for a
vehicle model is determined according to a test procedure conducted under controlled
laboratory conditions.
Figure 2-1: Footprint of a Vehicle

7
Each vehicle model is distinguished by its size – the vehicle “footprint” is the measure of size
that has been chosen; it is the area obtained by multiplying the length of the wheelbase by the
average track width (see Figure 2-1).
To measure compliance with the GHG standards, the following steps are performed. First, the
sales weighted average footprint and the sales weighted average GHG emissions are
calculated for a manufacturer in each model year. Computations are performed separately for
each manufacturer’s car and light truck fleet. If the manufacturer’s car GHG average falls on or
below the line that defines the standard for the average footprint of vehicle sales of the MY, then
the company meets the standard. If the average falls below the line, then the company is better
than the standard and is due a credit that can be used in future years. Procedures for
compliance with Corporate Average Fuel Economy (CAFE) standards are quite similar but the
averages are computed using a sales weighted harmonic average of each individual vehicle
model’s fuel economy. If the CAFE average falls below the line, then the company fails to meet
the standard since fuel economy and GHG emissions are inversely related. If the company does
not have sufficient credits to offset the excess, a penalty is assessed under the US CAFE
program. EPA’s GHG rules under the CAA do not allow a company to fail to meet the standard
without serious legal consequences – it is not clear how EPA will address this difference in
treatment of manufacturers. The same calculations are made for the company’s light truck fleet.
Trading of credits is allowed between cars and light truck fleets.
Under the footprint standard approach, each company will have a different fleet average result
since their vehicle sales mix is unique. Companies may use several technologies to reduce the
GHG emissions of each model line. The light truck standards are less stringent than the car
standards, in that higher CO2 emissions are allowed at the same footprint area, reflecting the
different mission and design of this class of vehicles. In addition, for 2017 through 2021, the
larger light truck footprint standards are significantly less progressive than the passenger cars
standards.
2.3 REGULATORY DESIGN AND STRINGENCY OF STANDARDS
The standard curve that NHTSA initially used for the 2010MY is an S-shaped constrained
logistical curve; the new system from 2011-16 and now extended from 2017 to 2025, uses
“piecewise linear” functions between vehicle footprint and the test-cycle CO2 emission rate. This
shape, shown in Figure 2-2 for passenger cars, allows for different sized vehicles to have
different standards in the sloped portion, but constrains the largest vehicles at the upper bend
and incentivizes vehicles below the lower bend.

8
Figure 2-2: CO2 Target Curves for Passenger Cars
Figure 2-3: CO2 Target Curves for Light Trucks

9
The footprint curves require about 4.1% annual fuel economy increase for cars from MYs 2017
through 2021, and 4.3% annually for MYs 2022 through 2025. The curves are different for cars
and light trucks. The cars curves are more or less evenly spaced apart from the smallest to the
largest footprint, indicating that cars of all sizes are faced with a similar degree of fuel economy
improvement target. However, the light truck curves, shown in Figure 2-3, are quite different –
the curves are noticeably squeezed together for larger footprint values where the majority of
large pickup trucks are concentrated. The regulation requires slower fuel economy improvement
rate for full size trucks resulting in average LDT improvement requirement of 2.9% for MYs 2017
through 2021.
Figure 2-4: Annual Fuel Economy Increase Required by CAFE Standards
The compression of the curves at larger footprints was to specially address the concerns of the
domestic US manufacturers (GM, Ford and Chrysler) that there is less fuel efficiency potential
for the large footprint vehicles due to their open pickup bed, body-on-frame construction and the
requirement to be capable of hauling or towing heavy loads. However, it is not clear why such
concerns did not persist for setting the 2025 standard, and it is possible that manufacturers
expect to reopen this issue when the standards are reviewed in 2017.As shown in Figure 2-4,

10
the required rate of fuel economy improvement varies considerably across the range of footprint
values, from about 4% for the smallest trucks to only 0.5% for the largest trucks (this reduced
rate for large trucks was aimed at the large pickup market) in the 2017-2021 period. The rate
would increase to 4.7% for MYs 2022 through 2025
One significant change in vehicle classification is that 2-wheel drive SUV models will be
classified as cars while 4-wheel drive SUV models will remain classified as trucks. This re-
classification changes the ratio of cars to trucks assumed for the future but also provide a
perverse incentive to manufacturers to discontinue the more efficient 2WD models. Typically,
conversion from 2WD to 4WD increases CO2 emissions by 6 to 7%, but the standard for light
trucks is almost 15% higher at the same platform area, so that conversion to 4WD improves the
compliance picture.
According to the agency projections, the CAFE standards will require a combined average of
40.3 to 41.0 mpg in MY 2021, and 48.7 to 49.7mpg in MY2025. EPA’s GHG standards, which
are harmonized with NHTSA’s CAFE standards, are projected to require 163g/mi (CO2) in
MY2025, which would be equivalent to 54.5 mpg, if the vehicles were to meet this CO2 level all
through fuel economy improvements. The standards for each year based on GHG emissions
and their conversion to fuel economy space is shown below.
The agencies expect, however, that a portion of these improvements will be made through other
credits (discussed further in sections below) and the actual tailpipe CO2 level expected by the
agencies are about 234 g/mi in 2020 and 186 g/mi in 2025. The car + light truck fleet average
numbers are based on an estimate from the US Energy Information Administration (EIA) that
the percent of vehicles that are light trucks will fall drastically in the future from 2008 levels of
over 50% of the light vehicle fleet, based on events in 2009/2010. Because there are two
categories, car and truck, and the standards are based on the footprint attributes of future year

11
vehicle sales, the exact GHG outcome from the program is unknown until the final sales mix of
vehicles sold in each MY is determined some months after the end of the year. More recently,
the light truck share has rebounded in the US in spite of high gasoline prices suggesting that the
EIA may have been too optimistic in its forecast of energy use reductions. Our own analysis
suggests actual CO2 emissions for compliance may be even higher as described in section 2.5.
The EPA and NHTSA standards on the same metric of MPG are different because the NHTSA
standard does not include the air conditioner related GHG emissions and has some other minor
differences in accounting. The two standards using the MPG metric are shown below in Figure
2-5.
Figure 2-5
The regulations include a system of emission credits to help meet overall environmental
objectives in a manner that provides companies with maximum compliance flexibility. A new
and very important CAFE program flexibility is that, for the first time, NHTSA will allow CAFE
credits for “any adjustments that EPA allows” such as improvements related to mobile air
conditioning (A/C) efficiency and “off cycle” technologies. The credits include the following:
Credits are assessed for companies doing better than the applicable fleet
average standard for a given model year for both cars and light trucks;

12
Deficits will be incurred for companies not achieving the applicable fleet average
standard in a given model year; the emission deficits incurred in a given model
year will have to be offset with an equivalent number of emission credits within
the subsequent three model years;
Emission credits have a lifespan of five model years and can be traded between
companies.
Credits can be transferred between cars and light trucks. To maintain the effects
of the standards on fuel volumes and GHG emission reductions, these transfers
are weighted by the average lifetime mileage of cars versus trucks. Unlike the
CAFE standards, there are no limits on the amounts that can be transferred
under the GHG regulation.
Credit incentives for "game changing" technologies including hybridization for full-
size pick-ups, as well as early technology introduction.
Revised credit scheme for CNGVs, PHEVs, and FFVs to reflect the actual use of
electricity and/or alternative fuels (the current CAFE credit for FFVs will expire in
MY2020).
Under CAFE there is a well-established civil penalty regime, which continues under the
reformed NHTSA standards program. Companies pay penalties of $5.50 for every 1/10th of a
mpg that their fleet average failed to meet the standard multiplied by the number of vehicles
sold by the company. Under the EPA GHG standards, there are no provisions for non-
compliance penalties; companies must comply or they will face a court case that could result in
large fines. In theory, companies that are on track to fail to meet the standard can purchase
credits from another company. Apparently such trading has occurred at least once in the past,
but whether this is feasible in future is difficult to predict. Our analysis leads us to think that
there are unlikely to be enough excess credits to be traded to meet the degree of non-
compliance likely for the 2025 standard. Even if there were sufficient credits, it is not clear
whether the companies holding them would be willing to sell them to competitors.
Manufacturers that sold fewer than 40,000 cars/light trucks in 2009 are allowed to create
Temporary Optional Fleets for up to 10,000 vehicles as a separate averaging fleet that must
meet a GHG emission target 25% greater than the applicable standard, in return for less
stringent standards for the total fleet.

13
2.4 “OFF CYCLE” CREDITS
EPA provided a temporary incentive in its 2011-16 rule to encourage the commercialization of
advanced GHG/fuel economy control technologies - including electric vehicles (EVs), plug-in
hybrid electric vehicles (PHEVs), and fuel cell vehicles (FCVs). The 2017-25 rules would
continue this incentive. EPA’s proposal includes an emissions compliance value of zero
grams/mile for EVs and FCVs, and the electric drive portion of PHEV driving. There is also
provision for a multiplier so that each advanced technology vehicle would count as greater than
one vehicle in a manufacturer’s fleet-wide compliance calculation.
The “zero g/mi” CO2 tailpipe allowance for BEVs, PHEVs and FCEVs will be kept up to the
combined sales volume of either 200,000 or 600,000 units, depending on how early these types
of vehicles are introduced. Also, for these vehicles, production multipliers of 1.3 to 2.0 are
allowed for MYs 2017 to 2021, depending on the vehicle type and year. For any production
greater than this amount, the compliance value for the vehicle will be greater than zero
gram/mile, set at a level that reflects the vehicle’s net increase in upstream GHG emissions in
comparison to the gasoline vehicle it replaces; this calculation involves an estimation of lifecycle
emissions of GHG from the entire vehicle and fuel pathway. However, the sales volumes to hit
the cap are much higher than what is widely anticipated for these vehicle types.
For the GHG standards program, EPA allows FFV credits in line with those established for fuel
economy, but only during the period from MYs 2012 to 2015. After MY 2015, EPA will only allow
FFV credits based on a manufacturer’s demonstration that the alternative fuel is actually being
used in the vehicles, and based on the vehicle’s actual fueling. At present, methods to establish
this are only in the research stage, but the data can be made available in each vehicle
electronic control unit and downloaded either at annual inspection or through a wireless
connection. The maximum FFV credit for fuel economy is set at 1.2 MPG for MY 2012-2014,
and declines by 0.2 mpg per year to be zero in 2020.
For dedicated alternative fuel vehicles, such as dedicated natural gas vehicles, there are no
limits or phase-out of the credits. Production multipliers are also available for the early
introduction of CNG vehicles.
EPA is proposing to expand the “off cycle” credits starting with MY2017 to include:
Active aerodynamics
High efficiency exterior lighting
Engine heat recovery

14
Idle-off
Active transmission warm-up
Active engine warm-up
Electric heater circulation pump
Solar roof panels
Thermal control (glass or glazing, active seat ventilation, solar reflective paint,
passive or active cabin ventilation)
The rule states that the maximum GHG reduction allowed from any combination of these credits
would be capped at 10g/mi (about 1.6mpg for 2020) for the combined LDV/LDT fleet. Some
manufacturers have submitted comments that argue for this cap being lifted, and that the credit
be based on GHG reductions that manufacturers can substantiate in evidence they submit on
the in-use effects of the technology. EPA will consider manufacturer submissions for the above
technology categories as well as other technologies that can also reduce emissions.
The special full size pickup hybridization provisions will allow 10g/mi (about 1.6mpg for 2020)
credit for “mild HEV” designs, if market penetration in a given model (nameplate) is from 30% to
80% (depending on the year) from MY2017 to 2021 after which no early introduction credits are
available. A 20g/mi credit (about 3 mpg) will be available for “strong” HEV designs and market
penetration from 15% to 40% in the same time period.
2.5 OTHER EMISSION CREDITS
Methane (CH4) and nitrous oxide (N2O) emissions are relatively strong GHGs that are emitted in
very small quantities from vehicle tailpipes; credits can be earned when a company can
demonstrate that its tailpipe NH4 and N2O emissions are lower than the emission caps that have
been established, based on representative emissions from existing new vehicles. (The
procedures for obtaining these credits have not been formalized although the general structure
is known). The GHG weighted CO2 equivalent emissions of these compounds are about 3 to 4
percent of tailpipe CO2 emissions so that the net reduction potential is small but not
insignificant.
Air conditioner (A/C) credits can be earned for vehicles with systems that can be shown to
reduce leakage of refrigerants (which are strong GHGs), and for systems that reduce CO2
related emissions by improving the A/C system efficiency – in this case the system needs less
gasoline (and therefore lower CO2 emissions) for its operation. The current refrigerant, R-134a,
has a very high global warming potential, and the leakage reduction credits are 6.3 g/mi for cars

15
and 7.8 g/mi for trucks. Replacement of the refrigerant with R-1234yf increases the leakage
reduction credits to 13.8 g/mi and 17.2 g/mi. Reducing air-conditioner energy consumption by
improving compressor efficiency, installation of an internal heat exchanger and by better control
of cooling air receives a credit of 5 g/mi and 7.2 g/mi for cars and light trucks respectively. The
A/C credits are the largest of all of the credits available.
According to HDS estimates, these credits can be obtained at low cost relative to many engine
and transmission technologies planned for the future and we anticipate that manufacturers will
maximize the use of these credits. However, EPA and NHTSA assume far more modest use of
these credits to compute tailpipe emissions, and their estimates for credit use over the 2016 to
2025 period are shown below The assumed off-cycle credit usage is only 2.3 g/mi in 2025 as
opposed to the available maximum of 10 g/mi..
MYR GHG Std.
Tech. Multiplier
HEV Pickup
Off cycle technology
A/C Refrigerant
A/C Efficiency
Projected Tailpipe
2016 250 g/mi 0 0 0.5 5.8 4.8 261g/mi
34.1 mpg
2020 213 1.0 0.1 1.0 13.4 5.8 234 g/mi
38.0 mpg
2025 163 0 0.3 2.3 14.9 5.7 186 g/mi
47.8 mpg
The 186 g/mi projected level in 2025 is equivalent to 47.8 mpg, which is different from the CAFE
standard due to some differences in computation of the CAFE associated with test procedure
credits and the treatment of air conditioning. It is curious that EPA does not expect
manufacturers to use the entire off cycle credit up to the cap of 10 g/mi. In addition, other credits
associated with EVs and HEVs are not explored in the EPA analysis.
2.6. ESTIMATED CO2 AND FUEL ECONOMY TARGETS WITH CREDITS
The EPA/NHTSA estimates for projected tailpipe levels have been widely criticized as too
optimistic, and organizations such as the ICCT have estimated much lower levels for 2025. For
example, in a 2013 SAE presentation2, J. German from ICCT provided an estimate of 202 g/mi
equivalent to 45.2 mpg for 2025, but even this estimate did not account for market shifts and
changes to the footprint of vehicles. The A/C credits are about the only area where there is
2 German, J, Oral presentation at the 2013 SAE Government/ Industry Meeting, January 2013

16
agreement among most parties that the entire credit will likely be utilized, from conversion of the
refrigerant, reduced refrigerant leakage and from efficiency improvements. The maximum credit
is 18.8 g/mi for cars and 24.4 g/mi from trucks. For a 55% car and 45% truck sales mix in 2025,
the net credit will be 21.3 g/mi, somewhat higher than EPA’s estimate of 20.6 g/mi (due to the
lower assumed truck penetration of 33%).
There are many technologies for off-cycle credits and Table 2-1 provides a complete listing of
the available credits. The total available credits if all technologies are employed on the same
vehicle is over 14 g/mi for cars and 20 g/mi for trucks but the total that can be claimed for
compliance is capped at 10 g/mi. Hence, even a 60% penetration of these technologies will
allow exceeding the 10 g/mi cap to claim the full available credit.
Technology Credits in g/mi (cars/trucks)
Active aerodynamic drag reduction devices 0.6/1.0 per 3% drag reduction
Engine idle stop 2.5/4.4 (with electric heater circulation) 1.5/2.9(w/o electric heater circulation)
Electric heater circulation pump Included in idle stop
Waste heat recovery 0.7/0.7
Active transmission warm-up 1.5/ 3.2
Active engine warm-up 1.5/ 3.2
High efficiency exterior lights 1.0/1.0
Solar thermal control Up to 3.0/4.3
Solar Panels for HEV/PHEV/EV 3.3/3.3 for battery charging only
2.5/2.5 for battery charging+ active cabin ventilation
Table 2-1: Technologies with Defined Off-cycle Credits
Many of the technologies such as active aerodynamic devices, rapid transmission warm-up,
high efficiency lights and idle stop have already entered the market in 2012/2013. These four
technologies are widely expected to be available in most cars and light trucks by 2020, and
even an 80% penetration of these technologies by 2025 would result in an 8.3 g/mi credit. In
addition, manufacturers can propose additional technologies for consideration for credits, and
we expect to see some penetration of solar thermal control technology so that the net benefit is
likely to exceed the cap value of 10 g/mi by 2025.
The pickup truck technology credit allows a 20 g/mi credit for pickup trucks exceeding the
applicable standard by 20%. Such pickups are likely to be diesel or hybrid engine powered, and

17
could conceivably have a market penetration of 20% or more by 2025. Since pickup trucks are
about 10% of the total car+ truck fleet, the fleet-wide credit is only 0.4 g/mi. EV super credits
expire by 2021 so that they are unlikely to have any impact on 2025 except through credit carry-
forward provisions. However, the zero tailpipe emissions will provide some benefit; if 3% of cars
and 2% of trucks are EV/PHEV, we compute a net benefit of 4.8 g/mi for the other 97.4% of
vehicles that are conventionally powered. This computation is simply based on the fact that
2.6% of the vehicles will be at zero emissions; if the per-credit emissions are at 184 g/mi, per
the NHTSA standard, the benefit is 184*0.026 or 4.8 g/mi
Vehicle classification and size are also contributors to the actual requirements for 2025. As
noted, EPA expects truck sales to be only 33% of total light vehicles, but current sales of trucks
have rebounded from the lows observed in 2009. Additionally we anticipate conversion of much
of the 2WD SUV fleet to 4WD due to the less stringent standard applicable to 4WD SUVs, and
the minimum truck fraction in 2025 is forecast at 40% with some 2WD SUVs in the fleet. The 7%
difference in sales mix reduces the applicable standard by 4.2 g/m, since the difference
between car and truck standards in 2025 is 60 g/mi. In addition, the footprint based standard
has led to increases in wheelbase length in many new models that replace older models.
Wheelbase increases of 2 to 4 inches are common on many new models, which is about a 3%
increase (since typical wheelbase lengths are in the 100 to 110 inch range). This increase is
equivalent to a standard increase of about 3 g/mi for cars and 5 g/mi for trucks, or about 4 g/mi
for the fleet. Hence, we estimate tailpipe emissions of all but the EV fleet in 2025 as follows:
- EPA 2025 standard 163.0 g/mi
- A/C credits 21.3 g/mi
- Off-cycle technology 10.0 g/mi
- Pickup truck credit 0.4 g/mi
- EV/PHEV credit 4.8 g/mi
- Car to truck shift 4.2 g/mi
- Increased wheelbase ~4.0 g/mi
- Total for all changes ~45.0 g/mi
Hence we anticipate that the applicable standard for all conventionally powered vehicles will be
about 208 g/mi, or 42.7 mpg, which is a very substantial reduction from the claimed value of
54.5 mpg. The 42.7 mpg is a test procedure based number and on-road fuel economy will be
about 20% lower, or less than 35 mpg. This is a significant finding, both for the purposes of
estimating future technology requirements and for estimating future fuel demand. However,

18
even the 42.7 mpg is quite a challenging value as it implies a 50% improvement in fuel economy
over the actual 2010 fuel economy attained. The 50% value is an average across all
manufacturers, and domestic manufacturers as well as the European luxury car manufacturers
will need a 55+% improvement to comply with 2025 standards, while many Asian manufacturers
could comply with improvements of 45% or less.
2.7. EU STANDARDS FOR CO2 EMISSIONS FROM LIGHT VEHICLES
In February 2007, the European Commission published its key draft proposal to limit CO2
emissions from the passenger cars sold in 27 member states to 120g/km by 2012, with a
130g/km standard to be met by vehicle motor technology alone, and an additional 10g/km
reduction through the use of alternate fuels and the improvements of tires, air conditioners etc.
In December 2007, the EU Commission published draft regulations providing more detail on the
method of assessing targets of individual auto manufacturers, fines to be collected from those
failing to reach their goals, etc. After negotiations between the European Parliament and France
(which was the presidency holder of the Council), the final draft was adopted by the European
Parliament in December 2008. Although based on the EU Commission's draft, the final draft
contained a new implementation schedule that reflected the view of the European Automobile
Manufacturers Association (ACEA) that more time was necessary to develop cars with low-CO2
emissions.
Key elements of the draft regulation adopted by European Parliament on CO2 emissions from
passenger cars are as follows:
Overall target for
EU
Reduce CO2 emissions to 130g/km on average among new passenger cars
sold in EU by means of vehicle motor technology alone, and further reduce
by 10g/km, through the use of alternate fuels and improvements of tires, air
conditioners, etc, to a final goal of 120g/km.
Targets of
individual auto
manufacturers
CO2 emission goals of individual auto manufacturers to be calculated by
using the Limit Value Curve based on the vehicle weight. The method of
assessment (g/km) for the period 2012 to 2015 is "130 + 0.0457 * (average
vehicle weight of individual auto manufacturers - average vehicle weight in
the market in EU)". The overall average vehicle weight in EU, applicable to
the 2012 to 2015 period, is 1,372kg and subject to new calculation every
three years based on the results during the preceding three-year period.

19
Pooling
Auto manufacturers are allowed to pool CO2 emissions with other auto
manufacturers for averaging purpose (for determining the timing of low-
CO2 emission vehicles among several auto manufacturers).
Timeframe Average CO2 emissions to meet the target with 65% of passenger cars
sold and registered in 2012, 75% in 2013, 80% in 2014 and 100% in 2015.
Fines
During the period from 2012 to 2018, a fine of 5 Euro to g/km in excess of
the target by no more than 1g/km (Excess emissions * 5 Euro), 15 Euro for
excess by more than 1 g/km but no more than 2g/km, 25 Euro for excess
by more than 2g/km but no more than 3g/km, and 95 Euro for excess by
more than 3g/km.
A fine of 95 Euro to each g/km in excess of the target in and after 2019
has been proposed. However, the fine appears very high and may not be
ratified by the EU.
The European Parliament adopted the final draft in December 2008. The final draft requires
auto manufacturers to meet the 130g/km limit by 2012 with 65% of their products complying
with the 130 g/km CO2 emission standard and apply that standard in phases to all cars by
2015. The EU was to formulate a method of assessing targets for individual auto
manufacturers based on their average vehicle weights so that the 130g/km limit is met in the
EU as a whole, but not by each manufacturer. The final draft contains smaller penalties than
the original draft for auto manufacturers failing to meet their targets. It also contains a new,
long-range goal of reducing CO2 emissions to 95g/km on new cars by 2020. Automakers
selling no more than 10,000 vehicles a year may present their reduction targets independently.
Automakers selling 10,000 to 300,000 a year may apply for special treatment as niche
manufacturers and, when the request is granted, may set their target at 25% reduction from
the 2007 average. The EU Commission is required to study the feasibility of alternative
regulations based on footprint (track width * wheelbase), etc, rather than the vehicle weight
and, are expected to present them to the European Parliament and the Council. The 2020
target, along with the penalty criteria, will be reviewed and decided by the end of 2013.
The final draft regulation contains incentives to promote and accelerate the development of
ultra-low carbon vehicle technologies that would impose large development cost burden and
therefore are initially least cost efficient. Auto manufacturers using innovative technologies will
be entitled to up to 7g/km reduction from their original CO2 reduction norm. In addition, the draft

20
contains preferential measures (super-credits) for vehicles with CO2 emissions no higher than
50g/km whereby, for instance, each vehicle will be counted as equal to 3.5 in the calculation of
the average emission for the period from 2012 to 2013, 2.5 in 2014 and 1.5 in 2015.
The CO2 emission target of 130g/km in EU's final draft regulation represents an 18% or a
28g/km reduction from the average amount of CO2 emissions from passenger cars sold in the
EU in 2007 (158g/km) The new standard applies only to 65% of the cars sold in 2012; full
compliance begins in 2015. The target CO2 level for individual auto manufacturers will be
determined by the average weight of their vehicles sold in the EU. In an early estimate from a
EU study, the targets range broadly from 122g/km (Fiat) to 137g/km (Daimler, BMW). Those
auto manufacturers with the reduction requirement of 20% or higher from the actual emission
level in 2007 include Daimler (44g/km, 24%), Mazda (42g/km, 25%), Suzuki (40g/km, 25%) and
Nissan (37g/km, 22%).
The 95 g/km standard was adopted by the EU Commission in June 2013, but the regulation
provides manufacturers a choice of using either weight or footprint metric to meet the target. In
addition, “super-credits” were provided for early introduction of low CO2 emission vehicles and
electric vehicles. The EU is now discussing a goal of about 65 to 70 g/km for 2025, which would
be equivalent to a fleet fuel economy level of 79 to 84 mpg.

21
3. ADVANCED ENGINE TECHNOLOGIES
3.1 INTRODUCTION
A previous report on technology to improve fuel economy to 2016 was completed by EEA/ICF (a
predecessor to HDS) for the API3in 2008. This analysis seeks to update the report with
information on new technological developments since that time, and does not, therefore, include
comprehensive descriptions of all technologies. Technologies to improve engines have been
conceptually identified for quite some time but high-speed computerized control and
electromechanical actuation breakthroughs have made implementation of more advanced
technologies possible. Advances in spark-ignition engine technology since the development of
the last report to ago are very significant, and it now appears that most analysts had under-
estimated the potential for fuel efficiency improvement in conventional engines.
A wide range of technological options are under consideration or being introduced for the next
generation of engines. Figure 3-1 provides a pictorial summary of the different options and
these are explained in more detail below. Examination of data on product plans (more fully
described in Section 7) shows that manufacturers are proceeding on two divergent pathways.
The first involves turbo-charging and downsizing the engine as shown in the lower part of figure
3-1. A more novel variant includes lean burn with turbo-charging and downsizing the engine.
The second path involves using high compression ratios and preventing knock by novel
methods such as the use of a Miller or Atkinson cycle with late intake valve closing. Both paths
also involve using a common set of new technology such as variable valve actuation and cooled
EGR. The advantages and disadvantages of the pathways are examined below.
3.2 VARIABLE VALVE ACTUATION
It has long been recognized that speed and load dependent (i.e., variable) valve timing and lift
can enhance both low speed torque and high speed horsepower, without compromising either.
As a result, the vast majority engines now employ some variation of this technology. Also,
several electrically (as opposed to hydraulic) actuated variable valve timing systems have been
introduced. Figure 3-2 shows the evolution of variable valve lift and timing systems over the last
15 years.
3 EEA/ICF, Advanced Technologies to Improve Fuel Economy of Light Duty Vehicles, Report
to the API, November 2008.

22
Figure 3-1: Gasoline Engine Evolution Pathways
Source: Bosch4
3.2.1 Variable Valve Timing
Variable Valve Timing (VVT), also known as cam phasing, has become standard equipment in
the vast majority of light duty engines. Most VVT systems are operated hydraulically, but new
system variants are being developed that would further enhance system response. For
example, Delphi announced development of an electrically actuated variable cam phaser
(EVCP)5. This allows additional degrees of freedom for the introduction of new combustion
systems such as HCCI, for example, where much higher levels of control over the engine
operating range are required. The system also can support start-stop and hybrid applications,
4HakanYilmaz, Bosch, North America “ Bosch Powertrain Technologies”, Presentation at DOE
DEER Conference, 2012 5 E. Jacque, et.al., ATZ Technical Paper, “Delphi Electric Cam Phasing as an Enabler of CO2
Reduction”, MTZ Worldwide Edition, February, 2013

23
when phasing is required at very low engine speeds when oil pressure might not be adequate
for hydraulic phasers.
Figure 3-2: Variable Valve Control Evolution.
Source: Hitachi6
3.2.2 Variable Valve Lift
Variable Valve Lift (VVL) technologies can be configured for continuous variations in lift or for
changing valve lift in discrete increments. This technology can be introduced either separately
or in combination with VVT. In addition to reduced pumping losses, the system provides
improved power output that permits engine downsizing and substantial fuel economy
improvement. OEMs that have implemented VVLT with maximum fuel economy tuning have
reported the benefit of about 6% with relatively modest costs of about $300.
Several manufacturers have introduced two-step or three-step VVL systems. GM is one of the
OEMs that recently announced the adoption of VVL technology in mass production engines.
The new MY2014 Impala will offer a 195hp version 2.5L I4 which will include a 2-step intake
VVL system (GM’s Intake Valve Lift Control)7. The engine achieves variable valve lift using a
6 S. Hara, et.al., “Variable Valve Actuation Systems for Environmentally Friendly Engines”,
Hitachi Review Vol. 58, 2009. 7 GM Press Release, “2014 Impala Engine Gets a High-Tech Lift”, Detroit, September 17, 2012.
Available on line at

24
rocker arm that switches between low and high lift intake cam profiles. While the VVT and
Discrete VVL are currently used in mass production, Continuously Variable Valve Lift systems
(CVVL) are less common but market expansion is planned in the near future. Existing CVVL
systems are usually designed to achieve a combination of both lift and valve opening duration
change via an intermediate lever mechanism or other means. This approach, also known as
“intake throttling”, allows elimination of the conventional throttle since the engine air flow can be
controlled through real time adjustment of the inlet valve lift and opening times. BMW’s
Valvetronic is perhaps the best known CVVL system since it been in production for many years.
Nissan/Hitachi has developed a CVVL system, which they call VVEL (Variable Valve Event and
Lift). The system is also designed to throttle intake valves and works in conjunction with VVT;
the system has been introduced in the 3.7L Infiniti V-6.
Chrysler/Fat has commercialized the system variant called Multi-Air® which is now featured in
the 1.4L I4 Fire engine. The electro-hydraulic VVLT system (developed together with Magneti-
Marelli) controls the intake valves and eliminates the need for the throttle valve. The controller is
able to control each cylinder individually. The company claims that a power increase of up to
10% is possible while improving fuel economy by more than 10%. The technology is scheduled
to migrate to other engine families. Fiat has indicated that the system is well suited to work in
conjunction with turbo-charging and even with diesel engines.8
3.2.3 Camless Valve Actuation
Camless valve actuation (CVA) expands upon the concept of variable valve timing and lift by
completely eliminating the camshaft and mechanical valve actuation mechanism from the
cylinder head. In place of the camshaft, the valve is actuated and controlled through either
electrical or hydraulic actuators. Despite the conceptual simplicity, the camless system is not yet
available commercially. Valeo was one supplier that claimed to have engines running in test
vehicles, but performance under cold ambient and durability are apparently not yet up to par.
Automakers have commented publicly that they are closely following developments in camless
technology and both Toyota and Honda have displayed camless prototype engines at the Tokyo
Motor Show in recent years. Companies are still concerned, however that CVA, in addition to
being costly, would have uncertain durability once the valve train is not mechanically connected
http://media.gm.com/content/media/us/en/chevrolet/vehicles/impala/2014.detail.html/content/Pa
ges/news/us/en/2012/Sep/0917_intakevalve.html 8Automotive Engineering Online, “Inside Fiat’s Innovative Multiair System”, October 7, 2010.

25
to the crankshaft. It appears that primary concerns are not necessarily for efficiency but rather
for control system long-term durability.
Eaton has proposed a related system for heavy duty applications as recently as last year9. Their
proposed solution is “hybrid” actuation with one cylinder valve operated conventionally by the
camshaft while the second operated with an electro-hydraulic actuator. Eaton believes that this
solution would provide an early entry for the camless technology including “limp-home”
capability.
Figure 3-3: Eaton Electro-hydraulic Valve Actuator Source: Ref 9
CVA should deliver at least the same benefits as the CVVL– or at least 10% reduction in fuel
consumption. Additional benefits would likely be realized on larger engines, when cylinder-cut is
implemented. Further additional benefits for all engines can be realized if additional fuel
economy improvements are fully derived from advanced combustion controls working with
flexible intake valve actuation.
3.3 TURBOCHARGING AND SUPERCHARGING
Turbo-charging technologies have undergone rigorous development and many engines are now
sold in the US with variations ranging from mono-scroll waste-gated designs to multi-stage
systems. The new technologies lead to improved response and higher BMEP potential. Multi-
stage systems have been proposed sometimes in combinations with supercharging, and
9 J. McCarthy, Eaton Corporation, “Compact, electro-hydraulic, variable valve actuation system
providing variable lift, timing and duration to enable high efficiency engine combustion control”,
Presentation at DEER 2012 Conference, October 18, 2012.

26
electrically driven turbos or superchargers. Figure 3-4 below summarizes the most promising
turbo-charging/supercharging combinations.
Figure 3-4: Advanced Turbo-charger Configurations
Source: Mahle (Ref. 10)
While turbocharged or supercharged port fuel-injected (PFI) engines are still being produced for
limited applications, such as sports cars, the vast majority of engines will use this technology
with direct injection (DI) and VVT as an optimized package, with engine downsizing.
3.3.1 Stoichiometric DISI Engines
Stoichiometric DISI engines are now being used by most OEMs in the US. The technology trend
is moving toward higher injection pressures and more sophisticated injection strategies such
pulsed-injection. There are many applications with naturally aspirated engines but many
manufacturers have also introduced DISI in combination with turbo-charging and VVT as a
package.
With modest (20%) downsizing, the fuel economy increase of about 10% should be expected. In
combination with high boost and extreme downsizing, Mahle indicated that 35% increase in fuel

27
economy (equivalent to a 26% decrease in CO2) is achievable. Further synergies can be found
with other technologies including electrification, as shown in Figure 3-5.
Figure 3-5: Mahle Estimates of CO2 Reduction Potential with Advanced DI/Turbo
Source: Mahle (Ref. 10)
Many first generation Turbo DISI engines in the US market are representative of 18 Bar BMEP-
level boost. VW/Audi was one of the first OEMs to sell these engines (TFSI technology) in the
mass market on a wide variety of vehicle platforms. The trend towards higher boost pressures
continues and most current engines with this technology have maximum BMEP levels of 18.5 to
20 bar. As an example, Ford is marketing the 2L Ecoboost 4-valve DOHC I4, with a
compression ratio of 10:1. It is equipped with a single stage turbocharger, centrally located
direct injection, twin cam phasers and thin skin exhaust manifold. Its performance is equivalent
to a 3L V6 engine and it has a BMEP of 19.7 bar. Very few engines have crossed the 20 bar
threshold, and among mass market vehicles, only the GM 2L engine rated at 272HP has a
BMEP of 25 bar. Luxury European cars like Audi, Porsche and BMW offer high performance
models with engines having a BMEP of 22 to 24 bar and maintain CR at 10, but also require
premium fuel.

28
Figure 3-6: Current European Turbo/DI Engine Performance and Potential Evolution
There are many more engine examples in Europe as illustrated in Figure 3-6. Designers are
working toward “extreme downsizing” engines that would achieve specific output of as much as
120kW/L. Mahle announced that 50% downsizing is feasible, which conceptually allows a 2.4L
I4 engine be replaced by a 1.2L I3 engine with similar performance and about 35% fuel
economy improvement.10. Mahle and Bosch have demonstrated an engine with 30 Bar BMEP
boost using inter-cooled 2-stage turbo-charging.
Other auto-manufacturers (notably the Japanese) are more skeptical about the prospects for
downsized, turbocharged engine in the US market, and suggest that the technology may be
better suited to Europe with its high speed driving. Although suppliers such as Bosch and Mahle
have claimed fuel economy improvements of 25% to 35%, the actual test results for the Ford
and European models with this technology suggest much less benefit. For current engines
boosted to a BMEP of 19 to 20 bar, downsizing by one-third provides near equivalent
performance to naturally aspirated PFI engine. Of course, only a few vehicles are available with
both naturally aspirated and GDI/Turbo engines of near identical performance so that
determination of exact benefit is difficult but the following comparisons are reasonably closely
matched in performance, with the EPA rated combined FE compared:
10
Hugh Blaxill, Mahle, “Near Term Spark Ignition Engine Technologies for Improved Fuel
Economy”, Presentation at ERC 2011 Symposium, May 23, 2011.

29
Table 3-1 shows the benefit in fuel economy for an approximately equivalent performance
turbo/DI engine (i.e., downsized by 25 to 35%) is around 9% or less. The only counter example
(not shown in the table) is the BMW 2L turbo engine which shows a very large 30% FE benefit
relative to the naturally aspirated 3L six cylinder on the BMW 3 series. However, it may be that
the 3L naturally aspirated engine is not optimized for fuel economy as the 3L turbocharged six
cylinder engine offers both better fuel economy and much higher performance than the naturally
aspirated version..
Model
(MY2013)
Transmission Engine1
(nat.
asp)
EPA Fuel
Economy
Engine 2
(Turbo-DI)
Fuel
Economy
Benefit
Ford F-
150
Auto-6 5.0L V8 20.47 3.5L V6 T 22.15 8.2%
Ford
Fusion
Auto-6 2.5L I-4 34.56 1.6L I4 T 37.70 9.1%
VW Jetta Auto-6 2.5L I4 33.11 2.0L I4 T 34.95 5.5%
GM Sonic Auto-6 1.8L I4 37.79 1.4L I4 T 41.36 9.4%
Table 3-1: Comparison of Naturally Aspirated and Turbo-charged DISI Engine Fuel Economy from MY2013
Although EPA has estimated that by 2025, most auto-manufacturers will move to downsized
GDI/Turbo engines with 24 bar BMEP, this appears quite uncertain based on our analysis. It is
likely that as combustion chamber designs, head cooling and in-cylinder gas motion are
optimized, the boost level can be raised to over 20 bar without requiring premium fuel. Boost to
BMEP levels of 24 to 27 bar will require cooled EGR, which raises its own set of problems in
EGR thermal management and intake deposit control, and extreme engine downsizing may also
result in drivability penalties. We forecast that European manufacturers and Ford will likely have
21-22 bar boost engines for the mass market and 24 to 27 bar boosted engines in high
performance applications by 2025, but we do not expect penetration levels for Turbo DI engines
above 35% for the fleet as a whole.
3.3.2 Lean-Burn DISI Engines
The 1st generation lean burn DISI engines (marketed in Europe) achieved mixture formation
through a special combustion chamber design which is referred to as “wall-guided” mixture

30
formation. The technology did not achieve wide success since it was difficult to control the
resulting stratified mixture formation at different engine speeds. The newer technology variants
used centrally placed injector to achieve a “spray guided” stratification. This design uses a small
spacing between the injector and the spark plug electrode, and the air-fuel mixture formation
takes place almost independent of gas flow and piston movement. The spray guided systems,
however, use high pressure piezo-injectors to achieve the desired level of mixture stratification
control, with attendant high injection system cost.
Luxury makers such as BMW and Mercedes have introduced spray guided DISI lean burn
engines in Europe with up to 20% fuel consumption improvement and there is renewed
optimism, that with proposed new gasoline sulfur regulations, the technology will migrate to the
US market11. We anticipate that Mercedes will have one or more lean burn engines in the US
market in MY 2016 and the technology will be in widespread use by these two manufacturers by
2020.
Mahle (Ref. 10) was able to demonstrate a 14% fuel economy improvement (FTP cycle) with
lean burn versus stoichiometric operation of the base engine. Ultra-lean operation (lambda over
2) was demonstrated at low load conditions. The company claims the engine-out NOx was
“nearly zero” with controllable HC and CO emissions. Further fuel economy improvements, as
much as 25%, are possible with DI and compression ratio increase. The company claims that
the technology would particularly work well with downsizing and high EGR concepts.
Mercedes has introduced a new version of its 3.5l V6 engine with lean burn in Europe this
model year (2013). The operating range in the lean burn area is shown in Figure 3-8. Mercedes
uses a sophisticated conical spray fuel injector and fuel injection is done in multiple pulses as
shown in Figure 3-712. Up to 4 bar BMEP, the engine runs very lean at an overall lambda of over
3. There is a transition region from 4 bar BMEP to 7 bar where the combustion mode is termed
“Homogeneous- Stratified” (HOS) where most of the mixture is homogeneous and the lambda is
about 2 but the region near the spark plug is near stoichiometric.
11
Daimler Press Release, “New V8 and V6 Engines from Mercedes-Benz”, May 6, 2010. 12
Breitbach, H, et al., Lean Burn Stratified Combustion in Gasoline Engines, Motor Technische
Zeitschrift (MTZ), May 2013

31
Figure 3-7: Mercedes Lean Burn DISI Operating Air-Fuel Ratio Map
Source: MTZ (Ref. 12)
More recently, Mercedes has extended this concept to a 2L turbo-charged engine with a
maximum BMEP of 23 bar. The region of stratified operation has been extended to 6 bar while
the HOS region ends at 12 bar. Fuel consumption benefits are significant, with the benefit of
17% at 2 bar BMEP and 9% at 4 bar BMEP, in comparison to homogenous charge
stoichiometric operation as shown in figure 3-8. The turbocharged lean burn engine also
showed similar benefits relative to a turbocharged stoichiometric engine, and typically, the fuel
consumption benefit on the EPA test cycle is similar to the benefit at 2.5 to 3 bar. This suggests
that combining the concepts of DI/ Turbo with stratified lean-burn can provide a total fuel
consumption benefit of 20 to 25 percent from the engine alone, with 9 to 10% from turbo-
charging and 10 to 15% from lean operation.
Emission control has always been a difficult issue with lean burn, but ultra-lean combustion over
much of the EPA cycle has led to such low NOx emissions that Mercedes appears confident of
achieving Tier 3 standards using a NOx adsorber (information from HDS meeting with Daimler).
This technology requires ultra-low sulfur gasoline and the recent EPA requirement for 15ppm
maximum sulfur content is seen as an enabler to meet the standards. We do not expect that a
diesel like urea-SCR system will be needed for lean burn DISI engines.

32
Figure 3-8: Comparison of BSFC versus IMEP for Mercedes Engine
Source: MTZ (Ref. 12)
3.4 INCREASED COMPRESSION RATIO
Theoretically, an engine’s efficiency will increase with increased Compression Ratio (CR).
Modern gasoline engines generally operate in a CR range from 10:1 to 11:1 but the trend is to
develop engines with higher CR, particularly with DI available to cool the charge mixture.
Mazda has announced the Skyactiv-G engine with CR of 14:1 and claims up to 15% increase in
fuel efficiency and torque. The technology was enabled by using a redesigned exhaust manifold
that minimizes hot residual gases, multi-hole DI injectors, injection pressure of 2,900psi and
reworked control system. Figure 3-9 traces the evolution of the engine concept, starting from a
PFI 2.0L engine with a CR of 10. The addition of DI enabled an increase of CR to 11.2 with a
5% increase in 1500 RPM torque, but further increases to 14 CR resulted in torque decrease by
7% due to the need to retard spark timing to avoid knock. The redesign of the combustion
chamber and the use of a high tumble intake port, along with a spray optimized multi-hole
injector (MHI), resulted in recovery of all the torque loss. Improved exhaust gas scavenging with
a long runner exhaust system reduces the mixture temperature to enable timing closer to
optimum, enabling a net torque increase of 15% over the baseline PFI engine.

33
Figure 3-9: Mazda 14 CR Engine Evolution
Source: Mazda (Ref. 13)
Figure 3-10: Mazda Accounting for Sky Active Engine Benefits (Ref.13)

34
Mazda data shows that the torque increase at 3000 RPM was 22% so that the benefits are
observed over a wide range of operation. Mazda has claimed that the brake specific fuel
consumption (BSFC) is close to that of a current diesel engine, and in a vehicle application,
Mazda has demonstrated fuel consumption reduction of 15% and Figure 3-10 shows that the
CR increase and Miller cycle contributed to 8% of the 15% reduction13. However it appears that
only 4.5 to 5 percent of the improvement is attributed to the CR increase and the remainder is
due to the pumping loss reduction according to information obtained at the meeting with Mazda.
Friction loss and idle speed reduction, as well as accessory loss (in the oil pump and water
pump), contribute to the 15% total as shown in Figure 3-10.
Figure 3-11: BSFC Map for Accord Hybrid 2L Engine
Source: SAE 2013-01-1738 (Ref. 14)
13
Goto, T., et al., The New Mazda Gasoline Skyactiv-G Engine, MTZ, pg. 41-46, June 2011

35
In 2013, Honda has introduced a 13 CR 2.0L 4 cylinder engine with PFI and cooled EGR, as
well as Atkinson cycle operation at part load by using a 2 stage VVLT system. The cooled EGR
suppresses knock and enables operation at near optimal spark timing without knock. Honda has
claimed a BSFC of 214 g/kW-hr which is one of the lowest levels ever achieved on a spark
ignition engine14. In addition, the cooled EGR and VVLT system reduces pumping loss at part
load so that the engine has very good fuel consumption over a wide range of torque and speed
as shown by the BSFC map in Figure 3-11. Although the engine will be used only in the 2014
Accord hybrid, the engine power rating is only a little lower than that of other 2L PFI engines at
140 HP. In comparison, Mazda’s 2L DI engine is rated at 154 HP. It is possible that the hybrid
engine strategy could be adopted to conventional drivetrains with some modifications in the
future.
Figure 3-12. Nissan 13 CR 1.2L Engine Technologies
Source: Nissan Ref. 15
Other Japanese manufacturers are also working on similar concepts such as high CR engines
with an Atkinson cycle instead of a Miller cycle. The Toyota Prius and other hybrid vehicle
models use the Atkinson cycle with a CR of about 12, but the power loss has restricted the use
14
Yonekawa, A., et al., Development of New Gasoline Engine for Accord Plug-in Hybrid, SAE
Paper No. 2013-01-1738

36
of these engines to hybrid models exclusively. Nissan has introduced a 1.2L 3 cylinder engine
with 13 CR in Europe, and the engine is unique in that it also employs supercharging. In order to
enable use of high CR, many of the same technologies used by Mazda such as a high tumble
intake port, shallow cavity piston, a multi-hole GDI injector, and the Miller cycle are also used in
the Nissan engine15, as shown in Figure 3-12.
With the Miller cycle, the effective CR is reduced to 7:1 and the supercharger is used to recover
power. The rating of the engine at 72kW (or 60 kW/L) is comparable to that of naturally
aspirated DI engines. The engine also employs many of the friction reduction technologies
described below. The net fuel economy improvement is substantial, with Nissan Micra equipped
with this engine certified at 95 g/km CO2 on the NEDC cycle, which is approximately equivalent
to 65 mpg on the US combined cycle. The net CO2 improvement over the 1.2L PFI engine is
20%.
As mentioned in the previous sub-section, high CR technology can be used to transition to lean
burn, using the stratified charge concept like Mercedes or using HCCI. At the interview, Mazda
stated that this was the next step in the development of high CR engines with DI and believed
that an additional 15% improvement in BSFC was possible with HCCI over the current Skyactiv
engine. Mazda suggested that commercialization of HCCI by the end of this decade was their
goal. HDS has unofficially learned that Honda is working towards a similar goal.
3.5 ENGINE FRICTION REDUCTION
Engine friction reduction is a continuously evolving technology capable of providing fuel
economy improvement. Engine developers are constantly looking to achieve further friction
reduction and some have reported very aggressive targets of as much as 50% friction reduction
in subsystems such as valve trains. The partial list of friction reduction technology includes:
low mass pistons and valves
reduced piston ring tension
reduced valve spring tension
surface coatings on the cylinder wall and piston skirt
improved bore/piston diameter tolerances in manufacturing
offset crankshaft for inline engines
15
Kishi, K, and Satou, T., The New Nissan Highly Efficient 1.2 L 3 cylinder GDI Supercharged
Engine, Vienna Motor Symposium Proceedings, 2012

37
higher efficiency gear drive oil pumps
Figure 3-13: Friction Reduction Targets, Mazda Skyactiv-G Technology
Source: Mazda (Ref. 16)
Figure 3-13 shows some of the targets established by Mazda for friction reduction in accessory
drives and in the valve-train16.
Diamond-Like Coating (DLC) technology is a relatively new trend in friction reduction. DLC is a
family of coatings made up primarily of carbon chains in an amorphous base material. In
addition to friction reduction, the DLCs are known to improve self-lubrication and resistance to
wear. However, they are sensitive to some additive packages used in current engine oils and
may require special lubricant formulations. One coating is marketed as Dylyn®Plus by Bekaert,
developed from the company’s racing experience. The company has reported up to 25%
reduction of camshaft torque by coating the finger followers. They claim that coating the
camshafts in this configuration will typically reduce the overall friction by additional 10%. Tests
with coated tappets show similar results. Nissan is one manufacturer that reported DLC friction
reduction results in the range of 40% in commercial engines when combined with ultra-low
friction lube oil (at the subcomponent level)17. Like other manufacturers, Nissan plans to reduce
16
D. Coleman, Manager, Mazda Vehicle Evaluation and Technical Communication, “What’s all
this Skyactiv Nonsense Anyway?”, Presentation Available at www.mazdausamedia.com 17
Nissan Technology Magazine, “Nano-technology based ultra-low friction technology”,

38
friction by about 10% for every new engine generation. Friction reduction technology employed
in the new 1.2L DI supercharged engine is outlined in Figure 3-14.
Figure 3-15: Friction Reduction Technologies in the New Nissan 1.2L Engine
Source: Nissan (Ref. 15)
3.6 IMPROVED LUBRICANTS
As indicated above, new friction reduction technologies such as Diamond-Like Coatings (DLCs)
are being implemented and new oil formulations are being developed to complement friction

39
reduction. Nissan has shown that DLCs working with specially formulated “ultra-low friction oils”
can reduce component-level friction by as much 40%18.
The use of 5W-30 motor oil is now widespread. More manufacturers certify engines with 5W-20
to achieve improved fuel economy rating in the order of 1%. The trend is moving toward even
lower cold start “W” (Winter ) ratings all of way to “zero” (0W-20 oil formulations) and these oils
are commercially available (for example Mobil 1 0W-20 Advanced Fuel Economy synthetic oil,
which claims 2% fuel economy improvement over “the most commonly used”19
lubricants).Honda confirmed that the new Acura RDX is certified with 0W-20.20 In addition,
efforts are underway to define a new, lower viscosity, 0W-16 oil for release later this year.
3.7 ADVANCED LIGHT DUTY DIESELS
With consistently high fuel prices, diesel sales proved to be relatively robust and more
manufacturers have announced diesel introductions. With the possible exception of VW’s
compacts, most will use the Urea-SCR plus DPF after-treatment system in order to satisfy Tier
2 emissions standards. The current and near-term diesel vehicles and its engines in the US
market are:
Audi A3 and VW Golf, Jetta, Passat, Beetle - 2L I4
Audi Q7, A6, A7, Q5, A8 and VW Touareg – 3L V6
BMW 3-Series, X5 – 3L I6
Chevrolet Cruze – 2L I4
Jeep Grand Cherokee and Dodge Ram– 3L V6
Mazda 6 – 2.2L I4
Mercedes E-Class, ML, S-Class, GL – 3L V6
Mazda CX-5 and 626 – 2.2L I4
In addition, both GM and Ford may introduce a V8 diesel engine for use in the full size pickup
and SUV models in 2017 or 2018
Many of the improvements to turbo-charging and the resulting increased BMEP discussed for SI
engines were first developed for diesel engines. The current VW 2L diesel sold in the US and
18
Okuda, S., et al., Development of 5W-30 GF4 Engine Oil for DLC Coated Valve Lifters, SAE
Paper No. 2007-01-1979 19
www.mobiloil.com, “Mobil 1 0W-20 Advanced Fuel Economy Oil”. 20
SAE Automotive Engineering Online, “New Acura RDX Crossover Bucks Trend with V6
Power”, March 29, 2012.

40
rated at 140HP is an older design with a single stage turbo, operating at 20 bar BMEP. The 3L
V6 diesel used in the VW Touareg and Audi models, as well as the Mercedes 3L V-6 are more
recent engines but continue to use a single turbo with a boost level of 24 bar BMEP. While dual
scroll and twin turbo versions of these engines have been introduced in the EU, only the BMW
twin turbo 3L I-6 engine is available in the US and the boost level is at 26.4 bar BMEP. BMW
will shortly introduce a 2L 4 cylinder diesel with a twin turbo that operates at 28.3 bar BMEP.
The next generation VW 2L diesel engine will also offer a version boosted to 28 bar BMEP and
will be rated at about 200 HP.
Traditionally, the fuel economy of a light-duty diesel engine was considered to be 25 to 35 %
greater than that of a gasoline engine of equivalent performance. Since several new generation
diesels are already being sold in the US, actual MY2013 EPA CAFE data can be used to assess
the latest trends. The table below compares the fuel economy of the diesel engine to its nearest
performance equivalent gasoline counterpart for several light-duty vehicle models, and it
indicates a wide spread in FE benefit. Comparing performance levels is difficult because the
highly turbocharged diesel offers high torque but HP values are lower since the RPM is limited
to about 4000. As an example, the VW Passat equipped with the compact 2L I4 diesel and
urea-SCR NOx after-treatment offers 39.8% fuel economy advantage versus the naturally
aspirated 2.5L I5 gasoline engine. The gasoline engine offers higher power (170 hpvs.140hp)
but lower torque (177 ft-lb vs. 236 ft-lb) although the torque loss is compensated by a higher
axle ratio.
The data from Table 3-2 below makes it difficult to discern any trend in the benefit of the diesel
engine, although the relatively small diesel benefit shown for the BMW and Mercedes models
suggest that the benefit is narrowing with gasoline engine technology advances. GHG
emissions benefits from diesels are lower than implied by the fuel economy benefit because
diesel fuel has 12% more carbon content per unit volume than gasoline. Hence, a 30% fuel
economy benefit is a 23.1% fuel consumption benefit, but only 13.85% GHG benefit (1-
0.769*1.12). The smaller GHG benefit makes diesel engines a much less attractive technology
for meeting GHG standards than for meeting fuel economy standards. The only manufacturer
with relatively high diesel sales is VW, and it may be in the unusual position of complying with
CAFE standards while having difficulty complying with GHG standards.

41
MODEL Engine TRANS
FE
[MPG]
FE Benefit
[%]
Audi A3 2L Diesel AM-S6 46.2 50.0
2L T-DI AM-S6 30.8
VW Beetle 2L Diesel AM-S6 43.7 37.4
2L T-DI AM-S6 31.8
VW Passat 2L Diesel AM-S6 44.6 39.8
2.5L PFI A6 31.9
Audi Q7 3L Diesel S8 28.1 22.7
3L S-DI S8 22.9
BMW X5 3L Diesel S6 28.7 20.1
3L T-DI S8 23.9
Mercedes E-Class 3L Diesel A7 33.3 10.3
3.5L DI A7 30.2
Table 3-2: MY 2013 LD Diesel vs. Gasoline Models’ Fuel Economy Comparison
FE – Fuel Economy, EPA Combined Unadjusted
While gasoline engines are experiencing rapid fuel efficiency advancements, diesel technology
is also developing in the same direction and manufacturers indicate potential to achieve
additional 15 to 20% improvement over current diesels. Mazda announced21 the Skyactiv-D
package designed to demonstrate this capability particularly at low load conditions using
technologies such as reduced compression ratio, sequential twin turbo-charging, variable valve
lift and “superfast” piezo injectors. The CR reduction alone is claimed to provide about 5% fuel
economy improvement. In addition this allowed major engine redesign for lower weight and
mechanical friction reduction.
However, diesels have not been popular in the US outside of a few German models. In
particular, the diesel take rate in most car models with the exception of VW Passat and Jetta is
quite low. In these two car models and in several SUV models from Audi, Porsche, VW and
Mercedes, the take rates are quite similar at 25 to 30% of total model sales, but the take rates
on the Mercedes ML and BMW X5 SUV models are only 12%. The take rates on other car
models such as the Mercedes E class and the BMW 3 series are very low at less than 3%.
Overall diesel penetration in the first 4 months of 2013 is only 0.76% reflecting the fact that
21
http://www.mazda.com/mazdaspirit/skyactiv/engine/skyactiv-d.html

42
diesels are offered only in a handful of models. The relative popularity in SUV models suggests
that diesel engines may be more successful in trucks than in cars and may be a good option for
pickup trucks in particular, where the larger heavy duty pickups have diesel penetration levels of
about 65 to 70%.

43
4. BODY AND ACCESSORY TECHNOLOGY
4.1 WEIGHT REDUCTION
A principal determinant of vehicle fuel economy performance is vehicle weight. According to
recent trends most weight reduction methods can be classified as:
improved assembly
material substitution
improved packaging
downsizing, particularly powertrain and suspension
unit body construction
parts consolidation
The issue of material substitution, while simple in concept, is very complex as it requires an
understanding not only of the specific strength characteristics required for a component/system
but also an understanding of its crash performance, corrosion resistance and many more design
constraints. Since the completion of the last report to API, there are many new weight reduction
studies publically available and EPA/NHTSA have recently sponsored large efforts to update the
analysis. In general, many of these studies now conclude that the low-level weight reduction, in
the range of 5% to 10%, can be accomplished with near net “zero” cost, if the primary weight
reduction is complemented by cost reduction from secondary weight reduction in powertrain,
structures and suspension. However, estimates of higher levels of weight reduction feasibility,
and particularly its cost implications, are highly variable among the published studies.
EEA/ ICF completed a study in 2011 for primary weight reduction together with effects of
secondary weight reduction to estimate the costs of weight reduction on a whole
vehicle.22Primary weight reduction is the weight reduction achieved by substituting a lighter
component for an existing component through redesign and material substitution. Secondary
weight reduction is associated with the redesign of the entire vehicle taking into account the
benefit of primary weight reduction by downsizing the engine, transmission, suspension and
brakes to provide performance equivalent to that of the baseline vehicle. The study confirmed
that the net near zero-cost weight reduction can be accomplished to about 10% of the baseline
22
EEA/ ICF International, “Light Duty Vehicle Weight Reduction Assessment for Model Years
2016 to 2025”, Draft Final Report, Prepared for the US Department of Energy, November 2011.

44
weight for a typical 2010 model year vehicle. For weight reduction above 10%, the costs can
rise rapidly as more expensive materials such as aluminum, magnesium and composites are
needed at higher penetrations. Figure 4-1 shows the cost of primary weight reduction through
the use of advanced materials, and the cost savings from secondary weight reduction, to
provide a net cost as a function of total weight reduction for a midsize car with a base 2009
model year weight of 3400 lbs.
Figure 4-1
Source: EEA/ ICF (Ref. 22)
GM has recently confirmed that it will reduce weight of new models up to 15% by MY2016. A
large portion of this target will come from engine downsizing; for example, substituting a four
cylinder for a V6 engine would reduce the weight by 150 to 200lbs. With additional weight
decompounding redesign and assuming constant vehicle size, the goal appears to be
achievable. GM indicated that the material substitution will be implemented using:
• More high-strength steel for the body-in-white.
• Magnesium for selected parts such as transmission cases.
• More aluminum for doors, deck lids, hoods and structural parts.
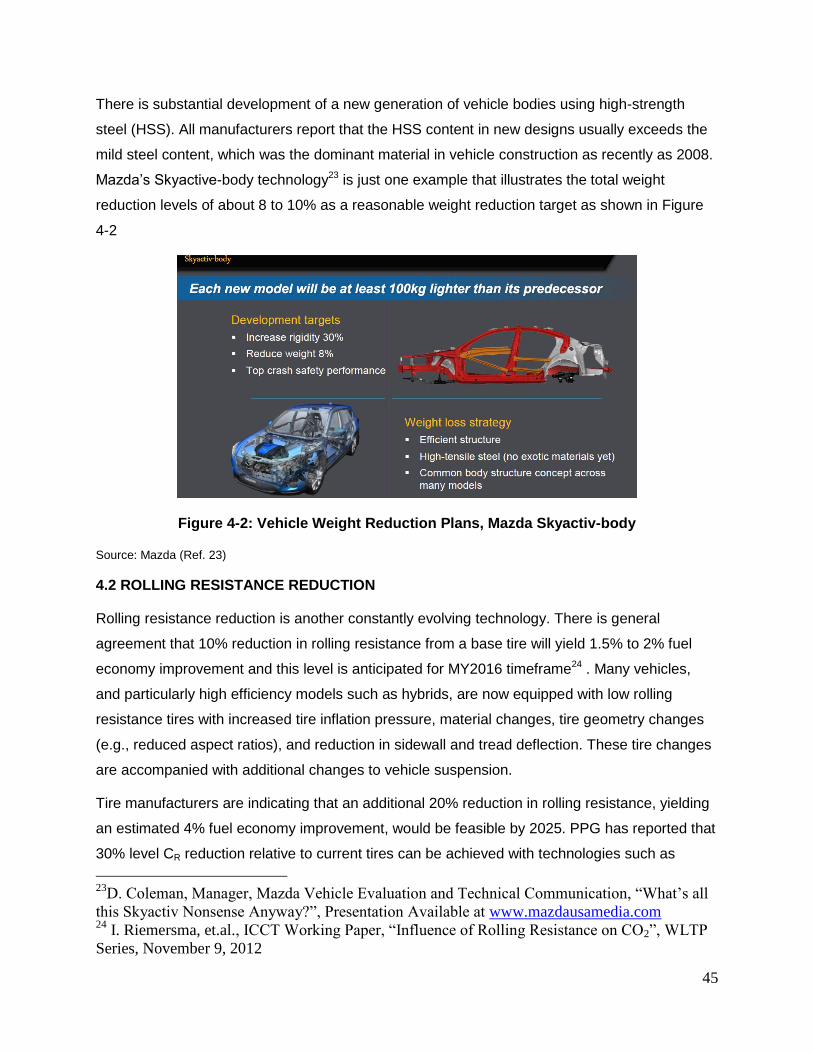
45
There is substantial development of a new generation of vehicle bodies using high-strength
steel (HSS). All manufacturers report that the HSS content in new designs usually exceeds the
mild steel content, which was the dominant material in vehicle construction as recently as 2008.
Mazda’s Skyactive-body technology23 is just one example that illustrates the total weight
reduction levels of about 8 to 10% as a reasonable weight reduction target as shown in Figure
4-2
Figure 4-2: Vehicle Weight Reduction Plans, Mazda Skyactiv-body
Source: Mazda (Ref. 23)
4.2 ROLLING RESISTANCE REDUCTION
Rolling resistance reduction is another constantly evolving technology. There is general
agreement that 10% reduction in rolling resistance from a base tire will yield 1.5% to 2% fuel
economy improvement and this level is anticipated for MY2016 timeframe24 . Many vehicles,
and particularly high efficiency models such as hybrids, are now equipped with low rolling
resistance tires with increased tire inflation pressure, material changes, tire geometry changes
(e.g., reduced aspect ratios), and reduction in sidewall and tread deflection. These tire changes
are accompanied with additional changes to vehicle suspension.
Tire manufacturers are indicating that an additional 20% reduction in rolling resistance, yielding
an estimated 4% fuel economy improvement, would be feasible by 2025. PPG has reported that
30% level CR reduction relative to current tires can be achieved with technologies such as
23
D. Coleman, Manager, Mazda Vehicle Evaluation and Technical Communication, “What’s all
this Skyactiv Nonsense Anyway?”, Presentation Available at www.mazdausamedia.com 24
I. Riemersma, et.al., ICCT Working Paper, “Influence of Rolling Resistance on CO2”, WLTP
Series, November 9, 2012

46
precipitated silica compounds. 25 Other manufacturers such as Continental appear to be
discussing the same technologies that are able to decrease rolling resistance while
simultaneously improving the handling characteristics. Figure 4-3 shows the evolution of the
trade-off between Wet Grip and Rolling Resistance over the different generations of Silica
compounds26
Figure 4-3: Wet Grip Versus Rolling Resistance
(percent improvement over baseline for wet grip and rolling resistance set at 100%)
Source: ICCT/Continental (Ref. 26)
According to ICCT27 the costs of achieving about 25% rolling resistance reduction would be $10
per tire, implying $4 per 10% reduction. The National Research Council estimates range from a
2006 estimate of $1 per tire to decrease rolling resistance of replacement tires by increasing
use of silica, to 2010 estimates of $2 to $5 per tire for new generation silica technology.
4.3 AERODYNAMIC DRAG REDUCTION
The reduction of aerodynamic drag, as measured by its coefficient of drag, CD, has the effect of
reducing the load on the engine at higher speeds and hence, improving fuel economy. Each
25
PPG Silica Products, “Precipitated Silica in Tires: A Beneficial Combination”, Product
Website Accessed April 4, 2013. 26
Ed Pike, “Opportunities to Improve Tire Energy Efficiency”, ICCT White Paper Number 13,
July 2011. Figure 3 is sourced from Continental Tire Group AG. 27
Ed Pike, op.cit.

47
10% reduction in drag is associated with about 2% increase in fuel economy, provided the top
gear ratio is changed to keep performance constant.
Ten years ago, an average new U.S. car had a 0.32 CD. Modern cars have achieved CD below
0.25 and the very best mass produced vehicles achieved levels of 0.22 (Mercedes has reported
that their new CLA-class achieved this coefficient28). Even hatchbacks, where the rear shape
imposes a drag penalty, have now been redesigned to attain CD values below 0.29 as illustrated
by the evolution of the VW Golf design as shown below29.
Figure 4-4: Car Drag Reduction Evolution.
Source: VW (Ref. 29)
Pickup trucks with their open rectangular bed and higher ride height have relatively poor CD; the
best of pickup designs have CD values of about 0.4, depending on size, 4WD vs 2WD, ground
clearance and other attributes important to the segment.
Aerodynamic drag cannot be reduced without affecting the styling characteristics of the vehicle.
However, more transparent technologies are now being employed to decrease drag further. The
list includes: active grille shutters, active spoilers/air dams, and active wheel covers. There are
currently several mass production platforms that employ this new technology. Examples include
the Ford Focus (CD :0.295), and Chevy Malibu (0.29).
4.4 ACCESSORY IMPROVEMENTS
Engine accessory efficiency improvement technology refers to an alternator, coolant and oil
pumps which are traditionally mechanically-driven. The new trend is to improve the general
28
Daimler Technicity Article, “Mercedes-Benz Aerodynamics: Emotion Meets Efficiency”,
March 8, 2013. 29
Volkswagen Viavision Article, “Shaping the Future of Mobility”, March, 2013

48
design of these devices through better bearings, seals, etc., but also moving to electrically
driven accessories designed to operate only when needed (“on-demand” accessories).
Electric accessory drive opens up many additional opportunities for engine efficiency
improvement. For example, the flow from the water pump can be modulated during the engine
warm-up period, allowing the engine to heat more rapidly, thereby reducing the fuel enrichment
needed during the cold start. Further benefits may be obtained when electrification is combined
with an improved, higher efficiency alternator and battery, which would allow the engine to have
stop-start functionality and maintain critical cooling and lubrication needs. In total, these
improvements provide modest benefits for fuel economy, in the 2 to 3% range.
Another area that has emerged in the last 2 years is active thermal management of the
drivetrain. The new 2013 Dodge Ram features an active transmission warm-up system where
the transmission oil is heated to a controlled temperature by the engine coolant. Active grill
shutters and electrically heated engine coolant thermostats are also under consideration for
faster warm-up with the grill shutters being introduced in both the Dodge Ram and Ford F-150
pickup. The fuel economy benefits are small on the FTP test where the cold start occurs at 75 F
(about 0.5% benefit each for the transmission and engine warm-up features) but these
technologies are also eligible for off-cycle credits for CAFE compliance, making them more
valuable.

49
5. ADVANCED TRANSMISSIONS
5.1 INTRODUCTION
In both automatic and manual transmissions, increasing the number of gears can provide a
wider ratio spread between first and top gears, which allows the engine to operate closer to its
efficient optimum at a wider variety of speeds. Alternatively, the increased number of gears can
be used to increase the number of steps with a constant ratio spread which improves drivability
and reduces shift shock. In addition, the wider ratio spread can be used to improve
performance in the first few gears while keeping the ratio of engine speed to car speed in top
gear. Since the last API report, the trend to increasing the ratio spread and number of gears has
increased at a much faster pace than originally expected.
5.2 SIX TO TEN SPEED AUTOMATIC TRANSMISSIONS
A 6-speed automatic transmission (6AT) is already the transmission of choice for many
vehicles. Higher gear-count transmissions such as eight-speed transmission (8AT) have been
available in the market from manufacturers such as Aisin and ZF and their products have
transitioned into mainstream platforms. Luxury vehicles from Europe have offered 7 speed and
8 speed transmissions since 2010.
GM has announced that Aisin will supply its TL-80SN 8-speed planetary automatic for the 2014
Cadillac CTS to be mated with the new twin-turbocharged 3.6L V6. The Aisin unit is also
expected to go into other GM vehicles. In the CTS application, the 8-speed is expected to
deliver a 1.5% to 2% fuel economy improvement vs. the 6-speed automatic in the outgoing 2013
CTS V6 model.
ZF manufactures the 8AT version for rear-wheel drive (RWD) vehicles for use by Chrysler full
size cars, pickups and SUVs. We expect that future production volumes will be sufficient to
develop several torque variants so the new transmission will be used across Chrysler’s RWD
product line. ZF claims that, as a result of increased gear ratio spread and additional
improvements, the new gearbox is capable of up to 6% fuel efficiency gain compared to the 2nd
generation 6-speed AT. When combined with other built in capabilities such as the stop-start
(HIS already used by the Ram pickup), the fuel efficiency improvement can be up to 11% on the

50
European cycle30. Figure 5-1 shows ZF’s estimates of the 8-speed transmissions benefit with
mild hybridization and full hybridization as well, but the numbers appear very optimistic.
Figure 5-1: Fuel Consumption Reduction from Advanced Transmissions
Source: ZF Friedrichshafen AG (Ref. 30)
For the new transmissions, the fuel economy improvements are achieved not just by increasing
the gear count but also by using technologies such as a variable oil pump, improved torque
converter and optimized control unit. ZF has gone one step further and released a new 9HP 9-
speed FWD transmission with ratio spread of 9.84.31 Starting with MY2014, we expect Chrysler
will offer this transmission in the compact van and in subsequent years, expand it to midsize
cars. ZF claims the technology will enable FWD vehicles to use downsized engines and will
achieve fuel efficiency gains comparable to DCTs and CVTs, or up to 12%.
GM and Ford have jointly developed current 6AT technology and have indicated that they are
working on 9 and 10-speed automatics for broad use across their vehicle lineup. GM is leading
the 9AT effort for FWD vehicles, while Ford is focusing on the 10AT for RWD vehicles, including
30
ZF Motion and Mobility, Products and Services Website, Chart Available at
http://www.zf.com/corporate/en/products/innovations/8hp_automatic_transmissions/lower_cons
umption/lower_consumption.html.Accessed September 3, 2013. 31
ZF Product Brochure, “9HP 9-speed Automatic Transmission for Passenger Cars”. 2012

51
pickups. The new technology is likely for at least small scale production by MY2017 (initially for
Lincoln and Cadillac vehicles). By 2025, we expect that these transmissions will have largely
replaced the six speed across the product lineup
Figure 5-2: ZF New 9-Speed Automatic Transmission.
Source: ZF Friedrichshafen AG (Ref. 31)
5.3 AUTOMATED MANUAL TRANSMISSIONS
There are several Automated Manual Transmissions (AMTs) currently in the US market and are
primarily sold in dual-clutch (DCT) configuration (as opposed to single clutch which traditionally
had issues with shift lag). A DCT uses separate clutches (and separate gear shafts) for the even
and odd-numbered gears. In this way, one of the clutches is always engaged, which allows for
faster and smoother shifting without the torque interruption of a single clutch system.
The DCTs can be separated into wet clutch and dry clutch designs. Wet clutch DCTs offer a
higher torque capacity that comes from the use of a hydraulic system that cools the clutches
and absorbs the slippage energy. Wet clutch systems are heavier and less efficient due to the
losses associated with viscous drag. Additionally, wet clutch AMTs have a higher cost due to
the additional hydraulic hardware required. Dry clutch DCTs are limited in torque capability and
also have poorer shift quality than the wet clutch design, but have lower internal losses.

52
As with other transmission types, AMT technology is trending toward higher gear counts. While
the 6-speed AMT is common, the 7-speed transmission is also available and used by VW.
VW/Audi has been marketing their Direct Shift Transmission (DSG), which is wet-clutch 6-speed
design, for many years32. Audi is also using another wet dual-clutch variant in its S line models
such as S4. The design has 7-speeds and called “S-tronic”.
Figure 5-3: VW/Audi 6-speed Wet-Clutch DSG Transmission Schematic
Source: VW (Ref. 32)
Several new DCT have entered the market in 2012/2013. Ford markets the Getrag DCT6
(called Power Shift) transmission for compacts equipped with I4 engines.33. The transmission
offers about 8 to 10% FE gain compared to a 4-speed AT. It is designed with electromechanical
actuation instead of hydraulic shifters, improving fuel efficiency further. The DCT6 was launched
in the Fiesta and now used in the Focus. VW has introduced the new dry clutch 7-speed DCT
for use in high efficiency packages (such as the new Jetta HEV). The transmission is designed
for up to 184ft-lb torque implying that base engines for future Jetta, Golf and Passat models will
be able to use this technology. By MY2017, we anticipate this transmission for the new Beetle
and Golf models. The new 7-speed AMT is claimed to have fuel consumption advantage of 7 to
12% relative to the 6-speed manual on the NEDC. Chrysler launched the Fiat’s dry-clutch DCT6
in the MY2013 Dart equipped with 1.4L engine.
32
Volkswagen of America, Inc., Service Training Course Number 851403, “The Direct Shift
Gearbox Design and Function”, Published in 2004. 33
Ford Press Release, “Ford to Introduce Fuel-efficient Dual-Clutch Power Shift Transmission
in North American Market in 2010”, January 21, 2009

53
However, the acceptance of the DCT in the US market is in doubt. The dry clutch DCT used by
Chrysler has had a poor reception in the market and it is anticipated that Chrysler will switch to
the 9-speed automatic by 2017. Even the wet clutch models have not been popular, and may
observers think that the DCT is better suited to Europe where customers are more used to
manual transmissions. Given the automatic transmission plans by the domestic manufacturers,
it appears that DCTs may be used only in very small cars such as the Ford Fiesta, and by
European models whose customers may prefer the feel of the DCT.
5.4 CONTINUOUSLY VARIABLE TRANSMISSIONS
A Continuously Variable Transmission (CVT) offers an infinite choice of ratios between fixed
limits, allowing optimization of engine operating conditions to maximize fuel economy. CVTs
have reached mainstream status and new generation CVT technology is now marketed in the
US, particularly by early adopters such as Nissan. Honda has announced a major strategic shift
toward new generation CVTs that would be combined with DI engine introduction, while Toyota
has also confirmed that many models will shift to the CVT. Honda is planning that, by the
MY2017 timeframe, more CVT variants will be developed for mini, compact, and mid-size
vehicle classes. A 5% fuel economy improvement over current CVTs has been reported.
Figure 5-4: JATCO New Generation CVT8 Technology Features.
Source: JATCO (Ref.34)
JATCO is the CVT supplier to Nissan (the Xtronic CVT). The JATCO CVT7 is used by
subcompact and compact models, while the CVT8 is suitable for higher torque applications
including vehicles equipped with Nissan’s most powerful engine, the 3.5L V6. JATCO claims
that the new transmission achieved additional 10% fuel economy improvement over the

54
previous variant by increasing the ratio spread (to 7.0) and by internal friction reduction such as
redesign of the oil system and changing the oil type34 as shown in Figure 5-4
The new CVT technology has produced major gains in fuel economy. In 2013 model year, the
Nissan Altima midsize car with a conventional 2.5L PFI engine rated at 182 HP achieved a
CAFÉ rating of 42.3 MPG, which is higher them most compact cars and an amazing 20% better
than the mid-size car average of about 36 mpg. As noted, about half of the improvement is
attributed to the new CVT.
Table 5-1 lists the combined (city-highway) fuel economy from the EPA gas Mileage Guide Data
of the nine most popular midsize cars for model year 2013 with near equivalent performance,
and the two CVT equipped cars have significantly better fuel economy than all the others, even
better than the GM “mild hybrid” sold in the Regal. Strangely, only the Japanese manufacturers
are investing in CVT technology even with this proven superiority to other transmission types.
Vehicle Model Engine Type-HP Transmission Combined FE
Nissan Altima 2.5L PFI 182HP CVT 42.3
Honda Accord 2.4L DI 185HP CVT 40.2
Toyota Camry 2.5L PFI 178HP A6 37.6
Hyundai Sonata 2.4L DI 198HP A6 36.6
Ford Fusion 2.5L PFI 175HP A6 34.6
Ford Fusion 1.6L DI-T 184HP A6 37.7
Chevy Malibu 2.5L PFI 192HP A6 34.8
Buick Regal Mild Hybrid 2.4L DI 182HP A6 38.7
Table 5-1: Comparison of 2013 Performance Equivalent Midsize Car Fuel Economy
5.5 TRANSMISSION EFFICIENCY IMPROVEMENTS
Similar to the engine friction reduction technologies, improvements to transmission efficiency
have been continuously implemented as new designs are released. The majority of these
improvements address mechanical friction within the gearbox. These improvements include but
34
Jatco Technology Information, “JATCO CVT8 for Medium and Large FWD Vehicles”,
Website accessed April 2, 2013.

55
are not limited to: shifting clutch technology improvements, improved kinematic design,
improved lubrication, more efficient seals, bearings and clutches, components coatings and
improved transmission lubricants. The transmission fluid pump can also be made more efficient.
The technologies are applicable to most transmission types, but these improvements are
generally not accounted for separately but are typically lumped together with improvements
from transmission ratio and gear count changes. Ricardo has suggested that, if all these
improvements are combined with other transmission technologies such as early torque
converter lockup (where applicable), the total improvement benefits can range from 4% to 6%35.
However, many current transmission designs already use some of the new technology
improvements for friction reduction, so that the total benefit depends on the baseline for
comparison and could be lower than the 4% to 6% cited by Ricardo.
35
EPA Regulatory Impact Analysis: “Final Rulemaking for 2017-2025 Light-Duty Vehicle
Greenhouse Gas Emission Standards and Corporate Average Fuel Economy Standards”, EPA-
420-R-12-016, August 2012.

56
6. VEHICLE ELECTRIFICATION
In the last 5 years, vehicle electrification technology has become available from virtually every
mainstream manufacturer. The market implementation in the US ranges from a simple belt-
driven stop-start system to a “plug-in” hybrid (PHEV) to fully functional Battery Electric Vehicles
(BEVs), which are capable of grid electricity charging. Both the PHEV and EV have no
significant new developments outside of changes to battery technology, and their prospects are
discussed in conjunction with battery technology developments described in Section 5.4.
6.1 STOP-START SYSTEMS
Stop-start systems operate by turning the engine off at idle and (sometimes) at deceleration.
New technology has recently enabled a re-launch of improved versions of this technology even
with torque converter equipped automatic transmissions, as manufacturers have developed
ways to maintain transmission oil pressure during idle shutdown.
Currently, the stop-start designs in the US market are mostly in European imports like VW and
BMW, and utilize a special strengthened starter motor that can pre-engage the engine when the
engine comes to a stop. The start-stop places a large demand on the batteries so that electrical
system upgrades are usually required with these systems. There is general agreement that idle
stop-start systems provide about 3% to 4% fuel economy improvement in the US city test but
almost zero on the highway test, so that CAFÉ benefit is only about 1.5% to 2%. The real world
benefits can be larger and many manufacturers are planning to apply for additional “off cycle”
credits (available as flexibilities in the GHG/CAFE rules) for this technology.
Bosch has shown that the benefit should be about 4% and could be much higher if stop-start
functionality is combined with engine shut-off during coasting36. Figure 6-1 from Bosch suggests
that shut-off during deceleration could improve the total benefit by 7% (to a total of 11%) on the
city cycle, and the net CAFE benefit may also increase more since there is some coasting
possible in the highway cycle. Second generation systems, incorporating shut-off during
coasting, are likely to appear in the post-2016 time frame.
36
H. Yilmaz, Bosch Chief Engineer –Gasoline Systems, “Bosch Powertrain Technologies”,
Presentation at DEER Conference 2012, available at
http://www1.eere.energy.gov/vehiclesandfuels/pdfs/deer_2012/

57
Figure 6-1: Fuel Economy Benefits from Engine Shutdown During Coasting on FTP Test
SS - Stop-Start; SSC – Stop Start and Coasting
Source: Bosch (Ref. 36)
Ford announced that the new generation MY2013 Fusion will be its first non-hybrid midsize
sedan available with Auto Start-Stop; which is sold as a $295 option.37 The system is used with
the 1.6-liter Ecoboost engine and 6 speed AT. Ford claims a 3.5% overall fuel economy
improvement. The stop-start is enabled using an electrically driven transmission pump with an
upgraded starter motor and an absorbent glass mat lead-acid 12V battery. The important part of
the system is the new controller that monitors accessory load to make sure that the engine can
be restarted and enough energy is available in the battery.
37
Ford Press Release, “Ford Fusion Auto Start-Stop System Priced at Only $295; Technology
Delivers Thousands of Dollars in Fuel Savings”, April 2, 2012.

58
Chrysler is unique among OEMs with the Stop-Start system launched in the MY2013 Ram
pickup38. It was developed by ZF for the 8 speed AT and uses a Hydraulic Impulse Storage
system to store pressurized oil in a hydraulic cylinder (vs. electric oil pump based systems). The
new ZF FWD 9AT, in production for Chrysler, is stop-start capable and we anticipate that the
system will be optional on most midsize car and truck models by MY2017. ZF also claims that
the new system improves fuel economy by up to 3.5%.
Figure 6-2: ZF Hydraulic Impulse Storage
Fiat already markets stop-start technology in Europe and their system will be introduced in the
US, near term, in compacts equipped with manual or DCT transmissions. Market reception in
the US to these systems has been mixed. BMW has reported that about 30% of the customers
have the system turned off due to engine vibration during start. Bosch believes that customers
may have some initial qualms about this technology but soon get used to the minor shudder
during restart. The Japanese manufacturers have been more cautious and it is unclear if they
will introduce this technology since they do not have problems with CAFÉ compliance.
6.2 BELT DRIVE ALTERNATOR STARTER (BAS) HYBRIDS
As the name implies, the BAS system replaces the existing alternator with a starter
motor/alternator to provide the stop-start functionality. In addition, the system is capable of
some regenerative braking and modest launch assist, depending on the power capability of the
belt.
The GM e-Assist ™ system is perhaps the best known BAS technology, now in its 2nd
generation. The e-Assist was redesigned for 2012 with a liquid-cooled induction motor/generator
and air-cooled power electronics and battery pack. The motor can provide up to 15kW of
38
Chrysler Press Release, “2013 Ram 1500 Offers Best-in-class Fuel Efficiency, New
Technology and New Features without Sacrificing Capability”, August 24, 2012.
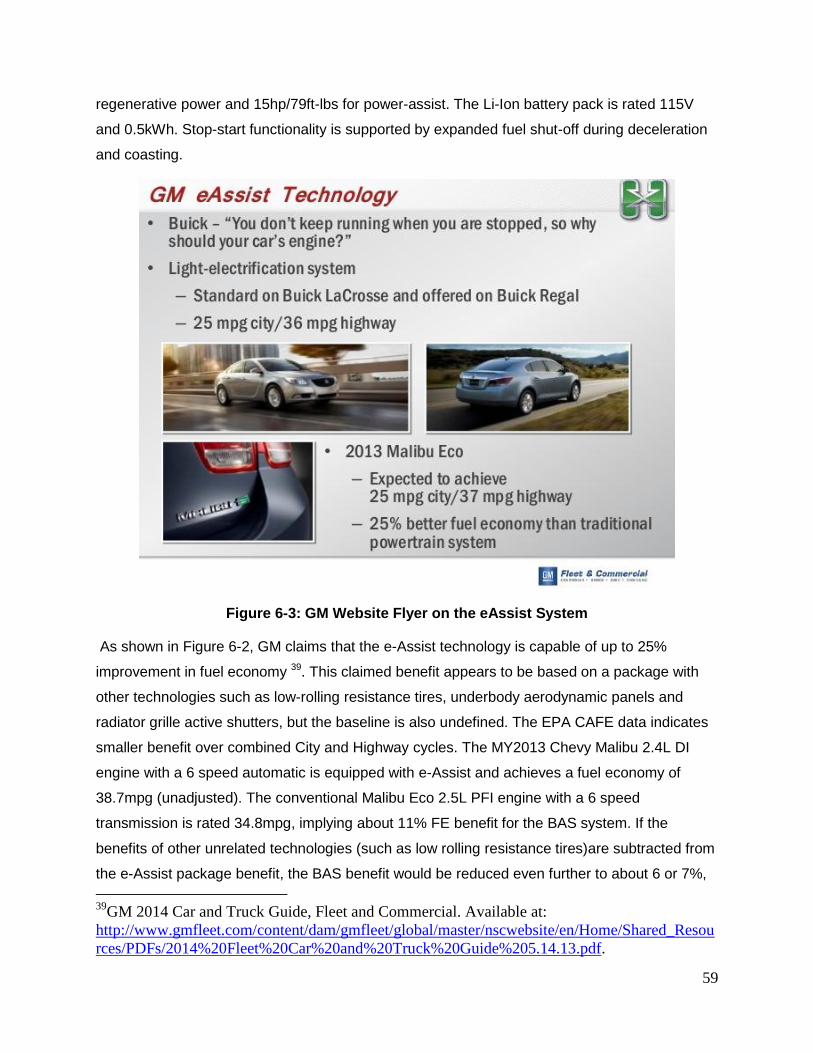
59
regenerative power and 15hp/79ft-lbs for power-assist. The Li-Ion battery pack is rated 115V
and 0.5kWh. Stop-start functionality is supported by expanded fuel shut-off during deceleration
and coasting.
Figure 6-3: GM Website Flyer on the eAssist System
As shown in Figure 6-2, GM claims that the e-Assist technology is capable of up to 25%
improvement in fuel economy 39. This claimed benefit appears to be based on a package with
other technologies such as low-rolling resistance tires, underbody aerodynamic panels and
radiator grille active shutters, but the baseline is also undefined. The EPA CAFE data indicates
smaller benefit over combined City and Highway cycles. The MY2013 Chevy Malibu 2.4L DI
engine with a 6 speed automatic is equipped with e-Assist and achieves a fuel economy of
38.7mpg (unadjusted). The conventional Malibu Eco 2.5L PFI engine with a 6 speed
transmission is rated 34.8mpg, implying about 11% FE benefit for the BAS system. If the
benefits of other unrelated technologies (such as low rolling resistance tires)are subtracted from
the e-Assist package benefit, the BAS benefit would be reduced even further to about 6 or 7%,
39
GM 2014 Car and Truck Guide, Fleet and Commercial. Available at:
http://www.gmfleet.com/content/dam/gmfleet/global/master/nscwebsite/en/Home/Shared_Resou
rces/PDFs/2014%20Fleet%20Car%20and%20Truck%20Guide%205.14.13.pdf.

60
which would be similar to the level claimed by Bosch for engine shut-off during idle and
coasting.
The GM system’s small fuel economy benefit is for a relatively expensive option with a sizable
Li-Ion battery pack to store electricity. As a result, the GM BAS system’s sales are low, with a
7.2% take rate in the Malibu and about a 20% take rate in the Buick La Crosse and Regal where
it is standard in some trim levels. No other manufacturer appears interested in this system,
although Hyundai is using it in conjunction with a hybrid drivetrain described below. GM sold
9141 BAS hybrids in the first 4 months of 2013, or at an annual sales rate of about 30,000/yr.
GM is planning to expand the models offering BAS as an option, and we anticipate that the
midsize SUV (Equinox) and compact car (Chevy Cruze/ Buick Verano) models will offer this
system in the near future. Overall sales may increase to about 100,000/year by 2020 since GM
is relying on this technology to meet fuel economy standards.
6.3 CRANKSHAFT-MOUNTED MOTOR HYBRIDS
The crankshaft-mounted motor hybrid system was selected by EPA as the most cost-effective
path for future hybridization. Honda’s Integrated Motor Assist (IMA) is perhaps the best known
example and has been available in the US market since 1999. The IMA system used in the
Civic and Insight consists of a downsized engine with a crankshaft mounted electric motor that
is always coupled to the engine, and has one clutch between the motor and transmission.
Recently, several other manufacturers have adopted this approach but combined it with an
additional clutch between the motor and engine to enable pure electric drive at light loads. This
type of system is also sometimes called a 1-motor 2-clutch (1M2C) system with the operating
modes shown below in Figure 6-4.
Figure 6-4: 1M2C Hybrid Operation Modes.
Source: JATCO, Ref. 40

61
Honda still markets the IMA for legacy hybrids such as Civic although its functionality is still
limited to regeneration and power assist. The Civic IMA system fuel economy is 63.1mpg
(unadjusted combined) versus the Civic HF 1.8L rated at 45.2mpg (a difference of 40%). The
IMA package does include a CVT and a downsized engine, as well as low rolling resistance
tires and aerodynamic aids, so that the benefit of the IMA system at equal performance is about
30%.
A number of other manufacturers such as BMW, Mercedes, VW, Hyundai and Nissan have
started marketing the1M2C hybrid system As with 2-motor hybrid designs (used by Prius) the
1M2C extra clutch is able to provide full electric operation at low speeds, typically up to 30 mph.
The power rating of the motor relative to the engine power rating and the relative system torque
affect the net fuel efficiency benefit obtained. The fuel consumption reduction observed form the
8 available models appears to be a linear function of the ratio of motor HP to engine HP and
system torque to engine torque. The benefits range from as little as 8% on the BMW 5 series
hybrid to 35% on the Jetta hybrid, reflecting the range of choices on extent of electrification
adopted. It is clear with appropriate motor and engine sizing, a 30 to 35% reduction in fuel
consumption can be obtained. System costs can also be low relative to the more complex Prius
type design, and the overall cost-effectiveness is also quite good according to manufacturers.
Figure 6-5: JATCO 1M2C FWD Hybrid Transaxle Developed for CVT8
Source: JATCO (Ref.40)
Available information on product plans and supplier developments suggest additional models
will be introduced with second generation 1M2C technology. For example, JATCO has

62
developed 1M2C technology for a FWD transaxle40 with the CVT8 transmission (see Figure 6-
5), indicating that next generation hybrids from Nissan will feature this technology. Getrag is
known to be developing 1M2C hybrids integrated with their AMT technology, as shown in Figure
6-6. 41,42
Figure 6-6: Getrag 1-Motor Hybrid AMT Concept and 1M2C Assembly
Source: Getrag Ref. 42
Honda has also developed a hybrid single-motor DCT and believes that this design can provide
additional 30% efficiency improvement compared to IMA. 43 This claim is for a technology
package with a Li-Ion battery pack, new 1.5L Atkinson cycle I4 engine and a 7-speed dry-clutch
DCT. In the Getrag and Honda designs, the motor is not crankshaft mounted which allows the
use of a high RPM motor which is cheaper for the same power rating, and improved flexibility in
matching motor and engine power requirements at all parts of the operating map.
The single motor hybrids do suffer from one major drawback –when the system is operating in
electric drive, engine restart is hard to accomplish in a seamless manner. Typically this involves
slipping the two clutches and increasing power to the motor simultaneously to prevent torque
interruption while restarting but this difficult to accomplish smoothly over all driving modes. As a
result, reviews of such systems have reported drivability defects and sales of such systems
have been very poor. The total sales across all models for this system type in the US for the first
40
Jatco Product Information, “Jatco CVT8 Hybrid, New CVT for Medium and Large FWD
Vehicles”, Available on the company’s website:
http://www.jatco.co.jp/ENGLISH/products/hybrid/cvt8.html. Accessed September 3, 2013. 41
John German, ICCT, “GHG/CAFE Standard Impacts on Vehicles and Technologies”,
Presentation, February 13, 2013. 42
Getrag Press Release, “Getrag Completes Product Portfolio with New Dual Clutch and Hybrid
Transmissions”, September 25, 2012. 43
Honda Press Release, “Honda Develops New Lightweight and Compact Hybrid System
Named “Sport Hybrid Intelligent Dual Clutch Drive””, Tokyo, November 12, 2012.

63
4 months of 2013 was only 8444 units, and most of these were Honda hybrids. Most European
1M2C models are selling at the rate 20 to 30 units per month which is unsustainable for the
longer term.
Hyundai/Kia models with a conceptually similar but different system design are selling at a much
better rate with 9828 vehicles sold in the first 4 months (i.e. more than the sales of all other
manufacturers of the one motor system type combined!). Although the Hyundai/Kia system has
one motor and tow clutches, it differs in one major respect – it uses a separate BAS to
accomplish engine restart. The marginal cost of the BAS system in the Hyundai hybrid is
estimated at $450 to 500, since it can share the battery and some of the power electronics with
the 1M2C system. The hybrid model has 30% lower fuel consumption than the conventional
model with the same engine, and appears to offer better drivability than the system without the
BAS. However, the cost effectiveness per percent fuel consumption reduction may be close to
that of the Prius system, blurring the choice between the systems.
6.4 DUAL MOTOR “FULL” HYBRIDS
The so-called “full hybrid” of the Toyota Prius-type uses an architecture that requires two electric
motor-generators as opposed to the one electric motor system used in the IMA or 1M2C
designs. This type of architecture, using planetary gear sets to replace the transmission, is also
used by GM for its Two Mode Hybrid (TMH), and by Ford.
Toyota has been very aggressive with THS (Toyota Hybrid System) expansion and the system
will be marketed on majority of its mainstream platforms. Toyota recently updated its goal to
increase its hybrid global sales volume to 1 million units/ year by 201544. With each generation
of THS technology, Toyota has achieved unprecedented system cost, size and weight reduction
and this trend is expected to continue. While the current hybrids still use the Ni-MH battery, the
switch to Li-Ion is expected in near term.
Ford has embraced the 2-motor hybrid pathway, once again because of the need to have PHEV
capability (i.e., Energi variants). The Fusion HEV/PHEV is one of the newest hybrid vehicles for
the US market. It is equipped with a Li-Ion battery pack, 2L Atkinson cycle engine with eCVT
hybrid power split transaxle and an 88kW drive motor. The MY2013 fuel economy rating is
66.1mpg (HEV version). When comparing to the conventional model equipped with a 2.5L
engine and a 6 speed automatic, (fuel economy 34.6mpg), the hybrid’s fuel economy
44
Toyota Press Release, “TMC Announces Status of Its Environmental Technology
Development, Future Plans”, September 24, 2012.

64
improvement is very large, 91%. The Fusion’s fuel economy is quite close to that of the Prius
hybrid at 70.7 mpg and significantly better than that of the Camry hybrid. There have been some
press reports (e.g. Consumer Reports) questioning the validity of the Ford test results as most
on-road tests have achieved fuel economy of 40 to 45 mpg, significantly lower than the 52 mpg
on road derived from the CAFE rating.
Sales of full hybrids dominate overall hybrid sales, with sales of 136,848 units (mostly from
Toyota and Ford) for the first 4 months of 2013, which equates to sales of over 400,000 units
per year. The good sales is associated with the high fuel economy benefit (~60%)and very
good drivability. Only the GM Two Mode Hybrid is unsuccessful in the market, since it is offered
only on large pickup and SUV models (where hybrids are not popular) and has a very high
incremental price of over $7000 relative to its gasoline counterpart.
Given the full hybrid design’s market success, Honda has launched two-motor hybrid
technology starting with the Accord PHEV. While several manufacturers have decided to focus
on the 1M2C-type system, Honda believes the 2-motor design is best suited for a hybrid that
can be reconfigured with PHEV capability. (Honda will upgrade the IMA system to the 1M2C-
type configuration but will use the technology for “sporty” power assist hybrids)
6.5 BATTERY ADVANCEMENTS AND IMPLICATIONS FOR BEV/PHEV SALES
Future prospects for BEV and PHEV sales are closely linked to the price and performance of
future batteries. Lithium-ion (Li-Ion) batteries have replaced nickel-metal hydride (NiMH)
batteries in most hybrids and are the preferred chemistry for PHEVs and EVs due to its much
more favorable energy density. Li-Ion technology refinement continues and there is general
agreement that it will remain the battery of choice for 2016-2025 timeframe.
Several material combinations have been commercialized for cell chemistry. In selecting cells
for the automotive battery pack, a trade-off is often made between higher voltage and higher
capacity cell chemistry (such as nickel cobalt aluminum or layered manganese nickel cathode)
versus lower capacity but lower cost chemistry (such as the lithium manganese spinel or lithium
iron phosphate based technology) with a longer cycle life. For example, the current PHEV/BEV
best sellers, the Chevy Volt and Nissan Leaf, employ a manganese spinel cathode and graphite
anode in a flat-plate configuration with LiPF6 electrolyte for longer cycle life and relatively low
cost, but battery energy density is only about 90wH/kg for the entire battery (not cell).

65
The National Academy of Sciences has recently published a report45 that describes various
alternative fuels in context of the long term US energy strategy. The NAS committee concluded
that the automotive Li-Ion batteries have the potential for significant weight and cost reduction.
The committee estimated that cost reduction from current levels of about $500/kW-hr (estimated
for the Chevy Volt and Nissan Leaf, but our sources suggest $600 as closer to actual cost) to
$280/kW-hr by 2030, as shown in Figure 6-7. Optimistically, the committee believes the costs
could reach $200/kW-hr for large packs (i.e., long range BEV applications). Such forecasts of
rapid cost reduction for batteries have been issued periodically for the last decade, but actual
costs have remained quite high, so that the NAS forecast should be regarded skeptically.
Figure 6-7: Estimated Cost ($/kWh) of Lithium-Ion Automotive Batteries to 2030
(curves represent optimistic, mid-range and pessimistic scenarios)
Source: NAS (Ref.45)
H-D Systems own estimate is that battery costs (to auto-manufacturers) will remain
approximately flat for the next 5 years since battery manufacturers have to recover their
investments in the first generation batteries, Second generation batteries may emerge in the
2017-2018 time frame if the market for hybrids and PHEV/EV models grows significantly.
Typically, each generation of batteries must be produced for 5 to 6 years to recoup investments
in battery development and manufacturing process developments.
In terms of the next generation batteries, new Li-Ion cathode and anode concepts, such as the
silicon-Li anode and layered Ni-Co-Mn oxide cathode, are being investigated. Silicon is an
attractive anode material for Lithium Ion batteries because it has the highest known theoretical
45
NAS, Transitions to Alternative Fuels and Vehicles, NAS Press, 2013

66
charge capacity of ~4,200 mAh/g – which is about ten times the amount of energy that a
conventional graphite-based anode can contain. It also has a specific energy of 1,550 Wh/kg –
about four times the energy of a conventional graphite-based anode. Furthermore, silicon is the
second most abundant element on the planet and has a well-developed industrial infrastructure,
making it a cheap material to commercialize with a cost comparable to graphite per unit of
weight. The problem with silicon is that it is very brittle and when Lithium Ions are transferred
during charge and discharge cycles, the volume expands and contracts by 400% which can
pulverize the silicon anodes after just the first cycle. Another limitation is the cathode chemistry.
Current cathodes made from oxides only have a capacity around 100-300 mAh/g. As a result, a
silicon anode alone would not benefit from its high charge capacity.
Panasonic has been developing an 18650-type (18 mm in diameter, 650 mm in length) battery
using a nickel-based cathode and silicon alloy anode. The battery’s capacity is increased by
13% from 65 mAh/g for the carbon-based anode to 74 mAh/g for the silicon-based anode.
Panasonic has also overcome some of the issues related to the degradation of the
silicon/graphite anodes and can maintain at least 80% capacity after 500 charge/discharge
cycles, which is still only one-tenth the automotive requirement. These batteries will initially be
used for laptops and the technology may see introduction for electric vehicle applications by
2020 with continued technology development.
Nexeon Limited is developing a silicon anode nanostructure which reduces the expansion
problem of silicon. Its first-generation anode has a capacity of 1,000 mAh/g and a second-
generation anode may reach 3,600 mAh/g. Using a conventional cathode, capacity could be
increased by 30-40% compared to current carbon-anode-based batteries. Nexeon has tested
the battery over 300 cycles and claims consistent performance46.
These developments indicate the possibility of anode and cathode improvements that can result
in a 25 to 35% increase in energy density at the cell level and emerge around 2020. Similar
increases in energy density could be observed at the battery level with improvements in
packaging, cooling and insulation. Typically, the chemicals and materials used for these
batteries will cost the same or less per unit weight so that improvements in energy density lead
to approximately similar percentage cost reductions.
46
http://www.nexeon.co.uk/technology/

67
Other chemistries are also being researched for automotive use. For example, Toyota is known
to be developing batteries using technologies such as solid state and metal-air47. Toyota
believes that the power density can be doubled from the current state-of-the-art Li-Ion
technology (5kW/liter to 10kW/l) and has recently signed an agreement with BMW to research
Lithium-Air batteries.48 Given the current status of these technologies, we do not anticipate
commercialization of these batteries before 2025, at the earliest.
Figure 6-8: Battery Technology Development.
Source: Toyota (Ref. 47)
6.5.1 Implications for BEV And PHEV Cost and Sales
A large number of BEV models and PHEV models have entered the market in the last 2 years.
Overall sales of all vehicles with plug-in capability were 24950 for the first four months of 2013
(or a rate of about 80,000/yr), split almost equally between BEV and PHEV models. BEV sales
were dominated by the Tesla Model S and the Nissan Leaf, while PHEV sales were dominated
by two very different models, the Chevy Volt and Prius Plug-in.
47
Toyota Innovation, “Research Progress: Next Generation Secondary Batteries”, Available at
http://www.toyotaglobal.com/innovation/environmental_technology
/next_generation_secondary_batteries.html. Accessed September 3, 2014. 48
BMW Group Press Release, “BMW Group and Toyota Motor Corporation Deepen
Collaboration by Signing Binding Agreements”, January 24, 2013.

68
PHEV models with the exception of the Chevy Volt, are full hybrids with a larger battery. An all-
electric range of operation (AER) for these vehicles is about 10 to 15 miles. Typically, all electric
drive consumes about 0.3 kWh/mi so that a 12 mile range requires about 3.6 kWh of usable
battery capacity. Only about 60% of the full capacity of a battery is usable in a hybrid design so
that battery capacity must be about 6 kWh to obtain a 12 mile range, as compared to a 1 to 1.5
kwh battery in a hybrid. The additional capacity of about 4.5 kWh costs an additional $2500 to
$3000 for the battery alone, and other PHEV features for all-electric operation result in a total
cost increment to a hybrid in the $4000 to $5000 range. This cost increment doubles the cost
increment of a full hybrid to a gasoline vehicle. Given our expectation of stable battery prices to
auto-manufacturers over the next 5 years, we do not expect significant sales growth to 2020
although some growth from today’s low volumes is to be expected.
The same challenges face the Volt and other BEV models. The Volt employs a large battery
(16.5 kWh) to provide a 40 mile range as well as a 1.4L engine and generator, and the battery
alone imposes a cost increase of over $8,000. Total vehicle costs have been computed by HDS
at over $44,000. Similarly, costs of EVs with a 100 mile range impose battery costs of $14,000
for a 24 kWh battery currently and overall vehicle costs for a compact EV are estimated at
$38,000 to 40,000. Hence, Nissan and Chevy are losing money on plug-in vehicles which is not
uncommon for new technology introduction. Tesla, whose cars offer a 150 to 200 mile range is
estimated to be losing $10,000 per vehicle on a car priced at over $70,000. Due to our battery
price expectations, cost decreases from scale and learning will be quite limited to 2020 limiting
future sales growth.
Given our cost and price expectations, sales growth for PHEV and BEV models will be
determined only by additional vehicle choices and larger manufacturer subsidies driven by the
need to meet the ZEV mandate requirements. Based on these considerations, sales could
easily double from current levels to 80,000 BEV and 80,000 PHEV sales per year by 2020, but
this would be only about 0.5%+0.5% or 1% of total light vehicle sales. Our expectation for each
type is in the 0.5 to 1% range for 2020, depending on fuel price falling to $3/gal or increasing to
$4.50/gal to define the extremes.

69
7. OEM COMPLIANCE STRATEGIES
7.1 INTRODUCTION
EPA has developed a technology path to comply with standards49 that is expected to represent
the “least-cost” pathway to compliance, and this pathway is described in Section 7.2 The
following section provides an overview of compliance strategies for the eight largest (by sales)
US auto-manufacturers. The OEM-specific fuel economy standards and CAFE compliance
figures for MY2017 are based on HDS” proprietary forecasting model that tracks technology
baseline and adoption plans on a model and powertrain basis, weighted by our own forecast
sales volumes. Since product plans are specified only 5 years into the future, technology and
CAFE for MY 2017 can be estimated with reasonable certainty. This allows for an informed
estimate on the technology path to 2020 as well as intelligent speculation on the potential path
to 2025 compliance. The actual compliance strategy is quite different from EPA expectations for
many manufacturers.
It should be noted that the post-2020 term, compliance strategies are less certain, particularly
because the CAFE/GHG regulations are written to allow a mid-term review of the 2022-2025
standards. OEMs will have to comply with the standards defined in 2012 rules, unless the
agencies determine that a different standard is necessary (i.e., another Final Rule will be
issued). Manufacturers, particularly the US “Big 3”, have commented publicly that the mid-term
review will be critical in “ensuring the success of the program through the 2025 model year”.50
The review is supposed to be completed before April 2018 and was a key element towards the
industry agreeing to accept the MY2025 targets.
7.2. EPA TECHNOLOGY FORECAST TO MEET 2025 STANDARDS
Although EPA examined a wide range of technologies to meet the 2025 standards, the final set
of technologies that were determined to be “cost-effective” is actually a relatively limited set that
is forecast to be deployed across all manufacturers.
49
EPA, Regulatory Impact Analysis, Final Rulemaking for 2017-2025 LDV Greenhouse Gas
Emission Standards and Corporate Average Fuel Economy Standards, EPA-420-R-12-016, 2012 50
N. Homeister, “Ford’s Perspective: Light Duty Fuel Economy Regulations”, Presentation at
SAE Government Industry Meeting, January 30, 2013.

70
The first set is referred to “anytime technologies” in the sense that they can be adopted
independent of the engine and transmission set chosen and include the following:
- Low friction lubricants
- Engine friction reduction (level 1 and level 2)
- Improved accessories (level 1 and level 2)
- Low rolling resistance tires (level 1 and level 2)
- Aerodynamic drag reduction (level 1 and level 2)
- Aggressive shift logic (level 1 and level 2)
- High efficiency gearbox
- Electric power steering for cars and small light trucks and elector-hydraulic power
steering for large trucks
In the above list, two levels of deployment are shown for many technologies and the second
level is a more intensive level of deployment, such as a higher level of drag reduction or rolling
resistance reduction, relative to level 1. In the forecast, almost all vehicles deploy these
technologies to Level 2, which is a more intensive level of technology deployment. This set of
technologies, if uniformly employed on a single 2008 baseline vehicle, is estimated to provide a
net 23.8% reduction in CO2 emissions but some vehicles had these technologies even in the
base year (2010) so that the entire 23.8% reduction does not accrue for the fleet. In the
technology benefit estimates employed by EPA for this technology set, the only controversial
estimate is for aggressive shift logic, which is estimated to provide 5.1 to 7% reduction in fuel
consumption and CO2 emissions. Aggressive shift logic has not been described objectively (in
the sense of a specification of what it implies) and the lack of clear definition makes it difficult to
know to what extent it had been deployed in 2010 or to estimate the level of deployment in
2013. The estimate of 4.8 to 5.4% fuel consumption reduction for the high efficiency gearbox is
also not well specified since transmission benefits are listed separately, making it unclear if both
sets of benefits should be combined independently.
There are four other technology areas forecast for improvement:
- Weight reduction
- Improved engine technology
- Improved transmission technology
- Vehicle electrification

71
Weight reduction is a significant factor but the extent of weight reduction included for 2025 is
quite modest for mass market manufacturers. GM, Ford and Chrysler are estimated to require a
6% weight reduction while the Asian manufacturers require only 3% weight reduction for their
car fleet. Weight reduction of 7 to 9 percent is estimated for the truck fleet for mass market
manufacturers except Toyota (at 4%). Luxury car manufacturers are estimated to require larger
weight reductions for cars and trucks (10 to 15%). Our own analysis suggests larger weight
reductions may be required by mass market manufacturers, especially for trucks where we
estimate a large fraction to require 15% weight reduction.
Engine technologies forecast for 2025 narrow down largely to the downsized GDI/ Turbo
engine with dual cam phasers, which offers the best cost-benefit according to EPA analysis.
The forecast has this technology in three flavors corresponding to the level of maximum boost
tolerated, to provide maximum brake mean effective pressures (BMEP) of 18 bar, 24 bar and 27
bar. The 27 bar versions also have cooled EGR. The base 18 bar engine provides10.7% to
13.6% benefit in fuel consumption across the different vehicle classes while the 24 bar version
improves the benefit by about 6% relative to the 18 bar version’s benefits. The 27 bar version
provides an additional 3.6% benefit. The forecast shows the vast majority of cars (>90%) and
70% to 80% of trucks using the 18 bar and 24 bar technology with the exception of GM cars (at
63%) and Toyota, Honda and Kia cars (at 20 to 25%). 27 bar technology is projected for use
largely in the luxury car and truck market. The lower use of this technology by the three Asian
manufacturers is tied to the baseline where the mix and base fuel economy levels permit them
to meet standards with less technology addition. However, the finding GDI/ Turbo technology is
the optimal approach appears to be driven by EPA’s use of European consultants Ricardo and
FEV for their analysis; based on inputs received during our interviews, Asian manufacturers
believe other approaches are superior.
EPA’s forecast of transmission technology seems equally affected by its reliance on
European consultants. EPA has determined that dual clutch automated manual transmission
(DCT) offers the best cost benefit of transmission technology, including 8/9 speed conventional
automatic transmissions and continuously variable transmissions (CVT). As noted above, EPA
has also assumed all transmissions can reduce internal losses and provides a 4.3 to 5.4%
benefit which appears to be too high for a dual clutch transmission where internal losses are
small. However, EPA has also reduced the benefit from DCT transmissions suggesting that the
use of both technologies is accounted for but this is not explicit in the regulatory analysis. EPA
models the use of wet clutch DCTs in high torque applications and dry clutch DCTs for smaller

72
vehicles. Most manufacturers are projected to use the DCT in 80 + 10 percent of all cars with
the exception of Ford at 53% (which is strange as Ford is one of the champions of this
technology). Since the DCT is not used where towing capability is required, penetration of DCTs
is primarily in smaller models for the light truck fleet, and is quite low for most manufacturers’
truck fleet. Most trucks are forecast by EPA to rely on conventional 6 speed and 8 speed
automatics. HDS does not believe that these EPA projections are realistic, as Japanese
manufacturers made a good case during our interviews that the CVT in conjunction with a high
compression ratio naturally aspirated engine may be a more cost effective path for passenger
trucks and cars.
EPA has considered various levels of vehicle electrification from the simple idle stop system
to the battery electric vehicle. Their 2025 forecast is for relatively low use of only the simple idle
stop system in cars (less than 10% for most mass market manufacturers except Ford) but much
higher use in trucks (~50%). Pure electric vehicles have small penetration in cars (2 %) and
almost zero penetration in trucks, and curiously, PHEV penetration is estimated to be lower than
that of battery electric vehicles. For hybrid vehicles, EPA models two types – one similar to the
BAS used in the Malibu and called “mild hybrid”, and the P2 hybrid which is conceptually similar
to the hybrid designs offered by Nissan, Hyundai and BMW and called strong hybrid. EPA does
not include the hybrid design currently used by Toyota and Ford, in spite of the fact that this
design dominates current sales.
MHEV Car HEV Car MHEV Truck HEV Truck
Chrysler 33 1 44 6
Ford 10 3 11 1
GM 16 0 36 0
Honda 0 0 40 0
Hyundai 0 0 50 0
Nissan 17 1 40 0
Toyota 0 12 3 3
VW 48 2 50 0
Table 7-1: Mild Hybrid and Hybrid Penetration (%) in EPA’s 2025 Forecast

73
The forecast penetrations shown in Table 7-1 for the two hybrid designs for cars and light trucks
do not follow any specific pattern possibly because this is the marginal technology to meet the
standard in the model. The forecast 2025 penetrations for the eight largest manufacturers are
shown below. (EPA does not consider the impact of California ZEV mandate requirements for
its analysis of BEV/PHEV penetration, which are determined solely for compliance with GHG
standards).
Estimates for technology costs in the EPA analysis are quite complex since these all change
with time due to learning and scale. Even for conventional technology, costs are expected to
decline by 15 to 20% over the 2016 to 2025 period. Costs of vehicle electrification technologies
show larger declines over the period and range from 24% for hybrids and idle stop technology
up to 47% for battery electric vehicles over the same period. Hence, compliance costs are
dependent on when the technology is adopted and the specific year of comparison involved.
Developing a simple representation of the technology impact and resultant cost of compliance
with 2025 standards for any manufacturer proved challenging due to the fact that the modeling
is performed at the nameplate level and total costs are dependent on the baseline mix of
nameplates sold, the timing of the changes and the path. As an illustration, a car starting with a
V8 engine in the 2008 baseline will see a reduction in engine size and cylinder count with
conversion to GDI/Turbo technology and the replacement engine will be a V6. With further
vehicle weight reduction, and progress to 24 bar BMEP or 27 bar BMEP GDI/Turbo technology,
the V6 engine could be downsized to a 4 cylinder engine. At the other end of the spectrum, a
vehicle starting with a large (over 2L) 4 cylinder engine may migrate only to 18 bar GDI/Turbo
technology and the 2025 engine may be still a 4 cylinder engine. In both cases, the end result
could be a 4 cylinder GDI Turbo engine but the cost savings from the V8 to 4 cylinder would
result in a different net cost. In addition, the V8 engine could have included cylinder cutout
technology in the base year and this would be deleted in the GDI/Turbo engine for additional
cost savings. Hence, the net cost of transforming the V8 equipped car can be lower than that of
transforming the 4 cylinder car. An exact accounting would require detailed knowledge of the
path for every nameplate in the manufacturers’ fleet and would be quite complex.
Instead, we developed an approximate analysis to illustrate the contributions of individual
technology to the total improvement in CO2 emissions (or fuel consumption reduction) and to
total cost of compliance, by using manufacturer fleet average data and estimating the starting
and ending mix of engines. The calculations shown in Tables 7-2 and 7-3 are for two
manufacturers that are on two ends of the spectrum for compliance difficulty and complexity.

74
GM had a relatively low CAFE in 2008 and has a sales mix dominated by larger vehicles and
trucks. Honda, on the other hand had a CAFE much higher than the standard in 2008 and sells
no large trucks, while specializing in smaller cars and trucks. Tables 7-2 and 7-3 provide details
on the EPA forecast of technology adoption for the car and light truck fleets, as well as the
resultant penetration weighted impact on fuel consumption and cost.
The same set of technologies is used for all manufacturers, and the plug-in hybrid is not used
for any of the compliance forecasts. Some diesel penetration is forecast for Daimler Benz (but
not for VW!) and some EV penetration is forecast for several import manufacturers but at low
penetration levels of under 5%.Tables 7-2 and 7-3 also illustrate the differences between
compliance costs depending on the starting point and fleet mix. Honda’s compliance cost as
derived in the tables above is about $1300 for cars compared to $1840 for GM’s cars, and
$2100 for trucks compared to $2825 for GM’s trucks. (all of these cost numbers are close to the
actual EPA numbers developed from the detailed forecast, and are within 10% of the EPA cost
figures. EPA also includes a $133 cost for A/C improvements).
7.3 MANUFACTURER SPECIFIC PLANS
Based on detailed tracking of manufacturer product plans, the technology introduction plans for
the 8 largest manufacturers in the US (by sales) are discussed below. Note that all forecasts
referred to in this section are based on HDS analysis of product plans as derived from public
sources and from non- confidential information obtained through our industry contacts as
described in Section 1.2 of this report. Product plan information was not discussed with the
manufacturers interviewed although many of their comments during the interview provided
insight into the future technology pathways they would likely follow.
7.3.1 FORD
Ford’s technology migration plan is well publicized in the trade press and includes major
powertrain changes and also smaller fuel economy improvement steps systems such as EPS
and radiator grille shutters in majority of vehicles by 201551. Ford has indicated that 90% of its
North American nameplates will be available with the Ecoboost engine as standard equipment,
or as an option, and this strategy is well underway. The 2nd generation Ecoboost engines were
announced this year starting with MY2014 Fiesta with 123hp 1L I3 engine.
51
Ford Sustainability Report 2011/2012.
Available for download at http://corporate.ford.com/doc/sr11.pdf.Accessed August, 2013.

75
FC [%] Costs [$]
Penetration
%
Cumulative
FC [%]
Cumulative
Costs [$] FC [%] Costs [$]
Penetration
%
Cumulative
FC [%]
Cumulative
Costs [$]
Cars Cars Cars Cars Cars Trucks Trucks Trucks Trucks Trucks
2025 2025 2025 2025 2025 2025 2025 2025
-11
Net Mass Reduction* [%] 5.1 per 10% -7 3.6 102 5.1 per 10% -10 5.1 257
Mass Increase due to Technology* [%] na 1 3.1 102 na 1 4.6 257
Turbocharging and Downsizing, 18 Bar BMEP 12.2 388 23 5.7 187 12.0 388 17 6.6 323
Turbocharging and Downsizing, 24 Bar BMEP 16.0 602 72 16.5 620 16.0 811 61 15.7 817
Turbocharging and Downsizing, 27 Bar BMEP 18.6 1,031 3 17.0 651 18.3 1,031 15 18.0 972
6-Speed Automatic Transmission 2.1 -8 0 17.0 651 2.0 -8 0 18.0 972
8-Speed Automatic Transmission 6.9 50 6 17.4 654 6.9 50 98 23.5 1,021
6-Speed Dual Clutch Transmission 7.0 -109 0 17.4 654 7.5 -109 0 23.5 1,021
8-Speed Dual Clutch Transmission 8.0 -15 89 23.2 641 9.0 -15 2 23.7 1,021
Manual Transmission 2.3 -147 5 23.3 634 2.3 -147 0 23.7 1,021
High Efficiency Gearbox 5.1 202 100 27.2 836 4.9 202 100 27.4 1,223
Cooled EGR 3.6 249 74 29.2 1,020 3.6 249 75 29.4 1,410
Hybrid Electrical Vehicle 15.5 2,606 0 29.2 1,020 14.6 2,799 0 29.4 1,410
Full Electric Vehicle (EV75) 100.0 7,899 0 29.2 1,020 n/a n/a 0 29.4 1,410
Plug-in Hybrid Electrical Vehicle (20mile AER) 40.0 6,939 0 29.2 1,020 40.0 7,942 0 29.4 1,410
Stop-Start 12V 2.1 308 0 29.2 1,020 2.1 349 49 30.1 1,581
Lower Rolling Resistance Tires, Level 2 3.9 44 100 31.9 1,064 3.2 44 100 32.3 1,625
Improved Accessories, Level 2 1.5 120 78 32.7 1,158 1.4 120 50 32.8 1,685
Engine Friction Reduction, Level 2 4.2 121 100 35.6 1,279 4.0 121 100 35.5 1,806
Stoichiometric Gasoline Direct Injection 1.5 226 97 36.4 1,484 1.5 226 93 36.4 2,016
Advanced Diesel 20.8 2,420 0 36.4 1,484 20.6 2,426 0 36.4 2,016
Mild HEV ** 7.3 1,614 22 37.5 1,839 7.2 1,614 50 38.7 2,823
Table 7-2: EPA Technology Adoption Forecast for GM Car and Truck Fleets for 2025

76
FC [%] Costs [$]
Penetration
%
Cumulative
FC [%]
Cumulative
Costs [$] FC [%] Costs [$]
Penetration
%
Cumulative
FC [%]
Cumulative
Costs [$]
Cars Cars Cars Cars Cars Trucks Trucks Trucks Trucks Trucks
2025 2025 2025 2025 2025 2025 2025 2025
Mass Technology Applied [% weight red.) -3 -11
Net Mass Reduction* [%] -3 1.5 16 -10 5.1 257
Mass Increase due to Technology* [%] 0 1.5 16 1 4.6 257
Turbocharging and Downsizing, 18 Bar BMEP 12.2 337 24 4.4 97 12.0 388 25 7.0 338
Turbocharging and Downsizing, 24 Bar BMEP 16.0 383 73 15.6 377 16.0 383 75 18.2 626
Turbocharging and Downsizing, 27 Bar BMEP 18.6 1,031 0 15.6 377 18.3 1,031 0 18.2 626
6-Speed Automatic Transmission 2.1 -8 0 15.6 377 2.0 -8 0 18.2 626
8-Speed Automatic Transmission 6.9 50 0 15.6 377 6.9 50 72 22.2 662
6-Speed Dual Clutch Transmission 7.0 -109 0 15.6 377 7.5 -109 0 22.2 662
8-Speed Dual Clutch Transmission 8.0 -15 85 21.3 364 9.0 -15 28 24.2 657
Manual Transmission 2.3 -147 12 21.5 346 2.3 -147 0 24.2 657
High Efficiency Gearbox 5.1 202 97 25.4 542 4.9 202 100 27.9 859
Cooled EGR 3.6 249 73 27.4 724 3.6 249 75 29.9 1,046
Hybrid Electrical Vehicle 15.5 2,606 3 27.7 802 14.6 2,799 0 29.9 1,046
Full Electric Vehicle (EV75) 100.0 7,899 0 27.7 802 n/a n/a 0 29.9 1,046
Plug-in Hybrid Electrical Vehicle (20mile AER) 40.0 6,939 0 27.7 802 40.0 7,942 0 29.9 1,046
Stop-Start 12V 2.1 308 0 27.7 802 2.1 349 3 29.9 1,057
Lower Rolling Resistance Tires, Level 2 3.9 44 97 30.4 845 3.2 44 100 32.1 1,101
Improved Accessories, Level 2 1.5 120 97 31.5 961 1.4 120 64 32.8 1,177
Engine Friction Reduction, Level 2 4.2 121 97 34.2 1,079 4.0 121 100 35.4 1,298
Stoichiometric Gasoline Direct Injection 1.5 226 97 35.2 1,298 1.5 226 100 36.4 1,515
Advanced Diesel 20.8 2,420 0 35.2 1,298 20.6 2,426 0 36.4 1,515
Mild HEV ** 7.3 1,614 0 35.2 1,298 7.2 1,614 36 38.0 2,096
Table 7-3: EPA Technology Adoption Forecast for Honda Car and Truck Fleets for 2025

77
Figure 7-1: Ford Global Technology Migration Plan
Source: Ford (Ref. 51)
Going forward, the powertrain strategy will continue along the following main pathways (see
Figure 7-1):
1. Volume growth of the Ecoboost as the main strategy, coupled with engine downsizing.
2. DI adoption on all turbocharged and most naturally aspirated engines.
3. Dual VVT (DVVT) implementation in most engines.
4. New transmissions including dry-clutch AMTs and ATs with up to 10 speeds.
5. New 2 motor “full” hybrid and PHEV model introduction.
6. Smaller fuel saving technology implementation across all vehicles. Examples include
deceleration fuel shut-off, advanced alternator control, and reduced idle speed.
Light Duty Vehicles
Ford’s near term LDV CAFE strategy was demonstrated when the two highest sales volume
models, the Fusion and Focus, were redesigned in 2012 and 2013. In particular, the Fusion was
altered dramatically with the size and feature content moved up-market, and the V6 eliminated

78
in favor of small Ecoboost engines. In 2013, the Fusion is available with several powertrain
choices including a HEV and PHEV version. The new C-Max hybrid and PHEV were launched
to compete directly with Toyota Prius V. Two BEVs (Focus and the Transit Connect) were
introduced for pilot production.
By 2017, we forecast that Ford’s larger cars will offer only DI engines including DI-Turbo
engines, but smaller models will offer a mix of PFI, DI and DI-Turbo engines. The table below
summarizes our forecast for most of Ford’s high sales volume products to about 2020. We do
not anticipate any of the BEVs to have significant sales volume to 2020, but hybrids and PHEVs
could have a market share of 10 to 15%. In the 2020/2021 period, we expect Ford to transition
away from PFI to DI, with only the Fiesta and Focus retaining PFI for the base model. It is
possible that the 5L V-8 Mustang could be phased out at about that time and replaced with a
second generation 3.5L V-6 Turbo. The 2017-19 engine mix by model is shown below for cars.
Model PFI DI DI-Turbo Full hybrid/ PHEV/BEV
Fiesta 1.6L I-4 1.0L I-3
Focus/C-Max 2.0L I-4 1.6L I-4 2.0L PFI/BEV
Fusion 2.5L I-4 2.0L I-4 1.6/2.0L I-4 2.0L PFI
Mustang 5.0L V-8 2.7L V-6 2.3L I-4
Taurus/ Lincoln 2.7/2.9L V-6 3.5L V-6 2.0/2.5L DI
Est. Market Share (2017-2019)
20% 20% 50% 10%
Ford’s MY2017 LDV standard is forecast by HDS at 38.6mpg and the CAFE is 37.6mpg. The
EPCA/EISA legislation does allow an FFV credit of 0.6mpg for MY2017. Therefore, Ford’s
CAFE is forecast to reach 37.6+0.6=38.2mpg for MY2017, which results in a 0.4mpg shortfall.
However, for MY2017 Ford will take advantage of extra CAFE credits available through off-cycle
technologies such as AC refrigerant changes and efficiency improvements, idle stop and
radiator grille shutters to make up the 0.4 mpg shortfall.
Ford’s entry-level compacts and subcompacts, as well as the Fusion, will generally have no
issues with CAFE compliance and will generate offsets to 2021. Longer terms, the problem
areas for Ford are Lincoln car lines and the high volume Mustang and Taurus. We expect that
even the larger (3.5L/3.7L) V-6 engines will be phased out, and all engines will undergo another
round of downsizing so that the 2.7L V-6 will likely be the largest available engine by 2025.

79
Light Duty Trucks
The future plan for LDTs will result in several new vehicles starting with EU-developed MY2014
Transit cargo van, which will be sold in addition to the E-series. Also, the Lincoln brand will be
strengthened with a new compact CUV from the Escape platform. The current body-on-frame
(BOF) full size trucks will continues with trim/power-train updates while the Ranger compact
pickup has already been eliminated. The CAFE/GHG requirements are relatively lenient for the
large trucks to 2021 so we do not anticipate significant power train changes to 2021 for these
trucks. However, we expect Ford to offer the 4.4L Diesel V-8 in the B-o-F vehicles starting in
2017 to improve compliance prospects; we estimate that diesels could account for 15% of the
market in these vehicles (only) by 2020.
Model PFI DI DI-Turbo Full hybrid/ Diesel/BEV
Escape 2.5L I-4 1.6/2.0L I-4 2.0L PFI
Transit Connect 2.5L I-4 2.0L PFI/BEV
Edge/MKX 2.7/2.9L V-6 2.0L I-4 2.5L DI
Explorer 3.5L V-6 2.3L I-4
Flex/ Lincoln MKT 3.5/ 3.7L V-6 3.5L V-6
F-100/150 and E-150 van 3.7 V-6/ 5.0 V-8
3.5L V-6 4.4 V-8 Diesel
Expedition/ Navigator 5.0 L V-8 3.5L V-6 4.4 V-8 Diesel
Est. Market Share (2017-19) 35% 10% 45% 10%
With the product and powertrain changes, Ford’s LDT MY2017 CAFE is forecast at 28.5mpg
with compliance requirements at 28.7mpg. However, when the 0.6mpg FFV credit is added,
Ford CAFE increases to 29.3mpg for MY2017.Ford’s compact CUVs/van and the midsize Edge
will meet the MY2017 standards and some offsets will be generated for Lincoln LDTs. The F150
will comply without significant further engine changes although Ford can maximize the 3.5L
Ecoboost volumes to generate credits. We expect the diesel to be successful in the pickup, with
a 15 to 20% take rate by 2020.
For the 2021-2025 timeframe, Ford will continue the technology trajectory described above with
the 2nd and 3rd generation variants of the DI-Turbo engine introduced in the 2012-2015 time
frame. All OEMs will be required to ramp up their electrification efforts to comply with the CA

80
ZEV regulations. As a result, in addition to BEV/PHEV pathway, Ford continues developing FCV
technology, particularly because California has indicated its’ commitment towards limited
hydrogen refueling station availability, which is aimed at a concentration of FCVs sales in
specific urban areas. Ford has announced a partnership with Renault-Nissan and Daimler to
jointly develop and commercialize FCV technology.54
7.3.2 GENERAL MOTORS
GM continues the sharp shift toward downsized 4 cylinder engines in almost every product line.
Even the new generation Impala has an I-4 option- a new variant of 2.5L DI with 2-step VVLT.
New small I-4s will be introduced in near term while V6s will gradually shift toward smaller
displacement choices.
GM’s powertrain strategy can be summarized along the following technology directions across
the lineup:
DI adoption in all engines lines except the smallest engines
Turbo/ DI -4 cylinder engines as a limited engine downsizing strategy to replace some
V6 engines
Limited use of diesels with urea-SCR after-treatment (MY2014 Cruze) in cars
Launch of a new twin-turbo DI V6 as a replacement for V-8 engines in the Cadillac
lineup
FFV capability for larger I4s, V6 and V8 engines. A CNG model is likely for fleets
(CNG/gasoline bi-fuel pickups are already sold for MY2013).
Continuation of large displacement OHV engines for the Corvette and full size trucks, re-
engineered with down-speeding, cylinder cut and VVT implementation across all
engines, at least to 2020.
DCT7 transmission launch for compact cars
9 and 10 speed AT introduction starting with Cadillac RWD cars
Light Duty Vehicles
GM has been increasing subcompact/compact sales volume but will also rely on increasing
electrification in order to satisfy the new regulations. We forecast several major technology
directions:
54
Ford Press Release, “The Strategic Cooperation between Daimler and Renault-Nissan Alliance
Forms Agreement with Ford to Accelerate Commercialization of Fuel Cell Electric Vehicle
Technology”, January 28, 2013.

81
Stop-start use with compact engines
Volume growth of the 2nd generation BAS - eAssist™(production of “hundreds of
thousands” by 2017)
FWD 2-motor hybrids (TMH) in cars
EREV Volt and Cadillac ELR sales volume growth
Spark BEV subcompact for ZEV mandate compliance
By 2017, we forecast that GM’s larger cars will offer only DI engines including DI-Turbo, but
smaller models will offer a mix of PFI, DI and DI-Turbo engines. The 2017-19 engine mix by
model is shown below for cars
Model PFI DI DI-Turbo BAS HEV Full HEV/ PHEV/
BEV/ Diesel
Spark 1.2L I-4 1.4L I-4
1.4L I-4 BEV
Sonic 1.4L I-4 1.8L I-4
1.4L I-4
Cruze/Verano 1.8L I-4 1.8L I-4 1.6/2.0L I-4 1.8L I-4 DI
2L Diesel
Volt/ELR 1.4L I-4 EREV
Malibu/LaCrosse/ Impala
2.5L I-4 3.6L V-6
2L I-4 2.5L I-4 DI
3.6L V-6 DI HEV
XTS/CTS/Camaro 3.6L V-6 2.5L I-4 3.6L V-6
3.6L V-6 DI HEV
Corvettte 5.5/6.2L V-8
6.2L V-8 S
Est. Market Share (2017-19)
25% 35% 20% 15% 5%
We do not anticipate the Spark BEV to have significant sales volume to 2020 since the Volt
platform is still positioned as the core electrified product supported by increased BAS volume
plans. The BAS market share is forecast at 20% in cars, while the combined diesel/HEV/PHEV
penetration should reach about 6% market share. By 2020, GM is expected to implement DI as
standard across all engines over 1.5Ldisplacement. With the product changes above, GM’s
MY2017 standard is forecast at 39.0mpg while the CAFE is 36.8mpg. GM will continue
maximizing FFV credit use to obtain an additional 0.6 mpg, resulting in about 1.6 mpg shortfall.
The company is planning to utilize the BEV/PHEV credit multipliers, A/C improvements, as well
as off-cycle technologies (such as the stop-start and grille shutter technologies) to generate

82
about 1mpg to 2mpg additional credits to close the compliance gap. GMs Spark subcompact, as
well as the Volt/ELR EREVs, will generate offsetting credits and GM can tune the volume
higher, if needed. The analysis illustrates that GM will have a difficult time complying even in the
near term due to two effects: their products have lower fuel economy than those of their
competitors at the same technology level, and their mix of larger vehicles makes it somewhat
more difficult to comply.
The problem areas for GM are the high volume CTS line, full size cars, and sports cars. GM will
also apply to exclude the emergency vehicles (i.e. Chevy Caprice Police) from the CAFE
compliance calculations. Longer term, technology directions announced by GM include up to
15% weight reduction using advances such as “nano steels”, carbon fiber components and
resistance spot welded aluminum structures.55 Like other OEMs, GM maintains an FCV
program for California compliance plans, but the latest cutbacks suggest in 2012 (when GM
closed its fuel cell development facility in New York) that limited pilot production could be
launched only for the post -MY2020 timeframe.
Light Duty Trucks
For LDTs, GM will continue major investment in compact SUVs. This model year, a new line
was launched from the compact Gamma platform (used by the Sonic) with the first product – the
Buick Encore. The existing compact SUVs, (Equinox, SRX and Terrain) will be redesigned for
greater efficiency starting MY2015. All vehicles will be based on the Delta compact car platform
used by the Cruze. At that point only the Cadillac would get the V6 engine option, with most
other small SUVs offering only 4 cylinder engines. Some models will get the BAS e-Assist
system.
The midsize Lambda crossovers are selling well so GM will develop more upgrades for the
CUVs including a luxury model for Cadillac. GM’s strategy is to upgrade the sheet metal and
content so that each brand can compete with a unique product, and GM also hopes to move
some of the customers from its largest SUV models (Yukon, Tahoe and Suburban). GM is the
sales leader in the large SUV class which uses B-O-F construction, like the Silverado pickup
and van, and most of these products have relatively low fuel economy.
GM’s engine selection for MY2017-19 is shown in table below. Most engines are forecast to
feature DI as standard including the OHV V8 engines, which will also receive cylinder cut and
55
GM CEO Remarks at the HIS CERA Week 2013 Energy Conference, Houston, TX, March
2013.

83
VVT as standard. The CAFE/GHG requirements are relatively lenient for the large trucks to
2021 so we do not anticipate significant V8 volume reduction to 2021. However, the 3.6L DI V6
would displace the 4.3L PFI V6 by 2021.
GM’s MY2017 LDT standard is forecast at 28.3mpg while the CAFE is 28.5 mpg. When the
0.6mpg FFV credit is added, GM will exceed the standard with the average of 29.1mpg which
will generate credits for future use. GM’s high volume Theta CUVs and the new entry level
compact CUVs exceed the MY2017 targets by a wide margin. Other platforms are reasonably
close, so GM will have no issues with LDT compliance to 2020.
Model PFI DI DI-Turbo HEV/Diesel
Small SUV/CUV 1.8L 1.8L BAS
Colorado/Canyon 2.5L I4
3.6L V6
Silverado/Sierra/Cargo Vans 4.2L V-6 5.3L/6.2L V8 4.5L V8 Diesel
Equinox/Terrain/SRX 2.5L I4
3.6L V6 (SRX)
2L I4 2.5L BAS
Enclave/Traverse/Acadia/Cadillac 3.6L V6 3.6L V6 3.6L V6 DI HEV
Suburban/Yukon/Escalade 5.3L/6.2L V8 4.5L V8 Diesel
Est. Market Share (2018-19) 10% 65% 15% 10%
GM will maintain the large footprint of its trucks to bank credits for future years and potentially,
to offset LDV under-compliance. Post 2021, when the requirements for large pickups, vans and
B-o-F SUVs increase sharply, GM will be under significant pressure. Advanced transmission
technology, including substantial increases in the market share of T-DI engines will be
implemented. Our analysis suggests that GM will be pushing for reduction of the 2025 targets
for trucks during the 2018 mid-term review.
7.3.3 CHRYSLER
Chrysler’s alliance with Fiat was designed to address its’ LDV product under-investment and the
strategy appears to be working with much stronger sales and Chrysler’s return to profitability.

84
The Fiat 500 was launched in the US market and will be followed by other Fiat designed LDVs.
Fiat-badged product will be a major contributor to Chrysler’s improved CAFE performance.
Light Duty Vehicles
Chrysler’s entry level car product was greatly improved with the Dodge Dart launch. Going
forward, by 2017 timeframe, the LDV product will be rearranged as follows:
Dodge Hornet introduction to compete with Ford Fiesta and Chevy Sonic.
Viper re-introduction.
Launch of a Chrysler compact from the Dart platform (likely designated as “100”)
Redesigned mid-size cars for Dodge and Chrysler
Continued investment in the RWD cars
Dodge Challenger redesign
Chrysler will incorporate Fiat’s Multiair CVVLT system in several engines as the key powertrain
improvement strategy, and our expectation is that no naturally aspirated DI will be adopted by
2017. The Multiair is already being used by Dodge Dart compact (1.4L Fire I4) and was
announced for the 2.4L Tigershark I4 (Cherokee). Diesel engines are another strategic direction
for Chrysler, and the first engine, the 3L V6 EcoDiesel™, will be launched in the MY2014 Jeep
Grand Cherokee. We forecast that the diesel adoption volume will have to be significant in order
to satisfy the 2017/18 CAFE regulations. The 2017-19 engine mix by model is shown below for
cars.
Model PFI DI DI-Turbo
Multi-air
Full
HEV/Diesel
Hornet 1.4L I4 1.4L I4
Dart/100 2L/2.4L I4 1.4L I4
Dodge Midsize/200 2.4L I4 3.2L V6 2.0L I4 2.4L PFI HEV
Charger/300/Challenger 5.7L V8 3.6L V6 3.2L V6 3L V6 Diesel
Est. Market Share (2017-19) 50% 10% 35% 5%

85
Longer term, we expect that Chrysler’s power train will be streamlined into 4 high volume
families: Fiat’s Fire compact I4 for engines under 1.5L, the Tigershark I4 covering 1.8 to 2.4L
engines, the Pentastar V6 covering 3 to 3.6L displacement and very limited use of the Hemi V8.
Older engine families, including the Modular V6/V8, will be discontinued by 2017. Chrysler’s
transmission lineup will be also reorganized with new products from Fiat. The current CVT is
scheduled to be replaced by DCT6 technology, but given the poor market acceptance, may be
replaced by 9 speed automatics. We forecast the major transmission directions as follows:
4 and 5-speed AT elimination in the next 3 years
Use of the DCT6 or the 9 AT for compacts and subcompacts.
Continuation of Chryslers’ 6AT transmissions in low cost compacts and intermediate
vehicles
ZFs 8-AT for full size RWD cars and LDTs
ZFs 9AT for higher cost FWD applications
Excluding Fiat imports, Chrysler’s LDV standard is forecast at 37.8mpg while the actual CAFE
attained is forecast to be 36.0mpg. Chrysler will continue maximizing FFV credit use. Therefore,
the CAFE will reach 36.0+0.6=36.6mpg for MY2017, resulting in slight under-compliance.
Chrysler’s products, such as the Dart compact, developed with Fiat’s technology will be
designed to comply with the fuel economy targets. The large footprint full size cars, with the
exception of the Challenger, will also comply with sales mix adjustment. The remaining
compliance shortfall will be filled in with Fiat’s product line credits, including the BEV. Chrysler
will also take advantage of off-cycle technologies such as aerodynamic aids, stop-start and LED
lighting. However, even with all of these changes, Chrysler will have difficulty complying with the
2020 LDV standards.
Beyond 2020, Chrysler will have a difficult time with CAFE compliance unless it rapidly expands
HEV sales, and phases out its 5.7L hemi V8 and 3.6L V-6 engine lines. Of the big 8
manufacturers, Chrysler may face the most serious shortfall in LDV compliance with standards.
Light Duty Trucks
For the LDT side, Chrysler will rapidly adjust the product lineup away from heavy reliance on B-
O-F SUVs. By the MY2017 timeframe, the LDT products will be rearranged as follows:
Jeep Compass will be redesigned from the new Dart platform while the Jeep Patriot will
be eliminated
Jeep Liberty will be redesigned as FWD CUV, renamed Cherokee, for 2014 introduction

86
Consolidation of the Chrysler and Dodge compact vans into one Chrysler minivan
Dodge Journey redesigned using a Fiat mid-size car platform. A new 3-row version will
be badged as a Chrysler with unique sheet metal and trim/features.
Durango will be eliminated and the Jeep Wagoneer introduced as the full size SUV
A new line of cargo vans starting with a compact van will be introduced to compete with
Ford Transit Connect. The mid and full size cargo van variants will be sourced from Fiat,
and will be diesel powered.
Chrysler is unique among OEMs with the Stop-Start system launch in the MY2013 Ram pickup.
It was developed by ZF for the 8AT and uses a HIS (Hydraulic Impulse Storage) system to store
pressurized oil in hydraulic cylinder (vs. electric oil pump based systems). The company claims
that the new system improves fuel economy by up to 3.5%.
The LDT engine lineup is summarized in the table below. Since the Multiair achieves large fuel
economy improvement and can operate with turbo-charging, we do not forecast naturally
aspirated DI engines for 2017. By 2020, however, at least one engine is expected with DI,
starting with the Pentastar V6. Chrysler is planning significant 3L V6 diesel penetration in
several products including the Ram pickup.
Model PFI DI DI-Turbo
Multi-air
Full HEV/ Diesel
Ram 1500/Cargo Vans 3.6L V6
5.7L V8
3.2L V6 3L V6 Diesel
Caravan 3.2L V6 3.2L PFI HEV
Wrangler 3.6L V6 3L V6 Diesel
Compass/Cherokee 2L/2.4L I4 1.4L I4
Journey/Chrysler CUV 2.4L I4
3.2L V6 2.4L PFI HEV
Grand Cherokee/Wagoneer 5.7LV8 3.6L V6 3.2L V6 3L V6 Diesel
Est. Market Share (2017-19) 55% 15% 15% 15%
With the above product changes, Chrysler 2017 LDT standard is forecast at 29.8mpg while the
actual CAFE attained is forecast to be 28.5mpg. When the 0.6mpg FFV credit is added,

87
Chrysler CAFE reaches 29.1mpg, which results in slight under-compliance. The BOF platforms,
particularly Jeep, will have difficulty meeting the standards even with significant diesel
penetration. However, the credits generated from the CUVs will be used to offset most of the
gap. With additional credits generated from AC efficiency improvement and off-cycle
technologies, Chrysler will be able to comply with the target for MY2017. In general Chrysler will
have a somewhat easier time complying with LDT standards through 2020 relative to complying
with LDV standards
For its longer term compliance strategy, Chrysler will need more hybrid and PHEV technology.
Also, the company has mentioned CNG as a viable option for fleet vehicles. Fiat is the first to
contribute BEV technology with the E-500 launch in California. We have information that ZF is
developing a hybridized version of the new 9AT transmission and because Chrysler is a key
partner for this product, we forecast that Chrysler’s FWD vehicles will have this transmission
around 2020. The ZF 9AT hybrid incorporates a single motor, implying a1-Motor, 2-Clutch
configuration for Chrysler’s HEVs.
7.3.4 TOYOTA
Due to its high hybrid sales, Toyota has no urgent need to improve fuel economy with
technologies that add a price premium, such as DI and new transmissions. The company has
been focusing on more cost effective incremental fuel economy improvement steps, such as
weight optimization and aerodynamic drag improvement. However, in order to keep up with the
competition on a vehicle class-specific basis, Toyota will start more aggressive powertrain
upgrades in the near term. Toyota management has commented that, by 2015, conventional
vehicle fuel efficiency will improve by 10 – 20% through engine and transmission changes
alone.
Light Duty Vehicles
For the Scion iQ launch, Toyota introduced its smallest NA power plant; the 1.3L I4 rated at
94hp. The engine, coupled with a compact CVT, allows very high fuel economy for the iQ, at
52.3mpg. The iQ is also now also sold in a BEV variant.
At present, Toyota employs DI only on the Lexus model line, while all Toyota and Scion badged
products use PFI. Toyota will start transitioning to DI, turbo-charging and advanced
transmissions (including 8AT and CVT) for some mainstream platforms like the Camry and
Avalon, as well as some sports cars like the new FRS. New generation DI-Turbo engines will be
introduced to provide fuel economy improvement and weight savings through engine

88
downsizing, but only on a limited set of vehicles. However, most of the lower cost vehicles like
Corolla, Matrix and Yaris will continue to offer PFI engines for the foreseeable future. Toyota’s
2017 LDV CAFE standard is forecast at 39.6mpg while the actual CAFÉ attained is forecast to
be 44.4mpg. With the FFV credit, the forecast reaches 45.0mpg for MY2017. Most high volume
products comply with the MY2017 standards ahead of time. Only the Lexus conventional cars
under-comply with the targets but their sales volume is relative low. With the high volume Prius
line, Toyota will accumulate a large LDV credit balance over the MY2012-2017 time frame. The
company will further increase the credit balance by using the “Zero g/mi" and production
multipliers for the BEV and the Prius PHEV. The 2017-19 engine mix by model is shown below
for cars.
Longer term, Toyota will maintain a mix of PFI, DI and Turbo engines since it will have a large
fuel economy credit balance from its successful hybrid products. Most smaller vehicles with four
cylinder engines will transition to the CVT transmission from the current 4 and 5 speed AT, but
the 6 speed will likely continue as the transmission of choice of Toyota products with V6 engine.
Lexus will gradually transition to 8 and 9 speed automatic transmissions. Also, the company will
take advantage of credits for A/C refrigerant improvement and for implementation of A/C
efficiency improvements. Hence, we expect that the combination of credits and expanding HEV
sales will provide Toyota adequate margin to comply with 2025 standards.
Model PFI DI DI-Turbo Full HEV/ PHEV/BEV
iQ/Yaris 1.3/1.5L I4 BEV
xD/Corolla/Matrix 1.8L I4 1.4L I4
Camry/Venza/ Lexus IS 2.5L I4 3.5L V6 2.0L I4 2.5L PFI HEV
Prius 1.5/1.8 PFI HEV
Avalon/ES 3.5L V6 2.5L PFI HEV
Lexus GS/LS 3.5L V6
5L V8
Est. Market Share (2017-19)
50% 20% 5% 25%

89
Light Duty Trucks
Toyota offers a full line of trucks including crossover SUV models, a compact van, body-on-
frame SUVs and compact and full size pickup trucks. Toyota will remain committed to some of
the B-o-F SUV long term since it will have plenty of CAFE credits from its car fleet. However,
due to its model mix, compliance with LDT CAFE standards will be a challenge. The B-o-F FJ
Cruiser and the Land Cruiser will be discontinued since their sales have been relatively low and
the Sequoia is sold in similar size and capability. Lexus’ LDT lineup will grow with introduction of
an additional crossover SUV based on the RAV4.
Due to the more difficult compliance prospects for LDT after 2021, we anticipate that DI use will
become more widespread as a way to increase specific output and downsize the engines. (This
is also consistent with the expectation that larger passenger car engines will adopt DI). The DI-
Turbo engines have not been as well received in trucks as in cars, and we expect that only a
few Lexus performance models may have this option. We also expect that Toyota will introduce
a diesel engine (already in production for other markets) in the full size pickup and large SUV
around 2017-18. The engine mix for MY2017-19 time frame is summarized below.
Toyota LDT standard for 2017 is forecast at 30.1mpg while the actual CAFE attained is forecast
to be 29.3mpg. With the 0.6mpg FFV credit the CAFE increases to 29.9mpg, which results in
slight under-compliance. Toyota compact CUVs will meet the MY2017 standards and offsets will
be generated. However, because the company will have a large LDV credit balance, no drastic
changes are expected or required for the high volume B-o-F trucks and Lexus SUVs.
Model PFI DI DI-Turbo Full HEV / PHEV/Diesel
Tacoma 2.7L I4 4L V6
Tundra/Sequoia/LX 5.7L V8 4L V6 4.5L V8 Dies
Sienna 3.5L 3.5L PFI HEV
RAV4/Lexus CUV 2.5L I4 2L I4 2.5L DI HEV
BEV
Highlander/RX 3.5L V6 2L I4 3.5L PFI HEV
4Runner/GX 4L V6
4.6L V8
Est. Market Share (2017-19) 15% 70% 8% 7%

90
In the past-2020 period, Toyota will have more difficulty complying with the LDT CAFE and
GHG standards due to relatively high large pickup and SUV sales. We anticipate the
introduction of smaller crossover SUV models and more aggressive weight reduction, together
with credits generated by over-compliance on the LDV fleet will allow Toyota to comply through
2025.
7.3.5 HONDA
Honda has started a new product restructuring initiative called “Earth Dreams”—comprised of a
series of measures to improve the efficiency of engines, transmissions, and hybrid designs.
Earth Dreams technology will be added as each vehicle is redesigned56 to include:
New gasoline engines with Advanced VTEC. Engines will be optimized depending on
size with implementation of DI, Atkinson cycle, cooled EGR/compression ratio increase
and many friction reduction strategies. Long term, most engines will have DI as standard
equipment .
A compact 1.6L diesel engine with reduced friction, Al block and compact turbocharger.
A new line of CVTs.
Several HEV technology variants
Figure 7-2:Honda Announcement on Earth Dreams Technology
Source: Honda (Ref. 56)
56
Honda Press Release, “Honda Announces Revolutionary Next Generation “Earth Dreams
Technology””, Tokyo, November 30, 2011.

91
The shift toward CVTs is the major strategic change for Honda. The company is planning that,
by the MY2017 timeframe, more CVT variants will be developed for mini, compact, and mid-size
vehicle classes, with an additional 5% fuel economy improvement over current CVT designs.
Light Duty Vehicles
Honda will continue investing heavily in hybrids and will eventually have an assortment of
electrified products including the 2-motor and 1M2C (IMA replacement) HEVs and a BEV. The
new 3-motor AWD hybrid system will be used for high performance vehicles like the NSX and
Acura RLX. The company also will continue its involvement in alternative fuels, including
hydrogen.
The first fully implemented product under the Earth Dreams strategy is the redesigned MY2013
Accord. The coupe version was launched with a 2.4L DI I4 engine coupled to a CVT
transmission. The new 2-motor hybrid system was launched in mid-2013 starting with the PHEV
configuration, which features the new 2L I4 with cooled-EGR and compression ratio of 13.0
(described in Section 3 of this report). The Accord HEV variant will follow in MY2014.The
Accord also is scheduled to receive the 2L Turbo DI. Longer term, most engines will adopt DI as
standard with PFI reserved only for the low cost Fit platform. The table below summarizes
Honda’s car engine mix for the MY2017-19 time frame.
Model PFI DI DI-Turbo HEV/PHEV/BEV
Fit 1.5L I4 BEV
Insight/CR-Z 1.5L/2L I4 PFI
Civic/ILX 1.8L CNG
1.8L/2L I4 1.5L/2L I4 PFI
Accord/Crosstour 2.4L I4
3.5L V6
2L I4 2L I4 PFI
TL 3.5L V6 2L I4 PFI
RL 3.5L V6 3.5L V6 DI
Est. Market Share (2017-19) 10% 70% 10% 10%
Honda’s LDV CAFE standard is forecast at 39.8mpg while the estimate for actual CAFE
attained is 42.1mpg. We are not forecasting any FFV certified engines for MY2013-
2019timeframe. All Honda high volume product lines comply with the MY2017 standards ahead

92
of time. The Acura cars under-comply with the targets but the sales volume is relative low and
Honda will likely accumulate a large LDV credit balance.
Post-2020, the increased use of high CR Miller cycle engines will be expanded, and coupled
with increased hybrid offerings, Honda will not have any problems in complying with 2025 LDV
CAFE and GHG standards. More likely, we expect Honda to generate credits that can be sold or
used to assist with LDT CAFE compliance
Light Duty Trucks
Honda maintains a limited product line for trucks and will continue its crossover refinement
strategy with a new product from the Fit platform for MY2015-16 launch. It’s possible that this
model will be marketed as the Civic Crosstour. We forecast that the Honda Ridgeline pickup will
be dropped after MY2014 due to poor sales, leaving only crossover SUVs and a compact van in
Honda’s LDT lineup. Most of the crossover SUV models use the large 4 cylinder or V6 engine
and we expect all of these engines to be converted to DI in the next 2 to 3 years. We forecast
that the Acura MDX will receive the 3.5L Turbo-DI as a performance option as this engine is
used by the RL flagship. The Pilot/MDX will also include a full hybrid variant.We estimate
Honda’s LDT 2017 CAFE standard at 31.6mpg while the actual CAFE attained is forecast to be
33.9mpg. Only the Pilot/MDX SUVs will under-comply with the targets. Overall, Honda will
continue accumulating credits and should not have issues with the CAFE compliance all the
way to 2021. Even beyond 2021, Honda’s expanded use of high CR Miller cycle engines and its
lack of B-o-F trucks in its product lineup will allow CAFE compliance with no major problems.
Model PFI DI DI-Turbo Full HEV
CR-V 2.4L I4
RDX 3.5L V6
Odyssey 3.5L V6 3.5L DI
Pilot/MDX 3.5L V6 3.5L V6 3.5L DI
Est. Market Share (2017-19) 0% 93% 2% 5%
7.3.6 NISSAN
Nissan will have a range of engine technologies technology implemented by the MY2017-19
timeframe including new generation CVTs, GDI and CVVLT. The key efficiency improvement for
Nissan’s lineup is the new generation wide ratio spread CVT. As implemented in the Altima, the

93
new CVT allowed the vehicle to achieve a combined fuel economy improvement of 20% relative
to the MY2012 model. A similar approach is expected for the rest of the car and crossover
models, since Nissan/Jatco has developed CVT technology to work with engines all the way up
to a 3.5L V6.
Nissan has also invested heavily in BEV development with the Leaf being the first of several all-
electric models to be introduced in the next 5 years. In addition to the full electric vehicle, the
company will introduce several HEV models with 1M2C technology, starting with Infiniti M and
the MY2014 Pathfinder. Nissan markets the micro-hybrid stop-start technology in Europe and
the technology will be brought to the US for compacts such as Versa and Cube and Sentra by
MY2016.
Light Duty Vehicles
Nissan is the leader in the BEV market. The Leaf program was positioned as one major
regulatory compliance tool for both California and Federal regulations. The production capacity
in Smyrna will be able to support very large sales volumes, if sales expand as planned. We
expect Infiniti will add a product from this platform by 2017 while Nissan will add an electric
compact van and small electric SUV in the next two years. However, we are not as optimistic as
Nissan in terms of future EV sales and expect sales of only about 50 thousand units per year in
2020, even with the addition of new car and van BEV models
The new 2013 Sentra switched to the stretched B-car platform used by the Versa in order to
achieve additional economies of scale. The compact 1.8L I4 PFI engine and CVT powertrain
was adopted to achieve a combined fuel economy of 45.9mpg. The midsize car segment
product revisions are being implemented starting with new MY2013 Altima. The 2.5L PFI engine
will remain as the core engine for the foreseeable future. Given the very good fuel economy
performance attained by PFI engine in combination with advanced CVT, we expect that DI
engines will remain as low volume products reserved for the Infiniti lineup, although we forecast
a Turbo-DI option for the Sentra and Maxima. Nissan’s MY2017-19 engine mix is summarized
below.We estimate that Nissan’s standard for MY2017 will be 39.0mpg, while the actual CAFE
attained is forecast at 40.5mpg. Nissan will generate LDV credits likely needed for its LDT fleet.
Even with limited BEV sales, we do not anticipate that Nissan will have any problems with CAFE
compliance through 2020/2021.

94
Model PFI DI DI-Turbo BEV/ HEV
Versa/Cube 1.6/1.8L I4
Leaf/ Infiniti BEV
Sentra 1.8L I4 1.6L I4
Altima 2.5L I4
3.5L V6
2.5L I4 PFI HEV
Maxima 3.5L V6 2.0 L I4
Infiniti G 3.7L V6
Infiniti M 3.7L V6
5.6L V8
3.5L V6 DI HEV
Est. Market Share (2017-19) 75% 10% 5% 10%
Beyond 2020, Nissan will also likely use the high CR/ supercharged engine technology that is
being introduced in Europe for many of its mainstream US models.Nissan’s ability to comply
with the 2022 – 2025 standards will depend on the success of its BEV focused strategy, but
there is enough time for Nissan to pivot to a PHEV and HEV focused strategy like other
manufacturers if BEV sales remain weak through 2017. As mentioned above, Nissan
participates in a FCV development partnership with Daimler and Ford. The strategy is aiming to
have products in addition to BEV models for California ZEV mandate compliance.
Light Duty Trucks
Nissan’s LDT fleet CAFE was also substantially improved with new CVT technology in almost all
crossover SUVs, including the Pathfinder and the Quest minivan. In contrast to their car fleet
strategy, Nissan will adopt the downsized T-DI gasoline engine pathway as the fuel economy
improvement strategy for small crossover SUV models. The Nissan Juke mini-SUV was
launched with 1.6L T-DI engine in 2013, and achieves very high fuel economy of 36 to
38mpg.Similarly, the next generation Rogue compact SUV will switch to the Sentra platform
(recently redesigned for weight reduction) with the 1.6L T-DI engine as an option.
The MY2014 Pathfinder has shifted to unibody construction using the stretched D-size platform
used by the Altima/Maxima/Murano. Other efficiency improvements will be limited to further
weight, drag and friction optimization. The Quest minivan, because of its large footprint, will
meet its fuel economy target with modest technology upgrades. Nissan is also introducing a

95
small front wheel drive cargo van derived from the Sentra platform, with a taxi-cab passenger
version that has been selected by New York for its taxi fleet. The van competes with the Ford
Transit Connect, and a BEV version will be introduced soon.
For the body-on-frame SUV and pickup segment, we forecast that both Frontier and Xterra will
receive only modest design changes as Nissan reevaluates its commitment toward the compact
pickup platform. Nissan will be able to continue marketing these vehicles into the MY2017 -19
timeframe with offsetting CAFE credits generated in the LDV segment. Beyond this time frame,
these vehicles will require substantial technology upgrades to meet CAFE standards, and may
be dropped if sales volumes continue to decline.
Nissan has entered the cargo van market with the NV (Nissan Van) product in 2012. The Titan
pickup and QX and Armada full size SUVs share the platform with NV/Titan so we forecast
these models will continue into MY2017. At present, only the 5.6L V8 engine is offered, but we
expect that the 4L V-6 will be added to improve fuel economy and both engines will utilize
cylinder deactivation technology. We also expect a diesel engine option in this class, possibly
the 5.2L V8 designed by Cummins (this was confirmed in late August, 2013), to be introduced
around MY 2018. The 7-speed automatic transmission is now standard for the QX SUV and will
be adopted across the full size product line.
Model PFI DI DI-Turbo 1M2C HEV,
BEV, Diesel
Frontier/X-Terra 2.5L I4
4L V6
Titan/ NV Cargo Van 4L V6
5.6L V8
5.6L V-8 5.2L Diesel
Quest 3.5L V6
NV200 Small Van/Taxi 2.0L I4 BEV
Juke/Rogue 2.0/ 2.5L I4 1.6L I4
Pathfinder/Murano/FX 3.5L V6 3.5L V6 2.5L S PFI HEV
Armada/QX 5.6L V8 5.2L Diesel
Est. Market Share (2017-19) 75% 10% 5% 10%

96
The table above summarizes the Nissan’s LDT engine selection for MY2017. With the heavy
emphasis on unibody models with small engines coupled to the CVT as the fuel economy
compliance strategy, Nissan is not pressed to adopt DI in most high volume engines, but will
offer DI for Infiniti models or as higher power option for some Nissan models. The expected LDT
engine mix for the 2017-19 time frame is shown below.
Nissan’s LDT standard is forecast at 30.8mpg while the actual CAFE attained is forecast to be
29.5 mpg, and with use of available FFV credits, it is estimated at 30 mpg. This results in a 0.8
mpg shortfall but Nissan can use credits from LDV over-compliance to cover the shortfall. Our
forecast shows that Nissan will comply with the LDT standards to 2020 as long as the BEV and
diesel share is around 10% . As with other manufacturers, the company will apply for off-cycle
credits by implementing technologies such as LED lights, AC improvements, stop-start and
aerodynamic aids, so that under compliance is minimized. Beyond 2020, the body-on-frame
trucks will have a difficult time complying and aggressive technology introduction will be
required. Beyond 2018, Nissan will also likely use the high CR/ supercharged engine technology
for crossover models. We anticipate that Nissan can comply with 2025 standards if both the
diesel and the BEV models are relatively successful and jointly achieve a 20 to 25% market
share.
7.3.7 HYUNDAI/KIA
Hyundai/Kia has gained substantial market share in the last few years with its redesigned
product lineup. The company is more confident to make bold product moves. Examples include
V6 elimination in the midsize car segment, large content increases for vehicles such as Accent
and Azera, an aggressive powertrain downsizing strategy, and following a unique hybrid
strategy that combines the 1M2C hybrid architecture with the BAS.
Light Duty Vehicles
Similar to Toyota and Honda, Hyundai/Kia will have no issues complying with the LDV CAFE
standards to 2020, particularly with powertrain downsizing, increased footprint and aggressive
weight reduction steps. The strategy is well underway with DI adoption in most engines, 2L T-DI
and 1.6LT-DI introduction and a new variant of Lambda II 3.3L DI V6.Hyundai’s RWD cars are
now equipped with its own 8-speed automatic (Hyundai Powertech). There is some indication
that a 10AT is being developed for RWD models for the post-2017 time frame. Other future
transmissions include a new FWD 8-speed automatic and DCTs (already available in the
Veloster sports car).

97
Aggressive light weighting steps will be implemented with HSS intensive bodies. Some
platforms, however, will counteract the weight reduction by increasing size so overall curb
weight will remain comparable to previous generation products. The next generation Hyundai
models will continue with a common exterior design theme called “Fluidic Sculpture”. As a result
we forecast 8 to 12% reduction of the drag coefficient across the lineup by MY2017.
Hyundai has expanded its RWD luxury segment offerings with the new Genesis Coupe and
Equus launch. Kia is forecast to follow in near term with its own RWD flagship, which will be in
addition to the full size Cadenza FWD model. While we are not forecasting a separate luxury
division by MY2017, it can happen in 7 to 10 years, if the Genesis platform’s relative success
continues. The RWD cars under-comply with their corresponding fuel economy targets but the
sales volume is relative low.
The Sonata/Optima HEVs were Hyundai’s first entry into the electrified product segment. We
forecast that the Santa Fe/Sorento SUV models will also adopt this system in the near term. A
subcompact BEV will be launched for ZEV compliance and most compacts will receive a stop-
start micro-hybrid system. In addition, Hyundai has invested heavily in the fuel cell vehicle and
has already embarked on pilot production of 1000 units of the FCV version of the ix35 crossover
SUV. Press reports indicate that they are planning to start production of a new FCV model in
2016 at a 20,000 unit/year rate, but many are skeptical that such a large market for FCVs exists
globally.
Model PFI DI DI-Turbo 1M2C HEV/BEV
Subcompacts 1.4L I4 BEV
Accent/Rio/Veloster 1.6L I4 1.6L I4
Elantra/Forte 1.8L I4 2L I4 1.6L PFI
Optima/Sonata 2.4L I4 2L I4 2.4L PFI
Azera/Cadenza 3.3L V6
Genesis/Equus 3.8L V6
5L V8
2L I4
3.3L V6
Est. Market Share (2017-19) 20% 60% 15% 5%

98
The Hyundai/Kia car engine mix for MY2017-19 is summarized above. Most engines will adopt
DI as standard while PFI will remain for budget entries and hybrids. HEV/BEV penetration is
estimated to be relatively low since the companies have achieved very large fuel economy
increases using conventional powertrain technology. Hyundai/Kia’s MY2017 CAFE standard is
forecast at 38.7mpg while their actual CAFE attained is estimated to be 42.0mpg. Like
Japanese manufacturers, the company will accumulate a large credit balance for MY2013-2017
timeframe and will further increase the balance by using off-cycle credits and A/C efficiency
improvements.
Light Duty Trucks
Hyundai/Kia LDT strategy going forward will be limited to crossover SUV offerings in each major
high volume segment, while the body-on-frame Veracruz SUV will be eliminated. Both Hyundai
and Kia will maintain 3 crossover SUV models. The long wheelbase Santa Fe will act as the
people mover for Hyundai while the new generation Sedona will serve this purpose for Kia. The
powertrain strategy will follow the LDV strategy described above with heavy emphasis on DI and
T-DI. As of MY2017, only hybrid CUVs are forecast to have a PFI equipped engine. The FCEV
Tucson model will likely emerge in 2015 or 2016 model year but we do not anticipate sales in
excess of a few hundred units per year to 2020 due to hydrogen infrastructure limitations.
Model PFI DI DI-Turbo 1M2C HEV
Soul/Hyundai CUV 1.6L/2L I4
Tucson/Sportage 2L I4 2L I4 FCEV
Santa Fe/Sorento 2.4L I4
3.3L V6
2L I4 2.4L PFI
Sedona 3.3L V6
Est. Market Share (2017-19) 0% 76% 20% 4%
Hyundai/Kia LDT standard is forecast at 32.5mpg while the actual CAFÉ attained is estimated at
36.2mpg. We are not forecasting the FFV-certified engines for MY2014-2017 timeframe. Our
estimates show that all SUV model lines will meet the MY2017 standards and large credit
balances will be generated. Given that Hyundai’s truck market strategy is focused largely on the
unibody SUVs, Hyundai has excellent prospects for complying with the 2025 LDT CAFE
standards with only modest increases in HEV/FCEV penetration.

99
7.3.8 VOLKSWAGEN
VW has aggressive expansion plans dubbed “Strategy 2018” which was first established in
2008 and calls for taking the worldwide lead in sales, exceeding Toyota and GM sales. The key
component of the strategy is a US market share expansion goal to reach 1 million total units per
year by 2018.It appears that VW’s strategy is progressing in that direction and new models such
as the US Passat are selling relatively well. The Passat is now produced in the new
Chattanooga, TN plant which was built to insulate the midsize models from currency swings.
The electrification strategy started with the introduction of the Q5 luxury hybrid and the Jetta
HEV in 2013 . Several BEVs are planned including the e-Golf (MY2014.5) and the Audi E-Tron
line. Eventually, the E-tron line up will have models based on R8, A3, A4 and Q7, in both BEV
and PHEV variants.
Light Duty Vehicles
VW’s LDV strategy is being implemented to better streamline the lower-end offerings and
expand the midsize segment to take advantage of the higher profit margins of larger vehicles.
The footprint-based fuel economy regulations make it useful to upsize the VW/Audi fleet to be
more competitive with other players. The new Beetle is part of the upsizing strategy of VW’s US
products. The New Compact Sedan (NCS) strategy was implemented with the US-spec Jetta,
while the New Midsize Sedan (NMS) was launched with the Passat as a US exclusive.
VW was the original developer of the DI/Turbo strategy and the majority of products offer this
type of engine as the standard engine or optional performance related choice. Only one
naturally aspirated engine line (the 2.5L 5 cylinder PFI engine) remains in the lineup in 2013 and
this engine will be dropped by 2015. The company improved its CAFE position with several high
efficiency engines including the 1.4L T-GDI, 2L T-GDI, 2L diesel and 3L supercharged V6
(Audi). The engines are paired with advanced transmission options: either a compact 6-speed
FWD automatic, or a DCT for VW models, and the 8AT for Audi. By MY2017, all engines will be
converted to second generation (22 bar BMEP) Turbo/DI as standard including the Audi super-
charged 3L V-6 which will adopt twin turbo technology. VW will also offer second generation
diesel engines to replace the current 2L and 3L models but we anticipate that they will remain at
current penetration levels of about 25% in VW car models and 5 to 10% in Audi models. VW
also plans to have a range of hybrid models, and have focused 1M2C technology. Given their
diesel niche, it is unclear if both hybrids and small diesels can co-exist or if one will cannibalize
the other’s sales.

100
Model PFI DI DI-Turbo 1M2C HEV/BEV/Diesel
Beetle/Golf 1.4/2L I4 1.4L DI HEV
2L Diesel
BEV
Jetta/A3 2L I4 1.4/2L I4 2L Diesel
1.4L DI HEV
Passat/A4 2L I4
3L V6
2L DI HEV
2L Diesel
A6/A7/A8 3L V6
4L V8
3L Diesel
Est. Market Share (2017-19) 0% 5% 70% 25%
VW’s 2017 standard is forecast at 39.4mpg while the actual CAFE attained is forecast to be
38.0mpg, which results in under-compliance, primarily due to the large Audi contribution (and
more minor Porsche and Bentley contribution). VW’s Golf and Jetta lines will comply with its
targets to generate offsets. The rest of model lines will be difficult to improve even with
significant diesel penetration of up to 25%. VW/Audi will need additional credits for 2017 and
subsequent model years. It is possible that VW will use FFV credits to close the gap. The most
likely candidate is the 2L TSI engine and VW may use a variable boost strategy to claim high
performance with E85.VW is also planning to utilize BEV production multipliers, A/C
improvement, as well as the off-cycle technologies (such as the stop-start, LED and grille
shutter technologies) to generate about 1mpg to 2mpg additional credits. In addition, its GHG
compliance picture is also more difficult than CAFÉ compliance due to their reliance on diesel.
Light Duty Trucks
VW’s LDT lineup is currently composed only of crossover SUV models derived from their car
platforms, and offer virtually the same engine options. In the near future, Volkswagen Group
plans to expand SUV offerings with two new models: the Audi Q3 for MY2014.5 and a Passat-
based SUV for MY2015. The VW Tiguan will be replaced by a new less expensive CUV for
MY2015 and will grow in size to be more competitive with the Honda CR-V and Toyota RAV4.
Component-level weight reduction will be used to keep the weight under control as the option
selection grows. All engines will feature turbo-charging and DI as standard. Diesel engines will
likely be more popular in SUVs than in cars and we anticipate 30% penetration, but HEV
penetration may be 5% or less.

101
Model PFI DI DI-Turbo 1M2C HEV/ Diesel
Tiguan/Q3 2L I4 2L Diesel
1.4L DI HEV
Mid CUV/Q5 2L I4
3L V6
2L Diesel
2L DI HEV
Touareg/Q7 3L V6
4L V8
3L Diesel
Est. Market Share (2017-19)
0% 0% 65% 35%
VW’s LDT standard is forecast at 31.9mpg while the actual CAFE attained is forecast to be
32.6mpg. VW is planning large diesel LDT penetration so the CAFE compliance should not be
an issue, but meeting GHG standard will require additional credits from off-cycle technologies.
Longer term, VW’s reliance on the efficient diesel engine may put it in a situation where it meets
CAFE standards but has trouble meeting GHG standards. If VW can market both diesel and
HEV models successfully, it will be able to meet 2025 standards for both fuel economy and
GHG emissions.
7.4 FLEET SUMMARY
The detailed analysis shows manufacturers having very different technology plans to 2019 and
being in very different technology positions. The manufacturer fall into three groups: the German
manufacturers, the domestic manufacturers and the Asians. All of their currently known product
plans suggest a clear path for 2020 compliance but different futures for 2025 compliance.
The German manufacturers are very reliant on DI/ Turbo technology as the primary tool for
compliance with VW also reliant on the DCT as the transmission of choice. BMW and Mercedes
will also rely on lean burn to meet standards through 2020, along with the DCT for some
vehicles and 8 to 10 speed automatics for larger models. VW is unique among all manufacturers
in being reliant on diesel penetration levels of 25+% of their passenger car fleet to meet
standards. Our analysis indicates that downsizing and turbo-charging technology face serious
limitations in moving to ever smaller and more highly boosted engines, suggesting a very
difficult path for complying with 2025 standards. The high diesel sales strategy will allow VW to
comply with CAFE standards but it will have a more difficult time with GHG standards.

102
GM and Chrysler will have modest reliance on DI/ Turbo technology and appear to be
examining more pathways to 2025 than the others. GM seems to be reliant on BAS mild hybrid
technology but its relatively small benefit and high cost will likely lead to problems with GM’s
compliance plan in 2020 and beyond. Ford is more aggressively pursuing DI/ Turbo technology
than the other domestic manufacturers though not to the same extent as the Europeans.
Instead, it plans to use full hybrid technology as well as PHEV and BEV technology to meet
standards. In the LDT segment, GM and Chrysler, while facing compliance difficulties as early
as 2017, also have serious issues complying beyond 2020 as large pickups and SUVs are a
large fraction of their sales, and the relatively easy requirements for 2020 for such vehicles are
ended with very stringent requirements for 2025. Ford is in only a slightly easier position, but our
analysis suggests that the domestic manufacturers will be pushing for an easing of the 2025
standards during the mid-term review in 2017-18.
The Asian manufacturers are relying much more on advanced naturally aspirated engines
(some with high CR) and the CVT as their principal choices for cars and crossover SUV models
and appear to be in a strong position for over-complying with standards to 2020 using low cost
technology. In addition, Toyota (and to a lesser extent, Honda and Hyundai) has several
successful hybrid products that provide significant fuel economy credits. Nissan is investing on a
BEV strategy that may not be successful, but this may only affect their credit accumulation for
use in the psot-2020 time frame, as their naturally aspirated engine plus CVT technology attains
very high fuel economy. In the post 2020 time frame, we expect that there will be a transition to
high CR + Miller or Atkinson cycle technology. This may allow manufacturers to meet the 2025
standards with no major reliance on hybrid or PHEV/BEV technology.
Based on a detailed study of market penetration by engine type, we have developed a forecast
for 2020. The forecast assumes that different manufacturers will have near constant market
share over the 2013 – 2020 period although technology market shares do not vary very much if
modest gains by Asian manufacturers are included in the forecast. The only major uncertainty is
V8 diesel introduction that could occur in 2019-20; if this does not happen, diesel penetration in
light trucks will be about 2%.Table 7-4 shows the car engine technology forecast, and we expect
that about one-third of the fleet will use downsized GDI Turbo engines by 2020, while the
different vehicle electrification technologies will claim about 15% market share, almost a
doubling of the current 7.8% market share in cars. However, we do not anticipate substantial
diesel market share in 2020, with only 2% of cars expected to be diesel (which does represent a
near doubling of current market share).

103
CARS 2010 2013 2016 2020
PFI 92 79 65 37
GDI- NA 3 7 10 25
GDI – TURBO 4 12 18 35
GDI –LEAN BURN 0 0 1 3
HIGH CR- MILLER CYCLE 0 0.5 3 6
HIGH CR – HCCI 0 0 0 2
HYBRID 6 6.5 8 10
BAS HYBRID 0.1 0.3 1 2
PHEV 0 0.5 0.8 1.5
BEV 0 0.5 0.7 1.5
DIESEL 0.9 1.1 1.5 2
Table 7-4: Engine Technology Mix (percent) for Cars over Time
While we have identified the High CR- Miller Cycle engine as the principal future Japanese
manufacturer technology direction, the Japanese manufacturers will have no problems
complying with the 2020 CAFE standards with conventional PFI or DI naturally aspirated
engines. Hence, high CR-Miller cycle technology will be introduced in limited quantities before
2020 for manufacturers to gain in-use experience with this technology, but market share will
increase rapidly in the post-2020 time frame to permit compliance with 2025 standards. Of
course, Mazda will be more aggressive in introducing this technology but they have limited
market share in the US (<2%) so that this technology’s overall fleet penetration will be quite low
in 2020.
Light truck engine technology mix is shown in Table 7-5, and the major difference between cars
and light trucks is in the area of hybrid vs. diesel penetration. We anticipate vehicle
electrification will continue to lag in light trucks, with only the small crossovers being offered with
hybrid and PHEV options. The 2020 CAFÉ standard for large light trucks is quite lenient, but the
2025 standards are difficult so that domestic manufacturers (who dominate this segment) may
offer a V8 diesel before the end of the decade. We anticipate that the diesel will be popular in

104
pickup trucks and the large SUV models, so that market share could increase rapidly in the
2018-20 time frame.
LIGHT TRUCKS 2010 2013 2016 2020
PFI 92.5 87 67 39/ 35 with
diesel V8
GDI- NA 5.5 5 10 30
GDI – TURBO 1.7 8 18 20
GDI –LEAN BURN 0 0 2 2
HIGH CR- MILLER CYCLE 0 0.5 1.5 3
HIGH CR – HCCI 0 0 0 1
HYBRID 0.8 1.2 1.5 2.5
BAS HYBRID 0 0 0.5 1
PHEV 0 0 0.8 0.3
BEV 0 0 0.7 0.3
DIESEL 0.3 0.4 1.5 2/ 6 with V8
Table 7-5: Engine Technology Mix (percent) for Light Trucks over Time

105
8. TECHNOLOGY PATH AND COSTS OF
COMPLIANCE WITH STANDARDS
8.1 ANALYSIS METHODOLOGY
As noted in the previous section, different manufacturers follow different strategies and have
different compliance prospects, so that a true picture of the technology path should be
performed at the manufacturer specific level. Section 7 of this report is a manufacturer specific
analysis from which aggregate technology introduction paths to 2020 for the entire new car and
light truck fleet were derived. Developing a path at this level of detail for 2025 is much more
speculative as there are no specific product plans beyond 2019/2020 and manufacturer
strategies can change depending on the actual costs and benefits of advanced technology as
realized in production, as well as the market response to technology. For example, GM seems
committed in the near term to mild (BAS) hybrid technology although our analysis suggests poor
cost-effectiveness and the market response to date has been tepid. In the 2020/2025 time
frame, GM could change this strategy if they arrive at the same conclusion. For this cost and
compliance analysis, we have assumed continuation of existing strategies in 2020 to 2025, so
that Ford and European manufacturers increase turbo/GDI penetration and move to 22 bar
technology, while Japanese manufacturers move to high CR engine technology and employ
HCCI in high end vehicles. We are also aware that Asian manufacturers are in a much easier
compliance position than domestic and EU manufacturers so that they may over-comply, and
we have set fleet-wide targets to be 2 to 3 percent higher than the actual compliance target. We
have also assumed that all manufacturers will utilize the “off-cycle” technology credits and air-
conditioner improvement credits based on actual model year technology usage, to the fullest
extent, and we have accounted for the increase in wheelbases expected as well as the zero
gram per mile assumption for electric vehicles. We do not, however, account for credits banked
from previous years.
The EPA cost estimates are derived at the manufacturer level by their OMEGA model, but their
methodology incorporates a number of unrealistic assumptions. First, it assumes that a
manufacturer’s product line is frozen at the base year line-up, with no new model introductions
or departures, so that their results are comparable to a constant fleet mix analysis starting from
a base year. Second, all manufacturers are expected to follow the same strategy of using the

106
lowest cost technology as determined by EPA, which is using DI/Turbo/ Engine down-size
technology with a dual clutch 8 speed transmission. (The choice of going to higher boost levels
of 24 bar and 27 bar is determined by the level of effort required to meet the target). Third, the
marginal technology for compliance after conventional technology is exhausted is the P2 hybrid
except for Toyota and Ford where the baseline hybrid type is used. Finally, the EPA accounting
for off-cycle credits is not transparent within the OMEGA model and we are not clear to what
extent the different credit types are included (air-conditioning related credits do appear to be
included). EPA staff provided inconsistent answers on the inclusion or exclusion of other credits
in the technology pathway to meet standards.
The Regulatory Impact Analysis (RIA) for the 2017-2025 Standards (jointly issued by EPA and
NHTSA) provides details on technology costs and manufacturer specific and fleet-wide costs
from a 2010 baseline. The average incremental retail price equivalent57 (or RPE) to the
consumer is detailed in the RIA and represents the increase in RPE over the 2016 vehicle since
the rulemaking was for the 2017 to 2025 time frame. Since technology costs vary by year, this is
not the same as subtracting the dollar cost of technology to meet 2016 standards in 2016. The
incremental RPE in 2010$ for cars and trucks are provided in Tables 10-8, 10-9 and 10-10 in
the RIA and are shown below for model years 2020 and 2025
2020 2025
Cars $577 $1675
Light Trucks $398 $2071
Fleet $515 $1807
While these costs are for the fleet average, costs by manufacturer vary significantly as can be
expected. The three domestic manufacturers’ costs are surprisingly close to average for cars,
but Chrysler and GM costs for trucks are about 10% higher than average. Toyota and Honda
compliance costs are lower than average but the luxury car manufacturers and VW have higher
costs, all of which are quite directionally reasonable. The cost includes A/C improvement costs
of $147 in 2020 and $133 in 2025.
57
The Retail Price Equivalent is the expected average retail price impact of adding new
technology to vehicles in a competitive market, and includes all of the overhead costs associated
with improving vehicle technology as well as the supplier cost of the technology to an auto-
manufacturer.

107
8.2 EPA UPDATES TO THE TECHNOLOGY IMPACT ON RETAIL PRICE
Published cost estimates form various organizations for new technology have converged in
most cases over the last 3 years so that most technology cost estimates fall in a relatively
narrow band of +10% from the mean. These differences are similar to the reported differences
between manufacturers due to technology implementation and scale differences. When
EPA/NHTSA first issued its notice of proposed rulemaking, costs and benefits for several
technologies (notably the DI/Turbo engine and the DCT transmission which were used
practically across the board) were out of line with estimates from NAS, industry and our own
estimates. The early estimates by the two agencies were documented in a April 2010 report
entitled “Joint Technical Support Document” (TSD), while others were documented in a
separate September 2010 report entitled “Interim Joint Technical Assessment Report” for Model
year 2017 – 2025 (TAR). In the final rule issued in October 2012, many of the EPA/NHTSA
estimates have moved as follows
- The DI/Turbo costs are similar to other consensus estimates but surprisingly, the
savings from downsizing a V6 engine to a I-4, or a V8 to a V6 has been
significantly underestimated, thereby inflating costs in the cases when downsizing
also involves reducing the cylinder count. The data from EPA implies that a V6
has a retail price increment over a I4 engine of only $250 to 300 while other
estimates are in the $900 to $1000 range.
- Costs for most other engine technologies are close to consensus estimates with
only engine friction reduction (level 2) having a significantly higher cost estimate
at $185 while other estimates are close to $75. This may be a case where the
specific friction reduction technology selected may be unique to EPA’s analysis.
- The costs for the 6-speed and 8-speed DCT relative to a 4 speed conventional
automatic are still listed as negative values, but auto-manufacturers inform us
that suppliers charge a premium of $150 to 200. This may be because of patent
protection and royalty costs (which may not be accounted for in EPA’s analysis),
as well as a limited supplier base for such transmissions.
- Costs for most other transmission technologies are also quite low, at about half of
other estimates or lower. For example, EPA/ NHTSA estimate that a 8-speed
conventional automatic costs only $54 more than a 4-speed unit in 2010, while
estimates from other sources are in the $200 range.
- The agencies have included one vaguely defined technology called ‘aggressive

108
shift logic” which usually implies shifting to a lower gear early, and has included a
very significant benefit of 5 to 7% in fuel consumption for a cost of $31 in 2020,
$27 in 2025. While it is possible to improve fuel economy by downshifting earlier,
this comes at the expense of drivability and vehicle responsiveness. Our own
discussions with the auto-manufacturers suggest that only 1 or 2 % improvement
may be possible but this may be already included in the 2016 baseline.
- Costs of weight reduction are similar to other estimates in the 1 to 10 percent
range although EPA/ NHTSA use a non-linear cost curve, making the estimates
quite sensitive to the percentage weight reduction. A 360 lb. weight reduction
(9%) on a truck is estimated at $190 while 440 lb. weight reduction (11%) is
estimated at $310. Above a 10% weight reduction, the EPA formula may be
overstating costs since costs are approximately proportional to the square of the
percent weight reduction..
- Costs of hybrid technology are somewhat unique to the EPA analysis as EPA
uses the mild hybrid (which is undefined but costs appear similar to the BAS
hybrid) extensively in its projections, but no manufacturer except for GM regards
BAS as a cost-effective technology. The costs for the GM BAS hybrid used by
EPA appear reasonable but the GM system is widely regarded as overdesigned
for the functionality it provides.
The net effect of the new cost estimates is that some cost estimates are still low, but others are
higher than consensus estimates. As a result, there is some reversion to the mean when costs
projections across all technologies from various organizations are examined.
8.3 ESTIMATES OF COMPLIANCE COSTS
The analysis results in this section use incremental technology RPE values that were developed
by us over the last few years and represent consensus estimates from manufacturers and
suppliers. These RPEvalues are documented in Appendix A. As noted, for most technologies,
our estimates are comparable to those developed by EPA, except for the following:
- We have incorporated a cost saving of $700 when downsizing the engine by 2
cylinders, which makes the GDI/Turbo a very inexpensive technology when
accompanied by cylinder count reduction
- We have used industry estimates for costs of transmission technology which are
uniformly higher than the ones assumed by EPA. In addition, we do not include
any additional benefit for ‘aggressive shift logic’

109
- We have added the new high CR/Miller Cycle and High CR/ Lean Burn
technology to the menu and have modeled these technologies as the preferred
pathway for the Japanese manufacturers.
- We do not assume that any manufacturer except GM uses the BAS hybrid
technology and the 2 motor strong hybrid is the hybrid design of choice in the
future. We also account for the small expected increase in plug-in hybrid and
battery electric vehicle sales to 2025.
- For light duty pickup trucks (almost all are large), cargo vans and large SUVs, the
diesel engine is considered to be a more attractive option than a hybrid drivetrain
and we have modeled the diesel as the “marginal technology” for larger trucks.
The analysis uses the same 2010 baseline as EPA so that the characteristics of utility are
maintained at this level, similar to the EPA analysis. The major difference between the two
analyses is the presence of the low cost high CR engine technologies, as well as the advanced
CVT units that is the pathway defined for the Japanese manufacturers.
Table 8-1 shows the technology penetrations, cost and fuel economy gain for the 2016 and
2020 period using the product plan based technology penetration data described in Section 7
for the car fleet. As expected, the product plan technology penetrations allow the fleet fuel
economy to slightly exceed targets for 2016 and 2020. The CAFE target for fuel economy is
37.8 mpg for cars in 2016 and 43.9 mpg in 2020 and the values attained are 38.8 and 44.1 mpg
respectively. The 2020 fleet average is close to the target implying that some manufacturers will
have difficulty in complying and will be using carry-forward credits or paying fines in this case.
Our analysis suggests that of the big 8 manufacturers, GM and Chrysler will have some difficulty
in meeting the car CAFE standard for 2020. Our estimate of the total retail price increase due to
compliance is about $720 over 2016 (i.e., the 2020 estimate of $1356 minus the 2016 value of
$635) which is higher than EPA’s estimate, but consistent with the fact that EPA assumes only a
25% markup from supplier cost to RPE, while our markup is 60%.
A second major finding is that costs of compliance for 2016 are much reduced from our earlier
estimates provided to API in 2009 (Ref.1). The new technology pathways and low cost
transmission improvements now suggest that the 2016 standards for cars will result in a retail
price increase of $635, which is only about half the previous estimate, and even cheaper than
the EPA estimate of about $750. Part of the reduction is associated with the market shifts that
have occurred since 2008, but most of the reduction is associated with significant improvement
in the potential benefits of conventional technology which are available at very low cost. Neither

110
Table 8-1: Product Plan Related Car Fleet Technology Introduction to 2020
the 2016 nor the 2020 standard requires significant increases in hybrid and EV/PHEV market
penetration in cars, and we anticipate that hybrid penetration will increase from about 7% today
to about 12% in 2020.
Table 8-2 provides the same information for the light truck fleet to 2020. The CAFE
requirements for light trucks to 2020 are less stringent than those for cars, which results in a
LDV FC% COST 2010 Mkt 2016Mkt FC% Cost 2020Mkt FC% Cost
ENGINE CYL. COUNT>4 -1 600 30.0 20 0.100 -60.0 15 0.150 -90.0
GDI 3 230 6.7 30 0.699 53.6 60 1.599 122.6
GDI/TURBO 19BAR 6 460 3.9 15 0.666 51.1 25 1.266 97.1
GDI/TURBO 23BAR 9 700 0.1 5 0.441 34.3 10 0.891 69.3
HIGH CR/ MILLLER 6 300 0.0 0 0.000 9.0 6 0.420 18.0
GDI/ TURBO/LEAN 15 1300 0.0 1 0.180 0.0 3 0.540 26.0
HCCI 15 1000 0.0 0 0.000 0.0 2 0.360 20.0
5 AUTO 2.5 50 18.6 13.5 -0.128 -2.6 0 -0.465 -9.3
6 AUTO 4.5 20 30.9 39 0.365 1.6 24 -0.311 -1.4
7 DCT 8 125 3.8 5 0.096 1.5 10 0.496 7.8
9/10 AUTO 8 160 0.0 7 0.560 11.2 20 1.600 32.0
CVT 8 125 14.5 20 0.495 6.9 25 0.945 13.1
TRANS. FRIC 3 30 0.0 55 1.650 16.5 80 2.400 24.0
ENGINE FRIC 1 2 40 0.0 70 1.400 28.0 70 1.400 28.0
ENGINE FRIC 2 4 100 0.0 10 0.400 10.0 30 1.200 30.0
0W-20 0.5 25 5.0 50 0.225 11.3 70 0.325 16.3
0W-16 0.5 30 0.0 0 0.000 0.0 30 0.150 9.0
EPS 2 80 15.0 60 0.900 36.0 80 1.300 52.0
ACC 1 50 15.0 80 0.650 32.5 100 0.850 42.5
WEIGHT 5% 3 30 0.0 60 1.800 18.0 40 1.200 12.0
WEIGHT 10% 6 140 0.0 10 0.600 14.0 50 3.000 70.0
WEIGHT 15% 9 290 0.0 0 0.000 0.0 5 0.450 14.5
DRAG 5% 0.8 15 20.0 80 0.480 9.0 40 0.160 3.0
DRAG 10% 1.5 35 10.0 20 0.150 3.5 40 0.450 10.5
DRAG 20% 2.8 135 0.0 0 0.000 0.0 20 0.560 27.0
RRC 10% 1.8 20 5.0 70 1.170 13.0 60 0.990 11.0
RRC 20% 3.5 45 0.0 10 0.350 4.5 40 1.400 18.0
START STOP 2.5 350 0.0 30 0.750 105.0 50 1.250 175.0
HYBRID 35 3800 6.3 8 0.595 64.6 12 1.995 194.9
PHEV 60 6500 0.0 0.8 0.480 52.0 1.5 0.900 87.8
EV 100 12000 0.0 0.7 0.700 84.0 1.5 1.500 162.0
DIESEL 25 2400 1.0 1.5 0.125 12.0 2 0.250 24.0
BAS 8 1000 0.0 1.5 0.120 15.0 4 0.320 40.0
TOTAL BASE BASE 14.12% 635.4 24.46% 1356.6
MPG 33.3 38.8 44.1

111
lower retail price effect of compliance of $630 more than the 2016 price, which is higher than the
EPA estimate, but still quite low and lower than the car estimate of $720. Costs of 2016
compliance are also substantially lower than our 2009 estimate for API, for much the same
reasons as for cars.
Table 8-2: Product Plan Related Light Truck Fleet Technology Introduction to 2020
Due to the unusual shape of the footprint curves defining the standards which make it easier for
larger trucks to comply, we estimate that GM, Ford and Chrysler will have a relatively easier
time complying with the light truck standard than with the car standard to 2020 and we forecast
LDT FC% COST 2010 Mkt 2016Mkt FC% Cost 2020Mkt FC% Cost
ENGINE CYL. COUNT>4 -1 600 73.0 60 0.130 -78.0 50 0.230 -138.0
GDI 3 360 5.5 30 0.735 72.6 55 1.485 154.2
GDI/TURBO 19BAR 6 535 1.7 10 0.498 44.4 15 0.798 71.2
GDI/TURBO 23BAR 9 780 0.0 3 0.270 23.4 5 0.450 39.0
HIGH CR/ MILLLER 6 450 0.0 2 0.120 9.0 3 0.180 13.5
GDI/ TURBO/LEAN 15 1550 0.0 0 0.000 0.0 2 0.360 31.0
HCCI 15 1400 0.0 0 0.000 0.0 1 0.180 14.0
5 AUTO 2.5 50 26.0 15 -0.275 -5.5 7 -0.475 -9.5
6 AUTO 4.5 20 50.5 60 0.428 1.9 50 -0.023 -0.1
7 DCT 8 125 2.0 5 0.240 3.8 8 0.480 7.5
9/10 AUTO 8 160 0.0 7 0.560 11.2 16 1.280 25.6
CVT 8 125 5.5 10 0.405 5.6 15 0.855 11.9
TRANS. FRIC 3 30 0.0 55 1.650 16.5 80 2.400 24.0
ENGINE FRIC 1 2 60 0.0 70 1.400 42.0 80 1.600 48.0
ENGINE FRIC 2 4 150 0.0 10 0.400 15.0 20 0.800 30.0
0W-20 0.5 40 5.0 50 0.225 18.0 80 0.375 30.0
0W-16 0.5 48 0.0 0 0.000 0.0 10 0.050 4.8
EPS 2 100 10.0 40 0.600 30.0 70 1.200 60.0
ACC 1 60 10.0 80 0.700 42.0 100 0.900 54.0
WEIGHT 5% 3 40 0.0 60 1.800 24.0 45 1.350 18.0
WEIGHT 10% 6 182 0.0 20 1.200 36.4 40 2.400 72.8
WEIGHT 15% 9 375 0.0 0 0.000 0.0 15 1.350 56.3
DRAG 5% 0.8 24 15.0 80 0.520 15.6 50 0.280 8.4
DRAG 10% 1.5 56 0.0 20 0.300 11.2 40 0.600 22.4
DRAG 20% 2.8 210 0.0 0 0.000 0.0 10 0.280 21.0
RRC 10% 1.8 32 5.0 70 1.170 20.8 60 0.990 17.6
RRC 20% 3.5 72 0.0 20 0.700 14.4 40 1.400 28.8
START STOP 2.5 350 0.0 30 0.750 105.0 50 1.250 175.0
HYBRID 35 3500 1.0 2 0.350 35.0 2.5 0.525 47.3
PHEV 60 6500 0.0 0.2 0.120 13.0 0.4 0.240 23.4
EV 100 12000 0.0 0.1 0.100 12.0 0.3 0.300 32.4
DIESEL 25 4200 0.3 1 0.175 29.4 5 1.175 197.4
BAS 8 1200 0.0 1 0.080 12.0 1.5 0.120 18.0
TOTAL BASE BASE 13.58% 580.7 22.55% 1209.7
MPG 24.7 28.58 31.43

112
that they will actually exceed the truck standard and use the excess credits towards satisfying
the car regulations. We also do not anticipate significant hybrid penetration in trucks and
estimate 2020 penetration of about 2.5% up from a little less than 1% today. We do expect
diesel penetration to grow significantly in trucks and estimate that it will reach 5+% in 2020 if
Ford and GM introduce the V8 diesel in large pickups and SUV models.
Table 8-3: “Product Plan” and Compliance Related Car Fleet Technology Introduction to
2025
LDV FC% COST 2010 Mkt 2025Mkt FC% Cost 2025Mkt FC% Cost
Pr. Plan Compliance
ENGINE CYL. COUNT>4 -1 600 30.0 10 0.200 -120.0 5 0.250 -150.0
GDI 3 230 6.7 75 2.049 157.1 75 2.049 157.1
GDI/TURBO 19BAR 6 460 3.9 25 1.266 97.1 20 0.966 74.1
GDI/TURBO 23BAR 9 700 0.1 15 1.341 104.3 15 1.341 104.3
HIGH CR/ MILLLER 6 300 0.0 10 0.700 30.0 15 1.050 45.0
GDI/ TURBO/LEAN 15 1300 0.0 10 1.800 130.0 10 1.800 130.0
HCCI 15 1000 0.0 10 1.800 100.0 15 2.700 150.0
75
5 AUTO 2.5 50 18.6 0 -0.465 -9.3 0 -0.465 -9.3
6 AUTO 4.5 20 30.9 12 -0.851 -3.8 0 -1.391 -6.2
7 DCT 8 125 3.8 10 0.496 7.8 10 0.496 7.8
9/10 AUTO 8 160 0.0 23 1.840 36.8 30 2.400 48.0
CVT 8 125 14.5 30 1.395 19.4 31 1.485 20.6
TRANS. FRIC 3 30 0.0 90 2.700 27.0 100 3.000 30.0
ENGINE FRIC 1 2 40 0.0 50 1.000 20.0 10 0.200 4.0
ENGINE FRIC 2 4 100 0.0 50 2.000 50.0 90 3.600 90.0
0W-20 0.5 25 5.0 50 0.225 11.3 10 0.025 1.3
0W-16 0.5 30 0.0 50 0.250 15.0 90 0.450 27.0
EPS 2 80 15.0 100 1.700 68.0 100 1.700 68.0
ACC 1 50 15.0 100 0.850 42.5 100 0.850 42.5
WEIGHT 5% 3 30 0.0 30 0.900 9.0 5 0.150 1.5
WEIGHT 10% 6 140 0.0 60 3.600 84.0 60 3.600 84.0
WEIGHT 15% 9 290 0.0 10 0.900 29.0 40 3.600 116.0
DRAG 5% 0.8 15 20.0 30 0.080 1.5 5 -0.120 -2.3
DRAG 10% 1.5 35 10.0 30 0.300 7.0 25 0.225 5.3
DRAG 20% 2.8 135 0.0 40 1.120 54.0 70 1.960 94.5
RRC 10% 1.8 20 5.0 30 0.450 5.0 5 0.000 0.0
RRC 20% 3.5 45 0.0 70 2.450 31.5 95 3.325 42.8
START STOP 2.5 350 0.0 70 1.750 245.0 75 1.875 262.5
HYBRID 35 3040 6.3 15 3.045 264.5 18 4.095 355.7
PHEV 60 5200 0.0 2 1.200 104.0 3 1.800 156.0
EV 100 9600 0.0 2 2.000 192.0 2 2.000 192.0
DIESEL 25 2400 1.0 2 0.250 19.2 2 0.250 19.2
BAS 8 800 0.0 4 0.320 40.0 4 0.320 40.0
TOTAL BASE BASE 30.71% 1868.7 35.15% 2201.3
MPG 33.3 48.1 51.4

113
The situation for 2025 is significantly different, as both car and light truck standards increase in
stringency rapidly over the 2021-2025 time frame, although the light truck standards increase at
a faster rate. No product plan exists for the 2025 time frame, but we developed a pseudo-
product plan assuming the same rate of technology introduction as in the 2016 to 2020 time
frame as comparative reference point to gauge the extent of compliance shortfall.
Table 8-3 shows the pseudo-product plan case and “compliance case” for cars in 2025. In this
case, the shortfall in the product-plan case is about 3 mpg or 4.5% in fuel consumption relative
to a 51 mpg target. Hence, the ability to comply with the 2025 standard for cars requires a
somewhat more aggressive technology introduction path than the historical rate (which is
already very aggressive) and a higher market penetration of electrified vehicles.
However, the marginal costs of compliance at $75 per percent reduction in fuel consumption are
not substantially above the $65 in the product plan case, so that 2025 standards may be
attainable with difficulty but not at great expense. The compliance cost is estimated at $2200,
or $1565 over the 2016 value (Our estimate is nearly identical to the EPA estimate of $1540).
The standards also assume that the take rate for hybrids and electrified vehicles increase to
23% of the car fleet or about 3 times today’s penetration, which will be difficult to achieve.
In contrast, the light truck requirements for 2025 appear much more difficult than the car
requirements. The historical pace of technology introduction results in a 8.3% fuel consumption
shortfall and the marginal cost of technology to improve fuel consumption is almost double that
for cars at $135 per percent FC reduction. Compliance can be attained only by significant hybrid
penetration in smaller passenger trucks and by dieselization of larger trucks. The combined
penetration requirements for hybrids and diesels are at 44% of the light truck fleet, and such
high levels required for compliance may be very difficult to achieve. In addition, the use of high
levels of diesel penetration may jeopardize compliance with the GHG regulations since the CO2
reduction with diesels in significantly lower than the volumetric fuel consumption reduction.
Costs of compliance are estimated to increase price by about $3000 relative to the 2010
baseline, or $2400 relative to the 2016 baseline. The estimates are detailed in Table 8-4
The difficulty associated with complying with the 2025 standards that we forecast must be
tempered by the fact that in the last 5 years, the pace of technology development has picked up
considerably and new developments that are yet unforeseen may reduce the compliance
burden significantly.

114
Table 8-4: “Product Plan” and Compliance Related LDT Fleet Technology to 2025
In summary, the analysis of technology compliance and costs show or suggest that
- The 2016 and 2020 standards can be attained at reasonably low RPE (less than $1400)
and does not require significant levels of vehicle electrification or diesel penetration
- The 2025 standards, even with all available credits, will be difficult to attain. The
standards for cars are potentially possible with penetration of hybrid and diesel vehicles
of about 25% but the LDT standards will require hybrid and diesel penetration of 45%.
- The US automakers will likely fight to have the 2025 standards relaxed, especially for
light trucks, when the mid-term review takes place in 2017-18.
LDT FC% COST 2010 Mkt 2025Mkt FC% Cost 2025Mkt FC% Cost
Pr. Plan Compliance
ENGINE CYL. COUNT>4 -1 600 73.0 40 0.330 -198.0 20 0.530 -318.0
GDI 3 360 5.5 60 1.635 160.2 70 1.935 178.2
GDI/TURBO 19BAR 6 535 1.7 20 1.098 97.9 25 1.398 124.7
GDI/TURBO 23BAR 9 780 0.0 10 0.900 78.0 20 1.800 156.0
HIGH CR/ MILLLER 6 450 0.0 20 1.200 90.0 9 0.540 40.5
GDI/ TURBO/LEAN 15 1550 0.0 5 0.900 77.5 0 0.000 0.0
HCCI 15 1400 0.0 5 0.900 70.0 4 0.720 56.0
5 AUTO 2.5 50 26.0 0 -0.650 -13.0 0 -0.650 -13.0
6 AUTO 4.5 20 50.5 36 -0.653 -2.9 0 -2.273 -10.1
7 DCT 8 125 2.0 10 0.640 10.0 14 0.960 15.0
9/10 AUTO 8 160 0.0 35 2.800 56.0 49 3.920 78.4
CVT 8 125 5.5 15 0.855 11.9 15 0.855 11.9
TRANS. FRIC 3 30 0.0 96 2.880 28.8 100 3.000 30.0
ENGINE FRIC 1 2 60 0.0 50 1.000 30.0 10 0.200 6.0
ENGINE FRIC 2 4 150 0.0 50 2.000 75.0 90 3.600 135.0
0W-20 0.5 40 5.0 50 0.225 18.0 20 0.075 6.0
0W-16 0.5 48 0.0 50 0.250 24.0 80 0.400 38.4
EPS 2 100 10.0 90 1.600 80.0 100 1.800 90.0
ACC 1 60 10.0 100 0.900 54.0 100 0.900 54.0
WEIGHT 5% 3 40 0.0 30 0.900 12.0 0 0.000 0.0
WEIGHT 10% 6 182 0.0 60 3.600 109.2 40 2.400 72.8
WEIGHT 15% 9 375 0.0 20 1.800 75.0 60 5.400 225.0
DRAG 5% 0.8 24 15.0 30 0.120 3.6 10 -0.040 -1.2
DRAG 10% 1.5 56 0.0 30 0.450 16.8 30 0.450 16.8
DRAG 20% 2.8 210 0.0 40 1.120 84.0 60 1.680 126.0
RRC 10% 1.8 32 5.0 30 0.450 8.0 10 0.090 1.6
RRC 20% 3.5 72 0.0 70 2.450 50.4 90 3.150 64.8
START STOP 2.5 350 0.0 60 1.500 210.0 76 1.900 266.0
HYBRID 35 3050 1.0 3 0.700 56.0 20 6.650 532.0
PHEV 60 5200 0.0 0.6 0.360 31.2 1 0.600 52.0
EV 100 9600 0.0 0.5 0.500 48.0 1 1.000 96.0
DIESEL 25 4200 0.3 10 2.425 407.4 20 4.925 827.4
BAS 8 960 0.0 2 0.160 24.0 2 0.160 24.0
TOTAL BASE BASE 28.51% 1883.0 36.80% 2982.1
MPG 24.7 34.55 39.08

115
9. EFFECTS OF NEW TECHNOLOGIES ON FUEL
REQUIREMENTS
9.1 OVERVIEW
The effects of the changing engine technologies and the introduction of plug-in hybrids could
affect the requirements for specific fuel properties, and these requirements were explored in
detail through both a literature search and direct meetings with key manufacturers and
suppliers. Of course, auto-manufacturers design new technologies while accounting for existing
fuel specifications, so that any fuel related short-comings are overcome by changes to engine
design and material specifications. Hence, the influences are generally modest and only point to
directional changes in fuel and lubricant specifications that may be advantageous in the future.
As summarized in Section 7, new engine technologies of interest include gasoline direct
injection (GDI), GDI with turbo-charging, high compression ratio, and idle stop. Secondary
impacts may arise from new hybrid and plug-in hybrid types. Impacts investigated include
GDI injector fouling and fuel coking due to higher tip temperature.
Intake valve deposits with GDI
Fuel octane and composition issues with GDI/ Turbo
Fuel Issues with high CR engines
Impact of fuel properties on PM emissions
These issues were discussed with the six auto-manufacturers and one supplier interviewed for
this project. Hence, some of the information presented below is based on information submitted
to us during the interviews, while some of the information discussed during the interviews were
from papers previously published by the staff.
9.2 GASOLINE DIRECT INJECTION
DI injectors are mounted to have the spray tips directly in the combustion chamber, and the
effects that could result from DI are
- Fuel coking in the tip due to higher temperature
- Increased oil dilution due to spray impingement on the wall
- Increased level of intake valve deposits due to lack of fuel wash
- Increased level of particulate matter (PM) emissions
116
During the interviews, manufacturers confirmed that all four issues were problems with first
generation DI engines but have been largely solved with newer systems.
Fuel coking at the tip and higher injector deposits at the tip have been improved by increased
cooling around the injector and by implementing a minimum injection quantity when combustion
chamber temperatures are high. The DI injector tip temperature is highly variable and can be as
high as 140 C, much higher than the 70 to 75 C maximum for injector tip temperatures with
PFI systems. A recent paper by Chevron concludes that tip temperature over 150 C leads to
sharp increases in coking so that the 140 C temperature maximum should not lead to
significant coking. Manufacturers agree that so far, coking has not been a problem in the EU
where DI has been available for over a decade, but Bosch was of the opinion that the European
experience may not translate directly to the US, and specifically mentioned that they had
observed salt deposits in injector tips in US DI engines. Bosch was of the opinion that the
sodium salts were from ethanol in gasoline and Bosch conjectured that the salt may be from the
salt dryers used in ethanol production.
Wall wetting by the fuel spray from DI injectors has been minimized by significant development
in optimizing combustion chamber airflow and injector spray pattern. The use of multi-hole
injectors with pulsed sprays has also contributed to significant reduction in wall wetting. Several
manufacturers acknowledged during the interviews that DI engines do have somewhat higher
levels of oil dilution by fuel but stated that the dilution level between oil changes was still within
specifications and is not an issue of any concern.
Intake valve deposit issues are not yet a major concern as manufacturers are using only
moderate quantities of external EGR and relying more heavily on internal EGR by adjusting cam
timing. Intake valve seals have been improved to reduce oil based deposit formation on intake
valves. However, manufacturers are wary of deposits with high EGR rates such as using cooled
EGR at wide open throttle to increase turbo boost, and feel that both intake deposits and valve
deposits would be an issue. Bosch believed that using a combination of both PFI and DI would
be the ideal technology to reduce intake valve deposits, and this is being used by Toyota in the
Lexus 3.5L V6 engine.
Particulate Matter (PM) emissions from DI engines have become a major issue after early DI
engines were found to have to 5 to 10 times higher PM emissions relative to gasoline PFI

117
engines, which emit less than 2 mg/mi.58 The new Tier 3 emission standards as well as the
California emission standards require meeting a 3 mg/mile PM standard phased in by 2021
while the EU is planning to regulate particulate number to 6 x 10¹¹ per km which is
approximately equivalent in stringency to the US standard. Figure 9-1 shows the relative
emission levels of different engines and the EU standards.
Figure 9-1: PM Emissions of Gasoline Technologies Relative to Standards
Source; Delphi, Ref. 58
Honda has been one of the key proponents of PM control by control of fuel properties. Their
analysis found that the PM emissions from GDI engines were well correlated with the inverse of
vapor pressure at 443 K and this implies control of T90 fraction of gasoline59. The analysis also
found correlation with the double-bond index of the fuel components and Honda developed a
correlation as shown in Figure 9-2 below. The index uses the following formula:
58
Piock, W., et al., Strategies Towards Meeting Future PM Standards in Homogeneous GDI
Engines, (Delphi) SAE paper 2011-01-1212, April, 2011 59
Akawa, K., Sakurai, T., and Jeter, J., Development of a Predictive Model for Gasoline Vehicle
Particulate Emissions, SAE Paper 2010-01-2115, October 2010

118
Figure 9-2 Honda Correlation of Measured PM Concentration to the PM Index
Source: Honda, Ref.59
Honda suggested that available fuels in the market had a 3x variation in PM number emissions.
Other manufacturers support the view that the heavier components have a significant effect on
PM emissions but also believe that this effect can be mitigated by improvements in fuel-air
mixing that can be achieved by using higher injection pressures, multi-hole injectors and
optimized injection for combustion chamber airflow. European manufacturers suggested that on
an approximate basis, 70% of the problem could be solved by engine improvements and 30%
by the fuel. During the interviews, Bosch, Daimler and VW were relatively confident of meeting
the PM standards without a trap on certification fuel. This does suggest that auto-manufacturers
will be pushing for reducing the variability of fuel T90 on in-use fuels in the near future.

119
9.3 TURBO-CHARGED DI ENGINES
Most of the new Turbo-charged engines also incorporate DI so that the CR can be maintained
at about 10 while allowing operation with regular gasoline. As noted in Section 3.3 of this report,
this allows operation at 19 to 20 bar BMEP, while operating at 22 to 23 bar BMEP requires
either a reduction in compression ratio or the use premium gasoline with a RON>95. During our
meeting with their staff, Honda provided an indication of the optimum octane number at different
boost levels for the EPA suggested levels of BMEP as shown in Figure 9-3.
Figure 9-3: Optimum Octane Number vs. Boost Pressure BMEP (bar)
Source: Honda Interview
Although the majority of mass-market vehicles with Turbo/DI engines require only regular fuel,
the experience in the EU suggests that demand for premium fuel will be higher for these
vehicles as consumers perceive an advantage. Manufacturers confirm that the actual HP
increase for a 4 octane point increase in fuel RON is on the order of 2.5% to 3% which should
be barely perceptible to consumers, and suggest that consumer response is more image driven.

120
Some manufacturers (notably Ford and Daimler) are advocating a higher ethanol blend
premium for turbo-DI engines to capture the high latent heat of vaporization of ethanol. These
manufacturers believe that a E25 or E30 blend with 91 RON base gasoline blend stock will
maximize the benefits of RON increase and cooling from evaporation. These manufacturers
also believe that widespread availability of this fuel can allow them to optimize their engines for
this fuel and obtain fuel efficiency benefit of about 8%, thereby almost completely offsetting the
reduced energy content of the fuel. During the interview, other manufacturers were not
supportive of E25, as some want uniform fuel standards rather than new geographical area
specific blends, while Toyota engineers cautioned against other limitations from these blends
such as high speed knock, that could limit boost and fuel efficiency benefit.
Figure 9-4: Toyota Correlation of LSPI Frequency to Auto-Ignition Temperature of
Lubricating Oil
Source: Toyota, Ref. 60
Low speed pre-ignition (LSPI) is a problem with some GDI engines and the pre-ignition does not
occur uniformly on every cycle but more randomly. Toyota’s research indicates that this may be
caused by the ejection of oil droplets into the combustion chamber from crevices60, and they
correlated the frequency of occurrence of low speed pre-ignition with the auto-ignition
temperature of the lubricating oil as shown in Figure 9-4. Other manufacturers are not a sure
60
Takeuchi, T. et al., Investigation of Engine Oil Effect on Abnormal Combustion in
Turbocharged DISI Engines, SAE Paper No. 2012-01-1615, March 2012.

121
that the lubricant oil is the complete explanation for this phenomenon, and some suggest wall
wetting could be an issue. A research project co-sponsored by auto and oil companies is
proceeding at Southwest Research Institute to further study this issue.
9.4 HIGH CR AND HCCI TECHNOLOGY
At present, engines with a CR greater than 12 using a Miller or Atkinson cycle are used by
Toyota and Honda in their hybrid vehicles, while Mazda has introduced a 2L engine with 13CR
on its conventional 323 and CX-5 models. The Toyota and Honda engines use PFI systems and
cooled EGR, while the Mazda system uses DI coupled with efficient exhaust gas scavenging to
minimize knock.
All of these engines are designed for operation with regular gasoline and information provided
by Mazda suggests the response of its engines to higher octane gasoline is similar to that of
conventional engines. There appears to be no special gasoline or lubricant requirements with
this technology. Engines employing cooled EGR require careful thermal management of EGR to
avoid condensates in the intake and EGR cooler. Intake deposits are also an issue which may
be one of the reasons why hybrid models employing cooled EGR also use PFI rather than GDI.
One possible solution to intake valve deposits that can be used in higher end vehicles is a
combined PFI + GDI system, as used in the current Lexus ES350/ GS350 models.
Figure 9-5: Relationship of Ignition Timing to Fuel Octane for HCCI Combustion
(Source: Mazda interview)
Japanese manufacturers, who are the primary developers of high CR technology, do not need
this technology to comply with fuel economy standards to 2020 since their fuel economy levels

122
are already quite high and many lower cost and lower risk technologies are still available in their
portfolio to meet 2020 standards. High CR and HCCI technology appears to be the pathway to
meet 2025 standards at reasonable cost, and we expect only limited market introduction before
2020 by the major manufacturers to gain experience with the in-use performance of this
technology. Mazda will be more aggressive in introducing high CR engines in the near term, but
it has very limited market share in the US of less than 2%.
As noted in Section 3.4, we also expect Mazda to introduce HCCI around 2018 but its effect on
fuel requirements is unclear. Mazda presented data61 showing that fuel octane number had a
positive effect on ignition timing for HCCI combustion when the intake temperature is 200 C but
had almost no effect at 250 C as shown in Figure 9-5. However, it is difficult to interpret the
practical implications for vehicle based operation with HCCI from the figure above, but Mazda
stated that RON would still be an important requirement in the future.
9.5 IDLE STOP AND HYBRID TECHNOLOGY
Idle stop as a stand-alone technology is expected to be used on about 50% of all cars by 2020,
partly driven by the extra off-cycle credits provided for this technology. Hybrid technology
incorporates idle stop as a key element and our forecast is for a fleet-wide penetration of about
7% (more in cars, less in light trucks). The only area of modest concern was for plug-in hybrids,
where the fuel may sit in the tank for months if the car was operated mostly on grid electricity. In
this case, the fuel may be wrong for the season, e.g., a summer fuel in winter leading to difficult
cold start.
In addition, Bosch expressed concern that having fuel in the tank for extended periods would
result in some tank liner materials being dissolved, ultimately leading to injector deposits. In
both these areas, manufacturers have no in-use experience but are monitoring the situation.
Honda presented data suggesting that hybrid and idle stop technologies reduce exhaust gas
temperature as shown in Figure 9-6, leading to less capability for the catalyst to desorb the
sulfur at high temperature transients. This data is used to support the need for a low sulfur
gasoline standard, but it is not clear that this represents actual data or a theoretical expectation,
since engine operating points also change for hybrid vehicles.
61
Yamakawa, Y. A Study on the Relationship Between Fuel Characteristics and Auto-ignition in
a Gasoline HCCI Engine, JSAE Paper 2008

123
Figure 9-6: Honda Representation of HEV/PHEV Catalyst Temperature Relative to
Conventional Vehicle Catalysts Temperature on the US06 Test Cycle
Source: Honda Interview
9.6 OTHER FUEL EFFECTS
Bosch had some concerns regarding the possible use of higher volumetric blends of ethanol in
the future, such as E15 or E25. One concern was with salt impurities in ethanol for injector
deposits. In addition due to the higher GDI injector tip temperature, Bosch was concerned about
the oxidation stability of ethanol blends. According to their data, the current ISO 7536 test
misrepresents the stability of ethanol blends since ethanol oxidation occurs at a different profile
relative to gasoline at lower temperatures. Figure 9-7 explains Bosch’s concerns regarding the
ISO 7536 test where the E10 blend oxygen consumption at the end of the 15 minute induction
period is not strong enough although the pressure drop is more linear with time relative to
gasoline. This may be an issue where API can study the test procedures.

124
Source: Bosch Interview
Figure 9-7: Oxygen Consumption Profile of Fuels in ISO 7536 Test

125
APPENDIX A: TECHNOLOGY COSTS AND BENEFITS FOR A MIDSIZE CAR*
(AT CONSTANT PERFORMANCE)
Technology / Combination Technologies Fuel
Consumption
(%)
Incremental
RPE 2016-25
($)
Spark Ignition Engine Technologies
Variable Valve Lift & Timing – Intake Discrete (DOHC) 6.0 290
Cylinder Deactivation 6.5 200
Stoichiometric Gasoline Direct Injection (DI)- I4 3.0 230
Turbo-charging & engine downsized by 30% (V6 to I4) 7.0 -140
19 bar Turbo-charging, GDI & engine downsized by 30%
(V6 to I4)
9.0 100
Second Generation Turbo-charging (23 bar), DCP, DI, &
engine downsized by 45% (V6 to I4)
12.0 330
14 CR technology 6.0 300
14 CR + HCCI Technology 15.0 1000
Improved Lubricating Oil 5W-20 0.5 40
Engine Friction Reduction (-7.5% Friction Mean
Effective Pressure)
1.3 40
Improved turbo efficiency 1.0 40
Engine Friction Reduction (-15% Friction Mean
Effective Pressure)
2.5 100
Body and Accessories
Weight Reduction by 5% 3.3 30
Weight Reduction by 10% 6.5 140
Weight Reduction by 15% 9.6 290
Rolling Resistance Reduction by 10% 2.2 20
Rolling Resistance Reduction by 20% 4.4 45
Drag Reduction by 10% 1.8 35
Drag Reduction by 20% 3.5 135
Alternator Improvements 0.5 25
Electric water pump 0.5 45

126
Technology / Combination Technologies Fuel
Consumption
(%)
Incremental
RPE 2016-25
($)
Spark Ignition Engine Technologies
Idle Stop (advanced) 2.5 350 (AT)
180 (MT)
Fast engine warm-up 0.5 40
Electric Power Steering 2.0 80
Transmissions (base is 4-speed)
Six Speed Automatic Transmission 4.5 100 (2015)
20 (2020)
9/10 Speed Automatic Transmission 8.0 200 (2015)
125 (2025)
Dual Clutch Transmission (6-speed, wet clutch) 7.0 130 (2015)
65 (2025)
Dual Clutch Transmission (6-speed, dry clutch) 8.0 100 (2015)
50 (2025)
Continuously Variable Transmission 6.5 100
Advanced CVT 8.3 125
Low loss Torque Converter 1.0 20
Fast transmission fluid warm-up 1.0 50
Reduced internal friction loss 3.0 30
Hybrids and EVs
Belt Drive Alternator Starter Hybrid (42V) 8.0 1000
Crankshaft Mounted Motor Hybrid (Integrated Motor
Assist type, motor torque = 0.6 x engine torque)
19.0 1900 (2016)
1600 (2030)
Dual Motor Full Hybrid (motor torque = 1.1engine
torque)
35.0 3800 (2016)
3050 (2030)
Regenerative brake improvements 2030 (IMA/Full) 1.0/2.0 25/50
Battery efficiency improvements 2030 (IMA/Full) 1.0/2.0 25/50
Motor efficiency improvements 2030 (IMA/Full) 1.0/2.0 150/250
Induction Motor (Full) -4.0 -400

127
Technology / Combination Technologies Fuel
Consumption
(%)
Incremental
RPE 2016-25
($)
Advanced Diesels
Diesel V6 Variable Geometry Turbo (LEV 3 compliant) 25 4200
Diesel I4 Variable Geometry Turbo (LEV 3 compliant) 25 2400
Sequential Turbo (LEV 3 compliant) 2016 5
600 V-6
400 I-4
Friction reduction 1 (2016) 1.0 50
Friction reduction 2 (2025) 3.0 120
FI System Improvements 2025 1.0 40
Combustion Improvements 2025 1.0 25
Turbo efficiency improvements 2025 1.0 100
Note: Fuel reductions and costs relative to nominal 2010 baseline vehicle, being a vehicle fitted with a
gasoline engine with fixed valve timing and port-fuel injection, 4-speed automatic transmission,
Cd 0.32 for cars, Cr 0.0085, and all steel body with high-strength low-alloy steel content of
about 40% at BIW stage of manufacture.
Costs for other vehicle size scaled based on weight or cylinder count if approporiate.

128
LIST OF ACRONYMS
1M2C One (electric) Motor Two Clutch hybrid design
A/C Air Conditioner
AMT Automated Manual Transmission
API American Petroleum Institute
AT Automatic transmission, with the number referring to the number of forward gears
BAS Belt Alternator Starter
BEV Battery Electric Vehicle
B-o-F Body on Frame
BMEP Brake Mean Effective Pressure
CAFE Corporate Average Fuel Economy
CARB California Air Resources Board
Cd Coefficient of Drag
CNGV Compressed Natural Gas Vehicle
CO2 Carbon Dioxide
CR Coefficient of Rolling Resistance
CR Compression Ratio
CVA Camless Valve Actuation
CVT Continuously Variable Transmission
CVVL Continuously Variable Valve Lift
DCT Double Clutch Transmission, a type of AMT
DLC Diamond Like Carbon coating
DI Direct Injection
DISI Direct Injection Spark Ignition engine

129
EGR Exhaust gas Recirculation
EIA Energy Information Administration
EPA Environmental Protection Agency
EU European Union
EVCP Electrically operated Variable Cam Phasing
Exx Ethanol Gasoline Blend with xx ethanol volumetric content in percent (e.g. E85)
FE Fuel Economy (miles per gallon)
FCEV Fuel Cell Electric Vehicle
FFV Flex Fuel Vehicle
FTP Federal Test Procedure
FWD Front Wheel Drive
GHG Green House Gas
g/mi grams per mile
HCCI Homogeneous Charge Compression Ignition
HEV Hybrid Electric Vehicle
HDS H-D Systems (report author)
HSS High Strength Steel
HOS Homogenous-Stratified combustion
ICCT International Council for Clean Transportation
IMA Intelligent Motor Assist (Honda name for 1M1C hybrid system)
IMEP Indicated Mean Effective Pressure.
ISO International Standards Organization
LDV Light Duty Vehicle (passenger car)
LDT Light Duty Truck (under 8500 lb. gross vehicle weight)
LEV Low Emission Vehicle (standard)
LSPI Low Speed Pre- Ignition

130
MHI Multi Hole Injector
mpg miles per gallon
MY Model Year
NAS National Academy of Sciences
NEDC New European Driving Cycle
NHTSA National Highway Traffic Safety Administration
NRC National Research Council
PFI Port Fuel Injection
PHEV Plug-in Hybrid Electric Vehicle
PM Particulate Matter
RIA Regulatory Impact Analysis
RWD Rear Wheel Drive
SUV Sport Utility Vehicle
TAR Technical Analysis Report
TFSI VW brand name for boosted direct injection engine
VVL Variable Valve Lift
VVT Variable Valve Timing