future roles of technology in k-12 education …christiannegolesky.com/uploads/dissertation.pdf ·...
TRANSCRIPT

FUTURE ROLES OF TECHNOLOGY IN K-12 EDUCATION IN
CONNECTICUT
CHRISTIANNE CLARK HANES GOLESKY, Ed.D.
M.A., Columbia University, 2006
B.S., Fairfield University, 2003
Mentor
John W. Mulcahy, Ph.D., LL.D.
Readers
George Goens, Ph.D.
Robert Kirschmann, Ph.D.
DISSERTATION
SUBMITTED IN PARTIAL FULFILLMENT OF THE REQUIREMENTS
FOR THE DEGREE OF DOCTOR OF EDUCATION
THE SCHOOL OF EDUCATION
UNIVERSITY OF BRIDGEPORT
CONNECTICUT
December 3, 2010

ii
UNIVERSITY OF BRIDGEPORT
Committee Approval of a Dissertation
Submitted by
Christianne Clark Hanes Golesky
I have read this dissertation and have found it to be of satisfactory quality for a doctoral degree.
_________________________ _____________________________
Date Dr. John W. Mulcahy, Chairperson
Dissertation Committee
I have read this dissertation and have found it to be of satisfactory quality for a doctoral degree.
_________________________ _____________________________
Date Dr. George Goens, Member
Dissertation Committee
I have read this dissertation and have found it to be of satisfactory quality for a doctoral degree.
_________________________ _____________________________
Date Dr. Robert Kirschmann, Member
Dissertation Committee

iii
Abstract
This study investigated the underlying factors that will determine the future roles of
technology in K-12 education in Connecticut. As school districts look towards technology for
answers to budget concerns and rising accountability standards, the way superintendents of
schools in Connecticut define these future roles have many far-reaching implications.
Adopting a modified Delphi technique, this study surveyed Connecticut superintendent‘s
of schools to investigate the future roles of technology in K-12 education. Using an online
survey, respondents expressed their levels of agreement with preference statements relating to
future roles of technology in K-12 education. The superintendents of schools were asked for their
views on applications of technology in education, advantages of technology in education,
disadvantages of technology in application, ways technology will support education, and policy
changes required by future roles of technology in education.
The findings indicated superintendents of schools in Connecticut saw value in redefining
the education process to include technology. While respondents did express interest in creating
virtual schools, they indicated it would not be an advantage to replace teachers with technology.
Advantages included using data to inform and differentiate instruction. However,
superintendents were concerned by the costs of such technologies as well as the quality of online
instruction.
The superintendents expressed great interest in redefining education, but did not see
connections between technology in education and producing good citizens, promoting wisdom,
promoting character development and improving student ethical behavior. However, all
superintendents agreed it will be necessary to change existing policies to fit these new roles of
technology in K-12 education

iv
Acknowledgements
A very wise man, who also happened to be my father, repeatedly asked me, ―How hard
can it be?‖ I would frequently ask him for his advice on whatever endeavor I was interested in
pursuing, and this was his classic response. No matter what the task, he had complete faith in my
abilities and instilled a belief in me of the unlimited possibilities of my potential.
As I pursued my doctoral degree of education at the University of Bridgeport, I was
retracing my father‘s footsteps from over twenty years prior. In the 1980s, Thomas Hanes began
the data center and later served as the Dean of Computing at UB. His love of technology shaped
my own and inspired this research study. I wish he were here to celebrate, but I know he is
looking down on me with a smile.
There are numerous individuals who have contributed their support, time and effort
throughout the completion of this study who have my thanks and gratitude.
To my husband, Jason, I thank you for your unwavering support of me and this goal. You
have always reminded me that without sacrifice, there is no victory.
In my case, it took an entire family to support a doctoral student. I am blessed to have had
my family beside me each step of the way. Without the support and encouragement specifically
from my mother, father, brother, aunt, uncle and grandparents, the directions my career has taken
would not have been possible. You continue to inspire me.
I extend a very special thank you to all the members of my family, my friends and my
colleagues from Fairfield Ludlowe High School. The access to your time, bookshelves and
thoughts made all the difference.
It is with deep appreciation and gratitude that I thank Dr. John W. Mulcahy for his role as
my dissertation committee chair and advisor. His wonderful feedback and insights were
incredibly valuable throughout this process. I would also like to thank Dr. Robert Kirschmann
for his role as a member of my dissertation committee as well as an excellent professor.
I also thank Dr. George Goens for taking on the role of dissertation committee member.
He has continued to shape the path of my research and my career. I will forever remember his
words of wisdom and advice.
I would like to thank the esteemed members of the jury of experts outside of my
committee who assisted the construction of a valid survey instrument used for this study: Dr.
John Tindall-Gibson, Superintendent of Schools, Naugatuck, Connecticut, Dr. Ann Clark,
Superintendent of Schools, Fairfield, Connecticut. Your input was wonderful and I thank you
again for your time.

v
Dedication
To My Father
Thomas Clark Hanes
1952-2008

vi
Table of Contents
Acknowledgments iv
Dedication v
List of Tables ix
List of Figures xi
Chapter
I. INTRODUCTION 1
Statement of the Problem 4
Research Questions 4
Significance of the Study 5
Definition of Terms 5
Limitations of the Study 10
Organization of the Study 10
II. REVIEW OF LITERATURE 12
Theory 12
Technology in Education 16
Technology Policies in Education 28
The Delphi Method 31
Summary 33
III. RESEARCH METHODOLOGY 34
Design of the Study 34
The Population 34
The Materials 38

vii
Demographic Data Sheet 39
Preference Statements 39
Directions 40
The Procedures 40
Development of the Problem 40
Development of the Questionnaire 41
Selection of the Subjects 41
Collection of the Data 42
Statistical Procedure 42
Validity 42
Summary 42
IV. ANALYSIS OF FINDINGS 43
Final Modal Responses 44
Applications 44
Advantages 49
Disadvantages 58
Support Education 77
Policy 89
Summary of Modes 93
Summary of Statements 93
V. CONCLUSIONS AND RECOMMENDATIONS 98
Summary 98
Conclusions 103

viii
Recommendations 105
References 107
Appendices 112
APPENDIX A: Questionnaire 112
APPENDIX B: Jury of Experts 119
APPENDIX C: Email Letter 121
APPENDIX D: Demographic Data Sheet 123
APPENDIX E: Responses by Urban, Suburban and Rural 126
APPENDIX F: Responses by Small, Medium and Large 132
APPENDIX G: Responses by Elementary, K-12 and Regional 138
APPENDIX H: Responses by Years of Experience 143
APPENDIX I: Responses by Gender 149

ix
List of Tables
Table 1: Applications of Technology in Education 47
Table 2: Demographics – Applications 50
Table 3: Advantages of Technology in Education 57
Table 4: Demographics – Advantages 59
Table 5: Disadvantages of Technology in Education 66
Table 6: Demographics – Disadvantages 68
Table 7: Ways Technology Will Support Education 81
Table 8: Demographics – Support Education 83
Table 9: Future Policy Changes 92
Table 10: Demographics – Policy 94
Table 11: Summary of Preferences 95
Table A1: Applications by Urban, Suburban and Rural 127
Table A2: Advantages by Urban, Suburban and Rural 128
Table A3: Disadvantages by Urban, Suburban and Rural 129
Table A4: Support Education by Urban, Suburban and Rural 130
Table A5: Policy Changes by Urban, Suburban and Rural 131
Table A6: Applications by Small, Medium and Large 133
Table A7: Advantages by Small, Medium and Large 134
Table A8: Disadvantages by Small, Medium and Large 135
Table A9: Support Education by Small, Medium and Large 136
Table A10: Policy Changes by Small, Medium and Large 137
Table A11: Applications by Elementary, K-12 and Regional 139

x
Table A12: Advantages by Elementary, K-12 and Regional 140
Table A13: Disadvantages by Elementary, K-12 and Regional 141
Table A14: Support Education by Elementary, K-12 and Regional 142
Table A15: Policy Changes by Elementary, K-12 and Regional 143
Table A16: Applications by Experience 145
Table A17: Advantages by Experience 146
Table A18: Disadvantages by Experience 147
Table A19: Support Education by Experience 148
Table A20: Policy Changes by Experience 149
Table A21: Applications by Gender 151
Table A22: Advantages by Gender 152
Table A23: Disadvantages by Gender 153
Table A24: Support Education by Gender 154
Table A25: Policy Changes by Gender 155
xi
List of Figures
Figure 1: Problem Based Learning 21
Figure 1: Years of Experience 35
Figure 2: Gender 36
Figure 3: District Designation 36
Figure 4: District Enrollment 37
Figure 5: District Type 37
1
Chapter One
Introduction
The infusion of technology has spread to every aspect of daily life. An entire
virtual world exists where individuals can communicate, work, shop, and even learn. The
work environment is no longer confined to a specific building or desk. Individuals can
work from anywhere they can receive a wireless signal to their computer or phone.
Leaving the home to interact with others and secure the essentials of daily living is no
longer necessary. Perched on the verge of obsolescence, land based phone lines are being
replaced with the more advantageous options of cell phones and voice over IP addresses.
While technology innovations have radically reconstructed the faces of business
and culture, K-12 education, as an institution, has remained almost the same (Tapscott,
2008). Some states, such as Michigan and Florida, have embraced educational technology
and are changing the process of education to meet the demands of today‘s society. The
roles of technology have transformed institutions of higher education into global
communities. Technology platforms such as Second Life and iTunes University are now
used worldwide.
Online learning has transitioned from post-secondary use to K-12 education. As
virtual learning becomes available to K-12 schools, the role this technology will take
continues to be defined. Technology can provide many learning opportunities for
students, but what those opportunities should be, and who can provide them, continues to
be a source of contention at the local, state, and national level. While state wide
initiatives in Connecticut have been developed to provide direction for districts,
individual schools continue to develop their own alternatives.

2
Students can find almost anything on the web and center their lives on the
efficient use of technology. Students can text message each other during class and spend
countless hours instant messaging at home, but trying to have a class discussion can be
difficult. However, in many school settings, students are restricted in their technology use
(Tapscott, 2008). They remove their headphones, put away their PDAs, turn off cell
phones, and in some cases even leave their laptops at home. They are transported from
the world of technology, into a barren classroom that is traditionally dependent upon
pencil and paper (Tapscott, 2008).
The model of education calling for memorization and recall has begun to shift
towards constructivism (Prensky, 2001), yet the fundamental aspects of education have
not changed in over two hundred years. Even though learning is taking place in different
ways than in the past, classrooms look very similar to the ones from fifty years ago. The
traditional delivery methods offered by current classrooms limits the learning which can
take place within (Prensky, 2001). While today‘s students are technologically savvy, they
struggle with traditional skills. Future roles of technology should incorporate both
technological and traditional literacy skills.
Educators have spent many years grappling with the roles technology can play in
education. The addition of computers to classrooms was viewed as having several
possible purposes. For some, computers were a way to complete more complex tasks,
create a product, or take the place of the teacher. A more modern interpretation is using
the computer and other educational technologies as instructional tools, instead of
supplemental resources (Moallem, 2008). Technology provides access to education for
those students with disabilities (Jonassen et al. 2003). Specifically, online delivery of

3
instruction allows convenient modification of instruction and materials to meet the needs
of students with special needs (Wiburg & Butler, 2003). Traditional education presents
physical barriers for some students, which prevents them from fully accessing
curriculum. Differentiation of course materials in an online environment is more seamless
and affords greater educational opportunities for those who experience barriers in a
traditional classroom (Moallem, 2008).
There are many models of educational technology use and it has been difficult for
school district‘s to determine which technology to purchase and integrate, as well as the
rationale of the decision (Prensky, 2001). Many decisions regarding policy are made out
of a fear of loss of control. For each possible benefit technology brings to education,
there is always at least one disadvantage. Rather than simply purchasing technology
without having a larger plan, it will be necessary for school districts to be very conscious
of the direction they are choosing to pursue for technology in education. The important
question to ask is not what technologies are available for use in education, but what the
educational needs to be met are and what the vision for education in the future will be
which needs to be determined.
Too often, technology decisions are made without this larger picture being
defined. As the state of Connecticut looks toward increasing graduation requirements and
the future of the virtual learning initiatives, the role of technology are integral to the
shape and definition of these issues.
Consistency is necessary in forming future policies for online learning, in order to
be in line with larger changes in education. In 2008, the CT Virtual Learning Center was
created as a statewide program. The purpose of the CT Virtual Learning Center was to

4
provide districts with online classes as resources for: credit remediation, compensatory
education, enrichment, advanced study, and homebound education (CT State Department
of Education, 2009). Some districts in the state of Connecticut embraced the virtual high
school concept, while others have not. These virtual offerings can serve as supplemental
offerings to school course offerings, yet the issues of funding, support and existing
district policies provide barriers (CT State Department of Education, 2009).
These issues have sparked the question of how do school superintendents view
the role of technology in the future. Education is at a cross roads as districts are faced
with the rising costs of education. Districts have begun looking to technology for
answers. The future roles of technology in K-12 education have many far-reaching
implications for school superintendents regarding policy and practice. This study
investigated the underlying factors that will determine the role of technology in K-12
education in Connecticut in the future.
Statement of the Problem
The purpose of this study was to examine the future roles of technology in K-12
education in Connecticut according to superintendents of schools.
Research Questions
Specifically, this study sought to answer the following:
1. What will be the applications of technology in education?
2. What will be the advantages of technology in education?
3. What will be the disadvantages of technology in education?
4. What ways will technology support education?

5
5. What will be the changes in policies required by technology in education?
Significance of the Study
A study of the future roles of technology in K-12 education in Connecticut is
important to educators in the state making policy decisions. This study provided an
overview of the perception of these future roles according to the current superintendents
of schools within the state of Connecticut. The findings of this study provided a
meaningful context of the contributing factors to form a future picture from the survey
results of the roles of technology in education. These results can structure future
dialogues among educational leaders within the Connecticut Association for Public
School Superintendents (CAPSS) as well as the Connecticut Association of Boards of
Education (CABE). The predicted future roles of technology in education can inform the
CT Distance Learning Consortium and the regional education service centers. The results
of this study are also significant to teacher preparation programs as well as the
Connecticut State Department of Education.
Definition of Terms
Assistive technology. Technologies designed to give assistance with everyday tasks
to individuals with disabilities.
Asynchronous online course. A course delivered online via the Internet using an
online learning platform in which students proceed at different paces. The course
allows for students to enroll at different points throughout the semester. The course
does not incorporate any activities where all students are engaged in an activity at the
same time.

6
Banking education. View of students as receptacles to be filled with knowledge by a
teacher.
Blog. An online journal.
Chat room. A virtual space where two or more individuals can type text to one
another in the form of a ―chat.‖
CIPA. Child Internet Protection Act of 2000.
Class credit. Carnegie units awarded towards completion of graduation credits.
Computer. Originally a person, and later a technological device, which computes
data.
Computer lab. A classroom containing computers where students complete word
processing tasks, Internet searches and create products.
Compensatory education. Education which focuses on basic skills.
Computer network. A group of computers linked together to share resources.
Constructivist learning. Student centered education with teacher acting as a
facilitator.
Connecticut Association of Boards of Education (CABE). Organization of school
board members within the state of Connecticut which offers training and workshops.
Connecticut Association of Public Superintendents of Schools (CAPSS).
Organization for CT public school superintendents which offers training and workshops.
Connecticut Virtual High School. Created in January 2008 by the CT Distance
Learning Consortium as a statewide initiative to provide online opportunities to
Connecticut students. The CT Virtual High School was originally created as a pilot
program where the state offered funding for students to attend.

7
COPA. Child Online Protection Act of 1998.
Course. A course of study as designated by a curriculum document approved by the
district.
Course management software application. An online website designed to host
courses which provide a variety of learning activities. These platforms also serve as
communication tools for the school community.
Course website. A website containing class information, grades, assignments and
supplemental resources.
Curriculum. A document describing course components aligned with state standards.
Credit remediation. The process of taking either the same or an additional course to
gain credits towards graduation.
Data mining. The process of using computer databases to store and analyze student
performance data.
Digital native. An individual who grows up using technology (Presnsky, 2001).
Digital immigrant. An individual who adapts to using technologies either already
developed or those created during their lifetime (Prensky, 2001).
Discussion board/forum. A place online where individuals can post topics and
receive replies from others in the form of a threaded discussion.
Distance learning. When students take a course which is physically being offered at
another location through the use of video or other media.
E-mail. An electronic form of mail correspondence.

8
E-Text. An electronic copy of a print text which can be delivered and accessed over
the internet. E-texts can be read on the computer screen or through a digital text reading
device.
Educational software. Computer software specifically designed for educational
purposes.
Educational technology. Technology used for the purpose of education such as
computers, electronic devices, cameras, LCD projectors and software.
Filter. A set of rules applied to the internet which are put in place for a network to
ensure inappropriate content is not accessed by minors.
Graduation requirements. The number of Carnegie units required by the CT State
Department of Education for a student to graduate from high school.
Hardware. The system components of a computer (DeVeau, 1995).
Homeschooling. When students are educated in the home environment instead of a
public or private school.
Human computer interface. A device, containing a computer, such as a cell phone,
which a human interacts with.
Laptop computer. A portable microcomputer.
Microcomputer. A smaller version of a technological computer able to be purchased
and used by an individual. Microcomputers are commonly referred to as simply
―computers.‖
Multi-media. The use of text, graphics and sound.
New England Association of Schools and Colleges (NEASC). Association sets the
accreditation standards for schools.

9
No Child Left Behind Legislation (NCLB). Legislation from 2002 which requires
integration of technology standards.
Online learning. Learning which occurs while using the internet.
Personal communication device. A device used by individuals for communication,
such as laptop computers, cell phones, smart phones and pagers.
Personal digital assistant (PDA). A PDA is a lightweight electronic device used for
managing contacts, calendars and email.
Podcast. A podcast is an audio recording file posted to the internet.
Problem based learning. Technology integration strategy where students work in
teams to use technology to solve a set problem.
Problem posing education. Education focused on a realistic problem facing students
to make connections between learning and reality.
School day. The length of time students are physically present in the school building.
Superintendent of Schools. The chief executive administrator for a school district.
Synchronous online course. A course delivered online via the internet using an
online learning platform in which students proceed at the same pace. The course
incorporates activities where all students are engaged in an activity at the same time.
The Technology, Education and Copyright Harmonization (TEACH) Act. A law
from 2002 allowing educators to utilize digital copyrighted content for online learning
courses.
Teacher contract. An agreement between an organization of teachers regarding
working conditions and wages and the local board of education.

10
Text messaging. Text sent from one mobile phone to another mobile phone or
multiple phones.
Virtual gaming. The playing of video games online against other players who are
also connected virtually.
Virtual schools. A virtual school is an online learning environment on the internet
which offers courses and functions as an online school community.
Web based communication tools. Tools such as e-mail, discussion forums and blogs
communicate with others through the internet.
Web quests. An online assignment where students are given a task and a set of
instructions to solve their quest using websites.
Wikis. An online database which can be contributed to by many individuals.
Wireless Local Area Network (W-LAN). A computer network of connected
computers which are able to share software and information. This is made available to
users through wireless technology, eliminating the need for cables (DeVeau, 1995).
Limitations of the Study
The limitations of this study included the population of one hundred thirty nine
superintendents of schools and the responding sample of 72, the data gathering sample of
72 and the instrument used. The study was limited to the data analysis plan, the data
gathering plan and the content, construct and face validity of the modified Delphi Method
(Appendix A).
Organization of the Study
This research study was presented in five chapters. Chapter one presented the
introduction to the roles of technology in K-12 education, the statement of the problem,

11
the research questions, the significance of the study, the definition of terms, the
limitations of the study, and the organization of the study. Chapter two presented the
review of the literature on: applications of technology in education, advantages and
disadvantages of technology in education, types of education supported by technology,
educational technology policy, and the Delphi Method. Chapter three presented the
subjects, materials, procedures, and research methodology. Chapter four presented the
analysis of the findings of this research. Chapter five presented the conclusions,
implications and recommendations for future research based upon the findings presented
in chapter four.
12
Chapter Two
Review of Literature
Introduction
The review of literature was divided into four sections. These sections were
theory, technology in education, technology policies in education and the Delphi method.
Theory
During the 1960s, Brazilian educator, Paulo Freire wrote about his experiences
and observations while educating minority workers. Freire‘s works focused on the
changes needed in educational theory. Freire‘s Pedagogy of the Oppressed (1970)
detailed the limitations of educational practice in relation to power and struggles for
freedom. The ―banking‖ concept of education, as described by Freire (1970), has been the
cornerstone of education in the past. In this model, the student is a receptacle which
needs to have knowledge placed inside by teachers. The process of learning was viewed
as a transaction with the teacher being the central holder of currency (Freire, 1970/2000).
As a result, the student was presented with an education that did not hold relevance to
their daily lives. The purpose of education was to change the nature of the student to
become more acceptable to the surrounding society. ―The educated individual is the
adapted person, because she or he is better fit for the world,‖ (Freire, 1970 p. 24). In this
model, the student is not acceptable in their original form and must strive to reach an
ideal set by those with power. Freire (1970) outlined the banking model of education as:
(a) the teacher teaches and the students are taught;
(b) the teacher knows everything and the students know nothing;
(c) the teacher thinks and the students are thought about;
(d) the teacher talks and the students listen — meekly;

13
(e) the teacher disciplines and the students are disciplined;
(f) the teacher chooses and enforces his choice, and the students comply;
(g) the teacher acts and the students have the illusion of acting through the action
of the teacher;
(h) the teacher chooses the program content, and the students (who were not
consulted) adapt to it;
(i) the teacher confuses the authority of knowledge with his or her own
professional authority, which she and he sets in opposition to the freedom of the
students;
(j) the teacher is the Subject of the learning process, while the pupils are mere
objects
(Freire, 1970 p.22)
The banking model of education does not meet the needs of students in achieving
the necessary power to be successful. ―Education must begin with the solution of the
teacher-student contradiction, by reconciling the poles of the contradiction so that both
are simultaneously teachers and students,‖ (Freire, 1970 p.22). These poles refer to the
traditional role of students and teachers under the banking model where teachers hold the
power of knowledge and then through lecture or memorization, impart the knowledge to
the students. This positions teachers and students at opposite poles where neither group
understands the other.
Problem-posing education is offered as the alternative model in which students
are empowered because education begins where the students are, not where they ―should‖
be.―This means, ultimately, that the educator must not be ignorant of, underestimate, or
reject any of the ‗knowledge of the living experience‘ with which educands come to
school.‖ (Freire, 1995 p.47) According to Freire (1995), the current reality perceived by
teachers is not the same reality seen by the students; to them, it is the reality of the past.
(Freire, 1995).

14
Freire was not the first educational theorist to recognize ―interest‖ on the part of
the student as a key component of education. Dewey (1913) emphasized the principle of
interest as central to effective education. ―The genuine principle of interest is the
principle of the recognized identity of the fact to be learned or the action proposed with
the growing self that it lies in the direction of the agent's own growth and is therefore
imperiously demanded if the agent is to be himself,‖ (Dewey, 1913 p.7). The only
safeguard to ensure students use their energies to pursue the mastering of content is to
secure the interest of the student. According to Dewey (1913), discipline was not
successful as a way to approach educational tasks. The unwillingness of the child was a
barrier to learning which could be overcome by securing interest. Freire (1970)
advocated, in extension, for student interest and relativity to the world of the student to be
at the forefront of education.
In 2001, Prensky wrote Digital Natives which gave a new definition of today‘s
student by looking at the context of their surroundings in a digital age. According to
Prensky (2001), these digital natives act, think and learn differently than the students who
came before them and require a different approach to teaching. A digital native is
someone who grew up using technology intuitively and fluently speaks the language of
computers and technology. A digital immigrant is someone who adapted and learned to
use technology at a later point in their life. Prensky (2001) stressed the importance of
being cognizant of these differences in students and teachers to ensure a successful
education process.
In a time of standards based education and increased accountability of schools,
Prensky (2001) called for a new understanding of students and the roles of technology in
15
their education. Through combining the environment of the student as well as the
interests of the students, Prensky (2001) stated, ―Today‘s students are no longer the
people our educational system was designed to teach. It is now clear that as a result of
this ubiquitous environment and the sheer volume of their interaction with it, today‘s
students think and process information fundamentally differently from their
predecessors,‖ (p.1). The technological world of the digital native has changed the way
student‘s learn and process information and must also transform the way education is
delivered (Prensky, 2001). Student achievement will not be impacted by technology
unless teacher practices are fully integrated (Nadolny, 2008).
Gomez (2006) made connections between Freire and these new types of learners.
Digital education or literacy, within the context of Freire's education, refers to
both the recognition of basic knowledge and the learning of information
technology skills, such as the operation of network connected computers and the
critical understanding of reality. Thus, independent from the education or basic
preparation of a person, a critical understanding of the knowledge embedded in
the digital world is indispensable.
(Gomez, 2006 p.54)
The understanding of the digital world discussed by Gomez (2006) changed the
concept of knowledge. Jackson & Davis (2000) have moved away from their previous
recommendation for a core of common knowledge ―because it implies a prescribed, fixed
universe of knowledge, a concept inappropriate for the information age,‖ (p. 31). Aligned
with the pedagogy of Freire, ―teachers must use equitable and excellent instructional
methods that meet students where they are and get the students where the standards say
they should go,‖ (Jackson & Davis, 2000 p.65).

16
Brooks-Young (2006) considered the various reports on the state of schools such
as, A Nation at Risk and What Work Requires of Schools. Brooks-Young (2006) outlined
the necessary shift in educational focus for the twenty-first century. The demands of
society far exceed content literacy and following directions. Instead, students need to be
lifelong learners capable of thinking critically, working in teams, and using technology
(Brooks-Young, 2006).
Technology in Education
While technology is a term used consistently in education today to describe
computers and related applications, technology in education did not begin with the
computer. Jonassen, Howland, Moore & Marra (2003) traced the roots of technology
used in education to 17th
century illustrations in textbooks, later 18th
century uses of slate
chalkboards and 19th
century lantern-slide projectors. The 20th
century saw the
introduction of television and radio programming specifically for education in the 1950s
and 60s. ―The students‘ role was to learn the information presented by the technology,
just as they learned information presented from the teacher,‖ (Jonassen, Howland, Moore
& Marra, 2003 p.10). According to Jonassen et al. (2003), this was the first true type of
educational technology for it was designed specifically to impart learning. Following this
pattern, students were meant to learn from the technology. Willis (2003) discussed the
way each invention of technology was purported to revolutionize education each time,
yet no significant changes were seen. Campbell-Kelly & Aspray (2004) traced this trend
through the evolution of the computer in the last century.
17
The 1890 census was a catalyst for the invention of what are now called
computers. Herman Hollerith invented a machine to mechanically count the census,
instead of having actual individuals work as human computers to tabulate the data.
Utilizing punch cards, this system laid the future foundation for IBM, a computer
company giant of the future (Campbell-Kelly & Aspray, 2004). When computers were
first introduced, these mainframe systems were utilized in similar ways, as a way of
performing mathematical computations (Campbell-Kelly & Aspray, 2004). Technology
in education from the 1940s through the late 1960s involved large systems used to create
computation tables and solve complex mathematical problems. Outside of the university
and government realms, the computer was not accessible to the average person
(Campbell-Kelly & Aspray, 2004).
The role of computers and related technology continued to evolve over time.
During the 1950s, the role of the computer evolved to include data processing in order to
appeal to businesses. Originally a government project for computation, the ENIAC
(electronic numerical integrator and computer) was a prototype for future computer
innovation (Weik, 1961). Many versions of these early computer mainframes were
developed by companies such as IBM, and each successive invention improved on the
shortcomings of the earlier models (Campbell-Kelly & Aspray, 2004). In the area of
software innovation, the RAND Corporation was awarded the contract to write the
software for the SAGE Air Defense Program for the government in 1955 (Campbell-
Kelly & Aspray, 2004).
Computers were first used on a larger scale in education in the late 1950s at the
university level (Moursund, 2003). Students used computers to learn programming

18
languages and punch cards. These first computers were used as data machines. The
computer main frames were enormous in size, difficult to maintain, very costly and
limited to the government and some universities (Wiburg & Butler, 2003). During this
time, university students were able to learn BASIC, instead of the more difficult
FORTRAN computing language used by scientists and engineers, and write their own
programs to solve basic problems (Moursund, 2003). The role of the computer in
education was as a productivity tool. While the possibilities of computing were exciting,
the actual applications were very limited.
These large systems were followed by microcomputers, which were easily
adapted by educators for drill and practice applications (Jonassen et al., 2003). However,
the quality of the software available to educators, as discussed by Campbell-Kelly &
Aspray (2004), was very limited and often of poor quality. Large software companies
were not developing educational software, and much of the education tools available
were created by educators themselves (Campbell-Kelly & Aspray, 2004).
As noted by Jonassen et al. (2003), the use of technology in education followed
traditional patterns of how teachers interacted with students. This was in direct contrast
with the way technology revolutionized the functioning on the American business office
(Campbell-Kelly & Aspray, 2004). When the Industrial Revolution began, America was
mainly an agricultural country and lagged behind the other countries where business had
already been firmly established. As a result, when technology and computing began to
adapt itself to the business consumer, American companies were open to these
innovations, while their overseas counterparts had a more difficult time adapting
(Campbell-Kelly & Aspray, 2004). This comparison can be continued to the roles of

19
technology in education. While the European business models had not been firmly
entrenched in the American culture, making change possible, the traditional system of
education was firmly in place and proved very resistant to change (Campbell-Kelly &
Aspray, 2004). When new technologies became available, the education system sought
ways for the technology to support existing practices, not to replace or change them.
It was not until the microcomputer was specifically marketed to educators that
computers had a presence in K-12 education. ―With the help of two college dropouts,
Steve Jobs and Steve Wozniak, microcomputers also became available to schools and to
teachers and students in the form of the Apple computer,‖ (Wiburg & Butler, 2003 p.9).
Apple recognized several key factors in marketing their computers that other companies
had overlooked. It was essential for the computer to be nicely encased as to appear
unthreatening to users (Campbell-Kelly & Aspray, 2004). Schools and colleges were the
first organizations, beside the government, to purchase personal computers on a large
scale, yet only the computer systems themselves were of great quality (Campbell-Kelly &
Aspray, 2004). The educational software market did not take hold for another decade and
the options for educators were limited in terms of how computers could be used in the
classroom. As more software became available, these technologies were then later
utilized as productivity tools, in addition to their drill and practice roles (Campbell-Kelly
& Aspray, 2004).
Educators began to use technology to complete tasks more efficiently. Computer
assisted instruction in the 1970s was the result of this mindset. Computers were used to
replace the role of the teacher for drill and practice. According to Moursund (2003), the
1970s introduced the microcomputer to schools. One of the main goals for this

20
investment of schools was to make education more affordable. Technology which can
replace or redefine the roles of teachers is often attractive in terms of cost, (Wiburg &
Butler, 2003). ―In 1983, it was estimated that in K-12 education there was approximately
one microcomputer for every 125 students,‖ (Moursund, 2003 p.79).
The first academic program in computing in education at a graduate school of
education was founded by Robert Taylor at Columbia University Teacher‘s College in
1976. Taylor originally worked with Bell Laboratories to learn the SNOBOL
computer language and went on to become one of the leading experts on computing in
education. Taylor was called to testify during a 1983 Congressional hearing by the
House Committee on Science and Technology regarding the future of technology (A
Legacy of Firsts). He testified, ―If introduced appropriately into schools, computing
will transform many aspects of education. In particular, it will increase the role of
graphics, force us to be more aware of the process nature of real learning, and make
formal learning environments more richly interactive than books, lectures and
traditional classes alone can ever be,‖ (US Congressional Hearing, 1983).
Cognitive psychology expanded to include the field of computing in the 1980s.
The area of human computer interface (HCI) design became necessary in designing
technologies. HCI is now integral to the development of educational technologies as the
ways students learn is integral to technology in education (Carroll, 2003). John Black, a
cognitive psychologist, worked with Taylor at Teacher‘s College to further define
computing in education from a cognitive standpoint. Black (2003) noted the importance
of the mental model of a piece of software or hardware as integral to the learning and
productive capabilities of the user.

21
During the 1980s and 1990s, the concept of Problem Based Learning (PBL) was
explored by Taylor & Budin (1992). PBL was an early educational technology strategy
where teams of students could use technology in teams, providing more contact time and
exposure to the technologies for the students with limited machines for use. Figure 1
below details the PBL model according to Moursund (2005).
Taylor and Budin (1992) worked with New York City school teachers to develop
programs using computers to enhance a problem solving approach to education. Their
work resulted in a three stage approach to technology integration. It was first necessary to
train the teachers on technologies which they currently had access to in their homes, then
apply these skills to areas where the technologies could be integrated with the curriculum,
and finally to assist teachers with the actual implementation the program (Taylor &
Budin, 1992). While PBL is still widely used in education today in the form of wikis,
Problem-Solving,
Task-Accomplishing
Team
Tools to extend
mental capabilities.
Tools to extend
physical capabilities.
Formal and informal education and training to build mental and physical capabilities and one‘s
knowledge and skills to effectively use mental and physical tools individually and as a team member.
Figure 1. Problem Based Learning Diagram. Adapted from ―Project-based learning: Using
information technology” (2nd
ed.) by D. Moursund, 2003, p. 5. Copyright 2003 by
International Society for Technology in Education.
Problem Based Learning

22
web quests and virtual gaming, the affordability of technologies has made them more
accessible to students and educators, taking away from the team approach (Moursund,
2005).
Computing in education underwent a radical shift in the mid 1990s with
―inexpensive multimedia computers and the eruption of the Internet,‖ (Jonassen,
Howland, Moore & Marra, 2003 p.10). While the capabilities of the available
technologies changed, the nature of the educational applications did not. ―In its early
days, the Internet allowed users to send and access text documents only. In 1993, the first
widely adopted browser with a graphical interface (Mosaic) was created,‖ (Jonassen et
al., 2003 p.34). As a result of these advances, the numbers of computers in classrooms
grew exponentially and the quality of educational software began to improve (Campbell-
Kelly & Aspray, 2004).
―For more than three decades, the world has witnessed an exponential rate of
growth in the amount of computing power that has been made available…15 years from
now will be 8,000 times the current level [of computing power],‖ (Moursund, 2003 p.80).
―It is not just a shift in how we compute or communicate. Rather, it is a potentially
radical shift in who is in control – of information, experience and resources,‖ (Shapiro,
1999 p. xi). As technologies became more affordable, the access to these technologies
represented a shift in power from large corporations and wealthy individuals to small
businesses and average citizens. Although, a digital divide still exists which must be
addressed (Wiburg & Butler, 2003). ―Technology has transformed nearly every aspect of
our personal and professional lives,‖ (Manternach-Wigans, 1999 p.1). However,
technology is only beginning to transform education (Campbell-Kelly & Aspray, 2004).
23
As educators looked forward to the possible uses for technology in education, amidst
federal encouragement, The International Society for Technology Education established a
set of national standards to be implemented in K-12 education (ISTE). The national
standards are divided into six categories:
1. Basic operations and concepts
2. Social, ethical and human issues
3. Technology productivity tools
4. Technology communication tools
5. Technology research tools
6. Technology problem-solving and decision-making tools
Barron, Orwig, Ivers & Lilavois (2002) stressed the importance of determining
educational goals and objectives first, and then investigating appropriate technologies to
support these goals and objectives.
Jonassen et al. (2003) outlined ways technology supports education. Technology
in education functions as tools to represent student knowledge construction as well as an
information vehicle to explore the applications of this knowledge. Technologies can
provide a context to support constructivist learning where the technology helps form the
initial learning as well as aids in applying new learning. These applications are furthered
with the ability for technologies to provide students with access to social mediums among
knowledge based communities. These applications allow for students to engage
technologies as intellectual partners to support their learning (Jonassen et al., 2003).
―Classroom technologies can best support problem solving by helping learners to access
information, model the problems, and make decisions,‖ (Jonassen et al., 2003 p.12).

24
Brooks-Young (2006) described a world which relies heavily on technology to
convey information. Therefore, the nature of literacy has changed to include visual
literacy, as well as fundamental technology literacy in addition to other content areas.
―Due to the dependency on computers, it has become necessary to prepare children by
integrating this technology into their curriculum,‖ (V. Black, 2006 p.1). The basic
concept of literacy has been altered as a result of the surrounding literacy contexts,
(Gallagher, 2007).
It is not enough to select the appropriate technologies in education, but to ensure
staff are given appropriate professional development for full utilization (Manternach-
Wigans, 1999). Barriers to technology integration are the result of issues with teacher
preparation to fully use such technologies (McRea, 2001). ―New technologies are
constantly emerging that present schools with less expensive opportunities to improve
teaching and learning and assist students in meeting standards,‖ (Fritz, 2005 p.3).
However, Fritz (2005) noted that cost is one of the main barriers to technology in
schools. ―When computers are available, every student should have opportunities to use
technology to support higher-order thinking skills,‖ (Jackson & Davis, 2000 p.86).Wilson
(2007) noted in addition to cost as a barrier, the ability for teachers to integrate
technology is in direct relation to teacher training and professional development.
Technology in education has changed the roles of teachers and administrators revealing
multiple interpretations of their roles (Nguyen, 2007).
―Computer mediated communication tools like email, discussion forums, and chat
rooms available in course web sites make it possible to continue course discussions
beyond the time and space of the classroom,‖ (Kumar, 2007).

25
Online learning, often called distance learning, began as correspondence courses.
Beginning in the 1920s, these courses were offered to adult learners and this format has
evolved to offer opportunities within K-12 education. However, ―full blown distance
learning courses often require a level of self-direction many K-12 students do not yet
possess,‖ (Brooks-Young, 2006). It is possible for distance learning to not utilize
necessary learning and communication features if not designed well. ―Discussion boards
have primarily been used in online courses, where a course management is the sole
means of delivering a course and web-based communication tools are of the main means
of communication between the instructor and student among students,‖ (Kumar, 2007
p.10) While distance learning is attractive in terms of cost and convenience, it is
necessary to ―recognize that schools and teachers (face to face teachers) are truly unique
and necessary intermediaries: they are community anchors,‖ (Shapiro, 1999).
There is a correlation between the rise of homeschooling and the increase in
technology in education. The capacities of these new emerging technologies shared the
power to educate with individuals, as well as schools (Andrade, 2008). The capability for
learning to be increasingly asynchronous adds to this attractiveness (Moursund, 2003).
Asynchronous online learning has drawbacks in terms of limited types of
applications when the feeling of a collaborative classroom community is removed. For
drill and practice applications of technology in education, Turning Points 2000 stated
―this negative relationship between lower order computer activities and academic
achievement has implications for how computers are used in all subject areas.
Apparently, ―kill and drill‖ is still deadly when it comes with bells, whistles, and a

26
flashing cursor,‖ (Turning Points 2000, 2000). These types of applications are only a
small portion of the ways technology is used in schools (Pflaum, 2004).
The kill and drill method of technology use in education is an example of negative
uses of technology in education. Not only how technologies are integrated and utilized
effect learning outcomes, but also the amount of technologies impact student
productivity. While in theory, technology should enhance learning and instruction,
Pflaum (2004) noted the key is in the method of integration. The majority of education
software available for use follows the computer based instruction model where the
computer instructs and the students input answers. However, Pflaum (2004) discussed the
need for computers to move beyond drill and practice and productivity tools.
Jonassen (2003) advocated the applications of technologies in schools should shift
from ―technology as teacher to technology as partner in the learning process.‖ The roles
of technology in schools should not continue to be limited to hardware and software.
Technologies should be used to design environments specifically to enhance learning.
Educational technologies must exist to fill a learning need (Jonassen, 2003).
Technologies which do not fill a learning need can be detrimental. Ophir, Nass &
Wagner (2009) conducted a study at Stanford University which found that students
engaged in heavy media multitasking performed lower on written tasks. Too much
technology can actually create interference in task performance. When multitasking
involves multiple activities which are not related to each other, the result was described
as an environmental distraction created by surrounding technologies (Ophir, Nass &

27
Wagner, 2009). Student texting, and other off task behaviors related to technology, can
actually reduce the capacity for learning.
In addition, Jonassen et al. (2003) acknowledged the lack of traditional
communication cues when using technology. These included: body language, tone, and
other indicators of overall meaning. As technology becomes a primary form of
communication, both within education and in the larger society, this lack of
communication cuing as well as the immediacy of these communications, becomes a
factor. Authors must be mindful of these when communicating using technologies to
ensure correct meaning and interpretation, (Jonassen et al., 2003).
When implemented correctly, educational technologies can have positive benefits
for all students (Barron et al., 2002). Assistive technologies can allow students with
disabilities to have greater access to education (Wiburg & Butler, 2003). ―Technology –
educational, instructional, and assistive – can support students with disabilities in their
efforts to learn information, communicate their knowledge and opinions verbally and in
text, and participate in classroom activities,‖ (Staples & Pittman, 2003 p.103). For
students with disabilities, technology in education does not simply represent a
supplement to their education, in many cases these student use these technologies to
construct meaning, (Staples & Pittman, 2003 p.109). ―Technology offers many
advantages for students with special needs,‖ (Barron et al., 2002 p.6). As noted by
Jackson & Davis (2000), students with special needs often respond more positively to
learning with technology because it is less intimidating to them.

28
As noted by Jonassen et al. (2003), technology in education has the potential to
change education, but only if implemented with fidelity to ensure technologies become
integrated with the learning process, not just productivity tools or to replace the role of
teachers. This integration requires a shift in traditional teaching to redefine the roles of
teacher and student to function within the new digital age (Jonassen et al., 2003).
Technology Policies in Education
The first laws concerning technology policies in education did not emerge until
concerns regarding student use of technologies and the Internet became prevalent. The
Child Internet Protection Act (CIPA) in 2000 was the first law which directly affected the
ways schools dealt with technology access. This law was enacted to require filters on all
school and public computers that could possibly be used by minors to access the Internet,
specifically making this law applicable to both school and public libraries. The law
stipulated those institutions not in compliance by 2001 would not receive federal funding
(Child Internet Protection Act, 2000). In 2003, this law was challenged and heard before
the Supreme Court in the case of UNITED STATES V. AMERICAN LIBRARY ASSN.
after a lower court found the law violated the Constitution and was not a valid exercise of
the spending power of Congress. The Supreme Court found that ―CIPA does not induce
libraries to violate the Constitution, and is a valid exercise of Congress‘ spending power,‖
(United States v. American Library Assn, 2003).
The predecessor to CIPA, the Child Online Protection Act (COPA) from 1998,
gave strict guidelines for business and service providers who granted access to online
material to minors. This is why providers are required to verify age, require login

29
information and to confirm the identity of online users before providing access to any
possible mature content (Child Online Protection Act, 1998). CIPA extended the intent
behind COPA to provide further protection for minors when in a public environment
using a computer.
Another main concern of technology policies in education is the use of personal
communication devices in schools. Prior to the 1990s, the cost of personal
communication devices such as mobile phones and personal computers prohibited this
from being an issue, but as the technologies advanced, they became more affordable and
accessible to students. According to Prensky (2005), today‘s cell phones have the same
technology as the microcomputers from the 1990s, but in a much smaller package. The
percentage of high school students in the United States who own a cellular phone ranges
from 75-100%, however due to school policies, many students are not permitted to use
them for educational purposes (Prensky, 2005).
CT Statute Section 10-223j details state law on student possession and use of
telecommunication devices in schools. The law stipulates students are not permitted to
use pagers in school without express written permission from the principal. However, the
decision regarding cellular telephones and other personal devices is left to each individual
board of education to determine their own policy (Student Possession and Use of
Telecommunication Devices Rule, 1995).
Prior to the events of 9/11, most concerns regarding use of personal technology
devices were regarding academic integrity. After the events of 9/11, the policies of school
districts were also concerned with issues of communication access between students and

30
parents in an emergency situation (Mooney, 2005). Prensky (2005) encouraged educators
to design policies to include these personal technology devices which are second nature
to the digital native generation of students attending school today.
CIPA legislation requires school districts to provide filters for computer use, even
if the computer being used is the personal property of the student. If the student is
accessing the school network, the filter must be in place to ensure students are not
accessing inappropriate content (Jonassen et al., 2003). This presents multiple issues for
school districts to consider regarding appropriate filtering software, distribution,
maintenance and the cost entailed with each factor.
The Technology, Education and Copyright Harmonization (TEACH) Act of 2002
broadened the capabilities of online education by expanding what is considered
acceptable use by educators using technology. The TEACH Act permits educators of
online courses to provide digitized versions of texts and other media for instruction. Prior
to the TEACH Act, educators were limited (by copyright) in terms of what materials
could be digitally presented, altered and stored for educational purposes when such a
version of a work did not already exist. Additionally, the TEACH Act addressed the
issues with student access via the Internet to view course content by requiring password
access and stipulating types of works permitted. This has allowed educators to create the
types of virtual learning environments envisioned by educators such as Taylor during the
1980s. Under the TEACH Act, an educator can create an interactive learning
environment with digitized text and multi-media supplemental materials.

31
School districts were also given direction on roles of technology in education
from other sources. The No Child Left Behind (NCLB) legislation of 2002 also included
provisions for the integration of technology with education. According to NCLB, schools
are required to enhance education through technology by integrating technology with all
curriculum.
The New England Association of Schools and Colleges (NEASC) accreditation
standards also include provisions for roles of technology in education. Standard seven is
titled, ―Library and other Information Resources.‖ K-12 schools and colleges are
evaluated on their ability to demonstrate technology as an integral part of the education
provided. The reports detail for each school the number and types of technologies
available to students and staff, the professional development opportunities provided and
curriculum integration (Library and Other Information Resources).
The Delphi Method
The Delphi method was first developed by Dalkey and Helmer of the Rand
Corporation in California while working with the US Air Force in the early 1950s
(Dalkey & Helmer, 1963). The previously discussed involvement of the RAND
Corporation in creating the software for the SAGE Air Defense Program project led to
the development of The Delphi Technique (Campbell-Kelly & Aspray, 2004). These
government projects were designed to perform calculations involved with refining the
SONAR system to be able to discriminate between moving and stationary objects and
advancing weapon launching capabilities. As a result, it was necessary for those involved
with these projects to communicate, but issues concerning the classified nature of the

32
projects, as well as location of the participants made face to face discussion difficult.
Instead, the Delphi method was used.
This method of research was designed to poll experts in a particular field to
predict future trends (DeVeau, 1995). Helmer and Rescher (1959) describe the Delphi
method as an epistemological approach to the inexact sciences. Helmer (1966) indicated
the Delphi method should be used for groups when forecasting future trends based on
informed decisions. Dalkey (1969) identified three key features of the Delphi method as
―anonymous responses, iteration and controlled feedback, and statistical group response,‖
(p.5). The Delphi method is often associated with technology surveys to reach a group
consensus as the multi-round approach allows experts who have not previously had the
opportunity to dialogue on the topic to do so anonymously and without group persuasion
influences. This method often involves several rounds of interviews to reach consensus
(Helmer, 1966).
Many of the original Delphi questionnaires used by the RAND Corporation
concerned possible future military scenarios and allowed the participants to predict future
roles of the technologies to build a consensus and have only recently become available to
the public after being declassified (RAND Corporation). The precedent for the Delphi
method becoming associated with technology and predicting future trends resulted from
these original questionnaires. These questionnaires presented the scenario at the top of
the page and listed the responses with a rating scale of one to five. This format became
the standard for Delphi questionnaires (Helmer, 1966).

33
Helmer (1966) recommended applying the Delphi method to educational
planning. ―It derives its importance from the realization that projections into the future,
on which public policy decisions must rely, are largely based on the personal
expectations of individuals rather than on predictions derived from a well-established
theory,‖ (Helmer, 1967 p.4).
Summary
The purpose of this study was to investigate and determine, through the use of a
modified Delphi technique, the future roles of technology in K-12 education in
Connecticut. A review of the literature revealed that as technology evolved over time, the
roles of technology in education have continued to evolve as well. The review of
literature concerning educational theory, technology in education and technology policies
in education were explored. The review of the literature revealed limited information
available on the future roles of technology in education, while literature was available on
current uses of technology. The Delphi technique and the procedures for conducting a
modified Delphi study were also investigated in the review of literature.

34
Chapter Three
Methodology
Design of the Study
Using a modified Delphi technique, this study investigated the future roles of
technology in K-12 education in Connecticut. This chapter reported the population of the
study, the materials and procedures used. In addition, this chapter presented the
development of the problem, questionnaire and selection of the data. The discussion
included the modified Delphi technique used for the collection of data, the statistical
procedures used and the face, construct and content validity of the instrument.
The Population
From the universe of educators, the population (N) of this study consisted of 163
Connecticut superintendents of schools. The invited sample (n) consisted of 139
Connecticut superintendents of individual and regional districts but not including regional
service districts. Six districts were not invited to participate due to a vacancy in the
superintendency, or an inability to be contacted by email resulting in the 155
superintendents intended to be invited being reduced to 139.
The superintendents of schools used in this study from the invited sample of 139
(n), consisted of 72 Connecticut K-12 superintendents of schools who responded to the
survey inquiry. These 72 subjects represented the data generating sample, which accounts
for 52% of the 139 from the invited sample.
35
Sample Composition
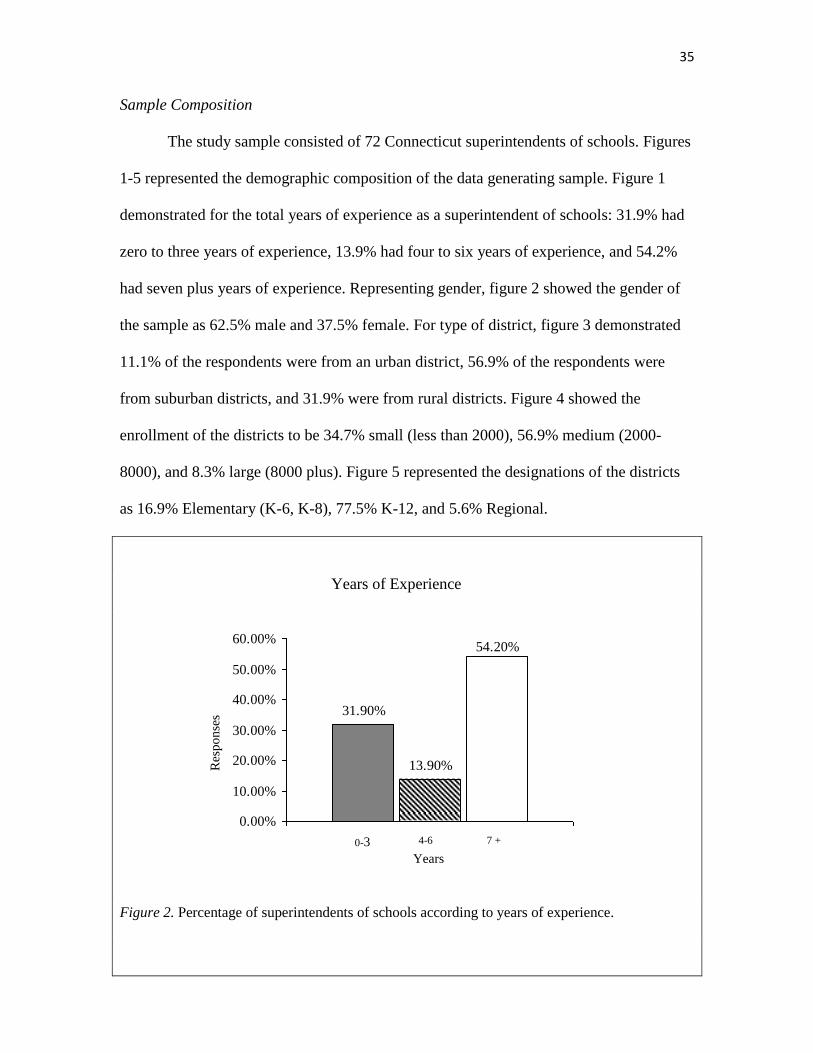
The study sample consisted of 72 Connecticut superintendents of schools. Figures
1-5 represented the demographic composition of the data generating sample. Figure 1
demonstrated for the total years of experience as a superintendent of schools: 31.9% had
zero to three years of experience, 13.9% had four to six years of experience, and 54.2%
had seven plus years of experience. Representing gender, figure 2 showed the gender of
the sample as 62.5% male and 37.5% female. For type of district, figure 3 demonstrated
11.1% of the respondents were from an urban district, 56.9% of the respondents were
from suburban districts, and 31.9% were from rural districts. Figure 4 showed the
enrollment of the districts to be 34.7% small (less than 2000), 56.9% medium (2000-
8000), and 8.3% large (8000 plus). Figure 5 represented the designations of the districts
as 16.9% Elementary (K-6, K-8), 77.5% K-12, and 5.6% Regional.
Years of Experience
31.90%
13.90%
54.20%
0.00%
10.00%
20.00%
30.00%
40.00%
50.00%
60.00%
Figure 2. Percentage of superintendents of schools according to years of experience.
0-3 4-6 7 +
R
esp
on
ses
Years

36
Gender
62.50%
37.50%
0.00%
10.00%
20.00%
30.00%
40.00%
50.00%
60.00%
70.00%
Figure 3. Percentage of superintendents of schools according to gender.
District Designation
11.10%
31.90%
56.90%
0.00%
10.00%
20.00%
30.00%
40.00%
50.00%
60.00%
Figure 4. Percentage of superintendents of schools according to district designation.
Rural
Female
Urban Suburban
Male
R
esp
on
ses
R
esp
on
ses

37
District Enrollment
34.70%
56.90%
8.30%
0.00%
10.00%
20.00%
30.00%
40.00%
50.00%
60.00%
Figure 5. Percentage of superintendents of schools according to district enrollment.
District Type
5.60%
16.90%
77.50%
0.00%
10.00%
20.00%
30.00%
40.00%
50.00%
60.00%
70.00%
80.00%
90.00%
Figure 6. Percentage of superintendents of schools according to district type.
Small
(> 2000) Medium
(2000-8000) Large
(8000 +)
Elementary
(K-6, K-8) K-12 Regional
R
esp
on
ses
R
esp
on
ses
Enrollment

38
The Materials
The data for this research study was collected through a one round modified
Delphi technique questionnaire entitled, ―Future Roles of Technology in K-12 Education
in Connecticut‖ (Appendix A). The questionnaire, developed by the researcher, consisted
of 52 preference statements with five spaces for comments. Face validity, content and
construct validity was affirmed by the jury of experts (Appendix B). The questionnaire
was delivered to the subjects electronically through email with an IP address specific link
to the survey hosted through Survey Monkey. For those subjects whose email addresses
rejected the initial email, a second invitation to participate was sent through email with a
non specific IP address link directly from the email of the researcher. This direct email
was sent to reduce the possibility of the message being blocked as spam.
The questionnaire link emailed to the population with either the IP address specific
link or the non IP address specific link included an introductory letter (Appendix C)
detailing the following four parts:
1. Researcher Information
2. Study Title
3. Purpose of the Study
4. Directions
A modified method of the Delphi technique was selected by the researcher for this
study upon the recommendation of the jury of experts due to the nature of the
population. The Delphi Technique usually consists of a minimum of three rounds of
the questionnaire to reach consensus from the panel (Helmer). The population of

39
superintendents of schools were not available for three rounds of the questionnaire
and the jury of experts recommended a modified Delphi Technique consisting of one
round.
Demographic Data Sheet (Appendix D)
The information requested of all respondents included the following information:
1. District name
2. Designation of school district
3. Total years of experience as a superintendent of schools
4. Gender
Preference Statements
The 52 preference statements included in the questionnaire related to the future roles
of technology in K-12 education in Connecticut. These 52 statements were classified into
five categories:
1. Applications of Technology in Education
2. Advantages of Technology in Education
3. Disadvantages of Technology in Education
4. Ways Education Will Be Supported By Technology
5. Policies for Technology in Education
40
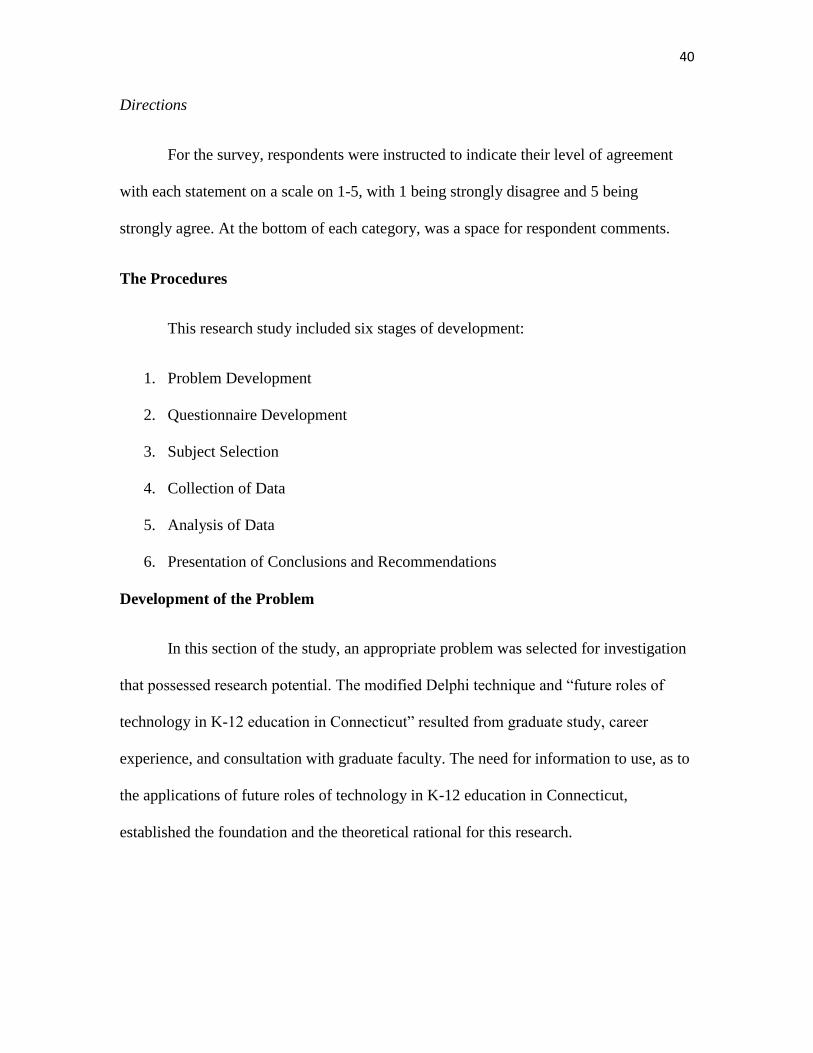
Directions
For the survey, respondents were instructed to indicate their level of agreement
with each statement on a scale on 1-5, with 1 being strongly disagree and 5 being
strongly agree. At the bottom of each category, was a space for respondent comments.
The Procedures
This research study included six stages of development:
1. Problem Development
2. Questionnaire Development
3. Subject Selection
4. Collection of Data
5. Analysis of Data
6. Presentation of Conclusions and Recommendations
Development of the Problem
In this section of the study, an appropriate problem was selected for investigation
that possessed research potential. The modified Delphi technique and ―future roles of
technology in K-12 education in Connecticut‖ resulted from graduate study, career
experience, and consultation with graduate faculty. The need for information to use, as to
the applications of future roles of technology in K-12 education in Connecticut,
established the foundation and the theoretical rational for this research.

41
Development of the Questionnaire
The modified Delphi questionnaire preference statements evolved through review
of the literature pertaining to technology in education. A jury of experts (Appendix B)
was consulted in the formulation of the preference statements. This consultation verified
face, construct and content validity. Following the review of literature, the five categories
were selected: applications of technology in education, advantages of technology in
education, disadvantages of technology in education, ways education will be supported
by technology and policies for technology in education. A total of 52 preference
statements were developed. The following rating scale was used:
1. undecided (value of 5)
2. strongly agree (value of 4)
3. agree (value of 3)
4. disagree (value of 2)
5. strongly disagree (value of 1)
Selection of Subjects
After the population was selected, an email was sent through the survey monkey
collector to the 139 K-12 superintendents of schools in Connecticut asking for their
participation in the study. Those who agreed to participate were directed to an online
survey link to the questionnaire. From the invited sample, 72 (52%) agreed to participate.
These 72 Connecticut K-12 superintendents of schools made up the data generating
sample for this study.

42
Collection of Data
The questionnaire was emailed as a clickable link to the invited population once. The
respondents were sent:
1. A letter from the researcher
2. A link to the online survey
Statistical Procedure
The data from the one round modified Delphi survey were analyzed using the
descriptive statistics - measurements of central tendency.
Validity
Consultation with a jury of experts regarding the development of the research
questions verified the content and face validity of the instrument. Content and construct
validity were ensured by the panel of experts and questionnaire design.
Summary
The modified Delphi technique was used in this research study to survey
Connecticut K-12 superintendents of schools. The Delphi technique was used as the
primary research format. A modified Delphi technique format was used to gather
responses due to the unique nature of the population. Respondents were asked to
participate in one round of the questionnaire. The population (N) of this study consisted
of 139 Connecticut superintendents of schools, with a data generating sample of 72,
which is 52% of the invited sample. The findings of this research undertaking were
presented in chapter four.

43
Chapter Four
Findings
This study investigated and determined, through a modified Delphi technique, the
future roles of technology in K-12 education in Connecticut. The research problem
addressed was whether K-12 education in Connecticut had a clear, cohesive direction
defined for future technology roles in education. This study was intended to provide an
overview of the perception of these future roles according to the current superintendents
of schools within the state of Connecticut. The findings of this study provided the
contributing factors to form a future picture from the survey results of the roles of
technology in education. These results can structure future dialogues among educational
leaders within Connecticut.
The purpose of this chapter was to present the findings of this modified Delphi
study. These findings were presented in the following categories in tables 2-31.
The findings of this modified Delphi study were divided into the following five
categories:
1. Applications of Technology in Education
2. Advantages of Technology in Education
3. Disadvantages of Technology in Education
4. Ways Education Will Be Supported By Technology
5. Policies for Technology in Education

44
Final Modal Responses
The following value scale was utilized in determining the degree of agreement or
disagreement Connecticut superintendents perceived for the future roles of technology in
K-12 education:
1. strongly disagree (value of 1)
2. disagree (value of 2)
3. agree (value of 3)
4. strongly agree (value of 4)
5. undecided (value of 5)
Applications of Technology in Education
The various types of applications of technology in education were the first
scenarios to be investigated, using the modified Delphi questionnaire developed by this
researcher (Appendix A). Ten preference statements were rated. Table 2 presented the
modal scores relating to the category of future applications of technology in education.
The first preference statement measured the degree to which superintendents of
schools believed a future application of technology in education would be a reduced
number of teachers. Table 1 presented the modal response of 2 (44.4%) for the first
preference statement, indicating the superintendents of schools disagreed that future
applications of technology in education would result in a reduction in the number of
teachers.

45
The second preference statement examined the degree to which superintendents of
schools agreed a future application of technology in education would be to supplement
traditional classroom teaching methods. Table 1 presented the modal response of 4
(58.3%) for the second preference statement. This indicated the superintendents of
schools strongly agreed that future applications of technology in education would include
supplementing traditional classroom teaching methods.
The third preference statement evaluated the degree to which superintendents of
schools agreed a future application of technology in education would be the creation of
virtual schools. Table 1 presented the modal response of 4 (40.3%) for the third
preference statement. This indicated the superintendents of schools strongly agreed that
future applications of technology in education would include the creation of virtual
schools.
The fourth preference statement measured the degree to which superintendents of
schools agreed a future application of technology in education would include a reduction
of hours students are physically in school. Table 1 presented the modal response of 3
(38.9%) for the fourth preference statement. This indicated the superintendents of schools
agreed that future applications of technology in education would include a reduction of
hours students are physically in school.
The fifth preference statement investigated the degree to which superintendents of
schools agreed a future application of technology in education would include online
classes offered by districts in addition to traditional classes. Table 1 presented the modal
response of 4 (58.3%) for the fifth preference statement. This indicated the

46
superintendents of schools strongly agreed that future applications of technology in
education would include online classes offered by districts in addition to traditional
classes.
The sixth preference statement evaluated the degree to which superintendents of
schools agreed a future application of technology in education would include a
restructured school schedule. Table 1 presented the modal response of 3 (47.2%) for the
sixth preference statement. This indicated the superintendents of schools agreed that
future applications of technology in education would include a restructured school
schedule.
The seventh preference statement measured the degree to which superintendents
of schools agreed a future application of technology in education would include
restructured school calendar. Table 1 presented the modal response of 3 (38.9%) for the
seventh preference statement. This indicated the superintendents of schools agreed that
future applications of technology in education would include a restructured school
calendar.
The eighth preference statement measured the degree to which superintendents of
schools agreed a future application of technology in education would be a redefined role
of teachers. Table 1 presented the modal response of 3 (48.6%) for the eighth preference
statement. This indicated the superintendents of schools agreed that future applications of
technology in education would include a redefined role of teachers.
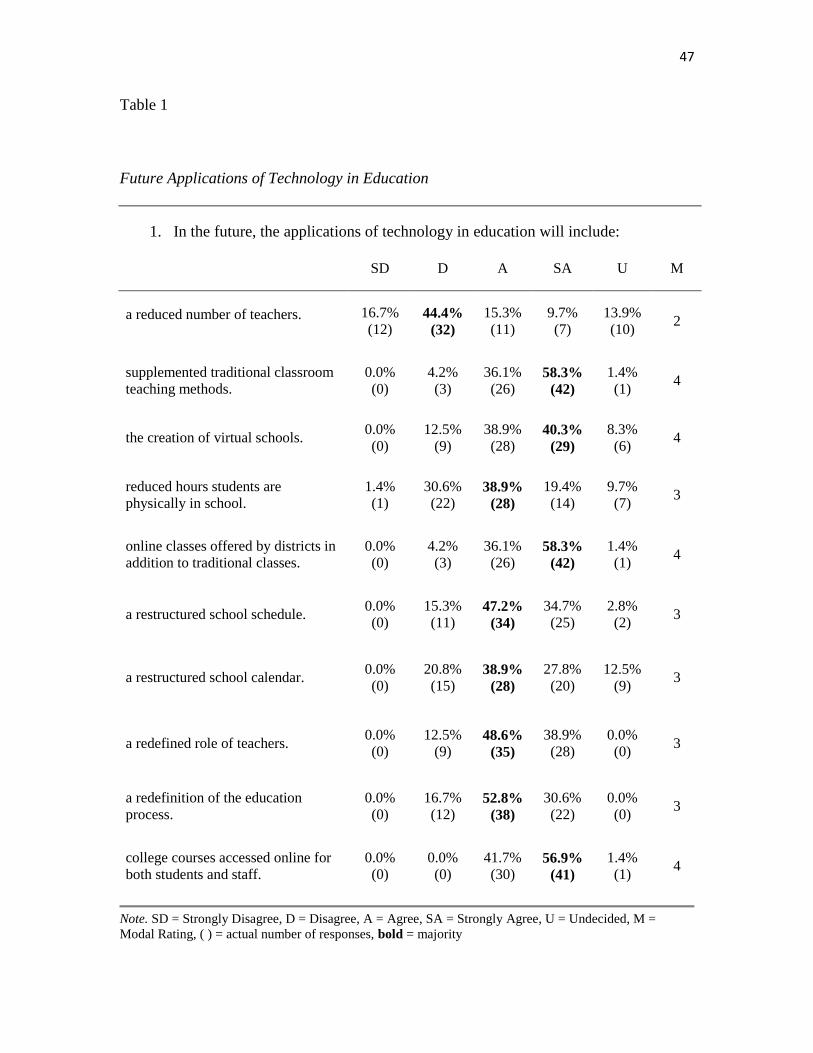
47
Table 1
Future Applications of Technology in Education
1. In the future, the applications of technology in education will include:
SD D A SA U M
a reduced number of teachers. 16.7%
(12) 44.4%
(32)
15.3%
(11)
9.7%
(7)
13.9%
(10) 2
supplemented traditional classroom
teaching methods.
0.0%
(0)
4.2%
(3)
36.1%
(26) 58.3%
(42)
1.4%
(1) 4
the creation of virtual schools. 0.0%
(0)
12.5%
(9)
38.9%
(28) 40.3%
(29)
8.3%
(6) 4
reduced hours students are
physically in school.
1.4%
(1)
30.6%
(22) 38.9%
(28)
19.4%
(14)
9.7%
(7) 3
online classes offered by districts in
addition to traditional classes.
0.0%
(0)
4.2%
(3)
36.1%
(26) 58.3%
(42)
1.4%
(1) 4
a restructured school schedule. 0.0%
(0)
15.3%
(11) 47.2%
(34)
34.7%
(25)
2.8%
(2) 3
a restructured school calendar. 0.0%
(0)
20.8%
(15) 38.9%
(28)
27.8%
(20)
12.5%
(9) 3
a redefined role of teachers. 0.0%
(0)
12.5%
(9) 48.6%
(35)
38.9%
(28)
0.0%
(0) 3
a redefinition of the education
process.
0.0%
(0)
16.7%
(12) 52.8%
(38)
30.6%
(22)
0.0%
(0) 3
college courses accessed online for
both students and staff.
0.0%
(0)
0.0%
(0)
41.7%
(30) 56.9%
(41)
1.4%
(1) 4
Note. SD = Strongly Disagree, D = Disagree, A = Agree, SA = Strongly Agree, U = Undecided, M =
Modal Rating, ( ) = actual number of responses, bold = majority

48
The ninth preference statement measured the degree to which superintendents of
schools agreed a future application of technology in education would be a redefinition of
the education process. Table 1 presented the modal response of 3 (52.8%) for the ninth
preference statement. This indicated the superintendents of schools agreed that future
applications of technology in education would include a redefinition of the education
process.
The tenth preference statement measured the degree to which superintendents of
schools agreed a future application of technology in education would include college
courses accessed online for both students and staff. Table 1 presented the modal response
of 4 (56.9%) for the tenth preference statement. This indicated the superintendents of
schools strongly agreed that future applications of technology in education would include
college courses accessed online for both students and staff.
Demographic Groups
When the responses were sorted according to demographic information and
categorized as strongly disagree/disagree and agree/strongly agree, the group modal
responses for five of the preference statements did not show complete agreement, as
shown in Table 2. The complete responses according to demographic groups was shown
in Appendices E-I. For the first preference statement, the group which did not fall into the
category of disagree was from the regional school districts. Of the four respondents in the
group, one disagreed, one agreed, one strongly agreed and one was undecided.
For the second preference statement, all of the group modal responses fell into the
category of agree and strongly agree. The only two groups who did not have a modal
response of strongly agree were urban and large district superintendents. The response of

49
these two groups was agree. For the third preference statement, Elementary district
superintendents had a split modal response of disagree and strongly agree in comparison
to the overall modal responses of agree/strongly agree.
For the fourth preference statement, group modal responses were split between
disagree and agree/strongly agree with the exception of the groups representing
superintendent years of experience in the agree category.
For the seventh preference statement, the group modal response which did not fall
into the category of agree/strongly agree was urban superintendents. The urban
superintendent modal response was split between disagree, agree, strongly agree and
undecided.
For the eighth preference statement, the group modal responses of urban, large
and elementary superintendents did not fall into the category of agree/strongly agree.
Advantages of Technology in Education
The future advantages of technology in education were the second scenarios to be
investigated, using the modified Delphi questionnaire developed by this researcher
(Appendix A). Nine preference statements were rated. Table 3 presented the modal scores
relating to the category of advantages of technology in education.
The first preference statement measured the degree to which superintendents of
schools believed a future advantage of technology in education would be increased parent
communication. Table 3 presented the modal response of 4 (68.1%) for the first
preference statement. This indicated the superintendents of schools strongly agreed that a

50
Table 2
Demographic Groups - Applications
Applications – Preference Statement One
In the future, the applications of technology in education will include a reduced number of
teachers.
Strongly Disagree / Disagree
Agree / Strongly Agree
Undecided Group Response
12.5% (1) 50.0% (4) 25.0% (2) 12.5% (1) 0.0% (0) Urban 8
17.1% (7) 51.2% (21) 12.2% (5) 7.3% (3) 12.2% (5) Suburban 41
17.4% (4) 30.4% (7) 17.4% (4) 13.0% (3) 21.7% (5) Rural 23
20.0% (5) 36.0% (9) 20.0% (5) 8.0% (2) 16.0% (4) Small 25
14.6% (6) 46.3% (19) 14.6% (6) 9.8% (4) 14.6% (6) Medium 41
16.7% (1) 66.7% (4) 0.0% (0) 16.7% (1) 0.0% (0) Large 6
16.7% (2) 50.0% (6) 16.7% (2) 0.0% (0) 16.7% (2) Elementary 12
18.2% (10) 45.5% (25) 14.5% (8) 9.1% (5) 12.7% (7) K-12 55
0.0% (0) 25.0% (1) 25.0% (1) 25.0% (1) 25.0% (1) Regional 4
17.4% (4) 39.1% (9) 13.0% (3) 8.7% (2) 21.7% (5) 0-3 23
10.0% (1) 70.0% (7) 0.0% (0) 10.0% (1) 10.0% (1) 4-6 10
17.9% (7) 41.0% (16) 20.5% (8) 10.3% (4) 10.3% (4) 7 + 39
20.0% (9) 44.4% (20) 15.6% (7) 6.7% (3) 13.3% (6) Male 45
11.1% (3) 44.4% (12) 14.8% (4) 14.8% (4) 14.8% (4) Female 27

51
Table 2 (continued)
Applications – Preference Statement Three
In the future, the applications of technology in education will include the creation of virtual
schools.
Strongly Disagree / Disagree
Agree / Strongly Agree
Undecided Group Response
0.0% (0) 0.0% (0) 25.0% (2) 62.5% (5) 12.5% (1) Urban 8
0.0% (0) 12.2% (5) 46.3%(19) 36.6%(15) 4.9% (2) Suburban 41
0.0% (0) 17.4% (4) 30.4% (7) 39.1% (9) 13.0% (3) Rural 23
0.0% (0) 16.0% (4) 32.0% (8) 36.0% (9) 16.0% (4) Small 25
0.0% (0) 12.2% (5) 41.5%(17) 41.5%(17) 4.9% (2) Medium 41
0.0% (0) 0.0% (0) 50.0% (3) 50.0% (3) 0.0% (0) Large 6
0.0% (0) 33.3% (4) 16.7% (2) 33.3% (4) 16.7% (2) Elementary 12
0.0% (0) 9.1% (5) 41.8%(23) 41.8%(23) 7.3% (4) K-12 55
0.0% (0) 0.0% (0) 75.0% (3) 25.0% (1) 0.0% (0) Regional 4
0.0% (0) 8.7% (2) 39.1% (9) 43.5%(10) 8.7% (2) 0-3 23
0.0% (0) 10.0% (1) 40.0% (4) 30.0% (3) 20.0% (2) 4-6 10
0.0% (0) 15.4% (6) 38.5%(15) 41.0%(16) 5.1% (2) 7 + 39
0.0% (0) 17.8% (8) 33.3%(15) 42.2%(19) 6.7% (3) Male 45
0.0% (0) 3.7% (1) 48.1%(13) 37.0%(10) 11.1% (3) Female 27

52
Table 2 (continued)
Applications – Preference Statement Four
In the future, the applications of technology in education will include reduced hours students are in
school.
Strongly Disagree / Disagree
Agree / Strongly Agree
Undecided Group Response
0.0% (0) 37.5% (3) 25.0% (2) 37.5% (3) 0.0% (0) Urban 8
2.4% (1) 34.1% (14) 34.1%(14) 19.5% (8) 9.8% (4) Suburban 41
0.0% (0) 21.7% (5) 52.2%(12) 13.0% (3) 13.0% (3) Rural 23
0.0% (0) 36.0% (9) 36.0% (9) 12.0% (3) 16.0% (4) Small 25
2.4% (1) 26.8% (11) 43.9%(18) 19.5% (8) 7.3% (3) Medium 41
0.0% (0) 33.3% (2) 16.7% (1) 50.0% (3) 0.0% (0) Large 6
0.0% (0) 33.3% (4) 33.3% (4) 8.3% (1) 25.0% (3) Elementary 12
1.8% (1) 29.1% (16) 41.8%(23) 20.0%(11) 7.3% (4) K-12 55
0.0% (0) 50.0% (2) 25.0% (1) 25.0% (1) 0.0% (0) Regional 4
4.3% (1) 26.1% (6) 39.1% (9) 21.7% (5) 8.7% (2) 0-3 23
0.0% (0) 30.0% (3) 40.0% (4) 0.0% (0) 30.0% (3) 4-6 10
0.0% (0) 33.3% (13) 38.5%(15) 23.1% (9) 5.1% (2) 7 + 39
0.0% (0) 35.6% (16) 33.3%(15) 24.4%(11) 6.7% (3) Male 45
3.7% (1) 22.2% (6) 48.1%(13) 11.1% (3) 14.8% (4) Female 27

53
Table 2 (continued)
Applications – Preference Statement Seven
In the future, the applications of technology in education will include a restructured school calendar.
Strongly Disagree / Disagree
Agree / Strongly Agree
Undecided Group Response
0.0% (0) 25.0% (2) 25.0% (2) 25.0% (2) 25.0% (2) Urban 8
0.0% (0) 22.0% (9) 46.3%(19) 22.0% (9) 9.8% (4) Suburban 41
0.0% (0) 17.4% (4) 30.4% (7) 39.1% (9) 13.0% (3) Rural 23
0.0% (0) 20.0% (5) 48.0%(12) 20.0% (5) 12.0% (3) Small 25
0.0% (0) 24.4% (10) 29.3%(12) 31.7%(13) 14.6% (6) Medium 41
0.0% (0) 0.0% (0) 66.7% (4) 33.3% (2) 0.0% (0) Large 6
0.0% (0) 25.0% (3) 50.0% (6) 25.0% (3) 0.0% (0) Elementary 12
0.0% (0) 12.7% (7) 47.3%(26) 36.4%(20) 3.6% (2) K-12 55
0.0% (0) 25.0% (1) 50.0% (2) 25.0% (1) 0.0% (0) Regional 4
0.0% (0) 26.1% (6) 34.8% (8) 26.1% (6) 13.0% (3) 0-3 23
0.0% (0) 10.0% (1) 50.0% (5) 10.0% (1) 30.0% (3) 4-6 10
0.0% (0) 20.5% (8) 38.5%(15) 33.3%(13) 7.7% (3) 7 + 39
0.0% (0) 26.7% (12) 28.9%(13) 31.1%(14) 13.3% (6) Male 45
0.0% (0) 11.1% (3) 55.6%(15) 22.2% (6) 11.1% (3) Female 27

54
Table 2 (continued)
Applications – Preference Statement Eight
In the future, the applications of technology in education will include a redefined role of teachers.
Strongly Disagree / Disagree
Agree / Strongly Agree
Undecided Group Response
0.0% (0) 37.5% (3) 25.0% (2) 37.5% (3) 0.0% (0) Urban 8
0.0% (0) 9.8% (4) 61.0%(25) 29.3%(12) 0.0% (0) Suburban 41
0.0% (0) 8.7% (2) 34.8% (8) 56.5%(13) 0.0% (0) Rural 23
0.0% (0) 12.0% (3) 40.0%(10) 48.0%(12) 0.0% (0) Small 25
0.0% (0) 9.8% (4) 56.1%(23) 34.1%(14) 0.0% (0) Medium 41
0.0% (0) 33.3% (2) 33.3% (2) 33.3% (2) 0.0% (0) Large 6
0.0% (0) 33.3% (4) 33.3% (4) 16.7% (2) 16.7% (2) Elementary 12
0.0% (0) 18.2% (10) 40.0%(22) 29.1%(16) 12.7% (7) K-12 55
0.0% (0) 25.0% (1) 50.0% (2) 25.0% (1) 0.0% (0) Regional 4
0.0% (0) 4.3% (1) 60.9%(14) 34.8% (8) 0.0% (0) 0-3 23
0.0% (0) 0.0% (0) 50.0% (5) 50.0% (5) 0.0% (0) 4-6 10
0.0% (0) 20.5% (8) 41.0%(16) 38.5%(15) 0.0% (0) 7 + 39
0.0% (0) 13.3% (6) 44.4%(20) 42.2%(19) 0.0% (0) Male 45
0.0% (0) 11.1% (3) 55.6%(15) 33.3% (9) 0.0% (0) Female 27

55
future advantage of technology in education would include increased parent
communication.
The second preference statement examined the degree to which superintendents of
schools agreed a future advantage of technology in education would be increased
monitoring of teachers. Table 3 presented the modal response of 3 (40.3%) for the second
preference statement. This indicated the superintendents of schools agreed that future
advantages of technology in education would include increased monitoring of teachers.
The third preference statement evaluated the degree to which superintendents of
schools agreed a future advantage of technology in education would be the improved
quality of differentiated instruction. Table 3 presented the modal response of 3 (51.4%)
for the third preference statement. This indicated the superintendents of schools agreed
that future advantages of technology in education would include the improved quality of
differentiated instruction.
The fourth preference statement measured the degree to which superintendents of
schools agreed a future advantage of technology in education would include greater
access to data for teachers to inform instruction. Table 3 presented the modal response of
4 (72.2%) for the fourth preference statement. This indicated the superintendents of
schools strongly agreed that future advantages of technology in education would include
greater access to data for teachers to inform instruction.
The fifth preference statement investigated the degree to which superintendents of
schools agreed a future advantage of technology in education would include increased
access for students with disabilities. Table 3 presented the modal response of 4 (55.6%)

56
for the fifth preference statement. This indicated the superintendents of schools strongly
agreed that future advantages of technology in education would include increased access
for students with disabilities.
The sixth preference statement evaluated the degree to which superintendents of
schools agreed a future advantage of technology in education would include
paraprofessionals replaced with technology. Table 3 presented the modal response of 2
(54.2%) for the sixth preference statement. This indicated the superintendents of schools
disagreed that future advantages of technology in education would include
paraprofessionals replaced with technology.
The seventh preference statement measured the degree to which superintendents
of schools agreed a future advantage of technology in education would include reduced
costs of education by replacing teachers with technology. Table 3 presented the modal
response of 2 (63.9%) for the seventh preference statement. This indicated the
superintendents of schools disagreed that future advantages of technology in education
would include reduced costs of education by replacing teachers with technology.
The eighth preference statement measured the degree to which superintendents of
schools agreed a future advantage of technology in education would be a reduced number
of dropouts. Table 3 presented the modal response of 3 (38.9%) for the eighth preference
statement. This indicated the superintendents of schools agreed that future advantages of
technology in education would include a reduced number of dropouts.

57
Table 3
Future Advantages of Technology in Education
2. There are inherent advantages to the roles of technology in education. In the future, these
advantages will include:
SD D A SA U M
increased parent communication. 0.0%
(0)
1.4%
(1)
30.6%
(22)
68.1%
(49)
0.0%
(0) 4
increased monitoring of teachers. 0.0%
(0)
20.8%
(15)
40.3%
(29)
33.3%
(24)
5.6%
(4) 3
improved quality of differentiated
instruction.
0.0%
(0)
0.0%
(0)
51.4%
(37)
44.4%
(32)
4.2%
(3) 3
greater access to data for teachers
to inform instruction.
0.0%
(0)
0.0%
(0)
26.4%
(19)
72.2%
(52)
1.4%
(1) 4
increased access for students with
disabilities.
0.0%
(0)
1.4%
(1)
41.7%
(30)
55.6%
(40)
1.4%
(1) 4
paraprofessionals replaced with
technology.
11.1%
(8)
54.2%
(39)
12.5%
(9)
8.3%
(6)
13.9%
(10) 2
reduced costs of education by
replacing teachers with technology.
9.7%
(7)
63.9%
(46)
11.1%
(8)
8.3%
(6)
6.9%
(5) 2
a reduced number of dropouts. 0.0%
(0)
22.2%
(16)
38.9%
(28)
12.5%
(9)
26.4%
(19) 3
improved graduation rates. 0.0%
(0)
18.1%
(13)
47.2%
(34)
13.9%
(10)
20.8%
(15) 3
Note. SD = Strongly Disagree, D = Disagree, A = Agree, SA = Strongly Agree, U = Undecided, M =
Modal Rating, ( ) = actual number of responses, bold = majority.

58
The ninth preference statement measured the degree to which superintendents of
schools agreed a future advantage of technology in education would include improved
graduation rates. Table 3 presented the modal response of 3 (47.2%) for the ninth
preference statement. This indicated the superintendents of schools agreed that future
applications of technology in education would include improved graduation rates.
Demographic Groups
When the responses were sorted according to demographic information and
categorized as strongly disagree/disagree and agree/strongly agree, the group modal
responses for three of the preference statements did not show complete agreement, as
shown in Table 4. The complete responses according to demographic groups were shown
in Appendices E-I. For the second preference statement, the group which did not fall into
the category of agree/strongly agree was from the large school districts.
For the eighth preference statement, group modal responses were split between
disagree and agree/strongly agree with the exception of the groups representing
superintendent gender in the agree category. The group modal response for the rural
group was split between agree and undecided.
For the ninth preference statement, the group modal responses which did not fall
into the category of agree/strongly agree were urban, large and regional superintendents.
Disadvantages of Technology in Education
The future disadvantages of technology in education were the third scenarios to be
investigated, using the modified Delphi questionnaire developed by this researcher

59
Table 4
Demographic Groups – Advantages
Advantages – Preference Statement Two
In the future, there are inherent advantages of technology in education. In the future, these will
include increased monitoring of teachers.
Strongly Disagree / Disagree
Agree / Strongly Agree
Undecided Group Response
0.0% (0) 25.0% (2) 37.5% (3) 37.5% (3) 0.0% (0) Urban 8
0.0% (0) 24.4%(10) 39.0%(16) 29.3%(12) 7.3% (3) Suburban 41
0.0% (0) 13.0% (3) 43.5%(10) 39.1% (9) 4.3% (1) Rural 23
0.0% (0) 12.0% (3) 48.0%(12) 36.0% (9) 4.0% (1) Small 25
0.0% (0) 22.0% (9) 36.6%(15) 34.1%(14) 7.3% (3) Medium 41
0.0% (0) 50.0% (3) 33.3% (2) 16.7% (1) 0.0% (0) Large 6
0.0% (0) 8.3% (1) 66.7% (8) 16.7% (2) 8.3% (1) Elementary 12
0.0% (0) 25.5%(14) 36.4%(20) 32.7%(18) 5.5% (3) K-12 55
0.0% (0) 0.0% (0) 25.0% (1) 75.0% (3) 0.0% (0) Regional 4
0.0% (0) 13.0% (3) 47.8%(11) 34.8% (8) 4.3% (1) 0-3 23
0.0% (0) 10.0% (1) 20.0% (2) 70.0% (7) 0.0% (0) 4-6 10
0.0% (0) 28.2%(11) 41.0%(16) 23.1% (9) 7.7% (3) 7 + 39
0.0% (0) 20.0% (9) 42.2%(19) 31.1%(14) 6.7% (3) Male 45
0.0% (0) 22.2% (6) 37.0%(10) 37.0%(10) 3.7% (1) Female 27

60
Table 4 (continued)
Advantages – Preference Statement Eight
In the future, there are inherent advantages of technology in education. In the future, these will
include a reduced number of dropouts.
Strongly Disagree / Disagree
Agree / Strongly Agree
Undecided Group Response
0.0% (0) 37.5% (3) 12.5% (1) 25.0% (2) 25.0% (2) Urban 8
0.0% (0) 24.4%(10) 43.9%(18) 12.2% (5) 19.5% (8) Suburban 41
0.0% (0) 13.0% (3) 39.1% (9) 8.7% (2) 39.1% (9) Rural 23
0.0% (0) 20.0% (5) 44.0%(11) 4.0% (1) 32.0% (8) Small 25
0.0% (0) 19.5% (8) 39.0%(16) 17.1% (7) 24.4% (10) Medium 41
0.0% (0) 50.0% (3) 16.7% (1) 16.7% (1) 16.7% (1) Large 6
0.0% (0) 8.3% (1) 58.3% (7) 0.0% (0) 33.3% (4) Elementary 12
0.0% (0) 23.6%(13) 36.4%(20) 14.5% (8) 25.5% (14) K-12 55
0.0% (0) 50.0% (2) 25.0% (1) 0.0% (0) 25.0% (1) Regional 4
0.0% (0) 30.4% (7) 26.1% (6) 13.0% (3) 30.4% (7) 0-3 23
0.0% (0) 10.0% (1) 60.0% (6) 10.0% (1) 20.0% (2) 4-6 10
0.0% (0) 20.5% (8) 41.0%(16) 12.8% (5) 25.6% (10) 7 + 39
0.0% (0) 26.7%(12) 37.8%(17) 8.9% (4) 26.7% (12) Male 45
0.0% (0) 14.8% (4) 40.7%(11) 18.5% (5) 25.9% (7) Female 27

61
Table 4 (continued)
Advantages – Preference Statement Nine
In the future, there are inherent advantages of technology in education. In the future, these will
include improved graduation rates.
Strongly Disagree / Disagree
Agree / Strongly Agree
Undecided Group Response
0.0% (0) 37.5% (3) 12.5% (1) 25.0% (2) 25.0% (2) Urban 8
0.0% (0) 14.6% (6) 56.1%(23) 12.2% (5) 17.1% (7) Suburban 41
0.0% (0) 17.4% (4) 43.5%(10) 13.0% (3) 26.1% (6) Rural 23
0.0% (0) 20.0% (5) 48.0%(12) 8.0% (2) 24.0% (6) Small 25
0.0% (0) 12.2% (5) 51.2%(21) 17.1% (7) 19.5% (8) Medium 41
0.0% (0) 50.0% (3) 16.7% (1) 16.7% (1) 16.7% (1) Large 6
0.0% (0) 8.3% (1) 58.3% (7) 8.3% (1) 25.0% (3) Elementary 12
0.0% (0) 18.2%(10) 45.5%(25) 14.5% (8) 21.8% (12) K-12 55
0.0% (0) 50.0% (2) 50.0% (2) 0.0% (0) 0.0% (0) Regional 4
0.0% (0) 26.1% (6) 43.5%(10) 13.0% (3) 17.4% (4) 0-3 23
0.0% (0) 0.0% (0) 60.0% (6) 10.0% (1) 30.0% (3) 4-6 10
0.0% (0) 17.9% (7) 46.2%(18) 15.4% (6) 20.5% (8) 7 + 39
0.0% (0) 22.2%(10) 48.9%(22) 11.1% (5) 17.8% (8) Male 45
0.0% (0) 11.1% (3) 44.4%(12) 18.5% (5) 25.9% (7) Female 27

62
(Appendix A). Thirteen preference statements were rated. Table 5 presented the mode
scores relating to the category of disadvantages of technology in education.
The first preference statement measured the degree to which superintendents of
schools believed a future disadvantage of technology in education would be unensured
accountability of student work in online classes. Table 5 presented the modal response of
2 (47.2%) for the first preference statement. This indicated the superintendents of schools
strongly disagreed that a future disadvantage of technology in education would include
uninsured accountability of student work in online classes.
The second preference statement examined the degree to which superintendents of
schools agreed a future disadvantage of technology in education would be the
micromanagement of student achievement by parents. Table 5 presented the modal
response of 2 (55.6%) for the second preference statement. This indicated the
superintendents of schools disagreed that future disadvantages of technology in education
would include the micromanagement of student achievement by parents.
The third preference statement evaluated the degree to which superintendents of
schools agreed a future disadvantage of technology in education would be depersonalized
parent to school communication. Table 5 presented the modal response of 2 (61.1%) for
the third preference statement. This indicated the superintendents of schools disagreed
that future disadvantages of technology in education would include the depersonalization
of parent to school communications.
The fourth preference statement measured the degree to which superintendents of
schools agreed a future disadvantage of technology in education would include costs to

63
update technologies. Table 5 presented the modal response of 3 (56.9%) for the fourth
preference statement. This indicated the superintendents of schools agreed that future
disadvantages of technology in education would include costs to update technologies.
The fifth preference statement investigated the degree to which superintendents of
schools agreed a future disadvantage of technology in education would include rapidly
changing technologies becoming obsolete. Table 5 presented the modal response of 3
(66.7%) for the fifth preference statement. This indicated the superintendents of schools
agreed that future disadvantages of technology in education would include rapidly
changing technologies becoming obsolete.
The sixth preference statement evaluated the degree to which superintendents of
schools agreed a future disadvantage of technology in education would include limited
student access to technologies at home. Table 5 presented the modal response of 3
(47.2%) for the sixth preference statement. This indicated the superintendents of schools
agreed that future disadvantages of technology in education would include limited
student access to technologies at home.
The seventh preference statement measured the degree to which superintendents
of schools agreed a future disadvantage of technology in education would include
reduced face to face interactions of teachers and students. Table 5 presented the modal
response of 2 (37.5%) for the seventh preference statement. This indicated the
superintendents of schools disagreed that future disadvantages of technology in education
would include reduced face to face interactions of teachers and students.

64
The eighth preference statement measured the degree to which superintendents of
schools agreed a future disadvantage of technology in education would be reduced face to
face interactions of students. Table 5 presented the modal response of 2 and 3 (34.7%
each) for the eighth preference statement. This indicated the superintendents of schools
agreed/disagreed that future disadvantages of technology in education would include
reduced face to face interactions of students.
The ninth preference statement measured the degree to which superintendents of
schools agreed a future disadvantage of technology in education would include ensured
quality of online course content. Table 5 presented the modal response of 3 (52.8%) for
the ninth preference statement. This indicated the superintendents of schools agreed that
future applications of technology in education would include ensured quality of online
course content.
The tenth preference statement measured the degree to which superintendents of
schools agreed a future disadvantage of technology in education would include reduced
teacher creativity. Table 5 presented the modal response of 2 (59.7%) for the tenth
preference statement. This indicated the superintendents of schools disagreed that future
applications of technology in education would include reduced teacher creativity.
The eleventh preference statement measured the degree to which superintendents
of schools agreed a future disadvantage of technology in education would include
reduced problem solving abilities of students. Table 5 presented the modal response of 2
(62.5%) for the eleventh preference statement. This indicated the superintendents of

65
schools disagreed that future applications of technology in education would include
reduced problem solving abilities of students.
The twelfth preference statement measured the degree to which superintendents of
schools agreed a future disadvantage of technology in education would include decreased
student ethical behavior. Table 5 presented the modal response of 2 (52.8%) for the
twelfth preference statement. This indicated the superintendents of schools disagreed that
future applications of technology in education would include decreased student ethical
behavior.
The thirteenth preference statement measured the degree to which superintendents
of schools agreed a future disadvantage of technology in education would include
decreased verbal communication skills of students. Table 5 presented the modal response
of 2 (48.6%) for the thirteenth preference statement. This indicated the superintendents of
schools disagreed that future applications of technology in education would include
decreased verbal communication skills of students.
Demographic Groups - Disadvantages
When the responses were sorted according to demographic information and
categorized as strongly disagree/disagree and agree/strongly agree, the group modal
responses for eight of the preference statements did not show complete agreement, as
shown in Table 6. The complete responses according to demographic groups was shown

66
Table 5
Disadvantages of Technology in Education
3. There are inherent disadvantages to the roles of technology in education. In the future, these
disadvantages will include:
SD D A SA U M
uninsured accountability of student
work in online classes.
2.8%
(2)
47.2%
(34)
38.9%
(28)
4.2%
(3)
6.9%
(5) 2
micromanagement of student
achievement by parents.
2.8%
(2)
55.6%
(40)
30.6%
(22)
2.8%
(2)
8.3%
(6) 2
depersonalized parent to school
communication.
4.2%
(3)
61.1%
(44)
26.4%
(19)
5.6%
(4)
2.8%
(2) 2
costs to update technologies. 1.4%
(1)
2.8%
(2)
56.9%
(41)
36.1%
(26)
2.8%
(2) 3
rapidly changing technologies
become obsolete.
0.0%
(0)
5.6%
(4)
66.7%
(48)
25.0%
(18)
2.8%
(2) 3
limited student access to
technologies at home.
2.8%
(2)
40.3%
(29)
47.2%
(34)
6.9%
(5)
2.8%
(2) 3
reduced face to face interactions of
teachers and students.
1.4%
(1)
37.5%
(27)
33.3%
(24)
19.4%
(14)
8.3%
(6) 2
reduced face to face interactions of
students.
1.4%
(1)
34.7%
(25)
34.7%
(25)
22.2%
(16)
6.9%
(5) 2/3
ensured quality of online course
content.
2.8%
(2)
20.8%
(15)
52.8%
(38)
16.7%
(12)
6.9%
(5) 3
reduced teacher creativity. 18.1%
(13)
59.7%
(43)
11.1%
(8)
6.9%
(5)
4.2%
(3) 2
reduced problem solving abilities of
students.
20.8%
(15)
62.5%
(45)
5.6%
(4)
6.9%
(5)
4.2%
(3) 2
decreased student ethical behavior. 8.3%
(6)
52.8%
(38)
18.1%
(13)
4.2%
(3)
16.7%
(12) 2

67
Table 4 (continued)
decreased verbal communication
skills of students.
4.2%
(3)
48.6%
(35)
26.4%
(19)
15.3%
(11)
5.6%
(4) 2
Note. SD = Strongly Disagree, D = Disagree, A = Agree, SA = Strongly Agree, U = Undecided, M =
Modal Rating, ( ) = actual number of responses, bold = majority.
in Appendices E-I. For the first preference statement, the group modal responses for all of
the groups were split between the categories of strongly disagree/disagree and
agree/strongly agree with the exception of superintendent gender in the disagree category.
For the second preference statement, group modal responses were split between
disagree and agree for the groups representing rural, small and regional districts. The
other group modal responses were in the disagree category.
For the third preference statement, the group modal responses which did not fall
into the category of disagree were for regional superintendents. The group modal
response for regional superintendents was split between strongly disagree, disagree, agree
and strongly agree.
For the sixth preference statement, the group modal responses for all groups were
split between disagree and agree with the exception of superintendent years of
experience. The group modal responses for superintendent years of experience were all in
the agree category.
For the seventh and eighth preference statements, the group modal responses of
all groups were split between the disagree and agree/strongly agree categories.

68
Table 6
Demographic Groups - Disadvantages
Disadvantages – Preference Statement One
In the future, there are inherent disadvantages to the roles of technology in education. In the
future, these disadvantages will include unensured accountability of student work in online
classes.
Strongly Disagree / Disagree
Agree / Strongly Agree
Undecided Group Response
0.0% (0) 62.5% (5) 12.5% (1) 12.5% (1) 12.5% (1) Urban 8
0.0% (0) 48.8%(20) 36.6%(15) 4.9% (2) 9.8% (4) Suburban 41
8.7% (2) 39.1% (9) 52.2%(12) 0.0% (0) 0.0% (0) Rural 23
8.0% (2) 44.0%(11) 44.0%(11) 4.0% (1) 0.0% (0) Small 25
0.0% (0) 48.8%(20) 39.0%(16) 2.4% (1) 9.8% (4) Medium 41
0.0% (0) 50.0% (3) 16.7% (1) 16.7% (1) 16.7% (1) Large 6
8.3% (1) 33.3% (4) 58.3% (7) 0.0% (0) 0.0% (0) Elementary 12
0.0% (0) 52.7%(29) 36.4%(20) 1.8% (1) 9.1% (5) K-12 55
25.0% (1) 25.0% (1) 25.0% (1) 25.0% (1) 0.0% (0) Regional 4
0.0% (0) 65.2%(15) 26.1% (6) 4.3% (1) 4.3% (1) 0-3 23
0.0% (0) 30.0% (3) 50.0% (5) 0.0% (0) 20.0% (2) 4-6 10
5.1% (2) 41.0%(16) 43.6%(17) 5.1% (2) 5.1% (2) 7 + 39
4.4% (2) 42.2%(19) 40.0%(18) 6.7% (3) 6.7% (3) Male 45
0.0% (0) 55.6%(15) 37.0%(10) 0.0% (0) 7.4% (2) Female 27

69
Table 6 (continued)
Disadvantages – Preference Statement Two
In the future, there are inherent disadvantages to the roles of technology in education. In the
future, these disadvantages will include micromanagement of student achievement by parents.
Strongly Disagree / Disagree
Agree / Strongly Agree
Undecided Group Response
0.0% (0) 75.0% (6) 0.0% (0) 12.5% (1) 12.5% (1) Urban 8
0.0% (0) 63.4%(26) 29.3%(12) 0.0% (0) 7.3% (3) Suburban 41
8.7% (2) 34.8% (8) 43.5%(10) 4.3% (1) 8.7% (2) Rural 23
8.0% (2) 40.0%(10) 40.0%(10) 4.0% (1) 8.0% (2) Small 25
0.0% (0) 63.4%(26) 29.3%(12) 0.0% (0) 7.3% (3) Medium 41
0.0% (0) 66.7% (4) 0.0% (0) 16.7% (1) 16.7% (1) Large 6
8.3% (1) 41.7% (5) 25.0% (3) 8.3% (1) 16.7% (2) Elementary 12
0.0% (0) 63.6%(35) 29.1%(16) 0.0% (0) 7.3% (4) K-12 55
25.0% (1) 0.0% (0) 75.0% (3) 0.0% (0) 0.0% (0) Regional 4
0.0% (0) 69.6%(16) 17.4% (4) 4.3% (1) 8.7% (2) 0-3 23
0.0% (0) 50.0% (5) 40.0% (4) 0.0% (0) 10.0% (1) 4-6 10
5.1% (2) 48.7%(19) 35.9%(14) 2.6% (1) 7.7% (3) 7 + 39
4.4% (2) 51.1%(23) 33.3%(15) 2.2% (1) 8.9% (4) Male 45
0.0% (0) 63.0%(17) 25.9% (7) 3.7% (1) 7.4% (2) Female 27

70
Table 6 (continued)
Disadvantages – Preference Statement Three
In the future, there are inherent disadvantages to the roles of technology in education. In the
future, these disadvantages will include depersonalized parent to school communication.
Strongly Disagree / Disagree
Agree / Strongly Agree
Undecided Group Response
0.0% (0) 50.0% (4) 37.5% (3) 12.5% (1) 0.0% (0) Urban 8
0.0% (0) 70.7%(29) 22.0% (9) 4.9% (2) 2.4% (1) Suburban 41
13.0% (3) 47.8%(11) 30.4% (7) 4.3% (1) 4.3% (1) Rural 23
12.0% (3) 48.0%(12) 32.0% (8) 4.0% (1) 4.0% (1) Small 25
0.0% (0) 70.7%(29) 22.0% (9) 4.9% (2) 2.4% (1) Medium 41
0.0% (0) 50.0% (3) 33.3% (2) 16.7% (1) 0.0% (0) Large 6
16.7% (2) 50.0% (6) 16.7% (2) 8.3% (1) 8.3% (1) Elementary 12
0.0% (0) 67.3%(37) 29.1%(16) 1.8% (1) 1.8% (1) K-12 55
25.0% (1) 25.0% (1) 25.0% (1) 25.0% (1) 0.0% (0) Regional 4
0.0% (0) 52.2%(12) 43.5%(10) 0.0% (0) 4.3% (1) 0-3 23
0.0% (0) 70.0% (7) 20.0% (2) 0.0% (0) 10.0% (1) 4-6 10
7.7% (3) 64.1%(25) 17.9% (7) 10.3% (4) 0.0% (0) 7 + 39
6.7% (3) 60.0%(27) 22.2%(10) 8.9% (4) 2.2% (1) Male 45
0.0% (0) 63.0%(17) 33.3% (9) 0.0% (0) 3.7% (1) Female 27
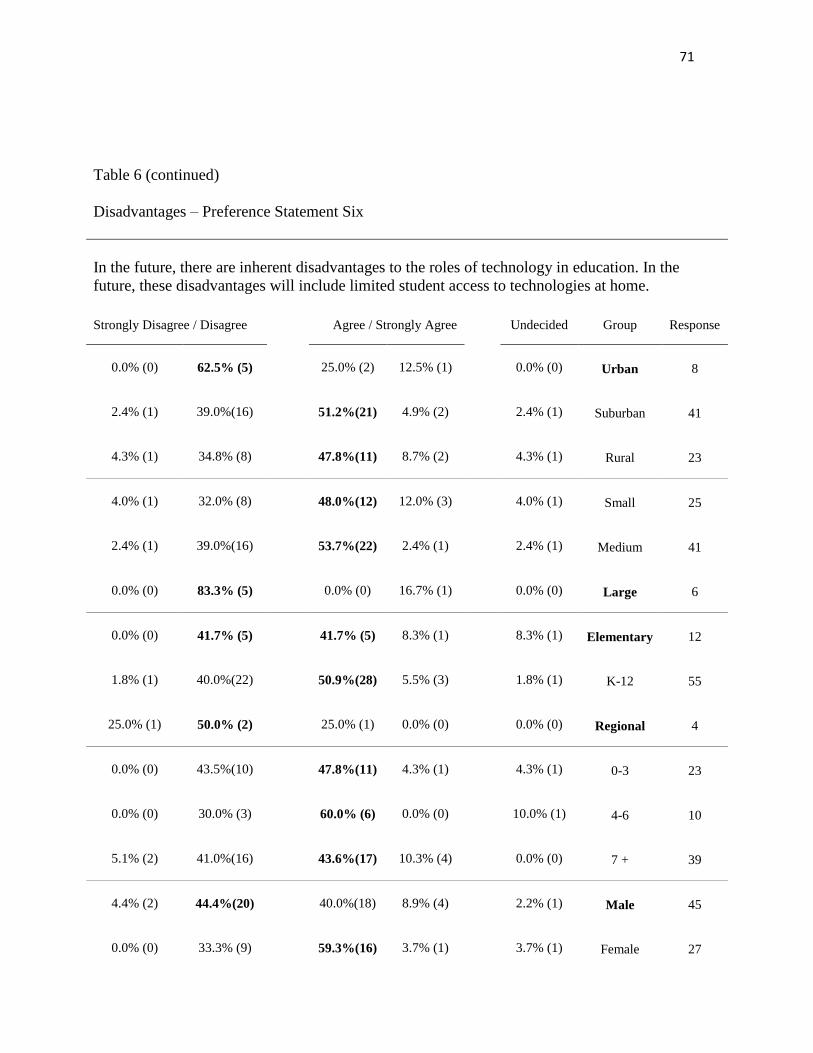
71
Table 6 (continued)
Disadvantages – Preference Statement Six
In the future, there are inherent disadvantages to the roles of technology in education. In the
future, these disadvantages will include limited student access to technologies at home.
Strongly Disagree / Disagree
Agree / Strongly Agree
Undecided Group Response
0.0% (0) 62.5% (5) 25.0% (2) 12.5% (1) 0.0% (0) Urban 8
2.4% (1) 39.0%(16) 51.2%(21) 4.9% (2) 2.4% (1) Suburban 41
4.3% (1) 34.8% (8) 47.8%(11) 8.7% (2) 4.3% (1) Rural 23
4.0% (1) 32.0% (8) 48.0%(12) 12.0% (3) 4.0% (1) Small 25
2.4% (1) 39.0%(16) 53.7%(22) 2.4% (1) 2.4% (1) Medium 41
0.0% (0) 83.3% (5) 0.0% (0) 16.7% (1) 0.0% (0) Large 6
0.0% (0) 41.7% (5) 41.7% (5) 8.3% (1) 8.3% (1) Elementary 12
1.8% (1) 40.0%(22) 50.9%(28) 5.5% (3) 1.8% (1) K-12 55
25.0% (1) 50.0% (2) 25.0% (1) 0.0% (0) 0.0% (0) Regional 4
0.0% (0) 43.5%(10) 47.8%(11) 4.3% (1) 4.3% (1) 0-3 23
0.0% (0) 30.0% (3) 60.0% (6) 0.0% (0) 10.0% (1) 4-6 10
5.1% (2) 41.0%(16) 43.6%(17) 10.3% (4) 0.0% (0) 7 + 39
4.4% (2) 44.4%(20) 40.0%(18) 8.9% (4) 2.2% (1) Male 45
0.0% (0) 33.3% (9) 59.3%(16) 3.7% (1) 3.7% (1) Female 27

72
Table 6 (continued)
Disadvantages – Preference Statement Seven
In the future, there are inherent disadvantages to the roles of technology in education. In the
future, these disadvantages will include reduced face to face interactions of teachers and students.
Strongly Disagree / Disagree
Agree / Strongly Agree
Undecided Group Response
0.0% (0) 25.0% (2) 50.0% (4) 12.5% (1) 12.5% (1) Urban 8
0.0% (0) 39.0%(16) 29.3%(12) 22.0% (9) 9.8% (4) Suburban 41
4.3% (1) 39.1% (9) 34.8% (8) 17.4% (4) 4.3% (1) Rural 23
4.0% (1) 44.0%(11) 20.0% (5) 24.0% (6) 8.0% (2) Small 25
0.0% (0) 34.1%(14) 41.5%(17) 17.1% (7) 7.3% (3) Medium 41
0.0% (0) 33.3% (2) 33.3% (2) 16.7% (1) 16.7% (1) Large 6
8.3% (1) 50.0% (6) 25.0% (3) 8.3% (1) 8.3% (1) Elementary 12
0.0% (0) 36.4%(20) 38.2%(21) 16.4% (9) 9.1% (5) K-12 55
0.0% (0) 25.0% (1) 0.0% (0) 75.0% (3) 0.0% (0) Regional 4
0.0% (0) 34.8% (8) 39.1% (9) 13.0% (3) 13.0% (3) 0-3 23
0.0% (0) 50.0% (5) 20.0% (2) 10.0% (1) 20.0% (2) 4-6 10
2.6% (1) 35.9%(14) 33.3%(13) 25.6%(10) 2.6% (1) 7 + 39
2.2% (1) 37.8%(17) 26.7%(12) 26.7%(12) 6.7% (3) Male 45
0.0% (0) 37.0%(10) 44.4%(12) 7.4% (2) 11.1% (3) Female 27

73
Table 6 (continued)
Disadvantages – Preference Statement Eight
In the future, there are inherent disadvantages to the roles of technology in education. In the
future, these disadvantages will include reduced face to face interactions of students.
Strongly Disagree / Disagree
Agree / Strongly Agree
Undecided Group Response
0.0% (0) 50.0% (4) 25.0% (2) 12.5% (1) 12.5% (1) Urban 8
0.0% (0) 31.7%(13) 39.0%(16) 24.4%(10) 4.9% (2) Suburban 41
4.3% (1) 34.8% (8) 30.4% (7) 21.7% (5) 8.7% (2) Rural 23
4.0% (1) 40.0%(10) 24.0% (6) 24.0% (6) 8.0% (2) Small 25
0.0% (0) 29.3%(12) 43.9%(18) 22.0% (9) 4.9% (2) Medium 41
0.0% (0) 50.0% (3) 16.7% (1) 16.7% (1) 16.7% (1) Large 6
8.3% (1) 58.3% (7) 8.3% (1) 8.3% (1) 16.7% (2) Elementary 12
0.0% (0) 32.7%(18) 41.8%(23) 20.0%(11) 5.5% (3) K-12 55
0.0% (0) 0.0% (0) 25.0% (1) 75.0% (3) 0.0% (0) Regional 4
0.0% (0) 30.4% (7) 43.5%(10) 17.4% (4) 8.7% (2) 0-3 23
0.0% (0) 40.0% (4) 40.0% (4) 10.0% (1) 10.0% (1) 4-6 10
2.6% (1) 35.9%(14) 28.2%(11) 28.2%(11) 5.1% (2) 7 + 39
2.2% (1) 37.8%(17) 24.4%(11) 28.9%(13) 6.7% (3) Male 45
0.0% (0) 29.6% (8) 51.9%(14) 11.1% (3) 7.4% (2) Female 27

74
Table 6 (continued)
Disadvantages – Preference Statement Ten
In the future, there are inherent disadvantages to the roles of technology in education. In the
future, these disadvantages will include reduced teacher creativity.
Strongly Disagree / Disagree
Agree / Strongly Agree
Undecided Group Response
37.5% (3) 37.5% (3) 0.0% (0) 25.0% (2) 0.0% (0) Urban 8
7.3% (3) 70.7%(29) 12.2% (5) 7.3% (3) 2.4% (1) Suburban 41
30.4% (7) 47.8%(11) 13.0% (3) 0.0% (0) 8.7% (2) Rural 23
24.0% (6) 52.0%(13) 8.0% (2) 4.0% (1) 12.0% (3) Small 25
12.2% (5) 68.3%(28) 14.6% (6) 4.9% (2) 0.0% (0) Medium 41
33.3% (2) 33.3% (2) 0.0% (0) 33.3% (2) 0.0% (0) Large 6
33.3% (4) 50.0% (6) 0.0% (0) 0.0% (0) 16.7% (2) Elementary 12
14.5% (8) 65.5%(36) 10.9% (6) 7.3% (4) 1.8% (1) K-12 55
25.0% (1) 25.0% (1) 50.0% (2) 0.0% (0) 0.0% (0) Regional 4
17.4% (4) 65.2%(15) 8.7% (2) 8.7% (2) 0.0% (0) 0-3 23
30.0% (3) 50.0% (5) 0.0% (0) 0.0% (0) 20.0% (2) 4-6 10
15.4% (6) 59.0%(23) 15.4% (6) 7.7% (3) 2.6% (1) 7 + 39
26.7% (12) 55.6%(25) 8.9% (4) 8.9% (4) 0.0% (0) Male 45
3.7% (1) 66.7%(18) 14.8% (4) 3.7% (1) 11.1% (3) Female 27

75
Table 6 (continued)
Disadvantages – Preference Statement Twelve
In the future, there are inherent disadvantages to the roles of technology in education. In the
future, these disadvantages will include decreased student ethical behavior.
Strongly Disagree / Disagree
Agree / Strongly Agree
Undecided Group Response
0.0% (0) 62.5% (5) 12.5% (1) 12.5% (1) 12.5% (1) Urban 8
2.4% (1) 63.4%(26) 24.4%(10) 0.0% (0) 9.8% (4) Suburban 41
21.7% (5) 30.4% (7) 8.7% (2) 8.7% (2) 30.4% (7) Rural 23
16.0% (4) 36.0% (9) 4.0% (1) 8.0% (2) 36.0% (9) Small 25
4.9% (2) 61.0%(25) 26.8%(11) 0.0% (0) 7.3% (3) Medium 41
0.0% (0) 66.7% (4) 16.7% (1) 16.7% (1) 0.0% (0) Large 6
25.0% (3) 25.0% (3) 8.3% (1) 16.7% (2) 25.0% (3) Elementary 12
3.6% (2) 60.0%(33) 21.8%(12) 0.0% (0) 14.5% (8) K-12 55
25.0% (1) 50.0% (2) 0.0% (0) 0.0% (0) 25.0% (1) Regional 4
8.7% (2) 65.2%(15) 21.7% (5) 0.0% (0) 4.3% (1) 0-3 23
20.0% (2) 40.0% (4) 10.0% (1) 0.0% (0) 30.0% (3) 4-6 10
5.1% (2) 48.7%(19) 17.9% (7) 7.7% (3) 20.5% (8) 7 + 39
11.1% (5) 46.7%(21) 15.6% (7) 6.7% (3) 20.0% (9) Male 45
3.7% (1) 63.0%(17) 22.2% (6) 0.0% (0) 11.1% (3) Female 27

76
Table 6 (continued)
Disadvantages – Preference Statement Thirteen
In the future, there are inherent disadvantages to the roles of technology in education. In the
future, these disadvantages will include decreased verbal communication skills of students.
Strongly Disagree / Disagree
Agree / Strongly Agree
Undecided Group Response
0.0% (0) 50.0% (4) 25.0% (2) 12.5% (1) 12.5% (1) Urban 8
2.4% (1) 56.1%(23) 22.0% (9) 17.1% (7) 2.4% (1) Suburban 41
8.7% (2) 34.8% (8) 34.8% (8) 13.0% (3) 8.7% (2) Rural 23
8.0% (2) 36.0% (9) 32.0% (8) 16.0% (4) 8.0% (2) Small 25
2.4% (1) 56.1%(23) 22.0% (9) 14.6% (6) 4.9% (2) Medium 41
0.0% (0) 50.0% (3) 33.3% (2) 16.7% (1) 0.0% (0) Large 6
16.7% (2) 41.7% (5) 25.0% (3) 8.3% (1) 8.3% (1) Elementary 12
1.8% (1) 52.7%(29) 27.3%(15) 12.7% (7) 5.5% (3) K-12 55
0.0% (0) 25.0% (1) 25.0% (1) 50.0% (2) 0.0% (0) Regional 4
4.3% (1) 47.8%(11) 21.7% (5) 17.4% (4) 8.7% (2) 0-3 23
10.0% (1) 50.0% (5) 20.0% (2) 0.0% (0) 20.0% (2) 4-6 10
2.6% (1) 48.7%(19) 30.8%(12) 17.9% (7) 0.0% (0) 7 + 39
4.4% (2) 46.7%(21) 24.4%(11) 20.0% (9) 4.4% (2) Male 45
3.7% (1) 51.9%(14) 29.6% (8) 7.4% (2) 7.4% (2) Female 27

77
For the tenth preference statement, the group modal responses fell into the
category of strongly disagree/disagree with the exception of large and regional districts.
The group modal response for large districts was split between strongly disagree,
disagree and strongly agree. The group modal response of regional districts was agree.
For the twelfth preference statement, the group modal responses fell into the
category of strongly disagree/disagree with the exception of rural, small and elementary
districts. The group modal responses for rural and small districts were split between
disagree and undecided. The group modal response for elementary districts was split
between strongly disagree, disagree and undecided.
For the thirteenth preference statement, the group modal responses were in the
disagree category with the exception of rural and regional districts. The rural district
group modal response was split between disagree and agree, while the regional district
group modal response was strongly agree.
Ways Education Will Be Supported By Technology
The future ways education will be supported by technology were the fourth
scenarios to be investigated, using the modified Delphi questionnaire developed by this
researcher (Appendix A). Eleven preference statements were rated. Table 7 presented the
modal scores relating to the category of disadvantages of technology in education.
The first preference statement measured the degree to which superintendents of schools
believed future ways education will be supported by technology would include promoting
lifelong learning. Table 7 presented the modal response of 3 (58.3%) for the first
preference statement. This indicated the superintendents of schools agreed that a
78
future way education will be supported by technology would include promoting lifelong
learning.
The second preference statement examined the degree to which superintendents of
schools agreed future ways education will be supported by technology would be through
producing good citizens. Table 7 presented the modal response of 2 (37.5%) for the
second preference statement. This indicated the superintendents of schools disagreed that
future ways education will be supported by technology would include producing good
citizens.
The third preference statement evaluated the degree to which superintendents of
schools agreed future ways education will be supported by technology would be through
preparing a skilled workforce. Table 7 presented the modal response of 3 (61.1%) for the
third preference statement. This indicated the superintendents of schools agreed that
future ways education will be supported by technology would include preparing a skilled
workforce.
The fourth preference statement measured the degree to which superintendents of
schools agreed future ways education will be supported by technology would include
allowing for greater student specialization. Table 7 presented the modal response of 3
(59.7%) for the fourth preference statement. This indicated the superintendents of schools
agreed that future ways education will be supported by technology would include
allowing for greater student specialization.
The fifth preference statement investigated the degree to which superintendents of
schools agreed future ways education will be supported by technology would include
79
preparing students for post-secondary education. Table 7 presented the modal response of
3 (61.1%) for the fifth preference statement. This indicated the superintendents of schools
agreed that future ways education will be supported by technology would include
preparing students for post-secondary education.
The sixth preference statement evaluated the degree to which superintendents of
schools agreed future ways education will be supported by technology would include
developing critical thinking skills. Table 7 presented the modal response of 3 (55.6%) for
the sixth preference statement. This indicated the superintendents of schools agreed that
future ways education will be supported by technology would include developing critical
thinking skills.
The seventh preference statement measured the degree to which superintendents
of schools agreed future ways education will be supported by technology would include
ensuring content knowledge. Table 7 presented the modal response of 3 (59.7%) for the
seventh preference statement. This indicated the superintendents of schools agreed that
future ways education will be supported by technology would include ensuring content
knowledge.
The eighth preference statement measured the degree to which superintendents of
schools agreed future ways education will be supported by technology would be making
US education more competitive globally. Table 7 presented the modal response of 3
(55.6%) for the eighth preference statement. This indicated the superintendents of schools
agreed that future ways education will be supported by technology would include making
US education more competitive globally.
80
The ninth preference statement measured the degree to which superintendents of
schools agreed future ways education will be supported by technology would include
promoting wisdom. Table 7 presented the modal response of 2 (44.4%) for the ninth
preference statement. This indicated the superintendents of schools disagreed that future
ways education will be supported by technology would include promoting wisdom.
The tenth preference statement measured the degree to which superintendents of
schools agreed future ways education will be supported by technology would include
promoting character development. Table 7 presented the modal response of 2 (50%) for
the tenth preference statement. This indicated the superintendents of schools disagreed
that future ways education will be supported by technology would include promoting
character development.
The eleventh preference statement measured the degree to which superintendents
of schools agreed future ways education will be supported by technology would include
improving student ethical behavior. Table 4 presented the modal response of 2 (38.9%)
for the eleventh preference statement. This indicated the superintendents of schools
disagreed that future ways education will be supported by technology would include
improving student ethical behaviors.
Demographic Groups
When the responses were sorted according to demographic information and
categorized as strongly disagree/disagree and agree/strongly agree, the group modal
responses for six of the preference statements did not show complete agreement, as
shown in Table 8. The complete responses according to demographic groups was shown

81
Table 7
Ways Technology Will Support Education
4. In the future, technology will support education by:
SD D A SA U M
promoting lifelong learning. 0.0%
(0)
1.4%
(1)
58.3%
(42)
40.3%
(29)
0.0%
(0) 3
producing good citizens. 0.0%
(0)
37.5%
(27)
29.2%
(21)
11.1%
(8)
22.2%
(16) 2
preparing a skilled workforce. 0.0%
(0)
1.4%
(1)
61.1%
(44)
27.8%
(20)
9.7%
(7) 3
allowing for greater student
specialization.
0.0%
(0)
4.2%
(3)
59.7%
(43)
29.2%
(21)
6.9%
(5) 3
preparing students for post-
secondary education.
0.0%
(0)
6.9%
(5)
61.1%
(44)
29.2%
(21)
2.8%
(2) 3
developing critical thinking skills. 0.0%
(0)
15.3%
(11)
55.6%
(40)
23.6%
(17)
5.6%
(4) 3
ensuring content knowledge. 0.0%
(0)
12.5%
(9)
59.7%
(43)
20.8%
(15)
6.9%
(5) 3
making US education more
competitive globally.
0.0%
(0)
11.1%
(8)
55.6%
(40)
23.6%
(17)
9.7%
(7) 3
promoting wisdom. 5.6%
(4)
44.4%
(32)
20.8%
(15)
4.2%
(3)
25.0%
(18) 2
promoting character development. 5.6%
(4)
50.0%
(36)
16.7%
(12)
2.8%
(2)
25.0%
(18) 2
improving student ethical behavior. 5.6%
(4)
38.9%
(28)
19.4%
(14)
6.9%
(5)
29.2%
(21) 2
Note. SD = Strongly Disagree, D = Disagree, A = Agree, SA = Strongly Agree, U = Undecided, M =
Modal Rating, ( ) = actual number of responses, bold = majority.

82
in Appendices E-I. For the second preference statement, the group modal responses for
all of the groups were split between the categories of disagree and agree/strongly agree
with the exception of superintendent gender in the disagree category. In addition, the
rural group modal response was split between agree and undecided.
For the seventh preference statement, group modal responses were split between
disagree and agree for the groups representing rural, small and regional districts. The
other group modal responses were in the disagree category.
For the eighth preference statement, the group modal response which did not fall
into the category of agree/strongly agree was regional superintendents. The group modal
response for regional superintendents was split between the disagree and agree
categories.
For the ninth preference statement, the group modal responses for all of the
groups were split between the categories of disagree and agree/strongly agree with the
exception of superintendent gender in the disagree category. In addition, the large group
modal response was split between disagree, agree and strongly agree. The elementary
group modal response was split between disagree and agree.
For the tenth preference statement, the group modal responses were in the
disagree category with the exception of large districts and superintendents with four to
six years of experience. The large district group modal response was split between
disagree and undecided, while the superintendents with four to six years of experience
group modal response was in the agree category.
For the eleventh preference statement, the group modal responses for the majority
of the groups were split between the categories of disagree and agree/strongly agree with

83
Table 8
Demographic Groups – Support Education
Support Education – Preference Statement Two
In the future, technology will support education by producing good citizens.
Strongly Disagree / Disagree
Agree / Strongly Agree
Undecided Group Response
0.0% (0) 25.0% (2) 37.5% (3) 25.0% (2) 12.5% (1) Urban 8
0.0% (0) 43.9%(18) 26.8%(11) 9.8% (4) 19.5% (8) Suburban 41
0.0% (0) 30.4% (7) 30.4% (7) 8.7% (2) 30.4% (7) Rural 23
0.0% (0) 24.0% (6) 36.0% (9) 8.0% (2) 32.0% (8) Small 25
0.0% (0) 46.3%(19) 26.8%(11) 7.3% (3) 19.5% (8) Medium 41
0.0% (0) 33.3% (2) 16.7% (1) 50.0% (3) 0.0% (0) Large 6
0.0% (0) 25.0% (3) 41.7% (5) 0.0% (0) 33.3% (4) Elementary 12
0.0% (0) 38.2%(21) 29.1%(16) 10.9% (6) 21.8% (12) K-12 55
0.0% (0) 75.0% (3) 0.0% (0) 25.0% (1) 0.0% (0) Regional 4
0.0% (0) 34.8% (8) 34.8% (8) 8.7% (2) 21.7% (5) 0-3 23
0.0% (0) 10.0% (1) 40.0% (4) 20.0% (2) 30.0% (3) 4-6 10
0.0% (0) 46.2%(18) 23.1% (9) 10.3% (4) 20.5% (8) 7 + 39
0.0% (0) 35.6%(16) 26.7%(12) 13.3% (6) 24.4% (11) Male 45
0.0% (0) 40.7%(11) 33.3% (9) 7.4% (2) 18.5% (5) Female 27

84
Table 8 (continued)
Support Education – Preference Statement Seven
In the future, technology will support education by ensuring content knowledge.
Strongly Disagree / Disagree
Agree / Strongly Agree
Undecided Group Response
0.0% (0) 0.0% (0) 75.0% (6) 25.0% (2) 0.0% (0) Urban 8
0.0% (0) 14.6% (6) 58.5%(24) 17.1% (7) 9.8% (4) Suburban 41
0.0% (0) 13.0% (3) 56.5%(13) 26.1% (6) 4.3% (1) Rural 23
0.0% (0) 12.0% (3) 56.0%(14) 24.0% (6) 8.0% (2) Small 25
0.0% (0) 14.6% (6) 63.4%(26) 14.6% (6) 7.3% (3) Medium 41
0.0% (0) 0.0% (0) 50.0% (3) 50.0% (3) 0.0% (0) Large 6
0.0% (0) 8.3% (1) 66.7% (8) 16.7% (2) 8.3% (1) Elementary 12
0.0% (0) 10.9% (6) 61.8%(34) 20.0%(11) 7.3% (4) K-12 55
0.0% (0) 50.0% (2) 25.0% (1) 25.0% (1) 0.0% (0) Regional 4
0.0% (0) 8.7% (2) 65.2%(15) 21.7% (5) 4.3% (1) 0-3 23
0.0% (0) 0.0% (0) 50.0% (5) 40.0% (4) 10.0% (1) 4-6 10
0.0% (0) 17.9% (7) 59.0%(23) 15.4% (6) 7.7% (3) 7 + 39
0.0% (0) 15.6% (7) 55.6%(25) 26.7%(12) 2.2% (1) Male 45
0.0% (0) 7.4% (2) 66.7%(18) 11.1% (3) 14.8% (4) Female 27

85
Table 8 (continued)
Support Education – Preference Statement Eight
In the future, technology will support education by making US education more competitive
globally.
Strongly Disagree / Disagree
Agree / Strongly Agree
Undecided Group Response
0.0% (0) 0.0% (0) 62.5% (5) 37.5% (3) 0.0% (0) Urban 8
0.0% (0) 7.3% (3) 61.0%(25) 22.0% (9) 9.8% (4) Suburban 41
0.0% (0) 21.7% (5) 43.5%(10) 21.7% (5) 13.0% (3) Rural 23
0.0% (0) 20.0% (5) 48.0%(12) 24.0% (6) 8.0% (2) Small 25
0.0% (0) 7.3% (3) 63.4%(26) 17.1% (7) 12.2% (5) Medium 41
0.0% (0) 0.0% (0) 33.3% (2) 66.7% (4) 0.0% (0) Large 6
0.0% (0) 8.3% (1) 58.3% (7) 16.7% (2) 16.7% (2) Elementary 12
0.0% (0) 9.1% (5) 56.4%(31) 25.5%(14) 9.1% (5) K-12 55
0.0% (0) 50.0% (2) 50.0% (2) 0.0% (0) 0.0% (0) Regional 4
0.0% (0) 13.0% (3) 52.2%(12) 26.1% (6) 8.7% (2) 0-3 23
0.0% (0) 0.0% (0) 40.0% (4) 60.0% (6) 0.0% (0) 4-6 10
0.0% (0) 12.8% (5) 61.5%(24) 12.8% (5) 12.8% (5) 7 + 39
0.0% (0) 13.3% (6) 51.1%(23) 24.4%(11) 11.1% (5) Male 45
0.0% (0) 7.4% (2) 63.0%(17) 22.2% (6) 7.4% (2) Female 27

86
Table 8 (continued)
Support Education – Preference Statement Nine
In the future, technology will support education by promoting wisdom.
Strongly Disagree / Disagree
Agree / Strongly Agree
Undecided Group Response
12.5% (1) 12.5% (1) 37.5% (3) 25.0% (2) 12.5% (1) Urban 8
2.4% (1) 53.7%(22) 19.5% (8) 2.4% (1) 22.0% (9) Suburban 41
8.7% (2) 39.1% (9) 17.4% (4) 0.0% (0) 34.8% (8) Rural 23
8.0% (2) 36.0% (9) 24.0% (6) 0.0% (0) 32.0% (8) Small 25
4.9% (2) 51.2%(21) 17.1% (7) 2.4% (1) 24.4% (10) Medium 41
0.0% (0) 33.3% (2) 33.3% (2) 33.3% (2) 0.0% (0) Large 6
8.3% (1) 33.3% (4) 33.3% (4) 0.0% (0) 25.0% (3) Elementary 12
3.6% (2) 47.3%(26) 18.2%(10) 3.6% (2) 27.3% (15) K-12 55
25.0% (1) 50.0% (2) 25.0% (1) 0.0% (0) 0.0% (0) Regional 4
8.7% (2) 43.5%(10) 13.0% (3) 4.3% (1) 30.4% (7) 0-3 23
0.0% (0) 10.0% (1) 60.0% (6) 0.0% (0) 30.0% (3) 4-6 10
5.1% (2) 53.8%(21) 15.4% (6) 5.1% (2) 20.5% (8) 7 + 39
6.7% (3) 44.4%(20) 22.2%(10) 6.7% (3) 20.0% (9) Male 45
3.7% (1) 44.4%(12) 18.5% (5) 0.0% (0) 33.3% (9) Female 27

87
Table 8 (continued)
Support Education – Preference Statement Ten
In the future, technology will support education by promoting character development.
Strongly Disagree / Disagree
Agree / Strongly Agree
Undecided Group Response
0.0% (0) 37.5% (3) 25.0% (2) 12.5% (1) 25.0% (2) Urban 8
4.9% (2) 56.1%(23) 17.1% (7) 2.4% (1) 19.5% (8) Suburban 41
8.7% (2) 43.5%(10) 13.0% (3) 0.0% (0) 34.8% (8) Rural 23
4.0% (1) 44.0%(11) 20.0% (5) 0.0% (0) 32.0% (8) Small 25
7.3% (3) 56.1%(23) 14.6% (6) 2.4% (1) 19.5% (8) Medium 41
0.0% (0) 33.3% (2) 16.7% (1) 16.7% (1) 33.3% (2) Large 6
0.0% (0) 41.7% (5) 33.3% (4) 0.0% (0) 25.0% (3) Elementary 12
5.5% (3) 52.7%(29) 14.5% (8) 1.8% (1) 25.5% (14) K-12 55
25.0% (1) 50.0% (2) 0.0% (0) 0.0% (0) 25.0% (1) Regional 4
4.3% (1) 47.8%(11) 8.7% (2) 4.3% (1) 34.8% (8) 0-3 23
0.0% (0) 10.0% (1) 50.0% (5) 0.0% (0) 40.0% (4) 4-6 10
7.7% (3) 61.5%(24) 12.8% (5) 2.6% (1) 15.4% (6) 7 + 39
6.7% (3) 51.1%(23) 17.8% (8) 4.4% (2) 20.0% (9) Male 45
3.7% (1) 48.1%(13) 14.8% (4) 0.0% (0) 33.3% (9) Female 27

88
Table 8 (continued)
Support Education – Preference Statement Eleven
In the future, technology will support education by improving student ethical behavior.
Strongly Disagree / Disagree
Agree / Strongly Agree
Undecided Group Response
0.0% (0) 25.0% (2) 37.5% (3) 12.5% (1) 25.0% (2) Urban 8
7.3% (3) 43.9%(18) 22.0% (9) 2.4% (1) 24.4% (10) Suburban 41
4.3% (1) 34.8% (8) 8.7% (2) 13.0% (3) 39.1% (9) Rural 23
0.0% (0) 36.0% (9) 16.0% (4) 12.0% (3) 36.0% (9) Small 25
9.8% (4) 43.9%(18) 17.1% (7) 2.4% (1) 26.8% (11) Medium 41
0.0% (0) 16.7% (1) 50.0% (3) 16.7% (1) 16.7% (1) Large 6
0.0% (0) 33.3% (4) 33.3% (4) 16.7% (2) 16.7% (2) Elementary 12
7.3% (4) 38.2%(21) 18.2%(10) 1.8% (1) 34.5% (19) K-12 55
0.0% (0) 75.0% (3) 0.0% (0) 25.0% (1) 0.0% (0) Regional 4
4.3% (1) 39.1% (9) 13.0% (3) 4.3% (1) 39.1% (9) 0-3 23
0.0% (0) 10.0% (1) 50.0% (5) 0.0% (0) 40.0% (4) 4-6 10
7.7% (3) 46.2%(18) 15.4% (6) 10.3% (4) 20.5% (8) 7 + 39
6.7% (3) 33.3% (15) 22.2%(10) 11.1% (5) 26.7% (12) Male 45
3.7% (1) 48.1%(13) 14.8% (4) 0.0% (0) 33.3% (9) Female 27

89
the exception of superintendent gender in the disagree category and rural superintendents
in the undecided category.
Future Policies Required by Technology in Education
The future policies required by technology in education were the third scenarios
to be investigated, using the modified Delphi questionnaire developed by this researcher
(Appendix A). Eight preference statements were rated. Table 9 presented the modal
scores relating to the category of policies required by technology in education.
The first preference statement measured the degree to which superintendents of
schools believed a future policy required by technology in education would be students
having the option to ―test out‖ of required courses for graduation by demonstrating
proficiency and students would have the option to graduate early by demonstrating
proficiency to "test out" of required courses. Table 9 presented the modal response of 3
(62.5%) for the first preference statement. This indicated the superintendents of schools
agreed that a future policy required by technology in education would include students
having the option to ―test out‖ of required courses for graduation by demonstrating
proficiency and students would have the option to graduate early by demonstrating
proficiency to "test out" of required courses.
The second preference statement measured the degree to which superintendents of
schools believed a future policy required by technology in education would be students
having the option to graduate early by increasing maximum student course loads. Table 9
presented the modal response of 3 (65.3%) for the second preference statement. This
indicated the superintendents of schools agreed that a future policy required by

90
technology in education would include students having the option to graduate early by
increasing maximum student course loads.
The third preference statement measured the degree to which superintendents of
schools believed a future policy required by technology in education would be students
having the option to take advanced online courses outside of their district for graduation
credit. Table 9 presented the modal response of 3 (51.4%) for the third preference
statement. This indicated the superintendents of schools agreed that a future policy
required by technology in education, would include students having the option to take
advanced online courses outside of their district for graduation credit.
The fourth preference statement measured the degree to which superintendents of
schools believed a future policy required by technology in education would be students
having the option to take online courses outside of their district for graduation credit
which are also offered traditionally within the district. Table 9 presented the modal
response of 3 (50%) for the fourth preference statement. This indicated the
superintendents of schools agreed that a future policy required by technology in
education, would include students having the option to take online courses outside of
their district for graduation credit which are also offered traditionally within the district.
The fifth preference statement measured the degree to which superintendents of
schools believed a future policy required by technology in education would be students
being required to take at least one online course as a graduation requirement. Table 9
presented the modal response of 3 (36.1%) for the fifth preference statement. This
indicated the superintendents of schools agreed that a future policy required by

91
technology in education, would include students being required to take at least one online
course as a graduation requirement.
The sixth preference statement measured the degree to which superintendents of
schools believed a future policy required by technology in education would be students
adhering to an ethics policy for student behaviors in online courses. Table 9 presented the
modal response of 3 (47.2%) for the sixth preference statement. This indicated the
superintendents of schools agreed that a future policy required by technology in
education, would include students adhering to an ethics policy for student behaviors in
online courses.
The seventh preference statement measured the degree to which superintendents
of schools believed a future policy required by technology in education would be districts
providing for students with limited access to technologies at home. Table 9 presented the
modal response of 3 (51.4%) for the seventh preference statement. This indicated the
superintendents of schools agreed that a future policy required by technology in
education, would include districts providing for students with limited access to
technologies at home.
The eighth preference statement measured the degree to which superintendents of
schools believed a future policy required by technology in education would be teachers
having ongoing professional development in technology. Table 5 presented the modal
response of 4 (65.3%) for the eighth preference statement. This indicated the
superintendents of schools strongly agreed that a future policy required by technology in
education, would include teachers having ongoing professional development in technology.

92
Table 9
Future Policy Changes
5. The future roles of technology in education will require changes in existing policies. In the future,
these changes in policy will include:
SD D A SA U M
students having the option to ―test out‖ of
required courses for graduation by
demonstrating proficiency. Students
having the option to graduate early by
demonstrating proficiency to "test out" of
required courses.
0.0%
(0)
1.4%
(1)
62.5%
(45)
31.9%
(23)
4.2%
(3) 3
students having the option to graduate
early by increasing maximum student
course loads.
0.0%
(0)
0.0%
(0)
65.3%
(47)
31.9%
(23)
2.8%
(2) 3
students having the option to take
advanced online courses outside of their
district for graduation credit.
0.0%
(0)
0.0%
(0)
51.4%
(37)
47.2%
(34)
1.4%
(1) 3
students having the option to take online
courses outside of their district for
graduation credit which are also offered
traditionally within the district.
0.0%
(0)
15.3%
(11)
50.0%
(36)
31.9%
(23)
2.8%
(2) 3
students being required to take at least one
online course as a graduation requirement.
0.0%
(0)
22.2%
(16)
36.1%
(26)
29.2%
(21)
12.5%
(9) 3
students adhering to an ethics policy for
student behaviors in online courses.
0.0%
(0)
1.4%
(1)
47.2%
(34)
45.8%
(33)
5.6%
(4) 3
districts providing for students with
limited access to technologies at home.
1.4%
(1)
9.7%
(7)
51.4%
(37)
29.2%
(21)
8.3%
(6) 3
teachers having ongoing professional
development in technology.
0.0%
(0)
0.0%
(0)
34.7%
(25)
65.3%
(47)
0.0%
(0) 4
Note. SD = Strongly Disagree, D = Disagree, A = Agree, SA = Strongly Agree, U = Undecided, M = Modal Rating,
( ) = actual number of responses, bold = majority.
93
Demographic Groups
When the responses were sorted according to demographic information and
categorized as strongly disagree/disagree and agree/strongly agree, the group modal
responses for one of the preference statements did not show complete agreement, as shown in
Table 10. The complete responses according to demographic groups was shown in
Appendices E-I. For the fifth preference statement, the group modal responses for all of the
groups were in the category of agree/strongly agree with the exception of urban and large
districts in the disagree category.
Summary of Modal Responses
A summary of the 52 preference statement modal responses was presented in Table
11. This table indicated zero (0%) preference statements were rated strongly disagree.
Sixteen (31%) preference statements were rated disagree. Twenty eight (54%) preference
statements were rated agree. Eight (15%) preference statements were rated strongly agree.
Summary of Statements
From the responses of the questionnaire designed by the researcher, superintendents of
schools agreed that in the future, the applications of technology in education will include:
supplemented traditional classroom teaching methods, the creation of virtual schools,
reduced hours students are physically in school, and online classes offered in addition to
traditional classes. Superintendents also agreed that the applications of technology in
education will include: a restructured school schedule, a restructured school calendar, a
redefined role of teachers, a redefinition of the education process, and college courses
accessed online for both students and staff.

94
Table 10
Demographic Groups – Policies
Policies – Preference Statement Five
The future roles of technology in education will require changes in existing policies. In the future,
these changes in policy will include students being required to take at least one online course as a
graduation requirement.
Strongly Disagree / Disagree
Agree / Strongly Agree
Undecided Group Response
0.0% (0) 50.0% (4) 12.5% (1) 12.5% (1) 25.0% (2) Urban 8
0.0% (0) 26.8%(11) 34.1%(14) 29.3%(12) 9.8% (4) Suburban 41
0.0% (0) 4.3% (1) 47.8%(11) 34.8% (8) 13.0% (3) Rural 23
0.0% (0) 20.0% (5) 40.0%(10) 24.0% (6) 16.0% (4) Small 25
0.0% (0) 17.1% (7) 39.0%(16) 34.1%(14) 9.8% (4) Medium 41
0.0% (0) 66.7% (4) 0.0% (0) 16.7% (1) 16.7% (1) Large 6
0.0% (0) 16.7% (2) 50.0% (6) 8.3% (1) 25.0% (3) Elementary 12
0.0% (0) 23.6%(13) 36.4%(20) 29.1%(16) 10.9% (6) K-12 55
0.0% (0) 25.0% (1) 0.0% (0) 75.0% (3) 0.0% (0) Regional 4
0.0% (0) 30.4% (7) 34.8% (8) 26.1% (6) 8.7% (2) 0-3 23
0.0% (0) 30.0% (3) 30.0% (3) 20.0% (2) 20.0% (2) 4-6 10
0.0% (0) 15.4% (6) 38.5%(15) 33.3%(13) 12.8% (5) 7 + 39
0.0% (0) 17.8% (8) 37.8%(17) 26.7%(12) 17.8% (8) Male 45
0.0% (0) 29.6% (8) 33.3% (9) 33.3% (9) 3.7% (1) Female 27

95
Table 11
Summary of Preferences
Rating No of Responses Percentage
Strongly Disagree 0 0%
Disagree 16 31%
Agree 28 54%
Strongly Agree 8 15%
Undecided 0 0%
Total 52
Superintendents of schools agreed that in the future, the advantages of technology in
education will include: increased parent communication, increased monitoring of teachers,
improved quality of differentiated instruction, and greater access to data for teachers to use in
planning instruction. Superintendents of schools also agreed that in the future, the advantages
of technology in education will include: increased access for students with disabilities, a
reduced number of dropouts, and improved graduation rates.
The results of the survey also indicated that in the future, the disadvantages of technology
in education will include: costs to update technologies, rapidly changing technologies
become obsolete, and limited student access to technologies at home. Superintendents of

96
schools also agreed that future disadvantages of technology in education will include:
reduced face to face interactions of students, and ensured quality of online course content.
Superintendents of schools agreed that in the future, technology will support education
by: promoting lifelong learning, preparing a skilled workforce, allowing for greater student
specialization, and preparing students for post-secondary education. The survey also
indicated superintendents of schools agreed that in the future, technology will support
education by: developing critical thinking skills, ensuring content knowledge, and making
US education more competitive globally.
The survey indicated superintendents of schools agreed that in the future, changes in
policies will include: students having the option to ―test out‖ of required courses for
graduation by demonstrating proficiency. Students will also have the option to graduate early
by demonstrating proficiency to "test out" of required courses. Superintendents of schools
also agreed that changes in policy in the future will include: students having the option to
graduate early by increasing maximum student course loads and students having the option to
take advanced online courses outside of their district for graduation credit. The survey also
indicated agreement to students having the option to take online courses outside of their
district for graduation credit which are also offered traditionally within the district as well as
students being required to take at least one online course as a graduation requirement. The
superintendents of schools indicated agreement to students adhering to an ethics policy for
student behaviors in online courses, districts providing for students with limited access to
technologies at home, and teachers having ongoing professional development in technology.

97
From the results of the survey, superintendents of schools disagreed that in the future, the
applications of technology in education will include: a reduced number of teachers.
Superintendents of schools also disagreed that in the future, the advantages of technology in
education will include: paraprofessionals replaced with technology and reduced costs of
education by replacing teachers with technology.
The superintendents of schools indicated disagreement that in the future, the
disadvantages of technology in education will include: uninsured accountability of student
work in online classes, micromanagement of student achievement by parents, depersonalized
parent to school communication, reduced face to face interactions of teachers and students,
and reduced face to face interactions of students. Survey results indicated disagreement that
in the future, the disadvantages of technology in education will include: reduced teacher
creativity, reduced problem solving abilities of students, decreased student ethical behavior,
and decreased verbal communication skills of students.
Survey results indicated superintendents of schools disagreed that in the future,
technology will support education by: producing good citizens, promoting wisdom,
promoting character development, and improving student ethical behavior. Superintendents
of schools did not disagree with any future changes in policy required by technology in
education.
98
Chapter Five
Summary, Conclusions and Recommendations
Summary
Using a modified Delphi technique, this study was designed to investigate and
determine the future roles of technology in K-12 education in Connecticut. A significant
issue was that superintendents of schools had a limited amount of information to use in the
development of future roles of technology when designing technology implementation plans.
Specifically, this study sought to answer the following research questions:
1. What will be the applications of technology in education?
2. What will be the advantages of technology in education?
3. What will be the disadvantages of technology in education?
4. What ways will technology support education?
5. What will be the changes in policies required by technology in education?
The population of this study consisted of 163 Connecticut superintendents of schools.
The invited sample (n) consisted of 139 Connecticut superintendents of individual districts
and regional districts, including regional districts, but not including regional service districts.
Six districts were not able to be invited to participate due to a vacancy in the post, or an
inability to be contacted by email resulting in the 155 superintendents intended to be invited
being reduced to 139.
The data generating sample consisted of 72 Connecticut K-12 superintendents of
schools who responded to the survey inquiry. These 72 subjects represented 52% of the

99
invited sample. The subjects agreed to participate in this study by completing the
questionnaire and submitting online to this researcher (Appendix A).
With regard to the total years of experience as a superintendent of schools, 31.9% had
zero to three years of experience, 13.9% had four to six years of experience, and 54.2% had
seven plus years of experience. Representing gender, the respondents were 62.5% male and
37.5% female. For type of district, 11.1% of the respondents were from an urban district,
56.9% of the respondents were from a suburban district, and 31.9% were from a rural district.
The district enrollments of the respondents were 34.7% small (less than 2000), 56.9%
medium (2000-8000), and 8.3% large (8000 plus). The respondents‘ designations of the
districts were 16.9% Elementary (K-6, K-8), 77.5% K-12, and 5.6% Regional.
The data for this research study was collected through one round of a modified Delphi
questionnaire entitled, ―Future Roles of Technology in K-12 Education in Connecticut‖
(Appendix A). This questionnaire was developed by the researcher and included 52
preference statements. Validity information was presented in Chapter three. The
questionnaire was delivered to the subjects electronically through email with an IP address
specific link to the survey hosted through survey monkey (Appendix C). The questionnaire
included a section for demographic data (Appendix D).
The one round of the modified Delphi questionnaire (Appendix A) had 52 preference
statements related to the future roles of technology in K-12 education in Connecticut. These
52 preference statements were divided into the following categories:
1. Applications of Technology in Education
2. Advantages of Technology in Education

100
3. Disadvantages of Technology in Education
4. Ways Education Will Be Supported By Technology
5. Policies for Technology in Education
The following rating scales were used:
1. strongly disagree (value of 1)
2. disagree (value of 2)
3. agree (value of 3)
4. strongly agree (value of 4)
5. undecided (value of 5)
For the one round Delphi questionnaire, modes were computed for all 52 preference
statements. These computations analyzed the distribution of responses of the superintendents
of schools, with regards to the future roles of technology in K-12 education in Connecticut.
The survey monkey data analysis software was used to analyze and process the data collected
in this research study.
The study findings were divided into the following five categories from the modified
Delphi questionnaire:
1. Applications of Technology in Education
2. Advantages of Technology in Education
3. Disadvantages of Technology in Education
4. Ways Education Will Be Supported By Technology
5. Policies for Technology in Education
With regard to the category of applications of technology in education, the modal
responses of the superintendents, indicated ―strongly agreed‖ with four (40%) of the
101
preference statements. These included: supplemented traditional classroom teaching
methods, the creation of virtual schools, online classes offered by districts in addition to
traditional classes and college courses accessed online for both students and staff. The modal
responses of superintendents ―agreed‖ with five (50%) of the preference statements. These
included: reduced hours students are in school, a restructured school schedule, a restructured
school calendar, a redefined role of teachers and a redefinition of the education process. The
superintendents‘ modal responses ―disagreed‖ with one (10%) of the preference statements.
This was a reduced number of teachers as an application of technology in education. None of
the preference statements modal responses for applications of technology in education were
―undecided.‖
With regard to the category of advantages of technology in education, the modal
responses of the superintendents, indicated ―strongly agreed‖ with three (33%) of the
preference statements. These included: increased parent communication, greater access to
data for teachers to inform instruction and increased access for students with disabilities. The
modal responses of superintendents ―agreed‖ with four (44%) of the preference statements.
These included: increased monitoring of teachers, improved quality of differentiated
instruction, a reduced number of dropouts and improved graduation rates. The
superintendents‘ modal responses ―disagreed‖ with two (22%) of the preference statements.
This was a paraprofessionals replaced with technology and reduced costs of education by
replacing teachers with technology. None of the preference statements modal responses for
advantages of technology in education were ―undecided.‖
With regard to the category of disadvantages of technology in education, the modal
responses of the superintendents indicated ―strongly agreed‖ with none (0%) of the

102
preference statements. The modal responses of superintendents ―agreed‖ with five (38%) of
the preference statements. These included: costs to update technologies, rapidly changing
technologies becoming obsolete, limited student access to technologies at home, reduced face
to face interactions of students (split with ―Disagree‖) and ensured quality of online course
content. The superintendents‘ modal responses ―disagreed‖ with nine (69%) of the preference
statements. These included: uninsured accountability of student work in online classes,
micromanagement of student achievement by parents, depersonalized parent to school
communication, reduced face to face interactions of teachers and students, reduced face to
face interactions of students (split with ―Agree‖), reduced teacher creativity, reduced
problem solving ability of students and decreased student ethical behavior. None of the
preference statements modal responses for disadvantages of technology in education were
―undecided.‖
The fifth category investigated the future policies for technology in education. The
modal responses of the superintendents indicated ―strongly agreed‖ with none (0%) of the
preference statements. The modal responses of superintendents ―agreed‖ with seven (64%) of
the preference statements. These included: promoting lifelong learning, preparing a skilled
workforce, allowing for greater student specialization, preparing students for post-secondary
education, developing critical thinking skills, ensuring content knowledge and making US
education more competitive globally. The superintendents‘ modal responses ―disagreed‖ with
four (36%) of the preference statements. These included: producing good citizens, promoting
wisdom, promoting character development and improving student ethical behavior. None of
the preference statements modal responses for disadvantages of technology in education were
―undecided.‖

103
Conclusions
The following conclusions and implications may be drawn from the findings of this
modified Delphi study:
1. Future roles of technology in K-12 education in Connecticut were predicted through
the use of the modified Delphi technique. Areas of agreement and disagreement were
discovered.
2. In the category of applications of technology in education, strong agreement and
agreement was found for future applications of technology in education
supplementing traditional teaching methods with technology, creating virtual schools,
reducing hours students are in schools, offering online classes and access to online
college courses, restructuring the school schedule and calendar as well as a
redefinition of the education process. The respondents disagreed that a future
application should be a reduced number of teachers. This indicates that future roles of
technology in K-12 education in Connecticut will redefine education without
replacing teachers.
3. In the category of advantages of technology in education, strong agreement and
agreement was found for the future advantages of technology in education including
increased parent communication, increased monitoring of teachers, improved quality
of differentiated instruction, greater access to data for teachers, increased access for
students with disabilities, a reduced number of dropouts and improved graduation
rates. Respondents disagreed that future advantages of technology in education will

104
include paraprofessionals replaced with technology and reduced costs of education by
replacing teachers with technology. This indicates that future roles of technology in
K-12 education in Connecticut will include increased visibility of teachers and higher
quality instruction.
4. In the category of disadvantages of technology in education, agreement was found for
the future disadvantages of technology in education including: costs to update
technologies, rapidly changing technologies becoming obsolete, limited student
access to technologies at home and ensured quality of online courses. Respondents
both agreed and disagreed for the disadvantage of reduced face to face interactions of
students. Disagreement was found for the disadvantages of: uninsured accountability
of student work in online classes, micromanagement of student achievement by
parents, depersonalized parent to school contact, reduced face to face interactions of
teachers and students, reduced teacher creativity, reduced problem solving abilities of
students, decreased student ethical behavior and decreased verbal communication
skills of students. This indicates that future roles of technology in K-12 education in
Connecticut will address student access to technology and the structure of virtual
learning.
5. In the category of ways technology will support education in the future, agreement
was reached by the respondents in the following areas: promoting lifelong learning,
preparing a skilled workforce, allowing for greater student specialization, preparing
students for post-secondary education, developing critical thinking skills, ensuring
content knowledge and making US education more competitive globally. The
respondents disagreed that ways technology will support education in the future

105
include: producing good citizens, promoting wisdom, promoting character
development and improving student ethical behavior. This indicates that future roles
of technology in K-12 education in Connecticut at this time do not have a clear
purpose in the support of education. While the many applications of technology
appeal to superintendents, the reasons for using them need to be further clarified.
6. In the category of future policies for technology in education, strong agreement and
agreement was reached in all areas of future policy changes. This indicates that future
roles of technology in K-12 education in Connecticut will result in greater
opportunities and flexibility for students.
Recommendations
Based on the conclusions and findings of this modified Delphi study the following
areas were recommended for future research:
1. Future research should be conducted to determine what training and professional
development superintendents of schools need to better inform their decisions
regarding technology in education.
2. Future professional development opportunities should be designed for
superintendents of schools to demonstrate the future possibilities for technology in
education.
3. This study should be repeated to include the three rounds of the Delphi method to
reach consensus amongst the superintendents of schools in Connecticut.
4. The Review of Literature should be expanded in the future to include studies on the
impact of roles of technology in education.

106
5. This study should be used as a foundation for a discussion of future roles of
technology in K-12 education in Connecticut schools by CAPSS and CABE.
6. This modified Delphi study can be used as a foundation for future studies in
educational leadership and educational technology.
7. This study can be used as the foundation for scenario planning regarding future roles
of technology in education.
8. This study should be replicated within a district to include teachers and administrators
to aid in future technology in education planning and implementation.
9. This study should be used to structure future conversations between educational
leaders in the state of Connecticut.

107
References
Andrade, A.G. (2008). An exploratory study of the role of technology in the rise of
homeschooling (Dissertation, Ohio University, 2008).
Barron, A.E., Orwig, G.W., Ivers, K.S. &Lilavois, N. (2002). Technologies for Education: A
Practical Guide (4th ed.). Greenwood Village, CO: Libraries Unlimited.
Black, V.R. (2006). Self-perceptions of transformational leadership practices of middle and high
school computer technology teachers in an urban public school environment
(Dissertation, University of Bridgeport, 2006).
Brooks-Young, S. (2006). Critical technology issues for school leaders. Thousand Oaks, CA:
Corwin.
Campbell-Kelly, M., & Aspray, W. (2004). Computer: a history of the information machine.
Boulder, CO: Westview Press.
Carroll, J.M. (2003). Introduction: Toward a Multidisciplinary Science of Human Computer
Interaction. In Carroll, J.M. (Ed.) HCI models, theories, and frameworks (pp. 1-9). San
Francisco, CA: Morgan Kaufmann.
Children's Online Privacy Protection Act of 1998, 47 U.S.C. 231
Chow, A.S. (2008). The role of systems design and educational informatics in educational
reform: The story of the central education center (Dissertation, The Florida State
University, 2008).
Copyright Clearance Center (2005). The TEACH Act. Retrieved on June 15, 2010 from
http://www.copyright.com/media/pdfs/CR-Teach-Act.pdf
CT State Department of Education. Online courses available to CT high school students.
retrieved December 8, 2009 from

108
http://www.sde.ct.gov/sde/taxonomy/ct_taxonomy.asp?DLN=45425&sdeNav=|45425|
Dalkey, N.C. & Helmer, O., (1963). The Experimental Application of the Delphi Method to the
Use of Experts. Management Science, 9, (3), 458-467.
Deveau, P.M. (1995). Utilization of Multimedia Computer Technology in Corporate Training
and Development Programs: a Delphi Study (Doctoral dissertation, University of
Bridgeport, 1995).
Dewey, J. (1913). Interest and Effort in Education. New York, NY: Houghton Mifflin.
Dittmar, E.M. An investigation of instructional design roles and practices used to develop and
maintain interactive web-based learning (Dissertation, Capella University, 2009).
Freire, P. (1995). Pedagogy of hope. New York, NY: Continuum.
Freire, P. (n.d.). Pedagogy of the oppressed. Retrieved from
http://www.scribd.com/doc/4811889/Paulo-Freire-Pedagogy-of-Oppresed (Original work
published 1970).
Fritz, M.L. (2005). Students using handheld computers to learn collaboratively in a first grade
classroom (Dissertation, Drexel University, 2005).
Gallagher, J.D. (2007). Negotiating writing, literature, and the new literacies: Expanding and
maintaining boundaries in a 9th
grade English classroom (Dissertation, Michigan State
University, 2007).
Gomez, M.V. (2006). Contemporary Spheres for the Teaching Education: Freire‘s Principles.
Turkish Online Journal of Distance Education, 7(2), article 5.
Helmer, O. (1967). Analysis of the Future: The Delphi Method. Santa Monica, CA: Rand
Corporation.
Helmer, O., & Rescher, N. (1959). On the Epistemology of the Inexact Sciences. Management

109
Science, 6, (1) 25-52. www.jstor.org/stable/2627474.
Huffman, M. (2008).Compliance with Children's Internet Protection Act (CIPA)
and E-Rate Funding. Retrieved from www.doe.in.gov/htmls/phprint.php. accessed
3/6/2008.
Jackson, A.W. & Davis, G. A. (2000). Turning points 2000. New York, NY: Teachers College
Press.
Jonassen, D.H., Howland, J., Moore, J., & Marra, R.M. (2003). Learning to solve problems with
technology: A constructivist perspective (2nd
ed.). Upper Saddle River, NJ: Merrill
Prentice Hall.
Kakoszka, K.A. (2009). A case study approach to the perceptions of Edline, a k-12 technology
solution software, at a small catholic high school in southern Massachusetts (Dissertation,
Johnson & Wales University, 2009).
Kumar, S. (2007). Integrating asynchronous online discussions into the classroom in web-
enhanced courses (Dissertation, Boston University, 2007).
Mantemach-Wigans, L.K. (1999). Computer technology integration in Iowa high school:
Perceptions of teachers (Dissertation, Iowa State University, 1999).
McRae, P. (2001). Increasing the integration of technology into the fourth-grade curriculum
using teacher/media specialist collaboration in planning student research activities
(Dissertation, Nova Southeastern University, 2001).
Moallem, M. (2008). Accommodating individual differences in the design of online learning
environments: a comparative study. Journal of Research on Technology in Education,
40(2), 217-245.
Mooney, T. (2005). A practical guide to Connecticut school law (5th
ed.). Connecticut

110
Association of Boards of Education.
Moursund, D. (2003). Project-based learning: Using information technology (2nd
ed.). Eugene,
OR: International Society for Technology in Education.
Mulcahy, J.W., Gregory, J.L. (2009). A Handbook of Statistics and Quantitative Analysis for
Educational Leadership. Maryland: University Press of America.
Mulcahy, J.W. (2009). Leadership Analytics. Bloomington, IN: AuthorHouse.
Nadolny, L.N. (2008). Laptops for all students: Year one evaluation of a laptop initiative in
career and technical high school education (Dissertation, University of Delaware, 2008).
New England Association of Schools and Colleges. (n.d.). 7. Library and Other Information
Resources. Retrieved on June 12, 2010 from
http://cihe.neasc.org/standards_policies/standards/standard_seven/.
Nguyen, T.T. (2007). Technology tango: Perceptions of the roles of school technology
coordinators and library media specialists (Dissertation, University of Southern
California, 2007).
Ophir, E., Nass, C. & Wagner, A.D. (2009). Cognitive Control in Media Multitaskers.
Psychological and Cognitive Sciences, 106(37), 83-87.
Partnership for 21st Century Skills. 21
st Century Skills. Retrieved December 18, 2009 from
http://www.21stcenturyskills.org/index.php?option=com_content&task=view&id=42&It
emid=69.
Pasquerilla, J.W. (2008). The high school principal‘s perspective and role in regard to the
integration of technology into the high school and how has the principal‘s role been
impacted (Dissertation, University of Pittsburgh, 2008).
Pflaum, W.D. (2004). The technology fix: The promise and reality of computers in our schools.

111
Alexandria, VA: ASCD.
Prensky, M. (2005). What can you learn from a cell phone? Almost anything. Bracey, B. &
Culver, T. (Eds.) Harnessing the potential of ICT for education: a multistakeholder
approach. (pp.271-290). New York, NY: United Nations Information and
Communications Technologies Task Force.
Prensky, M. (2001). Digital Natives, Digital Immigrants. On the Horizon, 9 (5).
Shapiro, A.L. (1999). The control revolution. New York, NY: PublicAffairs.
Staples, A. & Pittman, J. (2003). Building Learning Communities. In Solomon, G., Allen, N.J.,
& Resta, P. (Eds.) Toward digital equity: Bridging the divide in education (pp.99-114).
Boston, MA: Allyn and Bacon.
Student Possession and Use of Telecommunication Devices, Conn. Stat. § 10-233j.
Teacher‘s College Columbia University, Heritage. (n.d.).A Legacy of Firsts. Retrieved June 11,
2010 from http://www.tc.columbia.edu/abouttc/heritage.htm?id=A+Legacy+of+Firsts.
Tapscott, D. (2008). Grown up digital. New York, NY: McGraw-Hill.
Taylor, R.P., & Budin, H.R. (1992). Teacher Training for Using Computers in Minority
Education. Teacher‘s College Register.
UNITED STATES V. AMERICAN LIBRARY ASSN., INC. Vol. number 194 US Page number
539. (2003). retrieved from http://supct.law.cornell.edu/supct/html/02-361.ZS.html
US Department of Education. (n.d.). NCLB Policy. Retrieved on April 12, 2010 from
http://www2.ed.gov/nclb/landing.jhtml.
Wiburg, K.M. & Butler, J.F. (2003). Creating Educational Access. Solomon, G., Allen,
N.J., & Resta, P. (Eds.) Toward digital equity: Bridging the divide in education (pp.1-
13). Boston, MA: Allyn and Bacon.

112
Wilson, S. (2007). A case study of the adoption of a technology-based innovation in an urban
school district: An e-portfolio initiative (Dissertation, University of Oklahoma, 2007)
Appendix A
Questionnaire

113
Appendix A
Questionnaire
Thank you for agreeing to be a part of this doctoral research study. This study is an investigation
entitled, "Future Roles of Technology in K-12 Education in Connecticut." Your input on this
topic will provide valuable insights.
The confidentiality of district responses will be maintained in the report of the findings.
There are five topics for this survey and it will take an average of ten to fifteen minutes to
complete.
Thank you in advance for your time. A copy of the findings will be sent to each participant at the
conclusion of the study.
Christianne Golesky
Doctoral Candidate
University of Bridgeport
District Name:
Which designation best fits your school district?
Urban
Suburban
Rural
What is the enrollment of your district?
Small (less than 2000)
Medium (2000-8000)
Large (8000 plus)

114
Which designation best represents your district?
Elementary (K-6, K-8)
K-12
Regional
What is your number of total years of experience as a superintendent of schools?
0-3 years
4-6 years
7+ years
What is your gender?
Male
Female
2. Applications of Technology in Education
In the future, the applications of technology in education will include:
Strongly
Disagree Disagree Agree
Strongly
Agree Undecided
a reduced number of teachers.
supplemented traditional classroom
teaching methods.
the creation of virtual schools.
reduced hours students are physically in
school.
online classes offered by districts in
addition to traditional classes.
a restructured school schedule.
a restructured school calendar.
a redefined role of teachers.
a redefinition of the education process.
college courses accessed online for both
students and staff.

115
Comments:
3. Advantages of Technology in Education
There are inherent advantages to the roles of technology in education. In the future, these
advantages will include:
Strongly
Disagree Disagree Agree
Strongly
Agree Undecided
increased parent communication.
increased monitoring of teachers.
improved quality of differentiated
instruction.
greater access to data for teachers to
inform instruction.
increased access for students with
disabilities.
paraprofessionals replaced with
technology.
reduced costs of education by replacing
teachers with technology.
a reduced number of dropouts.
improved graduation rates.
Comments:

116
4. Disadvantages of Technology in Education
There are inherent disadvantages to the roles of technology in education. In the future,
these disadvantages will include:
Strongly
Disagree Disagree Agree
Strongly
Agree Undecided
unensured accountability of student
work in online classes.
micromanagement of student
achievement by parents.
depersonalized parent to school
communication.
costs to update technologies.
rapidly changing technologies become
obsolete.
limited student access to technologies at
home.
reduced face to face interactions of
teachers and students.
reduced face to face interactions of
students.
ensured quality of online course content.
reduced teacher creativity.
reduced problem solving abilities of
students.
decreased student ethical behavior.
decreased verbal communication skills
of students.

117
Comments:
5. Ways Education Will Be Supported By Technology
In the future, technology will support education by:
Strongly
Disagree Disagree Agree
Strongly
Agree Undecided
promoting lifelong learning.
producing good citizens.
preparing a skilled workforce.
allowing for greater student
specialization.
preparing students for post-secondary
education.
developing critical thinking skills.
ensuring content knowledge.
making US education more competitive
globally.
promoting wisdom.
promoting character development.
improving student ethical behavior.
Comments:

118
6. Policies for Technology in Education
The future roles of technology in education will require changes in existing policies. In the
future, these changes in policy will include:
Strongly
Disagree Disagree Agree
Strongly
Agree Undecided
students having the option to “test out” of
required courses for graduation by
demonstrating proficiency. Students having
the option to graduate early by
demonstrating proficiency to "test out" of
required courses.
students having the option to graduate early
by increasing maximum student course loads.
students having the option to take advanced
online courses outside of their district for
graduation credit.
students having the option to take online
courses outside of their district for
graduation credit which are also offered
traditionally within the district.
students being required to take at least one
online course as a graduation requirement.
students adhering to an ethics policy for
student behaviors in online courses.
districts providing for students with limited
access to technologies at home.
teachers having ongoing professional
development in technology.
Comments:

119
Appendix B
Jury of Experts

120
Appendix B
Jury of Experts
Dr. Ann Clark
Superintendent of Schools
Fairfield Public Schools
501 Kings Highway East
Fairfield, CT 06825
Dr. George Goens
Education Consultant
P. O. Box 1775
Litchfield, CT 06759
Dr. Robert Kirschmann
University of Bridgeport
126 Park Avenue
Bridgeport, CT 06604
Dr. Jack Mulcahy
University of Bridgeport
126 Park Avenue
Bridgeport, CT 06604
Dr. John Tindall-Gibson
Superintendent of Schools
Naugatuck Public Schools

121
Appendix C
Email Letter

122
Appendix C
Email Letter
To: [Email]
From: [email protected]
Subject: Doctoral Technology Survey Participation Request
Body: My name is Christianne Golesky and I am a doctoral candidate in educational leadership
at the University of Bridgeport. The title of my dissertation is "Future Roles of
Technology in K-12 Education in Connecticut." I am seeking your participation in an
online survey of Connecticut superintendent perceptions of future technology roles. As
such, your input on this important issue is essential for accurate forecasting.
The results of the survey will be confidential, and they will not be reported by district or
individual. The results will only be reported according to demographic information using a
quasi-Delphi technique for forecasting. The survey takes approximately 10-15 minutes to
complete, and it is an exercise you will only have to do once.
I will forward you the results of my findings and conclusions once the study is completed.
Thank you for taking the time to read this, and thank you in advance for your
participation. I am truly looking forward to contributing a comprehensive analysis of
superintendent perceptions to the dialogue regarding future educational technology
decisions. Currently, I am an educator in the Fairfield Public Schools.
Sincerely,
Christianne Hanes Golesky
Doctoral Candidate
Here is a link to the survey:
http://www.surveymonkey.com/s.aspx
This link is uniquely tied to this survey and your email address. Please do not forward this message.
Please note: If you do not wish to receive further emails regarding this survey, please click the link below, and you will be
automatically removed from the mailing list. However, please reconsider as your input on this topic is essential.
http://www.surveymonkey.com/optout.aspx

123
Appendix D
Demographic Sheet

124
Appendix D
Demographic Sheet
Thank you for agreeing to be a part of this doctoral research study. This study is an investigation
entitled, "Future Roles of Technology in K-12 Education in Connecticut." Your input on this
topic will provide valuable insights.
The confidentiality of district responses will be maintained in the report of the findings.
There are five topics for this survey and it will take an average of ten to fifteen minutes to
complete.
Thank you in advance for your time. A copy of the findings will be sent to each participant at the
conclusion of the study.
Christianne Golesky
Doctoral Candidate
University of Bridgeport
District Name:
Which designation best fits your school district?
Urban
Suburban
Rural
What is the enrollment of your district?
Small (less than 2000)
Medium (2000-8000)
Large (8000 plus)
Which designation best represents your district?
Elementary (K-6, K-8)
K-12

125
Regional
What is your number of total years of experience as a superintendent of schools?
0-3 years
4-6 years
7+ years
What is your gender?
Male
Female

126
Appendix E
Responses by Urban, Suburban and Rural

127
Appendix E
Responses by Urban, Suburban and Rural
Table A1
Applications by Urban, Suburban and Rural
1. In the future, the applications of technology in education will include:
SD D A SA U M G R
a reduced number of teachers.
12.5% (1) 50.0% (4) 25.0% (2) 12.5% (1) 0.0% (0) 2 Urban 8
17.1% (7) 51.2% (21) 12.2% (5) 7.3% (3) 12.2% (5) 2 Suburban 41
17.4% (4) 30.4% (7) 17.4% (4) 13.0% (3) 21.7% (5) 2 Rural 23
supplemented traditional
classroom teaching methods.
0.0% (0) 0.0% (0) 62.5% (5) 37.5% (3) 0.0% (0) 3 Urban 8
0.0% (0) 4.9% (2) 36.6% (15) 56.1% (23) 2.4% (1) 4 Suburban 41
0.0% (0) 4.3% (1) 26.1% (6) 69.6% (16) 0.0% (0) 4 Rural 23
the creation of virtual schools.
0.0% (0) 0.0% (0) 25.0% (2) 62.5% (5) 12.5% (1) 4 Urban 8
0.0% (0) 12.2% (5) 46.3% (19) 36.6% (15) 4.9% (2) 3 Suburban 41
0.0% (0) 17.4% (4) 30.4% (7) 39.1% (9) 13.0% (3) 4 Rural 23
reduced hours students are
physically in school.
0.0% (0) 37.5% (3) 25.0% (2) 37.5% (3) 0.0% (0) 2,4 Urban 8
2.4% (1) 34.1% (14) 34.1% (14) 19.5% (8) 9.8% (4) 2,3 Suburban 41
0.0% (0) 21.7% (5) 52.2% (12) 13.0% (3) 13.0% (3) 3 Rural 23
online classes offered by districts
in addition to traditional classes.
0.0% (0) 12.5% (1) 12.5% (1) 75.0% (6) 0.0% (0) 4 Urban 8
0.0% (0) 0.0% (0) 46.3% (19) 53.7% (22) 0.0% (0) 4 Suburban 41
0.0% (0) 8.7% (2) 26.1% (6) 60.9% (14) 4.3% (1) 4 Rural 23
a restructured school schedule.
0.0% (0) 25.0% (2) 25.0% (2) 50.0% (4) 0.0% (0) 4 Urban 8
0.0% (0) 17.1% (7) 51.2% (21) 26.8% (11) 4.9% (2) 3 Suburban 41
0.0% (0) 8.7% (2) 47.8% (11) 43.5% (10) 0.0% (0) 3 Rural 23
a restructured school calendar.
0.0% (0) 25.0% (2) 25.0% (2) 25.0% (2) 25.0% (2) 2,3,4,5 Urban 8
0.0% (0) 22.0% (9) 46.3% (19) 22.0% (9) 9.8% (4) 3 Suburban 41
0.0% (0) 17.4% (4) 30.4% (7) 39.1% (9) 13.0% (3) 3 Rural 23
a redefined role of teachers.
0.0% (0) 37.5% (3) 25.0% (2) 37.5% (3) 0.0% (0) 2,4 Urban 8
0.0% (0) 9.8% (4) 61.0% (25) 29.3% (12) 0.0% (0) 3 Suburban 41
0.0% (0) 8.7% (2) 34.8% (8) 56.5% (13) 0.0% (0) 4 Rural 23
a redefinition of the education process.
0.0% (0) 12.5% (1) 50.0% (4) 37.5% (3) 0.0% (0) 3 Urban 8
0.0% (0) 14.6% (6) 65.9% (27) 19.5% (8) 0.0% (0) 3 Suburban 41
0.0% (0) 21.7% (5) 30.4% (7) 47.8% (11) 0.0% (0) 4 Rural 23
college courses accessed online for both students and staff.
0.0% (0) 0.0% (0) 25.0% (2) 75.0% (6) 0.0% (0) 4 Urban 8
0.0% (0) 0.0% (0) 46.3% (19) 53.7% (22) 0.0% (0) 4 Suburban 41
0.0% (0) 0.0% (0) 39.1% (9) 56.5% (13) 4.3% (1) 4 Rural 23
Note. SD = Strongly Disagree, D = Disagree, A = Agree, SA = Strongly Agree, U = Undecided, M = Modal Rating,
G = Group, R = Response, ( ) = actual number of responses, bold = majority.

128
Table A2
Advantages by Urban, Suburban and Rural
2. There are inherent advantages to the roles of technology in education. In the future, these advantages will
include:
SD D A SA U M G R
increased parent communication.
0.0% (0) 0.0% (0) 50.0% (4) 50.0% (4) 0.0% (0) 3,4 Urban 8
0.0% (0) 2.4% (1) 22.0% (9) 75.6% (31) 0.0% (0) 4 Suburban 41
0.0% (0) 0.0% (0) 39.1% (9) 60.9% (14) 0.0% (0) 4 Rural 23
increased monitoring of teachers.
0.0% (0) 25.0% (2) 37.5% (3) 37.5% (3) 0.0% (0) 3,4 Urban 8
0.0% (0) 24.4% (10) 39.0% (16) 29.3% (12) 7.3% (3) 3 Suburban 41
0.0% (0) 13.0% (3) 43.5% (10) 39.1% (9) 4.3% (1) 3 Rural 23
improved quality of differentiated instruction.
0.0% (0) 0.0% (0) 50.0% (4) 37.5% (3) 12.5% (1) 3 Urban 8
0.0% (0) 0.0% (0) 56.1% (23) 41.5% (17) 2.4% (1) 3 Suburban 41
0.0% (0) 0.0% (0) 43.5% (10) 52.2% (12) 4.3% (1) 4 Rural 23
greater access to data for
teachers to inform instruction.
0.0% (0) 0.0% (0) 62.5% (5) 37.5% (3) 0.0% (0) 3 Urban 8
0.0% (0) 0.0% (0) 17.1% (7) 80.5% (33) 2.4% (1) 4 Suburban 41
0.0% (0) 0.0% (0) 30.4% (7) 69.6% (16) 0.0% (0) 4 Rural 23
increased access for students
with disabilities.
0.0% (0) 12.5% (1) 37.5% (3) 50.0% (4) 0.0% (0) 4 Urban 8
0.0% (0) 0.0% (0) 41.5% (17) 58.5% (24) 0.0% (0) 4 Suburban 41
0.0% (0) 0.0% (0) 43.5% (10) 52.2% (12) 4.3% (1) 4 Rural 23
paraprofessionals replaced with technology.
12.5% (1) 50.0% (4) 0.0% (0) 12.5% (1) 25.0% (2) 2 Urban 8
7.3% (3) 61.0% (25) 17.1% (7) 7.3% (3) 7.3% (3) 2 Suburban 41
17.4% (4) 43.5% (10) 8.7% (2) 8.7% (2) 21.7% (5) 2 Rural 23
reduced costs of education by
replacing teachers with
technology.
12.5% (1) 50.0% (4) 12.5% (1) 25.0% (2) 0.0% (0) 2 Urban 8
7.3% (3) 65.9% (27) 12.2% (5) 7.3% (3) 7.3% (3) 2 Suburban 41
13.0% (3) 65.2% (15) 8.7% (2) 4.3% (1) 8.7% (2) 2 Rural 23
a reduced number of dropouts.
0.0% (0) 37.5% (3) 12.5% (1) 25.0% (2) 25.0% (2) 2 Urban 8
0.0% (0) 24.4% (10) 43.9% (18) 12.2% (5) 19.5% (8) 3 Suburban 41
0.0% (0) 13.0% (3) 39.1% (9) 8.7% (2) 39.1% (9) 3,5 Rural 23
improved graduation rates.
0.0% (0) 37.5% (3) 12.5% (1) 25.0% (2) 25.0% (2) 2 Urban 8
0.0% (0) 14.6% (6) 56.1% (23) 12.2% (5) 17.1% (7) 3 Suburban 41
0.0% (0) 17.4% (4) 43.5% (10) 13.0% (3) 26.1% (6) 3 Rural 23
Note. SD = Strongly Disagree, D = Disagree, A = Agree, SA = Strongly Agree, U = Undecided, M = Modal Rating,
G = Group, R = Response, ( ) = actual number of responses, bold = majority.

129
Table A3
Disadvantages by Urban, Suburban and Rural
3. There are inherent disadvantages to the roles of technology in education. In the future, these
disadvantages will include:
SD D A SA U M G R
unensured accountability of student work in online classes.
0.0% (0) 62.5% (5) 12.5% (1) 12.5% (1) 12.5% (1) 2 Urban 8
0.0% (0) 48.8%(20) 36.6%(15) 4.9% (2) 9.8% (4) 2 Suburban 41
8.7% (2) 39.1% (9) 52.2%(12) 0.0% (0) 0.0% (0) 2.43 Rural 23
micromanagement of student
achievement by parents.
0.0% (0) 75.0% (6) 0.0% (0) 12.5% (1) 12.5% (1) 2 Urban 8
0.0% (0) 63.4%(26) 29.3%(12) 0.0% (0) 7.3% (3) 2.15 Suburban 41
8.7% (2) 34.8% (8) 43.5%(10) 4.3% (1) 8.7% (2) 2.26 Rural 23
depersonalized parent to school
communication.
0.0% (0) 50.0% (4) 37.5% (3) 12.5% (1) 0.0% (0) 2.63 Urban 8
0.0% (0) 70.7%(29) 22.0% (9) 4.9% (2) 2.4% (1) 2.27 Suburban 41
13.0% (3) 47.8%(11) 30.4% (7) 4.3% (1) 4.3% (1) 2.17 Rural 23
costs to update technologies.
0.0% (0) 0.0% (0) 75.0% (6) 25.0% (2) 0.0% (0) 3.25 Urban 8
0.0% (0) 4.9% (2) 51.2%(21) 39.0%(16) 4.9% (2) 3.2 Suburban 41
4.3% (1) 0.0% (0) 60.9%(14) 34.8% (8) 0.0% (0) 3.26 Rural 23
rapidly changing technologies become obsolete.
0.0% (0) 0.0% (0) 75.0% (6) 25.0% (2) 0.0% (0) 3.25 Urban 8
0.0% (0) 7.3% (3) 73.2%(30) 19.5% (8) 0.0% (0) 3.12 Suburban 41
0.0% (0) 4.3% (1) 52.2%(12) 34.8% (8) 8.7% (2) 3.04 Rural 23
limited student access to
technologies at home.
0.0% (0) 62.5% (5) 25.0% (2) 12.5% (1) 0.0% (0) 2.5 Urban 8
2.4% (1) 39.0%(16) 51.2%(21) 4.9% (2) 2.4% (1) 2.54 Suburban 41
4.3% (1) 34.8% (8) 47.8%(11) 8.7% (2) 4.3% (1) 2.52 Rural 23
reduced face to face interactions of teachers and students.
0.0% (0) 25.0% (2) 50.0% (4) 12.5% (1) 12.5% (1) 2.5 Urban 8
0.0% (0) 39.0%(16) 29.3%(12) 22.0% (9) 9.8% (4) 2.54 Suburban 41
4.3% (1) 39.1% (9) 34.8% (8) 17.4% (4) 4.3% (1) 2.57 Rural 23
reduced face to face interactions
of students.
0.0% (0) 50.0% (4) 25.0% (2) 12.5% (1) 12.5% (1) 2.25 Urban 8
0.0% (0) 31.7%(13) 39.0%(16) 24.4%(10) 4.9% (2) 2.78 Suburban 41
4.3% (1) 34.8% (8) 30.4% (7) 21.7% (5) 8.7% (2) 2.52 Rural 23
ensured quality of online course content.
0.0% (0) 12.5% (1) 50.0% (4) 25.0% (2) 12.5% (1) 2.75 Urban 8
0.0% (0) 24.4%(10) 51.2%(21) 19.5% (8) 4.9% (2) 2.8 Suburban 41
8.7% (2) 17.4% (4) 56.5%(13) 8.7% (2) 8.7% (2) 2.48 Rural 23
reduced teacher creativity.
37.5% (3) 37.5% (3) 0.0% (0) 25.0% (2) 0.0% (0) 2.13 Urban 8
7.3% (3) 70.7%(29) 12.2% (5) 7.3% (3) 2.4% (1) 2.15 Suburban 41
30.4% (7) 47.8%(11) 13.0% (3) 0.0% (0) 8.7% (2) 1.65 Rural 23
reduced problem solving abilities
of students.
25.0% (2) 50.0% (4) 0.0% (0) 25.0% (2) 0.0% (0) 2.25 Urban 8
7.3% (3) 78.0%(32) 7.3% (3) 7.3% (3) 0.0% (0) 2.15 Suburban 41
43.5% (10) 39.1% (9) 4.3% (1) 0.0% (0) 13.0% (3) 1.35 Rural 23
decreased student ethical
behavior.
0.0% (0) 62.5% (5) 12.5% (1) 12.5% (1) 12.5% (1) 2.13 Urban 8
2.4% (1) 63.4%(26) 24.4%(10) 0.0% (0) 9.8% (4) 2.02 Suburban 41
21.7% (5) 30.4% (7) 8.7% (2) 8.7% (2) 30.4% (7) 1.43 Rural 23
decreased verbal communication
skills of students.
0.0% (0) 50.0% (4) 25.0% (2) 12.5% (1) 12.5% (1) 2.25 Urban 8
2.4% (1) 56.1%(23) 22.0% (9) 17.1% (7) 2.4% (1) 2.49 Suburban 41
8.7% (2) 34.8% (8) 34.8% (8) 13.0% (3) 8.7% (2) 2.35 Rural 23
Note. SD = Strongly Disagree, D = Disagree, A = Agree, SA = Strongly Agree, U = Undecided, M = Modal Rating,
G = Group, R = Response, ( ) = actual number of responses, bold = majority.

130
Table A4
Support Education by Urban, Suburban and Rural
4. In the future, technology will support education by:
SD D A SA U M G R
promoting lifelong learning.
0.0% (0) 0.0% (0) 37.5% (3) 62.5% (5) 0.0% (0) 4 Urban 8
0.0% (0) 0.0% (0) 70.7% (29) 29.3% (12) 0.0% (0) 3 Suburban 41
0.0% (0) 4.3% (1) 43.5% (10) 52.2% (12) 0.0% (0) 4 Rural 23
producing good citizens.
0.0% (0) 25.0% (2) 37.5% (3) 25.0% (2) 12.5% (1) 3 Urban 8
0.0% (0) 43.9% (18) 26.8% (11) 9.8% (4) 19.5% (8) 2 Suburban 41
0.0% (0) 30.4% (7) 30.4% (7) 8.7% (2) 30.4% (7) 2,3,5 Rural 23
preparing a skilled workforce.
0.0% (0) 0.0% (0) 62.5% (5) 37.5% (3) 0.0% (0) 3 Urban 8
0.0% (0) 0.0% (0) 63.4% (26) 24.4% (10) 12.2% (5) 3 Suburban 41
0.0% (0) 4.3% (1) 56.5% (13) 30.4% (7) 8.7% (2) 3 Rural 23
allowing for greater student specialization.
0.0% (0) 12.5% (1) 50.0% (4) 25.0% (2) 12.5% (1) 3 Urban 8
0.0% (0) 2.4% (1) 65.9% (27) 24.4% (10) 7.3% (3) 3 Suburban 41
0.0% (0) 4.3% (1) 52.2% (12) 39.1% (9) 4.3% (1) 3 Rural 23
preparing students for post-
secondary education.
0.0% (0) 0.0% (0) 62.5% (5) 37.5% (3) 0.0% (0) 3 Urban 8
0.0% (0) 4.9% (2) 68.3% (28) 24.4% (10) 2.4% (1) 3 Suburban 41
0.0% (0) 13.0% (3) 47.8% (11) 34.8% (8) 4.3% (1) 3 Rural 23
developing critical thinking skills.
0.0% (0) 0.0% (0) 50.0% (4) 50.0% (4) 0.0% (0) 3,4 Urban 8
0.0% (0) 14.6% (6) 63.4% (26) 19.5% (8) 2.4% (1) 3 Suburban 41
0.0% (0) 21.7% (5) 43.5% (10) 21.7% (5) 13.0% (3) 3 Rural 23
ensuring content knowledge.
0.0% (0) 0.0% (0) 75.0% (6) 25.0% (2) 0.0% (0) 3 Urban 8
0.0% (0) 14.6% (6) 58.5% (24) 17.1% (7) 9.8% (4) 3 Suburban 41
0.0% (0) 13.0% (3) 56.5% (13) 26.1% (6) 4.3% (1) 3 Rural 23
making US education more competitive globally.
0.0% (0) 0.0% (0) 62.5% (5) 37.5% (3) 0.0% (0) 3 Urban 8
0.0% (0) 7.3% (3) 61.0% (25) 22.0% (9) 9.8% (4) 3 Suburban 41
0.0% (0) 21.7% (5) 43.5% (10) 21.7% (5) 13.0% (3) 3 Rural 23
promoting wisdom.
12.5% (1) 12.5% (1) 37.5% (3) 25.0% (2) 12.5% (1) 3 Urban 8
2.4% (1) 53.7% (22) 19.5% (8) 2.4% (1) 22.0% (9) 2 Suburban 41
8.7% (2) 39.1% (9) 17.4% (4) 0.0% (0) 34.8% (8) 2 Rural 23
promoting character development.
0.0% (0) 37.5% (3) 25.0% (2) 12.5% (1) 25.0% (2) 2 Urban 8
4.9% (2) 56.1% (23) 17.1% (7) 2.4% (1) 19.5% (8) 2 Suburban 41
8.7% (2) 43.5% (10) 13.0% (3) 0.0% (0) 34.8% (8) 2 Rural 23
improving student ethical
behavior.
0.0% (0) 25.0% (2) 37.5% (3) 12.5% (1) 25.0% (2) 3 Urban 8
7.3% (3) 43.9% (18) 22.0% (9) 2.4% (1) 24.4% (10) 2 Suburban 41
4.3% (1) 34.8% (8) 8.7% (2) 13.0% (3) 39.1% (9) 5 Rural 23
Note. SD = Strongly Disagree, D = Disagree, A = Agree, SA = Strongly Agree, U = Undecided, M = Modal Rating,
G = Group, R = Response, ( ) = actual number of responses, bold = majority.

131
Table A5
Policy Changes by Urban, Suburban and Rural
5. The future roles of technology in education will require changes in existing policies. In the future, these
changes in policy will include:
SD D A SA U M G R
students having the option to
―test out‖ of required courses for graduation by demonstrating
proficiency. Students having the option to graduate early by
demonstrating proficiency to
"test out" of required courses.
0.0% (0) 12.5% (1) 62.5% (5) 12.5% (1) 12.5% (1) 3 Urban 8
0.0% (0) 0.0% (0) 73.2% (30) 26.8% (11) 0.0% (0) 3 Suburban 41
0.0% (0) 0.0% (0) 43.5% (10) 47.8% (11) 8.7% (2) 4 Rural 23
students having the option to
graduate early by increasing maximum student course loads.
0.0% (0) 0.0% (0) 87.5% (7) 12.5% (1) 0.0% (0) 3 Urban 8
0.0% (0) 0.0% (0) 65.9% (27) 29.3% (12) 4.9% (2) 3 Suburban 41
0.0% (0) 0.0% (0) 56.5% (13) 43.5% (10) 0.0% (0) 3 Rural 23
students having the option to take advanced online courses
outside of their district for
graduation credit.
0.0% (0) 0.0% (0) 50.0% (4) 50.0% (4) 0.0% (0) 3,4 Urban 8
0.0% (0) 0.0% (0) 53.7% (22) 46.3% (19) 0.0% (0) 3 Suburban 41
0.0% (0) 0.0% (0) 47.8% (11) 47.8% (11) 4.3% (1) 3,4 Rural 23
students having the option to
take online courses outside of their district for graduation credit
which are also offered
traditionally within the district.
0.0% (0) 12.5% (1) 50.0% (4) 25.0% (2) 12.5% (1) 3 Urban 8
0.0% (0) 12.2% (5) 51.2% (21) 34.1% (14) 2.4% (1) 3 Suburban 41
0.0% (0) 21.7% (5) 47.8% (11) 30.4% (7) 0.0% (0) 3 Rural 23
students being required to take at
least one online course as a
graduation requirement.
0.0% (0) 50.0% (4) 12.5% (1) 12.5% (1) 25.0% (2) 2 Urban 8
0.0% (0) 26.8% (11)
34.1% (14) 29.3% (12) 9.8% (4) 3 Suburban 41
0.0% (0) 4.3% (1) 47.8% (11) 34.8% (8) 13.0% (3) 3 Rural 23
students adhering to an ethics
policy for student behaviors in
online courses.
0.0% (0) 0.0% (0) 62.5% (5) 37.5% (3) 0.0% (0) 3 Urban 8
0.0% (0) 2.4% (1) 53.7% (22) 39.0% (16) 4.9% (2) 3 Suburban 41
0.0% (0) 0.0% (0) 30.4% (7) 60.9% (14) 8.7% (2) 4 Rural 23
districts providing for students
with limited access to
technologies at home.
0.0% (0) 12.5% (1) 62.5% (5) 12.5% (1) 12.5% (1) 3 Urban 8
0.0% (0) 9.8% (4) 51.2% (21) 29.3% (12) 9.8% (4) 3 Suburban 41
4.3% (1) 8.7% (2) 47.8% (11) 34.8% (8) 4.3% (1) 3 Rural 23
teachers having ongoing
professional development in
technology.
0.0% (0) 0.0% (0) 50.0% (4) 50.0% (4) 0.0% (0) 3,4 Urban 8
0.0% (0) 0.0% (0) 41.5% (17) 58.5% (24) 0.0% (0) 4 Suburban 41
0.0% (0) 0.0% (0) 17.4% (4) 82.6% (19) 0.0% (0) 4 Rural 23
Note. SD = Strongly Disagree, D = Disagree, A = Agree, SA = Strongly Agree, U = Undecided, M = Modal Rating,
G = Group, R = Response, ( ) = actual number of responses, bold = majority.

132
Appendix F
Responses by Small, Medium, and Large District Size

133
Appendix F
Responses by Small, Medium, and Large District Size
Table A6
Applications by Small, Medium and Large
1. In the future, the applications of technology in education will include:
SD D A SA U M G R
a reduced number of teachers.
20.0% (5) 36.0% (9) 20.0% (5) 8.0% (2) 16.0% (4) 2 Small 25
14.6% (6) 46.3% (19) 14.6% (6) 9.8% (4) 14.6% (6) 2 Medium 41
16.7% (1) 66.7% (4) 0.0% (0) 16.7% (1) 0.0% (0) 2 Large 6
supplemented traditional classroom teaching methods.
0.0% (0) 4.0% (1) 36.0% (9) 56.0% (14) 4.0% (1) 4 Small 25
0.0% (0) 4.9% (2) 34.1% (14) 61.0% (25) 0.0% (0) 4 Medium 41
0.0% (0) 0.0% (0) 50.0% (3) 50.0% (3) 0.0% (0) 3,4 Large 6
the creation of virtual schools.
0.0% (0) 16.0% (4) 32.0% (8) 36.0% (9) 16.0% (4) 4 Small 25
0.0% (0) 12.2% (5) 41.5% (17) 41.5% (17) 4.9% (2) 3,4 Medium 41
0.0% (0) 0.0% (0) 50.0% (3) 50.0% (3) 0.0% (0) 3,4 Large 6
reduced hours students are physically in school.
0.0% (0) 36.0% (9) 36.0% (9) 12.0% (3) 16.0% (4) 2,3 Small 25
2.4% (1) 26.8% (11) 43.9% (18) 19.5% (8) 7.3% (3) 3 Medium 41
0.0% (0) 33.3% (2) 16.7% (1) 50.0% (3) 0.0% (0) 4 Large 6
online classes offered by districts in addition to traditional classes.
0.0% (0) 8.0% (2) 36.0% (9) 52.0% (13) 4.0% (1) 4 Small 25
0.0% (0) 2.4% (1) 36.6% (15) 61.0% (25) 0.0% (0) 4 Medium 41
0.0% (0) 0.0% (0) 33.3% (2) 66.7% (4) 0.0% (0) 4 Large 6
a restructured school schedule.
0.0% (0) 16.0% (4) 60.0% (15) 24.0% (6) 0.0% (0) 3 Small 25
0.0% (0) 17.1% (7) 39.0% (16) 39.0% (16) 4.9% (2) 3,4 Medium 41
0.0% (0) 0.0% (0) 50.0% (3) 50.0% (3) 0.0% (0) 3.4 Large 6
a restructured school calendar.
0.0% (0) 20.0% (5) 48.0% (12) 20.0% (5) 12.0% (3) 3 Small 25
0.0% (0) 24.4% (10) 29.3% (12) 31.7% (13) 14.6% (6) 4 Medium 41
0.0% (0) 0.0% (0) 66.7% (4) 33.3% (2) 0.0% (0) 3 Large 6
a redefined role of teachers.
0.0% (0) 12.0% (3) 40.0% (10) 48.0% (12) 0.0% (0) 4 Small 25
0.0% (0) 9.8% (4) 56.1% (23) 34.1% (14) 0.0% (0) 3 Medium 41
0.0% (0) 33.3% (2) 33.3% (2) 33.3% (2) 0.0% (0) 2,3,4 Large 6
a redefinition of the education
process.
0.0% (0) 16.0% (4) 44.0% (11) 40.0% (10) 0.0% (0) 3 Small 25
0.0% (0) 19.5% (8) 56.1% (23) 24.4% (10) 0.0% (0) 3 Medium 41
0.0% (0) 0.0% (0) 66.7% (4) 33.3% (2) 0.0% (0) 3 Large 6
college courses accessed online
for both students and staff.
0.0% (0) 0.0% (0) 36.0% (9) 60.0% (15) 4.0% (1) 4 Small 25
0.0% (0) 0.0% (0) 46.3% (19) 53.7% (22) 0.0% (0) 4 Medium 41
0.0% (0) 0.0% (0) 33.3% (2) 66.7% (4) 0.0% (0) 4 Large 6
Note. SD = Strongly Disagree, D = Disagree, A = Agree, SA = Strongly Agree, U = Undecided, M = Modal Rating,
G = Group, R = Response, ( ) = actual number of responses, bold = majority.

134
Table A7
Advantages by Small, Medium and Large
2. There are inherent advantages to the roles of technology in education. In the future, these advantages will
include:
SD D A SA U M G R
increased parent communication.
0.0% (0) 0.0% (0) 40.0% (10) 60.0% (15) 0.0% (0) 4 Small 25
0.0% (0) 2.4% (1) 22.0% (9) 75.6% (31) 0.0% (0) 4 Medium 41
0.0% (0) 0.0% (0) 50.0% (3) 50.0% (3) 0.0% (0) 3,4 Large 6
increased monitoring of teachers.
0.0% (0) 12.0% (3) 48.0% (12) 36.0% (9) 4.0% (1) 3 Small 25
0.0% (0) 22.0% (9) 36.6% (15) 34.1% (14) 7.3% (3) 3 Medium 41
0.0% (0) 50.0% (3) 33.3% (2) 16.7% (1) 0.0% (0) 2 Large 6
improved quality of
differentiated instruction.
0.0% (0) 0.0% (0) 48.0% (12) 48.0% (12) 4.0% (1) 3,4 Small 25
0.0% (0) 0.0% (0) 51.2% (21) 43.9% (18) 4.9% (2) 3 Medium 41
0.0% (0) 0.0% (0) 66.7% (4) 33.3% (2) 0.0% (0) 3 Large 6
greater access to data for teachers to inform instruction.
0.0% (0) 0.0% (0) 24.0% (6) 76.0% (19) 0.0% (0) 4 Small 25
0.0% (0) 0.0% (0) 26.8% (11) 70.7% (29) 2.4% (1) 4 Medium 41
0.0% (0) 0.0% (0) 33.3% (2) 66.7% (4) 0.0% (0) 4 Large 6
increased access for students
with disabilities.
0.0% (0) 0.0% (0) 48.0% (12) 48.0% (12) 4.0% (1) 3,4 Small 25
0.0% (0) 0.0% (0) 41.5% (17) 58.5% (24) 0.0% (0) 4 Medium 41
0.0% (0) 16.7% (1) 16.7% (1) 66.7% (4) 0.0% (0) 4 Large 6
paraprofessionals replaced with technology.
16.0% (4) 40.0% (10) 24.0% (6) 0.0% (0) 20.0% (5) 2 Small 25
7.3% (3) 61.0% (25) 7.3% (3) 12.2% (5) 12.2% (5) 2 Medium 41
16.7% (1) 66.7% (4) 0.0% (0) 16.7% (1) 0.0% (0) 2 Large 6
reduced costs of education by
replacing teachers with
technology.
12.0% (3) 68.0% (17) 12.0% (3) 0.0% (0) 8.0% (2) 2 Small 25
7.3% (3) 63.4% (26) 12.2% (5) 9.8% (4) 7.3% (3) 2 Medium 41
16.7% (1) 50.0% (3) 0.0% (0) 33.3% (2) 0.0% (0) 2 Large 6
a reduced number of dropouts.
0.0% (0) 20.0% (5) 44.0% (11) 4.0% (1) 32.0% (8) 3 Small 25
0.0% (0) 19.5% (8) 39.0% (16) 17.1% (7) 24.4% (10) 3 Medium 41
0.0% (0) 50.0% (3) 16.7% (1) 16.7% (1) 16.7% (1) 2 Large 6
improved graduation rates.
0.0% (0) 20.0% (5) 48.0% (12) 8.0% (2) 24.0% (6) 3 Small 25
0.0% (0) 12.2% (5) 51.2% (21) 17.1% (7) 19.5% (8) 3 Medium 41
0.0% (0) 50.0% (3) 16.7% (1) 16.7% (1) 16.7% (1) 2 Large 6
Note. SD = Strongly Disagree, D = Disagree, A = Agree, SA = Strongly Agree, U = Undecided, M = Modal Rating,
G = Group, R = Response, ( ) = actual number of responses, bold = majority.

135
Table A8
Disadvantages by Small, Medium and Large
3. There are inherent disadvantages to the roles of technology in education. In the future, these
disadvantages will include:
SD D A SA U M G R
uninsured accountability of
student work in online classes.
8.0% (2) 44.0%(11) 44.0%(11) 4.0% (1) 0.0% (0) 2,3 Small 25
0.0% (0) 48.8%(20) 39.0%(16) 2.4% (1) 9.8% (4) 2 Medium 41
0.0% (0) 50.0% (3) 16.7% (1) 16.7% (1) 16.7% (1) 2 Large 6
micromanagement of student
achievement by parents.
8.0% (2) 40.0%(10) 40.0%(10) 4.0% (1) 8.0% (2) 2,3 Small 25
0.0% (0) 63.4%(26) 29.3%(12) 0.0% (0) 7.3% (3) 2 Medium 41
0.0% (0) 66.7% (4) 0.0% (0) 16.7% (1) 16.7% (1) 2 Large 6
depersonalized parent to school communication.
12.0% (3) 48.0%(12) 32.0% (8) 4.0% (1) 4.0% (1) 2 Small 25
0.0% (0) 70.7%(29) 22.0% (9) 4.9% (2) 2.4% (1) 2 Medium 41
0.0% (0) 50.0% (3) 33.3% (2) 16.7% (1) 0.0% (0) 2 Large 6
costs to update technologies.
4.0% (1) 0.0% (0) 56.0%(14) 40.0%(10) 0.0% (0) 3 Small 25
0.0% (0) 4.9% (2) 53.7%(22) 36.6%(15) 4.9% (2) 3 Medium 41
0.0% (0) 0.0% (0) 83.3% (5) 16.7% (1) 0.0% (0) 3 Large 6
rapidly changing technologies
become obsolete.
0.0% (0) 4.0% (1) 56.0%(14) 32.0% (8) 8.0% (2) 3 Small 25
0.0% (0) 4.9% (2) 73.2%(30) 22.0% (9) 0.0% (0) 3 Medium 41
0.0% (0) 16.7% (1) 66.7% (4) 16.7% (1) 0.0% (0) 3 Large 6
limited student access to technologies at home.
4.0% (1) 32.0% (8) 48.0%(12) 12.0% (3) 4.0% (1) 3 Small 25
2.4% (1) 39.0%(16) 53.7%(22) 2.4% (1) 2.4% (1) 3 Medium 41
0.0% (0) 83.3% (5) 0.0% (0) 16.7% (1) 0.0% (0) 2 Large 6
reduced face to face interactions
of teachers and students.
4.0% (1) 44.0%(11) 20.0% (5) 24.0% (6) 8.0% (2) 2 Small 25
0.0% (0) 34.1%(14) 41.5%(17) 17.1% (7) 7.3% (3) 3 Medium 41
0.0% (0) 33.3% (2) 33.3% (2) 16.7% (1) 16.7% (1) 2,3 Large 6
reduced face to face interactions of students.
4.0% (1) 40.0%(10) 24.0% (6) 24.0% (6) 8.0% (2) 2 Small 25
0.0% (0) 29.3%(12) 43.9%(18) 22.0% (9) 4.9% (2) 3 Medium 41
0.0% (0) 50.0% (3) 16.7% (1) 16.7% (1) 16.7% (1) 2 Large 6
ensured quality of online course content.
8.0% (2) 24.0% (6) 48.0%(12) 12.0% (3) 8.0% (2) 3 Small 25
0.0% (0) 19.5% (8) 56.1%(23) 17.1% (7) 7.3% (3) 3 Medium 41
0.0% (0) 16.7% (1) 50.0% (3) 33.3% (2) 0.0% (0) 3 Large 6
reduced teacher creativity.
24.0% (6) 52.0%(13) 8.0% (2) 4.0% (1) 12.0% (3) 2 Small 25
12.2% (5) 68.3%(28) 14.6% (6) 4.9% (2) 0.0% (0) 2 Medium 41
33.3% (2) 33.3% (2) 0.0% (0) 33.3% (2) 0.0% (0) 1,2,4 Large 6
reduced problem solving abilities of students.
28.0% (7) 52.0%(13) 8.0% (2) 0.0% (0) 12.0% (3) 2 Small 25
17.1% (7) 70.7%(29) 4.9% (2) 7.3% (3) 0.0% (0) 2 Medium 41
16.7% (1) 50.0% (3) 0.0% (0) 33.3% (2) 0.0% (0) 2 Large 6
decreased student ethical behavior.
16.0% (4) 36.0% (9) 4.0% (1) 8.0% (2) 36.0% (9) 2 Small 25
4.9% (2) 61.0%(25) 26.8%(11) 0.0% (0) 7.3% (3) 2 Medium 41
0.0% (0) 66.7% (4) 16.7% (1) 16.7% (1) 0.0% (0) 2 Large 6
decreased verbal communication
skills of students.
8.0% (2) 36.0% (9) 32.0% (8) 16.0% (4) 8.0% (2) 2 Small 25
2.4% (1) 56.1%(23) 22.0% (9) 14.6% (6) 4.9% (2) 2 Medium 41
0.0% (0) 50.0% (3) 33.3% (2) 16.7% (1) 0.0% (0) 2 Large 6
Note. SD = Strongly Disagree, D = Disagree, A = Agree, SA = Strongly Agree, U = Undecided, M = Modal Rating,
G = Group, R = Response, ( ) = actual number of responses, bold = majority.
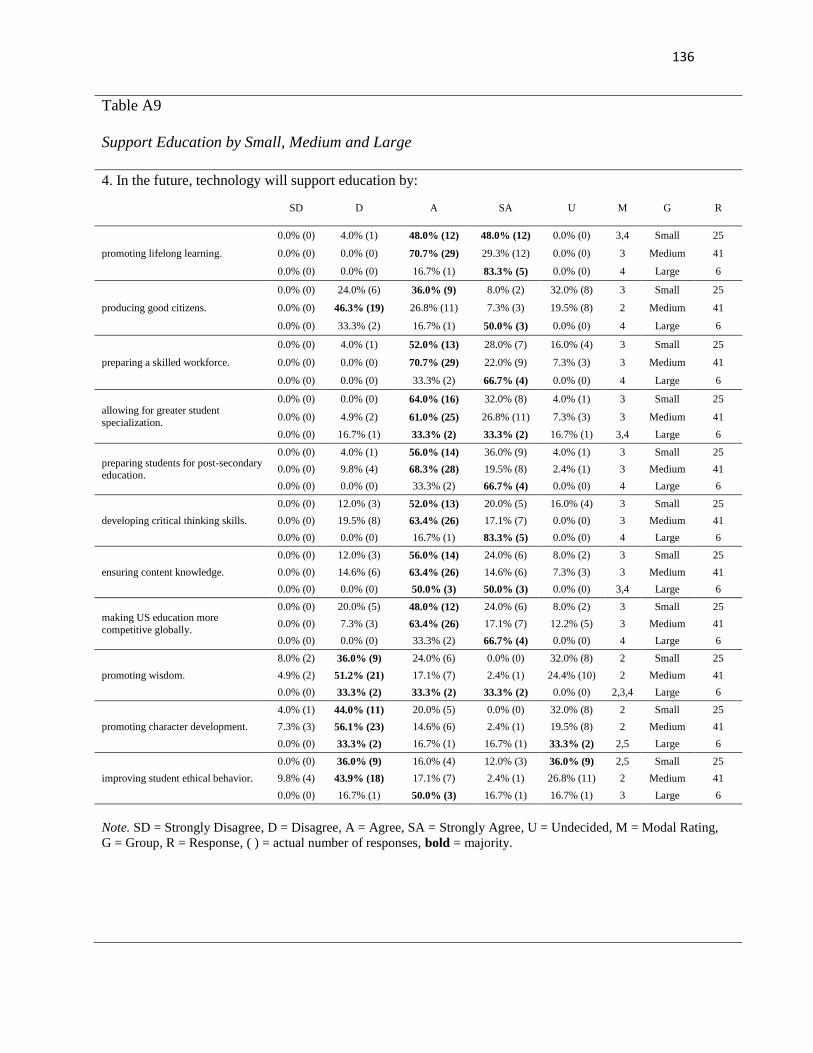
136
Table A9
Support Education by Small, Medium and Large
4. In the future, technology will support education by:
SD D A SA U M G R
promoting lifelong learning.
0.0% (0) 4.0% (1) 48.0% (12) 48.0% (12) 0.0% (0) 3,4 Small 25
0.0% (0) 0.0% (0) 70.7% (29) 29.3% (12) 0.0% (0) 3 Medium 41
0.0% (0) 0.0% (0) 16.7% (1) 83.3% (5) 0.0% (0) 4 Large 6
producing good citizens.
0.0% (0) 24.0% (6) 36.0% (9) 8.0% (2) 32.0% (8) 3 Small 25
0.0% (0) 46.3% (19) 26.8% (11) 7.3% (3) 19.5% (8) 2 Medium 41
0.0% (0) 33.3% (2) 16.7% (1) 50.0% (3) 0.0% (0) 4 Large 6
preparing a skilled workforce.
0.0% (0) 4.0% (1) 52.0% (13) 28.0% (7) 16.0% (4) 3 Small 25
0.0% (0) 0.0% (0) 70.7% (29) 22.0% (9) 7.3% (3) 3 Medium 41
0.0% (0) 0.0% (0) 33.3% (2) 66.7% (4) 0.0% (0) 4 Large 6
allowing for greater student
specialization.
0.0% (0) 0.0% (0) 64.0% (16) 32.0% (8) 4.0% (1) 3 Small 25
0.0% (0) 4.9% (2) 61.0% (25) 26.8% (11) 7.3% (3) 3 Medium 41
0.0% (0) 16.7% (1) 33.3% (2) 33.3% (2) 16.7% (1) 3,4 Large 6
preparing students for post-secondary education.
0.0% (0) 4.0% (1) 56.0% (14) 36.0% (9) 4.0% (1) 3 Small 25
0.0% (0) 9.8% (4) 68.3% (28) 19.5% (8) 2.4% (1) 3 Medium 41
0.0% (0) 0.0% (0) 33.3% (2) 66.7% (4) 0.0% (0) 4 Large 6
developing critical thinking skills.
0.0% (0) 12.0% (3) 52.0% (13) 20.0% (5) 16.0% (4) 3 Small 25
0.0% (0) 19.5% (8) 63.4% (26) 17.1% (7) 0.0% (0) 3 Medium 41
0.0% (0) 0.0% (0) 16.7% (1) 83.3% (5) 0.0% (0) 4 Large 6
ensuring content knowledge.
0.0% (0) 12.0% (3) 56.0% (14) 24.0% (6) 8.0% (2) 3 Small 25
0.0% (0) 14.6% (6) 63.4% (26) 14.6% (6) 7.3% (3) 3 Medium 41
0.0% (0) 0.0% (0) 50.0% (3) 50.0% (3) 0.0% (0) 3,4 Large 6
making US education more
competitive globally.
0.0% (0) 20.0% (5) 48.0% (12) 24.0% (6) 8.0% (2) 3 Small 25
0.0% (0) 7.3% (3) 63.4% (26) 17.1% (7) 12.2% (5) 3 Medium 41
0.0% (0) 0.0% (0) 33.3% (2) 66.7% (4) 0.0% (0) 4 Large 6
promoting wisdom.
8.0% (2) 36.0% (9) 24.0% (6) 0.0% (0) 32.0% (8) 2 Small 25
4.9% (2) 51.2% (21) 17.1% (7) 2.4% (1) 24.4% (10) 2 Medium 41
0.0% (0) 33.3% (2) 33.3% (2) 33.3% (2) 0.0% (0) 2,3,4 Large 6
promoting character development.
4.0% (1) 44.0% (11) 20.0% (5) 0.0% (0) 32.0% (8) 2 Small 25
7.3% (3) 56.1% (23) 14.6% (6) 2.4% (1) 19.5% (8) 2 Medium 41
0.0% (0) 33.3% (2) 16.7% (1) 16.7% (1) 33.3% (2) 2,5 Large 6
improving student ethical behavior.
0.0% (0) 36.0% (9) 16.0% (4) 12.0% (3) 36.0% (9) 2,5 Small 25
9.8% (4) 43.9% (18) 17.1% (7) 2.4% (1) 26.8% (11) 2 Medium 41
0.0% (0) 16.7% (1) 50.0% (3) 16.7% (1) 16.7% (1) 3 Large 6
Note. SD = Strongly Disagree, D = Disagree, A = Agree, SA = Strongly Agree, U = Undecided, M = Modal Rating,
G = Group, R = Response, ( ) = actual number of responses, bold = majority.

137
Table A10
Policy Changes by Small, Medium and Large
5. The future roles of technology in education will require changes in existing policies. In the future, these
changes in policy will include:
SD D A SA U M G R
students having the option to
―test out‖ of required courses for
graduation by demonstrating proficiency. Students having the
option to graduate early by demonstrating proficiency to
"test out" of required courses.
0.0% (0) 0.0% (0) 64.0% (16) 28.0% (7) 8.0% (2) 3 Small 25
0.0% (0) 0.0% (0) 63.4% (26) 34.1% (14) 2.4% (1) 3 Medium 41
0.0% (0) 16.7% (1) 50.0% (3) 33.3% (2) 0.0% (0) 3 Large 6
students having the option to graduate early by increasing
maximum student course loads.
0.0% (0) 0.0% (0) 68.0% (17) 32.0% (8) 0.0% (0) 3 Small 25
0.0% (0) 0.0% (0) 63.4% (26) 31.7% (13) 4.9% (2) 3 Medium 41
0.0% (0) 0.0% (0) 66.7% (4) 33.3% (2) 0.0% (0) 3 Large 6
students having the option to
take advanced online courses
outside of their district for graduation credit.
0.0% (0) 0.0% (0) 52.0% (13) 44.0% (11) 4.0% (1) 3 Small 25
0.0% (0) 0.0% (0) 51.2% (21) 48.8% (20) 0.0% (0) 3 Medium 41
0.0% (0) 0.0% (0) 50.0% (3) 50.0% (3) 0.0% (0) 3,4 Large 6
students having the option to
take online courses outside of their district for graduation credit
which are also offered
traditionally within the district.
0.0% (0) 28.0% (7) 44.0% (11) 28.0% (7) 0.0% (0) 3 Small 25
0.0% (0) 9.8% (4) 51.2% (21) 34.1% (14) 4.9% (2) 3 Medium 41
0.0% (0) 0.0% (0) 66.7% (4) 33.3% (2) 0.0% (0) 3 Large 6
students being required to take at
least one online course as a graduation requirement.
0.0% (0) 20.0% (5) 40.0% (10) 24.0% (6) 16.0% (4) 3 Small 25
0.0% (0) 17.1% (7) 39.0% (16) 34.1% (14) 9.8% (4) 3 Medium 41
0.0% (0) 66.7% (4) 0.0% (0) 16.7% (1) 16.7% (1) 2 Large 6
students adhering to an ethics
policy for student behaviors in
online courses.
0.0% (0) 0.0% (0) 40.0% (10) 52.0% (13) 8.0% (2) 4 Small 25
0.0% (0) 2.4% (1) 51.2% (21) 41.5% (17) 4.9% (2) 3 Medium 41
0.0% (0) 0.0% (0) 50.0% (3) 50.0% (3) 0.0% (0) 3,4 Large 6
districts providing for students with limited access to
technologies at home.
4.0% (1) 8.0% (2) 48.0% (12) 28.0% (7) 12.0% (3) 3 Small 25
0.0% (0) 9.8% (4) 56.1% (23) 29.3% (12) 4.9% (2) 3 Medium 41
0.0% (0) 16.7% (1) 33.3% (2) 33.3% (2) 16.7% (1) 3,4 Large 6
teachers having ongoing professional development in
technology.
0.0% (0) 0.0% (0) 28.0% (7) 72.0% (18) 0.0% (0) 4 Small 25
0.0% (0) 0.0% (0) 39.0% (16) 61.0% (25) 0.0% (0) 4 Medium 41
0.0% (0) 0.0% (0) 33.3% (2) 66.7% (4) 0.0% (0) 4 Large 6
Note. SD = Strongly Disagree, D = Disagree, A = Agree, SA = Strongly Agree, U = Undecided, M = Modal Rating,
G = Group, R = Response, ( ) = actual number of responses, bold = majority.

138
Appendix G
Responses by Elementary, K-12 and Regional

139
Appendix G
Responses by Elementary, K-12 and Regional
Table A11
Applications by Elementary, K-12 and Regional
1. In the future, the applications of technology in education will include:
SD D A SA U M G R
a reduced number of teachers.
16.7% (2) 50.0% (6) 16.7% (2) 0.0% (0) 16.7% (2) 2 Elementary 12
18.2% (10) 45.5% (25) 14.5% (8) 9.1% (5) 12.7% (7) 2 K-12 55
0.0% (0) 25.0% (1) 25.0% (1) 25.0% (1) 25.0% (1) 2,3,4,5 Regional 4
supplemented traditional
classroom teaching methods.
0.0% (0) 0.0% (0) 41.7% (5) 58.3% (7) 0.0% (0) 4 Elementary 12
0.0% (0) 5.5% (3) 38.2% (21) 56.4% (31) 0.0% (0) 4 K-12 55
0.0% (0) 0.0% (0) 0.0% (0) 75.0% (3) 25.0% (1) 4 Regional 4
the creation of virtual schools.
0.0% (0) 33.3% (4) 16.7% (2) 33.3% (4) 16.7% (2) 2,4 Elementary 12
0.0% (0) 9.1% (5) 41.8% (23) 41.8% (23) 7.3% (4) 3,4 K-12 55
0.0% (0) 0.0% (0) 75.0% (3) 25.0% (1) 0.0% (0) 3 Regional 4
reduced hours students are
physically in school.
0.0% (0) 33.3% (4) 33.3% (4) 8.3% (1) 25.0% (3) 2,3 Elementary 12
1.8% (1) 29.1% (16) 41.8% (23) 20.0% (11) 7.3% (4) 3 K-12 55
0.0% (0) 50.0% (2) 25.0% (1) 25.0% (1) 0.0% (0) 2 Regional 4
online classes offered by districts in addition to traditional classes.
0.0% (0) 16.7% (2) 33.3% (4) 50.0% (6) 0.0% (0) 4 Elementary 12
0.0% (0) 1.8% (1) 38.2% (21) 58.2% (32) 1.8% (1) 4 K-12 55
0.0% (0) 0.0% (0) 25.0% (1) 75.0% (3) 0.0% (0) 4 Regional 4
a restructured school schedule.
0.0% (0) 25.0% (3) 50.0% (6) 25.0% (3) 0.0% (0) 3 Elementary 12
0.0% (0) 12.7% (7) 47.3% (26) 36.4% (20) 3.6% (2) 3 K-12 55
0.0% (0) 25.0% (1) 50.0% (2) 25.0% (1) 0.0% (0) 3 Regional 4
a restructured school calendar.
0.0% (0) 33.3% (4) 33.3% (4) 16.7% (2) 16.7% (2) 2,3 Elementary 12
0.0% (0) 18.2% (10) 40.0% (22) 29.1% (16) 12.7% (7) 3 K-12 55
0.0% (0) 25.0% (1) 50.0% (2) 25.0% (1) 0.0% (0) 3 Regional 4
a redefined role of teachers.
0.0% (0) 8.3% (1) 41.7% (5) 50.0% (6) 0.0% (0) 4 Elementary 12
0.0% (0) 14.5% (8) 52.7% (29) 32.7% (18) 0.0% (0) 3 K-12 55
0.0% (0) 0.0% (0) 25.0% (1) 75.0% (3) 0.0% (0) 4 Regional 4
a redefinition of the education
process.
0.0% (0) 16.7% (2) 50.0% (6) 33.3% (4) 0.0% (0) 3 Elementary 12
0.0% (0) 18.2% (10) 54.5% (30) 27.3% (15) 0.0% (0) 3 K-12 55
0.0% (0) 0.0% (0) 50.0% (2) 50.0% (2) 0.0% (0) 3,4 Regional 4
college courses accessed online
for both students and staff.
0.0% (0) 0.0% (0) 50.0% (6) 50.0% (6) 0.0% (0) 3,4 Elementary 12
0.0% (0) 0.0% (0) 41.8% (23) 58.2% (32) 0.0% (0) 4 K-12 55
0.0% (0) 0.0% (0) 25.0% (1) 50.0% (2) 25.0% (1) 4 Regional 4
Note. SD = Strongly Disagree, D = Disagree, A = Agree, SA = Strongly Agree, U = Undecided, M = Modal Rating,
G = Group, R = Response, ( ) = actual number of responses, bold = majority.

140
Table A12
Advantages by Elementary, K-12 and Regional
2. There are inherent advantages to the roles of technology in education. In the future, these advantages will
include:
SD D A SA U M G R
increased parent communication.
0.0% (0) 0.0% (0) 41.7% (5) 58.3% (7) 0.0% (0) 4 Elementary 12
0.0% (0) 1.8% (1) 27.3% (15) 70.9% (39) 0.0% (0) 4 K-12 55
0.0% (0) 0.0% (0) 50.0% (2) 50.0% (2) 0.0% (0) 3,4 Regional 4
increased monitoring of teachers.
0.0% (0) 8.3% (1) 66.7% (8) 16.7% (2) 8.3% (1) 3 Elementary 12
0.0% (0) 25.5% (14) 36.4% (20) 32.7% (18) 5.5% (3) 3 K-12 55
0.0% (0) 0.0% (0) 25.0% (1) 75.0% (3) 0.0% (0) 4 Regional 4
improved quality of differentiated instruction.
0.0% (0) 0.0% (0) 50.0% (6) 41.7% (5) 8.3% (1) 3 Elementary 12
0.0% (0) 0.0% (0) 52.7% (29) 43.6% (24) 3.6% (2) 3 K-12 55
0.0% (0) 0.0% (0) 50.0% (2) 50.0% (2) 0.0% (0) 3,4 Regional 4
greater access to data for
teachers to inform instruction.
0.0% (0) 0.0% (0) 41.7% (5) 58.3% (7) 0.0% (0) 4 Elementary 12
0.0% (0) 0.0% (0) 25.5% (14) 72.7% (40) 1.8% (1) 4 K-12 55
0.0% (0) 0.0% (0) 0.0% (0) 100.0% (4) 0.0% (0) 4 Regional 4
increased access for students with disabilities.
0.0% (0) 0.0% (0) 50.0% (6) 41.7% (5) 8.3% (1) 3 Elementary 12
0.0% (0) 1.8% (1) 40.0% (22) 58.2% (32) 0.0% (0) 4 K-12 55
0.0% (0) 0.0% (0) 50.0% (2) 50.0% (2) 0.0% (0) 3,4 Regional 4
paraprofessionals replaced with technology.
16.7% (2) 41.7% (5) 25.0% (3) 0.0% (0) 16.7% (2) 2 Elementary 12
7.3% (4) 61.8% (34) 9.1% (5) 9.1% (5) 12.7% (7) 2 K-12 55
50.0% (2) 0.0% (0) 25.0% (1) 0.0% (0) 25.0% (1) 1 Regional 4
reduced costs of education by
replacing teachers with
technology.
25.0% (3) 50.0% (6) 16.7% (2) 0.0% (0) 8.3% (1) 2 Elementary 12
7.3% (4) 67.3% (37) 9.1% (5) 9.1% (5) 7.3% (4) 2 K-12 55
0.0% (0) 75.0% (3) 25.0% (1) 0.0% (0) 0.0% (0) 2 Regional 4
a reduced number of dropouts.
0.0% (0) 8.3% (1) 58.3% (7) 0.0% (0) 33.3% (4) 3 Elementary 12
0.0% (0) 23.6% (13) 36.4% (20) 14.5% (8) 25.5% (14) 3 K-12 55
0.0% (0) 50.0% (2) 25.0% (1) 0.0% (0) 25.0% (1) 2 Regional 4
improved graduation rates.
0.0% (0) 8.3% (1) 58.3% (7) 8.3% (1) 25.0% (3) 3 Elementary 12
0.0% (0) 18.2% (10) 45.5% (25) 14.5% (8) 21.8% (12) 3 K-12 55
0.0% (0) 50.0% (2) 50.0% (2) 0.0% (0) 0.0% (0) 2,3 Regional 4
Note. SD = Strongly Disagree, D = Disagree, A = Agree, SA = Strongly Agree, U = Undecided, M = Modal Rating,
G = Group, R = Response, ( ) = actual number of responses, bold = majority.

141
Table A13
Disadvantages by Elementary, K-12 and Regional
3. There are inherent disadvantages to the roles of technology in education. In the future, these
disadvantages will include:
SD D A SA U M G R
unensured accountability of student
work in online classes.
8.3% (1) 33.3% (4) 58.3% (7) 0.0% (0) 0.0% (0) 3 Elementary 12
0.0% (0) 52.7%(29) 36.4%(20) 1.8% (1) 9.1% (5) 2 K-12 55
25.0% (1) 25.0% (1) 25.0% (1) 25.0% (1) 0.0% (0) 1,2,3,4 Regional 4
micromanagement of student achievement by parents.
8.3% (1) 41.7% (5) 25.0% (3) 8.3% (1) 16.7% (2) 2 Elementary 12
0.0% (0) 63.6%(35) 29.1%(16) 0.0% (0) 7.3% (4) 2 K-12 55
25.0% (1) 0.0% (0) 75.0% (3) 0.0% (0) 0.0% (0) 3 Regional 4
depersonalized parent to school
communication.
16.7% (2) 50.0% (6) 16.7% (2) 8.3% (1) 8.3% (1) 2 Elementary 12
0.0% (0) 67.3%(37) 29.1%(16) 1.8% (1) 1.8% (1) 2 K-12 55
25.0% (1) 25.0% (1) 25.0% (1) 25.0% (1) 0.0% (0) 1,2,3,4 Regional 4
costs to update technologies.
0.0% (0) 0.0% (0) 50.0% (6) 50.0% (6) 0.0% (0) 3,4 Elementary 12
0.0% (0) 3.6% (2) 61.8%(34) 30.9%(17) 3.6% (2) 3 K-12 55
25.0% (1) 0.0% (0) 25.0% (1) 50.0% (2) 0.0% (0) 4 Regional 4
rapidly changing technologies
become obsolete.
0.0% (0) 0.0% (0) 66.7% (8) 25.0% (3) 8.3% (1) 3 Elementary 12
0.0% (0) 7.3% (4) 70.9%(39) 21.8%(12) 0.0% (0) 3 K-12 55
0.0% (0) 0.0% (0) 25.0% (1) 50.0% (2) 25.0% (1) 4 Regional 4
limited student access to
technologies at home.
0.0% (0) 41.7% (5) 41.7% (5) 8.3% (1) 8.3% (1) 2,3 Elementary 12
1.8% (1) 40.0%(22) 50.9%(28) 5.5% (3) 1.8% (1) 3 K-12 55
25.0% (1) 50.0% (2) 25.0% (1) 0.0% (0) 0.0% (0) 2 Regional 4
reduced face to face interactions of
teachers and students.
8.3% (1) 50.0% (6) 25.0% (3) 8.3% (1) 8.3% (1) 2 Elementary 12
0.0% (0) 36.4%(20) 38.2%(21) 16.4% (9) 9.1% (5) 3 K-12 55
0.0% (0) 25.0% (1) 0.0% (0) 75.0% (3) 0.0% (0) 4 Regional 4
reduced face to face interactions of
students.
8.3% (1) 58.3% (7) 8.3% (1) 8.3% (1) 16.7% (2) 2 Elementary 12
0.0% (0) 32.7%(18) 41.8%(23) 20.0%(11) 5.5% (3) 3 K-12 55
0.0% (0) 0.0% (0) 25.0% (1) 75.0% (3) 0.0% (0) 4 Regional 4
ensured quality of online course
content.
8.3% (1) 25.0% (3) 50.0% (6) 0.0% (0) 16.7% (2) 3 Elementary 12
1.8% (1) 21.8%(12) 54.5%(30) 16.4% (9) 5.5% (3) 3 K-12 55
0.0% (0) 0.0% (0) 50.0% (2) 50.0% (2) 0.0% (0) 3,4 Regional 4
reduced teacher creativity.
33.3% (4) 50.0% (6) 0.0% (0) 0.0% (0) 16.7% (2) 2 Elementary 12
14.5% (8) 65.5%(36) 10.9% (6) 7.3% (4) 1.8% (1) 2 K-12 55
25.0% (1) 25.0% (1) 50.0% (2) 0.0% (0) 0.0% (0) 3 Regional 4
reduced problem solving abilities of students.
33.3% (4) 41.7% (5) 0.0% (0) 0.0% (0) 25.0% (3) 2 Elementary 12
18.2% (10) 69.1%(38) 5.5% (3) 7.3% (4) 0.0% (0) 2 K-12 55
25.0% (1) 50.0% (2) 25.0% (1) 0.0% (0) 0.0% (0) 2 Regional 4
decreased student ethical behavior.
25.0% (3) 25.0% (3) 8.3% (1) 16.7% (2) 25.0% (3) 1,2,5 Elementary 12
3.6% (2) 60.0%(33) 21.8%(12) 0.0% (0) 14.5% (8) 2 K-12 55
25.0% (1) 50.0% (2) 0.0% (0) 0.0% (0) 25.0% (1) 2 Regional 4
decreased verbal communication skills of students.
16.7% (2) 41.7% (5) 25.0% (3) 8.3% (1) 8.3% (1) 2 Elementary 12
1.8% (1) 52.7% (29) 27.3% (15) 12.7% (7) 5.5% (3) 2 K-12 55
0.0% (0) 25.0% (1) 25.0% (1) 50.0% (2) 0.0% (0) 4 Regional 4
Note. SD = Strongly Disagree, D = Disagree, A = Agree, SA = Strongly Agree, U = Undecided, M = Modal Rating,
G = Group, R = Response, ( ) = actual number of responses, bold = majority.

142
Table A14
Support Education by Elementary, K-12 and Regional
4. In the future, technology will support education by:
SD D A SA U M G R
promoting lifelong learning.
0.0% (0) 8.3% (1) 50.0% (6) 41.7% (5) 0.0% (0) 3 Elementary 12
0.0% (0) 0.0% (0) 61.8% (34) 38.2% (21) 0.0% (0) 3 K-12 55
0.0% (0) 0.0% (0) 50.0% (2) 50.0% (2) 0.0% (0) 3,4 Regional 4
producing good citizens.
0.0% (0) 25.0% (3) 41.7% (5) 0.0% (0) 33.3% (4) 3 Elementary 12
0.0% (0) 38.2% (21) 29.1% (16) 10.9% (6) 21.8% (12) 2 K-12 55
0.0% (0) 75.0% (3) 0.0% (0) 25.0% (1) 0.0% (0) 2 Regional 4
preparing a skilled workforce.
0.0% (0) 8.3% (1) 66.7% (8) 8.3% (1) 16.7% (2) 3 Elementary 12
0.0% (0) 0.0% (0) 60.0% (33) 30.9% (17) 9.1% (5) 3 K-12 55
0.0% (0) 0.0% (0) 75.0% (3) 25.0% (1) 0.0% (0) 3 Regional 4
allowing for greater student
specialization.
0.0% (0) 0.0% (0) 75.0% (9) 16.7% (2) 8.3% (1) 3 Elementary 12
0.0% (0) 5.5% (3) 58.2% (32) 29.1% (16) 7.3% (4) 3 K-12 55
0.0% (0) 0.0% (0) 50.0% (2) 50.0% (2) 0.0% (0) 3,4 Regional 4
preparing students for post-
secondary education.
0.0% (0) 8.3% (1) 66.7% (8) 16.7% (2) 8.3% (1) 3 Elementary 12
0.0% (0) 7.3% (4) 60.0% (33) 30.9% (17) 1.8% (1) 3 K-12 55
0.0% (0) 0.0% (0) 75.0% (3) 25.0% (1) 0.0% (0) 3 Regional 4
developing critical thinking skills.
0.0% (0) 16.7% (2) 50.0% (6) 8.3% (1) 25.0% (3) 3 Elementary 12
0.0% (0) 14.5% (8) 58.2% (32) 25.5% (14) 1.8% (1) 3 K-12 55
0.0% (0) 25.0% (1) 50.0% (2) 25.0% (1) 0.0% (0) 3 Regional 4
ensuring content knowledge.
0.0% (0) 8.3% (1) 66.7% (8) 16.7% (2) 8.3% (1) 3 Elementary 12
0.0% (0) 10.9% (6) 61.8% (34) 20.0% (11) 7.3% (4) 3 K-12 55
0.0% (0) 50.0% (2) 25.0% (1) 25.0% (1) 0.0% (0) 2 Regional 4
making US education more
competitive globally.
0.0% (0) 8.3% (1) 58.3% (7) 16.7% (2) 16.7% (2) 3 Elementary 12
0.0% (0) 9.1% (5) 56.4% (31) 25.5% (14) 9.1% (5) 3 K-12 55
0.0% (0) 50.0% (2) 50.0% (2) 0.0% (0) 0.0% (0) 2,3 Regional 4
promoting wisdom.
8.3% (1) 33.3% (4) 33.3% (4) 0.0% (0) 25.0% (3) 2,3 Elementary 12
3.6% (2) 47.3% (26) 18.2% (10) 3.6% (2) 27.3% (15) 2 K-12 55
25.0% (1) 50.0% (2) 25.0% (1) 0.0% (0) 0.0% (0) 2 Regional 4
promoting character development.
0.0% (0) 41.7% (5) 33.3% (4) 0.0% (0) 25.0% (3) 2 Elementary 12
5.5% (3) 52.7% (29) 14.5% (8) 1.8% (1) 25.5% (14) 2 K-12 55
25.0% (1) 50.0% (2) 0.0% (0) 0.0% (0) 25.0% (1) 2 Regional 4
improving student ethical behavior.
0.0% (0) 33.3% (4) 33.3% (4) 16.7% (2) 16.7% (2) 2,3 Elementary 12
7.3% (4) 38.2% (21) 18.2% (10) 1.8% (1) 34.5% (19) 2 K-12 55
0.0% (0) 75.0% (3) 0.0% (0) 25.0% (1) 0.0% (0) 2 Regional 4
Note. SD = Strongly Disagree, D = Disagree, A = Agree, SA = Strongly Agree, U = Undecided, M = Modal Rating,
G = Group, R = Response, ( ) = actual number of responses, bold = majority.

143
Table A15
Policy Changes by Elementary, K-12 and Regional
5. The future roles of technology in education will require changes in existing policies. In the future, these
changes in policy will include:
SD D A SA U M G R
students having the option to ―test out‖ of required courses for graduation by
demonstrating proficiency. Students
having the option to graduate early by demonstrating proficiency to "test out" of
required courses.
0.0% (0) 0.0% (0) 66.7% (8) 16.7% (2) 16.7% (2) 3 Elementary 12
0.0% (0) 1.8% (1) 65.5% (36) 30.9% (17) 1.8% (1) 3 K-12 55
0.0% (0) 0.0% (0) 25.0% (1) 75.0% (3) 0.0% (0) 4 Regional 4
students having the option to graduate
early by increasing maximum student
course loads.
0.0% (0) 0.0% (0) 75.0% (9) 25.0% (3) 0.0% (0) 3 Elementary 12
0.0% (0) 0.0% (0) 65.5% (36) 30.9% (17) 3.6% (2) 3 K-12 55
0.0% (0) 0.0% (0) 50.0% (2) 50.0% (2) 0.0% (0) 3,4 Regional 4
students having the option to take
advanced online courses outside of their
district for graduation credit.
0.0% (0) 0.0% (0) 50.0% (6) 41.7% (5) 8.3% (1) 3 Elementary 12
0.0% (0) 0.0% (0) 54.5% (30) 45.5% (25) 0.0% (0) 3 K-12 55
0.0% (0) 0.0% (0) 25.0% (1) 75.0% (3) 0.0% (0) 4 Regional 4
students having the option to take online
courses outside of their district for
graduation credit which are also offered traditionally within the district.
0.0% (0) 33.3% (4) 50.0% (6) 16.7% (2) 0.0% (0) 3 Elementary 12
0.0% (0) 10.9% (6) 54.5% (30) 30.9% (17) 3.6% (2) 3 K-12 55
0.0% (0) 25.0% (1) 0.0% (0) 75.0% (3) 0.0% (0) 4 Regional 4
students being required to take at least
one online course as a graduation
requirement.
0.0% (0) 16.7% (2) 50.0% (6) 8.3% (1) 25.0% (3) 3 Elementary 12
0.0% (0) 23.6% (13) 36.4% (20) 29.1% (16) 10.9% (6) 3 K-12 55
0.0% (0) 25.0% (1) 0.0% (0) 75.0% (3) 0.0% (0) 4 Regional 4
students adhering to an ethics policy for student behaviors in online courses.
0.0% (0) 0.0% (0) 41.7% (5) 50.0% (6) 8.3% (1) 4 Elementary 12
0.0% (0) 1.8% (1) 50.9% (28) 43.6% (24) 3.6% (2) 3 K-12 55
0.0% (0) 0.0% (0) 25.0% (1) 50.0% (2) 25.0% (1) 4 Regional 4
districts providing for students with limited access to technologies at home.
0.0% (0) 0.0% (0) 66.7% (8) 25.0% (3) 8.3% (1) 3 Elementary 12
0.0% (0) 12.7% (7) 49.1% (27) 29.1% (16) 9.1% (5) 3 K-12 55
25.0% (1) 0.0% (0) 50.0% (2) 25.0% (1) 0.0% (0) 3 Regional 4
teachers having ongoing professional development in technology.
0.0% (0) 0.0% (0) 50.0% (6) 50.0% (6) 0.0% (0) 3,4 Elementary 12
0.0% (0) 0.0% (0) 34.5% (19) 65.5% (36) 0.0% (0) 4 K-12 55
0.0% (0) 0.0% (0) 0.0% (0) 100.0% (4) 0.0% (0) 4 Regional 4
Note. SD = Strongly Disagree, D = Disagree, A = Agree, SA = Strongly Agree, U = Undecided, M = Modal Rating,
G = Group, R = Response, ( ) = actual number of responses, bold = majority.
144
Appendix H
Responses by Superintendent Years of Experience
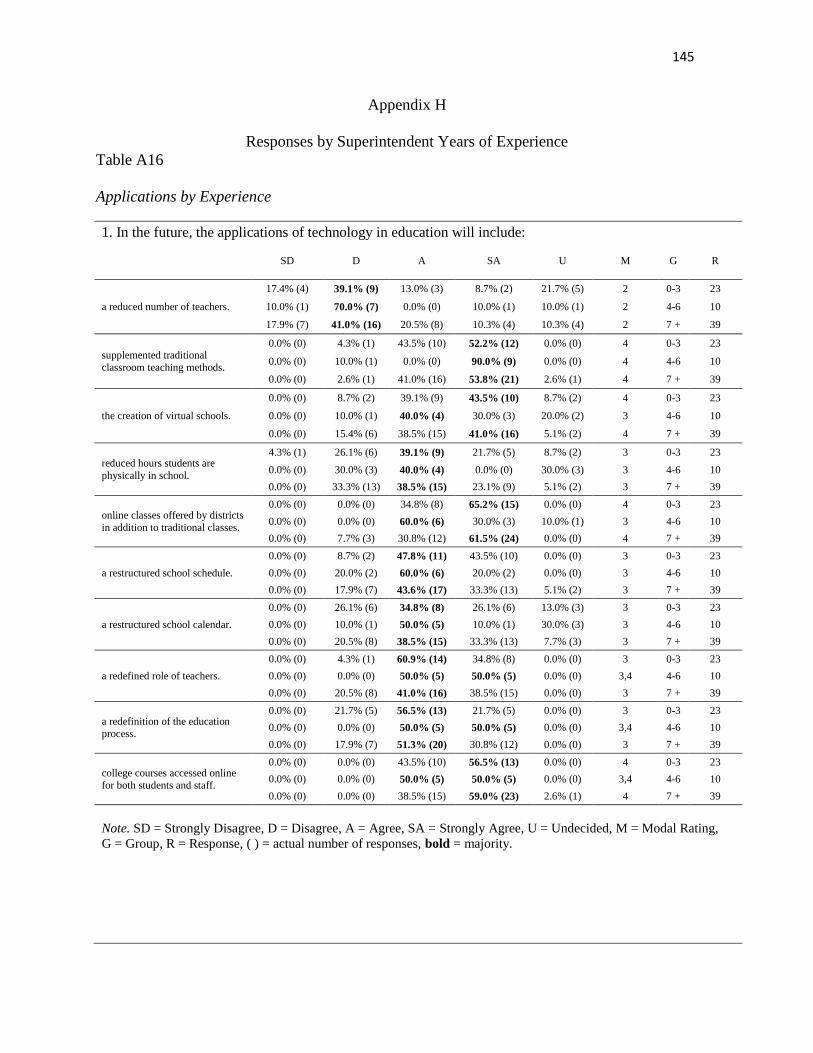
145
Appendix H
Responses by Superintendent Years of Experience
Table A16
Applications by Experience
1. In the future, the applications of technology in education will include:
SD D A SA U M G R
a reduced number of teachers.
17.4% (4) 39.1% (9) 13.0% (3) 8.7% (2) 21.7% (5) 2 0-3 23
10.0% (1) 70.0% (7) 0.0% (0) 10.0% (1) 10.0% (1) 2 4-6 10
17.9% (7) 41.0% (16) 20.5% (8) 10.3% (4) 10.3% (4) 2 7 + 39
supplemented traditional
classroom teaching methods.
0.0% (0) 4.3% (1) 43.5% (10) 52.2% (12) 0.0% (0) 4 0-3 23
0.0% (0) 10.0% (1) 0.0% (0) 90.0% (9) 0.0% (0) 4 4-6 10
0.0% (0) 2.6% (1) 41.0% (16) 53.8% (21) 2.6% (1) 4 7 + 39
the creation of virtual schools.
0.0% (0) 8.7% (2) 39.1% (9) 43.5% (10) 8.7% (2) 4 0-3 23
0.0% (0) 10.0% (1) 40.0% (4) 30.0% (3) 20.0% (2) 3 4-6 10
0.0% (0) 15.4% (6) 38.5% (15) 41.0% (16) 5.1% (2) 4 7 + 39
reduced hours students are
physically in school.
4.3% (1) 26.1% (6) 39.1% (9) 21.7% (5) 8.7% (2) 3 0-3 23
0.0% (0) 30.0% (3) 40.0% (4) 0.0% (0) 30.0% (3) 3 4-6 10
0.0% (0) 33.3% (13) 38.5% (15) 23.1% (9) 5.1% (2) 3 7 + 39
online classes offered by districts
in addition to traditional classes.
0.0% (0) 0.0% (0) 34.8% (8) 65.2% (15) 0.0% (0) 4 0-3 23
0.0% (0) 0.0% (0) 60.0% (6) 30.0% (3) 10.0% (1) 3 4-6 10
0.0% (0) 7.7% (3) 30.8% (12) 61.5% (24) 0.0% (0) 4 7 + 39
a restructured school schedule.
0.0% (0) 8.7% (2) 47.8% (11) 43.5% (10) 0.0% (0) 3 0-3 23
0.0% (0) 20.0% (2) 60.0% (6) 20.0% (2) 0.0% (0) 3 4-6 10
0.0% (0) 17.9% (7) 43.6% (17) 33.3% (13) 5.1% (2) 3 7 + 39
a restructured school calendar.
0.0% (0) 26.1% (6) 34.8% (8) 26.1% (6) 13.0% (3) 3 0-3 23
0.0% (0) 10.0% (1) 50.0% (5) 10.0% (1) 30.0% (3) 3 4-6 10
0.0% (0) 20.5% (8) 38.5% (15) 33.3% (13) 7.7% (3) 3 7 + 39
a redefined role of teachers.
0.0% (0) 4.3% (1) 60.9% (14) 34.8% (8) 0.0% (0) 3 0-3 23
0.0% (0) 0.0% (0) 50.0% (5) 50.0% (5) 0.0% (0) 3,4 4-6 10
0.0% (0) 20.5% (8) 41.0% (16) 38.5% (15) 0.0% (0) 3 7 + 39
a redefinition of the education
process.
0.0% (0) 21.7% (5) 56.5% (13) 21.7% (5) 0.0% (0) 3 0-3 23
0.0% (0) 0.0% (0) 50.0% (5) 50.0% (5) 0.0% (0) 3,4 4-6 10
0.0% (0) 17.9% (7) 51.3% (20) 30.8% (12) 0.0% (0) 3 7 + 39
college courses accessed online
for both students and staff.
0.0% (0) 0.0% (0) 43.5% (10) 56.5% (13) 0.0% (0) 4 0-3 23
0.0% (0) 0.0% (0) 50.0% (5) 50.0% (5) 0.0% (0) 3,4 4-6 10
0.0% (0) 0.0% (0) 38.5% (15) 59.0% (23) 2.6% (1) 4 7 + 39
Note. SD = Strongly Disagree, D = Disagree, A = Agree, SA = Strongly Agree, U = Undecided, M = Modal Rating,
G = Group, R = Response, ( ) = actual number of responses, bold = majority.
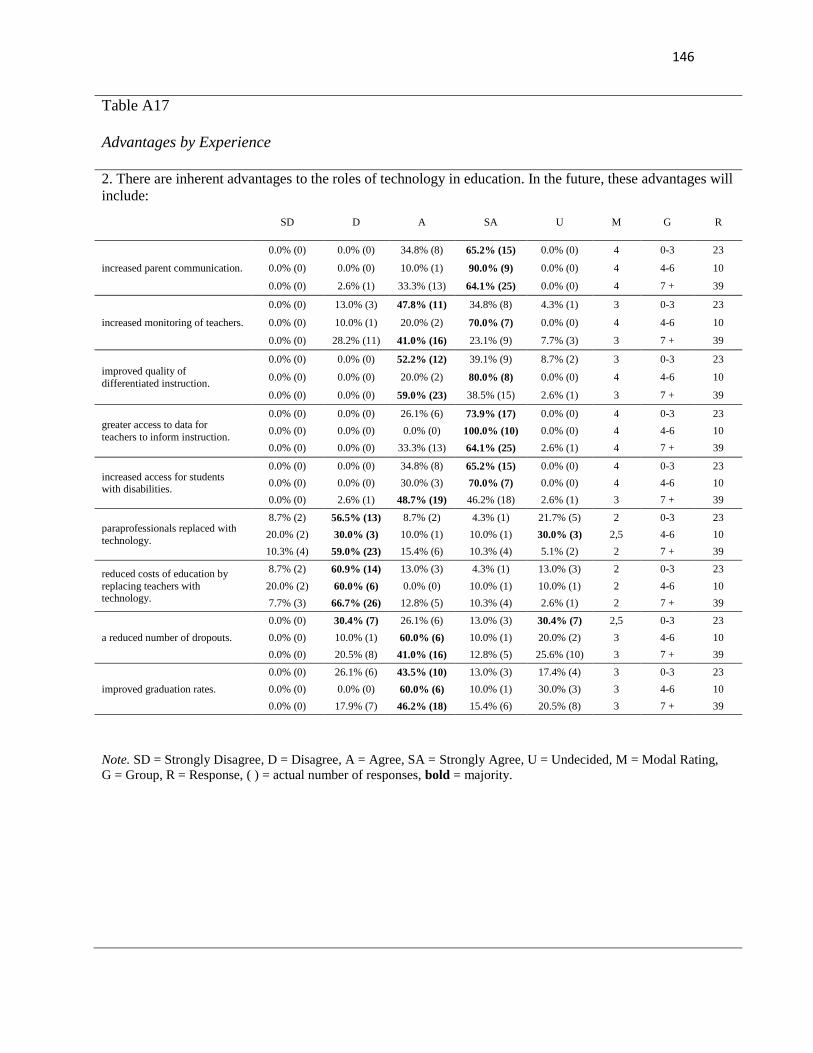
146
Table A17
Advantages by Experience
2. There are inherent advantages to the roles of technology in education. In the future, these advantages will
include:
SD D A SA U M G R
increased parent communication.
0.0% (0) 0.0% (0) 34.8% (8) 65.2% (15) 0.0% (0) 4 0-3 23
0.0% (0) 0.0% (0) 10.0% (1) 90.0% (9) 0.0% (0) 4 4-6 10
0.0% (0) 2.6% (1) 33.3% (13) 64.1% (25) 0.0% (0) 4 7 + 39
increased monitoring of teachers.
0.0% (0) 13.0% (3) 47.8% (11) 34.8% (8) 4.3% (1) 3 0-3 23
0.0% (0) 10.0% (1) 20.0% (2) 70.0% (7) 0.0% (0) 4 4-6 10
0.0% (0) 28.2% (11) 41.0% (16) 23.1% (9) 7.7% (3) 3 7 + 39
improved quality of
differentiated instruction.
0.0% (0) 0.0% (0) 52.2% (12) 39.1% (9) 8.7% (2) 3 0-3 23
0.0% (0) 0.0% (0) 20.0% (2) 80.0% (8) 0.0% (0) 4 4-6 10
0.0% (0) 0.0% (0) 59.0% (23) 38.5% (15) 2.6% (1) 3 7 + 39
greater access to data for
teachers to inform instruction.
0.0% (0) 0.0% (0) 26.1% (6) 73.9% (17) 0.0% (0) 4 0-3 23
0.0% (0) 0.0% (0) 0.0% (0) 100.0% (10) 0.0% (0) 4 4-6 10
0.0% (0) 0.0% (0) 33.3% (13) 64.1% (25) 2.6% (1) 4 7 + 39
increased access for students with disabilities.
0.0% (0) 0.0% (0) 34.8% (8) 65.2% (15) 0.0% (0) 4 0-3 23
0.0% (0) 0.0% (0) 30.0% (3) 70.0% (7) 0.0% (0) 4 4-6 10
0.0% (0) 2.6% (1) 48.7% (19) 46.2% (18) 2.6% (1) 3 7 + 39
paraprofessionals replaced with
technology.
8.7% (2) 56.5% (13) 8.7% (2) 4.3% (1) 21.7% (5) 2 0-3 23
20.0% (2) 30.0% (3) 10.0% (1) 10.0% (1) 30.0% (3) 2,5 4-6 10
10.3% (4) 59.0% (23) 15.4% (6) 10.3% (4) 5.1% (2) 2 7 + 39
reduced costs of education by
replacing teachers with technology.
8.7% (2) 60.9% (14) 13.0% (3) 4.3% (1) 13.0% (3) 2 0-3 23
20.0% (2) 60.0% (6) 0.0% (0) 10.0% (1) 10.0% (1) 2 4-6 10
7.7% (3) 66.7% (26) 12.8% (5) 10.3% (4) 2.6% (1) 2 7 + 39
a reduced number of dropouts.
0.0% (0) 30.4% (7) 26.1% (6) 13.0% (3) 30.4% (7) 2,5 0-3 23
0.0% (0) 10.0% (1) 60.0% (6) 10.0% (1) 20.0% (2) 3 4-6 10
0.0% (0) 20.5% (8) 41.0% (16) 12.8% (5) 25.6% (10) 3 7 + 39
improved graduation rates.
0.0% (0) 26.1% (6) 43.5% (10) 13.0% (3) 17.4% (4) 3 0-3 23
0.0% (0) 0.0% (0) 60.0% (6) 10.0% (1) 30.0% (3) 3 4-6 10
0.0% (0) 17.9% (7) 46.2% (18) 15.4% (6) 20.5% (8) 3 7 + 39
Note. SD = Strongly Disagree, D = Disagree, A = Agree, SA = Strongly Agree, U = Undecided, M = Modal Rating,
G = Group, R = Response, ( ) = actual number of responses, bold = majority.

147
Table A18
Disadvantages by Experience
3. There are inherent disadvantages to the roles of technology in education. In the future, these
disadvantages will include:
SD D A SA U M G R
uninsured accountability of student work in online classes.
0.0% (0) 65.2%(15) 26.1% (6) 4.3% (1) 4.3% (1) 2 0-3 23
0.0% (0) 30.0% (3) 50.0% (5) 0.0% (0) 20.0% (2) 3 4-6 10
5.1% (2) 41.0%(16) 43.6%(17) 5.1% (2) 5.1% (2) 3 7 + 39
micromanagement of student
achievement by parents.
0.0% (0) 69.6%(16) 17.4% (4) 4.3% (1) 8.7% (2) 2 0-3 23
0.0% (0) 50.0% (5) 40.0% (4) 0.0% (0) 10.0% (1) 2 4-6 10
5.1% (2) 48.7%(19) 35.9%(14) 2.6% (1) 7.7% (3) 2 7 + 39
depersonalized parent to school
communication.
0.0% (0) 52.2%(12) 43.5%(10) 0.0% (0) 4.3% (1) 2 0-3 23
0.0% (0) 70.0% (7) 20.0% (2) 0.0% (0) 10.0% (1) 2 4-6 10
7.7% (3) 64.1%(25) 17.9% (7) 10.3% (4) 0.0% (0) 2 7 + 39
costs to update technologies.
0.0% (0) 4.3% (1) 56.5%(13) 30.4% (7) 8.7% (2) 3 0-3 23
0.0% (0) 10.0% (1) 50.0% (5) 40.0% (4) 0.0% (0) 3 4-6 10
2.6% (1) 0.0% (0) 59.0%(23) 38.5%(15) 0.0% (0) 3 7 + 39
rapidly changing technologies
become obsolete.
0.0% (0) 4.3% (1) 82.6%(19) 13.0% (3) 0.0% (0) 3 0-3 23
0.0% (0) 10.0% (1) 60.0% (6) 30.0% (3) 0.0% (0) 3 4-6 10
0.0% (0) 5.1% (2) 59.0%(23) 30.8%(12) 5.1% (2) 3 7 + 39
limited student access to
technologies at home.
0.0% (0) 43.5%(10) 47.8%(11) 4.3% (1) 4.3% (1) 3 0-3 23
0.0% (0) 30.0% (3) 60.0% (6) 0.0% (0) 10.0% (1) 3 4-6 10
5.1% (2) 41.0%(16) 43.6%(17) 10.3% (4) 0.0% (0) 3 7 + 39
reduced face to face interactions
of teachers and students.
0.0% (0) 34.8% (8) 39.1% (9) 13.0% (3) 13.0% (3) 3 0-3 23
0.0% (0) 50.0% (5) 20.0% (2) 10.0% (1) 20.0% (2) 2 4-6 10
2.6% (1) 35.9%(14) 33.3%(13) 25.6%(10) 2.6% (1) 2 7 + 39
reduced face to face interactions of students.
0.0% (0) 30.4% (7) 43.5%(10) 17.4% (4) 8.7% (2) 3 0-3 23
0.0% (0) 40.0% (4) 40.0% (4) 10.0% (1) 10.0% (1) 2,3 4-6 10
2.6% (1) 35.9%(14) 28.2%(11) 28.2%(11) 5.1% (2) 2 7 + 39
ensured quality of online course content.
0.0% (0) 30.4% (7) 43.5%(10) 17.4% (4) 8.7% (2) 3 0-3 23
10.0% (1) 20.0% (2) 50.0% (5) 10.0% (1) 10.0% (1) 3 4-6 10
2.6% (1) 15.4% (6) 59.0%(23) 17.9% (7) 5.1% (2) 3 7 + 39
reduced teacher creativity.
17.4% (4) 65.2%(15) 8.7% (2) 8.7% (2) 0.0% (0) 2 0-3 23
30.0% (3) 50.0% (5) 0.0% (0) 0.0% (0) 20.0% (2) 2 4-6 10
15.4% (6) 59.0%(23) 15.4% (6) 7.7% (3) 2.6% (1) 2 7 + 39
reduced problem solving abilities of students.
17.4% (4) 73.9%(17) 0.0% (0) 8.7% (2) 0.0% (0) 2 0-3 23
30.0% (3) 60.0% (6) 0.0% (0) 0.0% (0) 10.0% (1) 2 4-6 10
20.5% (8) 56.4%(22) 10.3% (4) 7.7% (3) 5.1% (2) 2 7 + 39
decreased student ethical
behavior.
8.7% (2) 65.2%(15) 21.7% (5) 0.0% (0) 4.3% (1) 2 0-3 23
20.0% (2) 40.0% (4) 10.0% (1) 0.0% (0) 30.0% (3) 2 4-6 10
5.1% (2) 48.7%(19) 17.9% (7) 7.7% (3) 20.5% (8) 2 7 + 39
decreased verbal communication
skills of students.
4.3% (1) 47.8%(11) 21.7% (5) 17.4% (4) 8.7% (2) 2 0-3 23
10.0% (1) 50.0% (5) 20.0% (2) 0.0% (0) 20.0% (2) 2 4-6 10
2.6% (1) 48.7%(19) 30.8% (12) 17.9% (7) 0.0% (0) 2 7 + 39
Note. SD = Strongly Disagree, D = Disagree, A = Agree, SA = Strongly Agree, U = Undecided, M = Modal Rating,
G = Group, R = Response, ( ) = actual number of responses, bold = majority.
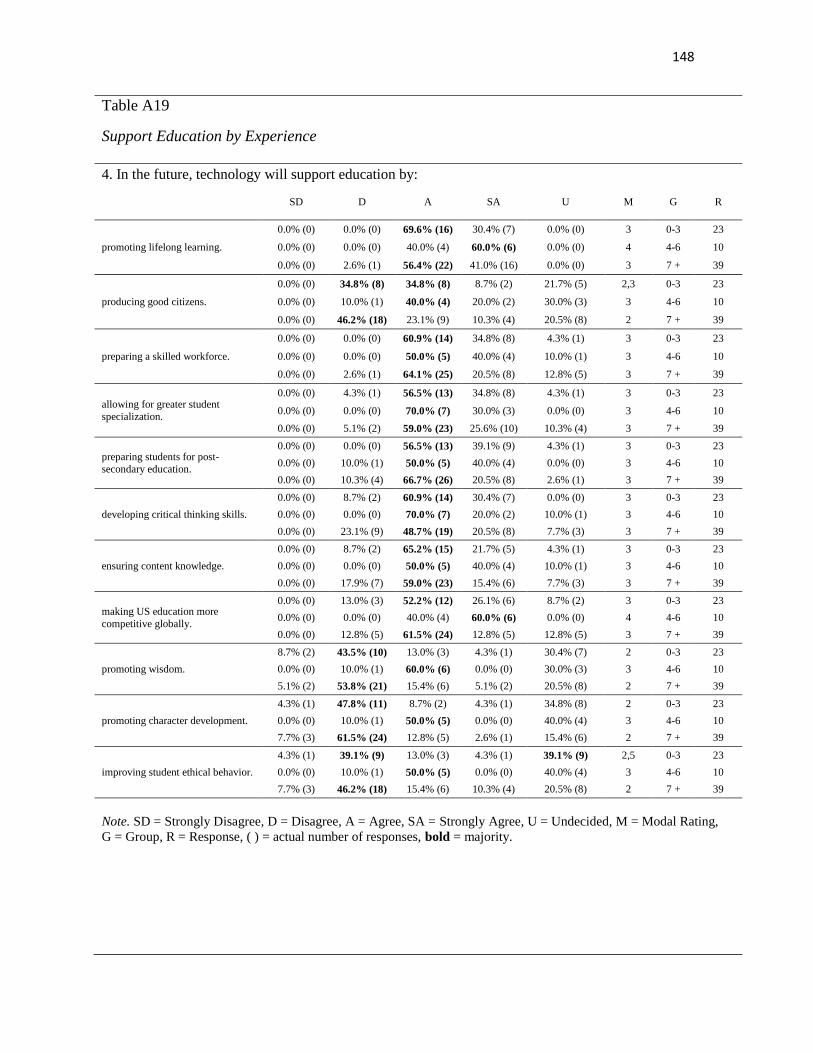
148
Table A19
Support Education by Experience
4. In the future, technology will support education by:
SD D A SA U M G R
promoting lifelong learning.
0.0% (0) 0.0% (0) 69.6% (16) 30.4% (7) 0.0% (0) 3 0-3 23
0.0% (0) 0.0% (0) 40.0% (4) 60.0% (6) 0.0% (0) 4 4-6 10
0.0% (0) 2.6% (1) 56.4% (22) 41.0% (16) 0.0% (0) 3 7 + 39
producing good citizens.
0.0% (0) 34.8% (8) 34.8% (8) 8.7% (2) 21.7% (5) 2,3 0-3 23
0.0% (0) 10.0% (1) 40.0% (4) 20.0% (2) 30.0% (3) 3 4-6 10
0.0% (0) 46.2% (18) 23.1% (9) 10.3% (4) 20.5% (8) 2 7 + 39
preparing a skilled workforce.
0.0% (0) 0.0% (0) 60.9% (14) 34.8% (8) 4.3% (1) 3 0-3 23
0.0% (0) 0.0% (0) 50.0% (5) 40.0% (4) 10.0% (1) 3 4-6 10
0.0% (0) 2.6% (1) 64.1% (25) 20.5% (8) 12.8% (5) 3 7 + 39
allowing for greater student
specialization.
0.0% (0) 4.3% (1) 56.5% (13) 34.8% (8) 4.3% (1) 3 0-3 23
0.0% (0) 0.0% (0) 70.0% (7) 30.0% (3) 0.0% (0) 3 4-6 10
0.0% (0) 5.1% (2) 59.0% (23) 25.6% (10) 10.3% (4) 3 7 + 39
preparing students for post-
secondary education.
0.0% (0) 0.0% (0) 56.5% (13) 39.1% (9) 4.3% (1) 3 0-3 23
0.0% (0) 10.0% (1) 50.0% (5) 40.0% (4) 0.0% (0) 3 4-6 10
0.0% (0) 10.3% (4) 66.7% (26) 20.5% (8) 2.6% (1) 3 7 + 39
developing critical thinking skills.
0.0% (0) 8.7% (2) 60.9% (14) 30.4% (7) 0.0% (0) 3 0-3 23
0.0% (0) 0.0% (0) 70.0% (7) 20.0% (2) 10.0% (1) 3 4-6 10
0.0% (0) 23.1% (9) 48.7% (19) 20.5% (8) 7.7% (3) 3 7 + 39
ensuring content knowledge.
0.0% (0) 8.7% (2) 65.2% (15) 21.7% (5) 4.3% (1) 3 0-3 23
0.0% (0) 0.0% (0) 50.0% (5) 40.0% (4) 10.0% (1) 3 4-6 10
0.0% (0) 17.9% (7) 59.0% (23) 15.4% (6) 7.7% (3) 3 7 + 39
making US education more
competitive globally.
0.0% (0) 13.0% (3) 52.2% (12) 26.1% (6) 8.7% (2) 3 0-3 23
0.0% (0) 0.0% (0) 40.0% (4) 60.0% (6) 0.0% (0) 4 4-6 10
0.0% (0) 12.8% (5) 61.5% (24) 12.8% (5) 12.8% (5) 3 7 + 39
promoting wisdom.
8.7% (2) 43.5% (10) 13.0% (3) 4.3% (1) 30.4% (7) 2 0-3 23
0.0% (0) 10.0% (1) 60.0% (6) 0.0% (0) 30.0% (3) 3 4-6 10
5.1% (2) 53.8% (21) 15.4% (6) 5.1% (2) 20.5% (8) 2 7 + 39
promoting character development.
4.3% (1) 47.8% (11) 8.7% (2) 4.3% (1) 34.8% (8) 2 0-3 23
0.0% (0) 10.0% (1) 50.0% (5) 0.0% (0) 40.0% (4) 3 4-6 10
7.7% (3) 61.5% (24) 12.8% (5) 2.6% (1) 15.4% (6) 2 7 + 39
improving student ethical behavior.
4.3% (1) 39.1% (9) 13.0% (3) 4.3% (1) 39.1% (9) 2,5 0-3 23
0.0% (0) 10.0% (1) 50.0% (5) 0.0% (0) 40.0% (4) 3 4-6 10
7.7% (3) 46.2% (18) 15.4% (6) 10.3% (4) 20.5% (8) 2 7 + 39
Note. SD = Strongly Disagree, D = Disagree, A = Agree, SA = Strongly Agree, U = Undecided, M = Modal Rating,
G = Group, R = Response, ( ) = actual number of responses, bold = majority.

149
Table A20
Policy Changes by Experience
5. The future roles of technology in education will require changes in existing policies. In the future, these
changes in policy will include:
SD D A SA U M G R
students having the option to ―test
out‖ of required courses for
graduation by demonstrating proficiency. Students having the
option to graduate early by demonstrating proficiency to "test
out" of required courses.
0.0% (0) 0.0% (0) 73.9% (17) 26.1% (6) 0.0% (0) 3 0-3 23
0.0% (0) 0.0% (0) 80.0% (8) 20.0% (2) 0.0% (0) 3 4-6 10
0.0% (0) 2.6% (1) 51.3% (20) 38.5% (15) 7.7% (3) 3 7 + 39
students having the option to
graduate early by increasing
maximum student course loads.
0.0% (0) 0.0% (0) 69.6% (16) 26.1% (6) 4.3% (1) 3 0-3 23
0.0% (0) 0.0% (0) 70.0% (7) 30.0% (3) 0.0% (0) 3 4-6 10
0.0% (0) 0.0% (0) 61.5% (24) 35.9% (14) 2.6% (1) 3 7 + 39
students having the option to take advanced online courses outside of
their district for graduation credit.
0.0% (0) 0.0% (0) 47.8% (11) 52.2% (12) 0.0% (0) 4 0-3 23
0.0% (0) 0.0% (0) 70.0% (7) 30.0% (3) 0.0% (0) 3 4-6 10
0.0% (0) 0.0% (0) 48.7% (19) 48.7% (19) 2.6% (1) 3,4 7 + 39
students having the option to take
online courses outside of their district for graduation credit which
are also offered traditionally within
the district.
0.0% (0) 4.3% (1) 60.9% (14) 34.8% (8) 0.0% (0) 3 0-3 23
0.0% (0) 30.0% (3) 60.0% (6) 10.0% (1) 0.0% (0) 3 4-6 10
0.0% (0) 17.9% (7) 41.0% (16) 35.9% (14) 5.1% (2) 3 7 + 39
students being required to take at
least one online course as a
graduation requirement.
0.0% (0) 30.4% (7) 34.8% (8) 26.1% (6) 8.7% (2) 3 0-3 23
0.0% (0) 30.0% (3) 30.0% (3) 20.0% (2) 20.0% (2) 2,3 4-6 10
0.0% (0) 15.4% (6) 38.5% (15) 33.3% (13) 12.8% (5) 3 7 + 39
students adhering to an ethics
policy for student behaviors in online courses.
0.0% (0) 0.0% (0) 60.9% (14) 39.1% (9) 0.0% (0) 3 0-3 23
0.0% (0) 0.0% (0) 40.0% (4) 60.0% (6) 0.0% (0) 4 4-6 10
0.0% (0) 2.6% (1) 41.0% (16) 46.2% (18) 10.3% (4) 4 7 + 39
districts providing for students with limited access to technologies at
home.
0.0% (0) 21.7% (5) 52.2% (12) 21.7% (5) 4.3% (1) 3 0-3 23
0.0% (0) 0.0% (0) 60.0% (6) 30.0% (3) 10.0% (1) 3 4-6 10
2.6% (1) 5.1% (2) 48.7% (19) 33.3% (13) 10.3% (4) 3 7 + 39
teachers having ongoing
professional development in
technology.
0.0% (0) 0.0% (0) 30.4% (7) 69.6% (16) 0.0% (0) 4 0-3 23
0.0% (0) 0.0% (0) 30.0% (3) 70.0% (7) 0.0% (0) 4 4-6 10
0.0% (0) 0.0% (0) 38.5% (15) 61.5% (24) 0.0% (0) 4 7 + 39
Note. SD = Strongly Disagree, D = Disagree, A = Agree, SA = Strongly Agree, U = Undecided, M = Modal Rating,
G = Group, R = Response, ( ) = actual number of responses, bold = majority.

150
Appendix I
Responses by Superintendent Gender

151
Appendix I
Responses by Superintendent Gender
Table A21
Applications by Gender
1. In the future, the applications of technology in education will include:
SD D A SA U M G R
a reduced number of teachers.
20.0% (9) 44.4% (20) 15.6% (7) 6.7% (3) 13.3% (6) 2 Male 45
11.1% (3) 44.4% (12) 14.8% (4) 14.8% (4) 14.8% (4) 2 Female 27
supplemented traditional classroom
teaching methods.
0.0% (0) 4.4% (2) 35.6% (16) 60.0% (27) 0.0% (0) 4 Male 45
0.0% (0) 3.7% (1) 37.0% (10) 55.6% (15) 3.7% (1) 4 Female 27
the creation of virtual schools.
0.0% (0) 17.8% (8) 33.3% (15) 42.2% (19) 6.7% (3) 4 Male 45
0.0% (0) 3.7% (1) 48.1% (13) 37.0% (10) 11.1% (3) 3 Female 27
reduced hours students are
physically in school.
0.0% (0) 35.6% (16) 33.3% (15) 24.4% (11) 6.7% (3) 2 Male 45
3.7% (1) 22.2% (6) 48.1% (13) 11.1% (3) 14.8% (4) 3 Female 27
online classes offered by districts in
addition to traditional classes.
0.0% (0) 6.7% (3) 37.8% (17) 55.6% (25) 0.0% (0) 4 Male 45
0.0% (0) 0.0% (0) 33.3% (9) 63.0% (17) 3.7% (1) 4 Female 27
a restructured school schedule.
0.0% (0) 20.0% (9) 40.0% (18) 35.6% (16) 4.4% (2) 3 Male 45
0.0% (0) 7.4% (2) 59.3% (16) 33.3% (9) 0.0% (0) 3 Female 27
a restructured school calendar.
0.0% (0) 26.7% (12) 28.9% (13) 31.1% (14) 13.3% (6) 4 Male 45
0.0% (0) 11.1% (3) 55.6% (15) 22.2% (6) 11.1% (3) 3 Female 27
a redefined role of teachers.
0.0% (0) 13.3% (6) 44.4% (20) 42.2% (19) 0.0% (0) 3 Male 45
0.0% (0) 11.1% (3) 55.6% (15) 33.3% (9) 0.0% (0) 3 Female 27
a redefinition of the education
process.
0.0% (0) 22.2% (10) 46.7% (21) 31.1% (14) 0.0% (0) 3 Male 45
0.0% (0) 7.4% (2) 63.0% (17) 29.6% (8) 0.0% (0) 3 Female 27
college courses accessed online for
both students and staff.
0.0% (0) 0.0% (0) 42.2% (19) 55.6% (25) 2.2% (1) 4 Male 45
0.0% (0) 0.0% (0) 40.7% (11) 59.3% (16) 0.0% (0) 4 Female 27
Note. SD = Strongly Disagree, D = Disagree, A = Agree, SA = Strongly Agree, U = Undecided, M = Modal Rating,
G = Group, R = Response, ( ) = actual number of responses, bold = majority.
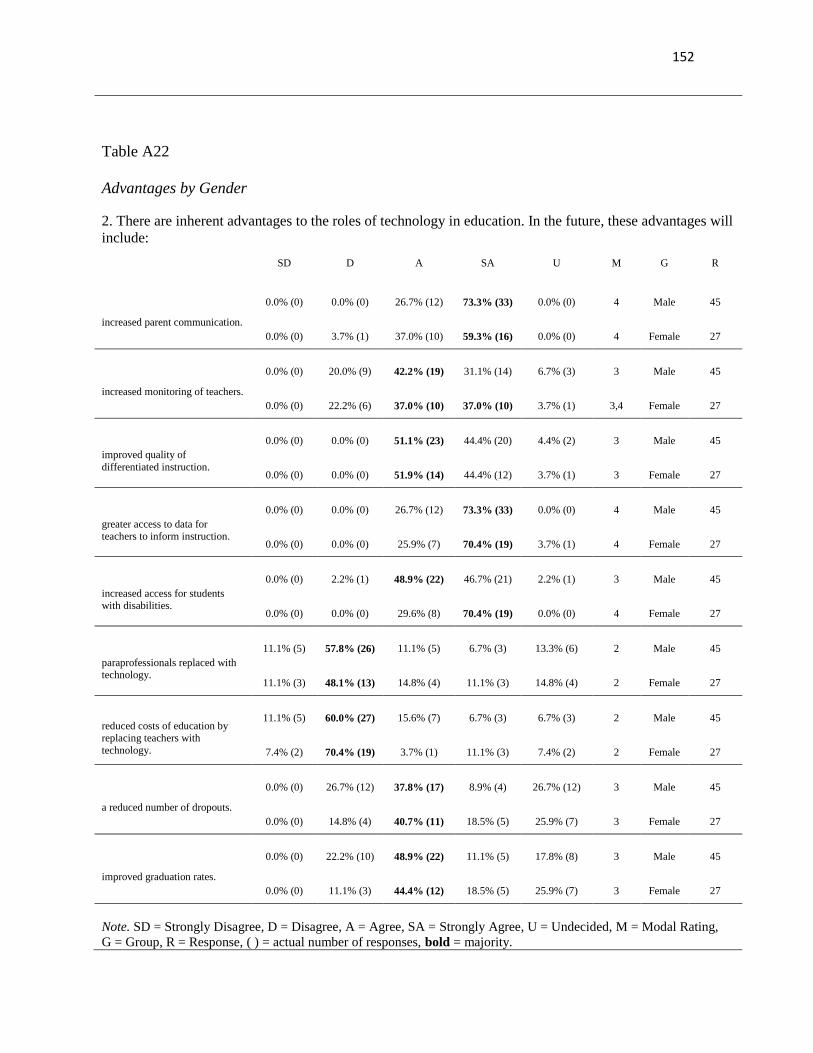
152
Table A22
Advantages by Gender
2. There are inherent advantages to the roles of technology in education. In the future, these advantages will
include:
SD D A SA U M G R
increased parent communication.
0.0% (0) 0.0% (0) 26.7% (12) 73.3% (33) 0.0% (0) 4 Male 45
0.0% (0) 3.7% (1) 37.0% (10) 59.3% (16) 0.0% (0) 4 Female 27
increased monitoring of teachers.
0.0% (0) 20.0% (9) 42.2% (19) 31.1% (14) 6.7% (3) 3 Male 45
0.0% (0) 22.2% (6) 37.0% (10) 37.0% (10) 3.7% (1) 3,4 Female 27
improved quality of
differentiated instruction.
0.0% (0) 0.0% (0) 51.1% (23) 44.4% (20) 4.4% (2) 3 Male 45
0.0% (0) 0.0% (0) 51.9% (14) 44.4% (12) 3.7% (1) 3 Female 27
greater access to data for teachers to inform instruction.
0.0% (0) 0.0% (0) 26.7% (12) 73.3% (33) 0.0% (0) 4 Male 45
0.0% (0) 0.0% (0) 25.9% (7) 70.4% (19) 3.7% (1) 4 Female 27
increased access for students with disabilities.
0.0% (0) 2.2% (1) 48.9% (22) 46.7% (21) 2.2% (1) 3 Male 45
0.0% (0) 0.0% (0) 29.6% (8) 70.4% (19) 0.0% (0) 4 Female 27
paraprofessionals replaced with technology.
11.1% (5) 57.8% (26) 11.1% (5) 6.7% (3) 13.3% (6) 2 Male 45
11.1% (3) 48.1% (13) 14.8% (4) 11.1% (3) 14.8% (4) 2 Female 27
reduced costs of education by replacing teachers with
technology.
11.1% (5) 60.0% (27) 15.6% (7) 6.7% (3) 6.7% (3) 2 Male 45
7.4% (2) 70.4% (19) 3.7% (1) 11.1% (3) 7.4% (2) 2 Female 27
a reduced number of dropouts.
0.0% (0) 26.7% (12) 37.8% (17) 8.9% (4) 26.7% (12) 3 Male 45
0.0% (0) 14.8% (4) 40.7% (11) 18.5% (5) 25.9% (7) 3 Female 27
improved graduation rates.
0.0% (0) 22.2% (10) 48.9% (22) 11.1% (5) 17.8% (8) 3 Male 45
0.0% (0) 11.1% (3) 44.4% (12) 18.5% (5) 25.9% (7) 3 Female 27
Note. SD = Strongly Disagree, D = Disagree, A = Agree, SA = Strongly Agree, U = Undecided, M = Modal Rating,
G = Group, R = Response, ( ) = actual number of responses, bold = majority.

153
Table A23
Disadvantages by Gender
3. There are inherent disadvantages to the roles of technology in education. In the future, these
disadvantages will include:
SD D A SA U M G R
uninsured accountability of
student work in online classes.
4.4% (2) 42.2% (19) 40.0% (18) 6.7% (3) 6.7% (3) 2 Male 45
0.0% (0) 55.6% (15) 37.0% (10) 0.0% (0) 7.4% (2) 2 Female 27
micromanagement of student achievement by parents.
4.4% (2) 51.1% (23) 33.3% (15) 2.2% (1) 8.9% (4) 2 Male 45
0.0% (0) 63.0% (17) 25.9% (7) 3.7% (1) 7.4% (2) 2 Female 27
depersonalized parent to school
communication.
6.7% (3) 60.0% (27) 22.2% (10) 8.9% (4) 2.2% (1) 2 Male 45
0.0% (0) 63.0% (17) 33.3% (9) 0.0% (0) 3.7% (1) 2 Female 27
costs to update technologies. 2.2% (1) 4.4% (2) 53.3% (24) 37.8% (17) 2.2% (1) 3 Male 45
0.0% (0) 0.0% (0) 63.0% (17) 33.3% (9) 3.7% (1) 3 Female 27
rapidly changing technologies
become obsolete.
0.0% (0) 6.7% (3) 66.7% (30) 22.2% (10) 4.4% (2) 3 Male 45
0.0% (0) 3.7% (1) 66.7% (18) 29.6% (8) 0.0% (0) 3 Female 27
limited student access to technologies at home.
4.4% (2) 44.4% (20) 40.0% (18) 8.9% (4) 2.2% (1) 2 Male 45
0.0% (0) 33.3% (9) 59.3% (16) 3.7% (1) 3.7% (1) 3 Female 27
reduced face to face interactions
of teachers and students.
2.2% (1) 37.8% (17) 26.7% (12) 26.7% (12) 6.7% (3) 2 Male 45
0.0% (0) 37.0% (10) 44.4% (12) 7.4% (2) 11.1% (3) 3 Female 27
reduced face to face interactions of students.
2.2% (1) 37.8% (17) 24.4% (11) 28.9% (13) 6.7% (3) 2 Male 45
0.0% (0) 29.6% (8) 51.9% (14) 11.1% (3) 7.4% (2) 3 Female 27
ensured quality of online course
content.
4.4% (2) 15.6% (7) 51.1% (23) 22.2% (10) 6.7% (3) 3 Male 45
0.0% (0) 29.6% (8) 55.6% (15) 7.4% (2) 7.4% (2) 3 Female 27
reduced teacher creativity. 26.7% (12) 55.6% (25) 8.9% (4) 8.9% (4) 0.0% (0) 2 Male 45
3.7% (1) 66.7% (18) 14.8% (4) 3.7% (1) 11.1% (3) 2 Female 27
reduced problem solving abilities
of students.
28.9% (13) 57.8% (26) 2.2% (1) 8.9% (4) 2.2% (1) 2 Male 45
7.4% (2) 70.4% (19) 11.1% (3) 3.7% (1) 7.4% (2) 2 Female 27
decreased student ethical behavior.
11.1% (5) 46.7% (21) 15.6% (7) 6.7% (3) 20.0% (9) 2 Male 45
3.7% (1) 63.0% (17) 22.2% (6) 0.0% (0) 11.1% (3) 2 Female 27
decreased verbal communication
skills of students.
4.4% (2) 46.7% (21) 24.4% (11) 20.0% (9) 4.4% (2) 2 Male 45
3.7% (1) 51.9% (14) 29.6% (8) 7.4% (2) 7.4% (2) 2 Female 27
Note. SD = Strongly Disagree, D = Disagree, A = Agree, SA = Strongly Agree, U = Undecided, M = Modal Rating,
G = Group, R = Response, ( ) = actual number of responses, bold = majority.

154
Table A24
Support Education by Gender
4. In the future, technology will support education by:
SD D A SA U M G R
promoting lifelong learning.
0.0% (0) 2.2% (1) 57.8% (26) 40.0% (18) 0.0% (0) 3 Male 45
0.0% (0) 0.0% (0) 59.3% (16) 40.7% (11) 0.0% (0) 3 Female 27
producing good citizens.
0.0% (0) 35.6% (16) 26.7% (12) 13.3% (6) 24.4% (11) 2 Male 45
0.0% (0) 40.7% (11) 33.3% (9) 7.4% (2) 18.5% (5) 2 Female 27
preparing a skilled workforce.
0.0% (0) 2.2% (1) 55.6% (25) 28.9% (13) 13.3% (6) 3 Male 45
0.0% (0) 0.0% (0) 70.4% (19) 25.9% (7) 3.7% (1) 3 Female 27
allowing for greater student
specialization.
0.0% (0) 4.4% (2) 53.3% (24) 31.1% (14) 11.1% (5) 3 Male 45
0.0% (0) 3.7% (1) 70.4% (19) 25.9% (7) 0.0% (0) 3 Female 27
preparing students for post-secondary education.
0.0% (0) 8.9% (4) 55.6% (25) 33.3% (15) 2.2% (1) 3 Male 45
0.0% (0) 3.7% (1) 70.4% (19) 22.2% (6) 3.7% (1) 3 Female 27
developing critical thinking
skills.
0.0% (0) 17.8% (8) 53.3% (24) 24.4% (11) 4.4% (2) 3 Male 45
0.0% (0) 11.1% (3) 59.3% (16) 22.2% (6) 7.4% (2) 3 Female 27
ensuring content knowledge.
0.0% (0) 15.6% (7) 55.6% (25) 26.7% (12) 2.2% (1) 3 Male 45
0.0% (0) 7.4% (2) 66.7% (18) 11.1% (3) 14.8% (4) 3 Female 27
making US education more
competitive globally.
0.0% (0) 13.3% (6) 51.1% (23) 24.4% (11) 11.1% (5) 3 Male 45
0.0% (0) 7.4% (2) 63.0% (17) 22.2% (6) 7.4% (2) 3 Female 27
promoting wisdom.
6.7% (3) 44.4% (20) 22.2% (10) 6.7% (3) 20.0% (9) 2 Male 45
3.7% (1) 44.4% (12) 18.5% (5) 0.0% (0) 33.3% (9) 2 Female 27
promoting character
development.
6.7% (3) 51.1% (23) 17.8% (8) 4.4% (2) 20.0% (9) 2 Male 45
3.7% (1) 48.1% (13) 14.8% (4) 0.0% (0) 33.3% (9) 2 Female 27
improving student ethical
behavior.
6.7% (3) 33.3% (15) 22.2% (10) 11.1% (5) 26.7% (12) 2 Male 45
3.7% (1) 48.1% (13) 14.8% (4) 0.0% (0) 33.3% (9) 2 Female 27
Note. SD = Strongly Disagree, D = Disagree, A = Agree, SA = Strongly Agree, U = Undecided, M = Modal Rating,
G = Group, R = Response, ( ) = actual number of responses, bold = majority.

155
Table A25
Policy Changes by Gender
5. The future roles of technology in education will require changes in existing policies. In the future, these
changes in policy will include:
SD D A SA U M G R
students having the option to
―test out‖ of required courses for graduation by demonstrating
proficiency. Students having the
option to graduate early by
demonstrating proficiency to
"test out" of required courses.
0.0% (0) 2.2% (1) 64.4% (29) 28.9% (13) 4.4% (2) 3 Male 45
0.0% (0) 0.0% (0) 59.3% (16) 37.0% (10) 3.7% (1) 3 Female 27
students having the option to
graduate early by increasing maximum student course loads.
0.0% (0) 0.0% (0) 66.7% (30) 28.9% (13) 4.4% (2) 3 Male 45
0.0% (0) 0.0% (0) 63.0% (17) 37.0% (10) 0.0% (0) 3 Female 27
students having the option to
take advanced online courses
outside of their district for graduation credit.
0.0% (0) 0.0% (0) 53.3% (24) 44.4% (20) 2.2% (1) 3 Male 45
0.0% (0) 0.0% (0) 48.1% (13) 51.9% (14) 0.0% (0) 4 Female 27
students having the option to
take online courses outside of
their district for graduation credit
which are also offered
traditionally within the district.
0.0% (0) 17.8% (8) 48.9% (22) 31.1% (14) 2.2% (1) 3 Male 45
0.0% (0) 11.1% (3) 51.9% (14) 33.3% (9) 3.7% (1) 3 Female 27
students being required to take at least one online course as a
graduation requirement.
0.0% (0) 17.8% (8) 37.8% (17) 26.7% (12) 17.8% (8) 3 Male 45
0.0% (0) 29.6% (8) 33.3% (9) 33.3% (9) 3.7% (1) 3,4 Female 27
students adhering to an ethics
policy for student behaviors in online courses.
0.0% (0) 2.2% (1) 42.2% (19) 46.7% (21) 8.9% (4) 4 Male 45
0.0% (0) 0.0% (0) 55.6% (15) 44.4% (12) 0.0% (0) 3 Female 27
districts providing for students
with limited access to
technologies at home.
2.2% (1) 13.3% (6) 46.7% (21) 26.7% (12) 11.1% (5) 3 Male 45
0.0% (0) 3.7% (1) 59.3% (16) 33.3% (9) 3.7% (1) 3 Female 27
teachers having ongoing
professional development in technology.
0.0% (0) 0.0% (0) 37.8% (17) 62.2% (28) 0.0% (0) 4 Male 45
0.0% (0) 0.0% (0) 29.6% (8) 70.4% (19) 0.0% (0) 4 Female 27
Note. SD = Strongly Disagree, D = Disagree, A = Agree, SA = Strongly Agree, U = Undecided, M = Modal Rating,
G = Group, R = Response, ( ) = actual number of responses, bold = majority.