future robotic exploration using honeybee search strategy: example search for caves on mars
TRANSCRIPT
Contents lists available at ScienceDirect
Acta Astronautica
Acta Astronautica 68 (2011) 1790–1799
0094-57
doi:10.1
n Corr
E-m
art4@so
journal homepage: www.elsevier.com/locate/actaastro
Future robotic exploration using honeybee search strategy: Examplesearch for caves on Mars
Aron Kisdi a,n, Adrian R.L. Tatnall b
a University of Southampton, 36 Priory Road, Wantage, OX12 9DD, UKb SES, University of Southampton, SO17 1BJ, UK
a r t i c l e i n f o
Article history:
Received 19 February 2010
Received in revised form
4 January 2011
Accepted 24 January 2011Available online 3 March 2011
Keywords:
Biomimicry
Swarm
Behaviour
Bees
Mars
Search
AI
Autonomous
Caves
65/$ - see front matter & 2011 Elsevier Ltd. A
016/j.actaastro.2011.01.013
esponding author. Tel. +07901871711.
ail addresses: [email protected] (A. Kisdi),
ton.ac.uk (A.R. Tatnall).
a b s t r a c t
Autonomous control has an increasing role in Earth and Space based applications. High
level autonomy can greatly improve planetary exploration and is, in many cases,
essential. It has been suggested during the Mars cave exploration programme, that an
effective way to explore a larger surface area would be the use of many, small and fully
autonomous robots. However, there are many challenges to overcome if such a swarm
exploration programme is to be implemented. This paper summarises these challenges
and focuses on one of the most crucial one: strategy. Many effective group exploration
behaviours can be observed in nature, most of which are optimised to work with agents
that have limited capabilities as individuals. For this paper a computer program has
been written to simulate the way bees search for new hives and investigate whenever it
is an optimal method to search for cave entrances on Mars. It has been found that this
method, using simple autonomous robots which can be constructed using available
technologies, could greatly improve the speed and range of a planetary exploration
mission. The simulation results show that 50 swarm robots can cover an area of over
300 meters square completely in 5 sols while they are searching for cave entrances and
returning results to the Lander which is a major performance improvement on any
previous mission. Furthermore areas of interests found by the explorers are sorted in
order of importance automatically and without the need of computational analysis,
hence larger quantities of data were collected from the more important areas. Therefore
the system – just like a hive of bees – can make a complex decision easily and quickly
to find the place which matches the required criteria best. Using a high performance
search strategy such as the one described in this paper is crucial if we plan to search for
important resources or even life on Mars and other bodies in the solar system.
& 2011 Elsevier Ltd. All rights reserved.
1. Introduction
1.1. Aim of research
Autonomous systems are increasingly important in allengineering applications. In the case of space systems
ll rights reserved.
Artificial Intelligence (AI) is highly desirable as agentsoperate in a remote environment and there is often adelay in communications and sometimes a fast responseis required. However AI requires major improvements inthe space sector for future missions and there is much tobe learned from nature in this field. Advanced autonomycan make systems more robust, speed up planetaryexploration and would also reduce the cost of operation.Even the simplest biological systems exhibit very effectivedecision making and sometimes cooperation. The indivi-dual agents of the swarm have limited capability but the
A. Kisdi, A.R.L. Tatnall / Acta Astronautica 68 (2011) 1790–1799 1791
decisions they make collectively are complex, while theprocess is efficient. Inspired by the fascinating way beessearch for new hives, this paper considers the use of asimilar artificially simulated methods in order to findareas of interest in planetary exploration. A secondaryaim is to use biomimetics in such a way that the complex-ity of AI is minimal, allowing hardware designs withminimal processing power, meaning that compact androbust hardware can be built.
1.2. Honeybees in nature
There are more species of bees than mammals andbirds combined [1]. The species are very different both inappearance and in behaviour. Contrary to common beliefmost bees are loners and only a few species live in hives.In this report the subject of interest is the apis mellifera orEuropean honeybee.
1.2.1. When bees search for a place for a new hive
If the bee hive reaches a certain size, explorer bees setoff to locate a place for a new hive. If the explorers find aplace which they believe is suitable they return and ‘tell’some of the other bees the location. These bees then setoff to inspect the location. If they like the place theyreturn to the hive and they recruit more bees to inspectthe location. In this way if a place is not so good for a hivefewer and fewer bees will visit it. However if it is a goodlocation more and more bees will go there until thenumber of bees reaches a certain size and the originalhive splits and starts the construction of the new hive [2].
This search is interesting because of many aspects. Thehive as a collective will receive multiple opinions on eachpossible location. These opinions will come from differentbees who visited the location at different times. At theend of the search the best location is selected howeverany other location can be easily compared with oneanother. Like all biological agents, bees are not identical,their physical and mental state is defined by their growthand learning. On the other hand the simulated bees areidentical just like the mass produced swarm robotswould be.
1.2.2. Advantages of bee-like search
Now we have to study the advantages of a bee-likesearch. The hive as a collective receives different reviewsof each place and compares them before the decision ismade. But the review of a bee is not subjective; it searchesfor the characteristics that are best for the new hive. Eachbee has the same senses but a place can receive differentreviews because of a number of different factors. Partiallyit is down to individual opinion which is impossible tosimulate but there are other aspects that need to beconsidered; most importantly time and perspective. Beeswill visit the same place at different times thereforecollectively gather much more information about thechanges at the place over time, such as during a day–night period. Differentiating perspective can be achievedin multiple ways, one of which is equipping the robotswith different sensors. Having task specific agents couldbe interesting for a future study however the aim of this
study is to show that improvement can be made on pastmissions even with the simplest agents if the bee-likesearch is used. Even if the agents are identical it ispossible to increase the information gathered from revi-sits by making the robots visit the same place fromdifferent directions allowing them to see additional detailwhich might be hidden from other angles. This can beachieved by randomizing obstacle avoidance which willlead to different paths to the same point. Alternatively,the AI of the robots can be improved so that theyapproach the previously discovered point from a differentdirection by choosing another path when they are close tothe target. Both of these improvements can be added tothe simulation however to change the results a higherresolution model of the terrain and caves should be usedas differences will depend on the temperature profile ofthe caves.
The individual bees make the decision whenever theythink the location is good or not based their senses. It isdebatable if bees have individual preferences or theysearch for characteristics required for the hive. Thereforethese biological agents might or might not introduce biasin the selection however the robots based on classical AIonly compare a limited number of digital inputs thereforein the simulation the agents are identical and withoutbias which does not affect the overall strategy. However itis interesting to note that such a system can potentiallymanage bias well. Inaccuracies from sensors would onlyaffect individual agents on the other hand from theperspective of the hive it is all down to numbers. Alocation is better if more explorers returned from it witha positive opinion.
In summary the advantages without running thesimulation to compare the search performance to pastmissions:
�
Identical agents improve swarm robustness andreduce production costs � Possible areas of interests are revisited by other agentsproducing data over time
� Revisits could potentially show the area of interestfrom different perspectives
� Revisit efforts are concentrated on areas which arecumulatively found relevant
� The areas likely to be relevant can be identifiedautonomously with very simple reactive AI
The simulation discussed in this study was set up tofind out if such a search strategy can be artificiallyreplicated and also to quantify the performance ofswarms of different sizes and compare its speed withpast missions, and to identify any disadvantages.
1.3. The importance of Mars exploration; caves and
methane
The surface of Mars is hostile to any organisms mainlybecause of its very low temperature and high radiationlevels. Caves would not only provide shelter from radia-tion but could also have a warmer and more even
A. Kisdi, A.R.L. Tatnall / Acta Astronautica 68 (2011) 1790–17991792
temperature. A model presented in a recently publishedarticle [3] implies that liquid water is present under thesurface of Olympus Mons. Deep reservoirs are warmedup by geothermal gradients and magmatic heat meaningthat even in the present day could contain liquid water.Atmospheric observations from both Earth and Marsorbiting spacecraft confirm the presence of methane inthe Martian atmosphere [4]. Methane is quickly destroyeddue to radiation. This means that it is continuouslygenerated under the surface. The source could be biolo-gical or geological, however, either way; it indicates thepresence of water underground.
Images from Mars Odyssey spacecraft revealed deepholes on the surface which are likely to be caveentrances [5]. The reason for this is that these holes arecolder during the day and warmer during the night thanthe average surface temperature. The temperature mea-surements were taken by Mars Odyssey’s Thermal Emis-sion Imaging System camera in the infrared spectrum.However the resolution of these observations from orbit islimited. The smallest possible cave entrance of the sevendiscovered at the time this report was written is around50 meters diameter while the largest is 200 meters. Theseholes have deep vertical walls which make them verydifficult to explore with rovers; however, there could bemuch smaller and much more accessible cave entranceson Mars.
1.4. How can caves be found?
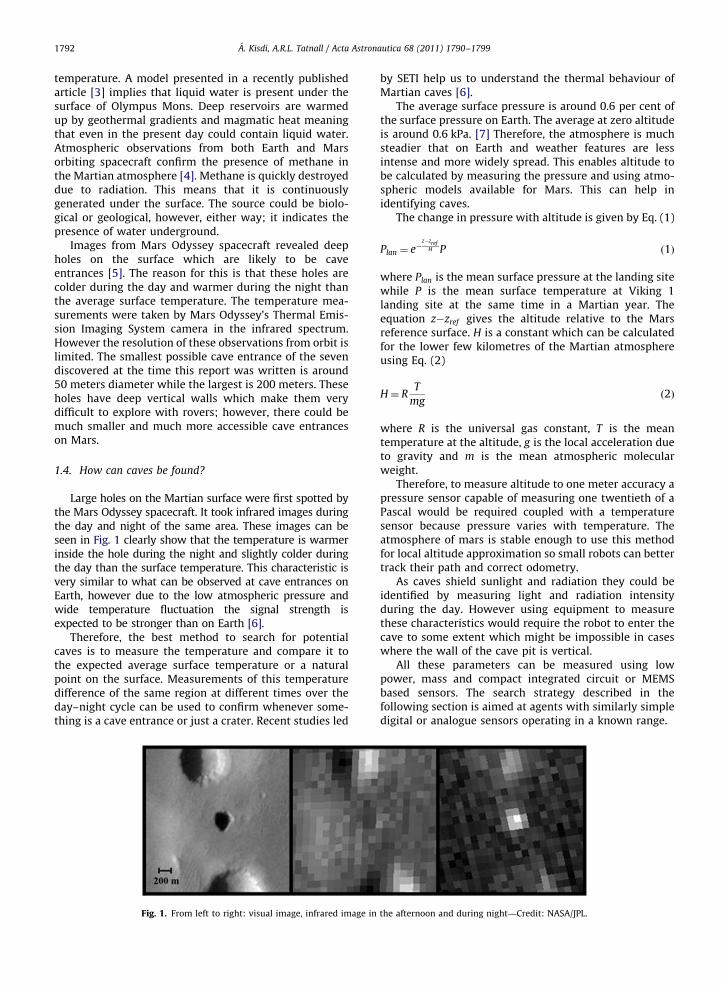
Large holes on the Martian surface were first spotted bythe Mars Odyssey spacecraft. It took infrared images duringthe day and night of the same area. These images can beseen in Fig. 1 clearly show that the temperature is warmerinside the hole during the night and slightly colder duringthe day than the surface temperature. This characteristic isvery similar to what can be observed at cave entrances onEarth, however due to the low atmospheric pressure andwide temperature fluctuation the signal strength isexpected to be stronger than on Earth [6].
Therefore, the best method to search for potentialcaves is to measure the temperature and compare it tothe expected average surface temperature or a naturalpoint on the surface. Measurements of this temperaturedifference of the same region at different times over theday–night cycle can be used to confirm whenever some-thing is a cave entrance or just a crater. Recent studies led
Fig. 1. From left to right: visual image, infrared image in
by SETI help us to understand the thermal behaviour ofMartian caves [6].
The average surface pressure is around 0.6 per cent ofthe surface pressure on Earth. The average at zero altitudeis around 0.6 kPa. [7] Therefore, the atmosphere is muchsteadier that on Earth and weather features are lessintense and more widely spread. This enables altitude tobe calculated by measuring the pressure and using atmo-spheric models available for Mars. This can help inidentifying caves.
The change in pressure with altitude is given by Eq. (1)
Plan ¼ e�z�zref
H P ð1Þ
where Plan is the mean surface pressure at the landing sitewhile P is the mean surface temperature at Viking 1landing site at the same time in a Martian year. Theequation z�zref gives the altitude relative to the Marsreference surface. H is a constant which can be calculatedfor the lower few kilometres of the Martian atmosphereusing Eq. (2)
H¼ RT
mgð2Þ
where R is the universal gas constant, T is the meantemperature at the altitude, g is the local acceleration dueto gravity and m is the mean atmospheric molecularweight.
Therefore, to measure altitude to one meter accuracy apressure sensor capable of measuring one twentieth of aPascal would be required coupled with a temperaturesensor because pressure varies with temperature. Theatmosphere of mars is stable enough to use this methodfor local altitude approximation so small robots can bettertrack their path and correct odometry.
As caves shield sunlight and radiation they could beidentified by measuring light and radiation intensityduring the day. However using equipment to measurethese characteristics would require the robot to enter thecave to some extent which might be impossible in caseswhere the wall of the cave pit is vertical.
All these parameters can be measured using lowpower, mass and compact integrated circuit or MEMSbased sensors. The search strategy described in thefollowing section is aimed at agents with similarly simpledigital or analogue sensors operating in a known range.
the afternoon and during night—Credit: NASA/JPL.
A. Kisdi, A.R.L. Tatnall / Acta Astronautica 68 (2011) 1790–1799 1793
2. Simulation programme
2.1. Objective
The simulation was set up using the Python program-ming language. One of the objectives was to keep thesimulation flexible to modification and development. Theprogram of the graphical interface was kept separate fromthe description of the Martian environment and the codewhich controls the bees. Therefore the different aspectscan be developed separately and different codes can betested without the need to rewrite anything. The softwareis open source and available for download free ofcharge [8].
2.2. Overview of the simulator
In the following sections all parts of the program arediscussed in detail: the scientific background and theincluded features and theories behind the workingmechanism.
2.2.1. Environment description
The simulation is two dimensional however at a laterdevelopment stage this was extended to pseudo threedimensional. Altitude is included but only the surface issimulated. The area is limited to 1 kilometre square.Multiple simulations can be run to test for larger areashowever, the 1 kilometre square is sufficient to show theconcepts and to compare different scenarios in order tooptimise the number of robots and the robot code. Thesimulated area is shown in two separate screens. Themain screen shows the 100 meter square with the Landerin the centre. This has a resolution of 0.1 meter square.This means there is a different value for each environ-mental aspect for every 0.1 meter square. Objects whichare smaller than this are not considered and it is assumedthat a robot can cover 0.1 meter square with its on boardsensors. The second screen shows more of the surround-ing up to one kilometre square and it has a resolution of 2meter square.
The main tool used to look for caves is the observationof temperature. As on Earth, caves on Mars have a moreeven temperature therefore the cave entrances are colderduring the day and warmer during the night [6]. As thegoal is to find the temperature difference between thecave entrance and a neutral point on the surface regard-less of the time of the day, the software is simplified anddoes not include day–night cycles.
Temperature values were approximated to give similarresults to those given in the Mars Environment Specificationdocument by NASA’s Jet Propulsion Laboratory [9]. Thetemperature is included for every point of the surface –within the resolution – in a two dimensional matrix.
Pressure, light and radiation intensity and other char-acteristics are not fully implemented in the simulation atthe time of the publication of this paper.
Possible caves can be generated at random or can beuser defined. Caves have a size and notable difference intemperature and some difference in pressure compare toother points of the surface. The larger the difference the
more likely it is to be a cave. Robots will locate all possibleentrances however the aim of the programme is that theswarm compares the locations and decides which one ismost likely to be a cave. Instruments on orbit are limitedby their resolution and viewing angle. Robots can be usedto detect smaller and more accessible caves. In order tomake it possible to compare different runs of the pro-gramme the caves were defined manually instead of beinggenerated randomly, a capability which is also included inthe program.
The environment file can be developed separately fromthe rest of the program. A major improvement in thefuture would be to include changes due to the day–nightcycle and weather conditions hence making the environ-ment change dynamically with time.
2.2.2. Robot movements simulation
The way the robots explore their surrounding, avoidobstacles or return to the Lander was aimed to mimic thebehaviour of the bees in the simplest possible way. Arandom walk pattern was tailored specifically for thesimulator. Other basic decisions – for example whichway the robot should turn if it hits an obstacle – aremade at random.
2.2.3. Time, outputs and user interface gives the mainframe
of the software
The main design goal of the interface was to begraphical and user friendly so simulations are easy toset up and the behaviour of the robots can be observedbefore the final data is returned. This way the user canconcentrate on the development of the robot code and canget graphical feedback identifying errors immediately.
When the program starts it asks for some user input.The type of robot control needs to be specified first. Theoptions are controlled or behaviour based robots. Ifbehaviour based is selected the program asks for thenumber of robots. In theory the software can run withany number of robots however it is optimised for lessthan one thousand. The last parameter the user needs toselect is the background. The user can choose betweentemperature and pressure display in the current version.
The programme displays three windows. The firstwindow shows the close surrounding of the Lander, a100 meter square zone while the second window shows a1 kilometre square area. Both screens have various mouseand keyboard commands. The third window displays thetime, the Lander’s memory and certain events such aswhen a robot finds a cave. Time is displayed in twodifferent ways. On top the simulation time is displayedin seconds and under it the Martian time. Martian time isdisplayed in minutes, hours and sols and one sol is 24 hand 39 min.
The average speed of the MER rovers is about 3 metersper minute. The maximum speed of the robots is alsoincluded in this code and it is assumed to be 0.1 meter perminute. The reason this value is so low is because thesmall size of the robots and the assumption that theyavoid or climb over small obstacles, stop to take measure-ments or turn around. It assumes the worst case, onwhich a real life scenario should only improve.
A. Kisdi, A.R.L. Tatnall / Acta Astronautica 68 (2011) 1790–17991794
3. Robot control
The most important attribute of an agent workingin a remote environment is reliability. Generally a simplesystem can be made more robust than a complex system.This applies to both hardware and software design.Therefore the main aim of the robot control was toachieve the required level of autonomy with the simplestpossible code. This can be achieved using subsumptionarchitecture [10], meaning decomposing intelligent beha-viour into many simple modules.
At the start of the program the robots are in the Landerand set off to explore their surrounding in a randommanner. While one might argue a more structured searchcould prevent repetition and ensure there are no areasmissed, such a strategy would need advanced AI orcollaboration between agents, hence more complexrobots. The results in this report show that a simplerandom walk can still improve greatly on previous pla-netary exploration missions while it gives the option touse very simple and therefore robust hardware. Reducingthe hardware requirement also means agents can bemade smaller or lighter allowing more advanced robotdesigns such as jumping or flying locomotion. Theycontinuously read the on board sensors and record thedistance they have travelled from the Lander. They avoidobstacles and have a certain chance of returning to theLander if they have not found anything of interest. Thischance is time dependent and described by the Poissondistribution. This model mimics how bees return to thehive after some time if the search was unsuccessful. If arobot finds an area which might be a cave entrance itreturns to the Lander immediately. Whenever a robotidentifies something as a cave or not depends on certainthreshold values which can be changed. In the simulationthe temperature difference threshold was set to 5 degrees.It is assumed that the robots continuously receive tem-perature measurements from the Lander wirelessly andcompare them to its own reading. The results show that arelatively fast decision can be made without the need ofadvanced sensors such as cameras. Again this design aimsto show that the strategy can be used with very simpleagents. If the Lander is mobile the swarm of ‘‘bees’’ canidentify the most interesting destination rapidly in orderto maximise the data of interest returned by the Lander’ssensor array which could include cameras and other highbandwidth devices.
Each robot stores the values of the last sensor mea-surements and does not store any new values on the wayback, unless it finds a ‘better’ – i.e. has a larger differencethan a neutral point on the surface – cave on the wayback. The robots take the shortest route, the ‘bee line’back to the Lander. As the robot keeps track of thedistance it travelled in a Cartesian frame it can calculatethe direction of the Lander and move directly back insteadof going back the way it came. For a real mission anotherpossibility to explore would be a continuous homingsignal sent from the Lander.
If a robot returns to the Lander it checks the memory ofthe Lander where all the discoveries are stored. Again thelack of wireless transmitter on board of every agent
minimalizes the hardware requirement. If it found a caveentrance which is better than any in the Lander’s memory, ituploads the data to the Lander which than sorts the list ofstored data. This way the Lander acts as the hive of beeswhich can communicate past findings to any explorer beeswhich returns. If some possible cave sites are alreadydiscovered, the robot decides whenever to start a new searchor go to one of the possible caves and take measurementsagain. A better cave has a higher chance to be revisited.
This way the robots interact with each other by the useof stigmergy [11]. Stigmergy means that there is no directinteraction between agents, yet they are able to commu-nicate through a third party. They modify their environ-ment, in this case the hive (Lander), and other bees(robots) are then able to detect this change thereforereceiving information from the other agents.
Another advantage of such a simple control is that intheory the robots could be built purely on analoguetechnology without microprocessors. An analogue systemwould be much more robust than digital technology as itwould not be vulnerable to radiation and could tolerate amuch wider temperature range. Also analogue systemsare much faster and are therefore able to respond tochanges such as the sudden appearance of a cliff or caveentrance. On the other hand digital control would enablethe robots to be improved further and could significantlyincrease the amount of data returned. Therefore bothoptions should be considered in future investigation ofthe mission.
4. Results and discussion
To be able to quantify the findings from the simulator,some numerical results have to be recorded. The simula-tion can be set up in many different ways. For this sectionseveral set ups were used in order to collect comparabledata and try to answer the main questions regarding thebee search algorithm:
�
Were the ‘better’ cave entrances visited by morerobots than others? � Is there a relationship between the size of the swarmand its effectiveness?
� Is there an optimal number of robots? � Can the program be used to find the optimal number ofrobots?
� How long does it take to find all caves in acertain area?
� How large an area can the robots explore in a certainperiod of time?
� How do the findings compare with existing missions?The variables which can be changed without modify-ing the software:
�
Number of robots. � Number of caves, with the choice of random cavegeneration or manual set up.
� The number of times the program should runsubsequently.
A. Kisdi, A.R.L. Tatnall / Acta Astronautica 68 (2011) 1790–1799 1795
�
Tab10
Nro
1
Time of simulation with the option not to have a timelimit i.e. the simulation runs forever. (Time in terms ofsimulated Martian time.)
� Whenever the simulation should be stopped after anumber of cave entrances have been found.
4.1. Comparing results with bee behaviour in nature
The program was designed to mimic the behaviour ofbees in nature in order to distinguish important and lessimportant results and concentrate on retrieving moredata from the important locations. All the caves whichwere found by the robots are included in the results aswell as the number of times a robot visited that cave(number of ‘hits on cave’ in results). The cave with thelowest temperature, hence highest temperature differ-ence from the Lander should be the one visited mosttimes; while other cave entrances should have consider-ably less visits. More visits in nature removes potentialbias, and similarly in case of artificial agents if a robot’ssensor malfunctions or has high level of noise the resultfrom the system is not effected. Due to the random walkof the agents multiple simulation results have to beaveraged to draw an acceptable conclusion.
4.1.1. Results from 100 simulation runs
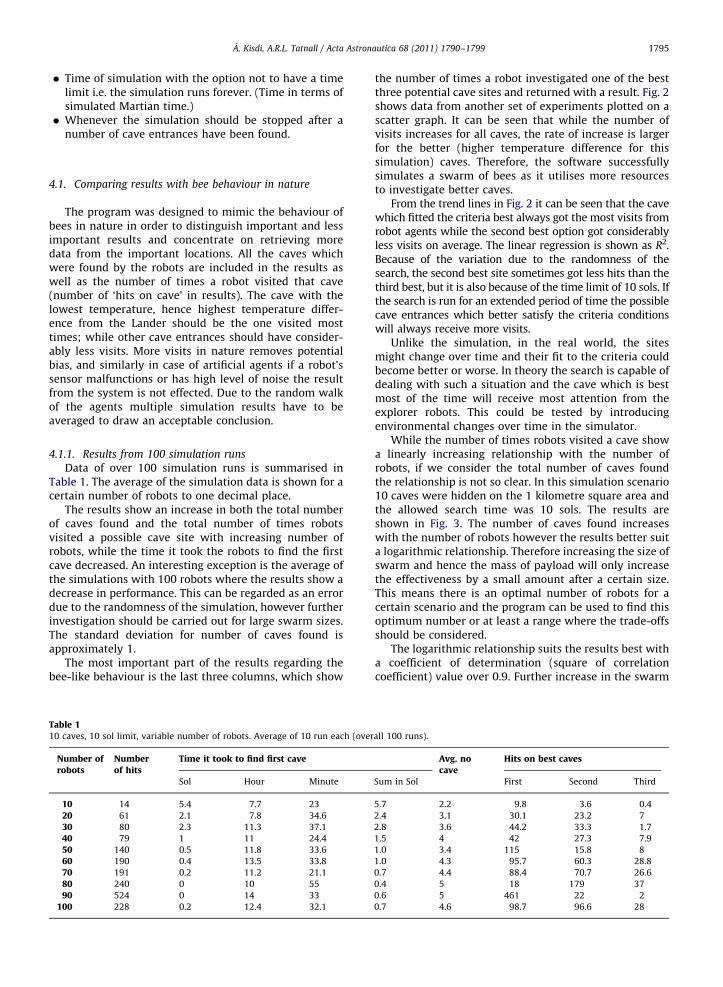
Data of over 100 simulation runs is summarised inTable 1. The average of the simulation data is shown for acertain number of robots to one decimal place.
The results show an increase in both the total numberof caves found and the total number of times robotsvisited a possible cave site with increasing number ofrobots, while the time it took the robots to find the firstcave decreased. An interesting exception is the average ofthe simulations with 100 robots where the results show adecrease in performance. This can be regarded as an errordue to the randomness of the simulation, however furtherinvestigation should be carried out for large swarm sizes.The standard deviation for number of caves found isapproximately 1.
The most important part of the results regarding thebee-like behaviour is the last three columns, which show
le 1caves, 10 sol limit, variable number of robots. Average of 10 run each (over
umber ofbots
Numberof hits
Time it took to find first cave
Sol Hour Minute
10 14 5.4 7.7 23
20 61 2.1 7.8 34.6
30 80 2.3 11.3 37.1
40 79 1 11 24.4
50 140 0.5 11.8 33.6
60 190 0.4 13.5 33.8
70 191 0.2 11.2 21.1
80 240 0 10 55
90 524 0 14 33
00 228 0.2 12.4 32.1
the number of times a robot investigated one of the bestthree potential cave sites and returned with a result. Fig. 2shows data from another set of experiments plotted on ascatter graph. It can be seen that while the number ofvisits increases for all caves, the rate of increase is largerfor the better (higher temperature difference for thissimulation) caves. Therefore, the software successfullysimulates a swarm of bees as it utilises more resourcesto investigate better caves.
From the trend lines in Fig. 2 it can be seen that the cavewhich fitted the criteria best always got the most visits fromrobot agents while the second best option got considerablyless visits on average. The linear regression is shown as R2.Because of the variation due to the randomness of thesearch, the second best site sometimes got less hits than thethird best, but it is also because of the time limit of 10 sols. Ifthe search is run for an extended period of time the possiblecave entrances which better satisfy the criteria conditionswill always receive more visits.
Unlike the simulation, in the real world, the sitesmight change over time and their fit to the criteria couldbecome better or worse. In theory the search is capable ofdealing with such a situation and the cave which is bestmost of the time will receive most attention from theexplorer robots. This could be tested by introducingenvironmental changes over time in the simulator.
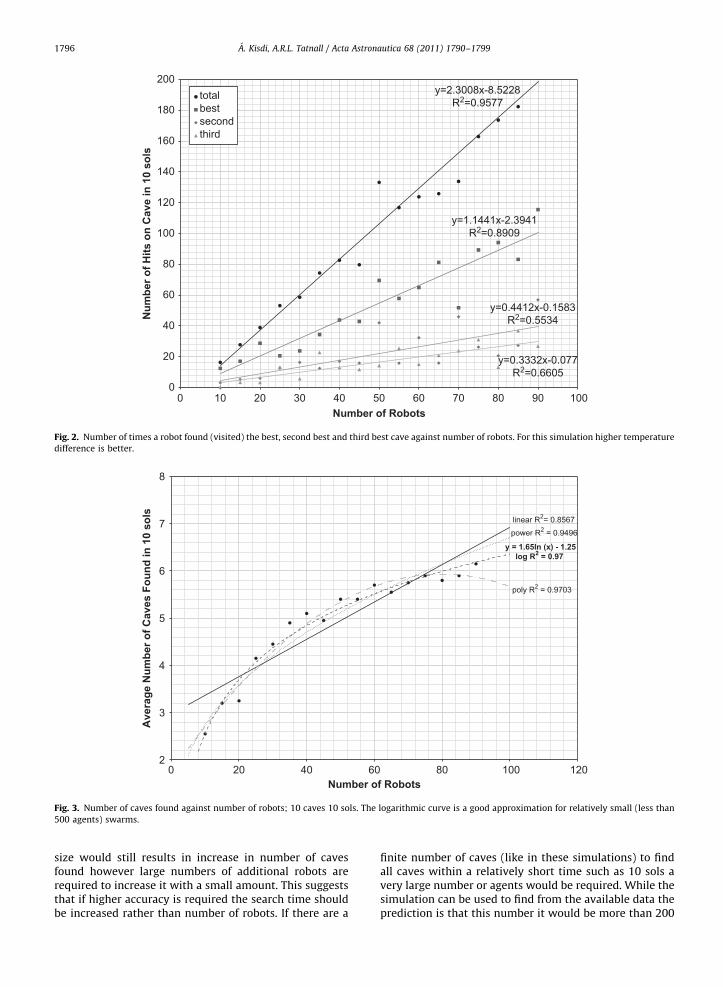
While the number of times robots visited a cave showa linearly increasing relationship with the number ofrobots, if we consider the total number of caves foundthe relationship is not so clear. In this simulation scenario10 caves were hidden on the 1 kilometre square area andthe allowed search time was 10 sols. The results areshown in Fig. 3. The number of caves found increaseswith the number of robots however the results better suita logarithmic relationship. Therefore increasing the size ofswarm and hence the mass of payload will only increasethe effectiveness by a small amount after a certain size.This means there is an optimal number of robots for acertain scenario and the program can be used to find thisoptimum number or at least a range where the trade-offsshould be considered.
The logarithmic relationship suits the results best witha coefficient of determination (square of correlationcoefficient) value over 0.9. Further increase in the swarm
all 100 runs).
Avg. nocave
Hits on best caves
Sum in Sol First Second Third
5.7 2.2 9.8 3.6 0.4
2.4 3.1 30.1 23.2 7
2.8 3.6 44.2 33.3 1.7
1.5 4 42 27.3 7.9
1.0 3.4 115 15.8 8
1.0 4.3 95.7 60.3 28.8
0.7 4.4 88.4 70.7 26.6
0.4 5 18 179 37
0.6 5 461 22 2
0.7 4.6 98.7 96.6 28
0
20
40
60
80
100
120
140
160
180
200
0 10 20 30 40 50 60 70 80 90 100
Num
ber o
f Hits
on
Cav
e in
10
sols
Number of Robots
totalbestsecondthird
y=2.3008x-8.5228R2=0.9577
y=1.1441x-2.3941R2=0.8909
y=0.4412x-0.1583R2=0.5534
y=0.3332x-0.077R2=0.6605
Fig. 2. Number of times a robot found (visited) the best, second best and third best cave against number of robots. For this simulation higher temperature
difference is better.
linear R2= 0.8567
poly R2 = 0.9703
y = 1.65ln (x) - 1.25log R2 = 0.97
power R2 = 0.9496
2
3
4
5
6
7
8
0 20 40 60 80 100 120
Ave
rage
Num
ber o
f Cav
es F
ound
in 1
0 so
ls
Number of Robots
Fig. 3. Number of caves found against number of robots; 10 caves 10 sols. The logarithmic curve is a good approximation for relatively small (less than
500 agents) swarms.
A. Kisdi, A.R.L. Tatnall / Acta Astronautica 68 (2011) 1790–17991796
size would still results in increase in number of cavesfound however large numbers of additional robots arerequired to increase it with a small amount. This suggeststhat if higher accuracy is required the search time shouldbe increased rather than number of robots. If there are a
finite number of caves (like in these simulations) to findall caves within a relatively short time such as 10 sols avery large number or agents would be required. While thesimulation can be used to find from the available data theprediction is that this number it would be more than 200
A. Kisdi, A.R.L. Tatnall / Acta Astronautica 68 (2011) 1790–1799 1797
which would result in an impractically large swarm.Hence a search with a reasonable number of agents is inmost cases incomplete.
4.1.2. Effects of changes in the size of the swarm
To determine the relationship between the number ofrobots in the swarm and its effectiveness, a single scenariowas set up and results from multiple simulation runsobserved. Five cave entrances were added in the 100 metersquare area around the Lander and five more further than50 meters but closer than 500 meters away. The simulationwas run for 5 sols, ten times with a certain number ofrobots. The minimum size of the swarm was ten robots andit was increased by five robots each time up to 70.
Table 2 summarises the results by averaging the out-comes from the 10 separate runs for each number ofrobots. The simulations ran for 5 sols each time and theposition and size of the caves were fixed. The first columnshows the number of robots, the second column the totalnumber of times a robot discovered or visited a cave, thethird column the number of caves that were discoveredand the last column the ‘effective radius’ of the search.This means that over 80 per cent of the caves had beenfound within the radius.
As discussed in Section 4.1.1 the amount of datareturned from potential cave sites increases with the sizeof the swarm. This suggests there is always a benefit inincreasing the swarm size. However for a given massbudget, an increase in swarm size would reduce the massassigned to a single robot and therefore the capability ofthe explorers. The relationship between the number ofcaves found and the number of robots also show a non-linear tend. For the data obtained for five sols runs thetrend line which fits best is a logarithmic curve. Asdiscussed previously it is the same for ten sols run thelogarithmic curve was a best fit. Whilst determination of ageneral equation would require many more simulationruns some conclusions can be drawn from these results:
�
TabRes
Nro
1122334455667
There is a strong correlation between the number ofrobots and the science returned.
� The relationship between the number of caves foundand the number of robots is nonlinear.
le 2ults from 130 simulation runs with a 5 sol time limit.
umber ofbots
Total numberof hits
Number ofcaves found
Averagedistance (m)
0 5.5 1.7 267.9
5 7.7 2.3 269.85
0 8.9 1.9 263.15
5 15.6 2.5 279.4
0 15.7 2.8 322.7
5 15 2.7 288.85
0 21 2.9 304.85
5 23.1 3 321.45
0 28.6 3 314.05
5 25.1 3 346.9
0 30.9 3.2 315.85
5 31.6 3 312.25
0 32.5 3.2 352.2
�
After a specific number of robots any further increaseof swarm will only improve the performance by asmall amount—this number can be found by multiplesimulation runs. � The simulator can be used to determine the optimalnumber of robots for a certain mission.
4.1.3. Time to find caves and search a certain area
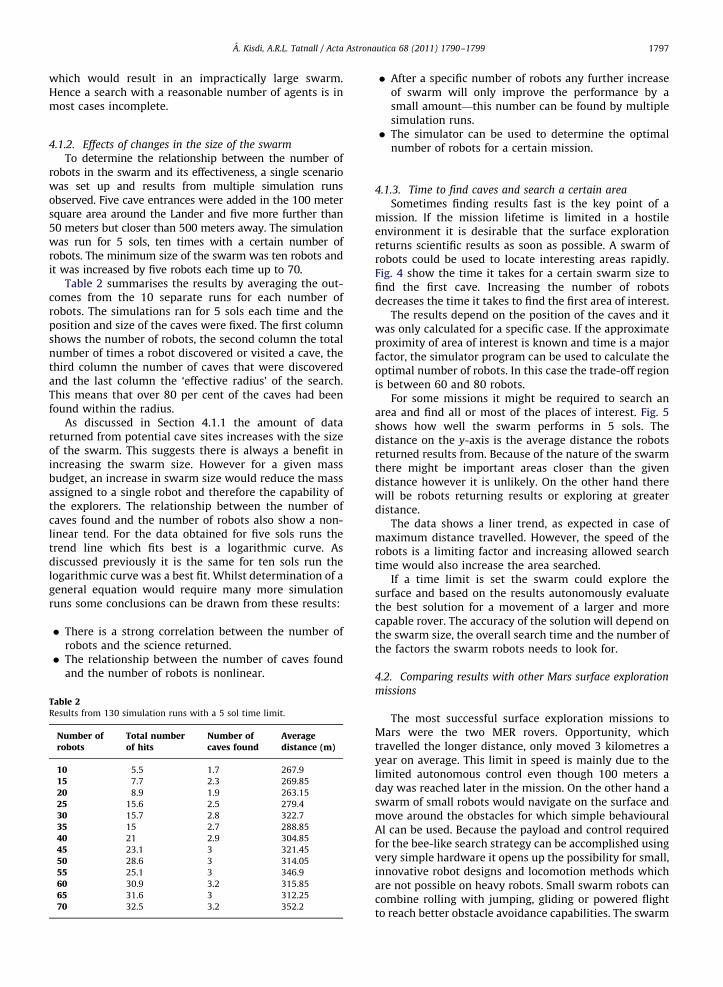
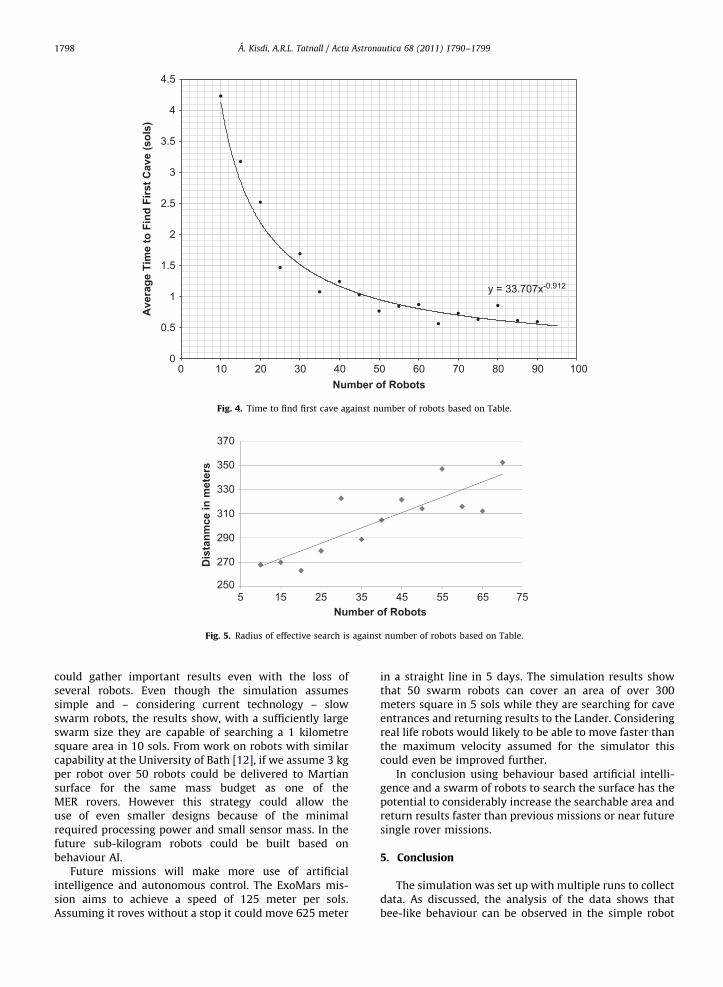
Sometimes finding results fast is the key point of amission. If the mission lifetime is limited in a hostileenvironment it is desirable that the surface explorationreturns scientific results as soon as possible. A swarm ofrobots could be used to locate interesting areas rapidly.Fig. 4 show the time it takes for a certain swarm size tofind the first cave. Increasing the number of robotsdecreases the time it takes to find the first area of interest.
The results depend on the position of the caves and itwas only calculated for a specific case. If the approximateproximity of area of interest is known and time is a majorfactor, the simulator program can be used to calculate theoptimal number of robots. In this case the trade-off regionis between 60 and 80 robots.
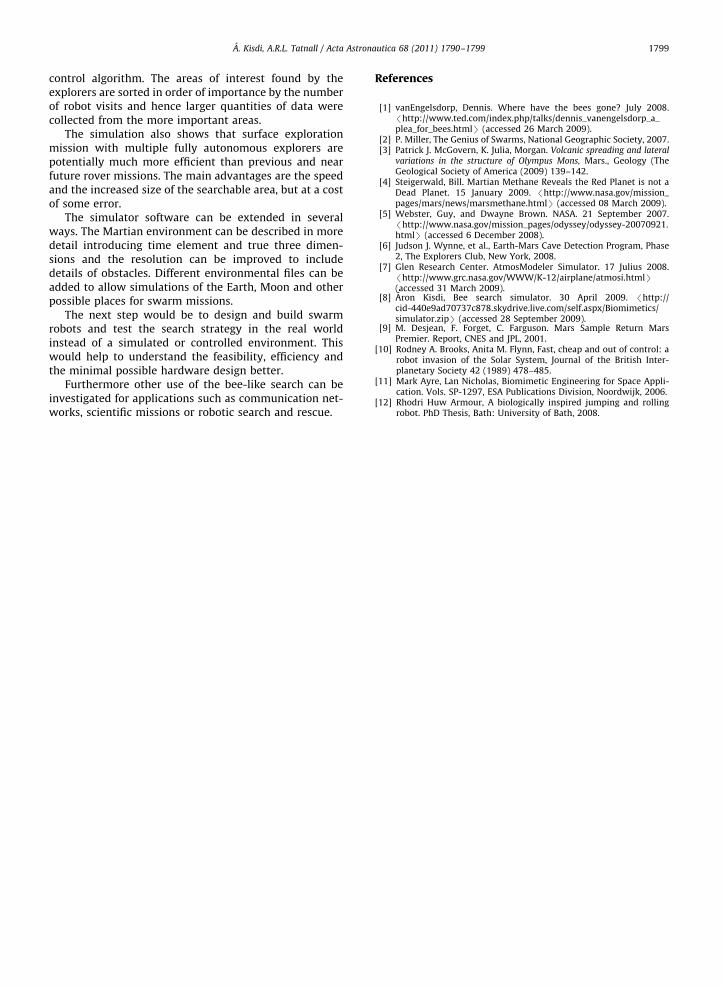
For some missions it might be required to search anarea and find all or most of the places of interest. Fig. 5shows how well the swarm performs in 5 sols. Thedistance on the y-axis is the average distance the robotsreturned results from. Because of the nature of the swarmthere might be important areas closer than the givendistance however it is unlikely. On the other hand therewill be robots returning results or exploring at greaterdistance.
The data shows a liner trend, as expected in case ofmaximum distance travelled. However, the speed of therobots is a limiting factor and increasing allowed searchtime would also increase the area searched.
If a time limit is set the swarm could explore thesurface and based on the results autonomously evaluatethe best solution for a movement of a larger and morecapable rover. The accuracy of the solution will depend onthe swarm size, the overall search time and the number ofthe factors the swarm robots needs to look for.
4.2. Comparing results with other Mars surface exploration
missions
The most successful surface exploration missions toMars were the two MER rovers. Opportunity, whichtravelled the longer distance, only moved 3 kilometres ayear on average. This limit in speed is mainly due to thelimited autonomous control even though 100 meters aday was reached later in the mission. On the other hand aswarm of small robots would navigate on the surface andmove around the obstacles for which simple behaviouralAI can be used. Because the payload and control requiredfor the bee-like search strategy can be accomplished usingvery simple hardware it opens up the possibility for small,innovative robot designs and locomotion methods whichare not possible on heavy robots. Small swarm robots cancombine rolling with jumping, gliding or powered flightto reach better obstacle avoidance capabilities. The swarm
5 15 25 35 45 55 65 75
Dis
tanm
ce in
met
ers
Number of Robots
370
350
330
310
290
270
250
Fig. 5. Radius of effective search is against number of robots based on Table.
y = 33.707x-0.912
0
0.5
1
1.5
2
2.5
3
3.5
4
4.5
0 10 20 30 40 50 60 70 80 90 100
Ave
rage
Tim
e to
Fin
d Fi
rst C
ave
(sol
s)
Number of Robots
Fig. 4. Time to find first cave against number of robots based on Table.
A. Kisdi, A.R.L. Tatnall / Acta Astronautica 68 (2011) 1790–17991798
could gather important results even with the loss ofseveral robots. Even though the simulation assumessimple and – considering current technology – slowswarm robots, the results show, with a sufficiently largeswarm size they are capable of searching a 1 kilometresquare area in 10 sols. From work on robots with similarcapability at the University of Bath [12], if we assume 3 kgper robot over 50 robots could be delivered to Martiansurface for the same mass budget as one of theMER rovers. However this strategy could allow theuse of even smaller designs because of the minimalrequired processing power and small sensor mass. In thefuture sub-kilogram robots could be built based onbehaviour AI.
Future missions will make more use of artificialintelligence and autonomous control. The ExoMars mis-sion aims to achieve a speed of 125 meter per sols.Assuming it roves without a stop it could move 625 meter
in a straight line in 5 days. The simulation results showthat 50 swarm robots can cover an area of over 300meters square in 5 sols while they are searching for caveentrances and returning results to the Lander. Consideringreal life robots would likely to be able to move faster thanthe maximum velocity assumed for the simulator thiscould even be improved further.
In conclusion using behaviour based artificial intelli-gence and a swarm of robots to search the surface has thepotential to considerably increase the searchable area andreturn results faster than previous missions or near futuresingle rover missions.
5. Conclusion
The simulation was set up with multiple runs to collectdata. As discussed, the analysis of the data shows thatbee-like behaviour can be observed in the simple robot
A. Kisdi, A.R.L. Tatnall / Acta Astronautica 68 (2011) 1790–1799 1799
control algorithm. The areas of interest found by theexplorers are sorted in order of importance by the numberof robot visits and hence larger quantities of data werecollected from the more important areas.
The simulation also shows that surface explorationmission with multiple fully autonomous explorers arepotentially much more efficient than previous and nearfuture rover missions. The main advantages are the speedand the increased size of the searchable area, but at a costof some error.
The simulator software can be extended in severalways. The Martian environment can be described in moredetail introducing time element and true three dimen-sions and the resolution can be improved to includedetails of obstacles. Different environmental files can beadded to allow simulations of the Earth, Moon and otherpossible places for swarm missions.
The next step would be to design and build swarmrobots and test the search strategy in the real worldinstead of a simulated or controlled environment. Thiswould help to understand the feasibility, efficiency andthe minimal possible hardware design better.
Furthermore other use of the bee-like search can beinvestigated for applications such as communication net-works, scientific missions or robotic search and rescue.
References
[1] vanEngelsdorp, Dennis. Where have the bees gone? July 2008./http://www.ted.com/index.php/talks/dennis_vanengelsdorp_a_plea_for_bees.htmlS (accessed 26 March 2009).
[2] P. Miller, The Genius of Swarms, National Geographic Society, 2007.[3] Patrick J. McGovern, K. Julia, Morgan. Volcanic spreading and lateral
variations in the structure of Olympus Mons, Mars., Geology (TheGeological Society of America (2009) 139–142.
[4] Steigerwald, Bill. Martian Methane Reveals the Red Planet is not aDead Planet. 15 January 2009. /http://www.nasa.gov/mission_pages/mars/news/marsmethane.htmlS (accessed 08 March 2009).
[5] Webster, Guy, and Dwayne Brown. NASA. 21 September 2007./http://www.nasa.gov/mission_pages/odyssey/odyssey-20070921.htmlS (accessed 6 December 2008).
[6] Judson J. Wynne, et al., Earth-Mars Cave Detection Program, Phase2, The Explorers Club, New York, 2008.
[7] Glen Research Center. AtmosModeler Simulator. 17 Julius 2008./http://www.grc.nasa.gov/WWW/K-12/airplane/atmosi.htmlS(accessed 31 March 2009).
[8] Aron Kisdi, Bee search simulator. 30 April 2009. /http://cid-440e9ad70737c878.skydrive.live.com/self.aspx/Biomimetics/simulator.zipS (accessed 28 September 2009).
[9] M. Desjean, F. Forget, C. Farguson. Mars Sample Return MarsPremier. Report, CNES and JPL, 2001.
[10] Rodney A. Brooks, Anita M. Flynn, Fast, cheap and out of control: arobot invasion of the Solar System, Journal of the British Inter-planetary Society 42 (1989) 478–485.
[11] Mark Ayre, Lan Nicholas, Biomimetic Engineering for Space Appli-cation. Vols. SP-1297, ESA Publications Division, Noordwijk, 2006.
[12] Rhodri Huw Armour, A biologically inspired jumping and rollingrobot. PhD Thesis, Bath: University of Bath, 2008.