future-ready whole building retrofits façades and core20%c3%a2... · missing ballast, missing or...
TRANSCRIPT
Future-Ready Whole Building Retrofits Façades and CoreScott Armstrong, Dipl. Arch. Tech., BSSO, CET, LEED AP BD+CSenior Façade Specialist, Project Director
Hannah Thevapalan, B.Arch.Sci., M.Eng.Façade Specialist, Project Manager
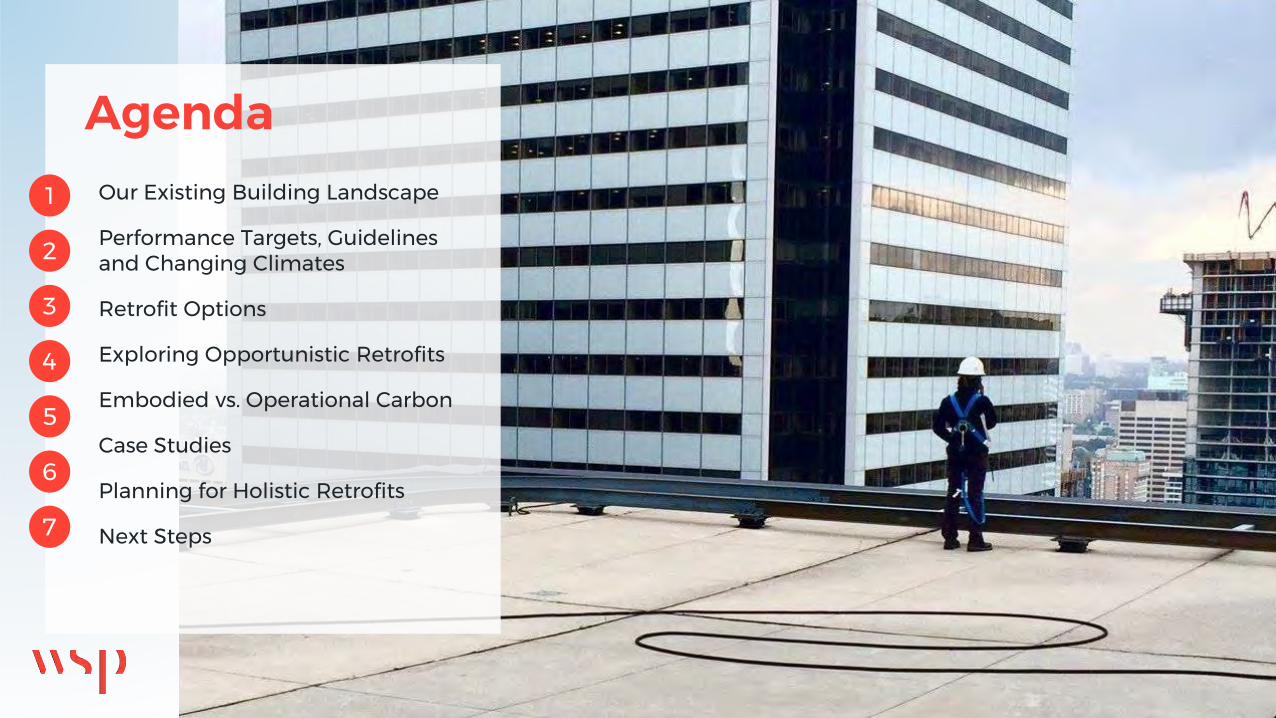
AgendaOur Existing Building Landscape
Performance Targets, Guidelines and Changing Climates
Retrofit Options
Exploring Opportunistic Retrofits
Embodied vs. Operational Carbon
Case Studies
Planning for Holistic Retrofits
Next Steps
1
2
3
4
5
6
7

EXISTING BUILDING LANDSCAPE
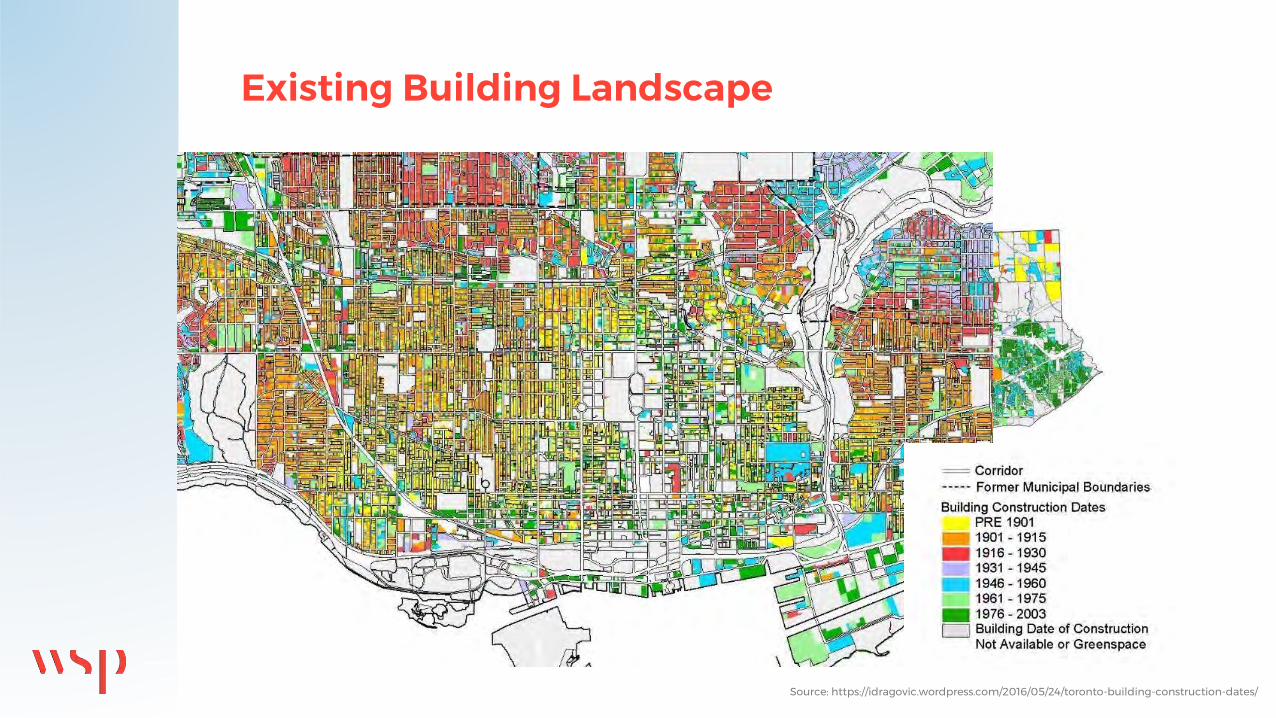
Existing Building Landscape
Source: https://idragovic.wordpress.com/2016/05/24/toronto-building-construction-dates/
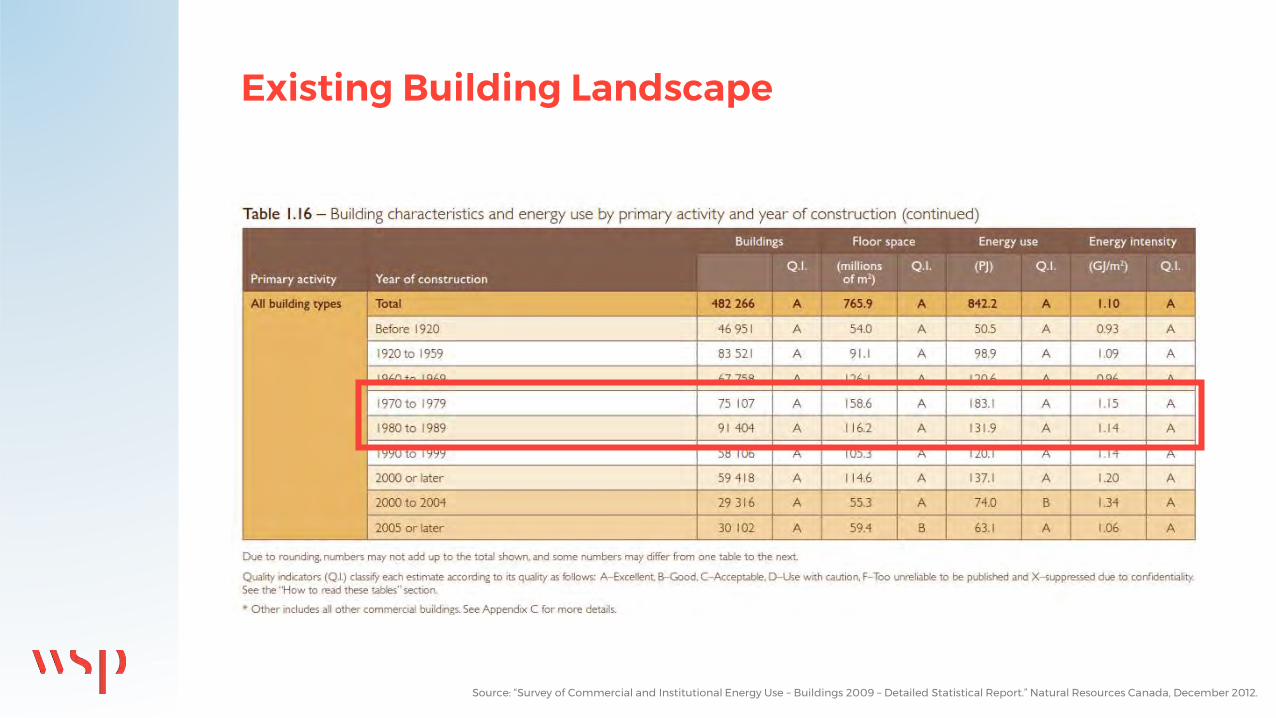
Source: “Survey of Commercial and Institutional Energy Use – Buildings 2009 – Detailed Statistical Report.” Natural Resources Canada, December 2012.
Existing Building Landscape
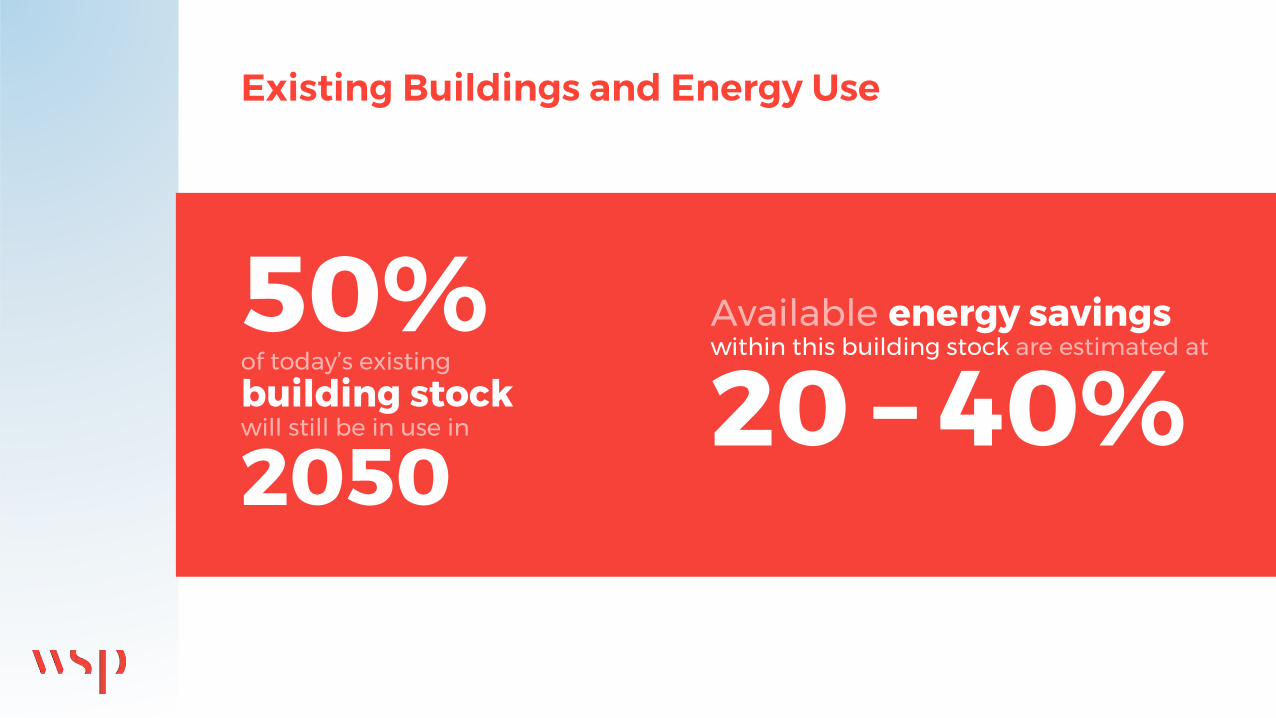
Existing Buildings and Energy Use
50%
2050
of today’s existing
building stockwill still be in use in 20 – 40%
Available energy savingswithin this building stock are estimated at

PERFORMANCE TARGETS
& GUIDELINES

2016 Vancouver Declaration 30%+ emissions reduction by 2030
Sustainability
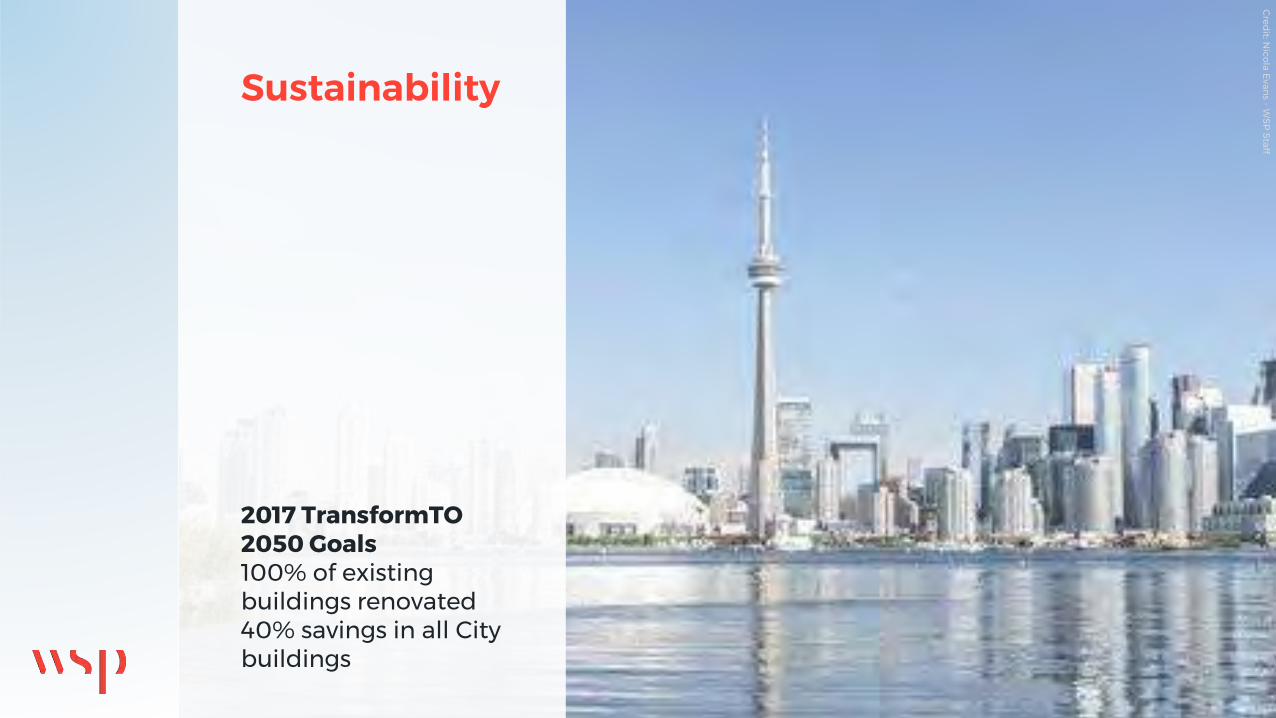
2017 TransformTO2050 Goals100% of existing buildings renovated 40% savings in all City buildings
Cred
it: Nico
la Evan
s -W
SP
Staff
Sustainability
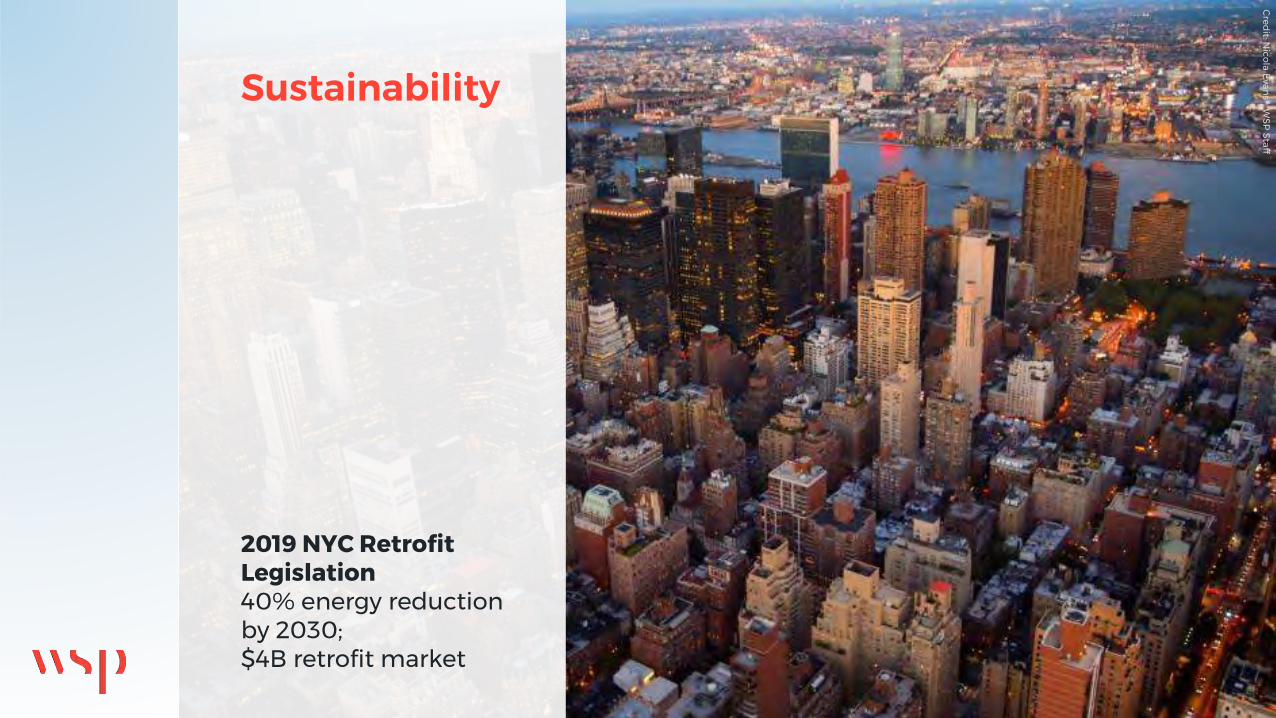
2019 NYC Retrofit Legislation40% energy reduction by 2030; $4B retrofit market
Cred
it: Nico
la Evan
s -W
SP
Staff
Sustainability
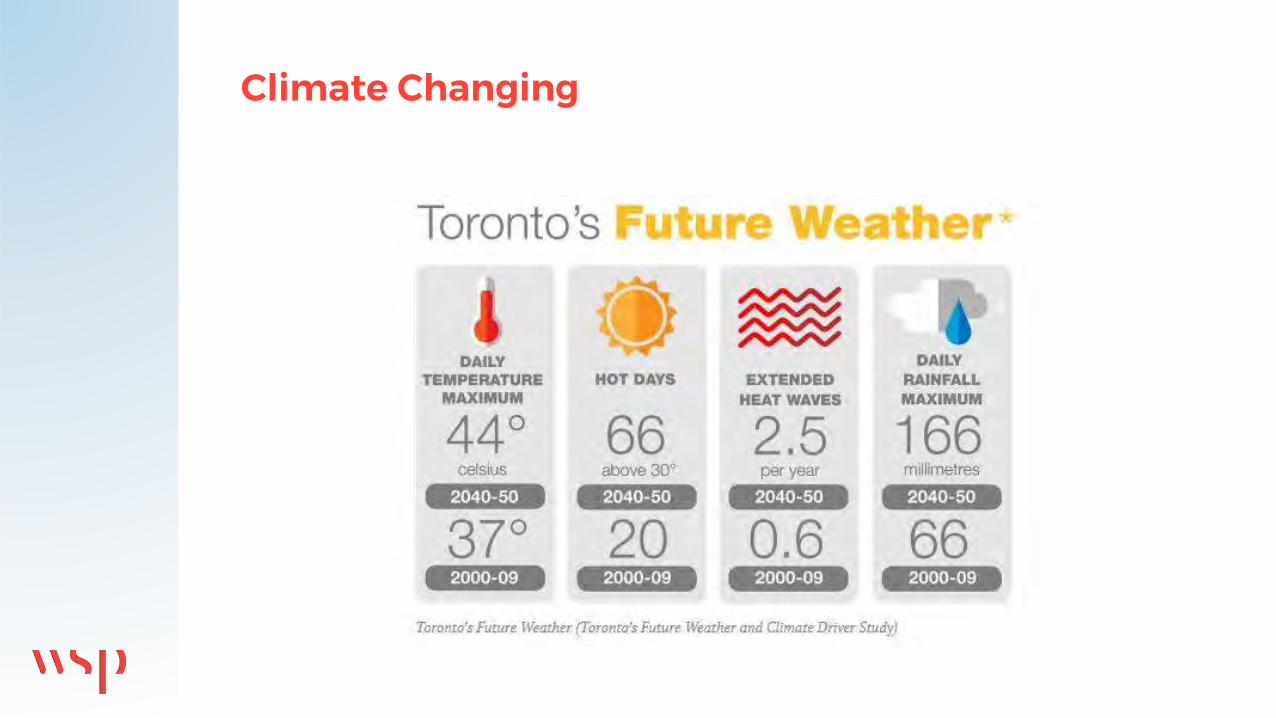
Climate Changing
Climate Changing
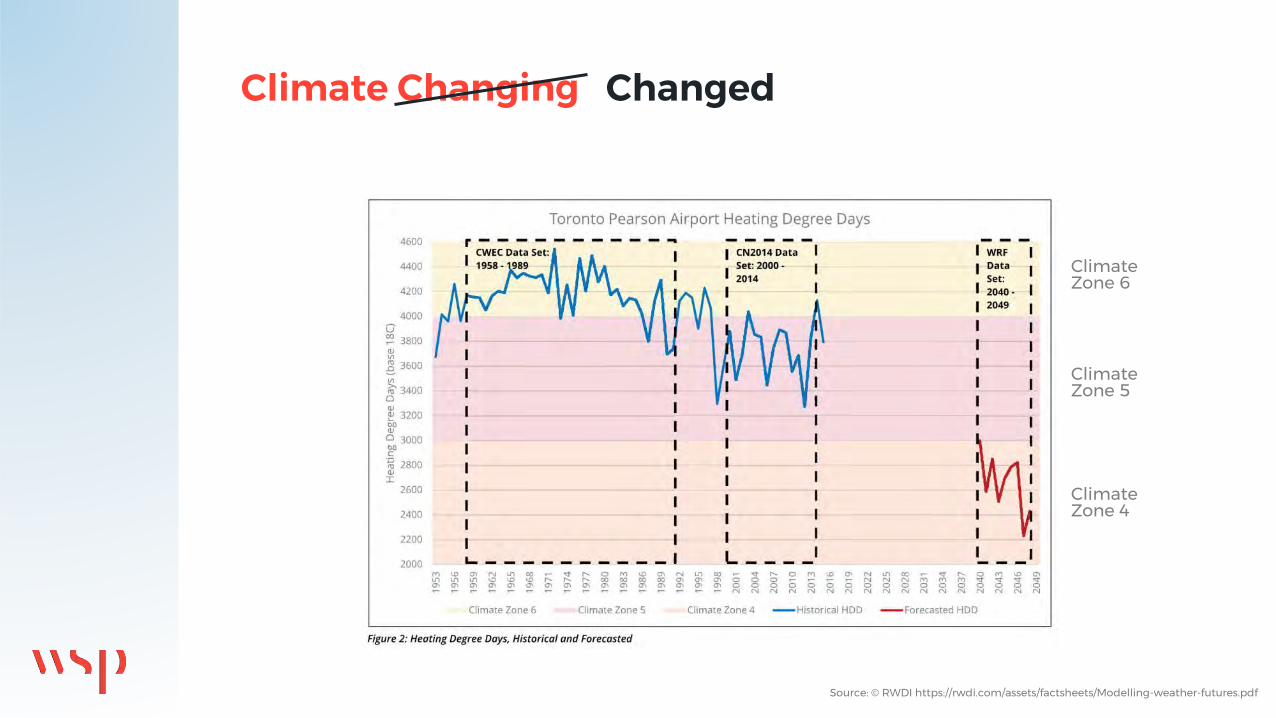
Climate Zone 6
Climate Zone 5
Climate Zone 4
Changed
Source: © RWDI https://rwdi.com/assets/factsheets/Modelling-weather-futures.pdf
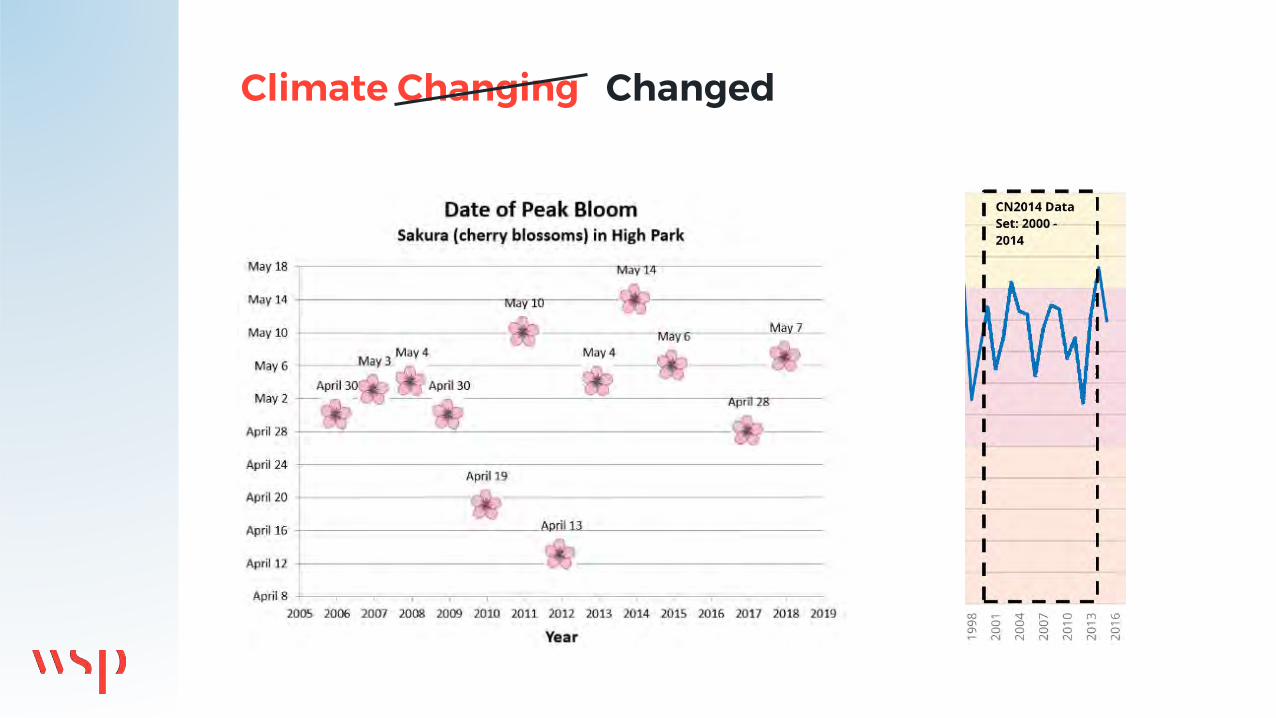
Climate Changing Changed
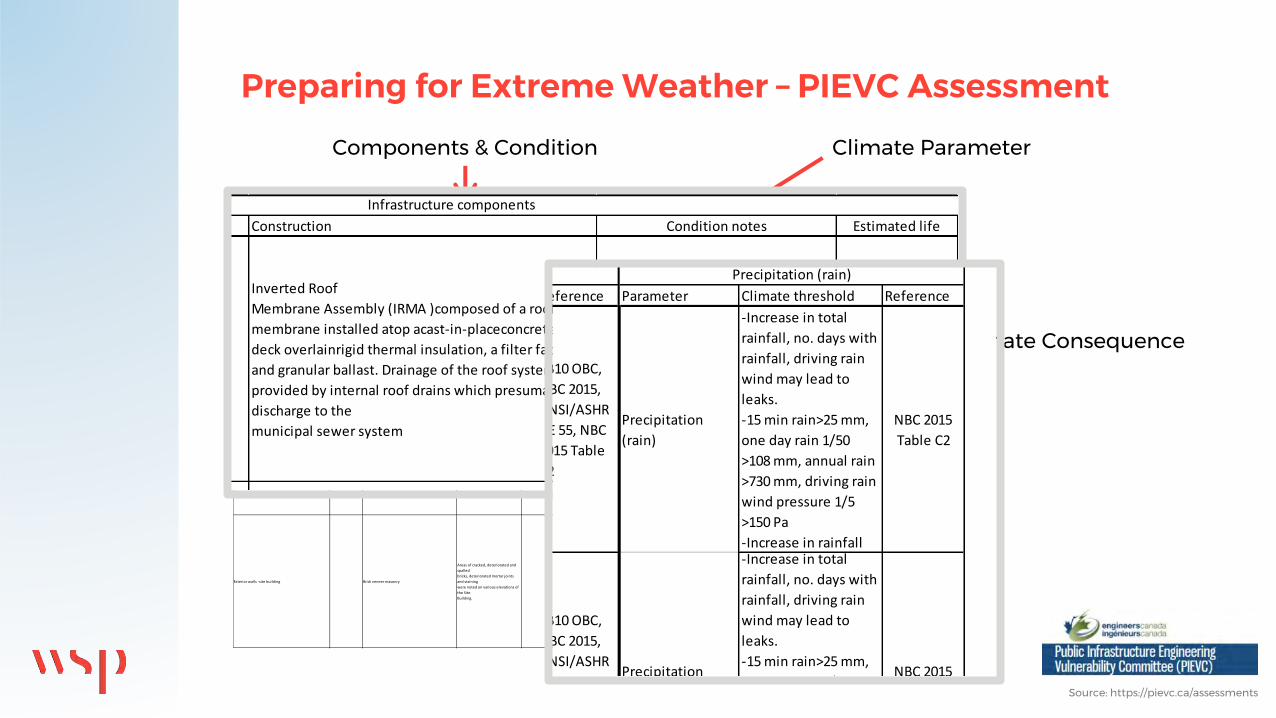
Preparing for Extreme Weather – PIEVC Assessment
Component Year installed Construction Condition notes Estimated life Source estimated life Parameter Climate threshold Reference Parameter Climate threshold Reference Parameter Climate threshold Reference
Roof system - main roof 2010
Inverted Roof
Membrane Assembly (IRMA )composed of a roof
membrane installed atop acast-in-placeconcrete roof
deck overlainrigid thermal insulation, a filter fabric
and granular ballast. Drainage of the roof systems is
provided by internal roof drains which presumably
discharge to the
municipal sewer system
No major deficiencies. Areas with
missing ballast, missing or damaged
drains, poor detailing in flashing,
20-30
Cost Database - PMR High-
rise
(e.g., BUR, MB and Hot
Rubber)
Temperature
– average
-Increased HDD and CDD
leads to higher energy
consumption
'-HDD>3760 (threshold
from NBC 2015)
SB10 OBC,
NBC 2015
Table C2
Temperature –
extremes
-Extreme
temperatures may
lead to discomfort
indoors
-Tout > 31C
-Tout < -22C
(thresholds from
NBC 2015)
SB10 OBC,
NBC 2015,
ANSI/ASHR
AE 55, NBC
2015 Table
C2
Precipitation
(rain)
-Increase in total
rainfall, no. days with
rainfall, driving rain
wind may lead to
leaks.
-15 min rain>25 mm,
one day rain 1/50
>108 mm, annual rain
>730 mm, driving rain
wind pressure 1/5
>150 Pa
-Increase in rainfall
NBC 2015
Table C2
Roof system - penthouse
2001-2006*
(scheduled for
2016
replacement)
Conventionally-designed modified bitumen
membrane installed atop rigid thermal insulation
atop corrugated steel roof decking. Drainage of the
roofsystems is provided by internal roof drains which
presumably discharge to the
municipal sewer system
No major deficiencies. Areas with
blistering20
Cost Database -
Conventional, High-rise -
Replace BUR, Mod Bit
Temperature
– average
-Increased HDD and CDD
leads to higher energy
consumption
'-HDD>3760 (threshold
from NBC 2015)
SB10 OBC,
NBC 2015
Table C2
Temperature –
extremes
-Extreme
temperatures may
lead to discomfort
indoors
-Tout > 31C
-Tout < -22C
(thresholds from
NBC 2015)
SB10 OBC,
NBC 2015,
ANSI/ASHR
AE 55, NBC
2015 Table
C2
Precipitation
(rain)
-Increase in total
rainfall, no. days with
rainfall, driving rain
wind may lead to
leaks.
-15 min rain>25 mm,
one day rain 1/50
>108 mm, annual rain
>730 mm, driving rain
wind pressure 1/5
>150 Pa
-Increase in rainfall
lead to higher
NBC 2015
Table C2
Roof system - staggered lower roofs 2014/2015
Loose laid and ballasted Ethylene Propylene Diene
Monomer (EPDM) membrane complete with “Sure-
White”
EPDM upturn membrane flashings. Drainage of the
roofsystems is provided by internal roof drains which
presumably discharge to the
municipal sewer system
25-30
Cost database - PMR High-
rise - Fully Adhered
Reinforced Single Ply
Membrane (i.e., TRA)
Temperature
– average
-Increased HDD and CDD
leads to higher energy
consumption
'-HDD>3760 (threshold
from NBC 2015)
SB10 OBC,
NBC 2015
Table C2
Temperature –
extremes
-Extreme
temperatures may
lead to discomfort
indoors
-Tout > 31C
-Tout < -22C
(thresholds from
NBC 2015)
SB10 OBC,
NBC 2015,
ANSI/ASHR
AE 55, NBC
2015 Table
C2
Precipitation
(rain)
-Increase in total
rainfall, no. days with
rainfall, driving rain
wind may lead to
leaks.
-15 min rain>25 mm,
one day rain 1/50
>108 mm, annual rain
>730 mm, driving rain
wind pressure 1/5
>150 Pa
-Increase in rainfall
lead to higher
runnoff and surpass
capacity of gutter
system
NBC 2015
Table C2
Roof system - atriumSloped glazing. Drainage by surface deflection
and discharged onto the lower roof systems
Temperature
– average
-Increased HDD and CDD
leads to higher energy
consumption
'-HDD>3760 (threshold
from NBC 2015)
SB10 OBC,
NBC 2015
Table C2
Temperature –
extremes
-Extreme
temperatures may
lead to discomfort
indoors
-Tout > 31C
-Tout < -22C
(thresholds from
NBC 2015)
SB10 OBC,
NBC 2015,
ANSI/ASHR
AE 55, NBC
2015 Table
C2
Precipitation
(rain)
-Increase in total
rainfall, no. days with
rainfall, driving rain
wind may lead to
leaks.
-15 min rain>25 mm,
one day rain 1/50
>108 mm, annual rain
>730 mm, driving rain
wind pressure 1/5
>150 Pa
-Increase in rainfall
lead to higher
runnoff and surpass
capacity of gutter
system
NBC 2015
Table C2
Exterior walls -site building Brick veneer masonry
Areas of cracked, deteriorated and
spalled
bricks, deteriorated mortar joints
and staining
were noted on various elevations of
the Site
Building.
Temperature
– average
-Increased HDD and CDD
leads to higher energy
consumption
'-HDD>3760 (threshold
from NBC 2015)
SB10 OBC,
NBC 2015
Table C2
Temperature –
extremes
-Extreme
temperatures may
lead to discomfort
indoors
-Tout > 31C
-Tout < -22C
(thresholds from
NBC 2015)
-Increased
exposure to
freeze/thaw may
excacerbate brick
deterioration
-Increased
deformation of
materials
(particularly
metallic elements)
due to increase in
magnitud of
extreme
temperatures
SB10 OBC,
NBC 2015,
ANSI/ASHR
AE 55, NBC
2015 Table
C2
Precipitation
(rain)
-Increase in total
rainfall, no. days with
rainfall, driving rain
wind may lead to
leaks.
-Increased exposure
to water may
excacerbate brick
deterioration
-15 min rain>25 mm,
one day rain 1/50
>108 mm, annual rain
>730 mm, driving rain
wind pressure 1/5
>150 Pa
NBC 2015
Table C2
Infrastructure components Precipitation (rain)Temperature – extremesTemperature – average
Climate ParameterComponents & Condition
Climate Consequence
Source: https://pievc.ca/assessments
Year installed Construction Condition notes Estimated life Source estimated life Parameter Climate
2010
Inverted Roof
Membrane Assembly (IRMA )composed of a roof
membrane installed atop acast-in-placeconcrete roof
deck overlainrigid thermal insulation, a filter fabric
and granular ballast. Drainage of the roof systems is
provided by internal roof drains which presumably
discharge to the
municipal sewer system
No major deficiencies. Areas with
missing ballast, missing or damaged
drains, poor detailing in flashing,
20-30
Cost Database - PMR High-
rise
(e.g., BUR, MB and Hot
Rubber)
Temperature
– average
-Increas
leads to
consump
'-HDD>3
from NB
2001-2006*
(scheduled for
2016
replacement)
Conventionally-designed modified bitumen
membrane installed atop rigid thermal insulation
atop corrugated steel roof decking. Drainage of the
roofsystems is provided by internal roof drains which
presumably discharge to the
municipal sewer system
No major deficiencies. Areas with
blistering20
Cost Database -
Conventional, High-rise -
Replace BUR, Mod Bit
Temperature
– average
-Increas
leads to
consump
'-HDD>3
from NB
Infrastructure components Temper
er Climate threshold Reference Parameter Climate threshold Reference Parameter Climate threshold Reference
ture
e
-Increased HDD and CDD
leads to higher energy
consumption
'-HDD>3760 (threshold
from NBC 2015)
SB10 OBC,
NBC 2015
Table C2
Temperature –
extremes
-Extreme
temperatures may
lead to discomfort
indoors
-Tout > 31C
-Tout < -22C
(thresholds from
NBC 2015)
SB10 OBC,
NBC 2015,
ANSI/ASHR
AE 55, NBC
2015 Table
C2
Precipitation
(rain)
-Increase in total
rainfall, no. days with
rainfall, driving rain
wind may lead to
leaks.
-15 min rain>25 mm,
one day rain 1/50
>108 mm, annual rain
>730 mm, driving rain
wind pressure 1/5
>150 Pa
-Increase in rainfall
NBC 2015
Table C2
ture
e
-Increased HDD and CDD
leads to higher energy
consumption
'-HDD>3760 (threshold
from NBC 2015)
SB10 OBC,
NBC 2015
Table C2
Temperature –
extremes
-Extreme
temperatures may
lead to discomfort
indoors
-Tout > 31C
-Tout < -22C
(thresholds from
SB10 OBC,
NBC 2015,
ANSI/ASHR
AE 55, NBC
2015 Table
C2
Precipitation
(rain)
-Increase in total
rainfall, no. days with
rainfall, driving rain
wind may lead to
leaks.
-15 min rain>25 mm,
one day rain 1/50
>108 mm, annual rain
>730 mm, driving rain
NBC 2015
Table C2
Precipitation (rain)Temperature – extremesTemperature – average
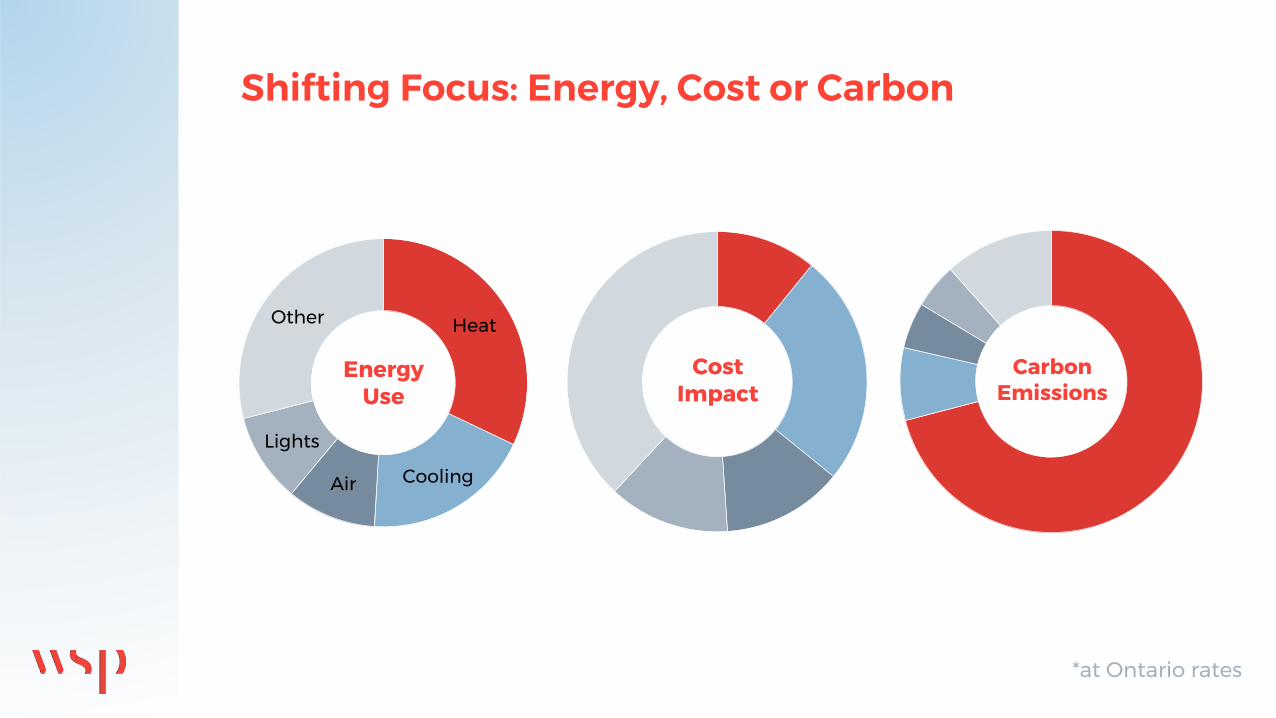
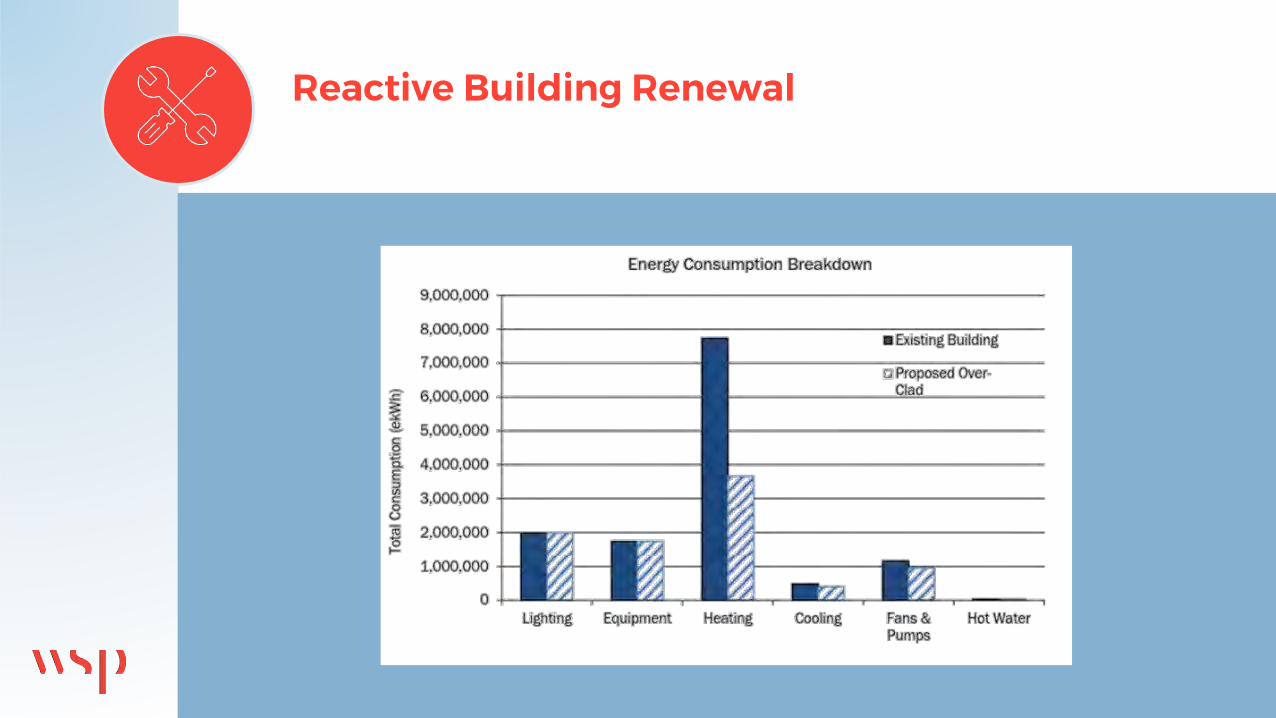
Carbon Emissions
Cost Impact
Heat
CoolingAir
Lights
Other
Energy Use
*at Ontario rates
Shifting Focus: Energy, Cost or Carbon
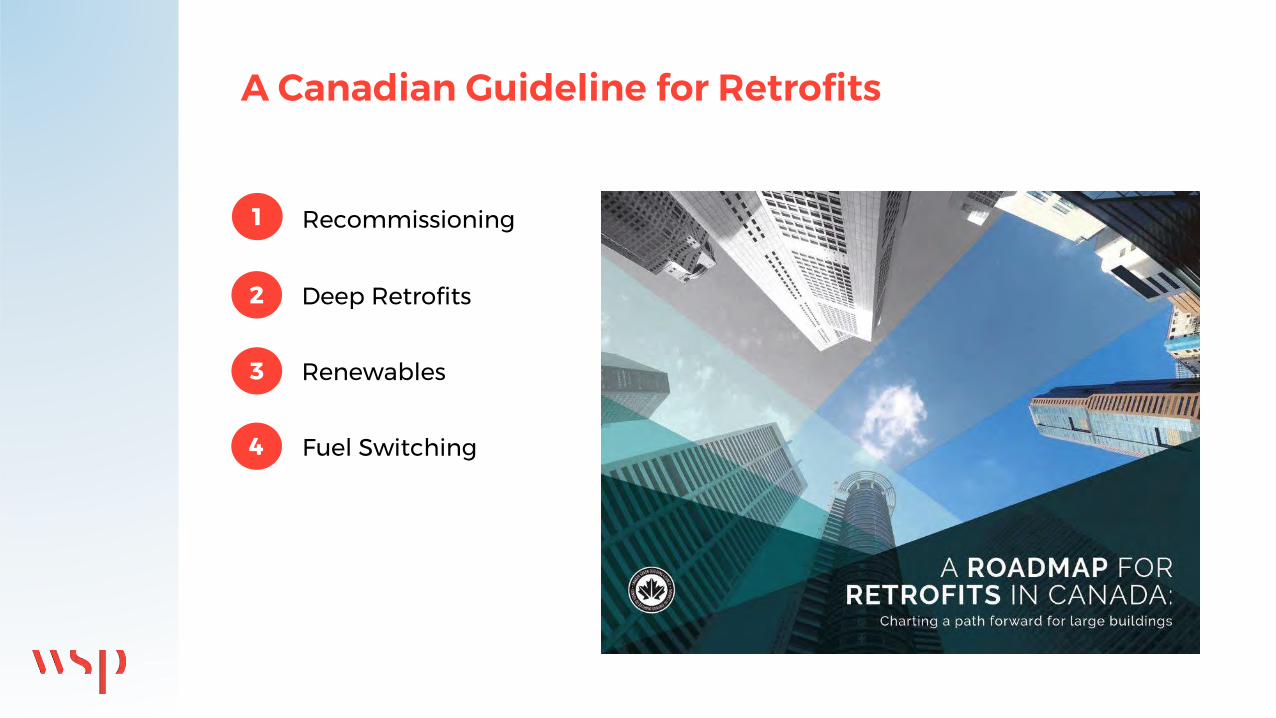
1
4
3
2
Recommissioning
Deep Retrofits
Renewables
Fuel Switching
A Canadian Guideline for Retrofits

Reducing Natural Gas Dependence
1
4
3
2
Recommissioning
Deep Retrofits
Renewables
Fuel Switching
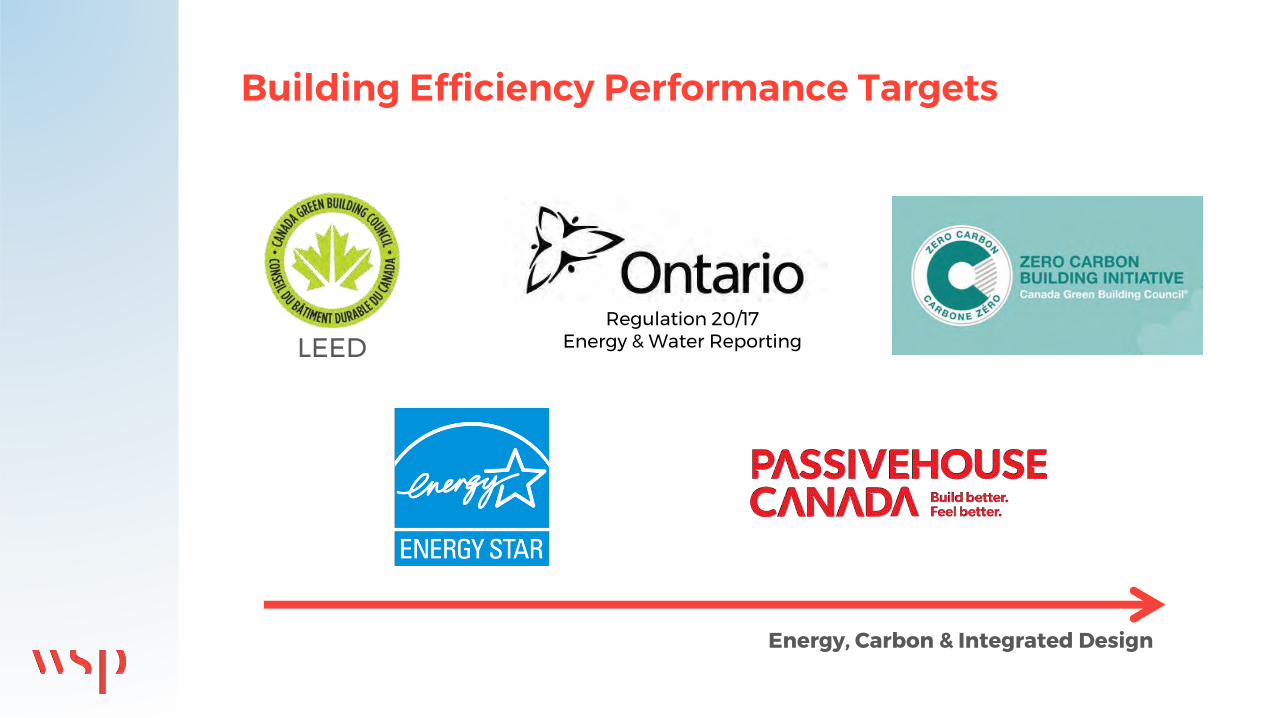
Building Efficiency Performance Targets
LEEDRegulation 20/17
Energy & Water Reporting
Energy, Carbon & Integrated Design
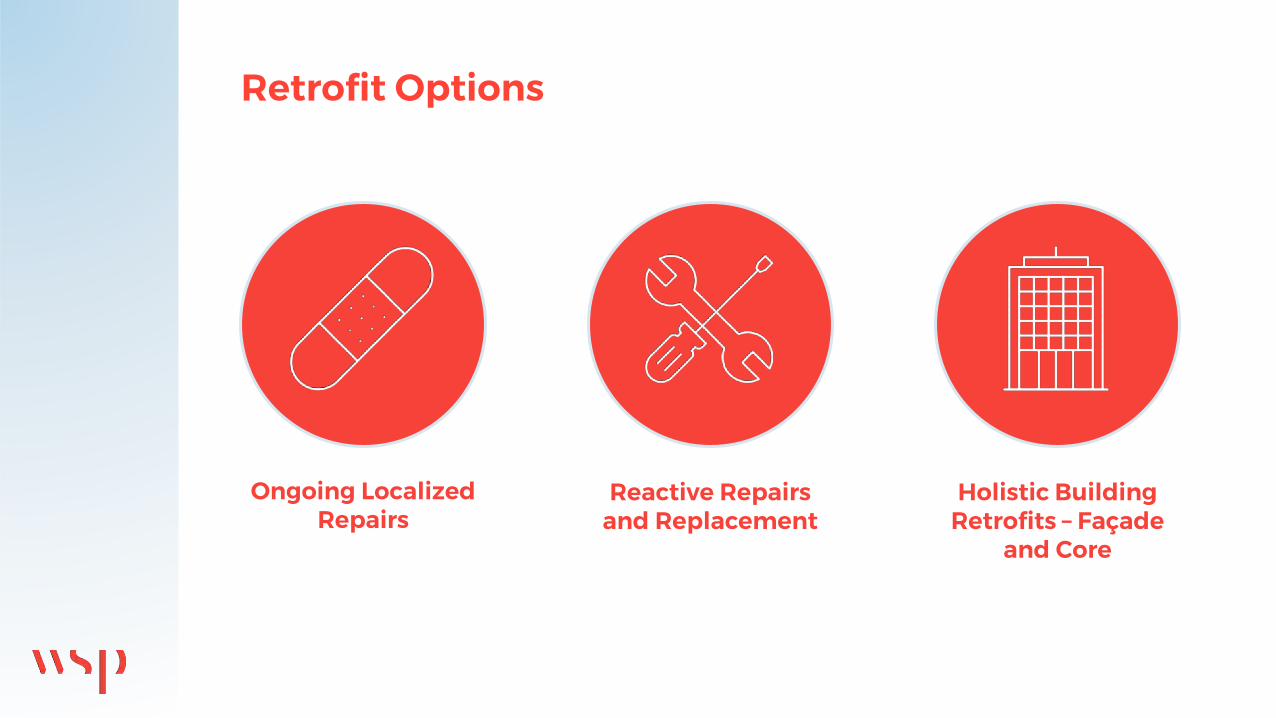
Retrofit Options
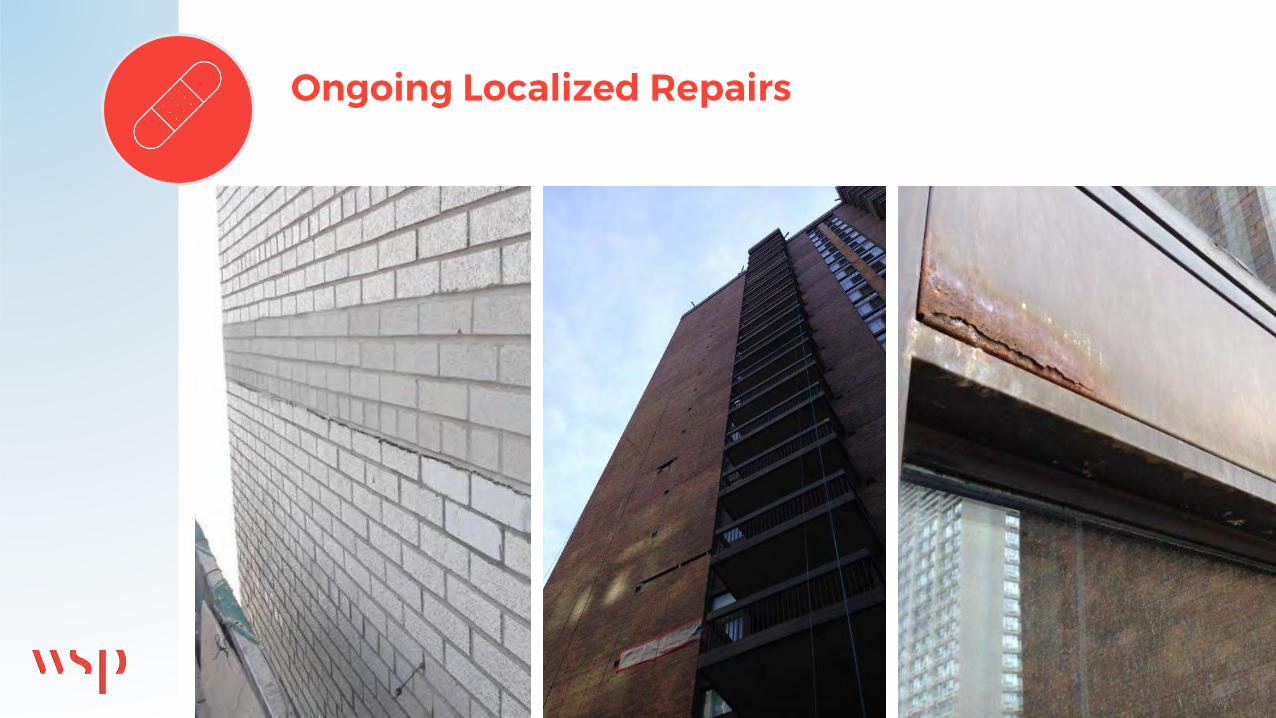
Ongoing Localized Repairs
Reactive Repairs and Replacement
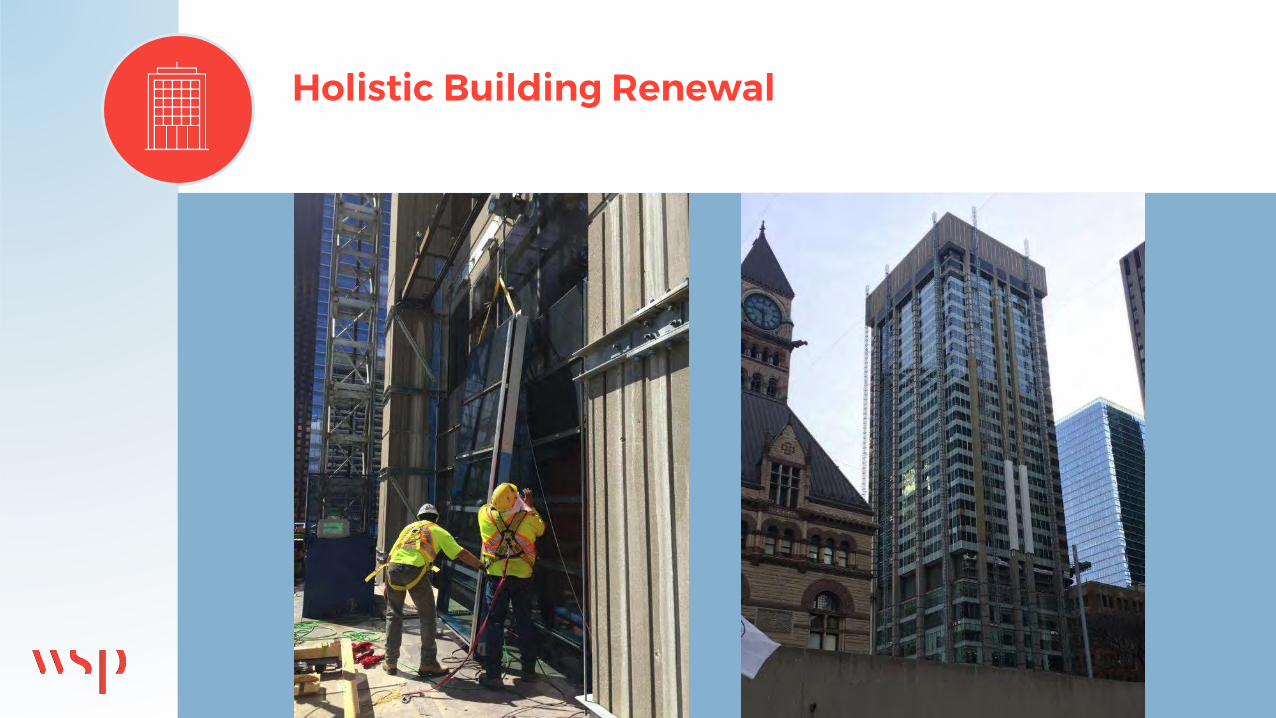
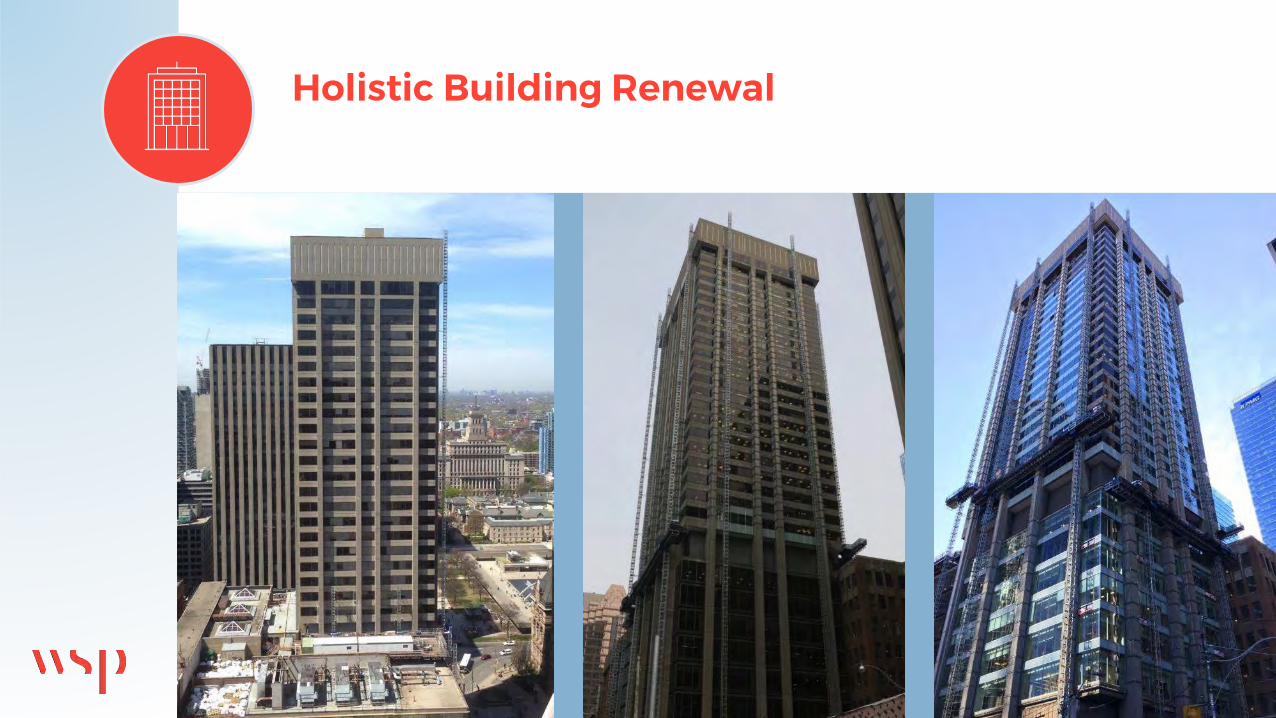
Holistic Building Retrofits – Façade
and Core

Ongoing Localized Repairs
— Piece-meal, as required— Limited capital repair budgets— Long term occupant disruption— Aesthetic Impact
Ongoing Localized Repairs

EXPLORING OPPORTUNISTIC
RETROFITS
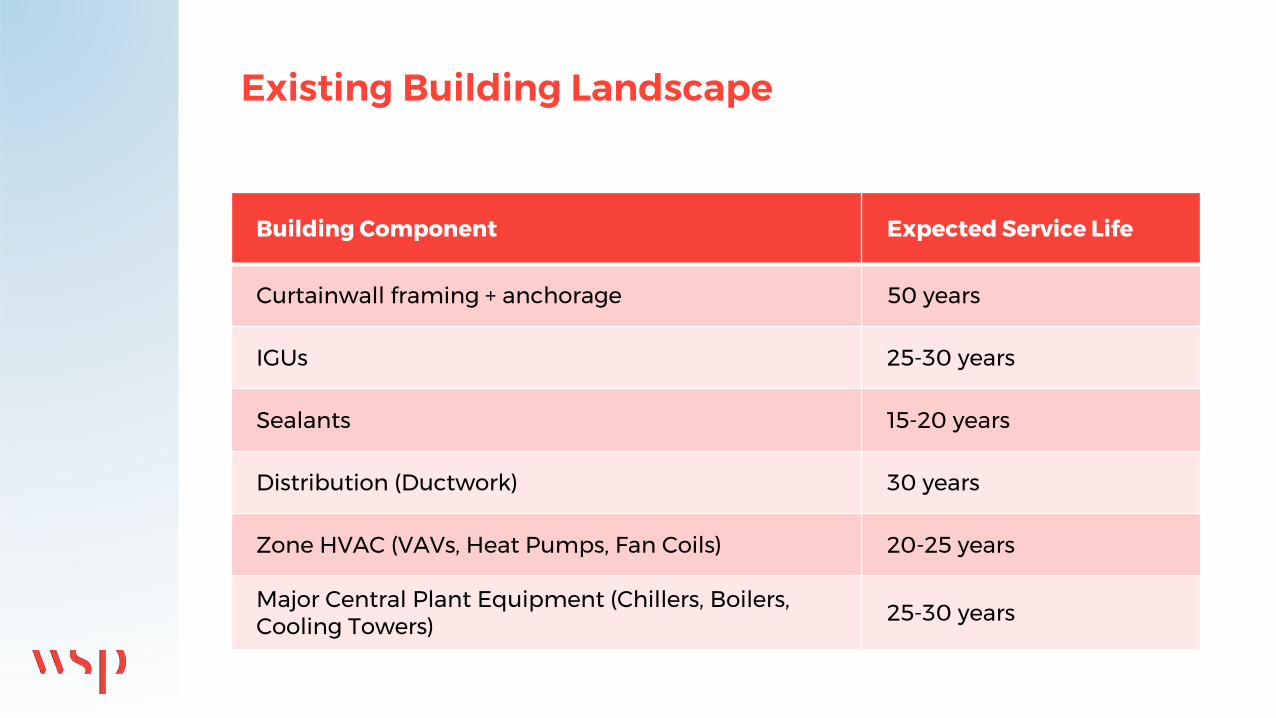
Building Component Expected Service Life
Curtainwall framing + anchorage 50 years
IGUs 25-30 years
Sealants 15-20 years
Distribution (Ductwork) 30 years
Zone HVAC (VAVs, Heat Pumps, Fan Coils) 20-25 years
Major Central Plant Equipment (Chillers, Boilers, Cooling Towers) 25-30 years
Existing Building Landscape
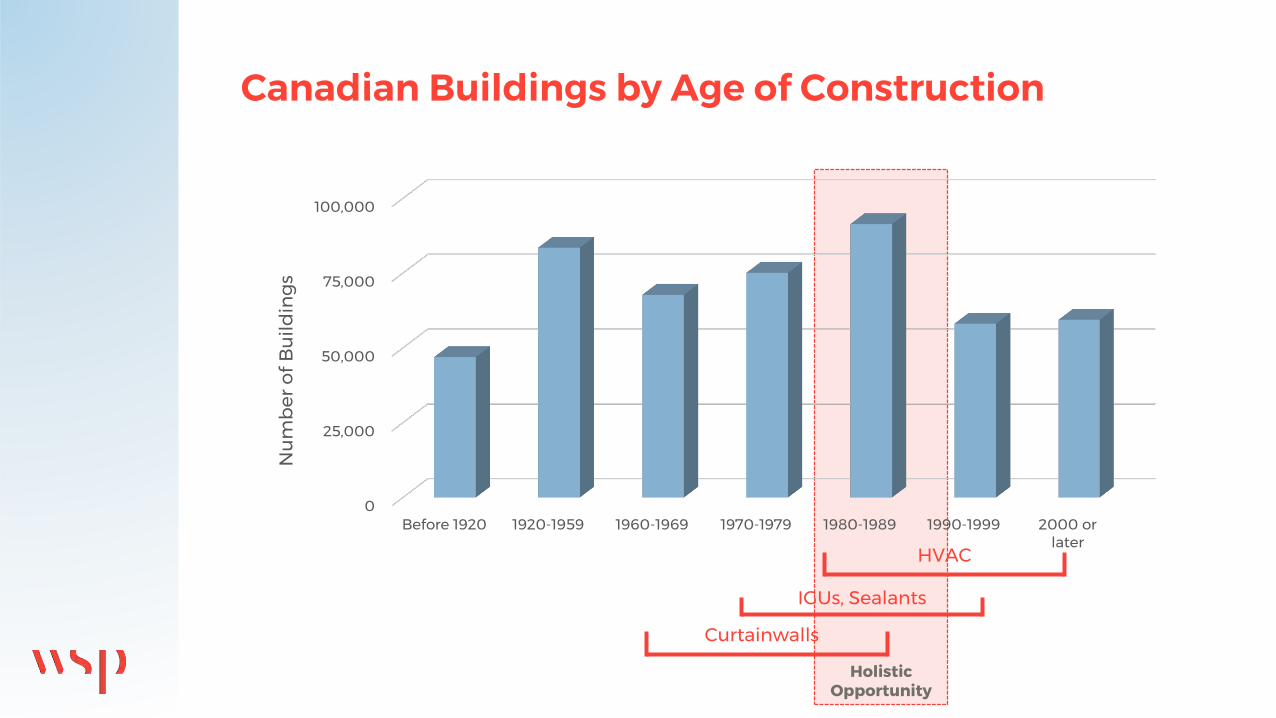
Holistic Opportunity
0
25,000
50,000
75,000
100,000
Before 1920 1920-1959 1960-1969 1970-1979 1980-1989 1990-1999 2000 orlater
Nu
mb
er o
f Bu
ildin
gs
HVAC
IGUs, Sealants
Curtainwalls
Canadian Buildings by Age of Construction
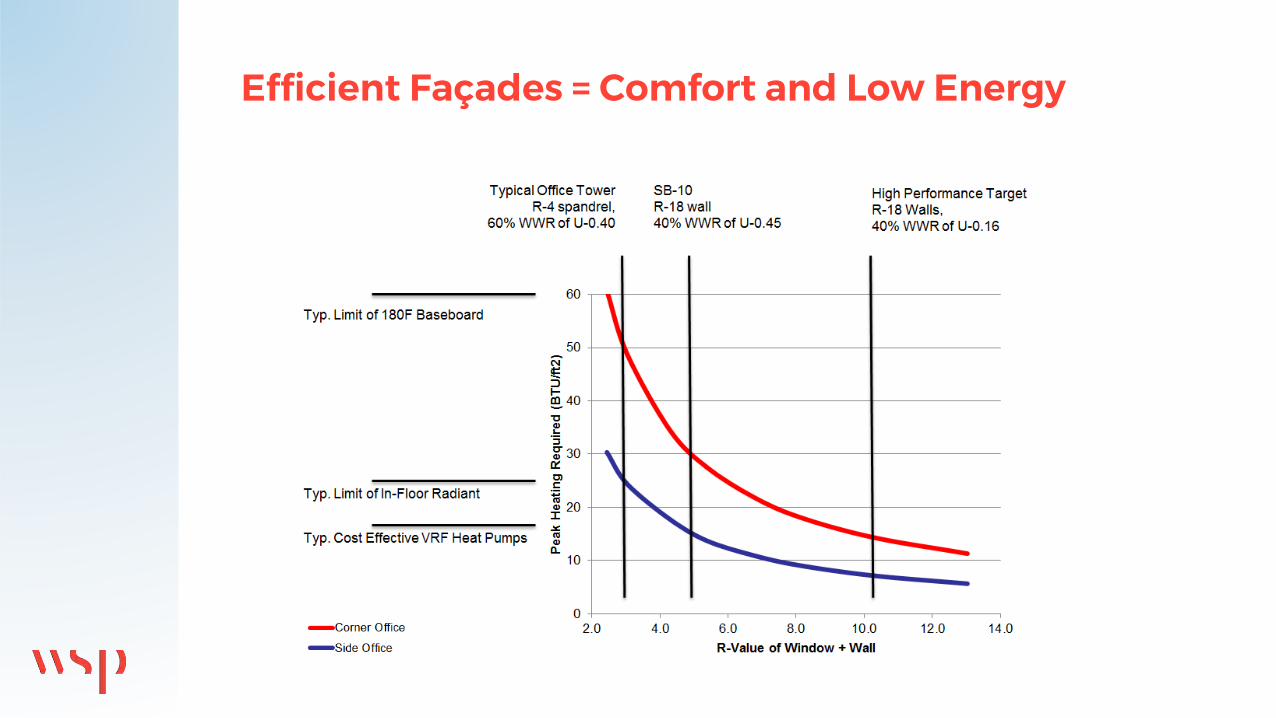
Efficient Façades = Comfort and Low Energy

Efficient Façades = Comfort and Low Energy
EMBODIED CARBONvs
OPERATIONAL CARBON
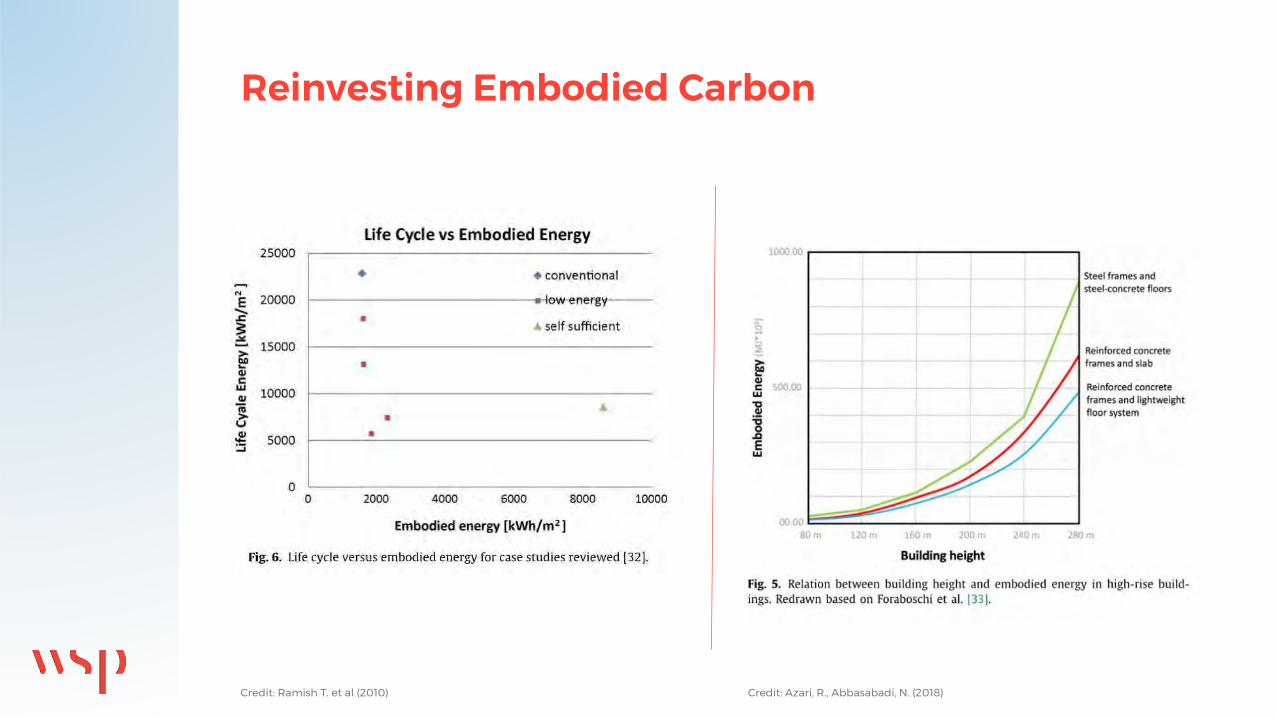
Reinvesting Embodied Carbon
Credit: Ramish T. et al (2010) Credit: Azari, R., Abbasabadi, N. (2018)

Reinvesting Embodied Carbon
Credit: Ibn-Mohammed, T. et al (2013)
Credit: Azari, R., Abbasabadi, N. (2018)
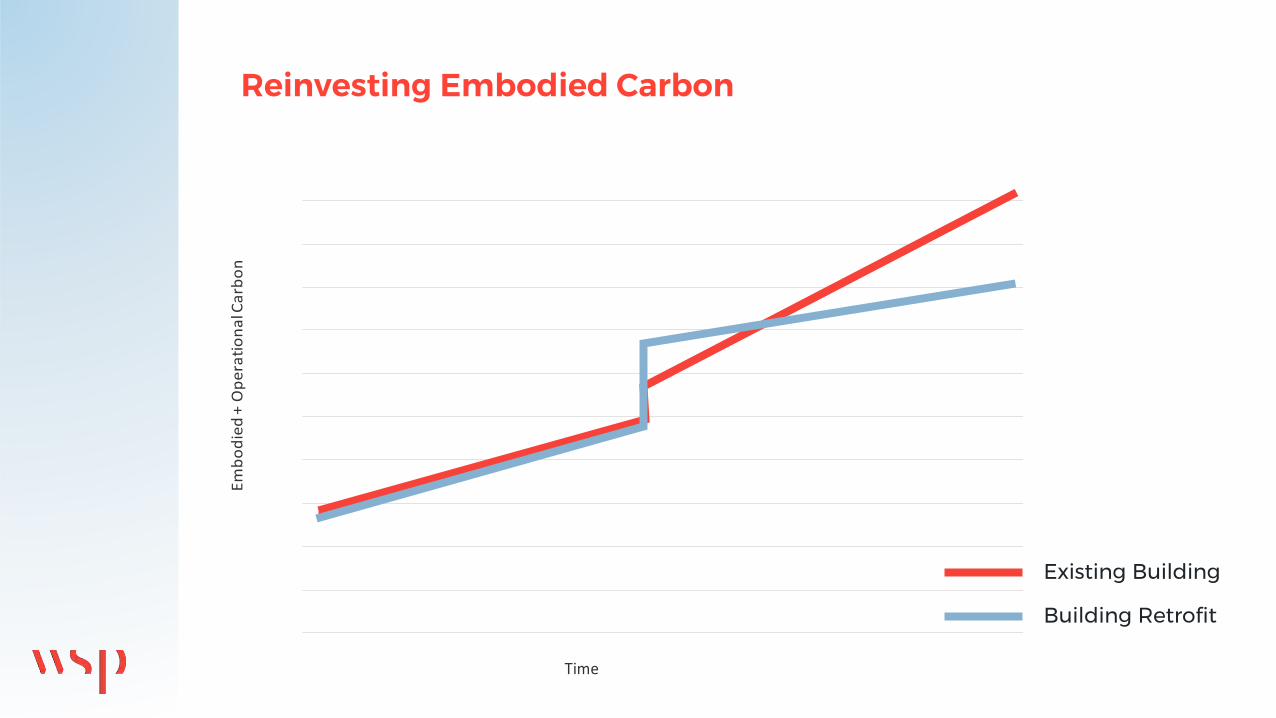
Reinvesting Embodied Carbon
Em
bo
die
d +
Op
era
tio
na
l Ca
rbo
n
Time
Existing Building
Building Retrofit
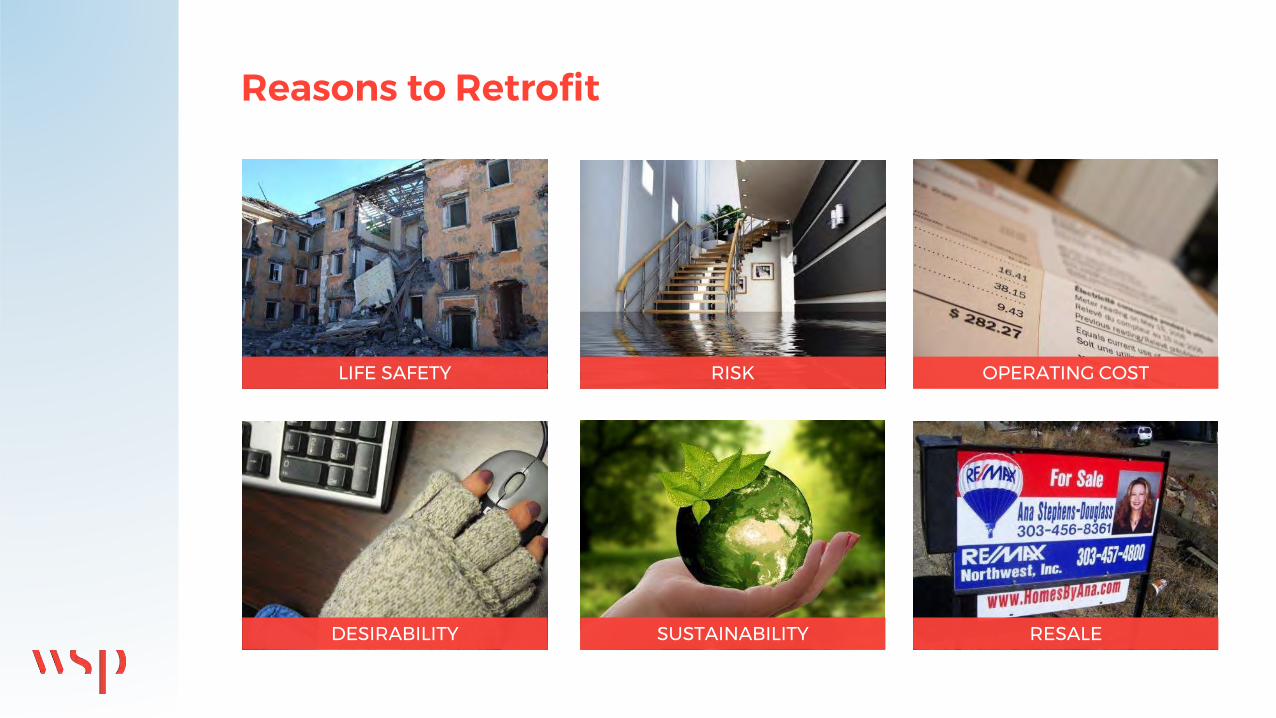
Reasons to Retrofit
RESALESUSTAINABILITY
LIFE SAFETY RISK OPERATING COST
DESIRABILITY

RETROFIT OPTIONS & CASE STUDIES
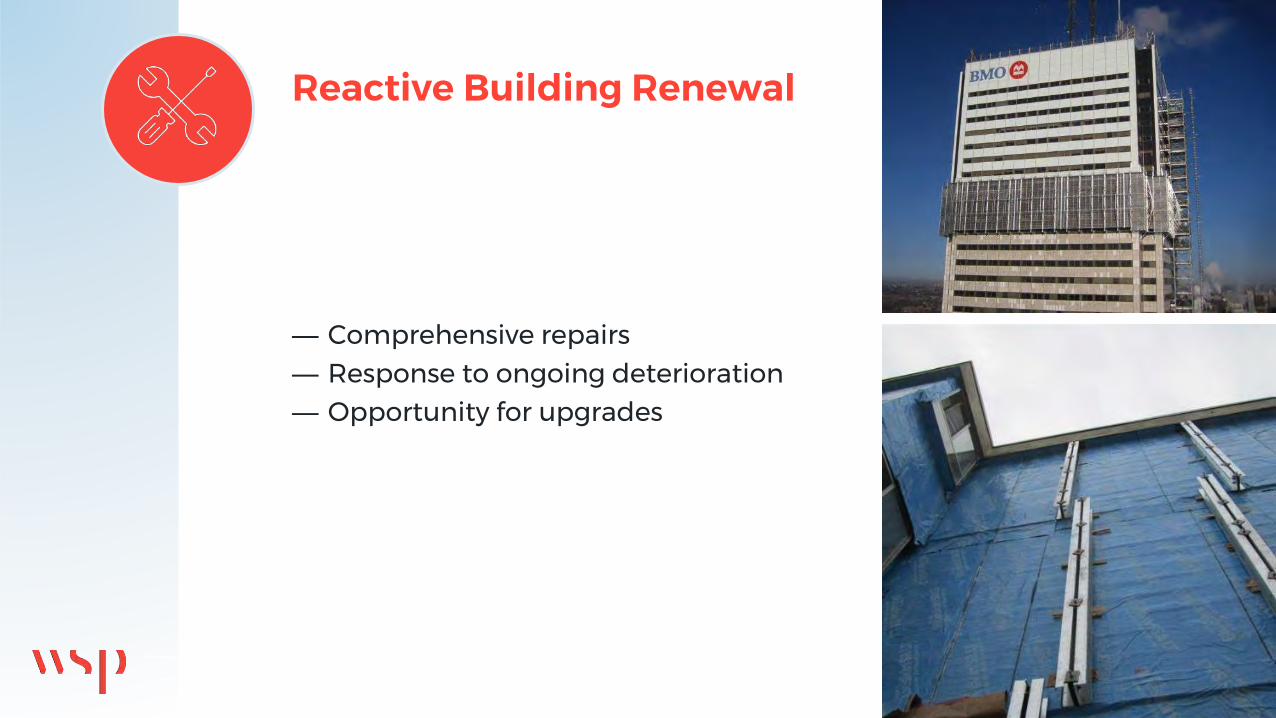
Reactive Building Renewal
— Comprehensive repairs— Response to ongoing deterioration— Opportunity for upgrades
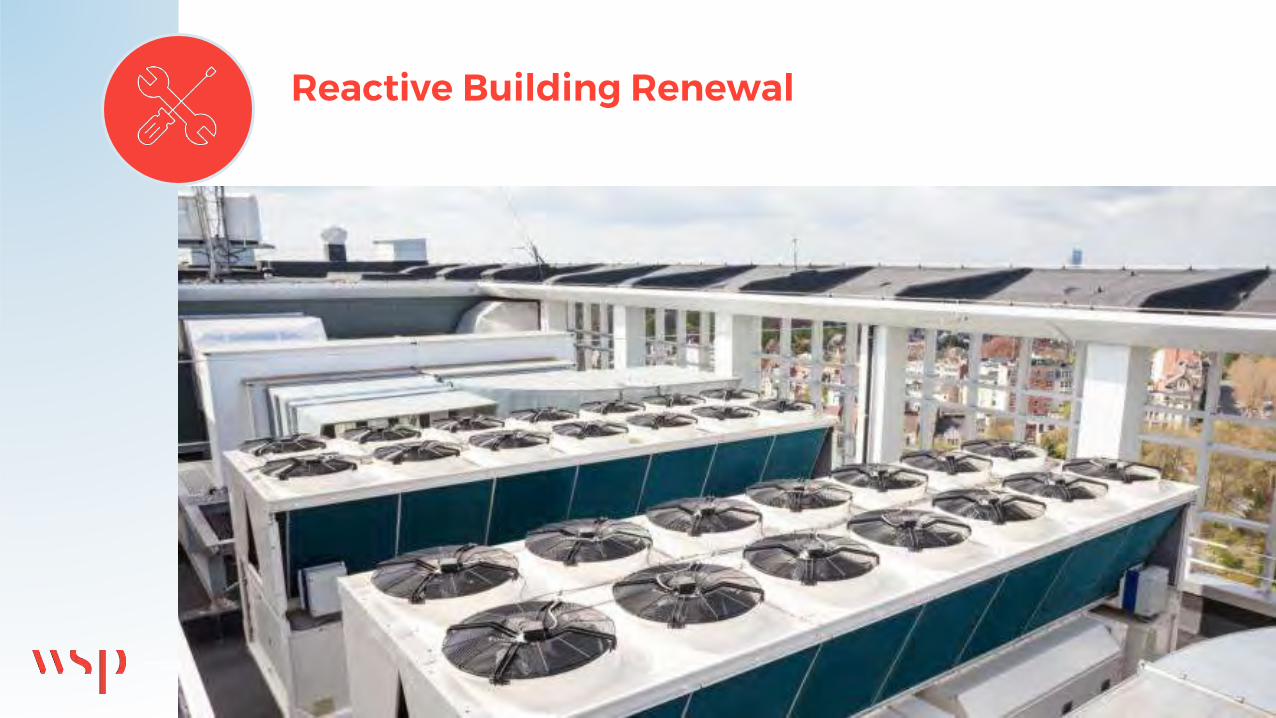
Reactive Building Renewal
Reactive Building Renewal
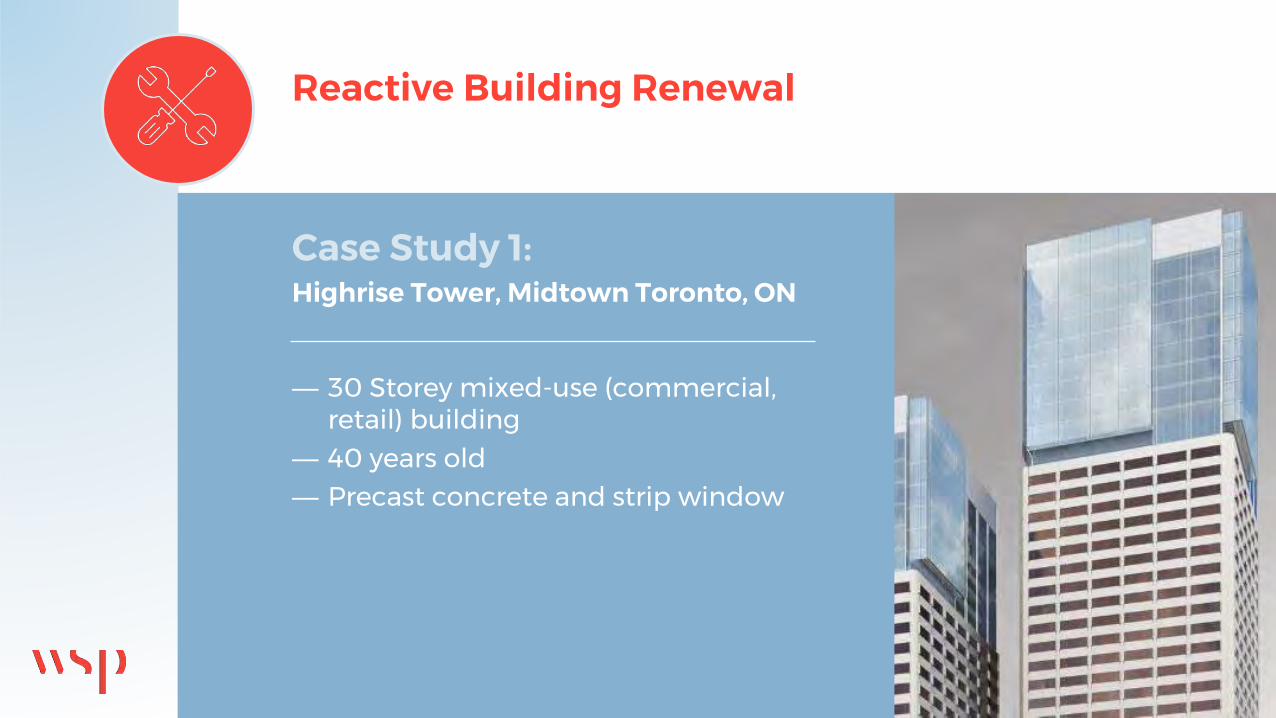
Case Study 1:Highrise Tower, Midtown Toronto, ON
— 30 Storey mixed-use (commercial, retail) building
— 40 years old— Precast concrete and strip window
Reactive Building Renewal
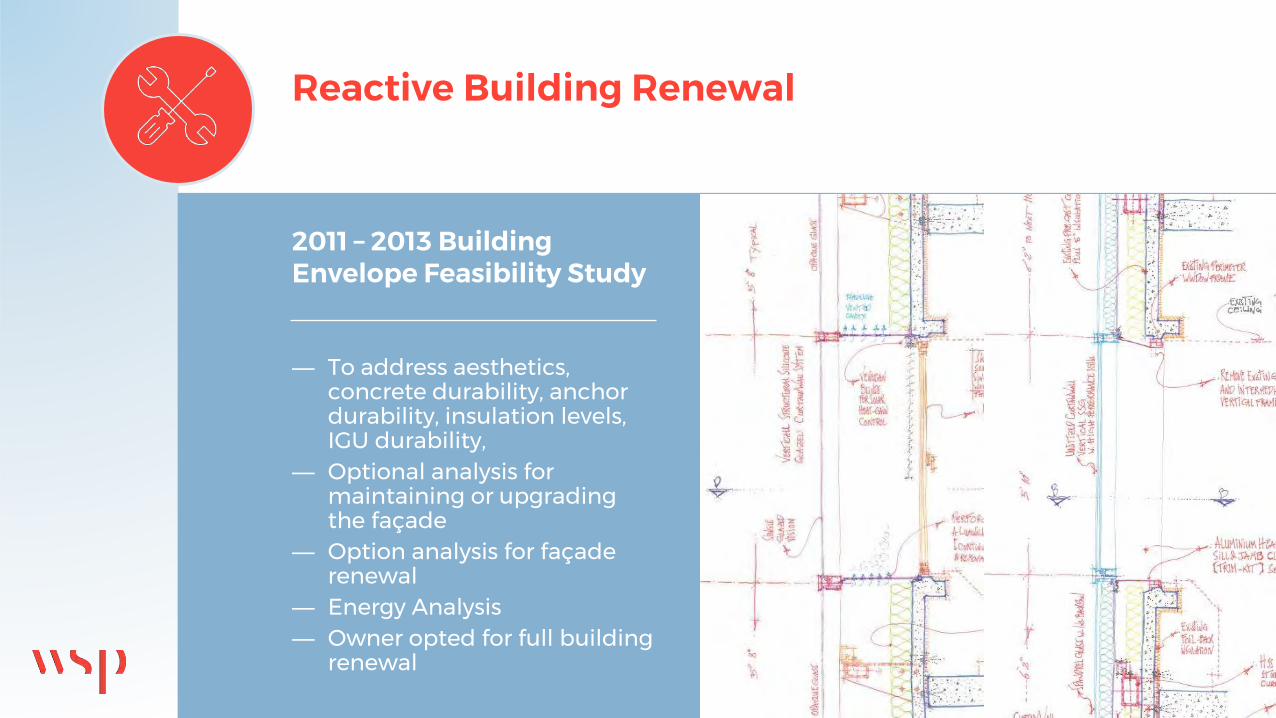
2011 – 2013 Building Envelope Feasibility Study
— To address aesthetics, concrete durability, anchor durability, insulation levels, IGU durability,
— Optional analysis for maintaining or upgrading the façade
— Option analysis for façade renewal
— Energy Analysis— Owner opted for full building
renewal
Reactive Building Renewal
Reactive Building Renewal
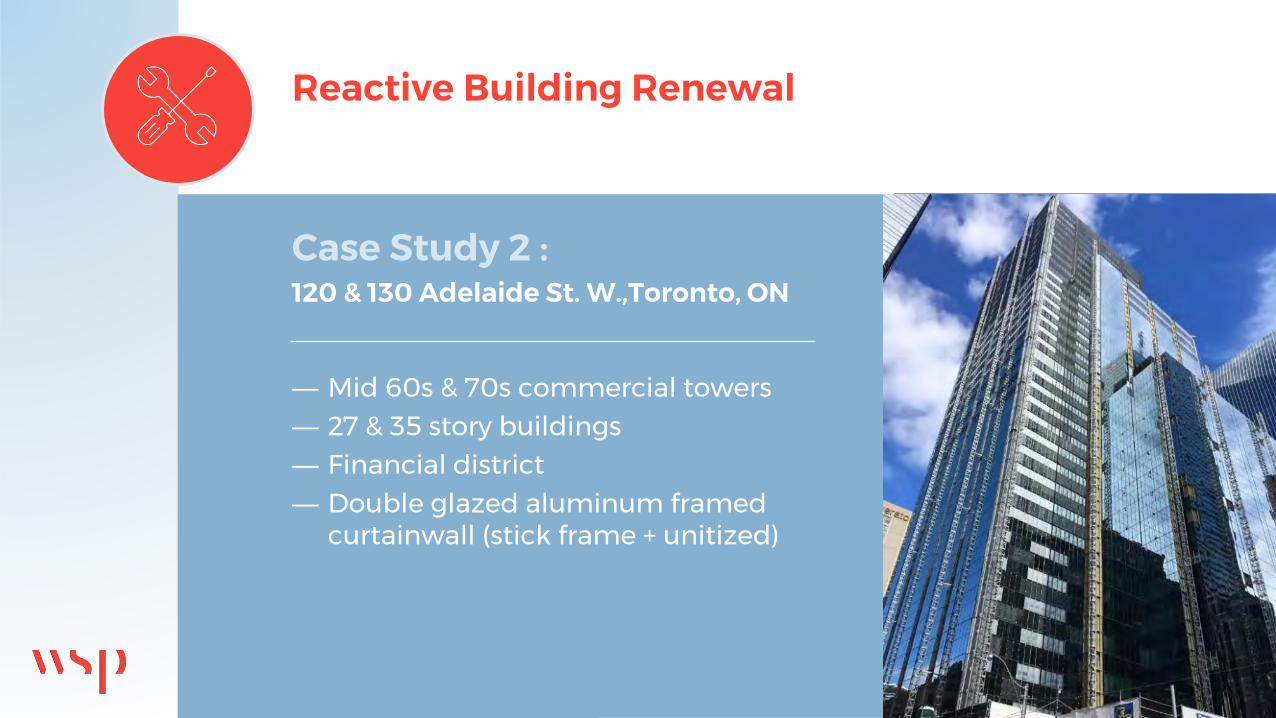
Case Study 2 :120 & 130 Adelaide St. W.,Toronto, ON
— Mid 60s & 70s commercial towers— 27 & 35 story buildings— Financial district— Double glazed aluminum framed
curtainwall (stick frame + unitized)
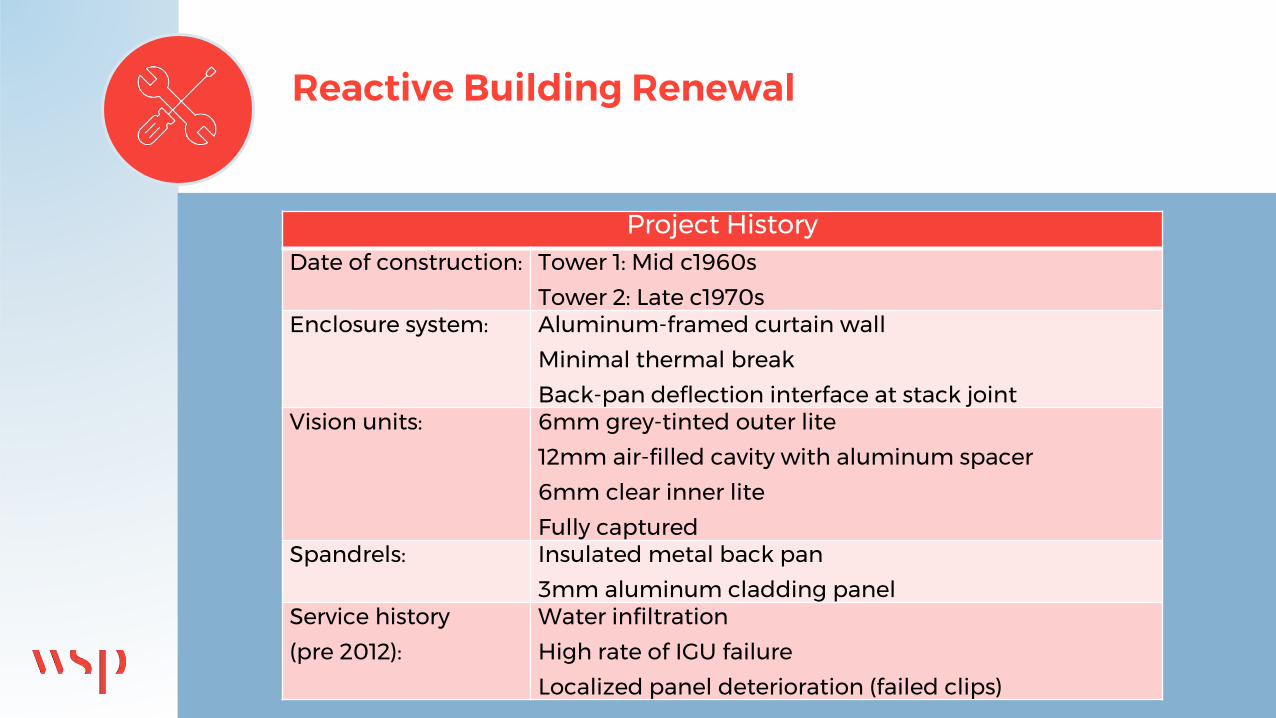
Reactive Building Renewal
Project HistoryDate of construction: Tower 1: Mid c1960s
Tower 2: Late c1970sEnclosure system: Aluminum-framed curtain wall
Minimal thermal break
Back-pan deflection interface at stack jointVision units: 6mm grey-tinted outer lite
12mm air-filled cavity with aluminum spacer
6mm clear inner lite
Fully capturedSpandrels: Insulated metal back pan
3mm aluminum cladding panelService history
(pre 2012):
Water infiltration
High rate of IGU failure
Localized panel deterioration (failed clips)
Reactive Building Renewal
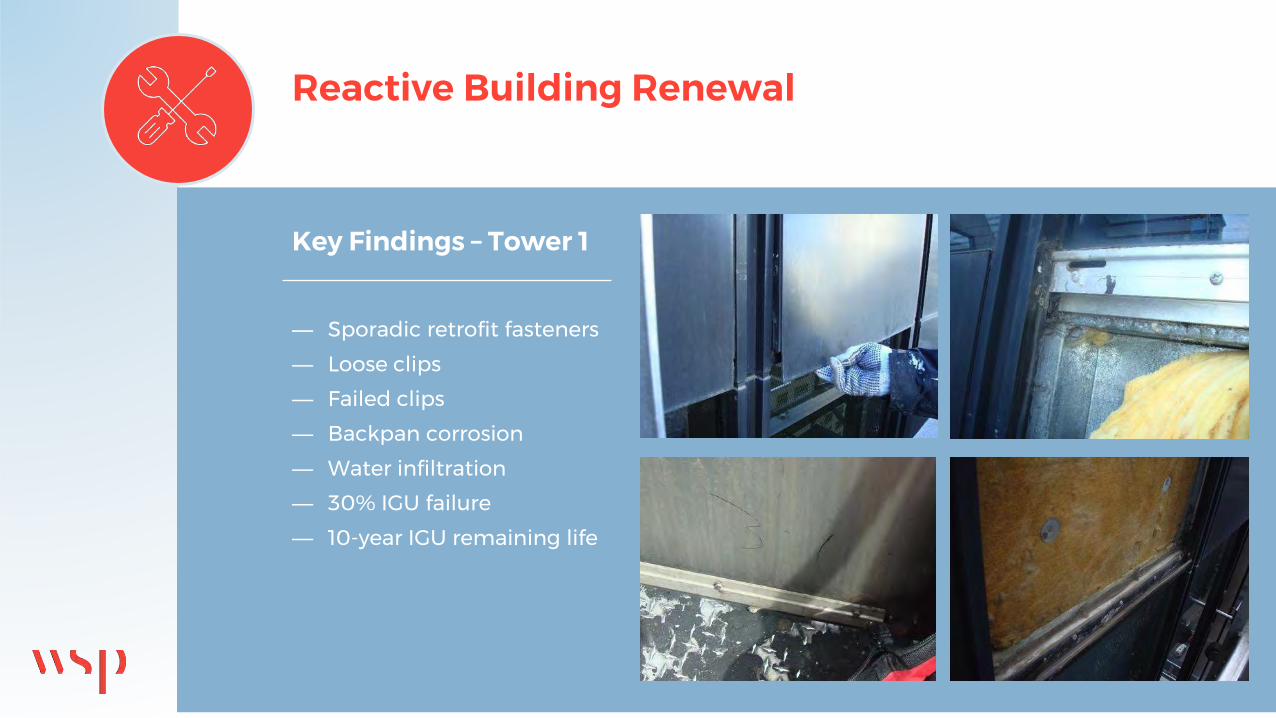
Key Findings – Tower 1
— Sporadic retrofit fasteners
— Loose clips
— Failed clips
— Backpan corrosion
— Water infiltration
— 30% IGU failure
— 10-year IGU remaining life
Reactive Building Renewal
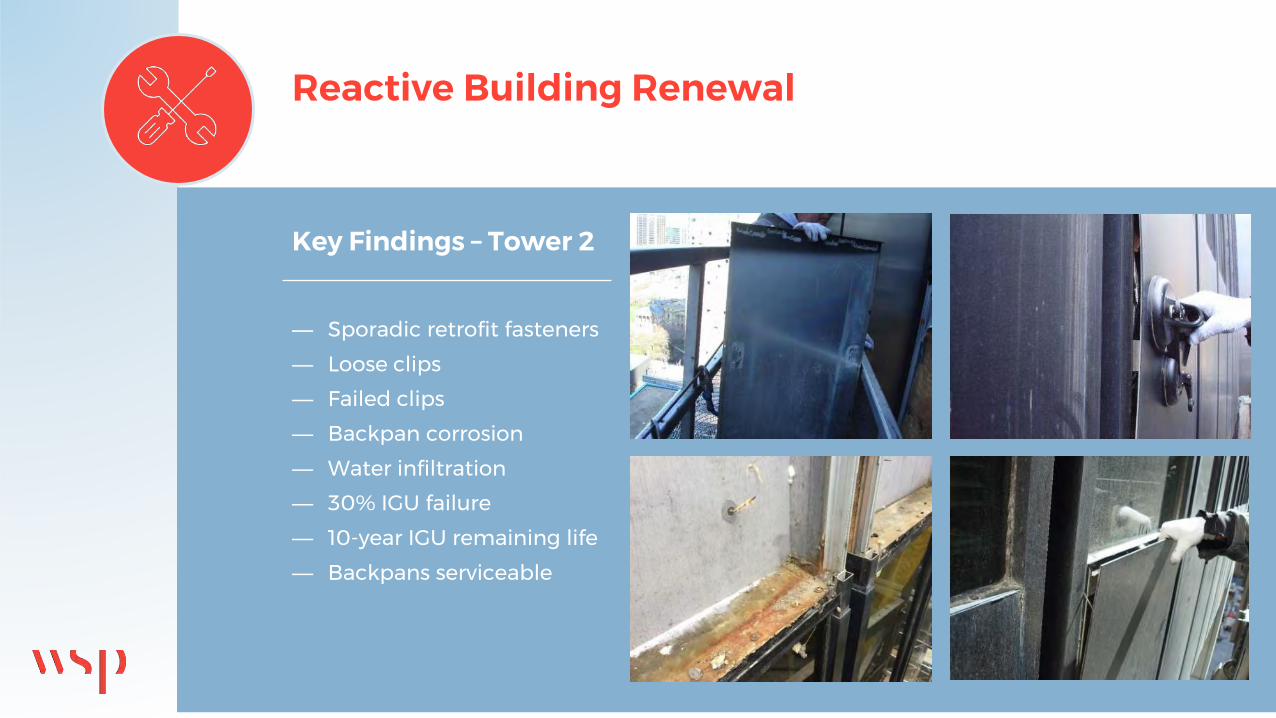
Key Findings – Tower 2
— Sporadic retrofit fasteners
— Loose clips
— Failed clips
— Backpan corrosion
— Water infiltration
— 30% IGU failure
— 10-year IGU remaining life
— Backpans serviceable
Reactive Building Renewal
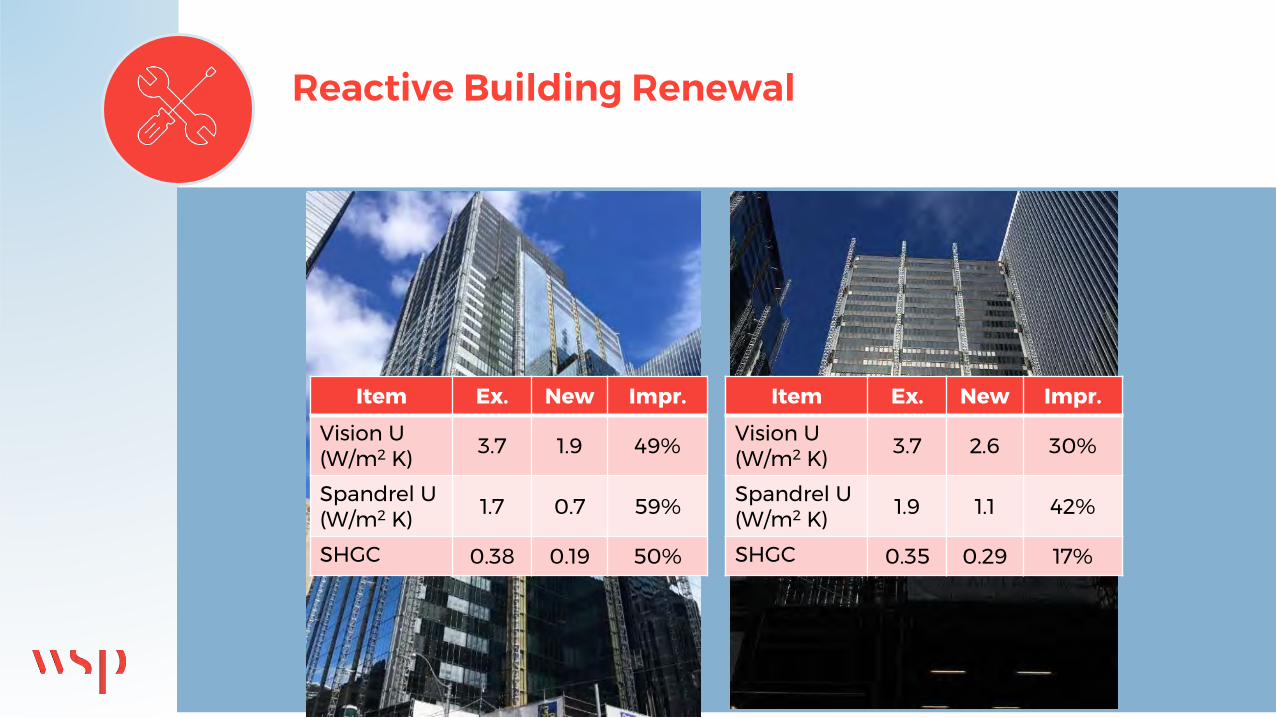
Item Ex. New Impr.
Vision U (W/m2 K) 3.7 2.6 30%
Spandrel U (W/m2 K) 1.9 1.1 42%
SHGC 0.35 0.29 17%
Item Ex. New Impr.
Vision U (W/m2 K) 3.7 1.9 49%
Spandrel U (W/m2 K) 1.7 0.7 59%
SHGC 0.38 0.19 50%

Reactive Building Renewal

Holistic Building Renewal –Façade + Core
— Maximizes building performance— Increased rentable space— Increased occupant comfort— Increased re-sale value
Holistic Building Renewal
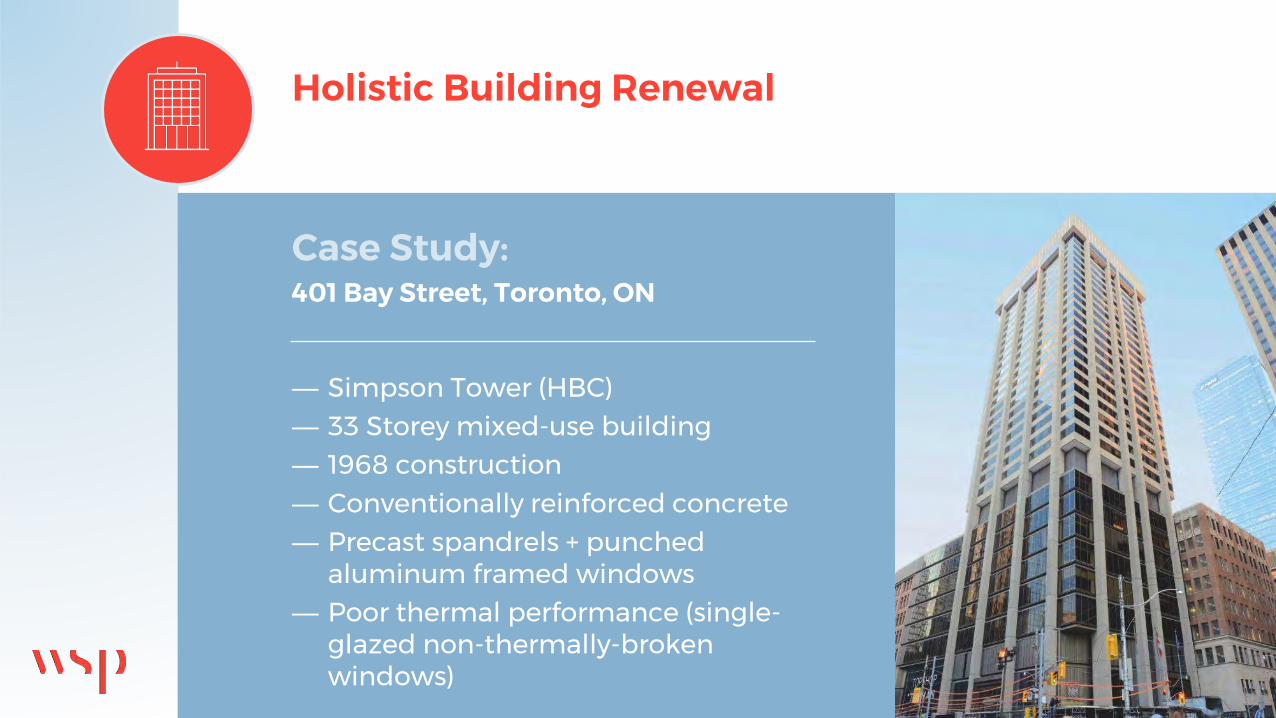
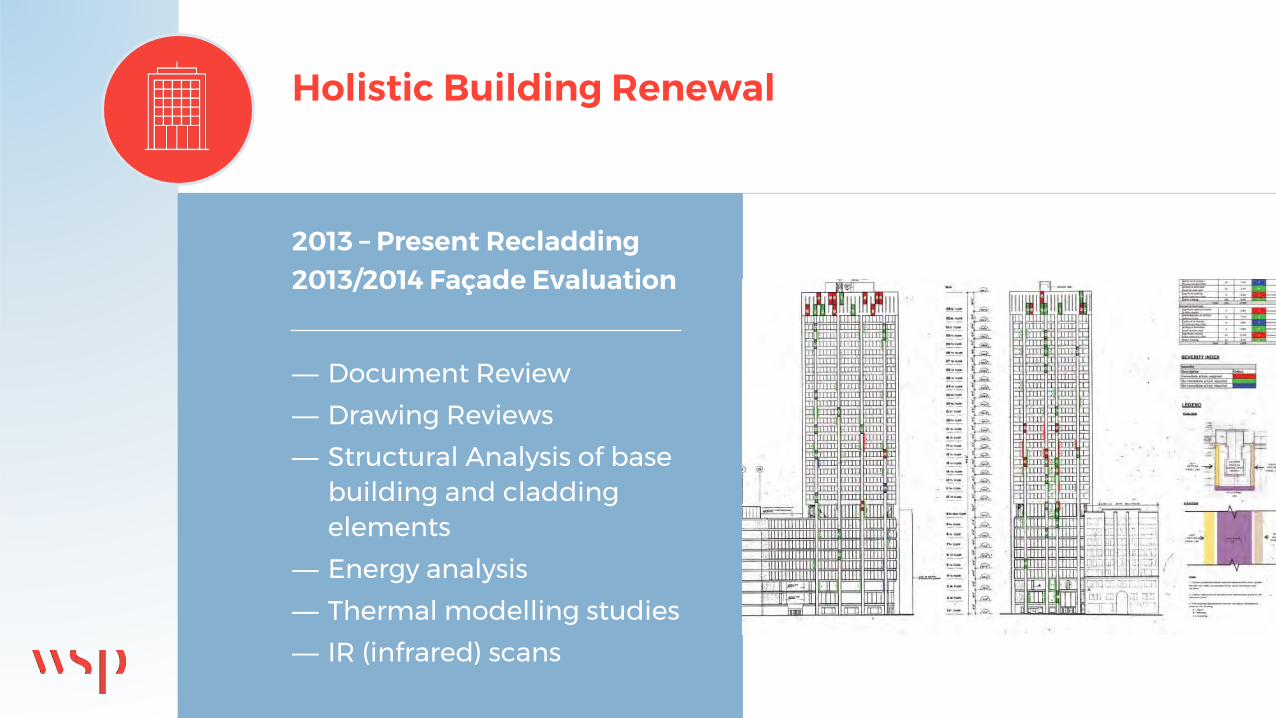
Case Study:401 Bay Street, Toronto, ON
— Simpson Tower (HBC)— 33 Storey mixed-use building— 1968 construction— Conventionally reinforced concrete— Precast spandrels + punched
aluminum framed windows— Poor thermal performance (single-
glazed non-thermally-broken windows)
Holistic Building Renewal
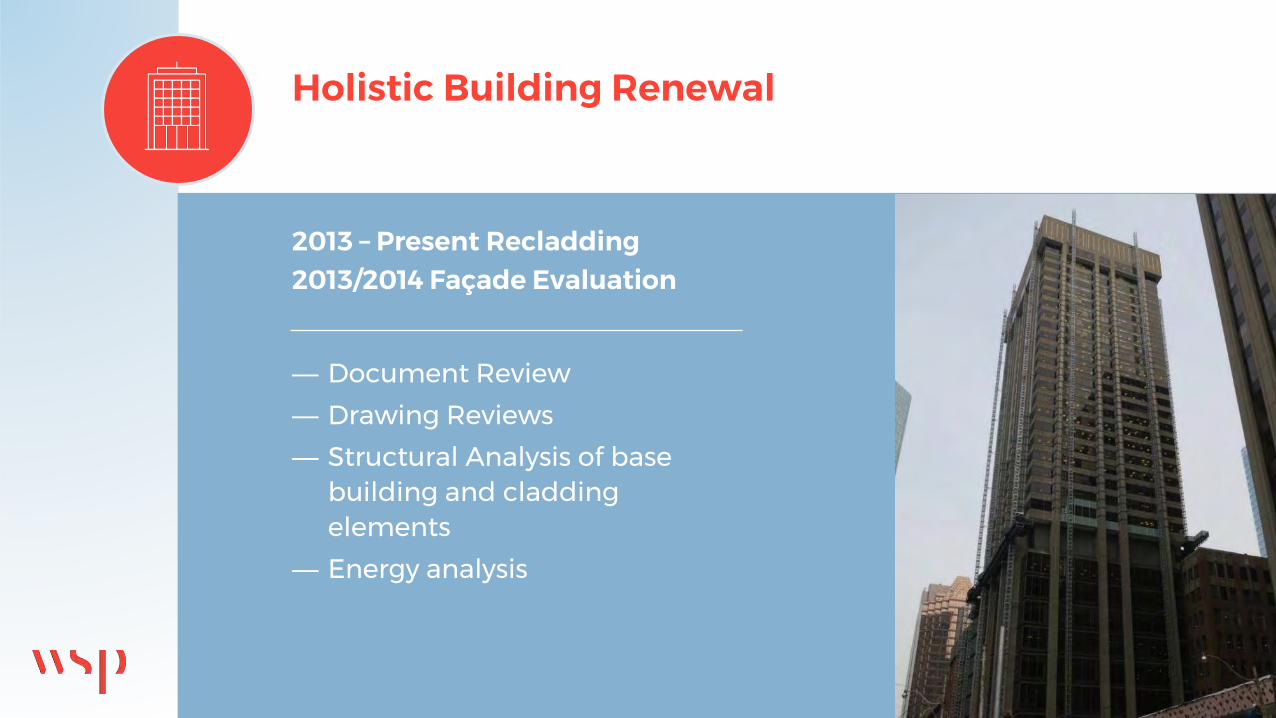
2013 – Present Recladding2013/2014 Façade Evaluation
— Document Review
— Drawing Reviews
— Structural Analysis of base building and cladding elements
— Energy analysis
Holistic Building Renewal
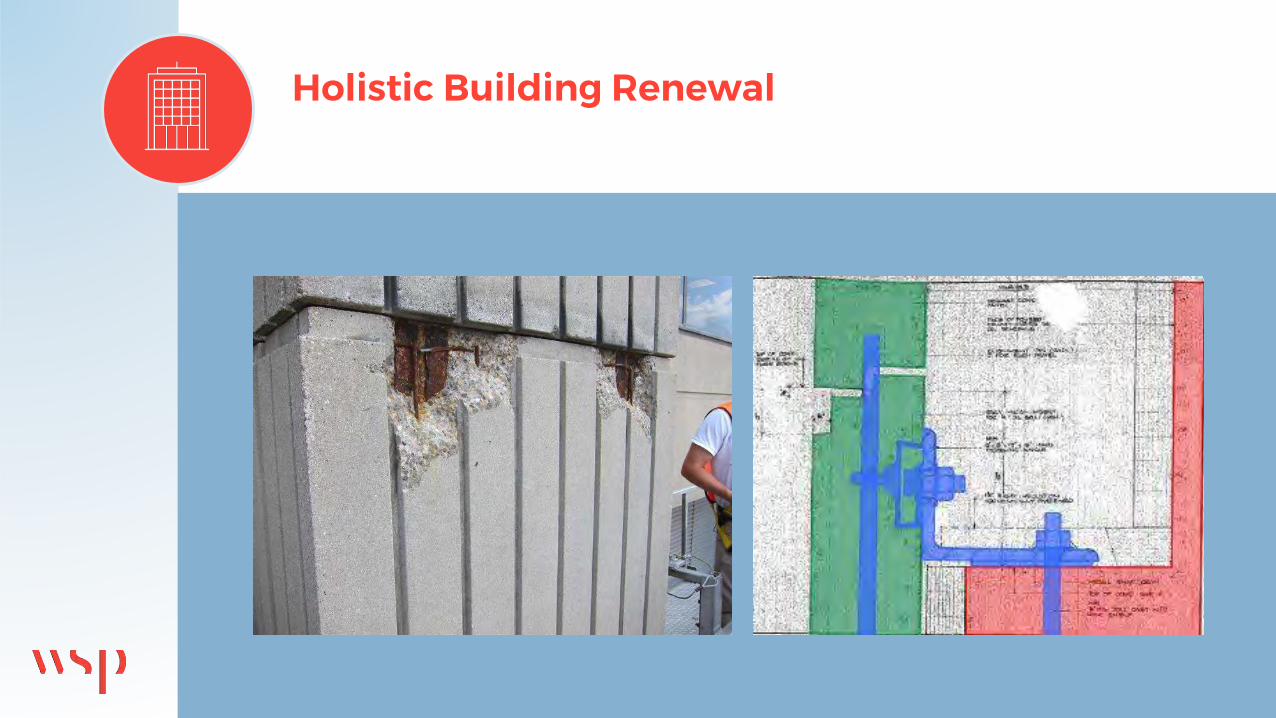
2013 – Present Recladding2013/2014 Façade Evaluation
— Document Review
— Drawing Reviews
— Structural Analysis of base building and cladding elements
— Energy analysis
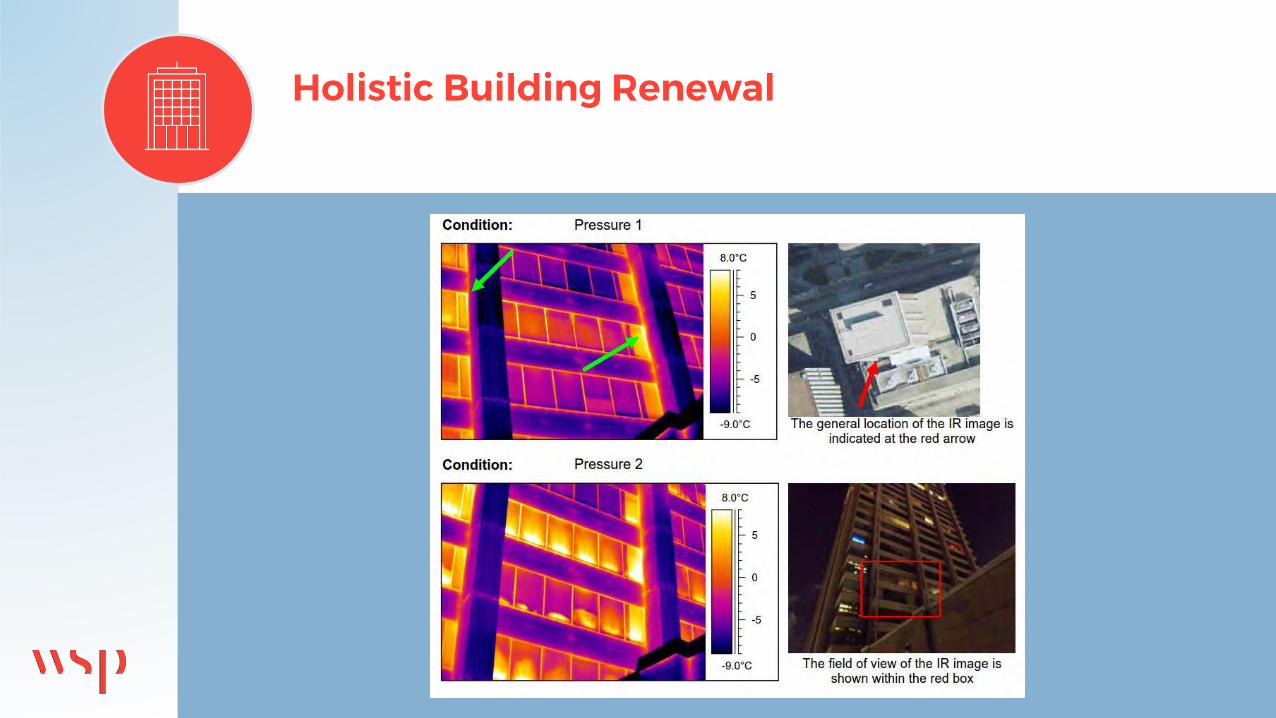
— Thermal modelling studies
— IR (infrared) scans
Holistic Building Renewal
Holistic Building Renewal
Holistic Building Renewal
Holistic Building Renewal
Holistic Building Renewal
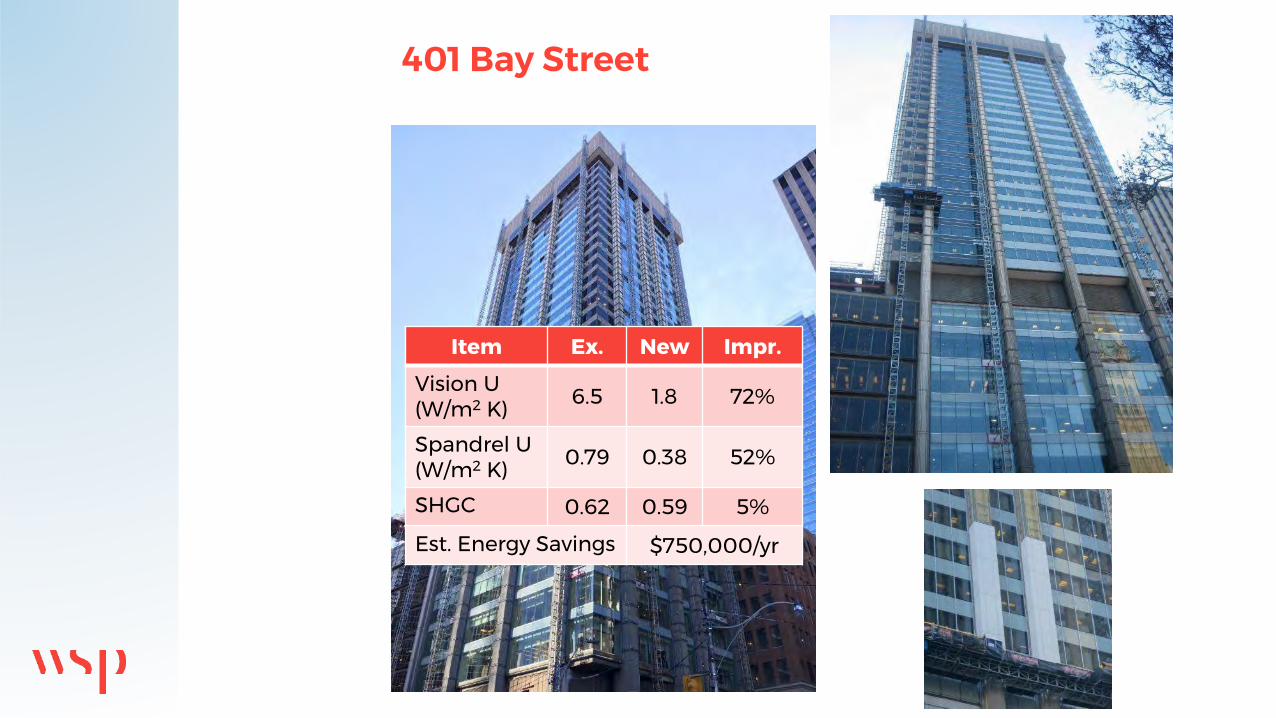
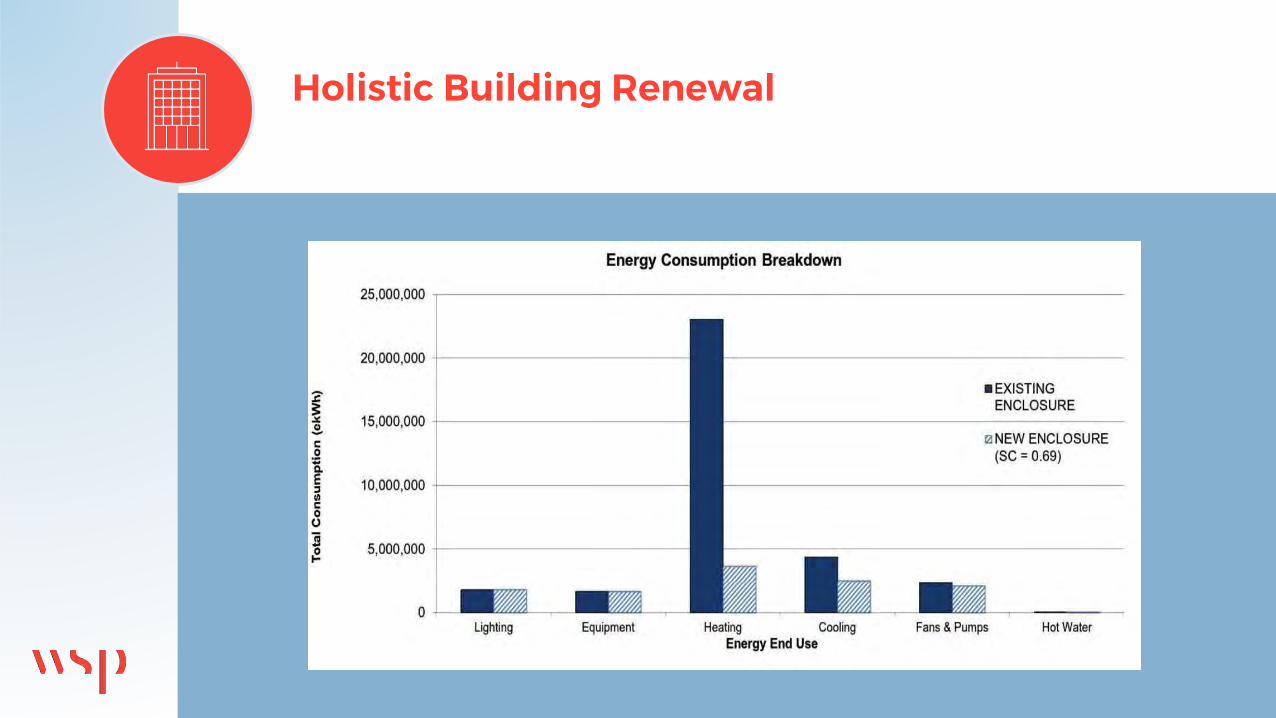
Item Ex. New Impr.
Vision U (W/m2 K) 6.5 1.8 72%
Spandrel U (W/m2 K) 0.79 0.38 52%
SHGC 0.62 0.59 5%
Est. Energy Savings $750,000/yr
401 Bay Street

Holistic Building Renewal
Case Study:2 Bloor East , Toronto, ON
— Building Envelope Renewal — Energy Re-Commissioning— Cost to implement = $900,000— Result:
17%reduction in electricity use
$1.2Mannual utility cost savings
Holistic Building Renewal
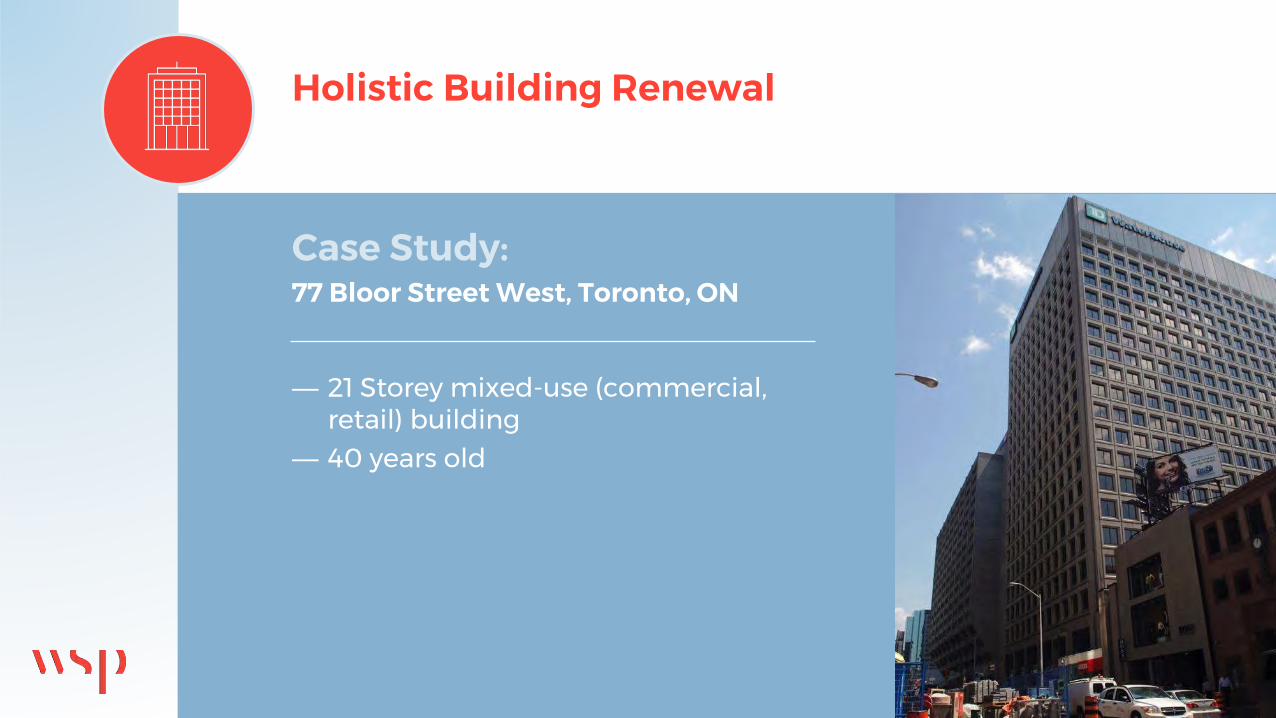
Case Study:77 Bloor Street West, Toronto, ON
— 21 Storey mixed-use (commercial, retail) building
— 40 years old

Holistic Building Renewal
Case Study:77 Bloor Street West, Toronto, ON
— Building Envelope Renewal — Energy Re-Commissioning— Result:
30% +energy & GHG reduction
$500kannual utility cost savings
30% +water savings

PLANNING FOR A HOLISTIC RETROFIT
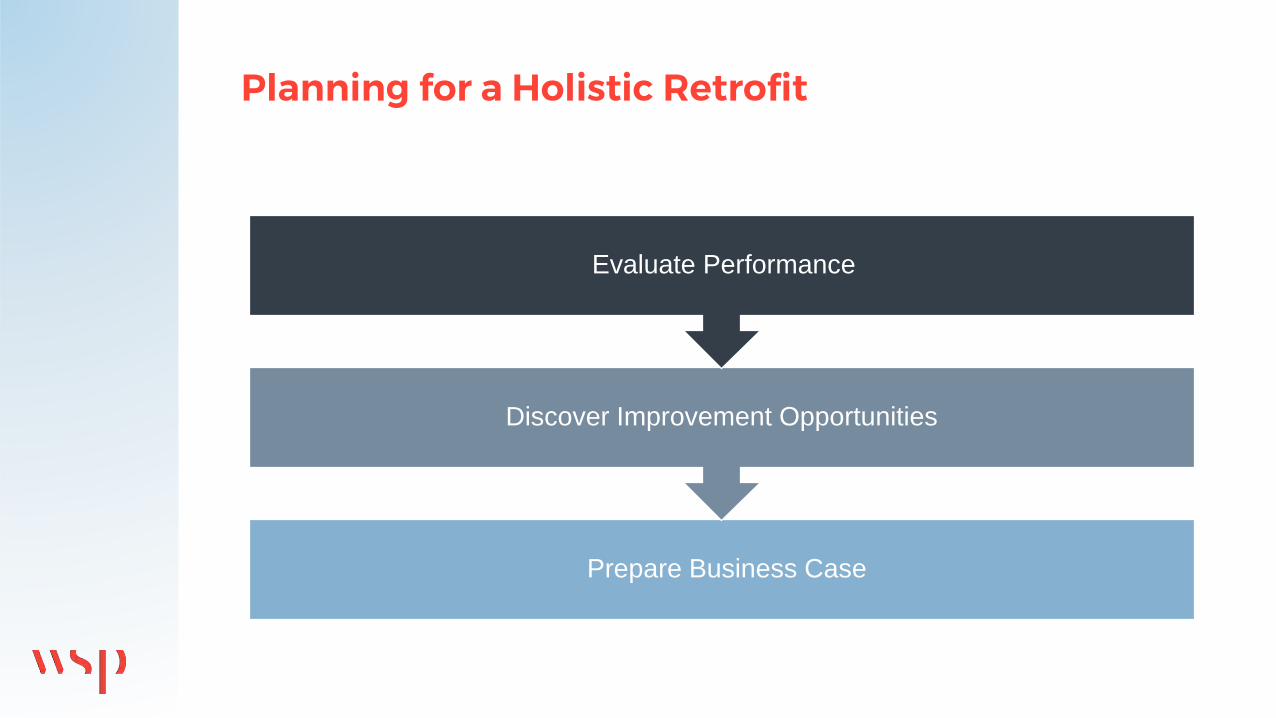
Planning for a Holistic Retrofit
Prepare Business Case
Discover Improvement Opportunities
Evaluate Performance
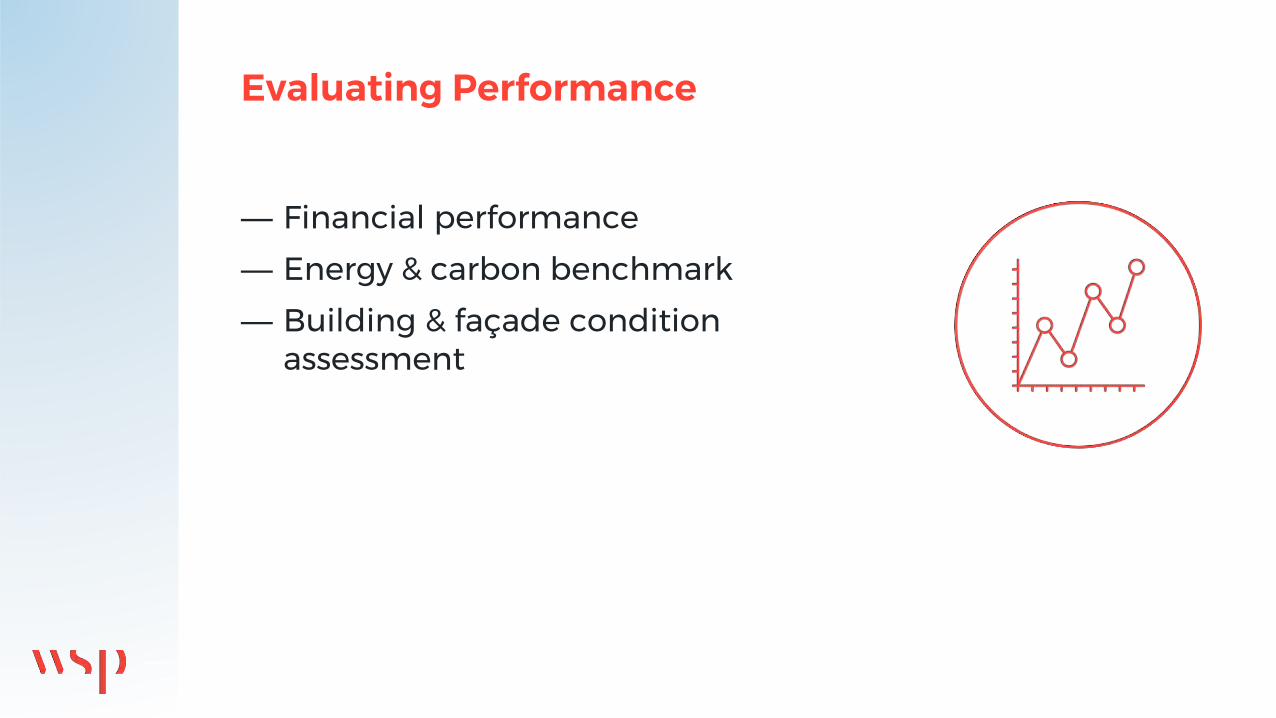
Evaluating Performance
— Financial performance
— Energy & carbon benchmark
— Building & façade condition assessment
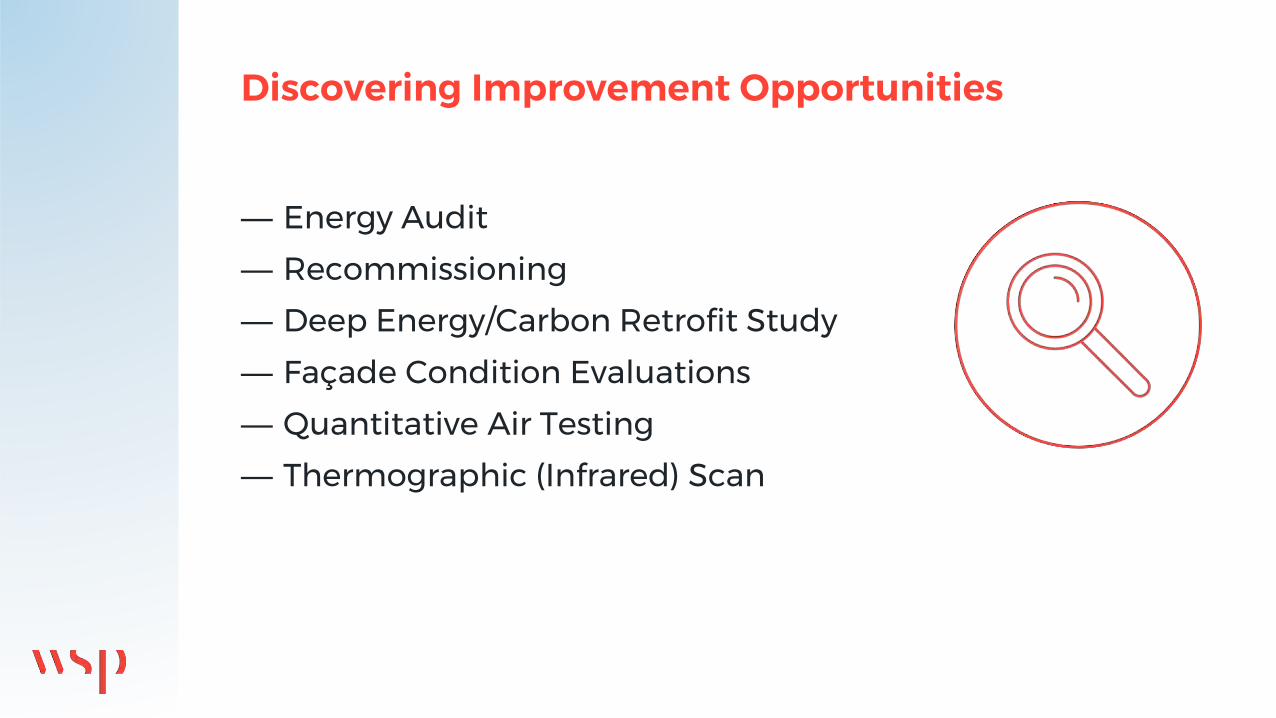
Discovering Improvement Opportunities
— Energy Audit
— Recommissioning
— Deep Energy/Carbon Retrofit Study
— Façade Condition Evaluations
— Quantitative Air Testing
— Thermographic (Infrared) Scan
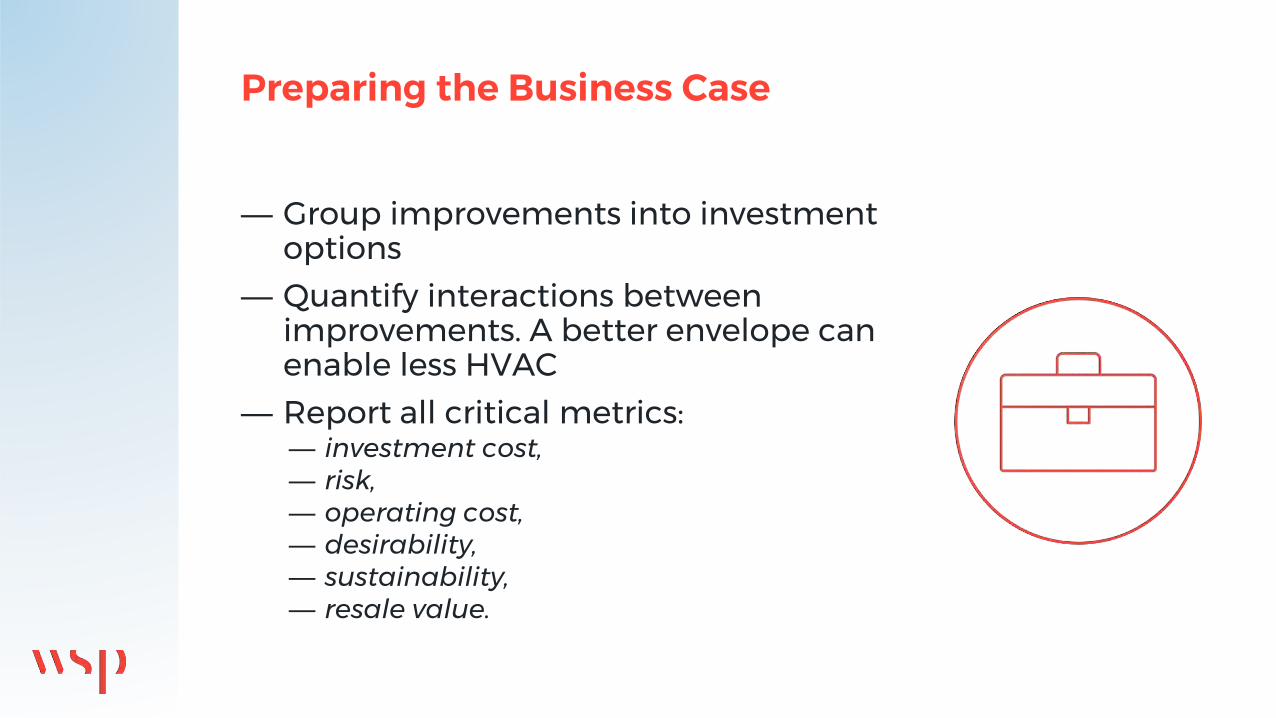
Preparing the Business Case
— Group improvements into investment options
— Quantify interactions between improvements. A better envelope can enable less HVAC
— Report all critical metrics: — investment cost, — risk, — operating cost, — desirability, — sustainability, — resale value.
Planning – Next Steps
— Continue thinking about shifting building performance targets
— Engage building owners in feasibility studies for retrofit options which consider both the façade and core
— Validate retrofit studies with analysis of post-retrofit energy data

EXISTING PARADIGM
Façade Renewal Paradigm
© Disney

Real Estate Hot Potato
Vancouverisawesome.com
Kraftcanada.com
Katiescucina.com