future mobility zones fund - west of england combined ...€¦ · west of england combined...
TRANSCRIPT
West of England Combined Authority – Future Mobility Zone – Final Proposal
0
Future Mobility Zones Fund Application Form – Final Proposal
Applicant Information City region name: West of England Combined Authority Bid manager name and position: Jason Humm, Head of Transport Postal address: 3 Rivergate Temple Quay Bristol BS1 6EW
This submission has been prepared utilising the FMZ Final Proposal template, however the boxes have been removed due to formatting constraints when presenting tables and diagrams.

West of England Combined Authority – Future Mobility Zone – Final Proposal
1
SECTION A – Name, location and description of the FMZ
A1. FMZ name and location
The West of England is recognised nationally and internationally as a region that leads and drives
innovation both within traditional sectors, such as aerospace, and across a diverse range of creative
and digital sectors. Our thriving universities are carrying out ground-breaking research and collaborating
with our forward-thinking businesses to bring great ideas to life. The West of England is proud to already
be a home of innovation and testing for future transport and mobility services.
Our Local Industrial Strategy (LIS) will continue to drive unprecedented levels of innovation – both
across the region and nationally – increasing our business productivity rate and exceeding our already
high contribution to national growth. We are one of the country’s biggest economic success stories and
we are working hard to keep it that way.
We know our region is going to keep growing and we need to be ambitious to meet the needs of the
future. To support our ambitions, the West of England Combined Authority (WECA) – with the full
support and backing of important and influential regional stakeholders – is applying to the Department
for Transport (DfT) for funding to create a West of England Future Mobility Zone (FMZ).
FMZ Name: West of England Future Mobility Living Lab
The aim of the West of England Future Mobility Zone is to co-design, trial and demonstrate replicable transport innovations that can improve connectivity, enhancing regional productivity, widening access to employment and creating a globally significant demonstrator to drive trade and inward investment.
Here, West of England Mayor Tim Bowles talks about our region and our ambitions for future
transport https://youtu.be/VTyfkV5X0 and about our Bid Submission https://youtu.be/tWdieeURIEw.
We are perfectly placed to lead on, and benefit from, the market for Future Mobility solutions, which is estimated to be £1.4 trillion by 20301. We have worked with stakeholders to define the principles for the Future Mobility market in the West of England and have strong support from the market – both incumbent operators and new entrants.
We have the skills and commercial relationships to successfully trial and evaluate new mobility modes,
models and services iteratively within our FMZ, and deliver long-term commercially viable services.
Our ambition to deliver a Future Mobility Living Lab plays to our region’s strengths. It supports delivery of our strategic transport objectives, is rooted within our LIS and supports delivery of our growth and transport ambitions as set out in our regional growth plans and Joint Local Transport Plan 2019 (JLTP).
Our JLTP is the most ambitious plan that the region has ever formulated, reflecting the need for a step change in transport provision to change the way people travel in the West of England. The FMZ is equally ambitious and will sit alongside the transformative measures set out in the plan.
The West of England FMZ will act as one Future Mobility Living Lab, with common management, governance and branding. The Living Lab will cover four diverse areas of operation, providing different use cases, challenges and opportunities, against which to trial and evaluate varied future mobility solutions. The diversity in testing environments – including private campuses and real-world urban, sub-urban and rural geographies – is a strong selling point of our Living Lab. From this we will deliver learnings and evidence for replicability and, ultimately, lead the transition to a future mobility market in the West of England.
Figure 1 – Why the West of England
West of England Combined Authority – Future Mobility Zone – Final Proposal
2
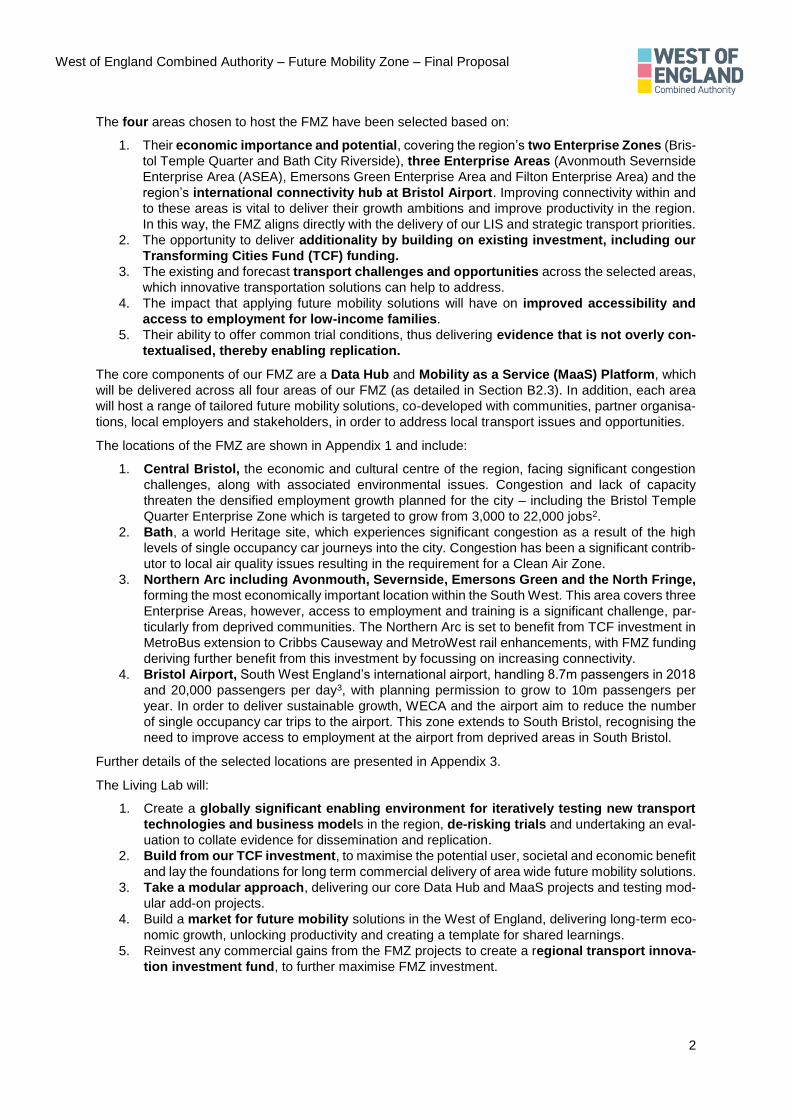
The four areas chosen to host the FMZ have been selected based on:
1. Their economic importance and potential, covering the region’s two Enterprise Zones (Bris-
tol Temple Quarter and Bath City Riverside), three Enterprise Areas (Avonmouth Severnside
Enterprise Area (ASEA), Emersons Green Enterprise Area and Filton Enterprise Area) and the
region’s international connectivity hub at Bristol Airport. Improving connectivity within and
to these areas is vital to deliver their growth ambitions and improve productivity in the region.
In this way, the FMZ aligns directly with the delivery of our LIS and strategic transport priorities.
2. The opportunity to deliver additionality by building on existing investment, including our
Transforming Cities Fund (TCF) funding.
3. The existing and forecast transport challenges and opportunities across the selected areas,
which innovative transportation solutions can help to address.
4. The impact that applying future mobility solutions will have on improved accessibility and
access to employment for low-income families.
5. Their ability to offer common trial conditions, thus delivering evidence that is not overly con-
textualised, thereby enabling replication.
The core components of our FMZ are a Data Hub and Mobility as a Service (MaaS) Platform, which
will be delivered across all four areas of our FMZ (as detailed in Section B2.3). In addition, each area
will host a range of tailored future mobility solutions, co-developed with communities, partner organisa-
tions, local employers and stakeholders, in order to address local transport issues and opportunities.
The locations of the FMZ are shown in Appendix 1 and include:
1. Central Bristol, the economic and cultural centre of the region, facing significant congestion
challenges, along with associated environmental issues. Congestion and lack of capacity
threaten the densified employment growth planned for the city – including the Bristol Temple
Quarter Enterprise Zone which is targeted to grow from 3,000 to 22,000 jobs2.
2. Bath, a world Heritage site, which experiences significant congestion as a result of the high
levels of single occupancy car journeys into the city. Congestion has been a significant contrib-
utor to local air quality issues resulting in the requirement for a Clean Air Zone.
3. Northern Arc including Avonmouth, Severnside, Emersons Green and the North Fringe,
forming the most economically important location within the South West. This area covers three
Enterprise Areas, however, access to employment and training is a significant challenge, par-
ticularly from deprived communities. The Northern Arc is set to benefit from TCF investment in
MetroBus extension to Cribbs Causeway and MetroWest rail enhancements, with FMZ funding
deriving further benefit from this investment by focussing on increasing connectivity.
4. Bristol Airport, South West England’s international airport, handling 8.7m passengers in 2018
and 20,000 passengers per day3, with planning permission to grow to 10m passengers per
year. In order to deliver sustainable growth, WECA and the airport aim to reduce the number
of single occupancy car trips to the airport. This zone extends to South Bristol, recognising the
need to improve access to employment at the airport from deprived areas in South Bristol.
Further details of the selected locations are presented in Appendix 3.
The Living Lab will:
1. Create a globally significant enabling environment for iteratively testing new transport
technologies and business models in the region, de-risking trials and undertaking an eval-
uation to collate evidence for dissemination and replication.
2. Build from our TCF investment, to maximise the potential user, societal and economic benefit
and lay the foundations for long term commercial delivery of area wide future mobility solutions.
3. Take a modular approach, delivering our core Data Hub and MaaS projects and testing mod-
ular add-on projects.
4. Build a market for future mobility solutions in the West of England, delivering long-term eco-
nomic growth, unlocking productivity and creating a template for shared learnings.
5. Reinvest any commercial gains from the FMZ projects to create a regional transport innova-
tion investment fund, to further maximise FMZ investment.

West of England Combined Authority – Future Mobility Zone – Final Proposal
3
A2. FMZ description
A2.1 FMZ description
The West of England Future Mobility Living Lab will unlock greater benefit from our TCF funding, maximising sustainable mobility to address our key challenges:
1. Congestion in central Bristol, where the network is at capacity. Better utilisation of capacity is required to deliver 26,000 jobs planned for Bristol and unlock investment4.
2. Our Region growth targets the delivery of 105,500 new homes and 82,500 jobs by 2036, which will place unprecedented demand on the transport system5.
3. Poor public transport access to key employment areas, such as the ASEA, means local com-munities struggle to access employment, stifling growth.
4. High single-occupancy vehicle usage in Bristol and Bath, causing congestion and air pollution.
The Future Mobility Living Lab will work with local communities, stakeholders and innovators to co-design, iteratively trial, demonstrate and enable solutions that can improve connectivity, enhancing regional productivity, widening access to employment and create a globally significant demonstrator to drive trade and inward investment by:
1. Building a Data Hub and Mobility Stations, to improve physical and digital connectivity.
2. Developing a MaaS Platform and trialling the use of Mobility Credits.
3. Trialling new mobility services, including micromobility and dynamic demand responsive transport (DDRT) - using connected and autonomous vehicles (CAVs) where feasible.
We will collate evidence and lessons learnt on the efficacy of our FMZ and its projects to help build evidence and expertise to disseminate and promote in the UK and globally.
WECA will harness the market opportunity offered by future mobility, which is estimated to be £1.4tn by 20306. With supportive industry partners we aim to deliver long-term commercially viable solutions, benefiting from investment and growth. We have already defined the principles for our FMZ, with full market support.
A2.2 Changes made as a result of feedback received from DfT
The following changes have been made to the proposal as a result of feedback received from DfT:
Strategic Case
1. The geographic coverage of the FMZ has been refined, with an updated map presented in Appendix 1. The key changes include:
• Extending the Northern Arc to cover Emersons Green Enterprise Area, which includes the Bristol and Bath Science Park as a key trip attractor in the region.
• Extending the Bristol Airport zone to include South Bristol, recognising the need to im-prove access to employment opportunities at the airport from South Bristol.
2. Our projects have been prioritised and further developed in Section B2.3. 3. DfT challenged bidders to think about how the market for future mobility will manifest. We have
carefully considered this, engaging closely with key stakeholders. We recognise the need for further work in these areas, but as a starting point we have defined the principles under which
The Living Lab Approach
Living Labs facilitate and foster open, collaborative innovation, in real-life environments. User and stakeholder participation are central to the co-creation approach of Living Labs, which involve exploring issues, experimenting with solutions and evaluating outcomes.
Knowle West Media Centre (KWMC) run the Bristol Living Lab, a place where citizens, artists, technologists, businesses and public sector organisations come together to co-create ideas, tools and technologies that address local challenges, to innovate and to explore new possibilities.
By adopting a Living Lab approach, the West of England FMZ will deliver user-focussed solutions that help realise our regional transport objectives and create long term sustainable solutions.
West of England Combined Authority – Future Mobility Zone – Final Proposal
4
our FMZ will be delivered, as set out in Section B2.5. These principles have received strong stakeholder and market support and our region is seen as a key location to invest.
4. We have further developed our plans for Mobility Credits, reviewing lessons learnt from previ-ous and current incentivisation projects (such as those delivered under the Local Sustainable Transport Fund (LSTF)). From this, we are focussing Mobility Credits on improving access to employment, which aligns directly to our strategic case and plans to improve productivity.
Financial Case
1. Project costs have been updated in Section D1, following market engagement and a cost re-view. The costs outlined have a greater confidence level than those in our Phase 1 submission.
2. We have reviewed our approach to contingency, taking a risk-based approach to costs, and applying a cost risk allocation based on levels of confidence.
3. WECA has committed to match fund 15% of the DfT award for the FMZ as new investment,.
Management Case
1. We have developed an outline procurement strategy, as presented in Section F1.2. 2. We have provided a more detailed programme level risk register in Section E1.2, and a project
level risk register in Appendix 9.
The above are in addition to the new content presented on our economic case and evaluation plan.
SECTION B – The Strategic Case
B1. Background - What are the zone’s objectives
Issues
1. Whilst the region is a net contributor to the Treasury, economic success is at risk. Growth and
productivity gains will not be delivered without improved connectivity.
2. The region’s connectivity issues often result from capacity challenges. The network is at ca-
pacity in urban areas and around key employment, costing £300m per annum7. Without in-
tervention, congestion will act as a handbrake to growth.
3. Demand for 105,500 new homes and 82,500 jobs by 2036, which will place unprecedented
demand on the transport system8.
4. The need for clean growth, recognising our Climate Emergency declaration and poor air
quality in Air Quality Management Areas, estimated to be causing over 300 premature
deaths per year9.
Opportunities
1. West of England’s growing Future Mobility sector, creating an opportunity to test and realise
the future market for mobility, providing an international showcase for investment.
2. Proven experience in innovation and testing, including five CAV projects, a 5G Test Bed
and an IOT Test Bed – creating a bridge between laboratory development and commercial
deployment.
3. Home to four world-leading universities consistently ranked in the top five nationally for their
quality of applied research and technology centres.
4. Bus patronage in Bristol growing 50%10 in five years, and 30% across the region, bucking
the national trend. Growth can be accelerated with investment in MaaS.
5. International companies supporting the West of England FMZ.
Objectives
We will address the issues, and harness the opportunities, by trialling, demonstrating and evaluating solutions that build on TCF investment in MetroBus and MetroWest Rail to:
1. Improve connectivity, to better connect people to employment and training.
2. Make more efficient use of existing capacity in peak and off-peak periods.
3. Improve air quality and public health.
4. Unlock the potential of innovators and enterprises in the region and drive inward investment.

West of England Combined Authority – Future Mobility Zone – Final Proposal
5
B2. Strategic Case - What does the FMZ contribute to the programme objectives?
B2.1 Alignment to our strategic transport objectives
We have taken an outcome focussed approach to our FMZ, ensuring that the FMZ projects support the delivery of our strategic transport objectives, growth proposals and LIS.
The West of England region aims to deliver over 105,000 new homes and 82,500 new jobs by 203611, generating a 25% increase in the demand for movement. To ensure this growth is sustainable, there needs to be a transformation in the connectivity of the region. Our TCF investment provides mass movement solutions to help tackle this challenge. With FMZ funding we can trial and evaluate the next generation of solutions, delivering additionality from TCF by widening the catchment of our mass transport solutions and offering new sustainable travel opportunities. The aim and objectives of our FMZ, as detailed in Sections A1 and B1, have been designed to harness this opportunity.
The West of England is unique in having a joint approach to spatial and transport planning, showing the
collaborative and innovative approach that the region is known for. Our draft JLTP provides the strategic
direction for all investment in transport in the West of England until 2036, building on the recommenda-
tions of our Joint Transport Study. The JLTP sets out the challenges faced in the region, including
network capacity and heavy congestion in many areas. It highlights the opportunity that new technology
could bring, including MaaS, CAVs, open data and Smart City initiatives. The FMZ will address the
objective of supporting sustainable and inclusive economic growth by using smarter transport
measures to unlock capacity on the network, thereby allowing the development of further jobs and
housing. Furthermore, through the MaaS Platform and the provision of new mobility services, access
to employment for those living in disadvantaged areas with poor connectivity will enable improved ac-
cessibility and life opportunities.
This FMZ bid is firmly sited within our LIS and is entirely consistent with our growth and transport ambitions within our developing region growth plans and JLTP. Consequently, the full support of the regional Mayor, councils, academic community and commercial stakeholders is behind our FMZ application. Table 1 summarises the alignment of the FMZ projects to our regional strategic objectives, which are taken from our draft JLTP, Region growth plans and Local Industrial Strategy. Appendix 5 provides further details of the alignment between our FMZ projects and our strategic transport objectives, showing our outcome focussed approach.
Table 1 – Alignment of FMZ projects to regional strategic objectives
Regional Strategic Objectives Data Hub MaaS Mobility Stations Micromobility DDRT
Sustainable and inclusive economic
growth, increasing productivity ✔✔✔ ✔✔✔ ✔✔✔ ✔ ✔✔✔
Equality and accessibility ✔ ✔✔✔ ✔✔✔ ✔ ✔
Better health, wellbeing, safety and
security ✔ ✔✔✔ ✔✔✔ ✔ ✔
Enable independence, reduce
health inequalities ✔ ✔✔✔ ✔✔✔ ✔ ✔✔✔
Access to public transport which
reduces reliance on cars ✔ ✔✔✔ ✔✔✔ ✔✔✔ ✔✔✔
Access to jobs ✔✔✔ ✔✔✔ ✔✔✔ ✔ ✔✔✔
Reducing congestion and a more
resilient road network ✔✔✔ ✔✔✔ ✔ ✔✔✔ ✔✔✔
Improving air quality ✔ ✔✔✔ ✔✔✔ ✔✔✔ ✔✔✔
Well connected with digital services ✔✔✔ ✔✔✔ ✔ ✔ ✔
West of England Combined Authority – Future Mobility Zone – Final Proposal
6
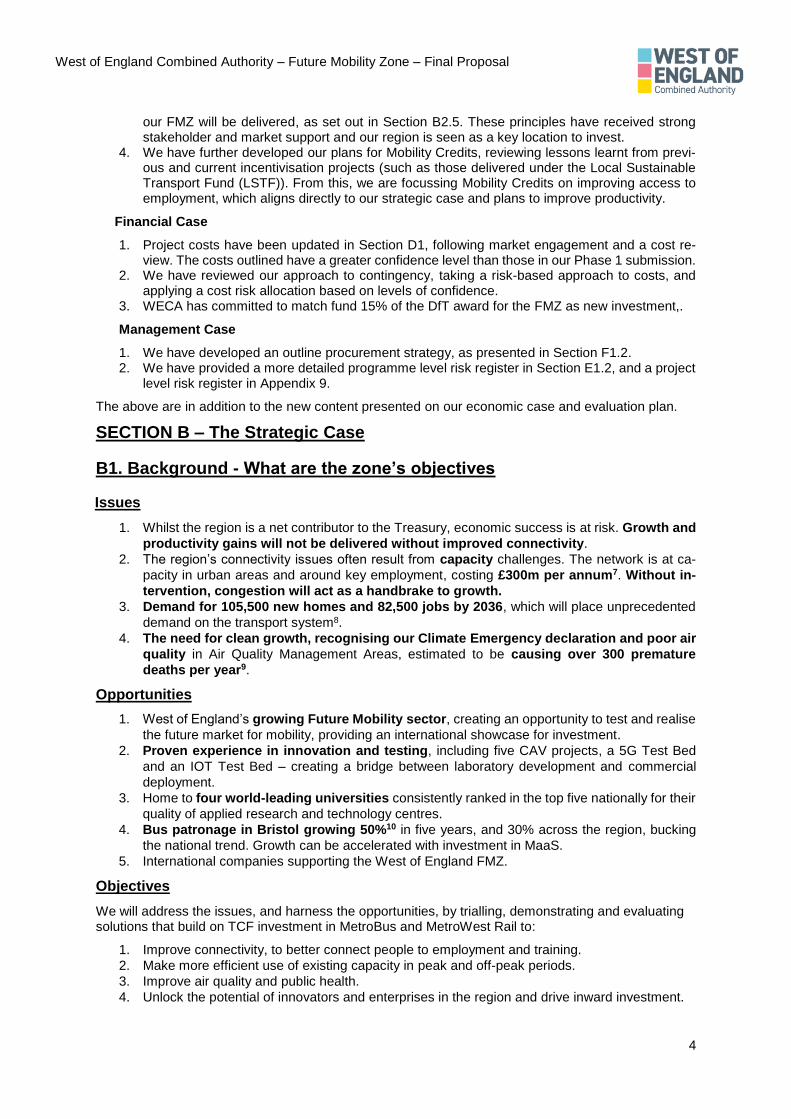
Figure 2 summarises the strategic case for our FMZ scheme.
Figure 2 – Strategic case summary
B2.2 – Knowledge gaps
Our FMZ proposal will address knowledge gaps in three key areas: (1) Impacts, outcomes and user responses; (2) Commercial; and (3) Strategy policy and regulation. The key knowledge gaps are detailed in Table 2, alongside the rationale for why they are important and the potential benefits of addressing them.
West of England Combined Authority – Future Mobility Zone – Final Proposal
7
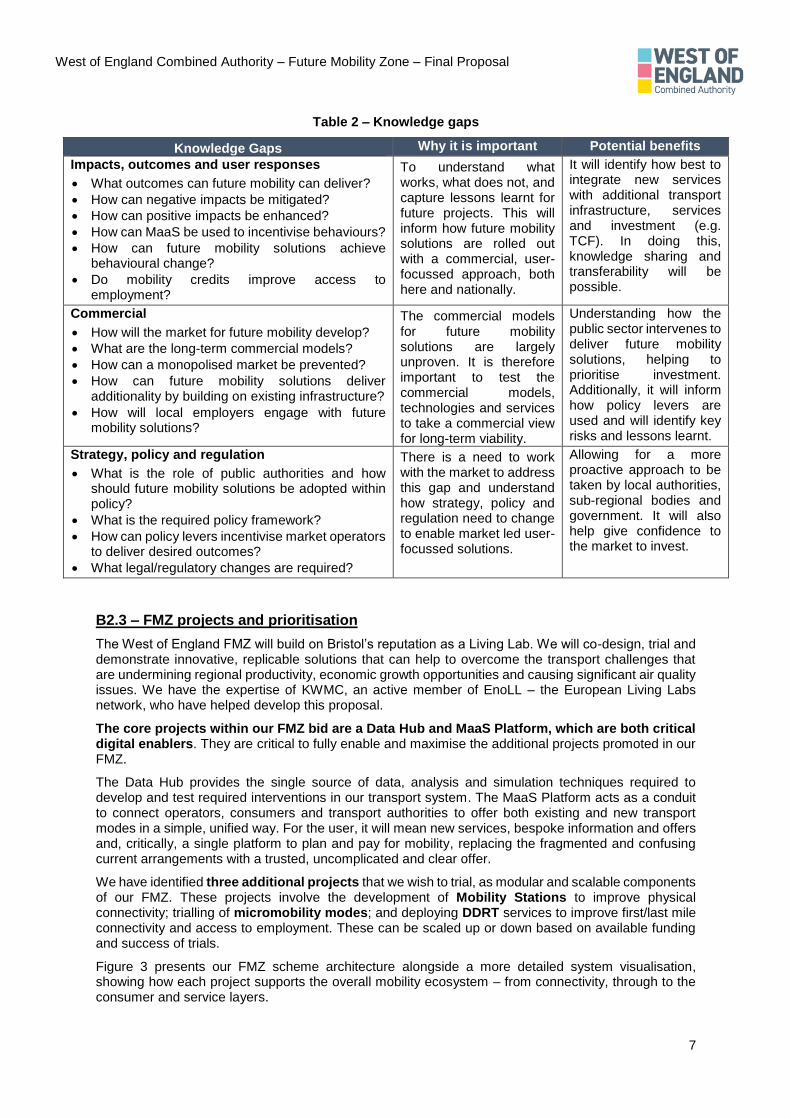
Table 2 – Knowledge gaps
Knowledge Gaps Why it is important Potential benefits
Impacts, outcomes and user responses
• What outcomes can future mobility can deliver?
• How can negative impacts be mitigated?
• How can positive impacts be enhanced?
• How can MaaS be used to incentivise behaviours?
• How can future mobility solutions achieve behavioural change?
• Do mobility credits improve access to employment?
To understand what works, what does not, and capture lessons learnt for future projects. This will inform how future mobility solutions are rolled out with a commercial, user-focussed approach, both here and nationally.
It will identify how best to integrate new services with additional transport infrastructure, services and investment (e.g. TCF). In doing this, knowledge sharing and transferability will be possible.
Commercial
• How will the market for future mobility develop?
• What are the long-term commercial models?
• How can a monopolised market be prevented?
• How can future mobility solutions deliver additionality by building on existing infrastructure?
• How will local employers engage with future mobility solutions?
The commercial models for future mobility solutions are largely unproven. It is therefore important to test the commercial models, technologies and services to take a commercial view for long-term viability.
Understanding how the public sector intervenes to deliver future mobility solutions, helping to prioritise investment. Additionally, it will inform how policy levers are used and will identify key risks and lessons learnt.
Strategy, policy and regulation
• What is the role of public authorities and how should future mobility solutions be adopted within policy?
• What is the required policy framework?
• How can policy levers incentivise market operators to deliver desired outcomes?
• What legal/regulatory changes are required?
There is a need to work with the market to address this gap and understand how strategy, policy and regulation need to change to enable market led user-focussed solutions.
Allowing for a more proactive approach to be taken by local authorities, sub-regional bodies and government. It will also help give confidence to the market to invest.
B2.3 – FMZ projects and prioritisation
The West of England FMZ will build on Bristol’s reputation as a Living Lab. We will co-design, trial and demonstrate innovative, replicable solutions that can help to overcome the transport challenges that are undermining regional productivity, economic growth opportunities and causing significant air quality issues. We have the expertise of KWMC, an active member of EnoLL – the European Living Labs network, who have helped develop this proposal.
The core projects within our FMZ bid are a Data Hub and MaaS Platform, which are both critical digital enablers. They are critical to fully enable and maximise the additional projects promoted in our FMZ.
The Data Hub provides the single source of data, analysis and simulation techniques required to develop and test required interventions in our transport system. The MaaS Platform acts as a conduit to connect operators, consumers and transport authorities to offer both existing and new transport modes in a simple, unified way. For the user, it will mean new services, bespoke information and offers and, critically, a single platform to plan and pay for mobility, replacing the fragmented and confusing current arrangements with a trusted, uncomplicated and clear offer.
We have identified three additional projects that we wish to trial, as modular and scalable components of our FMZ. These projects involve the development of Mobility Stations to improve physical connectivity; trialling of micromobility modes; and deploying DDRT services to improve first/last mile connectivity and access to employment. These can be scaled up or down based on available funding and success of trials.
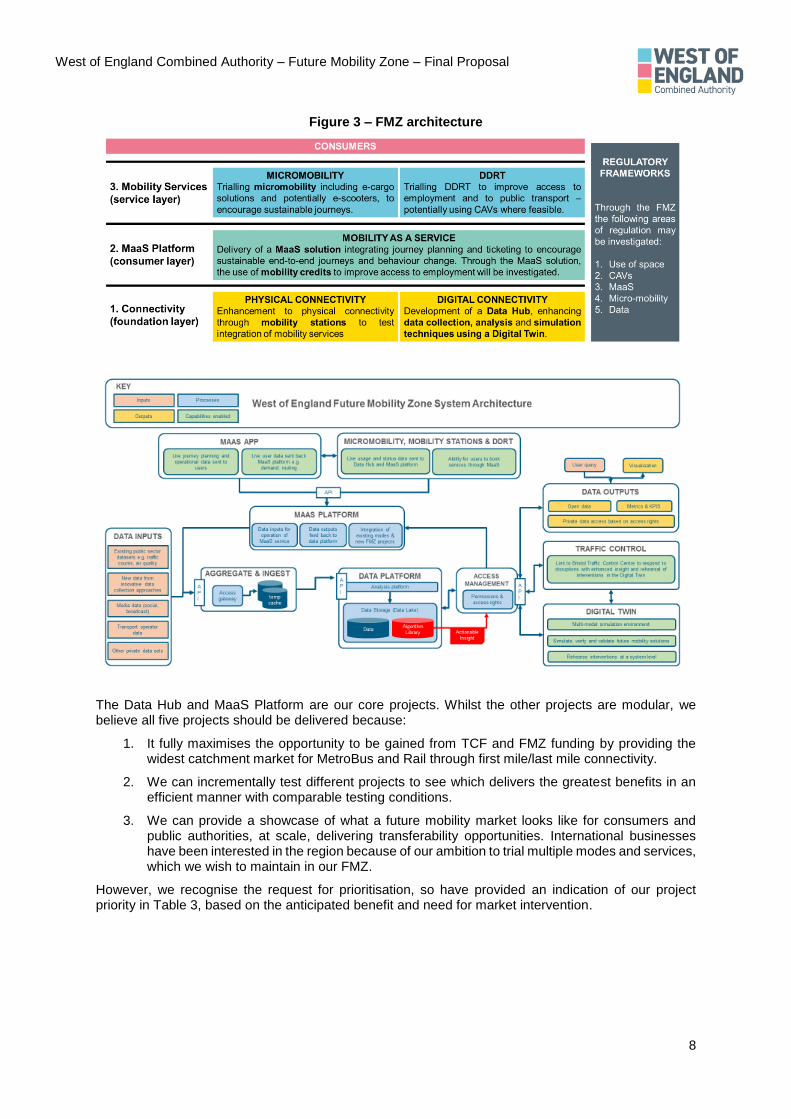
Figure 3 presents our FMZ scheme architecture alongside a more detailed system visualisation, showing how each project supports the overall mobility ecosystem – from connectivity, through to the consumer and service layers.
West of England Combined Authority – Future Mobility Zone – Final Proposal
8
Figure 3 – FMZ architecture
The Data Hub and MaaS Platform are our core projects. Whilst the other projects are modular, we believe all five projects should be delivered because:
1. It fully maximises the opportunity to be gained from TCF and FMZ funding by providing the widest catchment market for MetroBus and Rail through first mile/last mile connectivity.
2. We can incrementally test different projects to see which delivers the greatest benefits in an efficient manner with comparable testing conditions.
3. We can provide a showcase of what a future mobility market looks like for consumers and public authorities, at scale, delivering transferability opportunities. International businesses have been interested in the region because of our ambition to trial multiple modes and services, which we wish to maintain in our FMZ.
However, we recognise the request for prioritisation, so have provided an indication of our project priority in Table 3, based on the anticipated benefit and need for market intervention.

West of England Combined Authority – Future Mobility Zone – Final Proposal
9
Table 3 – Project prioritisation
Priority Project Justification
Higher
Lower
Data Hub and MaaS Platform
Delivery of a Data Hub and MaaS Platform is core to our FMZ. It will create the digital infrastructure required to deliver further projects. These projects also require strong leadership from the public sector.
Mobility Stations Mobility Stations will deliver modal shift and help improve air quality; though the data on their impact is limited therefore requiring public sector leadership.
DDRT DDRT offers an opportunity to enhance TCF funding and improve access to employment, particularly from areas of multiple deprivation. Existing regional experience and industry testing will be enhanced through the FMZ.
Micromobility The market has been shown to deliver micromobility without significant public sector investment, so this is a lower priority. However, we wish to take a role in enabling more innovative modes (e-scooters) and freight solutions, to build up the evidence based on their impact.
We welcome a discussion about funding and project prioritisation if successful.
Each project is described below, highlighting the alignment to DfT’s FMZ aims, stakeholder support and the geographic areas within which we will trial each project.
B2.3.1 – Data hub
Project Details: This project will unify datasets and gather new data to maximise the understanding of travel demands and traffic. It will provide the foundations for driving the demand for sustainable mobility, influence behaviours and allow more effective management of the transport system.
This project will leverage the existing data platform operated by Bristol City Council12, scaling across the region. Bristol’s platform provides a wide range of open data sets (e.g. the location of electric vehicle charging points) which anyone can access and interact with via an API. However, its limitations include:
1. Being focused on the Bristol area, which needs scaling up for the West of England.
2. The need for better integration with live systems, such that live data can be made available.
3. The need to open up private datasets, such as car parking availability.
4. The need to release data in common and easily used formats, to drive usage (e.g. GTFS).
5. The need to incorporate and merge new data feeds (such as mobile phone data or IOT data).
6. A lack of real time modelling tools able to use real time data streams from the platform.
The contract for the existing platform ends in Spring 2020, so the FMZ provides an opportunity to fund a larger, more advanced platform that integrates with the proposed MaaS project. Through the FMZ
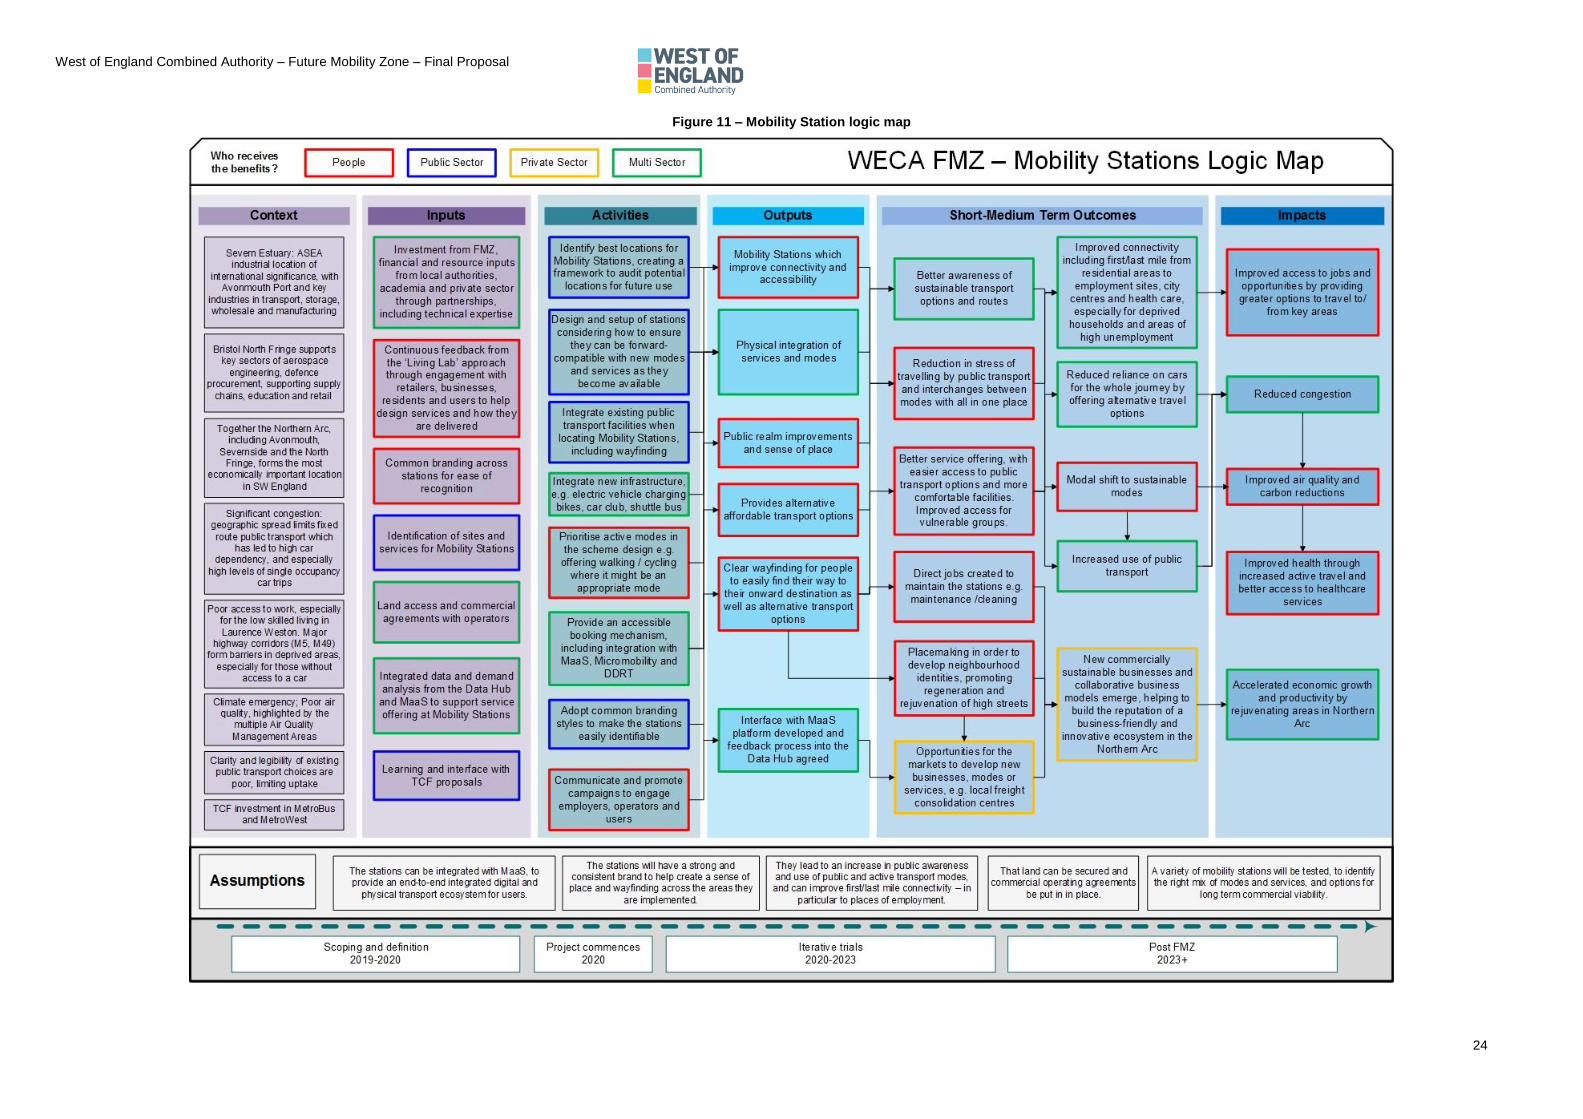
Logic Maps For each project we have produced a logic map to demonstrate how we expect the project to deliver the intended benefits. The logic maps present the context, inputs, activities, outputs and outcomes for each project. The logic maps are a tool that link to both our strategic case and economic case, and are presented in Figure 9 to Figure 13.
New technologies, such as data capture and processing technologies (sensors, artificial intelligence and digital twins) can generate and manage better quality data about our infrastructure, which can be used to improve the way that assets are planned and maintained.
Data for the Public Good (NIC, 2017)
West of England Combined Authority – Future Mobility Zone – Final Proposal
10
we will add real time transport data to provide a step-change in how the region manages its transport system.
Subject to further scoping and definition of use cases, the Data Hub functions will include:
1. Collation, cataloguing and secure storage of existing data, creating a single source of
truth. Example datasets include: parking utilisation; electric vehicle charging point utilisation;
public transport data (such as utilisation and vehicle position); micromobility vehicle utilisation
and position data.
2. Use of innovative data collection techniques to pool data such as mobile phone data, infor-
mation from the MaaS Platform and increasingly from connected infrastructure, to better un-
derstand vehicle, cycle and pedestrian movements. We have engaged with companies like
Vivacity Labs who offer a range of new tools and techniques for data collection (such as artifi-
cial intelligence driven sensors), that we aim to deploy and test. An evidence led audit of data
quantity, quality and coverage will be undertaken in scoping to identify gaps, informing new
data collection requirements.
3. A single, harmonised data model to allow integration and interoperability.
4. Data analytics and visualisation capabilities, providing actionable insight for transport prac-
titioners and operators, traffic control centres and other users.
5. Controlled levels of access to view and extract or manipulate data to improve decision
making and operational efficiency while protecting data providers' assets. As far as possible,
data will be opened-up for third party/public use through Open APIs.
Data sharing is fundamental to the West of England FMZ. Transport for London valued the user time
savings for the public as a result of its open data approach at up to £58m per year and we want to
deliver similar benefits for the people of the West of England. However, we recognise that data sharing
does not mean all data is open, given commercial and privacy restrictions.
Working with stakeholders and suppliers we are
developing models for data access and sharing,
recognising that different levels of access will be
appropriate for different users. We will work
closely with the market to define a data sharing
standard (including API standards), learning from
existing standards that we have investigated in-
cluding the New South Wales data specification13,
the MaaS Global data sharing API14 and the City
of Los Angeles Mobility Data Specification15.
Additionally, we are keen to push the capabilities
of the Data Hub to monitor performance of the
transport assets and the network in real time; test
interventions in a simulation environment in real
time; and respond to those disruptions in the real
world. To that end, the Data Hub project includes:
1. The development of a Digital Twin simu-
lation environment, capable of simulating
multi-modal transport systems as part of a
MaaS service; and utilise simulation for
verification and validation of human cen-
tred CAV systems.
2. Investigation of opportunities to link the
Data Hub to the Bristol traffic control cen-
tre and system, to simulate and then re-
spond to disruptions in the real world. This will be trialled at the Bristol level, to test and evaluate
whether there is a business case for wider deployment.
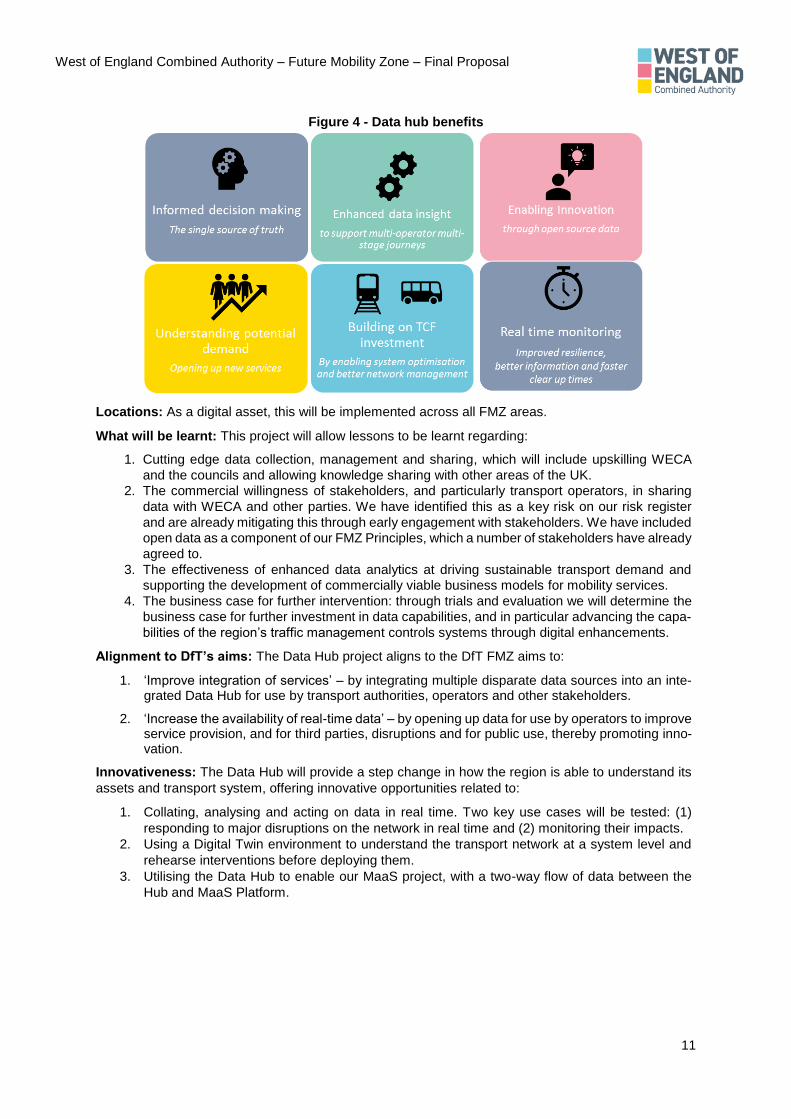
This Data Hub will deliver multiple benefits as shown in Figure 4.
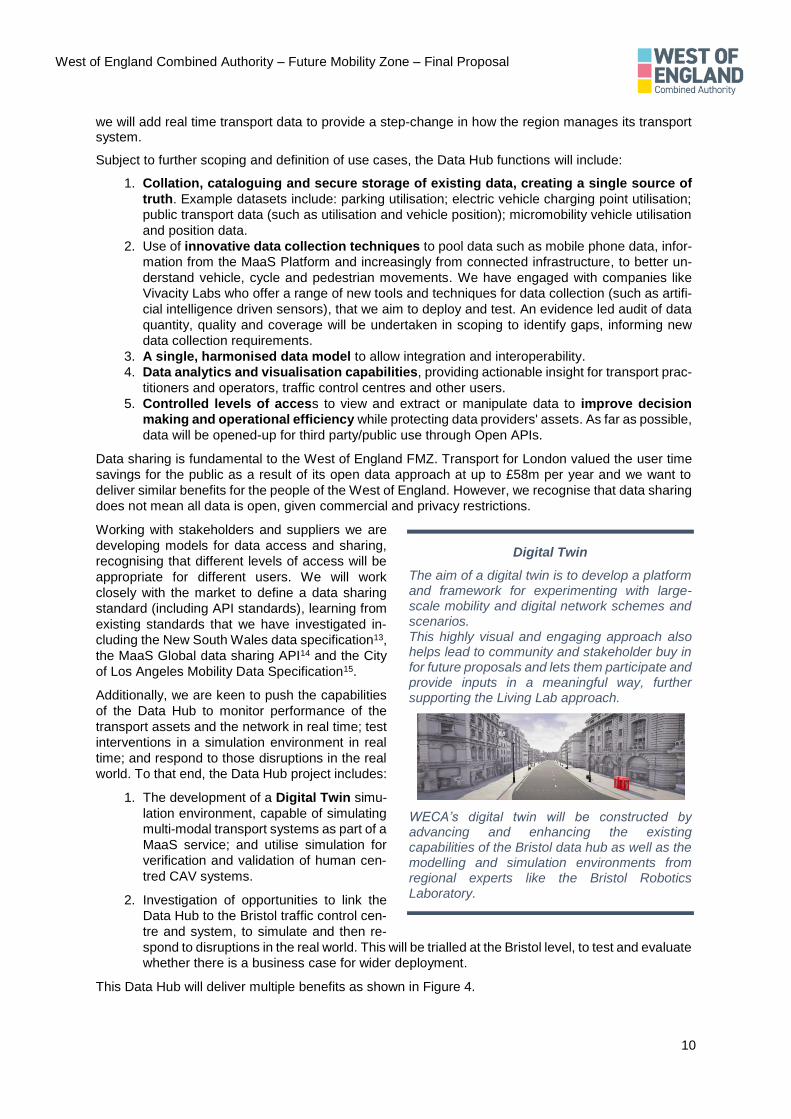
Digital Twin
The aim of a digital twin is to develop a platform and framework for experimenting with large-scale mobility and digital network schemes and scenarios. This highly visual and engaging approach also helps lead to community and stakeholder buy in for future proposals and lets them participate and provide inputs in a meaningful way, further supporting the Living Lab approach.
WECA’s digital twin will be constructed by advancing and enhancing the existing capabilities of the Bristol data hub as well as the modelling and simulation environments from regional experts like the Bristol Robotics Laboratory.
West of England Combined Authority – Future Mobility Zone – Final Proposal
11
Figure 4 - Data hub benefits
Locations: As a digital asset, this will be implemented across all FMZ areas.
What will be learnt: This project will allow lessons to be learnt regarding:
1. Cutting edge data collection, management and sharing, which will include upskilling WECA
and the councils and allowing knowledge sharing with other areas of the UK.
2. The commercial willingness of stakeholders, and particularly transport operators, in sharing
data with WECA and other parties. We have identified this as a key risk on our risk register
and are already mitigating this through early engagement with stakeholders. We have included
open data as a component of our FMZ Principles, which a number of stakeholders have already
agreed to.
3. The effectiveness of enhanced data analytics at driving sustainable transport demand and
supporting the development of commercially viable business models for mobility services.
4. The business case for further intervention: through trials and evaluation we will determine the
business case for further investment in data capabilities, and in particular advancing the capa-
bilities of the region’s traffic management controls systems through digital enhancements.
Alignment to DfT’s aims: The Data Hub project aligns to the DfT FMZ aims to:
1. ‘Improve integration of services’ – by integrating multiple disparate data sources into an inte-grated Data Hub for use by transport authorities, operators and other stakeholders.
2. ‘Increase the availability of real-time data’ – by opening up data for use by operators to improve service provision, and for third parties, disruptions and for public use, thereby promoting inno-vation.
Innovativeness: The Data Hub will provide a step change in how the region is able to understand its
assets and transport system, offering innovative opportunities related to:
1. Collating, analysing and acting on data in real time. Two key use cases will be tested: (1)
responding to major disruptions on the network in real time and (2) monitoring their impacts.
2. Using a Digital Twin environment to understand the transport network at a system level and
rehearse interventions before deploying them.
3. Utilising the Data Hub to enable our MaaS project, with a two-way flow of data between the
Hub and MaaS Platform.
West of England Combined Authority – Future Mobility Zone – Final Proposal
12
B2.3.2 – MaaS platform
Project Details: Significant improvements have been made to bus services, safe cycling provision and rail services in the West of England. Further improvements are already being taken forward with TCF investment. The resulting outcome is a network of high-quality public transport and cycling services that are already delivering significant shifts in travel habits. Our MaaS Platform will build from this, providing a one stop shop for all mobility services, with the aim of:
1. Making travel uncomplicated: offering multi-modal end-to-end journeys through a unified service offer across all mobility providers.
2. Making services targeted: allowing user specific journey planning, pricing (including mobility credits) and marketing to maximise efficiency of the transport system and encourage behaviour change.
3. Improving access to employment for those without a car
WECA is already co-ordinating operators to develop smart ticketing. The region has already delivered interoperable standards for smart cards and a multi-operator ticket, as well the introduction of contactless payment and payment by phone, removing the barrier of needing to pay with cash.
Aligned with our work on smart ticketing, the development of the TravelWest brand (https://travelwest.info/) has underpinned long-term programmes of investment in sustainable transport, encouraging behaviour change. TravelWest offers journey planning and modal specific information, as well as a travel card for pay as you go, daily/weekly/monthly passes and multi-operator tickets. The West of England Travel to Work Survey 2019 found that half of all 22,536 respondents to the survey had either used or were aware of the TravelWest journey planner16 – providing a strong base to build our MaaS Platform from.
Through MaaS this can be taken to the next level with a unified, multi-modal service where people can plan and pay for services based on the full range of sustainable travel options available to them.
The addition of DDRT, Mobility Stations and Micromobility will add further opportunities to open-up mobility options. However, this requires a single source of truth to make non-car travel simple and easy to understand.
Whilst bus patronage growth has been significant in the last five years, demand remains heavily ‘peak’ orientated, particularly for slightly longer trips (3-5 miles) whereas the car is perceived as more reliable in the off-peak. Through the MaaS Platform, users will have a realistic alternative to the private car by offering other travel combinations that are more convenient for their end-to-end journey. This will also aid better asset utilisation during off peak hours.
The platform will enable operators to develop user specific marketing and pricing strategies that will continue to grow off-peak demand, further supporting commercial delivery of increased peak-travel, critical to sustainable economic growth in the West of England.
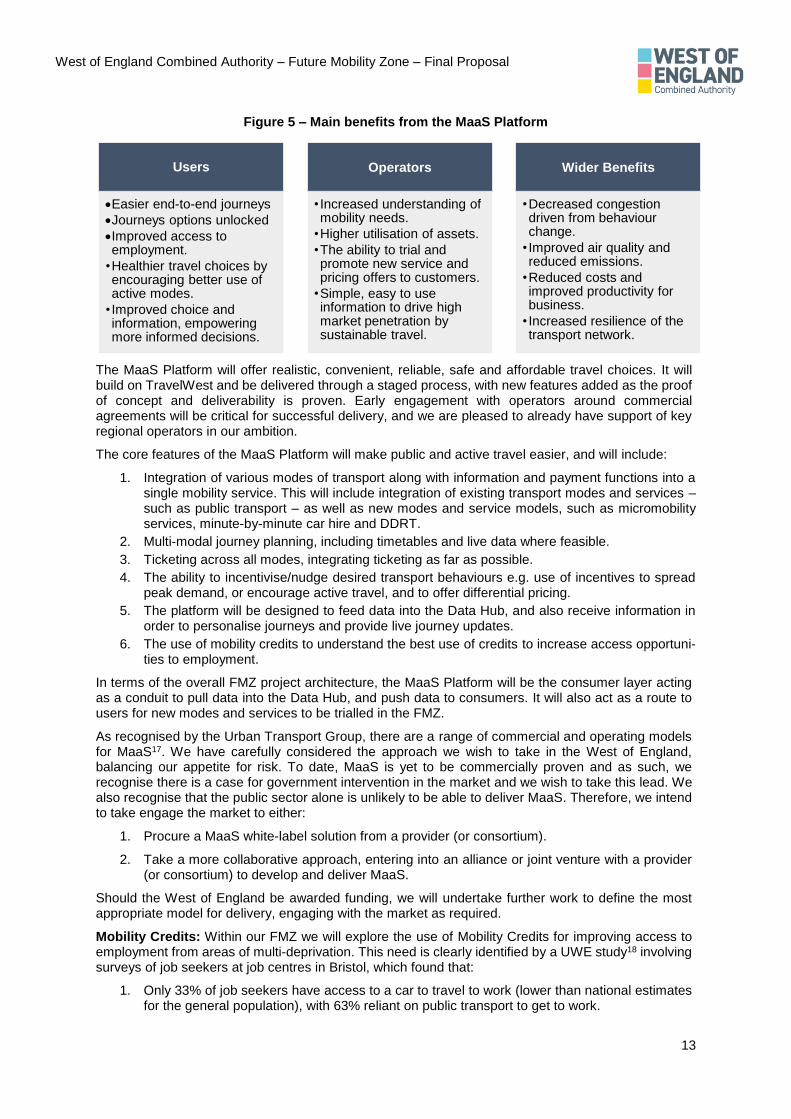
The main benefits of the MaaS Platform to different groups are shown in Figure 5.
West of England Combined Authority – Future Mobility Zone – Final Proposal
13
Figure 5 – Main benefits from the MaaS Platform
The MaaS Platform will offer realistic, convenient, reliable, safe and affordable travel choices. It will build on TravelWest and be delivered through a staged process, with new features added as the proof of concept and deliverability is proven. Early engagement with operators around commercial agreements will be critical for successful delivery, and we are pleased to already have support of key regional operators in our ambition.
The core features of the MaaS Platform will make public and active travel easier, and will include:
1. Integration of various modes of transport along with information and payment functions into a single mobility service. This will include integration of existing transport modes and services – such as public transport – as well as new modes and service models, such as micromobility services, minute-by-minute car hire and DDRT.
2. Multi-modal journey planning, including timetables and live data where feasible.
3. Ticketing across all modes, integrating ticketing as far as possible.
4. The ability to incentivise/nudge desired transport behaviours e.g. use of incentives to spread peak demand, or encourage active travel, and to offer differential pricing.
5. The platform will be designed to feed data into the Data Hub, and also receive information in order to personalise journeys and provide live journey updates.
6. The use of mobility credits to understand the best use of credits to increase access opportuni-ties to employment.
In terms of the overall FMZ project architecture, the MaaS Platform will be the consumer layer acting as a conduit to pull data into the Data Hub, and push data to consumers. It will also act as a route to users for new modes and services to be trialled in the FMZ.
As recognised by the Urban Transport Group, there are a range of commercial and operating models for MaaS17. We have carefully considered the approach we wish to take in the West of England, balancing our appetite for risk. To date, MaaS is yet to be commercially proven and as such, we recognise there is a case for government intervention in the market and we wish to take this lead. We also recognise that the public sector alone is unlikely to be able to deliver MaaS. Therefore, we intend to take engage the market to either:
1. Procure a MaaS white-label solution from a provider (or consortium).
2. Take a more collaborative approach, entering into an alliance or joint venture with a provider (or consortium) to develop and deliver MaaS.
Should the West of England be awarded funding, we will undertake further work to define the most appropriate model for delivery, engaging with the market as required.
Mobility Credits: Within our FMZ we will explore the use of Mobility Credits for improving access to employment from areas of multi-deprivation. This need is clearly identified by a UWE study18 involving surveys of job seekers at job centres in Bristol, which found that:
1. Only 33% of job seekers have access to a car to travel to work (lower than national estimates for the general population), with 63% reliant on public transport to get to work.
Users
•Easier end-to-end journeys
•Journeys options unlocked
•Improved access to employment.
•Healthier travel choices by encouraging better use of active modes.
• Improved choice and information, empowering more informed decisions.
Operators
• Increased understanding of mobility needs.
•Higher utilisation of assets.
•The ability to trial and promote new service and pricing offers to customers.
•Simple, easy to use information to drive high market penetration by sustainable travel.
Wider Benefits
•Decreased congestion driven from behaviour change.
• Improved air quality and reduced emissions.
•Reduced costs and improved productivity for business.
• Increased resilience of the transport network.

West of England Combined Authority – Future Mobility Zone – Final Proposal
14
2. 19% of people had left a job because they could not get to or from work and 26% had missed an interview because they could not get there or home again.
3. 56% of people who normally use public transport to get to work agreed that the cost of public transport limits where they can work.
Therefore, the MaaS Platform will be used to offer a trial group access to Mobility Credits that can be used to reduce costs to access employment opportunities for residents in Lawrence Weston in north-west Bristol. Lawrence Weston has been chosen as:
1. Direct bus and cycling options for access to employment or training are very limited. 2. 79% of residents in the area agree that the cost of public transport is a problem19. 3. 63% of residents in the area agree that public transport links to jobs are a problem, with 44%
reporting that poor transport links are a barrier to finding work20. 4. It is close to the ASEA, where employers are having difficulty filling roles due to poor access.
Through an integrated approach, MaaS will offer a variety of modes including pilot DDRT, micromobility and Mobility Stations at Avonmouth rail station and/or Portway Park and Ride linking into wider rail, MetroBus and bus networks. Mobility Credits will be available for residents to improve access to employment, for use across a range of modes offered on the MaaS Platform. Appropriate research methodologies will be employed to obtain statistically significant evidence on the impact of the Mobility Credits, using randomisation where required.
We will draw on experience of the West of England councils, who have experience in delivering sustainable travel schemes such as LSTF. Additionally, we will work with transport operators, Jobcentre Plus and other organisations, to oversee delivery of the Mobility Credits.
Previous and current sustainable transport projects in the region, such as Bristol’s Wheels to Work scheme, have shown that providing free bus tickets or cycle loans can improve access to employment. A number of these schemes finish in Spring 2020, so the FMZ, will trial innovative ways of making credits available including through the MaaS Platform. We will also look to widen access to transport servicers beyond bus or cycle loan.
Locations: As a digital asset, the MaaS Platform will be implemented across all FMZ areas.
What will be learnt: Effective evaluation of the MaaS Platform will be critical. The concept of MaaS is heavily discussed and promoted, however there is little evidence of its impact and ability to deliver the benefits listed above. We will therefore transparently evaluate the impact of the project, with a particular focus on the impact on long-term behavioural change.
Alignment to DfT’s aims: The MaaS Platform aligns to the following DfT FMZ aims to:
1. ‘Trial new mobility services, modes and models’ – by offering an integrated mobility service. 2. ‘Improve integration of services’ – by offering an integrated journey planning and ticketing offer. 3. ‘Increase the availability of real-time data’ – by integrating the Data Hub and MaaS Platform to
push real time journey data to users. 4. ‘Create a digital marketplace for mobility services’ – by creating a MaaS Platform and Open
APIs. 5. ‘Explore options for providing Mobility Credits, or other low-cost options for lower income
households’ – to improve access to employment
Innovativeness: This project is innovative in a number of ways:
1. MaaS is yet to be delivered commercially. We propose taking an open and collaborative approach with the market to co-develop a solution with full support of regional stakeholders – thus offering the greatest opportunity for success.
2. Our Mobility Credits offer the opportunity to test new mechanisms for incentivisation (e.g. using the MaaS app).

West of England Combined Authority – Future Mobility Zone – Final Proposal
15
B2.3.3 – Mobility stations
Project Details: Mobility Stations are physical multi-modal interchange points, integrating multiple modes and service offerings for end-users. CoMoUK, who are developing guidance on mobility points in the UK, identify five key characteristics:
1. A mobility start and transfer point. 2. Located at, or adjacent to, a place of recognisable local
economic / social activity. 3. More than one mobility mode connected in a smart way. 4. Be planned in a co-ordinated way as part of a network. 5. A redesign of space to reduce and regulate private car
space and improve access for pedestrians.
Mobility Stations will provide the first mile/last mile connectivity to the major bus, MetroBus and Rail services to provide end-to-end journeys for those travelling less than 5 miles by car, dramatically increasing the catchment areas and sustainable transport opportunities for those living and working in the areas.
A typical concept design for a Mobility Station is shown in Figure 621. For this project, we have developed two types of Mobility Station that we will deploy in different locations, as detailed Table 4.
The detailed specification of the services offered at each location will be developed with local communities and users, through our Living Lab approach.
The Mobility Stations will have a common branding style offering digital and physical integration of services.
Limited data on the impact of Mobility Stations is currently available; however, early indications are positive. For example, the city of Schoten in Belgium has seen an increase in the use of car sharing since the installation of the mobipunt Mobility Stations in June 2018 and has since enlarged its car share offer22. Our project aims to plug the evidence gap, collating evidence on the impact of Mobility Stations, and lessons learnt on how to implement them.
Table 4 – Mobility hubs and points
Mobility Hub Mobility Points
Deta
il Larger Mobility Stations, with a range of services
offered. This could be in a neighbourhood centre, linked to a train station, park and ride site or a major trip attractor (e.g. Southmead Hospital).
Smaller Mobility Stations, that serve local communities. These may just be a bus stop with appropriate branding and route information but could have additional services integrated.
Pro
po
sed
featu
res
• Integrated public transport services.
• Cycle parking infrastructure.
• Digital map and wayfinding.
• Micromobility options.
• EV charging for shared and/or private vehicles.
• Car share bays and vehicles.
• Drop-off/pick-up points, for passenger/logistics.
• A covered waiting area.
• Commercial facilities e.g. a cafe.
• Parcel locker/freight consolidation.
• Consistent branding.
• If located on a public transport route, public transport will be integrated.
• Services to connect users to public transport, including micromobility and DDRT.
• Cycle parking infrastructure – whether a Shef-field stand, secure covered storage or lockers.
• Static map and wayfinding information.
• Potential for parcel lockers/freight consolida-tion based on size.
Figure 6 – Concept design for a mobility station

West of England Combined Authority – Future Mobility Zone – Final Proposal
16
Locations: This project will be trialled in the Northern Arc; however subject to project success,
opportunities to deploy Mobility Stations and major transport hubs in Bristol and Bath will be explored.
Appendix 6 presents potential locations for Mobility Stations, based on preliminary analysis.
What will be learnt: Mobility Stations will be trialled to evaluate whether they:
1. Improve awareness and use of public transport and other modes such as car share. 2. Improve active travel services available to residents through simplification of service offering. 3. Improve connectivity across key areas. 4. Deliver a commercially sustainable model by, for example, offering other commercial services
such as local freight consolidation. 5. Help to improve local air quality, as has been found in trials in Europe.
The Mobility Stations project will also allow us to develop a method and an audit framework that can be used to identify new locations for future Mobility Stations and the services to be included.
Alignment to DfT’s aims: This project aligns to the DfT’s FMZ aim to ‘Improve integration of services’ by integrating transport services for end-users, helping to simplify the transport offer.
Innovativeness: The integration of modes of transport may not appear in itself innovative, however,
traditionally it has proved challenging operationally and commercially. This is reflected in the fact that
72% of trips in urban areas by car are under five miles despite significant investment in local bus and
rail23. The innovation in our FMZ will be to mesh new transport modes and services with the investment
through TCF in MetroBus and Rail. Linked to this, Mobility Stations offer an opportunity to bring
stakeholders together to reimagine how mobility services can be offered and work collaboratively to
deliver.
Innovation also lies in integrating the physical Mobility Stations with the digital MaaS offering, providing
a coherent end-to-end service for transport users through a consistent brand. The Data Hub will enable
service providers to ensure coordinated timetables so that interchanges are seamless and wait times
kept to an absolute minimum.
B2.3.4 – DDRT
Project Details: DDRT will be used to provide efficient public transport alternatives where conventional bus and rail services cannot offer viable services – in terms of geography and/time of operation. These services will open up the catchment areas for public transport providing the first mile/last mile connectivity to bus and rail hubs and employment/services that are located away from the main public transport corridors. DDRT will also enable previously unfeasible journeys, due to poor accessibility.
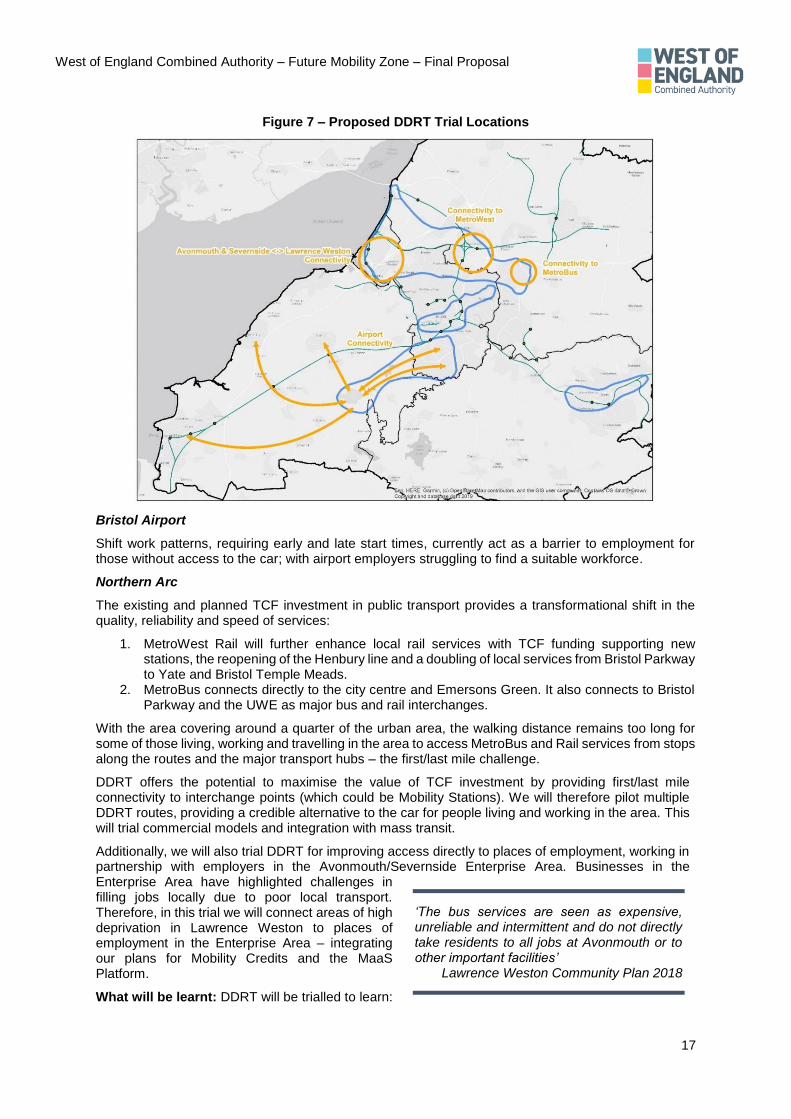
Locations: The DDRT project will be trialled for access to Bristol Airport and for first/last mile
connectivity in the Northern Arc, as shown in Figure 7.
West of England Combined Authority – Future Mobility Zone – Final Proposal
17
Figure 7 – Proposed DDRT Trial Locations
Bristol Airport
Shift work patterns, requiring early and late start times, currently act as a barrier to employment for those without access to the car; with airport employers struggling to find a suitable workforce.
Northern Arc
The existing and planned TCF investment in public transport provides a transformational shift in the quality, reliability and speed of services:
1. MetroWest Rail will further enhance local rail services with TCF funding supporting new stations, the reopening of the Henbury line and a doubling of local services from Bristol Parkway to Yate and Bristol Temple Meads.
2. MetroBus connects directly to the city centre and Emersons Green. It also connects to Bristol Parkway and the UWE as major bus and rail interchanges.
With the area covering around a quarter of the urban area, the walking distance remains too long for some of those living, working and travelling in the area to access MetroBus and Rail services from stops along the routes and the major transport hubs – the first/last mile challenge.
DDRT offers the potential to maximise the value of TCF investment by providing first/last mile connectivity to interchange points (which could be Mobility Stations). We will therefore pilot multiple DDRT routes, providing a credible alternative to the car for people living and working in the area. This will trial commercial models and integration with mass transit.
Additionally, we will also trial DDRT for improving access directly to places of employment, working in partnership with employers in the Avonmouth/Severnside Enterprise Area. Businesses in the Enterprise Area have highlighted challenges in filling jobs locally due to poor local transport. Therefore, in this trial we will connect areas of high deprivation in Lawrence Weston to places of employment in the Enterprise Area – integrating our plans for Mobility Credits and the MaaS Platform.
What will be learnt: DDRT will be trialled to learn:
‘The bus services are seen as expensive, unreliable and intermittent and do not directly take residents to all jobs at Avonmouth or to other important facilities’
Lawrence Weston Community Plan 2018

West of England Combined Authority – Future Mobility Zone – Final Proposal
18
1. How DDRT can best integrate with existing public transport services, maximising vehicle and public transport occupancy rates.
2. How DDRT can lead to long-term behavioural change away from car use. 3. The optimal models to deliver a commercially sustainable service. 4. The appropriate software and integration required across services, including integration
with MaaS.
5. How DDRT can support access to employment locations, including the commercial model.
Alignment to DfT’s aims: The DDRT project aligns to the DfT’s FMZ aim to ‘explore options for delivering efficiencies through shared (dynamic) demand responsive transport’.
Innovativeness: Demand responsive transport has already been piloted by First in the West of
England. However, there are a number of elements of innovation within our project:
1. Cutting edge routing software will be utilised to dynamically and efficiently allocate trips and
route vehicles, ensuring optimal utilisation with a goal of commercial sustainability.
2. We aim to integrate DDRT within our MaaS Platform and Mobility Stations, offering a digitally
and physically integrated consumer offering. Through the MaaS Platform, Mobility Credits for
DDRT travel will be an option for some consumers (as detailed in Section B2.3.2).
3. Utilising CAV technologies to run a service will be a truly innovative approach and may help
with the commercial viability challenges of running a service.
B2.3.5 – Micromobility
Project Details: The West of England recognises the potential for micromobility services to improve first/last mile connectivity; plugging short-distance gaps in public transport provision; and offering more sustainable logistics solutions. When integrated with other sustainable modes, micromobility offers the opportunity of supporting mode shift from private single-occupier cars – delivering congestion and air quality benefits. This includes both shared and privately-owned micromobility modes. However, there are significant gaps in evidence as to their impact, safety, commercial models and the role of the public sector in realising them.
The West of England FMZ will therefore trial a range of shared micromobility solutions. Given the range of vehicle types this covers, and different levels of market and public interest, we are mode agnostic. We wish to see a range of modes trialled to collate evidence on the outcomes that each can deliver. We also recognise that some micromobility solutions do not need public sector financing – such as bike share schemes which already operate commercially – and will therefore focus our FMZ funding where public sector involvement is most required. Finally, we will ensure that schemes are carefully designed to complement and not undermine active travel.
Under this project, we will focus on three core workstreams, as set out in Table 5.
Table 5 – Micromobility workstreams
Sub-project Activity
Policy framework and strategy for micromobility
We will develop a regional strategy for micromobility, and a policy framework for providers to work within (either voluntarily or through regulation, depending on the vehicle type). This will give clarity and guidance for the market.
E-cargo bike trial in central Bath and central Bristol
We will work with a provider to run e-cargo bike trials to help reduce the number of car/van-based freight and servicing trips within congested areas. This will help with congestion and air quality challenges and align with Clean Air proposals. E-cargo bikes could be made available to logistic companies and local businesses, with the goal of creating a commercially sustainable model.
E-scooter trial We will review the regulatory regime and aim to run a private-site trial, working with a mobility provider. In the long-term we aim to work with DfT to create an environment for public-road testing using potential routes/trial areas, as presented in Appendix 8. We will work with DfT, the market, stakeholders and local communities to ensure safe user-led trials.

West of England Combined Authority – Future Mobility Zone – Final Proposal
19
Sub-project Activity
The objectives of such a trial would include:
• Improving connectivity and access to employment.
• Understanding the safety implications of e-scooters.
• Understand the required regulatory and policy environment.
• Understanding wider impacts and outcomes.
Locations: The project will focus on the three areas of central Bath, central Bristol and the Northern
Arc, but will not be limited to these areas to allow the market to opt for other locations.
What will be learnt: Innovative micromobility schemes will be trialled to evaluate whether they:
1. Improve connectivity by offering new modes integrated with public transport services. A key test will be monitoring whether long-term behavioural and modal change can be achieved.
2. Lead to wider impacts and outcomes, including road safety, congestion and air quality. 3. Can be delivered through a commercially sustainable model. 4. Do not undermine active travel.
We will also use the trials to understand the required regulatory and policy environment.
Alignment to DfT’s aims: The micromobility trial aligns to the DfT’s FMZ aim to ‘Trial new mobility services, modes and models’.
Innovativeness: Innovative aspects of this project include:
1. Integrating new micromobility modes into local transport policy, integrating it with public transport, utilising the evidence developed through our proposed trials.
2. An e-scooter trial will be highly innovative and will bring significant transferability opportunities.
B2.3.6 – Project summary
Table 6 summarises the planned delivery of projects in each area in the FMZ.
Table 6 – Alignment of projects to each FMZ area
Central
Bristol
Central Bath Northern Arc Bristol Airport
Data Hub ✔ Digital asset common across all areas ✔
MaaS Platform ✔ Digital asset common across all areas ✔
Mobility Stations ✔
Micromobility ✔ ✔ ✔
DDRT ✔ ✔
Micromobility ✔ ✔ ✔
We recognise the uncertainty in the innovation space, and that during the FMZ, new innovations may emerge for testing and development. Therefore, we have identified budget that may cover additional activities such as:
1. Enhancements to the identified projects,
such as purchasing CAV technologies for op-
erating the DDRT project.
2. Regulatory reviews and changes that may be
required to enable e-scooters and CAVs.
3. Trialling of new concepts such as urban air
mobility, drawing on capabilities in the region
from Airbus and Vertical Aerospace.
Urban Air Mobility
Congestion of our existing transport networks is a growing issue and emerging technologies offer an innovative solution – taking urban transportation skyward, utilising Electric Vertical Take-off and Landing (eVTOL) aircraft. With a strong engineering and aerospace heritage, the West of England could be well positioned to research and trial this technology as the market develops.

West of England Combined Authority – Future Mobility Zone – Final Proposal
20
B2.4 – Innovativeness
In addition to the innovative nature of each project (as outlined for each project in Section B2.3), overall our FMZ approach has a number of innovative aspects, as set out in Figure 8.
Figure 8 – Innovativeness of the West of England FMZ
B2.5 – FMZ principles
We have considered the challenges and opportunities around the evolution of the mobility marketplace, engaging with stakeholders and the market. This included a ‘Market for Mobility’ workshop where we considered our approach to delivering the FMZ and projects, and what the role of WECA and its constituent councils should be.
We determined that WECA will take an enabling role to support delivery by the market, and put in place the required policy, strategy and frameworks to ensure solutions deliver on our strategic transport objectives whilst facilitating innovation and increased chances of commercial success. We will work with DfT and other FMZs to identify and share lessons on addressing market failures or issues, such as monopolisation.
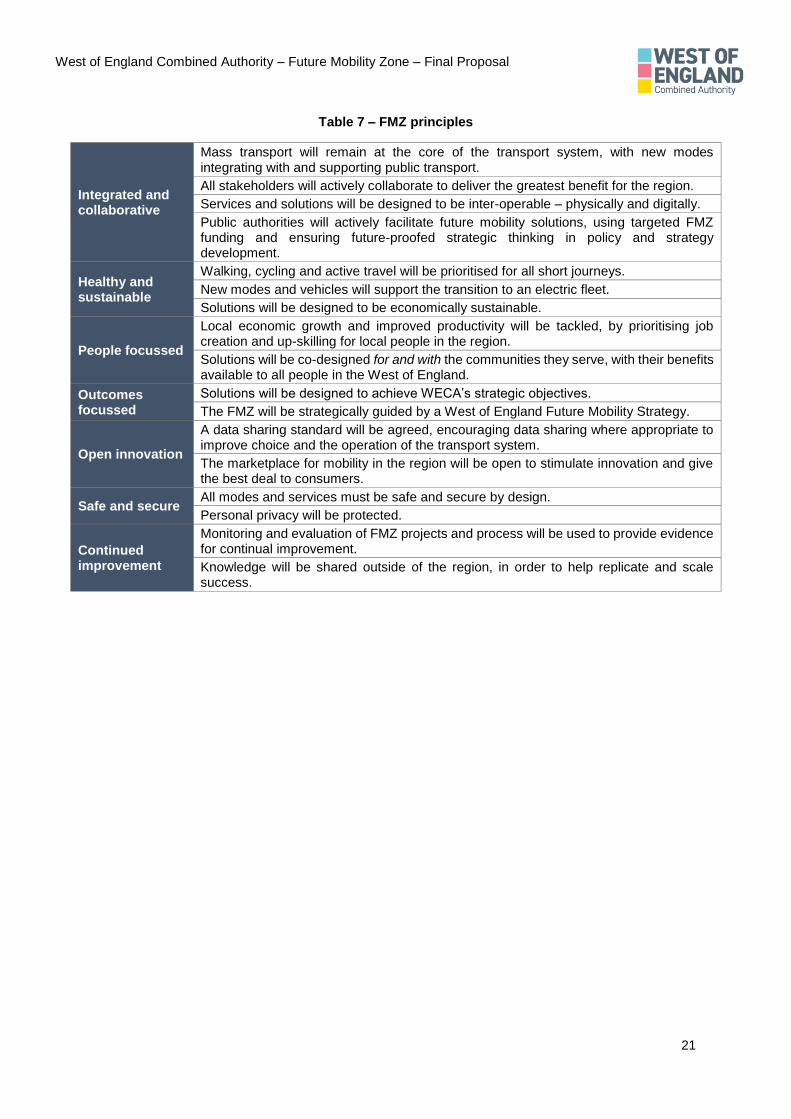
As part of this, we have agreed on a set of principles that will guide our FMZ, as set out in Table 7. We have strong support for working to these principles from stakeholders.
•The Data Hub and MaaS Platform will act as the digital integration point for allservices complemented by Mobility Stations and DDRT. This will enable us to testwhether an integrated and easy to use service is able to deliver a long-term shifttowards active and public transport modes.
Integration
•Our Living Lab approach will ensure solutions are co-developed and co-designed withthe communities they serve, as well as delivery partners and key regionalstakeholders. This innovative approach aims to ensure services are appropriatelydesigned, and adopted by consumers.
Living Lab
•Local, national and international stakeholders have been working togethercollaboratively on our FMZ proposals, opening up opportunities for innvovativedelivery and commercial models.
Market support
•We are taking an iterative approach to project testing, looking to test, evaluate, refineand re-test through a series of trials. This allows us to test different commerical andoperational models to collate evidence of the efficacy of new modes or services.
Iteration
West of England Combined Authority – Future Mobility Zone – Final Proposal
21
Table 7 – FMZ principles
Integrated and collaborative
Mass transport will remain at the core of the transport system, with new modes integrating with and supporting public transport.
All stakeholders will actively collaborate to deliver the greatest benefit for the region.
Services and solutions will be designed to be inter-operable – physically and digitally.
Public authorities will actively facilitate future mobility solutions, using targeted FMZ funding and ensuring future-proofed strategic thinking in policy and strategy development.
Healthy and sustainable
Walking, cycling and active travel will be prioritised for all short journeys.
New modes and vehicles will support the transition to an electric fleet.
Solutions will be designed to be economically sustainable.
People focussed
Local economic growth and improved productivity will be tackled, by prioritising job creation and up-skilling for local people in the region.
Solutions will be co-designed for and with the communities they serve, with their benefits available to all people in the West of England.
Outcomes focussed
Solutions will be designed to achieve WECA’s strategic objectives.
The FMZ will be strategically guided by a West of England Future Mobility Strategy.
Open innovation
A data sharing standard will be agreed, encouraging data sharing where appropriate to improve choice and the operation of the transport system.
The marketplace for mobility in the region will be open to stimulate innovation and give the best deal to consumers.
Safe and secure All modes and services must be safe and secure by design.
Personal privacy will be protected.
Continued improvement
Monitoring and evaluation of FMZ projects and process will be used to provide evidence for continual improvement.
Knowledge will be shared outside of the region, in order to help replicate and scale success.

West of England Combined Authority – Future Mobility Zone – Final Proposal
22
Figure 9 – Data Hub logic map

West of England Combined Authority – Future Mobility Zone – Final Proposal
23
Figure 10 – MaaS Platform logic map
West of England Combined Authority – Future Mobility Zone – Final Proposal
24
Figure 11 – Mobility Station logic map

West of England Combined Authority – Future Mobility Zone – Final Proposal
25
Figure 12 – DDRT logic map

West of England Combined Authority – Future Mobility Zone – Final Proposal
26
Figure 13 – Micromobility logic map

West of England Combined Authority – Future Mobility Zone – Final Proposal
27
SECTION C – The Economic Case
C1. The Economic Case – Government funding
C1.1 Why government funding is needed for the West of England FMZ
Government funding is needed for the West of England FMZ in order to:
1. Trial, collate evidence and evaluate the impact and outcomes of new transport modes, models and services, and their integration to the wider transport network. The results of this will inform future roll-out, legislation, policy, strategy, projects and investment including an evidenced backed West of England Future Mobility Strategy.
2. Stimulate market activity, catalysing new collaborations between transport operators, technology companies and other innovators. FMZ funding de-risks investment in innovation, overcoming the considerable commercial risks with new mobility modes and services in the deregulated public transport environment outside of London.
3. Ensure that future mobility solutions align with policy aims supporting sustainable and inclusive economic growth (West of England Joint Transport Study (2017), One City Plan (2019)).
4. Deliver a Living Lab approach, using a co-design process which will ensure solutions meet real needs and requirements and will therefore be self-sustaining in the future.
5. Prioritise user benefits and ensure equitable access, as WECA has a duty of care to ensure fair access, particularly to vulnerable user groups. The distribution of impacts could be negatively impacted if the projects were to be solely funded by the private sector, as the priority would be to develop projects in areas that are likely to become profitable sooner.
The private sector is unable to fund the FMZ for various reasons:
1. The fact that successful models do not currently exist in the market suggests that more research and innovation is needed before there is a viable commercial model for the private sector.
2. Even once viable commercial models and profitability potentials emerge, it is likely that private sector led initiatives or partnerships between private sector players would be self-selecting in ways that may bias the types of services and user groups served.
3. The private sector has greater expertise in specific areas of innovation, but need public sector leadership and direction to deliver innovation at this scale. The participation of stakeholders will enable projects to build on lessons already learned. The expertise of the private sector will accelerate the progress, such as with Bristol API.
4. Private sector funding may limit the opportunity to collate and disseminative evidence on the impact, outcomes and lessons learnt of projects.
If government funding was not available, we would expect the following to occur:
1. Our ambitions to investigate and test new transport modes, models and services would be significantly scaled back and delivered over a much longer timeframe. Evidence on future mobility solutions would be curtailed, and we would likely take a reactive response waiting on ‘unstimulated’ movement in the market and other areas to share their learnings.
2. Private sector investment would be limited, and at a slower pace than without FMZ investment. This will reduce the pace of innovation and testing needed to grow the market for mobility.
3. In-kind benefit from our academic partners would not emerge. For our academic partners, this would erode their ability to compete on a global stage for leadership in future mobility solutions. FMZ funding enhances BRL’s simulation capabilities and UWE’s human centred research.
4. Wider investment from international mobility operators would be unlikely to emerge. This would impact on job creation for the region.
5. In the long-term, our ability to deliver 105,500 new homes and 82,500 jobs by 2036 could be challenged, as we will lack evidence and understanding of the future mobility solutions that will help unlock additional capacity from our transport assets.
6. High levels of deprivation in areas with poor public transport accessibility and low levels of car ownership will continue to limit economic growth. People living in such areas will not benefit from improved access to employment that is planned as a key outcome of our FMZ.
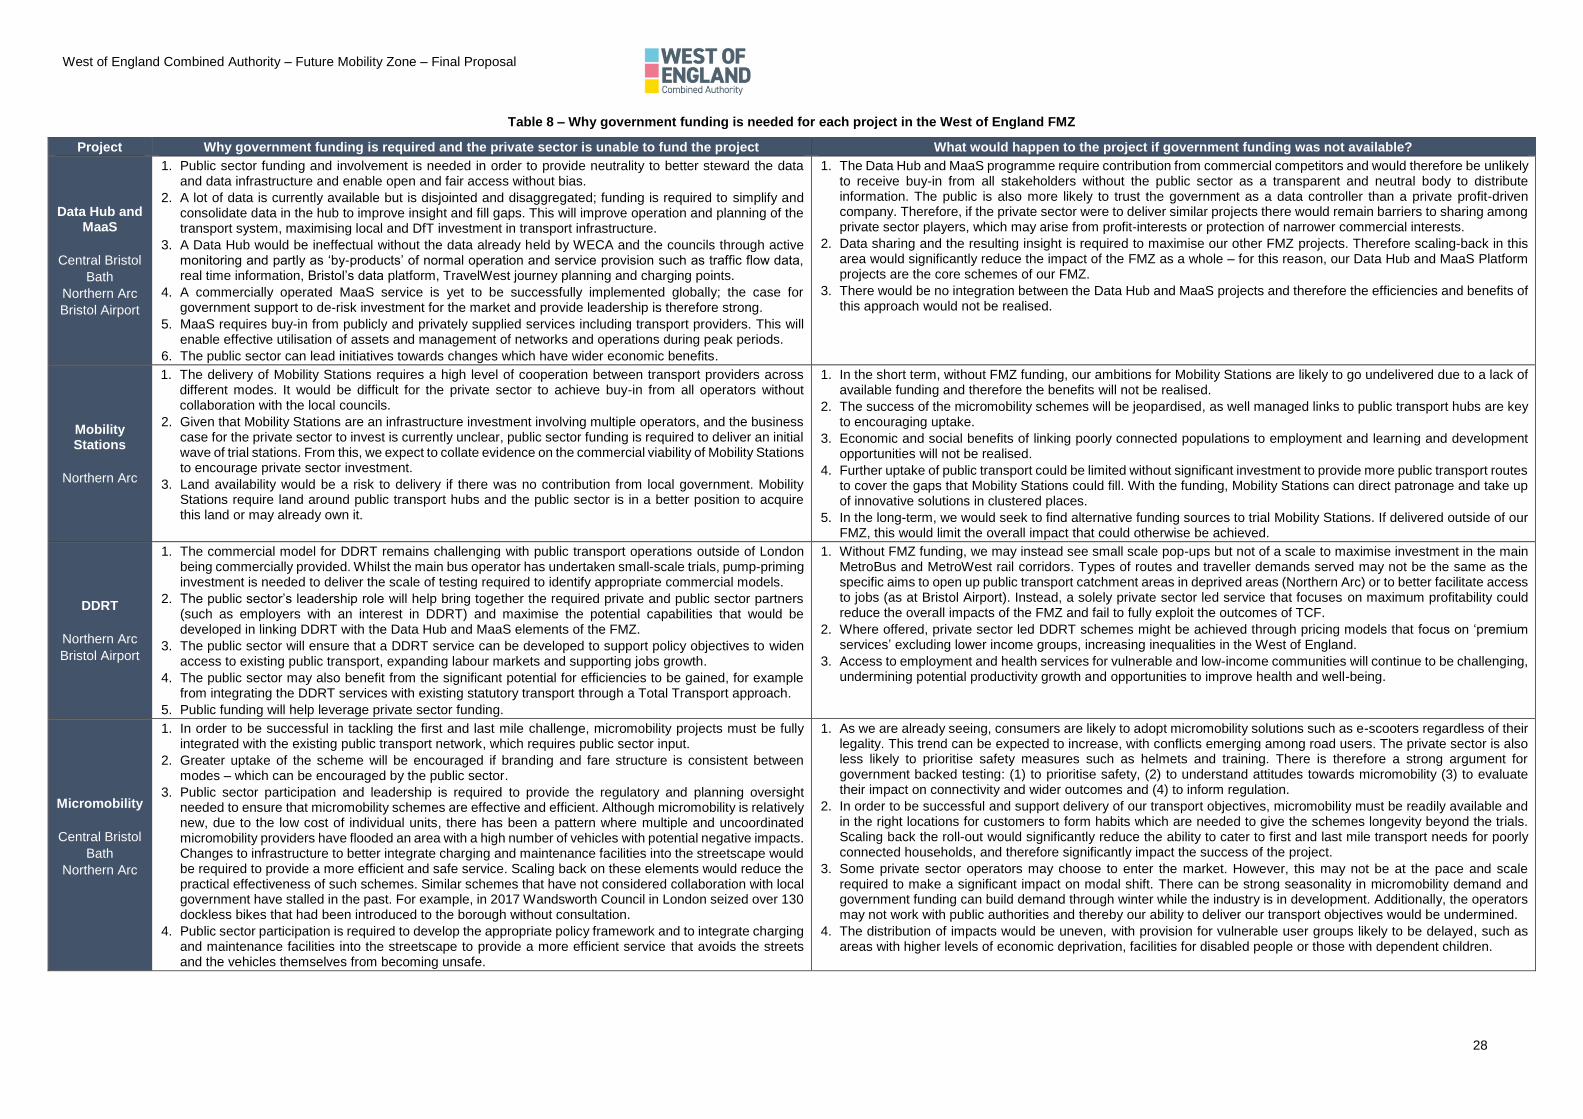
C1.2 Why government funding is needed for each project in the West of England FMZ
Table 8 explains why government funding is needed for each project in our FMZ.
West of England Combined Authority – Future Mobility Zone – Final Proposal
28
Table 8 – Why government funding is needed for each project in the West of England FMZ
Project Why government funding is required and the private sector is unable to fund the project What would happen to the project if government funding was not available?
Data Hub and MaaS
Central Bristol
Bath
Northern Arc
Bristol Airport
1. Public sector funding and involvement is needed in order to provide neutrality to better steward the data and data infrastructure and enable open and fair access without bias.
2. A lot of data is currently available but is disjointed and disaggregated; funding is required to simplify and consolidate data in the hub to improve insight and fill gaps. This will improve operation and planning of the transport system, maximising local and DfT investment in transport infrastructure.
3. A Data Hub would be ineffectual without the data already held by WECA and the councils through active monitoring and partly as ‘by-products’ of normal operation and service provision such as traffic flow data, real time information, Bristol’s data platform, TravelWest journey planning and charging points.
4. A commercially operated MaaS service is yet to be successfully implemented globally; the case for government support to de-risk investment for the market and provide leadership is therefore strong.
5. MaaS requires buy-in from publicly and privately supplied services including transport providers. This will enable effective utilisation of assets and management of networks and operations during peak periods.
6. The public sector can lead initiatives towards changes which have wider economic benefits.
1. The Data Hub and MaaS programme require contribution from commercial competitors and would therefore be unlikely to receive buy-in from all stakeholders without the public sector as a transparent and neutral body to distribute information. The public is also more likely to trust the government as a data controller than a private profit-driven company. Therefore, if the private sector were to deliver similar projects there would remain barriers to sharing among private sector players, which may arise from profit-interests or protection of narrower commercial interests.
2. Data sharing and the resulting insight is required to maximise our other FMZ projects. Therefore scaling-back in this area would significantly reduce the impact of the FMZ as a whole – for this reason, our Data Hub and MaaS Platform projects are the core schemes of our FMZ.
3. There would be no integration between the Data Hub and MaaS projects and therefore the efficiencies and benefits of this approach would not be realised.
Mobility Stations
Northern Arc
1. The delivery of Mobility Stations requires a high level of cooperation between transport providers across different modes. It would be difficult for the private sector to achieve buy-in from all operators without collaboration with the local councils.
2. Given that Mobility Stations are an infrastructure investment involving multiple operators, and the business case for the private sector to invest is currently unclear, public sector funding is required to deliver an initial wave of trial stations. From this, we expect to collate evidence on the commercial viability of Mobility Stations to encourage private sector investment.
3. Land availability would be a risk to delivery if there was no contribution from local government. Mobility Stations require land around public transport hubs and the public sector is in a better position to acquire this land or may already own it.
1. In the short term, without FMZ funding, our ambitions for Mobility Stations are likely to go undelivered due to a lack of available funding and therefore the benefits will not be realised.
2. The success of the micromobility schemes will be jeopardised, as well managed links to public transport hubs are key to encouraging uptake.
3. Economic and social benefits of linking poorly connected populations to employment and learning and development opportunities will not be realised.
4. Further uptake of public transport could be limited without significant investment to provide more public transport routes to cover the gaps that Mobility Stations could fill. With the funding, Mobility Stations can direct patronage and take up of innovative solutions in clustered places.
5. In the long-term, we would seek to find alternative funding sources to trial Mobility Stations. If delivered outside of our FMZ, this would limit the overall impact that could otherwise be achieved.
DDRT
Northern Arc
Bristol Airport
1. The commercial model for DDRT remains challenging with public transport operations outside of London being commercially provided. Whilst the main bus operator has undertaken small-scale trials, pump-priming investment is needed to deliver the scale of testing required to identify appropriate commercial models.
2. The public sector’s leadership role will help bring together the required private and public sector partners (such as employers with an interest in DDRT) and maximise the potential capabilities that would be developed in linking DDRT with the Data Hub and MaaS elements of the FMZ.
3. The public sector will ensure that a DDRT service can be developed to support policy objectives to widen access to existing public transport, expanding labour markets and supporting jobs growth.
4. The public sector may also benefit from the significant potential for efficiencies to be gained, for example from integrating the DDRT services with existing statutory transport through a Total Transport approach.
5. Public funding will help leverage private sector funding.
1. Without FMZ funding, we may instead see small scale pop-ups but not of a scale to maximise investment in the main MetroBus and MetroWest rail corridors. Types of routes and traveller demands served may not be the same as the specific aims to open up public transport catchment areas in deprived areas (Northern Arc) or to better facilitate access to jobs (as at Bristol Airport). Instead, a solely private sector led service that focuses on maximum profitability could reduce the overall impacts of the FMZ and fail to fully exploit the outcomes of TCF.
2. Where offered, private sector led DDRT schemes might be achieved through pricing models that focus on ‘premium services’ excluding lower income groups, increasing inequalities in the West of England.
3. Access to employment and health services for vulnerable and low-income communities will continue to be challenging, undermining potential productivity growth and opportunities to improve health and well-being.
Micromobility
Central Bristol
Bath
Northern Arc
1. In order to be successful in tackling the first and last mile challenge, micromobility projects must be fully integrated with the existing public transport network, which requires public sector input.
2. Greater uptake of the scheme will be encouraged if branding and fare structure is consistent between modes – which can be encouraged by the public sector.
3. Public sector participation and leadership is required to provide the regulatory and planning oversight needed to ensure that micromobility schemes are effective and efficient. Although micromobility is relatively new, due to the low cost of individual units, there has been a pattern where multiple and uncoordinated micromobility providers have flooded an area with a high number of vehicles with potential negative impacts. Changes to infrastructure to better integrate charging and maintenance facilities into the streetscape would be required to provide a more efficient and safe service. Scaling back on these elements would reduce the practical effectiveness of such schemes. Similar schemes that have not considered collaboration with local government have stalled in the past. For example, in 2017 Wandsworth Council in London seized over 130 dockless bikes that had been introduced to the borough without consultation.
4. Public sector participation is required to develop the appropriate policy framework and to integrate charging and maintenance facilities into the streetscape to provide a more efficient service that avoids the streets and the vehicles themselves from becoming unsafe.
1. As we are already seeing, consumers are likely to adopt micromobility solutions such as e-scooters regardless of their legality. This trend can be expected to increase, with conflicts emerging among road users. The private sector is also less likely to prioritise safety measures such as helmets and training. There is therefore a strong argument for government backed testing: (1) to prioritise safety, (2) to understand attitudes towards micromobility (3) to evaluate their impact on connectivity and wider outcomes and (4) to inform regulation.
2. In order to be successful and support delivery of our transport objectives, micromobility must be readily available and in the right locations for customers to form habits which are needed to give the schemes longevity beyond the trials. Scaling back the roll-out would significantly reduce the ability to cater to first and last mile transport needs for poorly connected households, and therefore significantly impact the success of the project.
3. Some private sector operators may choose to enter the market. However, this may not be at the pace and scale required to make a significant impact on modal shift. There can be strong seasonality in micromobility demand and government funding can build demand through winter while the industry is in development. Additionally, the operators may not work with public authorities and thereby our ability to deliver our transport objectives would be undermined.
4. The distribution of impacts would be uneven, with provision for vulnerable user groups likely to be delayed, such as areas with higher levels of economic deprivation, facilities for disabled people or those with dependent children.

West of England Combined Authority – Future Mobility Zone – Final Proposal
29
C2. The Economic Case – Benefits to transport users and wider society
In this section we present the benefits to users and wider society that will be achieved from each of our FMZ projects, which is summarised in Table 9. To support this, we have produced a logic map for each project, as shown in Figure 9 to Figure 13. The logic maps illustrate the context, inputs, activities, outputs, outcomes and impacts expected of each project1. Through the logic maps, we have identified how the expected outcomes and impacts will materialise. Social impacts and consideration of how impacts may be distributed among vulnerable groups are discussed in relation to the projects where relevant.
Above and beyond the project level impacts, the overall benefits of FMZ will be to increase the scale of modal shift with air quality, carbon, safety, noise and health benefits. In the context of economic growth, wider roll-out of FMZ will have a significant impact on the ability to have greater densities of housing and employment growth. We estimate that a 15% increase in public transport from an area wide expansion of FMZ scheme could support an increase in densification of housing by up to 5,000 new homes.
Table 9 – Summary of Users and Benefits from the FMZ Projects
Project User Segments Expected user benefits and
benefits to wider society Benefits to low-income
households
Data Hub and MaaS
• Transport authorities
• Service providers and operators
• Public transport and vehicle users
• Commuters
• Low-income groups
• Journey time savings and improved journey time reliability
• Increased patronage and decrease in cost of travel
• Option values
• Improved user information
• Improved network resilience
• Better planning of transport services and infrastructure
• Better information and new services leading to improved accessibility
• Improved affordability due to Mobility Credits
• Connectivity to jobs and reduction in deprivation levels
Mobility Stations
• Business users and commuters
• Vulnerable user groups including women, older people and people with disabilities
• Transport operators
• Active mode users
• Air quality benefits
• Increased growth and resilience of the local economy
• Improved access to active modes
• Improved first/last mile connectivity
• Improved journey quality
• Revitalised public realm
• Security benefits
• Improved access to affordable modes
• Urban regeneration
• Improved connectivity to jobs and skills
• Improved local services and facilities
DDRT • Commuters
• Business users
• Users without access to a vehicle
• Users with limited mobility
• Active mode users
• Affordability benefits
• Reduction in private car use
• Accessibility benefits – increased access to bus, MetroBus and rail corridors
• Journey time reliability
• Air quality benefits
• Public realm improvements
• Improved accessibility to jobs and skills
• Increased affordable mode options
Micromobility • Active mode users
• Public transport users
• People without access to a vehicle
• Low-income households
• Jobseekers
• Journey time reliability
• Access to shops and services
• Air quality
• Road safety
• Health benefits
• Severance
• Improved access to employment, services and recreation facilities
• Air quality benefits
• Improved first and last mile connectivity
1 For the purposes of our submission, we define the terms “Process evaluation” as judging whether the projects’ activities are
being implemented as intended and whether the activities are having the intended results; and “Economic evaluation” as measuring the effects in the target population by assessing the outcomes against objectives.

West of England Combined Authority – Future Mobility Zone – Final Proposal
30
C2.1 Data Hub and MaaS Platform
Within our Strategic Case, the Data Hub and MaaS Platform projects were presented as separate projects. Given that they are intrinsically linked, and following feedback from the DfT, we have combined the two projects for our Economic Case analysis.
The user segments we expect to benefit the most from the Data Hub and MaaS Platform are: (1) transport authorities, (2) service providers and operators, (3) commuters (4) public transport and vehicle users and (5) low-income groups, as set out below.
Impacts and benefits for transport authorities
1. Better understanding of transport demand and supply: Bringing together, normalising and harmonising existing and new data inputs will provide insight into transport demand and supply that enable WECA and transport authorities to respond and improve the planning of the transport system.
2. A more resilient network through improved network management: The Data Hub and its analytics, enhanced by the creation of a Digital Twin of the wider region, will enable better monitoring of network performance to respond to disruptions in real time.
3. Improved scenario testing: The Digital Twin will enable simulations of proposed interventions for richer analysis of their likely effectiveness.
Impacts and benefits for service providers and operators (private or public)
1. Better utilisation of existing assets: The Data Hub will enable a more detailed and holistic understanding of travel movements and mode choice, thus enabling operators to better plan service provision and use of limited assets. This will result in higher utilisation of the transport fleet, increasing the commercial viability of services. Through this, it will support further commercial scaling up of peak-hour operations to support the increasing need for sustainable travel in the West of England with the higher utilisation of both peak and off-peak fleet.
2. Exploiting opportunities to offer new services where there is unmet demand: The insight gained from the Data Hub will enable authorities and operators to identify opportunities to provide more efficient public transport services and meet demand. In addition to existing unmet demand, a 25% increase in demand for movement is anticipated by 2036 as a result of the provision of new homes and jobs outlined in the Local Plans. Data Hub information will enable service providers to effectively provide for new demand and efficiently distribute resources.
3. Growth in public transport patronage that continues the 50% increase in bus patronage in the last five years: As an indication of the scale of shift possible, the 2011 Census revealed that 69,200 daily journeys to work by car or van originate in the FMZ areas. There has been mode shift in the intervening years since 2011, but continuing problems with severe road congestion during peak periods throughout the region suggest significant scope for further mode shift. This is a key goal of operators such as First, to target mode shift, and lessons from our LSTF projects show that this can be achieved through improved customer information and integrated ticketing (delivered through the MaaS Platform) and well-designed services (enabled using data from the Data Hub).
Impacts and benefits for commuters
1. The West of England Travel to Work Survey 2018 found that 47% of the 22,536 survey respondents were not satisfied with their journey from work. Two of the most significant areas of complaint for commuters in the region were congestion and the need for better traffic management, infrastructure and accessibility. The Data Hub and MaaS will enable better network management leading to reduced congestion particularly during commuting peaks.
2. Evidence from TfL’s open data approach shows that open data can help integrate the first- and last-mile, encouraging alternative transport modes including cycling and walking, which has health benefits24.
3. In the longer term, sustained behaviour change, and mode shift away from single occupancy vehicle travel will further reduce congestion, delivering travel time savings, improved journey reliability and air quality benefits.
West of England Combined Authority – Future Mobility Zone – Final Proposal
31
Impacts and benefits for public transport and vehicle users
1. The MaaS Platform will offer an integrated, seamless end-to-end journey experience for all transport users regardless of their journey purpose, which will deliver immediate benefits including: o Enhanced information and customer service, by offering a personalised journey planner
which delivers real time updates and integrated ticketing. o Increased choice of services with a range of modes and services, which will be integrated
enabling more efficient multi-modal journeys. o Improved transport accessibility, as users will have a clear view of the transport modes
available to them – building on the successful TravelWest journey planner which was used by 19% of the 22,536 respondents of the 2019 West of England Travel to work survey.
2. We expect public transport users to see long-term benefits associated with journey time savings, as the real-time journey planner will optimise user journeys. This is expected to impact around 16,400 public transport commuters across the four FMZ zones (Census 2011), which will increase as public transport patronage increases.
3. The multi-modal nature of the MaaS service will enable people travelling on public transport or active modes to make journeys that they previously would not have made due to hard to understand information or perceived barriers. This will be maximised through delivery of our micromobility and DDRT projects, which will plug gaps in public transport and facilitate first/last mile connectivity. This will result in much larger catchment areas for the main bus, MetroBus and Rail corridors benefiting from TCF investment, maximising access and use of our mass-transit corridors.
Impacts and benefits for wider society
1. Unlocking housing and employment planning applications: Increasing accessibility of existing and key employment and housing growth sites by sustainable transport will increase the confidence for the private sector to invest and for planning authorities to approve planning applications. This will help deliver our housing and employment targets sustainably.
2. Economic benefit: Wider research by the Open Data Institute indicates that ‘across all core public sector data assets open data will provide 0.5% of GDP more economic value every year than data that users have to pay for’25.
3. Carbon reduction and Air quality improvements in support of objectives underpinning WECA’s declaration of a Climate Emergency. The MaaS Platform and analytics from the Data Hub will be designed to encourage reductions in single occupancy car trips as far as possible in favour of public transport and active modes. This will help reduce harmful emissions which currently result in approximately 300 deaths each year in Bristol attributable to air pollution26 and reducing the level of greenhouse gases from travel across the West of England.
4. Improved public health: The MaaS Platform will offer nudges that will encourage behaviour change away from single occupancy car trips. Long-term behaviour change that results in reduced highway congestion will contribute to improved air quality; and increases in active travel among the population will have positive impacts on their physical health.
5. Option values: The Data Hub will enable further innovation that leads to the creation of new journey options for travellers. In the short term, the MaaS Platform will improve awareness of the breadth of options currently available which will reduce traveller stress and give users greater confidence to choose public transport over private car. It also creates the opportunities for providers to offer incentives to car users to delay or avoid travelling when major incidents occur on the network – every car trip deterred from entering the network during incidents will speed up the return to normal conditions.
Impacts and benefits for low-income households
1. MaaS will improve access to public and active transport modes for all communities, and will ensure that those on a low-income know of the transport options available to them – this is important given that 66,800 people in the FMZ areas live within the 10% most deprived LSOAs in the UK27.
2. MaaS will be the consumer face of our Mobility Credits scheme which will be used to improve access to employment from areas of multiple deprivation. This should lead to benefits from job creation and retention which will benefit the 4,810 long-term unemployed in FMZ zones28.

West of England Combined Authority – Future Mobility Zone – Final Proposal
32
3. Improved transport accessibility resulting from the MaaS Platform may lead to reduced need for car ownership, and corresponding expenses. A study in London found that users switching from car to public transport saved on average £1.60 per journey29.
4. Improved accessibility is known to lead to improved well-being and reduced social exclusion, a serious issue in areas such as Lawrence Weston (targeted for our Mobility Credits scheme) which Age UK ranks as being in the highest 2% of areas nationally for risk of loneliness30.
Managing the risks of benefits not materialising
The key risks around behaviour change and whether the anticipated scales of benefits materialise include:
1. Data sharing between transport operators and other private sector data owners. 2. Data quality, interoperability and compatibility. 3. Adoption of the open data and MaaS Platform by operators and service providers. 4. Transport user uptake of MaaS Platform. 5. Resilience of the Data Hub and MaaS Platform (including cyber-security).
To help manage these risks, we will take a user centred design approach through our Living Lab, with all projects co-designed and co-developed with the communities and users they serve. This will help to reduce the risk of low uptake and support overall project success, by ensuring that solutions meet real needs and requirements. To encourage data sharing and minimise the risks that the outputs of the Data Hub are not used by authorities or operators, we have already started to engage with operators and the constituent local authorities to establish partnerships and discuss regulatory challenges and how to overcome these, as well as engaging all stakeholders to help define the most relevant use cases and applications of data. For the MaaS Platform, user engagement and extensive marketing and branding will help to ensure uptake, building from the successful TravelWest brand.
In the delivery phase, our iterative approach to testing and evaluation will allow for identification of any issues that might occur and give opportunities to change the approach. This includes the risk that the impacts and benefits expected of the Data Hub and MaaS Platform do not materialise – or unintended negative impacts occur. This feedback loop will allow for alternative scenarios and solutions to be tested, with a goal of achieving commercially sustainable services that meet user needs and support the region’s strategic transport objectives.
C2.2 Mobility Stations
Mobility Stations are physical interchange points, integrating multiple modes and service offerings including MetroBus, micromobility, electric vehicle charging, car sharing, cycle parking and freight consolidation as described in section B2.3.3. Mobility Stations will have a common branding and will be digitally integrated with the MaaS project. There will be two types of station: (1) Mobility Points serving local communities and (2) Mobility Hubs at larger interchange points.
The user segments we expect to benefit the most directly from Mobility Stations are (1) public transport users, (2) active mode users and (3) vulnerable populations, depicted in the logic map in Figure 11 and discussed below.
Impacts and benefits for transport users
Integrating modes into a single interchange facility will have numerous benefits for transport users:
Public transport and active mode users:
1. Mobility Stations will reduce user stress associated with public transport and active travel modes through improved wayfinding, travel information and physical integration. This will benefit the 6,200 working age people in the Northern Arc who commute via public transport (Census 2011, adjusted for population growth31). There are over 100,000 jobs across the Northern Arc, a recent report by SuScom (representing North Fringe employers) showed rail and bus only accounting for 10.3% of journeys to work32. Mobility Stations will also increase the number of travellers that choose to walk or may encourage users to walk the first/last mile. The TfL Yellow Book states that 66% of travellers would consider switching to walking after being shown a walking map33.
2. Physical integration of modes – supported by digital integration through the Data Hub and MaaS Platform – should improve modal connectivity, reducing overall journey times for users, increasing reliability and reducing travel related stress.
West of England Combined Authority – Future Mobility Zone – Final Proposal
33
3. Secure and weather-proof cycle parking at public transport stations will make cycling more attractive for the first/last mile, particularly during winter. 52% of respondents to TfL’s Attitudes to Cycling Survey said that improved cycle parking facilities would encourage them to cycle34. The provision of non-standard cycle parking facilities will also encourage the use of cargo bikes or cycles with trailers to enable families to cycle with young children. Mobility Stations that incorporate cycle parking facilities will improve the practicality of choosing to cycle, and since a station’s cycling catchment area is approximately 6.5 times greater than its walking catchment area35, the facilities will effectively increase the catchment areas of the public transport network.
4. Facilities such as cafes and waiting areas will improve the physical and social environment experienced while travelling and will therefore improve journey quality. Journey quality can be an important influence on the travel choices made by individuals36 and therefore the provision of Mobility Stations may induce users to choose more sustainable modes.
Vulnerable groups:
1. Mobility Stations will improve accessibility for people who are less able to navigate interchanges unassisted, such as those less able to walk, people with visual impairments and those traveling with young children. A qualitative study carried out by TfL in 2010 to understand the barriers faced by disabled commuters found that (1) lack of appropriate information provision and (2) problems finding somewhere to sit, to be two key barriers that limited respondents’ ability to travel and therefore access employment37. Consistent branding, improved wayfinding and information at Mobility Stations, supported by the MaaS Platform and Data Hub, will increase user confidence and make multi-modal end-to-end journeys easier for vulnerable users.
2. TfL found that 76% of people with disabilities are able to cycle38, therefore appropriate cycle parking facilities at Mobility Stations will help to link people with disabilities to public transport.
3. Mobility Stations will benefit users such as women and older people by providing comfortable and safe waiting facilities which will encourage these groups to make longer journeys or journeys at night by public transport rather than private vehicle.
Impacts and benefits for low-income households
1. 60% of journeys to work originating in the Northern Arc are by private car, which is partly due to the perception of poor public transport connectivity in the area. 43% of households with the highest levels of deprivation do not have access to a vehicle and they are therefore disproportionately impacted by poor accessibility. In combination with MaaS, Mobility Stations will increase awareness of travel options by (1) encouraging users to think multi-modal, (2) raising the profile of sustainable modes and (3) improving convenience of non-car travel options. This will benefit households whose accessibility is limited by lack of access to a car.
Impacts and benefits for wider society
1. Within the Northern Arc there are Air Quality Management Areas (as shown in Appendix 7), particularly along the M32 towards Bristol city centre. Mobility Stations would be particularly effective in this area as improving ease of use of more sustainable modes would reduce private car use, benefitting residents currently at risk from poor air quality.
2. Wider carbon reduction benefits will also be achieved through modal shift to more sustainable projects. Evaluation of a similar project set up in Cologne found evidence of a 70% decrease in CO2 emissions within an 800m radius of each of the hubs within 3 years of operation.
3. The enhanced facilities, public realm improvements and increased footfall associated with investment in Mobility Stations are expected to improve placemaking. Investment in improvements to the public realm and improved walking and cycling facilities has been found to increase local retail sales by 30%39 and per square metre, whilst cycle parking delivers five
times higher retail spend than the same area of car parking40. Where stations are located in
places of existing economic activity, they are expected to boost the performance of local shops. 4. There is a perception of poor public transport particularly in the Northern Arc due to congestion
on key corridors and people being unaware of the depth of the service offering. Through improving the provision of information, Mobility Stations will enable residents to make better use of existing services which will lead to increased revenue for public transport operators.
5. Mobility Stations can reduce the need for parking by offering viable alternative travel options. They can, therefore, support high-density housing development that would not otherwise be supported by the existing road network. Additionally, improved connectivity leads to a number
West of England Combined Authority – Future Mobility Zone – Final Proposal
34
of positive externalities that increase the value of land around Mobility Stations 41,42. Investment in Mobility Stations can, therefore, improve the bargaining power of local authorities in negotiations with developers.
6. Both transport users and local residents will benefit from the provision of delivery hubs, particularly commuters who are away from home during the day. McKinsey estimate that the same day delivery market, enabled by delivery hubs is expected to be worth around EUR 7.2 billion in 202043.
Managing the risks of benefits not materialising
The key risks around behaviour change and whether the anticipated benefits materialise include:
1. Identifying the most suitable locations: Mobility Stations will be most successful in changing behaviour where there is latent demand for modes other than vehicle use. To address this risk, Mobility Stations will be trialled in the Northern Arc and lessons learned on the key features will be applied to further roll out across the WECA region. Stakeholders and local communities will be involved in helping to determine the most suitable locations which will ensure they are chosen to address specific needs.
2. User uptake: we will take a user centred design approach through our Living Lab, with all projects co-designed and co-developed with the communities and users they serve to ensure that the Mobility Hubs and Mobility Points are designed with an appropriate mix and scale of services at each location. This will help to reduce the risk of low user take up and increase chances of overall project success, by ensuring that solutions meet real needs and requirements.
3. Our iterative approach to testing and evaluation will be used to ensure effective integration of Mobility Stations with MaaS and Data Hub technology ensuring that high quality, live information will be provided which will be crucial to encouraging user uptake.
C2.3 DDRT
As described in Section B2.3.4, the DDRT Project will focus on routes serving Bristol Airport, aimed at improving access to jobs, and routes in the Northern Arc, which will be aimed at targeting first and last mile transport as well as improving access to jobs and education. The user segments we expect to benefit the most from DDRT are (1) car drivers (primarily commuters), (2) people without access to a car or with limited mobility and (3) wider society, as depicted in the logic map in Figure 12 and as discussed below.
Impacts and benefits for car drivers (primarily commuters)
Northern Arc: There are approximately 54,300 working age people living in the Northern Arc and in excess of 100,000 jobs. Whilst TCF investment is significantly increasing the bus and rail service offering, housing and jobs are dispersed across a very large area meaning there are inevitably limitations in the penetration of fixed route services. The impact is that the walk distance to/from households/jobs away from the core catchment area is too far and/or perceived to be unsafe, particularly during winter periods. This means that the car remains a necessity for those not served by MetroBus/rail and those without access to a car are left unable to benefit from the TCF investment. DDRT increases the catchment market for the main bus/rail services by linking dynamic feeder services, providing first/last mile connectivity so that sustainable transport can become the mode of choice.
Bristol Airport: Poor public transport access to the airport (in terms of routes and scheduling for shift employees) greatly reduce access for non-car drivers. Employees are forced to drive to the airport, which forces many employees into car ownership, increasing household costs. Provision of a DDRT service for employees will help to reduce household car costs.
Where DDRT services are readily available, convenient to use, high quality, reliable and affordable, there is evidence from previous trials that modal shift from private car usage can be achieved:
1. Results from previous DDRT trials in Bristol suggest that most users would have driven (71%) and that a sizeable 8% of users stated they would be willing to give up a second car if the service was made permanent.
2. A similar service, ArrivaClick in Sittingbourne, Kent, which has been running since March 2017, has found that two years after its launch, it has drawn 52% of its ridership from people who formerly drove to complete the same journey

West of England Combined Authority – Future Mobility Zone – Final Proposal
35
Impacts for people without access to a car or limited mobility (low-income, economically inactive, or other disadvantaged groups)
DDRT will unlock previously unfeasible journeys, improve connectivity and accessibility for:
1. People without access to a car. In the Northern Arc and Bristol Airport Zones there are approximately 23,800 households with no access to a car or van (Census 2011, adjusted for population growth44). TCF investment in rail and bus will increase the frequency, reliability and speed of access to the Northern Arc, complemented by DDRT this will maximise access to employment for the wider population across the West of England.
2. People who have no reasonable public transport option to begin with, for example, due to timetables or pick-up locations or simply the lack of public transport services in their area.
3. People who are unable to use traditional means of bridging the transport gap to and from public transport nodes, for example, those that cannot use taxis due to affordability or cannot use active travel due to physical ability. The most recent Quality of Life survey for Bristol found that around 20% of people living in deprived areas rarely or never feel close to other people (higher than the Bristol average of 14%); and almost half (45%) of people in deprived areas have long-term health problems or disability that limits their mobility (compared with the Bristol average of 28%)45. In addition, we know that nationally 10% of those over 65 in the UK experience chronic loneliness and 23% of people aged 75+ who live alone do not see or speak with someone every day. DDRT can help to overcome all these challenges by improving accessibility.
Utilising DDRT, these groups will benefit from improved access to employment, services such as health care and education, as well as better access to leisure and social activities that benefit well-being and reduce social exclusion. Research from Bristol Community Transport, based on surveys of ‘Dial a Ride’ users, demonstrated that the benefits of being able to use such a service included:
1. Feeling more connected / less isolated and helped them to feel a part of their community as it provided new modes for them to go out more, to socialise, to access shops and services.
2. Feeling more independent, not having to rely on others for rides and building confidence by being able to travel independently.
3. Generally feeling a greater sense of well-being.
Impacts and benefits for wider society
By encouraging shared-rides on a large scale, people in households with access to a car (of which there are 80,200 in the zones where DDRT will be rolled out (Census 2011, adjusted for population growth46)) will choose to drive less, which will lead to reductions in single-occupancy vehicle trips and overall reductions in congestion on the highway network, which itself will lead to:
1. Improvements in air quality and reductions in greenhouse gas emissions due to reductions in total vehicle-kilometres driven and due to reductions in delays, which support objectives underpinning WECA’s declaration of a Climate Emergency. Via trials in London, in 2018, reported impacts in the order of 1.4m vehicle-miles saved and around 495 tonnes CO2 saved47 from DDRT travel.
2. Improvements in highway journey time reliability, including improvements in journey time reliability for DDRT passengers.
3. Increasing accessibility of existing and key employment and housing growth sites by sustainable transport will increase the confidence for the private sector to invest and for planning authorities to take sites from local plan allocations, to approved planning applications and then the construction of new homes/workplaces.
4. Savings to users, primarily as reductions in fuel consumption compared to those users each driving individual vehicles2. The same Via trial calculated savings of around $22.8m (2018 USD) in savings to commuters48.
Over the long-term, as people choose to drive less, it is also expected that they will choose to own fewer vehicles. This trend has the potential to transform cities, in which large amounts of space are allocated to highways and car parks. By reallocating highway space for shared transport modes, cities
2 Reduced fuel consumption would have a negative impact on public accounts due to reductions in fuel duty, but the losses would be offset somewhat as increased VAT revenue if consumers’ savings on fuel are transferred to general consumption. Further marginal external benefits arising from air quality improvements and health impacts could also offset losses in fuel duty. For the purposes of this appraisal, it is assumed that the net impacts would not be significant.
West of England Combined Authority – Future Mobility Zone – Final Proposal
36
will be able to reclaim the space currently occupied by single occupancy vehicles for uses that more meaningfully contribute to the health and vibrancy of the urban environment.
Furthermore, sharing increases the spatial efficiency of transport which, in turn, will free-up street space and parking for higher value uses such as affordable housing, parks, bike and pedestrian infrastructure. From this perspective, sharing can promote important policy goals like housing equity, pedestrian safety, and city beautification.
Managing the risks of benefits not materialising
The key risks around behaviour change and whether the anticipated scale of benefits materialise include:
1. Failure to integrate the Data Hub and MaaS Platform. 2. Failure to get the level of demand required to deliver commercially viable services. 3. Failure to increase asset utilisation 4. That the service leads to an increase in total vehicle miles, taking trips away from active modes
rather than private vehicles.
We will take a user-centred design approach through our Living Lab, with all projects co-designed and co-developed with the communities and users they serve. This will help to reduce the risk of low take up and maximise the change of project success, by ensuring that solutions meet real needs and requirements. For DDRT, this will involve engaging with trip attractors (including major employers, such as Bristol Airport who have are a key stakeholder in this project) and end-users in the specification and design process for new DDRT services. This is a key lesson learnt from the previous demand responsive trials in the region, such as the MYFIRSTMILE project.
In the delivery phase, our iterative approach to testing and evaluation will allow for the identification of any issues that might occur and an opportunity to change the approach. This includes the risk that the impacts and benefits expected of DDRT do not materialise – or unintended negative impacts occur. A critical aspect of this will be mapping the value chain of DDRT services in order to deliver the financial benefits for operators required to make services commercially sustainable.
C2.4 Micromobility
The micromobility project aims to deliver an e-scooter trial developed in the Northern Arc. In addition, E-cargo bikes will be trialled in central Bath and central Bristol to help reduce the number of car/van-based freight and servicing trips within congested areas. Findings from these trials will contribute to developing a regional strategy and policy framework for micromobility schemes to facilitate future growth of the sector.
The user segments to benefit most from the micromobility project are: (1) commuters, (2) active mode
users, (3) jobseekers and (4) households without access to a vehicle, as set out below.
Impacts and benefits for transport users
Commuters
1. Micromobility schemes aim to support shorter journeys. As 40% of commuter trips in the three zones selected for the micromobility scheme are less than 2km there is high potential for the uptake of e-scooters, helping to deliver faster and easier journeys for commuters.
Jobseekers
1. The three zones targeted for the micromobility scheme have a higher rate of job seekers allowance claimants compared to the regional average (24 per 10,000 people compared to 21 for the West of England), Bristol Centre Zone has the highest rate of claimants (39 per 10,000 people49). The Bristol Local Transport Strategy (2019) reports that approximately 40% of local jobseekers say that lack of personal transport or poor public transport is a key barrier preventing them from finding work50 - with Figure 14 showing low access to a car or van in the Northern Arc, Bristol and Bath. The provision of new travel options through e-scooters therefore has the potential to help tackle the barriers to accessing employment opportunities for jobseekers.
2. A growing micromobility industry will also create direct jobs in service, maintenance and research and development.

West of England Combined Authority – Future Mobility Zone – Final Proposal
37
Figure 14 – Access to a car or van in the West of England
Impacts and benefits for wider society
1. The provision of micromobility services will extend the reach of the existing public transport system to residents who would not be able to access the network by foot. An e-scooter pilot in San Francisco found that 34% of customers used the scooters to travel to and from public transport51. This increase in trips improves revenue for transport operators and increases accessibility in the Northern Arc which has a sparser public transport offering than the Bristol and Bath central zones.
2. There is evidence that the provision of e-scooters encourages mode change from private vehicles. In a 2018 pilot in Portland Oregon, a survey of users found that 34% of Portland riders and 48%of visitors took an e-scooter instead of driving a personal car or using Uber, Lyft, or taxi52. Reducing the number of vehicles on key routes will reduce congestion and improve air quality for residents along these routes and will therefore improve health. Currently, around 300 deaths per annuum in Bristol are attributable to air pollution53
3. Electrically assisted micromobility modes (e-bikes, e-scooters, e-cargo bikes, etc) increase the range that people are prepared to travel micromobility modes, removing barriers posed by hilly terrain and personal fitness, opens up this mode as a serious option for many more people.
4. An increased number of non-car trips to workplaces and to and from public transport hubs will result in increased footfall along local high streets, increasing revenue at local shops. In 2011, a study in London found that whilst car drivers spent more on a single trip, walkers and bus users spent £147 more per month than those travelling by car54. It is assumed that micromobility trips will deliver comparable benefits.
5. Results from an EU wide study suggest that every kilometre driven by car incurs an external cost of €0.11, while cycling and walking represent net benefits of €0.18 and €0.37 respectively55; other human-powered, including e-assist modes, could expect to also be net contributors to the economy.
Managing the risks of benefits not materialising
The key risk to the anticipated scales of benefits materialising is uptake, which is likely to be heavily reliant on user perceptions (e.g. safety, ease-of-use, availability of walking and cycling infrastructure).
Awareness of the micromobility project will be improved through the link with Mobility Stations, the information and parking facilities available at the stations will support user understanding of the potential of the scheme for improving accessibility. Our work developing a policy framework for providers to work

West of England Combined Authority – Future Mobility Zone – Final Proposal
38
within, in combination with the Living Lab approach, will improve user perceptions of safety, ensure solutions meet the needs of user addressing their perceptions and concerns.
Our collaborative development approach will ensure that buy-in from all stakeholders will be maintained into the future. Both public and private sectors will be involved in the testing environment which will ensure that the priorities of all stakeholders are addressed in tandem.
C3. The Economic Case – Benefits from new markets and business models
C3.1 New jobs
In general, there is limited concrete evidence of the direct and indirect job creation and wider economic impacts of new mobility schemes such as those forming the FMZ. However, as indicated in the logic maps, there is a clear and plausible theory of change in which improvements that enable better network management and more efficient use of existing transport assets can lead to a more resilient, accessible and inclusive transport system. Our FMZ create a valuable opportunity to collate evidence and lessons learnt on the efficacy of new modes, models and services help build knowledge and experience.
FMZ will grow the catchment of sustainable transport in terms of affordability, ease-of-access, and reduced journey times. This in turn will create wider employment catchments and also increase the transport accessibility of education and training opportunities for disadvantaged groups in the West of England. This is in turn will create wider employment catchments and also increase the transport accessibility of education and training opportunities for disadvantaged groups in the West of England. Having a larger, more diverse and more dynamic employee population throughout the West of England will incentivise business investment and jobs growth.
An outline of the types and scales of new jobs created directly and indirectly is set out in Table 10.
Table 10 – Potential for new jobs
Project Direct jobs Indirect jobs
Data Hub and MaaS Platform
1. Digital skills jobs required for creation, development and maintenance, e.g. software and systems developers, data processing, normalisation and harmonisation, data analytics and other ‘knowledge sector’ jobs. TfL’s open data is estimated to have created around 500 jobs that would not have existed otherwise56.
2. Back-office support jobs such as accounts management teams e.g. commercial and legal agreements, user accounts, sales and customer service.
1. An open data approach can lead to innovation in the private sector, creating new high skills jobs in SMEs and other organisations. There is strong potential for supporting indirect job creation within the highly competitive digital tech cluster in Bristol and the West of England.
Mobility Stations
1. Implementation of physical sites will create jobs in design, engineering and construction.
2. Once operational, Mobility Stations are likely to create jobs ranging from the creative/artistic sector/marketing sector, community engagement, facilities maintenance and repair.
1. Mobility Stations could see relatively steady streams of foot traffic and as they become neighbourhood focal points, they will be ideal locations for small business opportunities that benefit from footfall, such as newsagents, food shops and similar street vendors. Evidence shows that investment in better streets and places delivers quantifiable commercial returns, for examples, pedestrian improvements in New York led to a 48% increase in local retail sales57.
2. They could also support indirect jobs such as bicycle repair shops or car rental agencies.

West of England Combined Authority – Future Mobility Zone – Final Proposal
39
Project Direct jobs Indirect jobs
DDRT
1. Digital skills jobs in continuously developing route matching algorithms and user-friendly interfaces, as well as integrating with Data Hub and MaaS.
2. Jobs for around 20-30 vehicle drivers3, who are likely to come from low-income households and who will benefit from the training for a Driver’s Certificate of Professional Competence (Driver’s CPC)4. They will also need additional training in customer service, safeguarding, and technology. This upskilling and training will have longer term benefits for employees.
1. The development and ongoing operation and refinement of the DDRT APIs, either as part of the Data Hub and MaaS Platforms, or as independent start-ups who are able to tap into and innovate upon open APIs, will support the creation of new highly skilled technology and data analytics jobs.
2. An established DDRT project might act as a viable business model, which may then incentivise and support local SMEs and self-employed drivers in future.
Micromobility
1. An e-cargo bike project will directly create or support logistics jobs.
1. Wider modal shift among the population could lead to new businesses catering to changing travel behaviours. For example, growth in bicycle shops or the emergence of new specialist providers for e-bikes or e-scooters.
C3.2 New products and markets
Data Hub and MaaS
Consumer behaviour has been changing, which is evident in the rising demand for individualistic on-demand customer services and newly emerging business models focusing more on ‘subscriptions’ or ‘services’. In the transport sector these changes are appearing in, for example, the numerous personal mobility apps, micromobility subscription models, route planning or real-time tracking of discrete parts of the transport system. In this context, a successful MaaS Platform will itself be a new product in that it could seamlessly integrate all of the information and services that currently exist to some extent as separate ‘entities’ of varying utility. However, in addition to being a new product in its own right, a successful MaaS Platform and the travel demand insights enabled by the Data Hub are likely to create significant new potential markets and services that emerge from open data.
‘Open data’ itself will be a key trigger creating economic benefit by stimulating innovation in the market, fostering new services and new firms. In the long-term, it is expected that an open approach will help change the data culture in the region, encouraging reticent data owners to be more open with their data once they see the additional value they could realise from data sharing. Research by the European Data Portal shows that data sharing can lead to significant economic and social development and growth, forecasting a gain to EU GDP of 4% and public sector cost savings of €1.7 billion in 2020 alone58.
Comparative analysis of data environments around the world suggested that the opportunities for leveraging economic benefits from open data will be maximised where the three key conditions of political leadership, data availability (both in terms of sharing and comprehensiveness) and data usability (for example as Open APIs) are enabled, with the UK emerging as one of the global leads59. These three conditions have underpinned the framework for establishing a Data Hub and MaaS Platform in our FMZ.
In the UK, HM Treasury’s discussion paper on the economic value of data60 cites research that “firms adopting data-driven decision-making can have 5-6% higher output and productivity”61. Research by the European Commission found that “even limited use of big data analytics solutions by the top 100 EU manufacturers could boost EU economic growth by an additional 1.9% by 2020”62. For the UK specifically, research suggests that “from 2015 to 2020, the total benefit to the UK economy of big data analytics is expected to amount to £241 billion, or £40 billion on average per year”63.
3 The project has budgeted to purchase nine vehicles, which might require in the order of 2-3 drivers per vehicle for the purposes of the trial alone. 4 The Driver’s CPC will require 35 hours of training every seven years, and will be a transferrable qualification, which will improve prospects for long-term employability.
West of England Combined Authority – Future Mobility Zone – Final Proposal
40
These values suggest the potential scale of the impact that could materialise from implementing the Data Hub and MaaS Platform as the core projects in the WECA FMZ.
Mobility Stations
An improved public realm, increased footfall, longer dwell times and increasing land value will attract businesses to locate around Mobility Stations. Stations will have several physical infrastructure components that will be tailor made to each location. These will include aspects like charging stations, bicycle parking, parcel lockers, coffee shops, and several others. Likewise, Mobility Stations have the opportunity to promote public transport, active transport, and the use of shared modes, as well as being uniquely placed to trial new products and services like micromobility and e-scooters. This provides an excellent platform for new businesses and start-ups to trial by providing a dedicated location for people to easily access their new modes and services.
Each of these factors are likely to lead to several new products and services being unlocked to build, support, and operate the Mobility Stations.
DDRT
Whilst the West of England has seen significant increases in bus use in the last five years the general picture is one of decline outside of London. Whilst we are expecting TCF investment to further grow bus/MetroBus passengers, it is likely to plateau mid-next decade when the extent to which fixed route services can connect people to jobs, services and friends/family will have been maximised. By trialling DDRT with a view to establishing ongoing commercially viable operations, our FMZ will create the market for DDRT operations in the West of England.
Micromobility
McKinsey estimate a potential market of £80 - £120 billion for micromobility in Europe by 2030; however
further research, innovation and policy development is required before this industry can be unlocked.
Innovation of this kind in the West of England will contribute to international design standards,
establishing safety standards, developing regulatory frameworks and will create insights into uptake
and usage patterns that will enable exponential expansion of the market.
C3.3 Replicability
Our projects will be designed, trialled and evaluated in such a way that their learnings and evidence can be shared with DfT and others. This will aid with replicability, scalability and help promote the FMZ as a global demonstrator.
Data Hub and MaaS Platform
In general, the Data Hub and MaaS could be replicated in the UK and internationally – both the technical aspects and the commercial agreements and approaches. We are already using international examples of data sharing agreements and lessons learnt, for example from the New South Wales data specification64, the MaaS Global data sharing API65 and the City of Los Angeles Mobility Data Specification66 and are keen to lead the way on developing data sharing standards and approaches to MaaS in the UK, working with DfT, other FMZs and key stakeholders such as BSI.
The planned behaviour model and simulation capabilities that are to be built into the Data Hub will be highly transferable. If WECA (or other form of public sector partnership) took some Intellectual Property in these components there will be potential to generate significant ongoing revenue funding for use in other parts of the programme. It will enable innovators / SMEs to trial new ideas and services that can themselves be transferred to other UK areas.
Building such a platform using Open Standards will be essential to developing a scalable, repeatable solution. Avoiding vendor lock-in and working with international standards organisations will ensure that barriers to entry and scalability are avoided. Should the platform become scalable it could form part of a federated ecosystem of platforms, fulfilling some of the recommendations and ambitions of initiatives such as the National Digital Twin.
Furthermore, a proven commercial model for MaaS would be unique and could provide critical lessons for transferability.
Mobility Stations
West of England Combined Authority – Future Mobility Zone – Final Proposal
41
To maximise their potential to provide first and last mile solutions across the Northern Arc, the design and function of Mobility Stations will be heavily influenced by their locations and the transport users and journey purposes they serve. We will trial different types of Mobility Station with different features. By collating lessons learnt and evidence on their impacts, we will be able to develop a method and an audit framework that can be used to identify new locations for future Mobility Stations and the services to be included. This method and framework will be transferrable and replicable elsewhere in the UK and internationally.
Within the WECA FMZ trial itself, there is potential to scale up once the trial network of Mobility Stations is established, as additional stations could be added. If such opportunities arise, we will apply the best practices and lessons learned under the living lab approach, continuing to engage and involve stakeholders and the community to ensure that any new stations are designed to serve the communities and people which they are located.
We will also investigate the long-term commercial viability of Mobility Stations, trialling different commercial models as appropriate. This will provide learnings for other areas seeking to develop mobility stations.
DDRT
Whilst DDRT offers many benefits, there are commercial challenges in its delivery. Key challenges include asset utilisation (particularly in the off peak), matching demand to supply and network coverage.
By pump priming DDRT trials across multiple geographies and use cases, we will be able to determine valuable insights into how to develop and deliver competitive services. Although the two use cases have been developed to meet the particular expected demand types in the WECA region, the use cases themselves are applicable to other areas. The lessons learnt around the success of DDRT in widening accessibility to existing public transport and employment opportunities will be widely applied throughout the UK and further afield. Therefore, we anticipate a high level of transferability and replicability of the principles and lessons learnt.
We intend on integrating the DDRT services within our Data Hub and MaaS Platform. From this we will capture lessons learnt around inter-operability, which will be shared with others seeking to do similar.
Micromobility
Trialling a range of micromobility modes will deliver lessons learnt and evidence for sharing and replicability. Key areas for replicability and transferability within the UK and internationally will include:
1. Collaborative working between operators and authorities. 2. Commercial models for success. 3. Protocols for the management of micromobility modes. For example, regarding responsibility
for fleet management, asset clean up and asset parking. 4. Design issues for docked modes at the Mobility Stations, or protocols for where they can be
parked will be transferable to other UK cities. 5. Design and legal issues relating to operation of e-scooters on pavements, cycle lanes and
shared spaces.
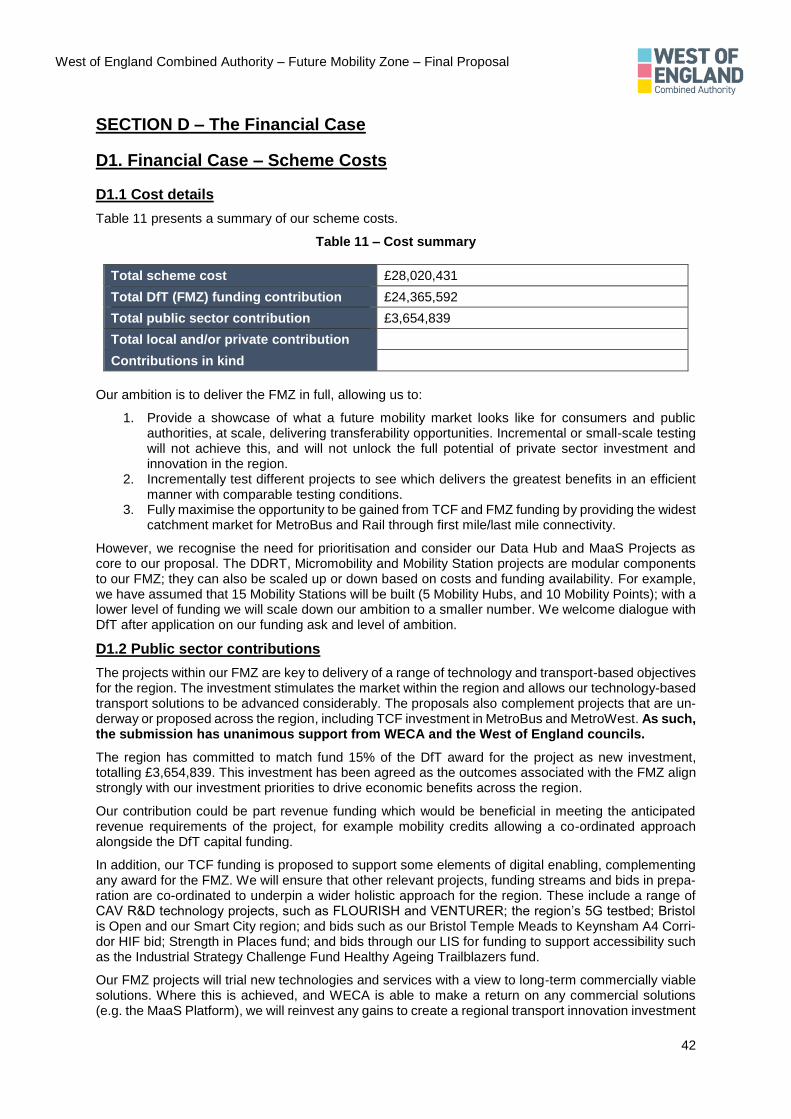
West of England Combined Authority – Future Mobility Zone – Final Proposal
42
SECTION D – The Financial Case
D1. Financial Case – Scheme Costs
D1.1 Cost details
Table 11 presents a summary of our scheme costs.
Table 11 – Cost summary
Total scheme cost £28,020,431
Total DfT (FMZ) funding contribution £24,365,592
Total public sector contribution £3,654,839
Total local and/or private contribution
Contributions in kind
Our ambition is to deliver the FMZ in full, allowing us to:
1. Provide a showcase of what a future mobility market looks like for consumers and public authorities, at scale, delivering transferability opportunities. Incremental or small-scale testing will not achieve this, and will not unlock the full potential of private sector investment and innovation in the region.
2. Incrementally test different projects to see which delivers the greatest benefits in an efficient manner with comparable testing conditions.
3. Fully maximise the opportunity to be gained from TCF and FMZ funding by providing the widest catchment market for MetroBus and Rail through first mile/last mile connectivity.
However, we recognise the need for prioritisation and consider our Data Hub and MaaS Projects as core to our proposal. The DDRT, Micromobility and Mobility Station projects are modular components to our FMZ; they can also be scaled up or down based on costs and funding availability. For example, we have assumed that 15 Mobility Stations will be built (5 Mobility Hubs, and 10 Mobility Points); with a lower level of funding we will scale down our ambition to a smaller number. We welcome dialogue with DfT after application on our funding ask and level of ambition.
D1.2 Public sector contributions
The projects within our FMZ are key to delivery of a range of technology and transport-based objectives for the region. The investment stimulates the market within the region and allows our technology-based transport solutions to be advanced considerably. The proposals also complement projects that are un-derway or proposed across the region, including TCF investment in MetroBus and MetroWest. As such, the submission has unanimous support from WECA and the West of England councils.
The region has committed to match fund 15% of the DfT award for the project as new investment, totalling £3,654,839. This investment has been agreed as the outcomes associated with the FMZ align strongly with our investment priorities to drive economic benefits across the region.
Our contribution could be part revenue funding which would be beneficial in meeting the anticipated revenue requirements of the project, for example mobility credits allowing a co-ordinated approach alongside the DfT capital funding.
In addition, our TCF funding is proposed to support some elements of digital enabling, complementing any award for the FMZ. We will ensure that other relevant projects, funding streams and bids in prepa-ration are co-ordinated to underpin a wider holistic approach for the region. These include a range of CAV R&D technology projects, such as FLOURISH and VENTURER; the region’s 5G testbed; Bristol is Open and our Smart City region; and bids such as our Bristol Temple Meads to Keynsham A4 Corri-dor HIF bid; Strength in Places fund; and bids through our LIS for funding to support accessibility such as the Industrial Strategy Challenge Fund Healthy Ageing Trailblazers fund.
Our FMZ projects will trial new technologies and services with a view to long-term commercially viable solutions. Where this is achieved, and WECA is able to make a return on any commercial solutions (e.g. the MaaS Platform), we will reinvest any gains to create a regional transport innovation investment
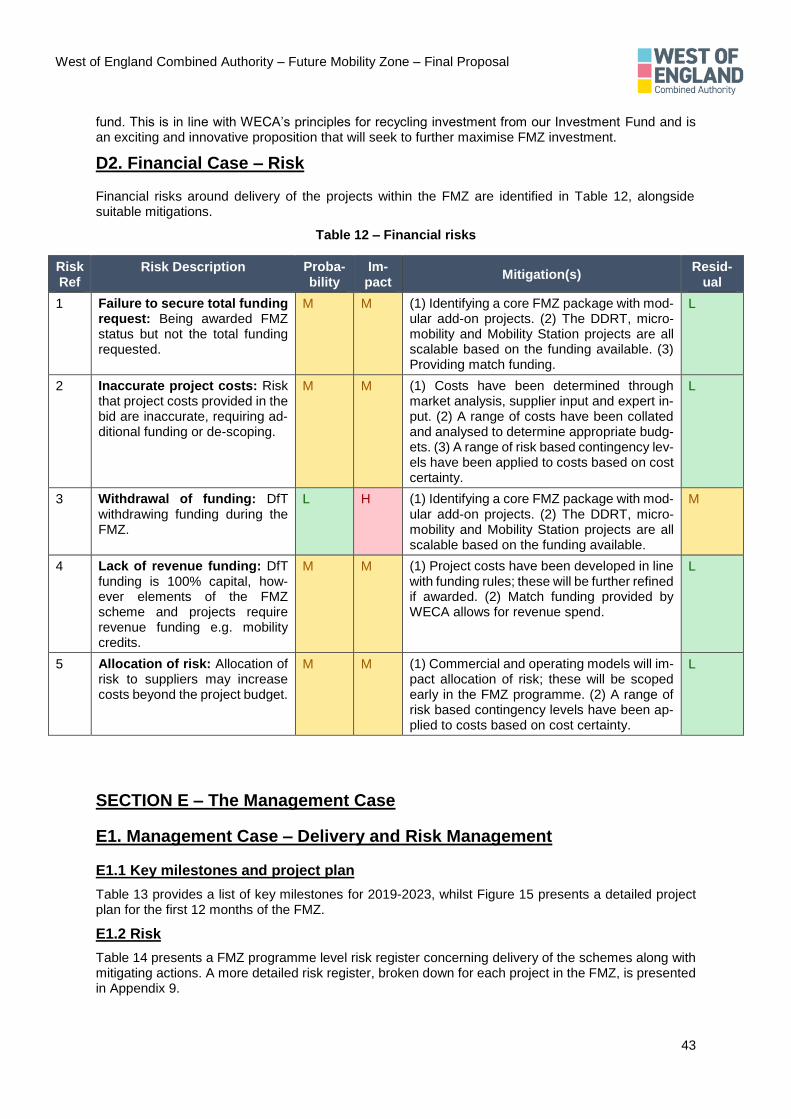
West of England Combined Authority – Future Mobility Zone – Final Proposal
43
fund. This is in line with WECA’s principles for recycling investment from our Investment Fund and is an exciting and innovative proposition that will seek to further maximise FMZ investment.
D2. Financial Case – Risk
Financial risks around delivery of the projects within the FMZ are identified in Table 12, alongside suitable mitigations.
Table 12 – Financial risks
Risk Ref
Risk Description Proba-bility
Im-pact
Mitigation(s) Resid-
ual
1 Failure to secure total funding request: Being awarded FMZ status but not the total funding requested.
M M (1) Identifying a core FMZ package with mod-ular add-on projects. (2) The DDRT, micro-mobility and Mobility Station projects are all scalable based on the funding available. (3) Providing match funding.
L
2 Inaccurate project costs: Risk that project costs provided in the bid are inaccurate, requiring ad-ditional funding or de-scoping.
M M (1) Costs have been determined through market analysis, supplier input and expert in-put. (2) A range of costs have been collated and analysed to determine appropriate budg-ets. (3) A range of risk based contingency lev-els have been applied to costs based on cost certainty.
L
3 Withdrawal of funding: DfT withdrawing funding during the FMZ.
L H (1) Identifying a core FMZ package with mod-ular add-on projects. (2) The DDRT, micro-mobility and Mobility Station projects are all scalable based on the funding available.
M
4 Lack of revenue funding: DfT funding is 100% capital, how-ever elements of the FMZ scheme and projects require revenue funding e.g. mobility credits.
M M (1) Project costs have been developed in line with funding rules; these will be further refined if awarded. (2) Match funding provided by WECA allows for revenue spend.
L
5 Allocation of risk: Allocation of risk to suppliers may increase costs beyond the project budget.
M M (1) Commercial and operating models will im-pact allocation of risk; these will be scoped early in the FMZ programme. (2) A range of risk based contingency levels have been ap-plied to costs based on cost certainty.
L
SECTION E – The Management Case
E1. Management Case – Delivery and Risk Management
E1.1 Key milestones and project plan
Table 13 provides a list of key milestones for 2019-2023, whilst Figure 15 presents a detailed project plan for the first 12 months of the FMZ.
E1.2 Risk
Table 14 presents a FMZ programme level risk register concerning delivery of the schemes along with mitigating actions. A more detailed risk register, broken down for each project in the FMZ, is presented in Appendix 9.

West of England Combined Authority – Future Mobility Zone – Final Proposal
44
WP Year Task Name
Q4 Q1 Q2 Q3 Q4 Q1 Q2 Q3 Q4 Q1 Q2 Q3
Note: Time indicies changes at end of 2020 Oct Nov Dec Jan Feb Mar Apr May Jun Jul Aug Sep Oct Nov Dec
WP0 Project launch
WP0.1 Y0 Notification of DfT Award
WP0.2 Y0 Agree interaction and collaboration with Bidders
WP0.3 Y0 Formulate Project Team, Board and consultant support
WP0.4 Y0 Agree enagement and comms approach
WP1 All Data Hub
WP1.1 Y1 Initial scoping and market engagement
WP1.2 Y1 Select / procure partner and agree high level objectives
WP1.3 Y1 Gap analysis and specify technical requirements
WP1.4 Y1 Design / development
WP1.5 Y1 Scope 3rd party data and agree open data protocols
WP1.6 Y1 Finalise technical design
WP1.7 Y1 Data Hub build
WP1.8 Y1 Migrate existing data sources
WP1.9 Y1 Testing
WP1.10 Y1 Iteration 1 Launch
WP1.11 Y1 Development and build of Digital Twin
WP1.12 Y2-Y4 Digital Twin testing
WP1.13 Y2-Y4 Digital Twin available for trials
WP1.14 Y2-Y4 Review open data provision and further integrate
WP1.15 Y2 Review / Test / Evaluate Iteration 1
WP1.16 Y2 Specify Iteration 2
WP1.17 Y3 Launch Iteration 2
WP1.18 Y2 Data insights for Y1 available
WP1.19 Y3 Review / Test / Evaluate Iteration 2
WP1.20 Y2-Y4 Data hub used to promote further trials and innovation
WP1.21 Y2-Y4 Ongoign testing evaluation and upgrade to Data Hub
WP1.22 Y4 Launch Iteration 3
WP1.23 Y4 Test/ Evaluate Iteration 3
WP2 All MAAS Platform
WP2.1 Y1 Initial scoping and market engagement
WP2.2 Y1 Select / procure partner and agree high level objectives
WP2.3 Y1 Specify technical requirements
WP2.4 Y1 Design / development / adapt existing platform
WP2.5 Y1 Agree protocols for Apps
WP2.6 Y1 Finalise technical design
WP2.7 Y1 Data integration to platform
WP2.8 Y1 Testing
WP2.9 Y1 Identify initial cohort of users & launch trial
WP2.10 Y1-Y2 Review / Test / Evaluate trial platform
WP2.11 Y2 MaaS Platform operational
WP2.12 Y2 Marketing/ Engagement of wider platform
WP2.13 Y2-Y4 Roll out of wider FMZ MaaS
WP2.14 Y2-Y4 MaaS Platform used for further trials and innovation
WP2.15 Y2-Y4 Capture feedback & prioritise functionality improvements
WP2.16 Y2-Y4 Ongoign testing evaluation & upgrade to MaaS Platform
WP2.17 Y4 Launch Iteration 3
WP2.18 Y4 Test/ Evaluate Iteration 3
Mobility credits
WP2.19 Y1 Feasibility Assessment with Knowle West Media Centre
WP2.20 Y1 Identify areas and cohorts
WP2.21 Y2 Customer engagement and agreement of protocols
WP2.22 Y2 Agree access to data
WP2.23 Y2 Design protocols for back office and MaaS platform
WP2.24 Y2-Y4 Mobility Credits Operational
WP2.25 Y2-Y4 Data population into datahub
2019 2020 2021 2022 2023
Financial year Q3 Financial year Q4 Financial year Q1 Financial year Q2 Financial year Q3
Table 13 – FMZ key milestones for 2019 - 2023

West of England Combined Authority – Future Mobility Zone – Final Proposal
45
WP Year Task Name
Q4 Q1 Q2 Q3 Q4 Q1 Q2 Q3 Q4 Q1 Q2 Q3
Note: Time indicies changes at end of 2020 Oct Nov Dec Jan Feb Mar Apr May Jun Jul Aug Sep Oct Nov Dec
WP3 All Mobility Stations
WP3.1 Y1 Identify quick win sites and initial service provision
WP3.2 Y1-Y2 Engage with Highways and Planning authorities
WP3.3 Y1 Initial scopeing and engagement
WP3.4 Y1 Prioritise and select initial feasible sites
WP3.5 Y1 Implement quick wins and micro stations
WP3.6 Y1-Y2 Detailed Design and Planning applications
WP3.7 Y2 Construction procurement and mobilisation
WP3.8 Y2 Construction
WP3.9 Y2 Launch Pilot Site
WP3.10 Y2-Y4 Site 1 operational
WP3.11 Y1-Y2 Design and planning approval sites 2, 3, 4 & 5
WP3.12 Y2 Construction procurement and mobilisation
WP3.13 Y3 Construction
WP3.14 Y3-Y4 Additional sites operational
WP4 All Micro-mobility
WP4.1 Y1 Initial scoping and market engagement.
WP4.2 Y1 Review Policy/ Define Scope and Requirements
WP4.3 Y1 Identify and review safety and legality considerations
WP4.4 Y1 Complete MOU/Concession Agreement/ Procure
WP4.5 Y1 Infrastructure provision and mobilisation
WP4.6 Y1 Trial Launch
WP4.7 Y1-Y4 Micro-Mobility Modes Operational
E-scooter trials
WP4.8 Y1 Identify and review safety and legality considerations
WP4.10 Y1 Develop regulatory framework for e-scooter trials
WP4.11 Y1-Y2 Deliver infrastructure changes for e-scooter trials
WP4.12 Y1-Y2 Implement regulatory approval
WP4.13 Y2 Commence e-scooter trials
WP4.14 Y3 Year one review and knowledge share
WP4.15 Y3-Y4 E-scooters widely available
WP5 All Dynamic Demand Responsive Travel
WP5.1 Y1 Initial scoping and market engagement (Airport Pilot)
WP5.2 Y1 Research operating areas / unserved need
WP5.3 Y1 Prioritise scheme objectives
WP5.4 Y1 Detailed Design (Airport Pilot)
WP5.5 Y1 Commence initial Airport pilot
WP5.6 Y1 Procure Back Office System as required
WP5.7 Y1 Procure operators / fleet as required
WP5.8 Y1-Y4 Optimise and Refine Operations
WP5.9 Y1 Scoping (Northern Arc Pilot)
WP5.10 Y1 Detailed Design (Northern Arc Pilot)
WP5.11 Y2 Commence Northern Arc pilot
WP5.12 Y3-Y4 Integrate with community transport and rural buses
WP6 All Evaluation and Monitoring
WP6.1 Y1 Establish baseline evaluation & monitoring plan
WP6.2 Y1-Y4 Evaluation and Monitoring quarterly progress reports
WP6.3 Y1 Y1 Evaluation and Monitoring/ Annual Report
WP6.4 Y2-Y4 Y2-4 Evaluation and Monitoring/ Annual Report
WP6.5 Y4 Final evaluation to support project continuation & legacy
WP7 All Programme Management and Comms
WP7.1 Y1 Define engagement and comms approach
WP7.2 Y1 Launch comms approach
WP7.3 Y1 Introduce Mobility Market place
WP7.4 Y2 Consult via Living Lab launches - across all schemes
WP7.5 Y2 Launch of West of England FMZ
WP7.6 Y4 Disseminate lessons learned & knowledge gained
2019 2020 2021 2022 2023
Financial year Q3 Financial year Q4 Financial year Q1 Financial year Q2 Financial year Q3
Table 13 – FMZ key milestones for 2019 - 2023

West of England Combined Authority – Future Mobility Zone – Final Proposal
46
WP Task Name
Oct Nov Dec Jan Feb Mar Apr May Jun Jul Aug Sep Oct Nov Dec
WP0 Project launch
WP0.1 Notification of DfT Award
WP0.2 Initial contact with Bidders
WP0.3 Agree interaction and collaboration with Bidders
WP0.4 Agree procurement and partnership approach
WP0.5 Appoint interim PM and project support from UA's
WP0.6 Appoint consultant via Professional Services Framework
WP0.7 Appoint permanent PM
WP0.8 Formulate Project Team
WP0.9 Formulate Evaluation team
WP0.10 Formulate Project Board
WP0.11 Commence partnership discussions & financial contributions
WP0.12 Agree enagement and comms approach
WP1 Data Hub
WP1.1 Forumlate Data Hub technical team
WP1.2 Initial scoping and market engagement
WP1.3 Define partnering approach for delivery
WP1.4 Budget scoping
WP1.5 Select / procure partner
WP1.6 Agree high level objectives
WP1.7 Review capabilities of existing Bristol Data Hub
WP1.8 Agree upgrades to Control Centre
WP1.9 Agree upgrades to ITS equipment
WP1.10 Agree upgrades to RTI equipment
WP1.11 User engagement and concensus building
WP1.12 Consider core set of technology for platform
WP1.13 Specify technical requirements from gap analysis
WP1.14 Data preparation
WP1.15 Scope 3rd party data and agree open data protocols
WP1.16 Detailed mapping of the region
WP1.17 Finalise technical design
WP1.18 Physical build of platform
WP1.19 Consider extended offers, data preparation services, etc
WP1.20 Migrate existing data sources
WP1.21 Evaluate, test, and reiterate data hub capabilities
WP1.22 Iteration 1 Launch
WP1.23 Development and build of Digital Twin
WP1.24 Evaluate and ongoing development
WP2 MAAS Platform
WP2.1 Forumlate MaaS technical team
WP2.2 Initial scoping and market engagement
WP2.3 Define partnering approach for delivery
WP2.4 Budget scoping
WP2.5 Select / procure partner
WP2.6 Agree high level objectives
WP2.7 Agree supporting data architecture
WP2.8 Specify technical requirements
WP2.9 API assessments, integration and development
WP2.10 User engagement and concensus building
WP2.11 Develop API Framework
WP2.12 Finalise technical design
WP2.13 User Interface Developments for various modes
WP2.14 Branding and Customisation of application
WP2.15 Develop Smart Search prioritisation of travel modes
WP2.16 Develop user guides
WP2.17 Data integration to platform
WP2.18 Testing
WP2.19 Identify initial cohort of users & launch trial
WP2.20 Review / Test / Evaluate trial platform
WP2.21 Capture feedback & prioritise functionality improvements
Mobility credits
WP2.22 Feasibility Assessment with Knowle West Media Centre
WP2.23 Identify areas and cohorts, commence design
2019 2020
Financial year Q3 Financial year Q4 Financial year Q1 Financial year Q2 Financial year Q3
Figure 15 – Detailed project plan for the first 12 months of the FMZ
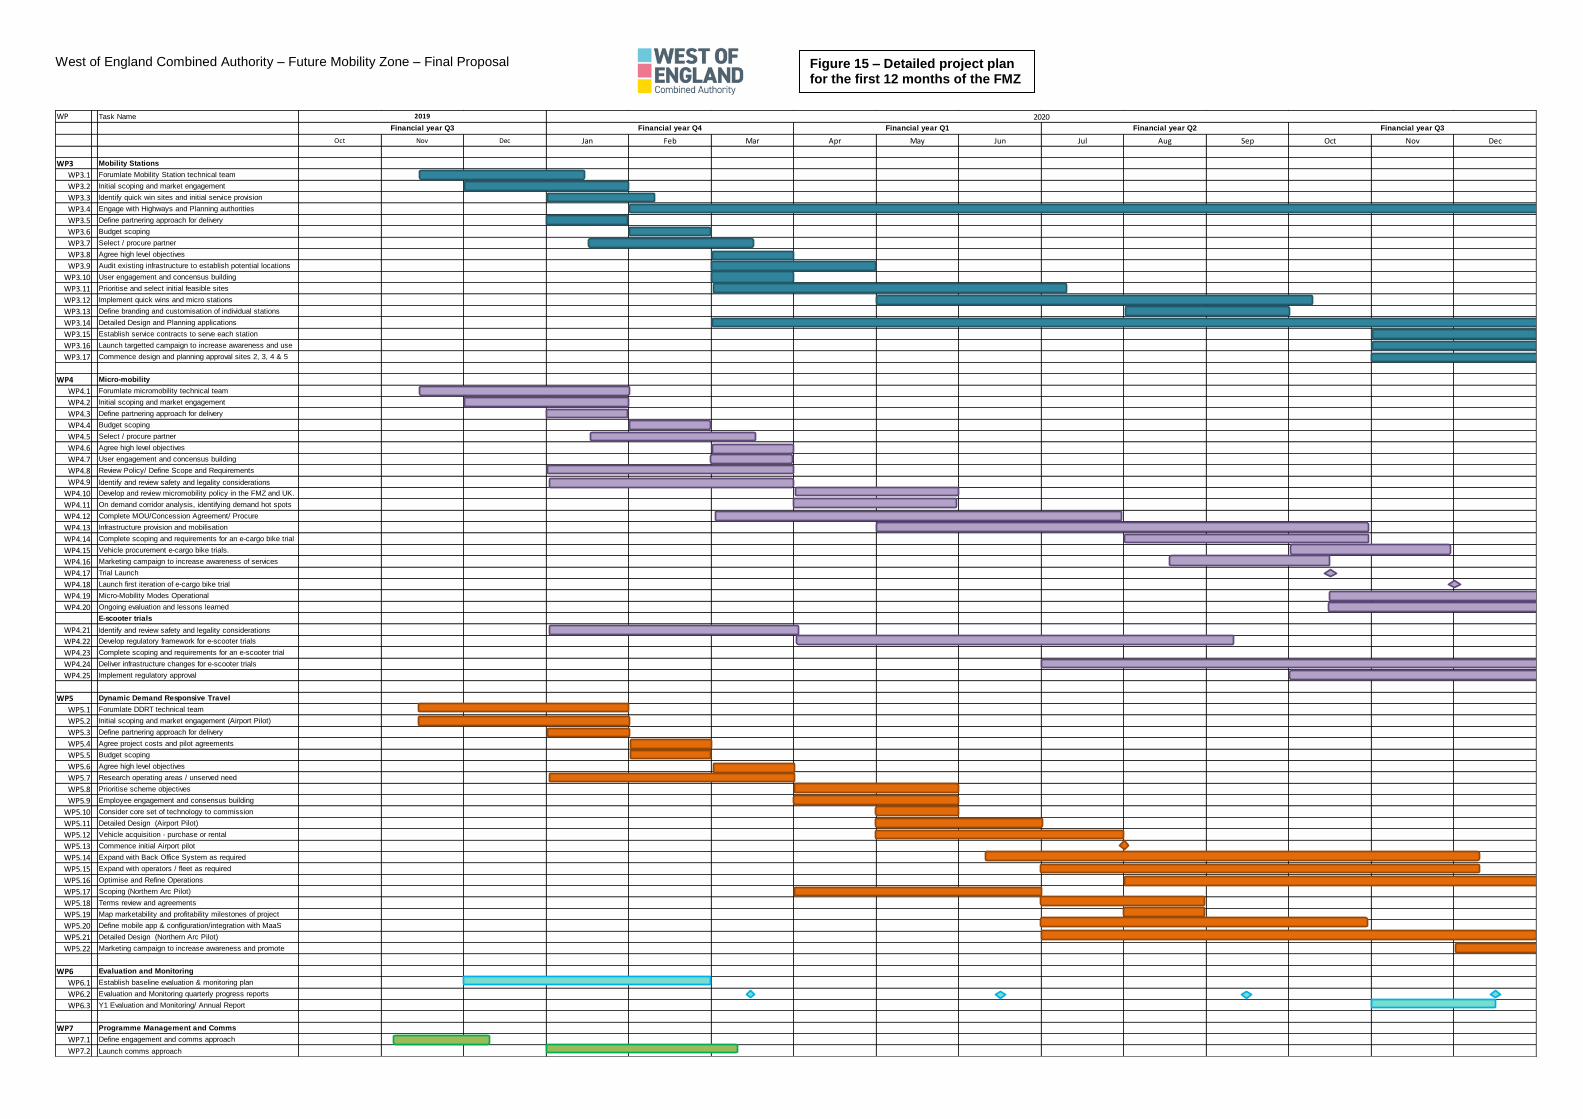
West of England Combined Authority – Future Mobility Zone – Final Proposal
47
WP Task Name
Oct Nov Dec Jan Feb Mar Apr May Jun Jul Aug Sep Oct Nov Dec
WP3 Mobility Stations
WP3.1 Forumlate Mobility Station technical team
WP3.2 Initial scoping and market engagement
WP3.3 Identify quick win sites and initial service provision
WP3.4 Engage with Highways and Planning authorities
WP3.5 Define partnering approach for delivery
WP3.6 Budget scoping
WP3.7 Select / procure partner
WP3.8 Agree high level objectives
WP3.9 Audit existing infrastructure to establish potential locations
WP3.10 User engagement and concensus building
WP3.11 Prioritise and select initial feasible sites
WP3.12 Implement quick wins and micro stations
WP3.13 Define branding and customisation of individual stations
WP3.14 Detailed Design and Planning applications
WP3.15 Establish service contracts to serve each station
WP3.16 Launch targetted campaign to increase awareness and use
WP3.17 Commence design and planning approval sites 2, 3, 4 & 5
WP4 Micro-mobility
WP4.1 Forumlate micromobility technical team
WP4.2 Initial scoping and market engagement
WP4.3 Define partnering approach for delivery
WP4.4 Budget scoping
WP4.5 Select / procure partner
WP4.6 Agree high level objectives
WP4.7 User engagement and concensus building
WP4.8 Review Policy/ Define Scope and Requirements
WP4.9 Identify and review safety and legality considerations
WP4.10 Develop and review micromobility policy in the FMZ and UK.
WP4.11 On demand corridor analysis, identifying demand hot spots
WP4.12 Complete MOU/Concession Agreement/ Procure
WP4.13 Infrastructure provision and mobilisation
WP4.14 Complete scoping and requirements for an e-cargo bike trial
WP4.15 Vehicle procurement e-cargo bike trials.
WP4.16 Marketing campaign to increase awareness of services
WP4.17 Trial Launch
WP4.18 Launch first iteration of e-cargo bike trial
WP4.19 Micro-Mobility Modes Operational
WP4.20 Ongoing evaluation and lessons learned
E-scooter trials
WP4.21 Identify and review safety and legality considerations
WP4.22 Develop regulatory framework for e-scooter trials
WP4.23 Complete scoping and requirements for an e-scooter trial
WP4.24 Deliver infrastructure changes for e-scooter trials
WP4.25 Implement regulatory approval
WP5 Dynamic Demand Responsive Travel
WP5.1 Forumlate DDRT technical team
WP5.2 Initial scoping and market engagement (Airport Pilot)
WP5.3 Define partnering approach for delivery
WP5.4 Agree project costs and pilot agreements
WP5.5 Budget scoping
WP5.6 Agree high level objectives
WP5.7 Research operating areas / unserved need
WP5.8 Prioritise scheme objectives
WP5.9 Employee engagement and consensus building
WP5.10 Consider core set of technology to commission
WP5.11 Detailed Design (Airport Pilot)
WP5.12 Vehicle acquisition - purchase or rental
WP5.13 Commence initial Airport pilot
WP5.14 Expand with Back Office System as required
WP5.15 Expand with operators / fleet as required
WP5.16 Optimise and Refine Operations
WP5.17 Scoping (Northern Arc Pilot)
WP5.18 Terms review and agreements
WP5.19 Map marketability and profitability milestones of project
WP5.20 Define mobile app & configuration/integration with MaaS
WP5.21 Detailed Design (Northern Arc Pilot)
WP5.22 Marketing campaign to increase awareness and promote
WP6 Evaluation and Monitoring
WP6.1 Establish baseline evaluation & monitoring plan
WP6.2 Evaluation and Monitoring quarterly progress reports
WP6.3 Y1 Evaluation and Monitoring/ Annual Report
WP7 Programme Management and Comms
WP7.1 Define engagement and comms approach
WP7.2 Launch comms approach
2019 2020
Financial year Q3 Financial year Q4 Financial year Q1 Financial year Q2 Financial year Q3
Figure 15 – Detailed project plan for the first 12 months of the FMZ
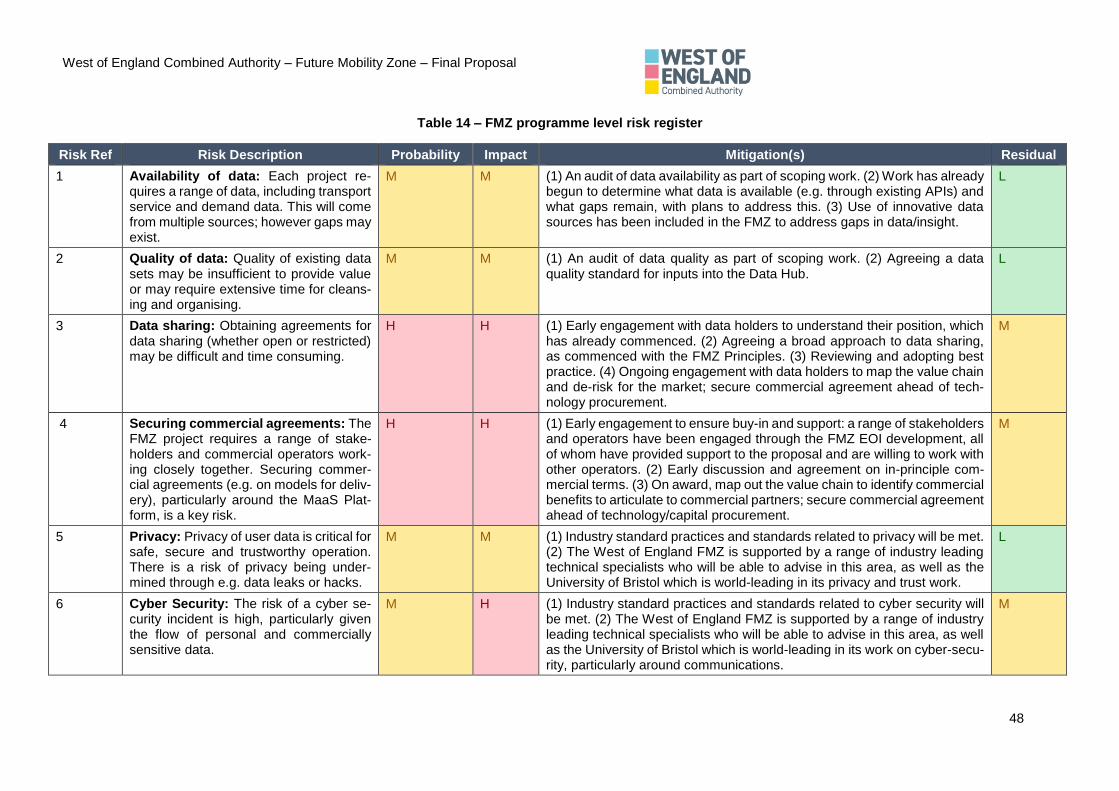
West of England Combined Authority – Future Mobility Zone – Final Proposal
48
Table 14 – FMZ programme level risk register
Risk Ref Risk Description Probability Impact Mitigation(s) Residual
1 Availability of data: Each project re-quires a range of data, including transport service and demand data. This will come from multiple sources; however gaps may exist.
M M (1) An audit of data availability as part of scoping work. (2) Work has already begun to determine what data is available (e.g. through existing APIs) and what gaps remain, with plans to address this. (3) Use of innovative data sources has been included in the FMZ to address gaps in data/insight.
L
2 Quality of data: Quality of existing data sets may be insufficient to provide value or may require extensive time for cleans-ing and organising.
M M (1) An audit of data quality as part of scoping work. (2) Agreeing a data quality standard for inputs into the Data Hub.
L
3 Data sharing: Obtaining agreements for data sharing (whether open or restricted) may be difficult and time consuming.
H H (1) Early engagement with data holders to understand their position, which has already commenced. (2) Agreeing a broad approach to data sharing, as commenced with the FMZ Principles. (3) Reviewing and adopting best practice. (4) Ongoing engagement with data holders to map the value chain and de-risk for the market; secure commercial agreement ahead of tech-nology procurement.
M
4 Securing commercial agreements: The FMZ project requires a range of stake-holders and commercial operators work-ing closely together. Securing commer-cial agreements (e.g. on models for deliv-ery), particularly around the MaaS Plat-form, is a key risk.
H H (1) Early engagement to ensure buy-in and support: a range of stakeholders and operators have been engaged through the FMZ EOI development, all of whom have provided support to the proposal and are willing to work with other operators. (2) Early discussion and agreement on in-principle com-mercial terms. (3) On award, map out the value chain to identify commercial benefits to articulate to commercial partners; secure commercial agreement ahead of technology/capital procurement.
M
5 Privacy: Privacy of user data is critical for safe, secure and trustworthy operation. There is a risk of privacy being under-mined through e.g. data leaks or hacks.
M M (1) Industry standard practices and standards related to privacy will be met. (2) The West of England FMZ is supported by a range of industry leading technical specialists who will be able to advise in this area, as well as the University of Bristol which is world-leading in its privacy and trust work.
L
6 Cyber Security: The risk of a cyber se-curity incident is high, particularly given the flow of personal and commercially sensitive data.
M H (1) Industry standard practices and standards related to cyber security will be met. (2) The West of England FMZ is supported by a range of industry leading technical specialists who will be able to advise in this area, as well as the University of Bristol which is world-leading in its work on cyber-secu-rity, particularly around communications.
M

West of England Combined Authority – Future Mobility Zone – Final Proposal
49
Risk Ref Risk Description Probability Impact Mitigation(s) Residual
7 Technology readiness: The technology required for each project may not be ma-ture enough for real-world trialling, requir-ing de-scoping or a scale back of activi-ties. This risks undermining evidence col-lation and the overall impact of the FMZ.
M H (1) Extensive market engagement commencing at EOI stage through Phase 2 and delivery to understand the maturity of the market and technol-ogy solutions. (2) Undertaking due diligence on suppliers and technology solutions. (3) Taking a solution agnostic approach at bid stage to prevent being locked into specific suppliers/technology. (4) Setting aside additional funding for risk based contingency and project enhancements as technol-ogy solutions mature and change.
L
8 Consumer uptake: Uptake of new modes/services may be too low to collate robust evidence, or to result in long-term commercially viable services.
M M (1) Early engagement with end-users, community groups (e.g. KWMC) and user-group representatives (e.g. SevernNet) to encourage uptake, as com-menced at EOI stage. (2) Taking a Living Lab approach so that solutions meet real needs and are therefore more likely to be adopted. (3) Extensive marketing and communications to raise awareness and adoption during de-livery. (4) Actioning lessons learnt from previous programmes/trials.
L
9 Market interest: Lack of interest from the market to deliver the proposed projects (e.g. due to requirements to share evalu-ation learnings).
M M (1) Extensive market engagement commencing at EOI stage through Phase 2 and delivery to ensure market interest in the proposed projects. (2) Adopting collaborative approaches to procurement to gain market input (as set out in Section F1.2). (3) Agreeing principles for delivery for the FMZ, with support from the market.
L
10 Market construct: There is a risk that negative market constructs may emerge in delivery of the FMZ and wider ecosys-tem for mobility in the West of England e.g. monopolisation, or siloed working.
M M (1) WECA working with stakeholders and government to identify plausible scenarios and possible interventions. (2) Agreeing principles for working in the FMZ with stakeholders. (3) Utilising appropriate interventions, policies, regulation and procurement techniques.
L
11 Safety: New modes trialled have a nega-tive impact on public safety.
L H (1) Only new services that can be proven to be safe and secure by design will be procured. (2) Suitable due-diligence by WECA and its partners. (3) Design of new services with key stakeholders e.g. police and road safety groups. (4) Monitoring and evaluation of new modes with public safety a key metric. (5) Rapid response to any negative impacts observed e.g. stop-ping a trial.
L
12 Timescales: Failure to deliver all projects and collate evidence within the life of the FMZ.
M M (1) Early scoping of projects in bid period and engagement with stakehold-ers. (2) Rapid mobilisation if awarded, working with DfT and key stakehold-ers. (3) Adopting suitable project management approaches, including a pro-gramme level approach to the FMZ.
L
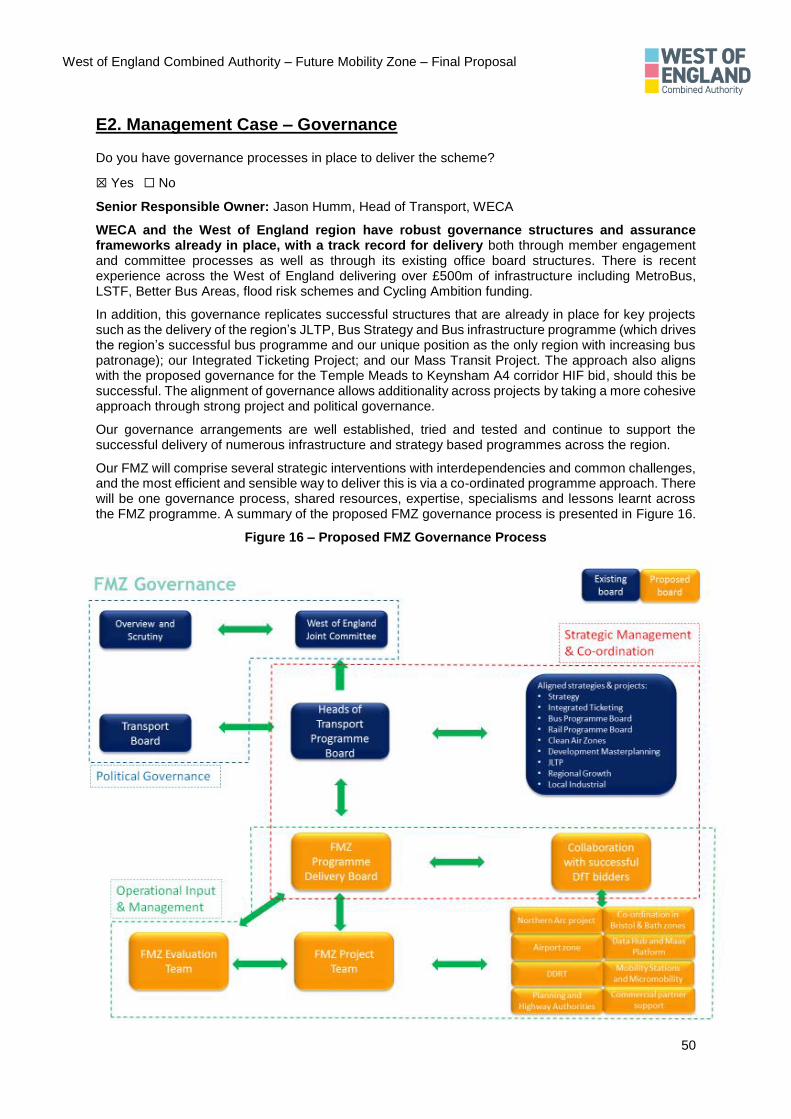
West of England Combined Authority – Future Mobility Zone – Final Proposal
50
E2. Management Case – Governance
Do you have governance processes in place to deliver the scheme?
☒ Yes ☐ No
Senior Responsible Owner: Jason Humm, Head of Transport, WECA
WECA and the West of England region have robust governance structures and assurance frameworks already in place, with a track record for delivery both through member engagement and committee processes as well as through its existing office board structures. There is recent experience across the West of England delivering over £500m of infrastructure including MetroBus, LSTF, Better Bus Areas, flood risk schemes and Cycling Ambition funding.
In addition, this governance replicates successful structures that are already in place for key projects such as the delivery of the region’s JLTP, Bus Strategy and Bus infrastructure programme (which drives the region’s successful bus programme and our unique position as the only region with increasing bus patronage); our Integrated Ticketing Project; and our Mass Transit Project. The approach also aligns with the proposed governance for the Temple Meads to Keynsham A4 corridor HIF bid, should this be successful. The alignment of governance allows additionality across projects by taking a more cohesive approach through strong project and political governance.
Our governance arrangements are well established, tried and tested and continue to support the successful delivery of numerous infrastructure and strategy based programmes across the region.
Our FMZ will comprise several strategic interventions with interdependencies and common challenges, and the most efficient and sensible way to deliver this is via a co-ordinated programme approach. There will be one governance process, shared resources, expertise, specialisms and lessons learnt across the FMZ programme. A summary of the proposed FMZ governance process is presented in Figure 16.
Figure 16 – Proposed FMZ Governance Process
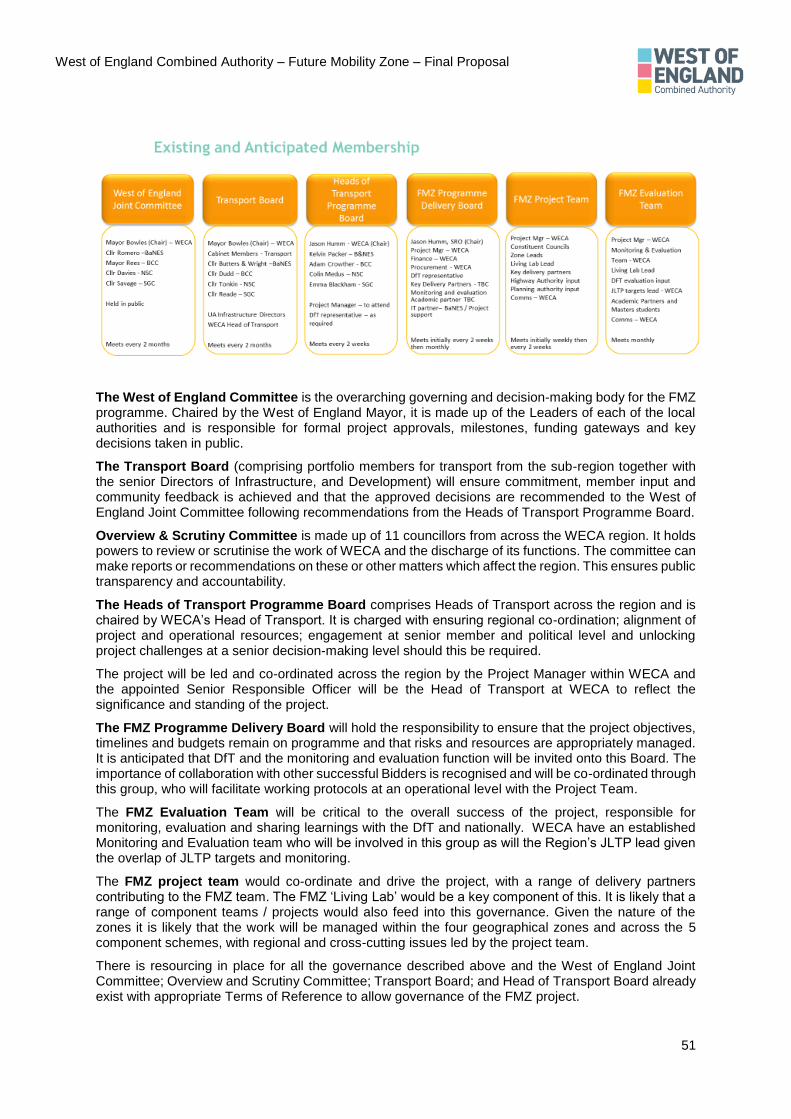
West of England Combined Authority – Future Mobility Zone – Final Proposal
51
The West of England Committee is the overarching governing and decision-making body for the FMZ programme. Chaired by the West of England Mayor, it is made up of the Leaders of each of the local authorities and is responsible for formal project approvals, milestones, funding gateways and key decisions taken in public.
The Transport Board (comprising portfolio members for transport from the sub-region together with the senior Directors of Infrastructure, and Development) will ensure commitment, member input and community feedback is achieved and that the approved decisions are recommended to the West of England Joint Committee following recommendations from the Heads of Transport Programme Board.
Overview & Scrutiny Committee is made up of 11 councillors from across the WECA region. It holds powers to review or scrutinise the work of WECA and the discharge of its functions. The committee can make reports or recommendations on these or other matters which affect the region. This ensures public transparency and accountability.
The Heads of Transport Programme Board comprises Heads of Transport across the region and is chaired by WECA’s Head of Transport. It is charged with ensuring regional co-ordination; alignment of project and operational resources; engagement at senior member and political level and unlocking project challenges at a senior decision-making level should this be required.
The project will be led and co-ordinated across the region by the Project Manager within WECA and the appointed Senior Responsible Officer will be the Head of Transport at WECA to reflect the significance and standing of the project.
The FMZ Programme Delivery Board will hold the responsibility to ensure that the project objectives, timelines and budgets remain on programme and that risks and resources are appropriately managed. It is anticipated that DfT and the monitoring and evaluation function will be invited onto this Board. The importance of collaboration with other successful Bidders is recognised and will be co-ordinated through this group, who will facilitate working protocols at an operational level with the Project Team.
The FMZ Evaluation Team will be critical to the overall success of the project, responsible for monitoring, evaluation and sharing learnings with the DfT and nationally. WECA have an established Monitoring and Evaluation team who will be involved in this group as will the Region’s JLTP lead given the overlap of JLTP targets and monitoring.
The FMZ project team would co-ordinate and drive the project, with a range of delivery partners contributing to the FMZ team. The FMZ ‘Living Lab’ would be a key component of this. It is likely that a range of component teams / projects would also feed into this governance. Given the nature of the zones it is likely that the work will be managed within the four geographical zones and across the 5 component schemes, with regional and cross-cutting issues led by the project team.
There is resourcing in place for all the governance described above and the West of England Joint Committee; Overview and Scrutiny Committee; Transport Board; and Head of Transport Board already exist with appropriate Terms of Reference to allow governance of the FMZ project.
West of England Combined Authority – Future Mobility Zone – Final Proposal
52
There are permanent members of staff both within WECA and the councils and our procurement processes will allow us to expand as the programme requires. We have a range of different skills between the different organisations, able to adapt to the different demands between programme components and varying resources. We will take a flexible approach, sharing resources where appropriate within the councils; across key partners and academia; and across other successful bidders where appropriate.
E3. Management Case – Monitoring
Do you agree, in principle, to undertake monitoring for each project in the FMZ scheme?
☒ Yes ☐ No
We agree to undertake monitoring as part of our wider monitoring and evaluation programme and have allocated a suitable budget for this.
E4. Management Case – Evaluation
WECA recognises the importance of collating robust evidence on the efficacy of the projects tested in the FMZ – on both an individual project and aggregated level. This evidence will not only help the West of England in understanding which innovations work in the real world, but will also provide evidence to Government and wider stakeholders on the lessons learnt, aiding replication. The evaluation approach for WECA’s FMZ consists of a range of qualitative and quantitative methods. Following discussions with the DfT, an emphasis has been placed on a process-based approach for each of the projects.
Although there are many similarities across the different FMZ projects, methodologies and approaches to evaluation may need to be adapted to address changing circumstances and project needs. Ultimately, WECA will work with the DfT to refine and agree a final evaluation prior to the project delivery.
Evaluation team
The evaluation team – which will be appointed post award – will comprise of world-renowned academics and independent consultants with a focus on transport and mobility research. For example, the Centre for Transport and Society at UWE which has experience in evaluating technology innovation projects (include CAV projects); whilst we may procure consultancy expertise. Our FMZ evaluation team will be fully integrated with the FMZ delivery team from Day 1. The objectives of the evaluation team will be to:
1. Develop and coordinate suitable methodologies for evaluation of projects within the FMZ. 2. Support the living lab approach by applying expertise in consumer research and public trials to
identify, stratify, and engage with a large population of potential project users. 3. Evaluate the impact on users e.g. changing behaviours and preferences. 4. Evaluate the impact on the transport system e.g. congestion and modal share. 5. Evaluate the impact on the environment e.g. air quality. 6. Evaluate wider outcomes related to regional productivity, job growth and inward investment,
aggregating benefits against investment cost wherever possible. 7. Collate evidence on the risks and opportunities of the projects.
As discussed with DfT, and in accordance with our iterative approach to testing and evaluation, we feel that the FMZ projects require mid-year evaluations. This agile approach allows the evaluation findings to influence design and delivery of the FMZ projects to achieve the expected outcomes and impacts.
Evaluation plans
For each project we have produced an evaluation plan, presented in Figure 17 to Figure 21. The overall approach to the evaluation plans is to test our assumptions, understand impacts, maximise learnings and share findings. Key assumptions that will be tested across the projects include:
1. Were the key assumptions on how the FMZ projects would function correct? Why or why not? To what extent?
2. What lessons have been learned from the projects and how have we used them to improve service offerings or replicated them elsewhere?
3. Has the FMZ helped to support the region’s strategic transport objectives? 4. Has the FMZ helped deliver a market for future mobility?

West of England Combined Authority – Future Mobility Zone – Final Proposal
53
In addition to focusing on key assumptions and lessons learned, the FMZ will evaluate the performance of transportation outcomes and wider economic impacts such as mode share and air quality.
Dissemination and replication
Through our joint process- and impact-based approach, the West of England FMZ will effectively evaluate large scale projects and contribute to a growing and shared evidence-base. Of key importance is the appropriate and effective dissemination of this evidence, including an annual evaluation report as well as other tools and techniques like public awareness campaigns, academic publications and more.
We will actively disseminate the findings of our evaluation, working with DfT and other FMZs. This evidence will inform future iterations of FMZ trials and projects, as well as inform policy, commercial, and regulatory measures for emerging transport technologies and innovations throughout the UK and the world. Due to the emphasis of a process-based evaluation approach, the FMZ is uniquely placed to provide relevant and replicable findings to the globe, such as the opportunities and challenges around commercial agreements for data sharing within the Data Hub and MaaS Platform.
Evaluation data
The quality and availability of data is critical to the effectiveness of our evaluation. This covers both baseline and future data. Quantitative and qualitative data will be collated from (1) existing sources, (2) outputs of the Data Hub and MaaS Platform, and (3) additional data collection e.g. user research on behavioural change and journey preferences through surveys and other deep-dive research techniques. The evaluation approach will be an ongoing activity throughout the project, reporting at regular intervals.
Data Hub evaluation – Figure 17
Key evaluation questions and lessons to capture from the Data Hub and the Digital Twin include their ability to enable optimisation and efficiency of the transport system and to improve resilience to deal with incidents/disruption. This will extend to understanding how improved data leads to more informed decision making, and wider impacts on the transport system e.g. increasing walking and cycling.
We will also examine the extent to which the Data Hub it is responsible for triggering new innovations in the market. This will look out how many new markets and/or products and services have been introduced, what savings or efficiencies (for both public and private sectors) have achieved from better insight, as well as whether the expected collaboration, partnerships, and agreements have materialized.
MaaS Platform evaluation – Figure 18
The evaluation of MaaS will focus on its effects on: (1) behaviour change, (2) connectivity, (3) network optimisation, (4) delivery of wider strategic objectives and (5) improving access to employment sites. Additionally, the evaluation of MaaS will try to understand how it complements other FMZ projects, including its ability to support the DDRT, micromobility, and Mobility Station projects, and how it compliments TCF investment.
As the Data Hub and MaaS Platform are so closely interlinked, additional learning will need to focus on their inter-operability. This will examine: (1) the challenges and lessons learnt from the development of the Data Hub and MaaS Platforms, and (2) whether integration of the Data Hub with MaaS has improved insights intro transport use, e.g. regarding the use of Mobility Credits and the benefits delivered.
Mobility Stations evaluation – Figure 19
The evaluation of Mobility Stations will examine whether they have improved the awareness and use of public transport and active other modes, especially with respect to improving modal interchanges and first/last mile connectivity. The overall impact of the stations on the air quality performance will be evaluated by monitoring the air quality levels in the area before and after the delivery of the stations.
Additionally, the evaluation will review if the stations have improved location specific connectivity, particularly with respect to employment sites and areas of deprivation. This will involve understanding what has (and has not) worked to improve connectivity as well as wider impacts on housing and employment in areas nearby the stations and the effect Mobility Credits might have on users.
DDRT evaluation – Figure 20
For the successful evaluation of DDRT, key understandings will need to be gained in how DDRT can facilitate first/last mile connectivity, to increase use of existing transport services, particularly in
West of England Combined Authority – Future Mobility Zone – Final Proposal
54
maximizing occupancy rates. We will also examine how DDRT impacts behaviour change and supports access to employment and can build on TCF investment.
The evaluation of DDRT will consider how effectively DDRT has been integrated with other transport services and FMZ projects. The uptake and use of DDRT will be particularly useful in understanding the demand for these services as well as the commercial viability of DDRT. This will help identify how DDRT has helped to unlock additional benefits of other investments such as CAZ and TCF.
Micromobility evaluation – Figure 21
Our micromobility project creates an opportunity for the evaluation of new and experimental products and services. In addition to discovering fundamental safety, policy, and regulatory findings, the key understanding is the impact that micromobility might have on the first and last mile connectivity issues, particularly with regards to access to employment and freight delivery. Additionally, an understanding of how micromobility has helped to support other modes like public transport, walking and cycling, will be critical to understanding the effects of the project on behaviour change.
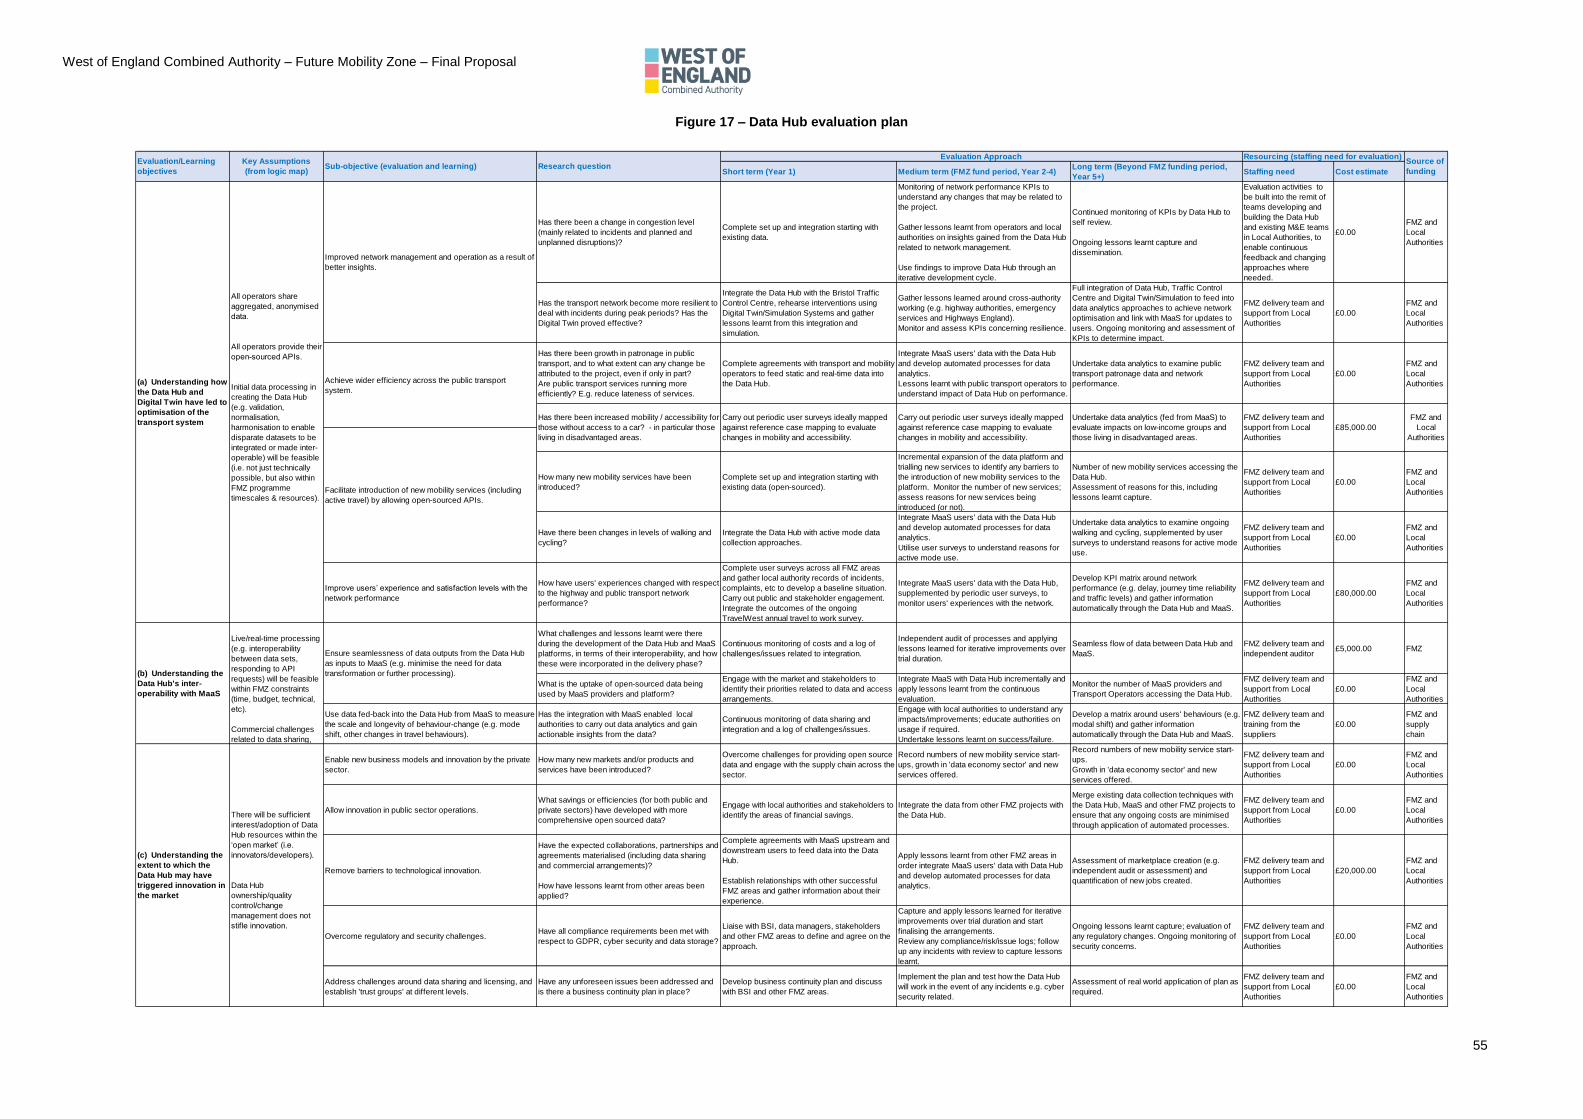
West of England Combined Authority – Future Mobility Zone – Final Proposal
55
Figure 17 – Data Hub evaluation plan
Short term (Year 1) Medium term (FMZ fund period, Year 2-4)Long term (Beyond FMZ funding period,
Year 5+)Staffing need Cost estimate
Has there been a change in congestion level
(mainly related to incidents and planned and
unplanned disruptions)?
Complete set up and integration starting with
existing data.
Monitoring of network performance KPIs to
understand any changes that may be related to
the project.
Gather lessons learnt from operators and local
authorities on insights gained from the Data Hub
related to network management.
Use findings to improve Data Hub through an
iterative development cycle.
Continued monitoring of KPIs by Data Hub to
self review.
Ongoing lessons learnt capture and
dissemination.
Evaluation activities to
be built into the remit of
teams developing and
building the Data Hub
and existing M&E teams
in Local Authorities, to
enable continuous
feedback and changing
approaches where
needed.
£0.00
FMZ and
Local
Authorities
Has the transport network become more resilient to
deal with incidents during peak periods? Has the
Digital Twin proved effective?
Integrate the Data Hub with the Bristol Traffic
Control Centre, rehearse interventions using
Digital Twin/Simulation Systems and gather
lessons learnt from this integration and
simulation.
Gather lessons learned around cross-authority
working (e.g. highway authorities, emergency
services and Highways England).
Monitor and assess KPIs concerning resilience.
Full integration of Data Hub, Traffic Control
Centre and Digital Twin/Simulation to feed into
data analytics approaches to achieve network
optimisation and link with MaaS for updates to
users. Ongoing monitoring and assessment of
KPIs to determine impact.
FMZ delivery team and
support from Local
Authorities
£0.00
FMZ and
Local
Authorities
Has there been growth in patronage in public
transport, and to what extent can any change be
attributed to the project, even if only in part?
Are public transport services running more
efficiently? E.g. reduce lateness of services.
Complete agreements with transport and mobility
operators to feed static and real-time data into
the Data Hub.
Integrate MaaS users' data with the Data Hub
and develop automated processes for data
analytics.
Lessons learnt with public transport operators to
understand impact of Data Hub on performance.
Undertake data analytics to examine public
transport patronage data and network
performance.
FMZ delivery team and
support from Local
Authorities
£0.00
FMZ and
Local
Authorities
How many new mobility services have been
introduced?
Complete set up and integration starting with
existing data (open-sourced).
Incremental expansion of the data platform and
trialling new services to identify any barriers to
the introduction of new mobility services to the
platform. Monitor the number of new services;
assess reasons for new services being
introduced (or not).
Number of new mobility services accessing the
Data Hub.
Assessment of reasons for this, including
lessons learnt capture.
FMZ delivery team and
support from Local
Authorities
£0.00
FMZ and
Local
Authorities
Have there been changes in levels of walking and
cycling?
Integrate the Data Hub with active mode data
collection approaches.
Integrate MaaS users' data with the Data Hub
and develop automated processes for data
analytics.
Utilise user surveys to understand reasons for
active mode use.
Undertake data analytics to examine ongoing
walking and cycling, supplemented by user
surveys to understand reasons for active mode
use.
FMZ delivery team and
support from Local
Authorities
£0.00
FMZ and
Local
Authorities
Improve users’ experience and satisfaction levels with the
network performance
How have users' experiences changed with respect
to the highway and public transport network
performance?
Complete user surveys across all FMZ areas
and gather local authority records of incidents,
complaints, etc to develop a baseline situation.
Carry out public and stakeholder engagement.
Integrate the outcomes of the ongoing
TravelWest annual travel to work survey.
Integrate MaaS users' data with the Data Hub,
supplemented by periodic user surveys, to
monitor users' experiences with the network.
Develop KPI matrix around network
performance (e.g. delay, journey time reliability
and traffic levels) and gather information
automatically through the Data Hub and MaaS.
FMZ delivery team and
support from Local
Authorities
£80,000.00
FMZ and
Local
Authorities
What challenges and lessons learnt were there
during the development of the Data Hub and MaaS
platforms, in terms of their interoperability, and how
these were incorporated in the delivery phase?
Continuous monitoring of costs and a log of
challenges/issues related to integration.
Independent audit of processes and applying
lessons learned for iterative improvements over
trial duration.
Seamless flow of data between Data Hub and
MaaS.
FMZ delivery team and
independent auditor£5,000.00 FMZ
What is the uptake of open-sourced data being
used by MaaS providers and platform?
Engage with the market and stakeholders to
identify their priorities related to data and access
arrangements.
Integrate MaaS with Data Hub incrementally and
apply lessons learnt from the continuous
evaluation.
Monitor the number of MaaS providers and
Transport Operators accessing the Data Hub.
FMZ delivery team and
support from Local
Authorities
£0.00
FMZ and
Local
Authorities
Use data fed-back into the Data Hub from MaaS to measure
the scale and longevity of behaviour-change (e.g. mode
shift, other changes in travel behaviours).
Has the integration with MaaS enabled local
authorities to carry out data analytics and gain
actionable insights from the data?
Continuous monitoring of data sharing and
integration and a log of challenges/issues.
Engage with local authorities to understand any
impacts/improvements; educate authorities on
usage if required.
Undertake lessons learnt on success/failure.
Develop a matrix around users' behaviours (e.g.
modal shift) and gather information
automatically through the Data Hub and MaaS.
FMZ delivery team and
training from the
suppliers
£0.00
FMZ and
supply
chain
Enable new business models and innovation by the private
sector.
How many new markets and/or products and
services have been introduced?
Overcome challenges for providing open source
data and engage with the supply chain across the
sector.
Record numbers of new mobility service start-
ups, growth in 'data economy sector' and new
services offered.
Record numbers of new mobility service start-
ups.
Growth in 'data economy sector' and new
services offered.
FMZ delivery team and
support from Local
Authorities
£0.00
FMZ and
Local
Authorities
Allow innovation in public sector operations.
What savings or efficiencies (for both public and
private sectors) have developed with more
comprehensive open sourced data?
Engage with local authorities and stakeholders to
identify the areas of financial savings.
Integrate the data from other FMZ projects with
the Data Hub.
Merge existing data collection techniques with
the Data Hub, MaaS and other FMZ projects to
ensure that any ongoing costs are minimised
through application of automated processes.
FMZ delivery team and
support from Local
Authorities
£0.00
FMZ and
Local
Authorities
Remove barriers to technological innovation.
Have the expected collaborations, partnerships and
agreements materialised (including data sharing
and commercial arrangements)?
How have lessons learnt from other areas been
applied?
Complete agreements with MaaS upstream and
downstream users to feed data into the Data
Hub.
Establish relationships with other successful
FMZ areas and gather information about their
experience.
Apply lessons learnt from other FMZ areas in
order integrate MaaS users' data with Data Hub
and develop automated processes for data
analytics.
Assessment of marketplace creation (e.g.
independent audit or assessment) and
quantification of new jobs created.
FMZ delivery team and
support from Local
Authorities
£20,000.00
FMZ and
Local
Authorities
Overcome regulatory and security challenges.Have all compliance requirements been met with
respect to GDPR, cyber security and data storage?
Liaise with BSI, data managers, stakeholders
and other FMZ areas to define and agree on the
approach.
Capture and apply lessons learned for iterative
improvements over trial duration and start
finalising the arrangements.
Review any compliance/risk/issue logs; follow
up any incidents with review to capture lessons
learnt.
Ongoing lessons learnt capture; evaluation of
any regulatory changes. Ongoing monitoring of
security concerns.
FMZ delivery team and
support from Local
Authorities
£0.00
FMZ and
Local
Authorities
Address challenges around data sharing and licensing, and
establish 'trust groups' at different levels.
Have any unforeseen issues been addressed and
is there a business continuity plan in place?
Develop business continuity plan and discuss
with BSI and other FMZ areas.
Implement the plan and test how the Data Hub
will work in the event of any incidents e.g. cyber
security related.
Assessment of real world application of plan as
required.
FMZ delivery team and
support from Local
Authorities
£0.00
FMZ and
Local
Authorities
Resourcing (staffing need for evaluation)Source of
funding
(a) Understanding how
the Data Hub and
Digital Twin have led to
optimisation of the
transport system
All operators share
aggregated, anonymised
data.
All operators provide their
open-sourced APIs.
Initial data processing in
creating the Data Hub
(e.g. validation,
normalisation,
harmonisation to enable
disparate datasets to be
integrated or made inter-
operable) will be feasible
(i.e. not just technically
possible, but also within
FMZ programme
timescales & resources).
Improved network management and operation as a result of
better insights.
Achieve wider efficiency across the public transport
system.
Has there been increased mobility / accessibility for
those without access to a car? - in particular those
living in disadvantaged areas.
Carry out periodic user surveys ideally mapped
against reference case mapping to evaluate
changes in mobility and accessibility.
Undertake data analytics (fed from MaaS) to
evaluate impacts on low-income groups and
those living in disadvantaged areas.
Evaluation/Learning
objectives
Key Assumptions
(from logic map)Sub-objective (evaluation and learning) Research question
Evaluation Approach
(b) Understanding the
Data Hub's inter-
operability with MaaS
Live/real-time processing
(e.g. interoperability
between data sets,
responding to API
requests) will be feasible
within FMZ constraints
(time, budget, technical,
etc).
Commercial challenges
related to data sharing,
(c) Understanding the
extent to which the
Data Hub may have
triggered innovation in
the market
There will be sufficient
interest/adoption of Data
Hub resources within the
‘open market’ (i.e.
innovators/developers).
Data Hub
ownership/quality
control/change
management does not
stifle innovation.
Ensure seamlessness of data outputs from the Data Hub
as inputs to MaaS (e.g. minimise the need for data
transformation or further processing).
Carry out periodic user surveys ideally mapped
against reference case mapping to evaluate
changes in mobility and accessibility.
FMZ delivery team and
support from Local
Authorities
£85,000.00
FMZ and
Local
Authorities
Facilitate introduction of new mobility services (including
active travel) by allowing open-sourced APIs.

West of England Combined Authority – Future Mobility Zone – Final Proposal
56
Figure 18 – Maas Platform evaluation plan
Short term (Year 1)Medium term (FMZ fund period, Year 2-
4)
Long term (Beyond FMZ funding period, Year
5+)Staffing need
Cost
estimate
Has there been a change in congestion
levels and mode share due to the
scheme?
Identify key metrics to monitor and how this can
be done through existing data sets and use of
the Data Hub and MaaS app.
Ongoing monitoring through the app, and
monitoring network performance KPIs
Determine the effect of MaaS on the transport
network and its users. Develop a matrix around
users' behaviours (e.g. modal shift) and gather
information about network performance automatically
through the Data Hub and MaaS.
FMZ delivery team
and support from
Local Authorities
£0.00
FMZ and
MaaS
Operator
What challenges were identified in brining
about modal or behavioural change, and
how were they overcome?
Engage with the potential users of MaaS and
get their feedback on the current situation and
what type of solution would suit them for using
alternative modes and/or journeys.
Measures to evaluate MaaS performance
and user satisfaction levels.
Determine whether new alternative modes and
routes are utilised by users.
FMZ delivery team
and support from
Local Authorities
£35,000.00
FMZ and
MaaS
Operator
Improve users’ experience and
satisfaction levels with the
network performance
How have users' experiences changed?
Engage with the potential users of MaaS
through focus group and user surveys. Analyse
local authority records of incidents, complaints
related to network performance
Evaluate journey quality of MaaS users.
Undertake user satisfaction surveys and compare
the numbers and nature of complaints with Y1
results. Review potential analysis of changes in
journey time variability and/or delay metrics.
FMZ delivery team
and support from
Local Authorities
£50,000.00
FMZ and
Local
Authorities
Achieve integration with transport
services and operators.
Has Maas effectively integrated various
transport services and created wider
efficiency across the network?
Understand the challenges and issues related
to integrating MaaS across various operators
and service providers. Lessons learned from
this integration.
Apply lessons learnt and integrate more
services with MaaS. Ongoing assessment
of integration using KPIs are required.
Measure and evaluate the number of service
providers operating through and outside MaaS
platform, as well as system efficiencies.
FMZ delivery team
and support from
Local Authorities
£0.00
FMZ and
MaaS
Operator
Achieve wider efficiency across
the public transport system .
Has there been growth in public transport
patronage, and to what extent can any
change be attributed to the project, even if
only in part?
Examine whether the assumptions around
MaaS support public transport and have
encouraged its use
Data collection (bus and rail patronage
data from operators and/or via local
authority service contracts, for example);
user surveys.
Undertake data analytics to examine public transport
patronage data and feed into KPI matrix.
FMZ delivery team
and support from
Local Authorities
£0.00
FMZ and
MaaS
Operator
What is the uptake of MaaS?Engage with market and users early to identify
MaaS priorities and determine access.
Integrate MaaS with Data Hub
incrementally and apply lessons learnt
from the continuous evaluation.
Measure the number of MaaS users and
operators using the platform.
Measure the number of MaaS providers, users, and
transport operators.
FMZ delivery team
and support from
Local Authorities
£0.00
FMZ and
MaaS
Operator
How will mobility credits help increase
access to employment and deliver job
growth?
Engage with the potential recipients of credits
and get their feedback on the current situation
and what type of credits would suit them.
Record number of people getting into
employment and skills across FMZ areas
(compared to a neutral case) and apply
lessons learnt from Y1.
Number of people in long term employment.
FMZ delivery team
and Job Centre
Plus
£0.00Local
Authorities
How and why are mobility credits are
being used? Who benefits most from
Mobility Credits and why? What is the
scale of benefits?
Engage with the employers and potential
recipients of credits and get their feedback on
the current situation and what type of credits
should be provided to the recipients.
Develop various types of credits and the ways
of distributing and consuming these across
FMZ areas.
Record number of people getting into
employment and skills compared across
FMZ areas and apply lessons learnt from
Y1.
Develop a log of lessons learnt for
mobility credits with respect to their
effectiveness and method of distribution.
Assess whether withdrawal of mobility credits has a
negative impact on employment (access and
numbers)
FMZ delivery team
and Job Centre
Plus
£50,000.00
FMZ and
MaaS
Operator
Achieve correspondence /
seamlessness of data outputs
from Data Hub as inputs to MaaS
(e.g. minimise the need for data
transformation or further
processing)
What challenges and lessons learnt were
there during the development of the Data
Hub and MaaS platforms, in terms of their
interoperability?
Continuous monitoring of costs and a log of
challenges/issues related to this integration
Brining independent audit of processes
and applying lessons learned for iterative
improvements over trial duration.
Continuous monitoring and evaluation of issues.
FMZ delivery team
and independent
auditor
£0.00
FMZ and
MaaS
Operator
Adapt/modify services due to
data analysis and feedback from
MaaS and the Data Hub.
Have transport services been amended
as a result of insight from the MaaS
Platform and Data Hub?
Complete set up of MaaS and integration with
transport service operators and providers,
starting with existing services.
Monitoring of service provision; speaking
to operators and services planners to
understand lessons learnt.
Number of new mobility services or services
modified utilising MaaS data.
FMZ delivery team
and support from
Local Authorities
£0.00
FMZ and
MaaS
Operator
Evaluate cumulative effect of
MaaS, Clean Air Zones (CAZ)
and Transforming Cities Fund
(TCF).
What are the cumulative benefits of MaaS,
CAZ and TCF projects in the region?
Evaluate and determine if MaaS has an effect
and to what extent on CAZ and TCF projects.
Establish understanding of evaluation process
of CAZ and TCF investment and integrate with
MaaS where it is possible
Examine and analyse MaaS operations in
TCF and CAZ areas and compare against
the base line/ do minimum scenario.
Measure public transport use; research additional
patronage due to MaaS components; and evaluate
impacts on car use and air quality.
FMZ delivery team
and support from
Local Authorities
£35,000.00
FMZ and
Local
Authorities
What is the uptake of the other projects
(e.g. micromobility)? How often are they
booked/used from MaaS?
Engage with market and users early to identify
MaaS service priorities. Data collection through
Data Hub/MaaS platform
Integrate MaaS with other schemes
incrementally and apply lessons learnt
from the continuous evaluation.
Measure the number of users, and transport
operators under the other FMZ schemes like micro
mobility and DDRT.
FMZ delivery team
and support from
Local Authorities
£0.00
FMZ and
MaaS
Operator
What is the demand for these services?
Engage with market and users early to identify
their mobility needs. User-reported, and
MaaS/Data hub reports
Incrementally integrate MaaS with FMZ
schemes; monitor demand.
Measure number of users, their experience and
satisfaction level with other FMZ projects.
FMZ delivery team
and support from
Local Authorities
£0.00
FMZ and
Local
Authorities
Improve the accessibility of
employees to employment sites
in areas of deprivation.
Has MaaS helped improve connectivity to
employment areas?
Carry out user surveys in the disadvantaged
areas, ideally develop a reference case
mapping analysis based on public engagement
Carry out periodic user surveys, also
ideally mapped against reference case
mapping to evaluate mobility and
accessibility.
Undertake data analytics (fed from MaaS) to
evaluate the impact on the low-income groups and
those living in the disadvantaged areas.
Increases in employee catchment areas.
Measure staff retention rates.
FMZ delivery team
and support from
Local Authorities
£40,000.00
FMZ and
Local
Authorities
Facilitate technological
innovation.
Are new services and providers entering
the market? Have the expected
collaboration and research partnerships
materialised?
Have any unforeseen developments
emerged?
Overcome challenges for providing open
source data and engage with supply chain
across the sector. Complete agreements with
MaaS upstream and downstream users to feed
data into Data Hub
Record numbers of new mobility service
start-ups, growth in 'data economy sector'
and new services offered. Engage with
the market for feedback; undertake a
market assessment.
Record numbers of new mobility service start-ups,
growth in 'data economy sector' and new services
offered.
FMZ delivery team
and support from
Local Authorities
£0.00
FMZ,
MaaS
Operator
and Local
Authorities
Enable wider impacts on housing
and employment.
What difficulties / lessons learnt in terms
of employment and deprivation has MaaS
brought attention to?
Engage with local authorities, stakeholder,
developers and employers to identify the areas
of wider impacts where MaaS could be useful.
Measure the number of jobs created due
to MaaS (direct, indirect or supply chain).
Assessment of marketplace creation (e.g.
independent audit or assessment) and quantification
of new jobs created. Assess whether behavioural
change from MaaS has helped unlock new housing.
FMZ delivery team
and support from
Local Authorities
£0.00
FMZ and
Local
Authorities
Deliver a long term impact on
employment and productivity
Have people taken jobs in areas they
previously would not have considered?
Monitor and assess changes in employment
and market creation.
Record number of people getting into
employment and skills compared across
FMZ areas and apply lessons learnt from
Y1.
Number of people in long term employment,
mapped against reference case including staff
retention rates.
Measure mode share against the baseline situation.
FMZ delivery team
and Job Centre
Plus
£32,000.00
FMZ and
Local
Authorities
Track the uptake and
effectiveness of Mobility Credits
including methods of distributing
and consuming these.
(a) Understand if MaaS
has encouraged
behaviour change
amongst it users
(including the
effectiveness of
mobility credits) and
what commercial
model(s) suit MaaS.
Integration of modes and
transport networks allows
for better routing and
mode choices amongst
users (including
integrated ticketing).
Challenge of getting
commercial agreements,
e.g. data sharing are
resolved.
Information provided as
part of MaaS is able to
link with private and public
sector data.
Sufficient users' uptake is
achieved for MaaS
operation to be financially
sustainable.
Risks around commercial
feasibility, e.g. contracts,
agreements between
providers are resolved.
Mobility credits can be
used in MaaS app; and
that they work to improve
access to employment.
Source of
funding
Ability of MaaS to support the
use of other modes, alternative
routes, and/or reduce the overall
travel times.
Key AssumptionsEvaluation/Learning
objectivesSub-objective Research question
Evaluation Approach Resourcing (staffing need for
(c) Understand how
MaaS impacts the
wider economy.
MaaS will serve a wide
area and provide real
time travel information to
its users that
complements and
enhances the existing
public transport offerings.
(b) Understand how
MaaS complements
other FMZ schemes
and helps deliver wider
strategic transport
objectives.
Track the uptake and
effectiveness of MaaS to support
DDRT, Mobility Stations, and
Micro mobility.
Sufficient data and quality
from the Data Hub to
feed into the MaaS
platform / good inter-
operability between Data
Hub and MaaS.
MaaS platform collects
sufficient data to feed
back into the data hub.

West of England Combined Authority – Future Mobility Zone – Final Proposal
57
Figure 19 – Mobility Station evaluation plan
Short term (Year 1) Medium term (FMZ fund period, Year 2-4)Long term (Beyond FMZ funding period,
Year 5+)Staffing need Cost estimate
Achieve wider efficiency across
the public transport system.
Has there been growth in patronage and
vehicle occupancy of public transport, and to
what extent can any change be attributed to
the project, even if only in part?
Examine whether the assumption regarding
Mobility Stations being able to support public
transport use is accurate by engaging with
public transport users
Collect public transport data (from operators
and/or via local authority service contracts, for
example) and engage with the public to refine
the project based on the lessons learnt.
Undertake data analytics to examine public
transport patronage and vehicle occupancy
data.
FMZ delivery team
and support from
Local Authorities
£40,000.00
FMZ and
Local
Authorities
How have users' experiences changed with
respect to their end-to-end journeys?
Complete user surveys across all FMZ areas
and gather local authority records of
complaints etc. to develop a baseline
situation.
Carry out public and stakeholder
engagement.
Integrate Mobility Station users' data with MaaS
and Data Hub, supplemented by periodic user
surveys, to monitor users' experience with the
Mobility Stations.
Develop KPI matrix around performance (e.g.
users' satisfaction, quality of service and mode
share levels) .
FMZ delivery team
and support from
Local Authorities
£50,000.00
FMZ and
Mobility
Station
Operator
Have there been changes in levels of walking
and cycling?
Examine whether the assumption regarding
Mobility Stations supporting active modes is
correct by analysing appropriate datasets.
Analyse travel to work surveys and carry out
interviews with the users of Mobility Stations.
Evaluate public health improvements, uptake of
active modes and air quality levels.
FMZ delivery team
and support from
Local Authorities
£60,000.00
FMZ and
Local
Authorities
Is there an increased sense of place or other
wider impacts such as security or landscape
improvements?
Liaise with authorities, stakeholders and other
FMZ areas to define and agree on the
approach, and design Mobility Stations to
meet the needs of users based on their
feedback and preferences.
User surveys to understand impact; capture
lessons learnt.
Develop KPI matrix around performance (e.g.
users' satisfaction, quality of service and mode
share levels).
FMZ delivery team
and support from
Local Authorities
£3,000.00
FMZ and
Local
Authorities
What is the uptake and use of Mobility
Stations?
Engage with the market and users early to
identify Mobility Station service priorities.
Monitor uptake and usage; undertake deep
dive research if required.
Measure the number of operators and service
providers, users, and transport operators
utilising Mobility Stations.
FMZ delivery team
and support from
Local Authorities
£0.00
FMZ and
Mobility
Station
Operator
How are Mobility Stations being used?
Collect data about journey origins and
destinations, and time of day and purpose.
Report data to MaaS/Data Hub.
Use of data to monitor how different
modes/services are being utilised; monitor
usage visually; user surveys.
Evaluate the utilisation rate of Mobility Stations
and develop a profile of services and mode
used frequently.
FMZ delivery team
and support from
Local Authorities
£30,000.00
FMZ and
Local
Authorities
Have Mobility Stations improved connectivity?
What has worked and what has not?
Carry out user surveys in Northern Arc and
establish baseline information.
Carry out periodic user surveys and measure
the connectivity from residential areas to key
employment centres.
Undertake data analytics to evaluate the impact
on low-income groups and those living in
disadvantaged areas.
FMZ delivery team
and support from
Local Authorities
£30,000.00
FMZ and
Local
Authorities
What have been the wider impacts on housing
and employment in areas near Mobility
Stations?
Set up a baseline about the placemaking and
wayfinding in the area and the number of
alternative options available to users.
Evaluate the impact of placemaking and
wayfinding on people e.g. through user
surveys; understand the impact on local
retailers/commerce through data collection and
surveys.
Assess long term impact on
communities/places e.g. land value.
FMZ delivery team
and support from
Local Authorities
£0.00
FMZ and
Local
Authorities
Enable new business models
and innovation from private
sector.
How many and what type of products and
services have been offered across the
Mobility Stations?
Apply known lessons learnt, challenges or
opportunities from user's surveys and
stakeholder engagement. Integrate design
processes with the needs of users and
businesses.
Record the numbers of new mobility service
start-ups, growth in mobility operators and the
number of new services offered. Keep
applying lessons learnt and feedback from
users and businesses.
Ongoing market analysis.
FMZ delivery team
and support from
Local Authorities
£0.00
FMZ and
Local
Authorities
Remove barriers to
technological innovation.
Have the expected collaboration and research
partnerships materialised?
Have any unforeseen developments
emerged?
Complete commercial agreements with
operators and develop a log of lessons
learnt.
Engage the public with designs for Mobility
Stations and capture their feedback and
preferences.
Capture lessons learnt; review issues logs. Ongoing lesson learnt and issue log analysis.
FMZ delivery team
and support from
Local Authorities
£0.00
FMZ and
Local
Authorities
(b) Understand how
Mobility Stations have
improved location
specific connectivity to
employment sites,
especially in the
Northern Arc.
They lead to an increase in
public awareness and use of
public and active transport
modes, and can improve
first/last mile connectivity – in
particular to places of
employment.
Improve accessibility and
connectivity in Northern Arc.
(c) Understand the
commercial viability of
Mobility Stations.
A variety of mobility stations
will be tested, to identify the
right mix of modes and
services, and options for
long term commercial
viability.
Resourcing (staffing need for Source of
funding
(a) Understand if
Mobility Stations have
improved the
awareness and use of
public and active
transport.
The stations can be
integrated with MaaS, to
provide an end-to-end
integrated digital and
physical transport ecosystem
for users.
The stations will have a
strong and consistent brand
to help create a sense of
place and wayfinding across
the areas they are
implemented.
Land can be secured and
commercial operating
agreements be put in in
place.
Increase public transport users’
experience and satisfaction
levels.
Track the uptake and
effectiveness of Mobility
Stations.
Evaluation/Learning
objectivesKey Assumptions Sub-objective Research question
Evaluation Approach
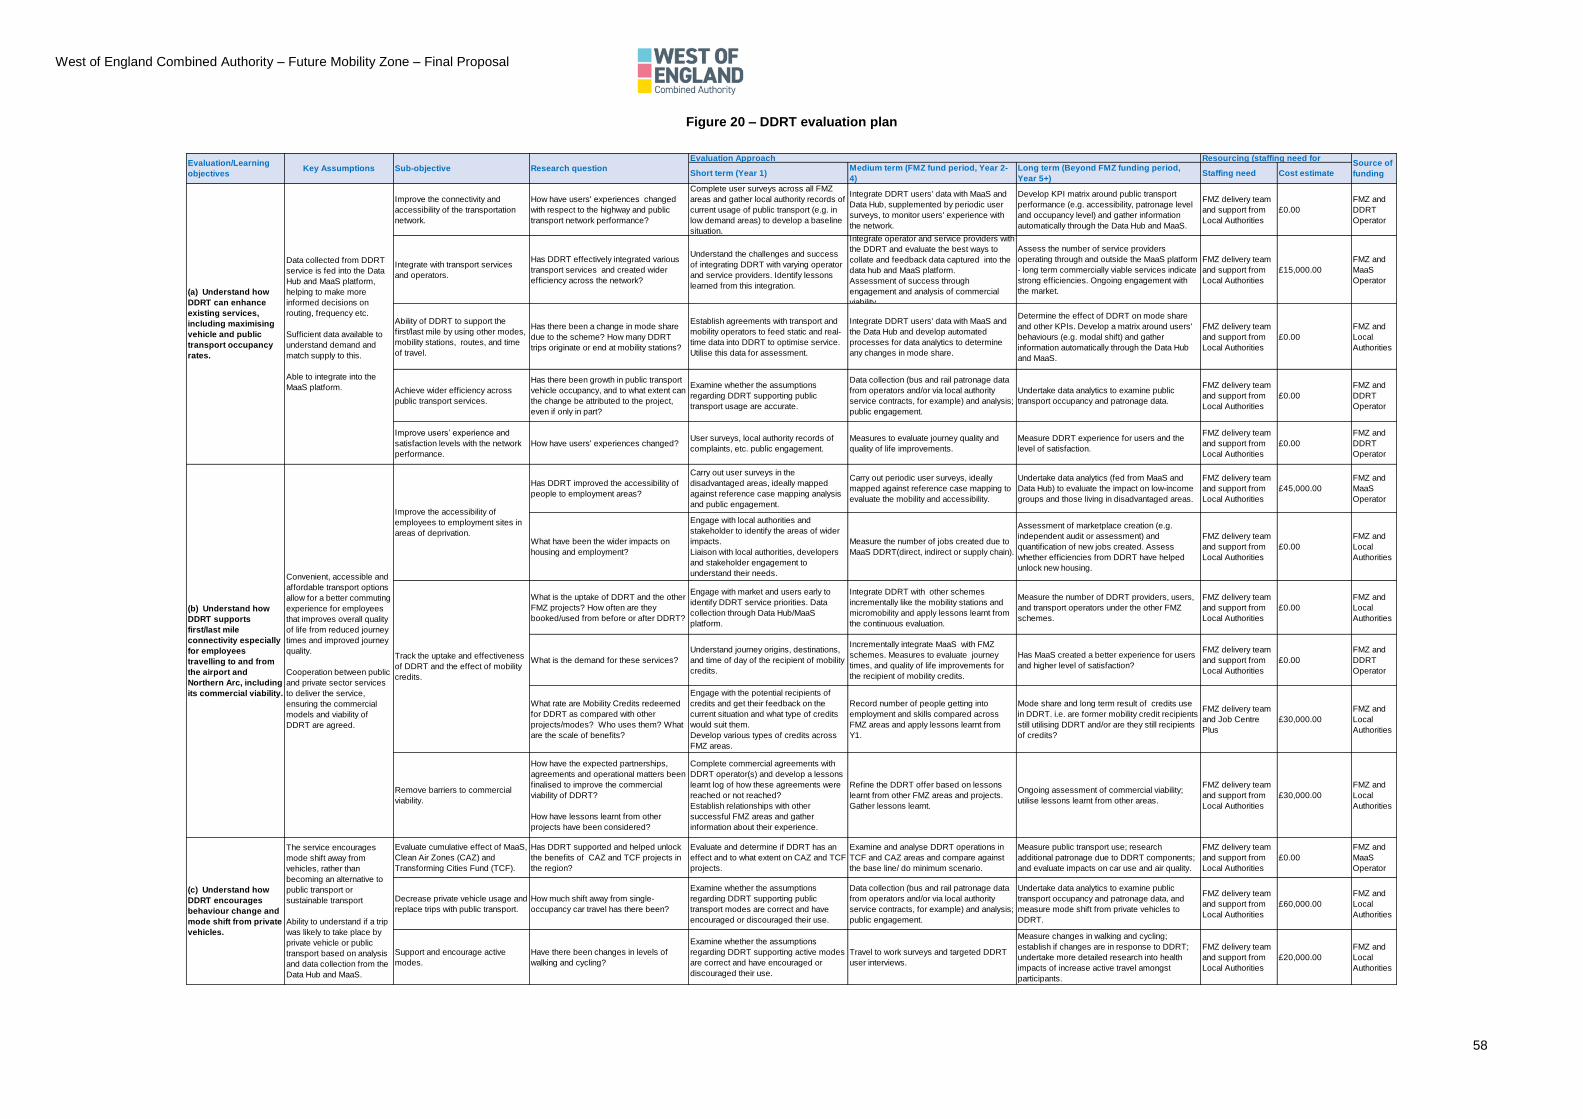
West of England Combined Authority – Future Mobility Zone – Final Proposal
58
Figure 20 – DDRT evaluation plan
Short term (Year 1)Medium term (FMZ fund period, Year 2-
4)
Long term (Beyond FMZ funding period,
Year 5+)Staffing need Cost estimate
Improve the connectivity and
accessibility of the transportation
network.
How have users' experiences changed
with respect to the highway and public
transport network performance?
Complete user surveys across all FMZ
areas and gather local authority records of
current usage of public transport (e.g. in
low demand areas) to develop a baseline
situation.
Integrate DDRT users' data with MaaS and
Data Hub, supplemented by periodic user
surveys, to monitor users' experience with
the network.
Develop KPI matrix around public transport
performance (e.g. accessibility, patronage level
and occupancy level) and gather information
automatically through the Data Hub and MaaS.
FMZ delivery team
and support from
Local Authorities
£0.00
FMZ and
DDRT
Operator
Integrate with transport services
and operators.
Has DDRT effectively integrated various
transport services and created wider
efficiency across the network?
Understand the challenges and success
of integrating DDRT with varying operator
and service providers. Identify lessons
learned from this integration.
Integrate operator and service providers with
the DDRT and evaluate the best ways to
collate and feedback data captured into the
data hub and MaaS platform.
Assessment of success through
engagement and analysis of commercial
viability.
Assess the number of service providers
operating through and outside the MaaS platform
- long term commercially viable services indicate
strong efficiencies. Ongoing engagement with
the market.
FMZ delivery team
and support from
Local Authorities
£15,000.00
FMZ and
MaaS
Operator
Ability of DDRT to support the
first/last mile by using other modes,
mobility stations, routes, and time
of travel.
Has there been a change in mode share
due to the scheme? How many DDRT
trips originate or end at mobility stations?
Establish agreements with transport and
mobility operators to feed static and real-
time data into DDRT to optimise service.
Utilise this data for assessment.
Integrate DDRT users' data with MaaS and
the Data Hub and develop automated
processes for data analytics to determine
any changes in mode share.
Determine the effect of DDRT on mode share
and other KPIs. Develop a matrix around users'
behaviours (e.g. modal shift) and gather
information automatically through the Data Hub
and MaaS.
FMZ delivery team
and support from
Local Authorities
£0.00
FMZ and
Local
Authorities
Achieve wider efficiency across
public transport services.
Has there been growth in public transport
vehicle occupancy, and to what extent can
the change be attributed to the project,
even if only in part?
Examine whether the assumptions
regarding DDRT supporting public
transport usage are accurate.
Data collection (bus and rail patronage data
from operators and/or via local authority
service contracts, for example) and analysis;
public engagement.
Undertake data analytics to examine public
transport occupancy and patronage data.
FMZ delivery team
and support from
Local Authorities
£0.00
FMZ and
DDRT
Operator
Improve users’ experience and
satisfaction levels with the network
performance.
How have users' experiences changed?User surveys, local authority records of
complaints, etc. public engagement.
Measures to evaluate journey quality and
quality of life improvements.
Measure DDRT experience for users and the
level of satisfaction.
FMZ delivery team
and support from
Local Authorities
£0.00
FMZ and
DDRT
Operator
Has DDRT improved the accessibility of
people to employment areas?
Carry out user surveys in the
disadvantaged areas, ideally mapped
against reference case mapping analysis
and public engagement.
Carry out periodic user surveys, ideally
mapped against reference case mapping to
evaluate the mobility and accessibility.
Undertake data analytics (fed from MaaS and
Data Hub) to evaluate the impact on low-income
groups and those living in disadvantaged areas.
FMZ delivery team
and support from
Local Authorities
£45,000.00
FMZ and
MaaS
Operator
What have been the wider impacts on
housing and employment?
Engage with local authorities and
stakeholder to identify the areas of wider
impacts.
Liaison with local authorities, developers
and stakeholder engagement to
understand their needs.
Measure the number of jobs created due to
MaaS DDRT(direct, indirect or supply chain).
Assessment of marketplace creation (e.g.
independent audit or assessment) and
quantification of new jobs created. Assess
whether efficiencies from DDRT have helped
unlock new housing.
FMZ delivery team
and support from
Local Authorities
£0.00
FMZ and
Local
Authorities
What is the uptake of DDRT and the other
FMZ projects? How often are they
booked/used from before or after DDRT?
Engage with market and users early to
identify DDRT service priorities. Data
collection through Data Hub/MaaS
platform.
Integrate DDRT with other schemes
incrementally like the mobility stations and
micromobility and apply lessons learnt from
the continuous evaluation.
Measure the number of DDRT providers, users,
and transport operators under the other FMZ
schemes.
FMZ delivery team
and support from
Local Authorities
£0.00
FMZ and
Local
Authorities
What is the demand for these services?
Understand journey origins, destinations,
and time of day of the recipient of mobility
credits.
Incrementally integrate MaaS with FMZ
schemes. Measures to evaluate journey
times, and quality of life improvements for
the recipient of mobility credits.
Has MaaS created a better experience for users
and higher level of satisfaction?
FMZ delivery team
and support from
Local Authorities
£0.00
FMZ and
DDRT
Operator
What rate are Mobility Credits redeemed
for DDRT as compared with other
projects/modes? Who uses them? What
are the scale of benefits?
Engage with the potential recipients of
credits and get their feedback on the
current situation and what type of credits
would suit them.
Develop various types of credits across
FMZ areas.
Record number of people getting into
employment and skills compared across
FMZ areas and apply lessons learnt from
Y1.
Mode share and long term result of credits use
in DDRT. i.e. are former mobility credit recipients
still utilising DDRT and/or are they still recipients
of credits?
FMZ delivery team
and Job Centre
Plus
£30,000.00
FMZ and
Local
Authorities
Remove barriers to commercial
viability.
How have the expected partnerships,
agreements and operational matters been
finalised to improve the commercial
viability of DDRT?
How have lessons learnt from other
projects have been considered?
Complete commercial agreements with
DDRT operator(s) and develop a lessons
learnt log of how these agreements were
reached or not reached?
Establish relationships with other
successful FMZ areas and gather
information about their experience.
Refine the DDRT offer based on lessons
learnt from other FMZ areas and projects.
Gather lessons learnt.
Ongoing assessment of commercial viability;
utilise lessons learnt from other areas.
FMZ delivery team
and support from
Local Authorities
£30,000.00
FMZ and
Local
Authorities
Evaluate cumulative effect of MaaS,
Clean Air Zones (CAZ) and
Transforming Cities Fund (TCF).
Has DDRT supported and helped unlock
the benefits of CAZ and TCF projects in
the region?
Evaluate and determine if DDRT has an
effect and to what extent on CAZ and TCF
projects.
Examine and analyse DDRT operations in
TCF and CAZ areas and compare against
the base line/ do minimum scenario.
Measure public transport use; research
additional patronage due to DDRT components;
and evaluate impacts on car use and air quality.
FMZ delivery team
and support from
Local Authorities
£0.00
FMZ and
MaaS
Operator
Decrease private vehicle usage and
replace trips with public transport.
How much shift away from single-
occupancy car travel has there been?
Examine whether the assumptions
regarding DDRT supporting public
transport modes are correct and have
encouraged or discouraged their use.
Data collection (bus and rail patronage data
from operators and/or via local authority
service contracts, for example) and analysis;
public engagement.
Undertake data analytics to examine public
transport occupancy and patronage data, and
measure mode shift from private vehicles to
DDRT.
FMZ delivery team
and support from
Local Authorities
£60,000.00
FMZ and
Local
Authorities
Support and encourage active
modes.
Have there been changes in levels of
walking and cycling?
Examine whether the assumptions
regarding DDRT supporting active modes
are correct and have encouraged or
discouraged their use.
Travel to work surveys and targeted DDRT
user interviews.
Measure changes in walking and cycling;
establish if changes are in response to DDRT;
undertake more detailed research into health
impacts of increase active travel amongst
participants.
FMZ delivery team
and support from
Local Authorities
£20,000.00
FMZ and
Local
Authorities
Source of
funding
Evaluation/Learning
objectivesSub-objective Research question
Evaluation Approach Resourcing (staffing need for
The service encourages
mode shift away from
vehicles, rather than
becoming an alternative to
public transport or
sustainable transport
Ability to understand if a trip
was likely to take place by
private vehicle or public
transport based on analysis
and data collection from the
Data Hub and MaaS.
(c) Understand how
DDRT encourages
behaviour change and
mode shift from private
vehicles.
Key Assumptions
Convenient, accessible and
affordable transport options
allow for a better commuting
experience for employees
that improves overall quality
of life from reduced journey
times and improved journey
quality.
Cooperation between public
and private sector services
to deliver the service,
ensuring the commercial
models and viability of
DDRT are agreed.
Improve the accessibility of
employees to employment sites in
areas of deprivation.
(a) Understand how
DDRT can enhance
existing services,
including maximising
vehicle and public
transport occupancy
rates.
Data collected from DDRT
service is fed into the Data
Hub and MaaS platform,
helping to make more
informed decisions on
routing, frequency etc.
Sufficient data available to
understand demand and
match supply to this.
Able to integrate into the
MaaS platform.
(b) Understand how
DDRT supports
first/last mile
connectivity especially
for employees
travelling to and from
the airport and
Northern Arc, including
its commercial viability.
Track the uptake and effectiveness
of DDRT and the effect of mobility
credits.
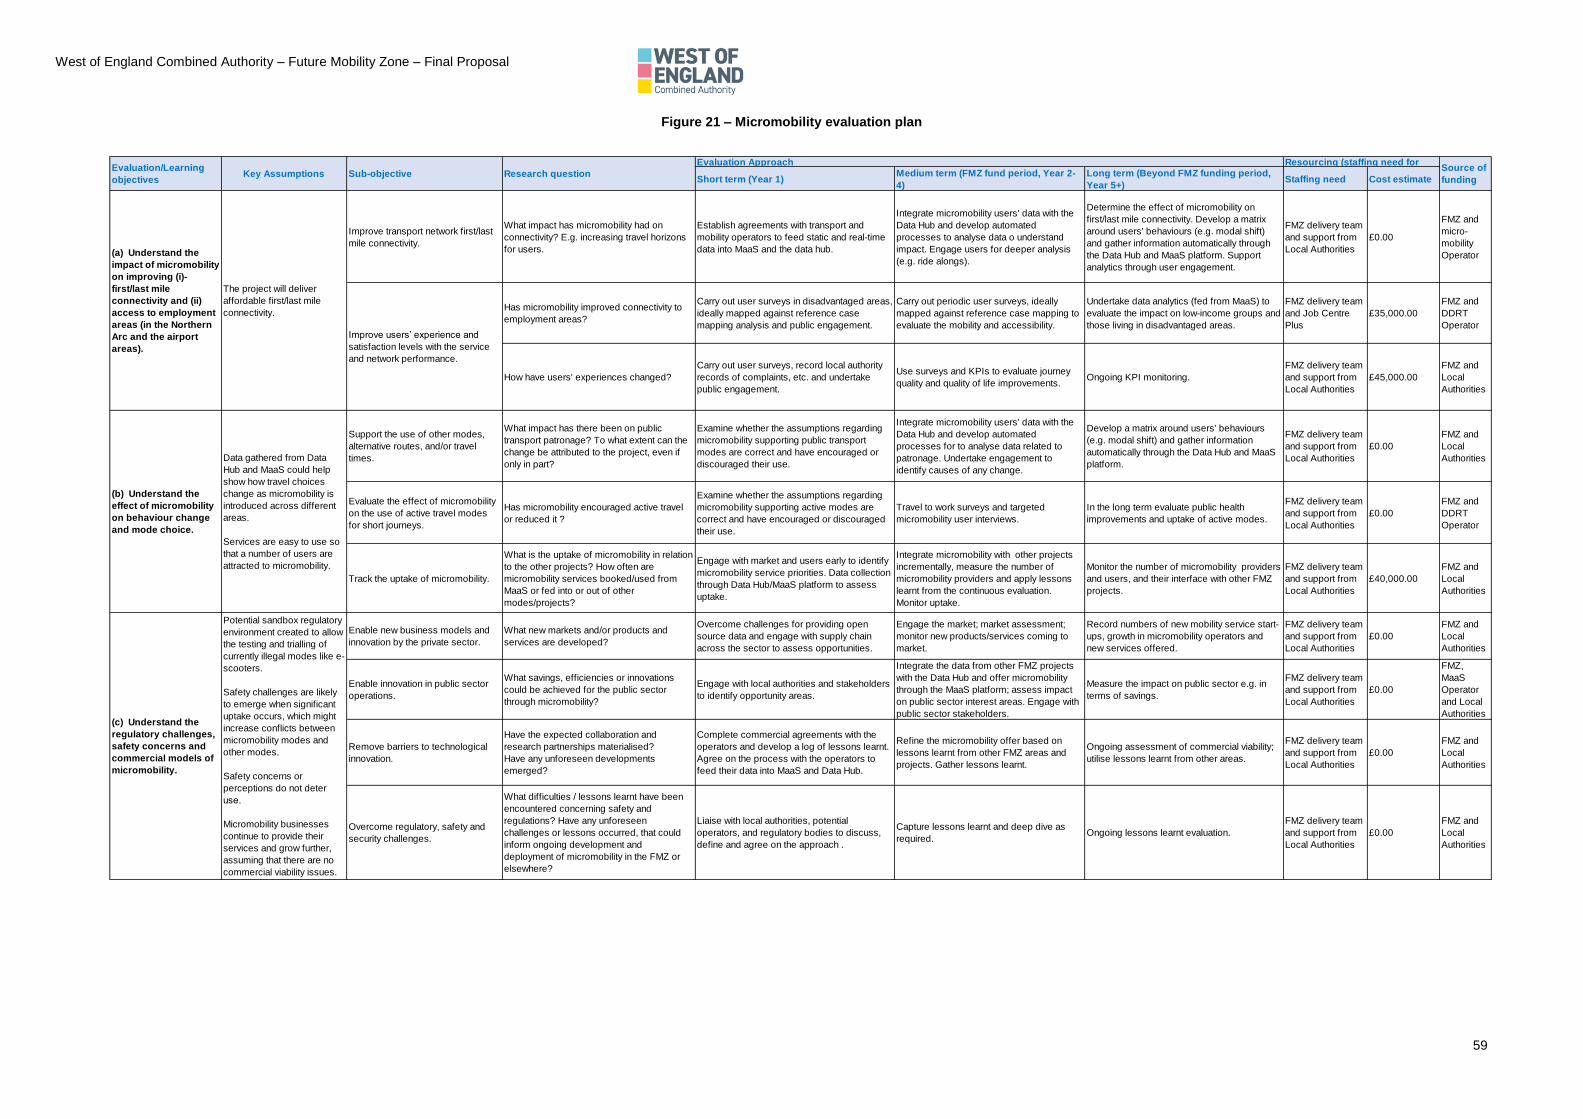
West of England Combined Authority – Future Mobility Zone – Final Proposal
59
Figure 21 – Micromobility evaluation plan
Short term (Year 1)Medium term (FMZ fund period, Year 2-
4)
Long term (Beyond FMZ funding period,
Year 5+)Staffing need Cost estimate
Improve transport network first/last
mile connectivity.
What impact has micromobility had on
connectivity? E.g. increasing travel horizons
for users.
Establish agreements with transport and
mobility operators to feed static and real-time
data into MaaS and the data hub.
Integrate micromobility users' data with the
Data Hub and develop automated
processes to analyse data o understand
impact. Engage users for deeper analysis
(e.g. ride alongs).
Determine the effect of micromobility on
first/last mile connectivity. Develop a matrix
around users' behaviours (e.g. modal shift)
and gather information automatically through
the Data Hub and MaaS platform. Support
analytics through user engagement.
FMZ delivery team
and support from
Local Authorities
£0.00
FMZ and
micro-
mobility
Operator
Has micromobility improved connectivity to
employment areas?
Carry out user surveys in disadvantaged areas,
ideally mapped against reference case
mapping analysis and public engagement.
Carry out periodic user surveys, ideally
mapped against reference case mapping to
evaluate the mobility and accessibility.
Undertake data analytics (fed from MaaS) to
evaluate the impact on low-income groups and
those living in disadvantaged areas.
FMZ delivery team
and Job Centre
Plus
£35,000.00
FMZ and
DDRT
Operator
How have users' experiences changed?
Carry out user surveys, record local authority
records of complaints, etc. and undertake
public engagement.
Use surveys and KPIs to evaluate journey
quality and quality of life improvements.Ongoing KPI monitoring.
FMZ delivery team
and support from
Local Authorities
£45,000.00
FMZ and
Local
Authorities
Support the use of other modes,
alternative routes, and/or travel
times.
What impact has there been on public
transport patronage? To what extent can the
change be attributed to the project, even if
only in part?
Examine whether the assumptions regarding
micromobility supporting public transport
modes are correct and have encouraged or
discouraged their use.
Integrate micromobility users' data with the
Data Hub and develop automated
processes for to analyse data related to
patronage. Undertake engagement to
identify causes of any change.
Develop a matrix around users' behaviours
(e.g. modal shift) and gather information
automatically through the Data Hub and MaaS
platform.
FMZ delivery team
and support from
Local Authorities
£0.00
FMZ and
Local
Authorities
Evaluate the effect of micromobility
on the use of active travel modes
for short journeys.
Has micromobility encouraged active travel
or reduced it ?
Examine whether the assumptions regarding
micromobility supporting active modes are
correct and have encouraged or discouraged
their use.
Travel to work surveys and targeted
micromobility user interviews.
In the long term evaluate public health
improvements and uptake of active modes.
FMZ delivery team
and support from
Local Authorities
£0.00
FMZ and
DDRT
Operator
Track the uptake of micromobility.
What is the uptake of micromobility in relation
to the other projects? How often are
micromobility services booked/used from
MaaS or fed into or out of other
modes/projects?
Engage with market and users early to identify
micromobility service priorities. Data collection
through Data Hub/MaaS platform to assess
uptake.
Integrate micromobility with other projects
incrementally, measure the number of
micromobility providers and apply lessons
learnt from the continuous evaluation.
Monitor uptake.
Monitor the number of micromobility providers
and users, and their interface with other FMZ
projects.
FMZ delivery team
and support from
Local Authorities
£40,000.00
FMZ and
Local
Authorities
Enable new business models and
innovation by the private sector.
What new markets and/or products and
services are developed?
Overcome challenges for providing open
source data and engage with supply chain
across the sector to assess opportunities.
Engage the market; market assessment;
monitor new products/services coming to
market.
Record numbers of new mobility service start-
ups, growth in micromobility operators and
new services offered.
FMZ delivery team
and support from
Local Authorities
£0.00
FMZ and
Local
Authorities
Enable innovation in public sector
operations.
What savings, efficiencies or innovations
could be achieved for the public sector
through micromobility?
Engage with local authorities and stakeholders
to identify opportunity areas.
Integrate the data from other FMZ projects
with the Data Hub and offer micromobility
through the MaaS platform; assess impact
on public sector interest areas. Engage with
public sector stakeholders.
Measure the impact on public sector e.g. in
terms of savings.
FMZ delivery team
and support from
Local Authorities
£0.00
FMZ,
MaaS
Operator
and Local
Authorities
Remove barriers to technological
innovation.
Have the expected collaboration and
research partnerships materialised?
Have any unforeseen developments
emerged?
Complete commercial agreements with the
operators and develop a log of lessons learnt.
Agree on the process with the operators to
feed their data into MaaS and Data Hub.
Refine the micromobility offer based on
lessons learnt from other FMZ areas and
projects. Gather lessons learnt.
Ongoing assessment of commercial viability;
utilise lessons learnt from other areas.
FMZ delivery team
and support from
Local Authorities
£0.00
FMZ and
Local
Authorities
Overcome regulatory, safety and
security challenges.
What difficulties / lessons learnt have been
encountered concerning safety and
regulations? Have any unforeseen
challenges or lessons occurred, that could
inform ongoing development and
deployment of micromobility in the FMZ or
elsewhere?
Liaise with local authorities, potential
operators, and regulatory bodies to discuss,
define and agree on the approach .
Capture lessons learnt and deep dive as
required.Ongoing lessons learnt evaluation.
FMZ delivery team
and support from
Local Authorities
£0.00
FMZ and
Local
Authorities
(c) Understand the
regulatory challenges,
safety concerns and
commercial models of
micromobility.
Potential sandbox regulatory
environment created to allow
the testing and trialling of
currently illegal modes like e-
scooters.
Safety challenges are likely
to emerge when significant
uptake occurs, which might
increase conflicts between
micromobility modes and
other modes.
Safety concerns or
perceptions do not deter
use.
Micromobility businesses
continue to provide their
services and grow further,
assuming that there are no
commercial viability issues.
Resourcing (staffing need for Source of
funding
(a) Understand the
impact of micromobility
on improving (i)-
first/last mile
connectivity and (ii)
access to employment
areas (in the Northern
Arc and the airport
areas).
The project will deliver
affordable first/last mile
connectivity.
Improve users’ experience and
satisfaction levels with the service
and network performance.
(b) Understand the
effect of micromobility
on behaviour change
and mode choice.
Data gathered from Data
Hub and MaaS could help
show how travel choices
change as micromobility is
introduced across different
areas.
Services are easy to use so
that a number of users are
attracted to micromobility.
Evaluation/Learning
objectivesKey Assumptions Sub-objective Research question
Evaluation Approach

West of England Combined Authority – Future Mobility Zone – Final Proposal
60
SECTION F – The Commercial Case
F1. Commercial Case
F1.1 – Market engagement
The West of England FMZ will deliver a globally significant demonstrator of Future Mobility innovations.
Our ambition for the FMZ has been supported by key local stakeholders as well as international
enterprises operating in the Future Mobility sector, who all recognise the unique strengths of the region
and the opportunity that the West of England FMZ delivers.
In developing our FMZ and its projects, we have consulted closely with stakeholders and the wider
market, engaging with them on multiple occasions and utilising a variety of workshops, meetings, and
ongoing correspondence. Stakeholders were brought in from an early stage in forming our EOI and
have remained involved through Phase 2. Stakeholders have come from across the West of England
to bring local expertise, as well as nationally and internally from different sectors, providing a diverse
and experienced mix of public, private, and academic input.
The aim of our market engagement has been to understand:
1. Local interest and support for an FMZ, and priorities for trialling and evaluation – which has
directly informed our strategic approach and FMZ projects.
2. Market appetite for delivering future mobility solutions in the West of England, which was found
to be very strong – given our existing strengths (e.g. growing bus patronage and cycling cre-
dentials), open approach to innovation and planned mass transit enhancements (through TCF).
3. The motivations of market players, and how these align with the strategic approach taken by
WECA to FMZ, e.g. encouraging modal shift towards public transport and active modes.
4. The types of schemes and solutions that can feasibly be delivered within the timescales of the
FMZ programme (up to 2022/23) based on the maturity of technology solutions.
5. Willingness to co-develop and co-deliver solutions with operators and service providers.
6. Scheme definition, with input to programme development, cost estimation and risk analysis.
We have engaged throughout the proposal development with KWMC in order to advice on how to take
a Living Lab approach. This is a user-led approach where projects are co-designed with communities
and end-users. Early input from KWMC ensured that we took the right approach from the start.
Furthermore, from an early stage we engaged end-user groups to ensure that we were designing trials
that meet real needs.
At the EOI stage, we held two workshops with stakeholders, in addition to meetings, calls and email
correspondence. Since being shortlisted our engagement has intensified, with a view to focussing our
FMZ priorities and projects and getting backing from key market players and user groups.
For Phase 2 we hosted a series of five stakeholder workshops to develop each of the five proposed
FMZ projects. The workshops created an open and engaging atmosphere to gather stakeholder input
and further develop the FMZ projects. Over 30 participants from 25 organisations attended the
workshops. Stakeholders were targeted according to their expertise and experience in a given field and
included local councils, academia and operators/service providers. The workshops were divided into
three sessions designed to develop our thinking on:
1. The impacts and outcomes that will be achieved from each project. A key component of this
exercise was to capture any assumptions that might be relevant.
2. The scope of services that will be delivered in a project. Using industry and marketplace exper-
tise, this session provided a practical understanding and knowledge of what types of services
and operations would be possible given the current technological capabilities of the market,
ensuring that the projects proposed are grounded and can genuinely be achieved.
3. The commercial and operational approaches for project delivery. In this session we asked par-
ticipants to consider the different deliverability options available to a given project, comparing
the roles of the private sector and public sector in each. This helped to further understand the

West of England Combined Authority – Future Mobility Zone – Final Proposal
61
need for the FMZ funding to deliver aspects of the project, as well as potential commercial
routes to market for schemes.
We held a sixth workshop to develop our approach to the overall marketplace for future mobility. This
focussed on commercial and operational delivery of the FMZ and wider approaches to market, exploring
WECA’s role in the market. We also developed our thinking on principles for the operation of the FMZ.
In addition to the workshops themselves, WECA reached out to both stakeholders who attended and
who could not attend, with a proforma of questions related to each of the individual projects. These
were aimed at capturing any further ideas or evidence related to the projects.
Alongside the workshops we held a multitude of face to face and conference call meetings, engaging
closely with the market and stakeholders to ensure our proposal is realistic and achievable.
In accordance with public procurement processes and local procurement rules, we have not specified
a supplier or consortium to deliver our FMZ. This will occur should we be successful in securing funding;
however, we have strong support from the market as evidenced by our letters of support.
In total, WECA has engaged with over 35 organisations to develop its FMZ proposal, resulting in
practical and achievable projects. We have strong support of industry and academia, with over 20 letters
of support received, as presented in Appendix 10.
F1.2 – Outline procurement strategy We have prepared an outline procurement strategy for our FMZ and welcome the opportunity to develop this further with the DfT to agree a detailed procurement strategy. We are also open to working with or taking a lead with the other FMZ areas to develop a joint approach to procurement. We are experienced in delivering projects collaboratively both regionally and nationally and have existing involvement in groups such as the M9 metro-Mayor’s group; ADEPT’s national Transport and Housing Boards; the Urban Transport Group etc. This provides the experience and platform for WECA to drive collaboration with other successful FMZ bidders and the exciting opportunity to share and gain valuable feedback through these conduits.
We have used the outputs from the pre-tender market engagement to assess the market offering to drive forward our procurement strategy. We understand the need for transparency and fairness to the market under our obligations of the Public Contracting Regulations 2015 (PCR). This is embedded in our approach for further market engagement and solution development involving the wider market.
Our procurement business partner has had an advisory role to date. They will join the FMZ Programme Delivery Board to provide required assurance and compliance; advise on procurement options available; and lead procurement activity in such a way that drives innovation.
We recognise the challenges ahead of procuring solutions which may not yet exist in the market place. We have a proven record with regard to collaboration, market stimulation and innovation:
Our collaboration with bus operators has seen major investment in infrastructure, service frequency and quality, launching our travelwest travel card, electronic ticketing and our metrobus routes, increasing patronage and bucking the national trend
Our joint working with Network Rail and operators is seeing the delivery of our metrowest programme, unlocking investment through network rail, aligning requirements through the current direct Award 3 franchise and seeing progress towards the re-opening of the rail line to Portishead.
The West of England Low Carbon Challenge fund is stimulating the market for small and medium-sized businesses and community organisations to improve their energy efficiency and WECA’s hosting of the South West Energy Hub is increasing the number and quality of local energy projects in the South West.
WECA and the LEP are also key investors in the Institute of Advanced Automotive Pro-pulsion Systems (IAAPS) – a global centre of excellence, delivering transformational re-search and innovation in low-emission vehicles. We’ve also invested in the National Compo-sites Centre, which is developing lightweight materials that are stronger and have the poten-tial to reduce weight and increase carbon efficiency.
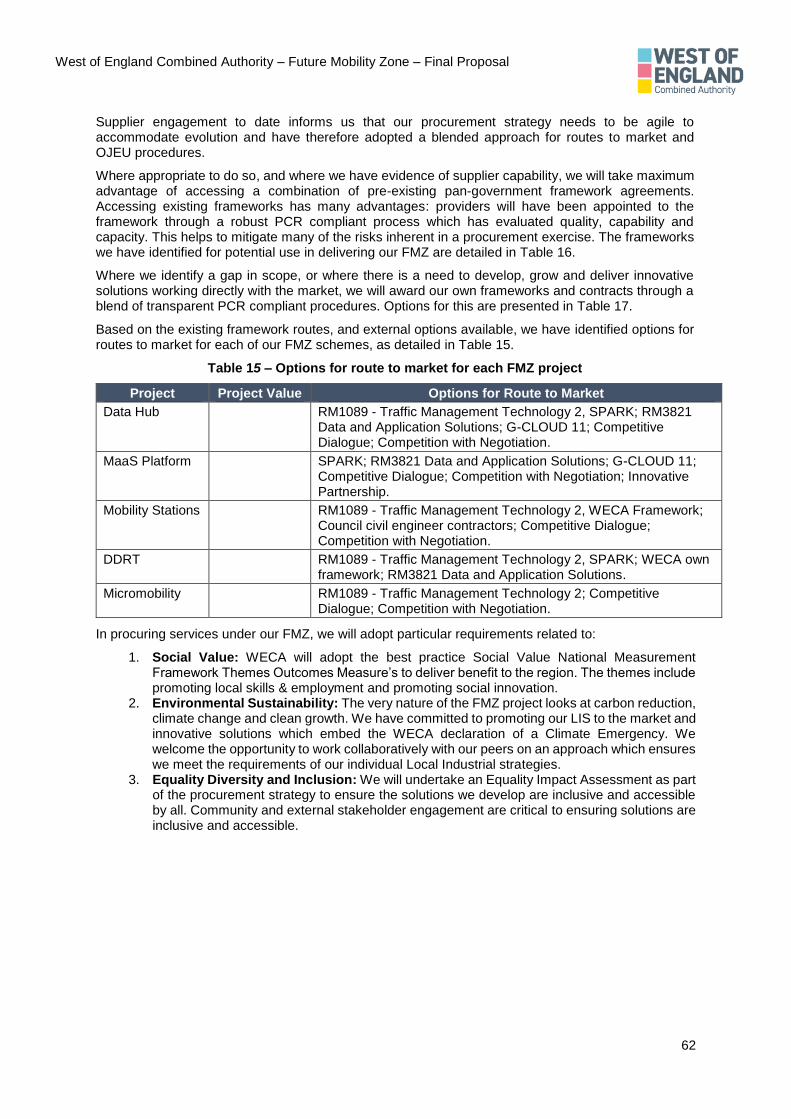
West of England Combined Authority – Future Mobility Zone – Final Proposal
62
Supplier engagement to date informs us that our procurement strategy needs to be agile to accommodate evolution and have therefore adopted a blended approach for routes to market and OJEU procedures.
Where appropriate to do so, and where we have evidence of supplier capability, we will take maximum advantage of accessing a combination of pre-existing pan-government framework agreements. Accessing existing frameworks has many advantages: providers will have been appointed to the framework through a robust PCR compliant process which has evaluated quality, capability and capacity. This helps to mitigate many of the risks inherent in a procurement exercise. The frameworks we have identified for potential use in delivering our FMZ are detailed in Table 16.
Where we identify a gap in scope, or where there is a need to develop, grow and deliver innovative solutions working directly with the market, we will award our own frameworks and contracts through a blend of transparent PCR compliant procedures. Options for this are presented in Table 17.
Based on the existing framework routes, and external options available, we have identified options for routes to market for each of our FMZ schemes, as detailed in Table 15.
Table 15 – Options for route to market for each FMZ project
Project Project Value Options for Route to Market Data Hub RM1089 - Traffic Management Technology 2, SPARK; RM3821
Data and Application Solutions; G-CLOUD 11; Competitive Dialogue; Competition with Negotiation.
MaaS Platform SPARK; RM3821 Data and Application Solutions; G-CLOUD 11; Competitive Dialogue; Competition with Negotiation; Innovative Partnership.
Mobility Stations RM1089 - Traffic Management Technology 2, WECA Framework; Council civil engineer contractors; Competitive Dialogue; Competition with Negotiation.
DDRT RM1089 - Traffic Management Technology 2, SPARK; WECA own framework; RM3821 Data and Application Solutions.
Micromobility RM1089 - Traffic Management Technology 2; Competitive Dialogue; Competition with Negotiation.
In procuring services under our FMZ, we will adopt particular requirements related to:
1. Social Value: WECA will adopt the best practice Social Value National Measurement Framework Themes Outcomes Measure’s to deliver benefit to the region. The themes include promoting local skills & employment and promoting social innovation.
2. Environmental Sustainability: The very nature of the FMZ project looks at carbon reduction, climate change and clean growth. We have committed to promoting our LIS to the market and innovative solutions which embed the WECA declaration of a Climate Emergency. We welcome the opportunity to work collaboratively with our peers on an approach which ensures we meet the requirements of our individual Local Industrial strategies.
3. Equality Diversity and Inclusion: We will undertake an Equality Impact Assessment as part of the procurement strategy to ensure the solutions we develop are inclusive and accessible by all. Community and external stakeholder engagement are critical to ensuring solutions are inclusive and accessible.

West of England Combined Authority – Future Mobility Zone – Final Proposal
63
Table 16 – Framework routes to market
Framework Authority Framework / Contract Name Summary Timeframe to award5
Crown Commercial Services
RM1089 - Traffic Management Technology 2
LOTS for GIS Data Systems, Environment Management Systems, Urban Traffic Management Control and Common Database Systems, Asset Data Capture and Management, Sustainable Transport Infrastructure, Traffic management Communications, Intelligent Transport Systems
2 - 3 Months
RM6094 SPARK Dynamic Purchasing System for Innovative Technology
A flexible route to market for both existing technologies and development of new technologies, it covers radical innovation, a new product, service, process or strategy introduced into a market, but designed to make a significant impact by completely replacing existing Technologies and methods. New suppliers can join a Dynamic Purchasing System at any time.
2 - 3 Months
RM3821 Data and Application Solutions
Access to providers for the provision of and expert advice on Data Collection, Storage and Management, Data Intelligence & Analytics and Environmental & Planning
2 - 3 Months
RM6008 Management Consultancy
Access to a range of management consultancy areas across several specialisms 2 - 3 Months
G-CLOUD 11 Access to a catalogue of IT Service providers for the provision of and development of software and cloud-based solutions.
2 - 3 Months
SMART Cities - Transport Technology Infrastructure
This solution is currently in development by CCS and will replace the Traffic Management Technology 2 framework mid-2020 and will widen the scope out to SMART Transport & Urban Transport solutions.
2 - 3 Months
NEPO Bloom Consultancy Managed Solution
The Bloom model is like a neutral vendor solution meaning that it is possible to target specific specialist suppliers and markets. Direct award is permitted however more extensive value and innovation can be achieved.
1 - 2 Months
WECA Transport and Infrastructure - Professional Services Framework
WECA’s own Professional services framework open to its UA's and LEP. 1 Month
5 Will vary according to complexity and value of project

West of England Combined Authority – Future Mobility Zone – Final Proposal
64
Table 17 – External procurement and OJEU procedures
Procedure When likely to be used Pros Cons Award
Open Market is likely to be limited, output is clear and can be well articulated.
• Requirement reaches a broad section of the market.
• No control over the number of bids we may attract.
• Limited opportunity to develop solutions with the market or negotiate costs/ outcomes.
3-4 Months
Restricted Market likely to be large, there is a need to limit the number of tenderers. Output is often clear and can be well articulated.
• Requirement reaches a broad section of the market.
• No control over the number of bids we may attract.
• Limited opportunity to develop solutions with the market or negotiate costs/ outcomes.
3-6 Months
Competitive Dialogue
Flexibility is needed, e.g. for highly complex and risky projects. Market will have a major role in defining the solution where unable to specify the requirements or cannot assess without in-depth dialogue. We need to understand what the market can offer in terms of technical, financial or legal solutions.
• Allows organisations to negotiate pro-posed solutions with bidders.
• Can open-up cross-border markets by encouraging suppliers to discuss pos-sible solutions.
• Drives innovation.
• Requires careful management.
• Can be lengthy, resource inten-sive and costly.
• Carries significant commercial risk if not managed in line with Public Procurement Principles.
6-9 Months
Competition with Negotiation
Services require adaptation or design inputs, For complex purchases, such as sophisticated products, intellectual services or major information and communication technology tools. Dialogue is needed with the market to guarantee the satisfactory outcome of the procurement process.
• Allows development of solutions with the market as a key stakeholder.
• Produces best commercial outcomes.
• Negotiation on costs/outcomes and terms are permitted.
• Requires careful management.
• Can be lengthy, resource inten-sive and costly.
• Carries significant commercial risk if not managed in line with Public Procurement Principles.
6-12 Months
Innovative Partnerships
Must only be used where there is a need for the development of an innovative product or service and the subsequent purchase of these cannot be met by solutions already available on the market. The Innovation Partnership Procedure aims to solve the problem of where after awarding a research and development contract without competition, we have been unable to purchase the product directly from the developer without further competition.
• Allows development of new types of goods and services.
• Market stimulation through the ap-pointment of one or several partners competing to conduct separate re-search and development activities.
• Choice of the most suitable partners for development contracts.
• Requires careful management.
• Can be lengthy, resource inten-sive and costly.
• Carries significant commercial risk if not managed in line with Public Procurement Principles.
6-12 Months
West of England Combined Authority – Future Mobility Zone – Final Proposal
65
SECTION G – Additionality
G1. Additionality
The FMZ will build upon the wide range of complementary schemes in the region that are already receiving investment, as well as the forthcoming TCF schemes.
WECA’s intended approach to utilise TCF funding was reported to DfT on the 12th April 2019. A further update on aims and allocations was submitted to DfT on 27th June 2019.
Our transport vision complementing the TCF funding is for sustainable long-term transport solutions across the West of England with two interrelated elements: Mass Transit and Digital Enabling. WECA’s transformational role in providing cost-effective solutions is enabled via TCF, alongside our Infrastructure Fund; Local Growth Fund; and through concept development and trials allowing further funding sources to be accessed as they become available. We are investing more than £200m over the next five years in revenue and capital programmes to support these elements.
FMZ funding will allow us to build on and accelerate our solutions for digital enabling, to trial new modal solutions that can be offered, accessed and paid for through digital technology and to interlink these solutions to information, access and choice related to the enhanced rail and bus services we are delivering through TCF.
We are planning and developing a sustainable value for money mass transit solution for our key regional routes and national and international transport links. Over the next five years, we have identified strategic capital investments to support our Mass Transit aspiration:
1. Strategic Rail Investment. We are maximising the utilisation of our local rail network by enhancing the availability of turn up and go services. We are identifying latent network capacity, and opportunity created through committed and planned regional infrastructure including Bristol East Junction, Filton Abbey Wood Double Tracking, signalling upgrades and electrification. We will be investing in excess of £70m on interventions to support a turn up and go approach in partnership with Network Rail and GWR. Interventions include:
• MetroWest programme.
• Station upgrades and re-openings to improve accessibility, community integration, passenger experience, facilities and amenities, ambience and environment, safety and security. Eight stations have been included in our initial assessment and prioritisation process.
• Bristol Temple Meads capacity and passenger experience enhancements
2. Strategic Bus Investment. In the establishment of our Regional Bus Strategy and Bus Programme, and associated Bus Deal with local providers, we have allocated an initial £20m from TCF to support the continued development of the frequency, reliability and quality of bus services across the region. This will include measures to enhance service reliability on key regional routes, and the extension of our successful metrobus rapid transit services on key routes. We will specifically be investing in:
• Metrobus Extensions; and
• Strategic Park & Ride solutions that support transfer modes from private car use to either bus or rail services in our congested urban areas.
3. Digital Enabling. There is an alignment of both challenge and opportunity in relation to our transport vision. We recognise that Mass Transit routes will not solve all our transport challenges. Mobility as a Service (MaaS) will also be important to move from people needing to own a car, to travel consumed as a service, based on travel need. However, concepts as part of TCF funding are under-developed and whilst aspirations align closely with our FMZ proposals, they fall short of the level of development, innovation and resourcing needed to stimulate the market and deliver the outcomes that we are anticipating as part of the FMZ Bid Submission.
West of England Combined Authority – Future Mobility Zone – Final Proposal
66
Hence the FMZ bid remains critical for the delivery of digital enabling in the region noting that our region starts from a position of growing bus patronage and is at the forefront of Smart City enabling technologies. The FMZ proposals will allow us to bring together our regional skills and experience within the public and private sector to work on the FMZ project which will additionally help advance a number of established, but unfunded longer-term transport aspirations. This complimentary approach will help to:
• Support our Mass Transit approach by enhancing the customer experience through digital solutions
• Deliver smart multi-modal travel planning
• Deliver integrated smart ticketing
• Deliver a Regional Operations Centre, working with partners to enable intelligent management of our multi-modal networks
• Enhance the availability of data to support future evidence-based decision making, and to enable future smart solutions.
A substantial proportion of TCF investment is in “tried and tested” technologies and solutions. FMZ will allow new ways of using and accessing traditional infrastructure allowing new service models and modes to be used. Our FMZ proposal will allow us to unlock more from our TCF investment in more ‘traditional’ modes.
The TCF therefore aligns very closely to the core aims of the FMZ and our innovative digital aspirations for transport, Specifically, FMZ would complement TCF in each of the main areas in the FMZ architecture described in Figure 3, as follows:
1. Connectivity. The FMZ physical connectivity provided by mobility stations would allow improved access to infrastructure upgrades funded by TCF, for example allowing new connections by new modes to access upgraded bus, rail and future transit stops. The selection of complementary locations for mobility stations also has the potential to further enhance this approach. The Data Hub would provide many types of new transport datasets which would improve the ability of residents to make maximum use of the new transport infrastructure as well as providing evidence to allow us to improve the effectiveness of our future capital investment.
2. MaaS Platform. The delivery of a MaaS solution would act as a conduit to connect operators, consumers and transport authorities to the existing services and the TCF enhancements in rail and bus services. This builds on top of the foundation layer, as well as acting as a mechanism to trial new modes with transport users either in isolation or as part of a wider connected journeys made using our rail and bus enhancements. FMZ services would be expected to provide an ‘uplift’ compared with conventional services based on increased catchments and journey possibilities. MaaS could also help make better use the new infrastructure in off-peak periods.
3. Mobility Services. Trials and demonstrations of new modes and services such as micromobility and dynamic demand responsive travel have clear benefits in isolation, but also as part of those wider connected end-to-end journeys integrating rail and bus services, which will be enhanced through TCF. Dynamic demand responsive travel would extend catchments in terms of origins and destinations, allowing improved connections to areas where there is high demand but limited conventional transport offerings. These could provide first mile/ last mile services from the bus and rail services upgraded through TCF, meaning more people would benefit from the investment. DDRT could also allow more sophisticated connections to upgraded services, for example connecting with the actual arrival/ departure times rather than timetabled times.
In addition, the enhanced data levered through the FMZ proposals and operation of the Living Lab provides the opportunity for detailed feedback that can help ensure investment and solutions being delivered through TCF and our Investment Fund are better aligned to need.
All TCF projects are managed in line with the West of England Local Growth Assurance Framework. This provides strong oversight of decision making, risk management, audit and scrutiny. The oversight of FMZ (as described in Section E2) would be complementary to TCF oversight which would ensure

West of England Combined Authority – Future Mobility Zone – Final Proposal
67
that maximum benefits are assured whilst at the same time ensuring clear demarcation between the projects.
The FMZ project would not be directly dependent on initial funding from TCF; it would be deliverable without TCF. However, we consider that the two projects would be complementary and that FMZ would allow substantially more benefits to flow from the TCF investment.

West of England Combined Authority – Future Mobility Zone – Final Proposal
68
Appendices
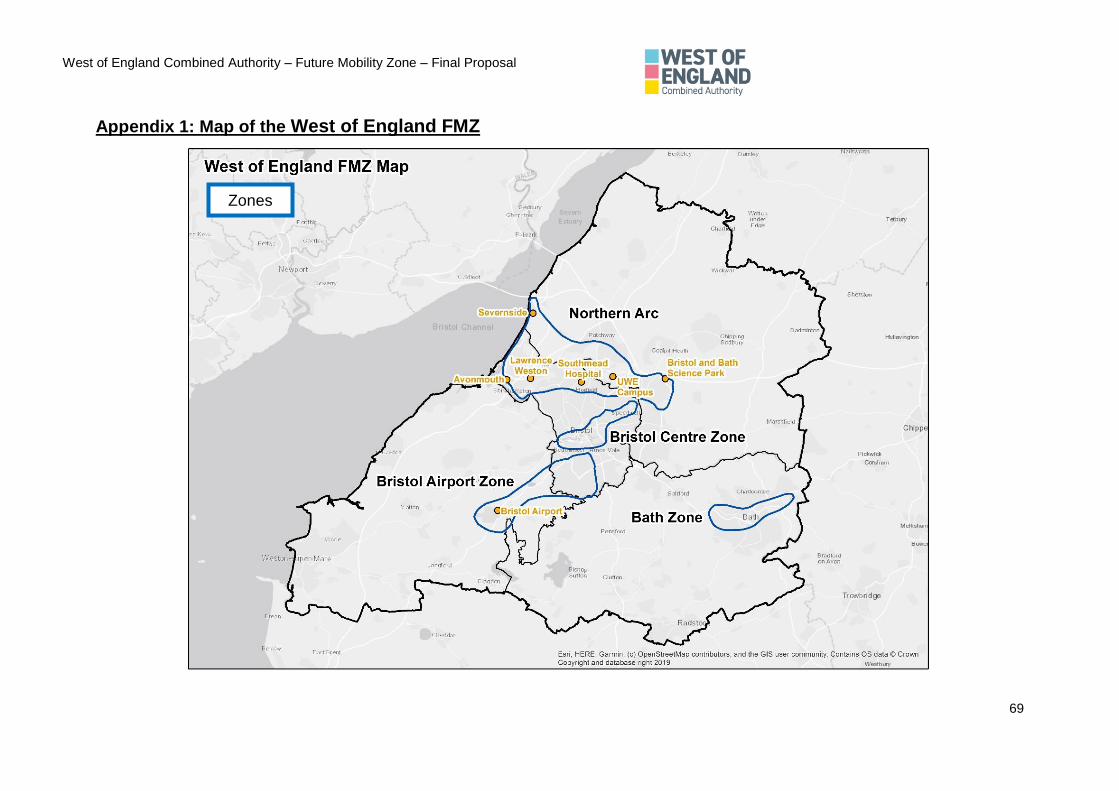
West of England Combined Authority – Future Mobility Zone – Final Proposal
69
Appendix 1: Map of the West of England FMZ
Zones
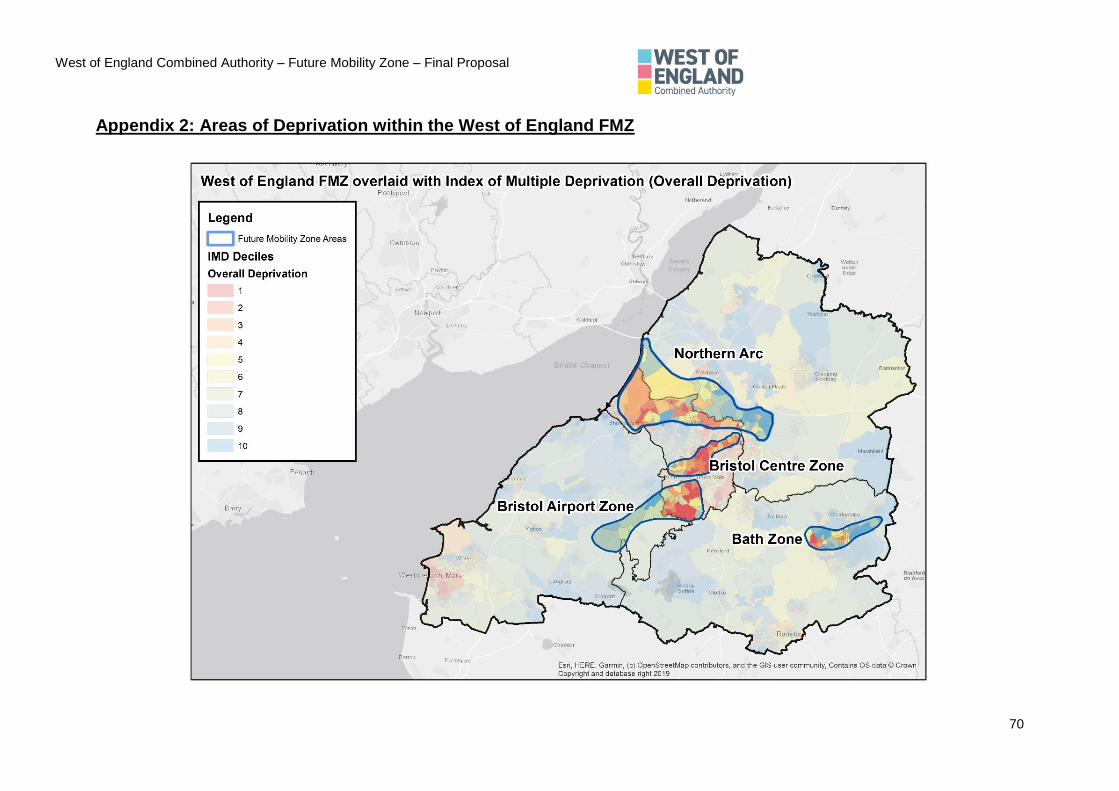
West of England Combined Authority – Future Mobility Zone – Final Proposal
70
Appendix 2: Areas of Deprivation within the West of England FMZ

West of England Combined Authority – Future Mobility Zone – Final Proposal
71
Appendix 3 – FMZ Areas
The criteria for selecting the locations of the FMZ are detailed in Section A1.
Central Bristol
Central Bristol is the economic and cultural centre of the region and faces significant congestion challenges, along with associated environmental issues.
The volume of traffic on major roads in Bristol has increased by 12% between 2010 and 201767, whilst TomTom’s traffic index estimates that congestion in Bristol (the measured amount of extra travel time experienced by drivers) has increased by 9% over the same period. Transport modelling for the region forecasts that this will worsen, with the total number of motor trips across the West of England forecast to increase by 23% by 2036.
Much of the city’s transport system operates at capacity during peak hours, which is a threat to the densified employment growth planned for the city – including the Bristol Temple Quarter Enterprise Zone which is targeted to grow from 3,000 to 22,000 jobs68 and deliver 4,500 new homes. The Temple Quarter is a key location for the growth of businesses working across the four Industrial Strategy Grand Challenges and will be a major test bed for Smart City solutions, but lack of connectivity could undermine this.
A Clean Air Zone is also being developed for the central area. Through the West of England FMZ, Central Bristol will trial a new Data Hub and MaaS Platform aimed at maximising the city’s transport capacity, improving accessibility for low-income families and improving air quality; and will test micromobility solutions, complementing existing wider investment in walking, cycling and public transport.
Bath
Within central Bath, 42% of households do not have access to a car, significantly higher than the national average (26%). As a result, fewer people drive to work (19% compared to 37% in England), and more walk to work (24% compared to 7% in England)69. However, large numbers of people drive into central Bath from the outskirts of the city, surrounding towns and rural areas. As such, Central Bath experiences significant congestion as a result of the high levels of single occupancy car journeys into the city.
Congestion has been a significant contributor to the air quality issues faced in the city – resulting in the declaration of a Clean Air Zone. To help address this, WECA and Bath and North East Somerset Council aim to shift mode choice towards public transport and active travel modes. This is needed to sustainably deliver the 7,000 new homes forecast for Bath up to 2029, and an additional 7,000 jobs, increasing to 11,000 by 203570.
To bring about the significant mode shift required, Central Bath will trial a Data Hub and MaaS Platform aimed at reducing single-occupancy private vehicle trips into the city and trial new micromobility solutions, complementing existing wider investment in walking, cycling and public transport.
Northern Arc – Avonmouth, Severnside, Emersons Green and the North Fringe
Together, Avonmouth, Severnside, Emersons Green and the North Fringe form the most economically important location within the South West of England.
The North Fringe includes the key sectors of aerospace engineering, defence procurement and supplies, financial services, retail and education supporting over 70,000 jobs. Housing growth sites of over 7,000 new homes are planned with many more already in construction.
Traffic levels have risen by 50% since 1991 (compared to 21% nationally) largely due to the area being geographically dispersed making it hard for conventional fixed route services to provide last mile/first mile connections to/from homes and jobs71. Ongoing investment in sustainable travel choices; including recent investment in MetroBus rapid transit; and future TCF funding of investment in rail and MetroBus expansions provide the potential to build on this and maximise the value of the infrastructure investment.
West of England Combined Authority – Future Mobility Zone – Final Proposal
72
The Avonmouth Severnside Enterprise Area (ASEA) is an industrial location of international significance, extending for five miles along the Severn Estuary and covering some 1,800 hectares. Within the ASEA, Severnside is the largest brownfield site in Western Europe, located between Bristol and the River Severn, and immediately adjacent to the M5 and M49 motorways. Avonmouth is the closest port to the main centres of UK population, with 45 million people living within a radius of 300 kilometres72.
The three largest employment sectors in Severnside are transport and storage, wholesale and manufacturing. These reflect the area’s attractiveness for large-scale industrial, warehousing, distribution, energy and waste processing uses, in addition to the activities of the port and its storage and distribution facilities and associated industries.
The ASEA has poor connectivity to labour markets with very car-dominated access and very low penetration by public transport. The M5 and M49 act as a physical barrier to labour markets in the areas of Lawrence Weston, Shirehampton and Southmead. These areas suffer from significant deprivation – being within the 10% most deprived areas nationally73 - with connectivity to skills and training needing to be addressed to better support the communities and labour market needs.
Appendix 2 shows the overlap of our FMZ locations to areas of deprivation in the West of England, in particular highlighting the deprivation in the Northern Arc. The West of England FMZ will help to address this by improving access to employment and training opportunities.
The Northern Arc also covers the Emersons Green Enterprise Area, and is home to the Bristol and Bath Science Park which includes the National Composites Centre.
Through the FMZ we will trial a Data Hub, MaaS Platform, DDRT and new micromobility solutions, aimed at improving transport choices and opportunities, complementing the extensive infrastructure plans for the Northern Arc. For the ASEA we will pilot how these services can widen access to this location and improve connectivity to adjoining labour markets and areas of deprivation including Lawrence Weston, Shirehampton and Southmead (as shown in Appendix 2). This will include trialling Mobility Credits to enable access to employment opportunities.
Bristol Airport
Bristol Airport is the major regional airport for the South West of England, handling more than 8.7m passengers in 2018 and 20,000 passengers per day74, with planning permission to grow to 10m passengers per year. Long-term, the airport has an aspiration to grow to 15m passengers per year by 2035iii. Passengers come from across the region:
1. 36% from the West of England
2. 39% from the wider South West region
3. 19% from South Wales75
The airport has approximately 4,000 staff on site each day, who commute to the airport largely through single occupancy car trips76. The airport also supports employment for over 24,000 people across the wider South West of England. This zone extends to South Bristol, recognising the need to improve access to employment at the airport from deprived areas in South Bristol.

West of England Combined Authority – Future Mobility Zone – Final Proposal
73
Appendix 4 – The West of England Local Industrial Strategy
The West of England is a place of collaboration, ingenuity and creativity, with a strong tradition of innovation. It is a place where ideas flourish and businesses grow, where creative, digital and technology meet traditional industry. It is at this interface where the solutions to the challenges of the future lie. Securely founded in robust evidence, the West of England LIS, published in July 2019, represents a strong partnership between local and national partners and a recognition of the shared ambition and opportunity for the region.
The robust evidence base underpinning our LIS has identified four main priorities: cross-sectoral innovation; inclusive growth; addressing the productivity challenge; and delivering innovation in infrastructure delivery.
Cross-sectoral innovation - Fostering cross-sectoral innovation from research through to commercialisation.
The West of England has long been a leader of innovation, born out of its substantial innovation ecosystem of major research-intensive businesses, four universities, specialist engineering innovation centres, growing numbers of innovative SMEs and a diverse economic base that brings together complementary strengths in a broad range of specialisms. This is driven by three significant sector strengths: advanced engineering; creative, cultural and digital industries; and financial, business and legal ‘tech’ services.
Our ambition is to be recognised globally as a place of innovation, where leading designers, engineers, scientists and entrepreneurs combine with industry to create an innovation ecosystem that drives research, development and commercialisation. To that end, the LIS sets out how the West of England will focus and coordinate the region’s pioneering innovation and sector strengths to maximise collaborative innovation. The West of England, in partnership with local partners, will develop a model for a Global Centre of Innovation Excellence (GCIE) to lead this work. Alongside this, the West of England will consult with local partners and government to design a locally-led model of a network of Living Labs. Overseen by the GCIE, this programme will aim to test, develop and prepare for market new products and services.
Inclusive growth - Ensuring that growth is inclusive, with a focus on opportunities for employment and progression for all.
Ensuring that economic growth is inclusive is at the heart of the West of England’s ambition and vision for the region’s future. It recognises that there are significant barriers to certain communities which constrain access to the opportunities the region offers.
The LIS will support communities facing specific challenges, bringing together a broader range of budgets and interventions linked to addressing careers advice, worklessness, in-work progression, and both digital and physical infrastructure to better connect people to opportunities.
Productivity challenge - Addressing the productivity challenge, including adopting new technology and management practices and supporting businesses to trade.
The West of England is home to a range of innovative, dynamic and fast growing businesses. Despite this, the region faces a productivity challenge. The growth of many businesses in the region remains slow, with productivity gains held back by slow uptake of technology and modern management practices.
The West of England aims for businesses of all sizes in its region to fulfil their potential, improving performance, resilience and sustainability, and enabling them to grow and offer a wide range of good quality jobs. It will ensure that businesses of all types and sizes have access to the space, networks and skills they need to thrive. To overcome the productivity challenge, the West of England will continue to co-ordinate regional business support services and build on Growth Hub funding and provision. This will ensure that specialist advice is available, tailored to different sectors and business life stages.
Innovation in infrastructure delivery - capitalising on the region’s innovative strengths to deliver the infrastructure necessary for future growth.

West of England Combined Authority – Future Mobility Zone – Final Proposal
74
Having the right infrastructure in place – both physical and digital – is key to unlocking productivity in the region, connecting rural and urban communities, and driving forward clean and inclusive growth and maximising the opportunities of the smart region. The West of England’s ambition is for the region’s residents to be able to move seamlessly around the region, using affordable transport solutions that minimise the impact on the environment.
The West of England benefits from its strong road and rail links and its international connectivity. However, the region’s infrastructure is coming under increasing pressure, making it harder for residents to move around the region for work and leisure. Using its innovation assets, the West of England is looking to develop a smart region more in tune with the needs of its residents. The region will also embed innovation in action to tackle the infrastructure challenges – including the Future of Mobility.
The actions identified in the LIS support the delivery of the four National Industrial Strategy Grand Challenges, including the Future of Mobility.
West of England Combined Authority – Future Mobility Zone – Final Proposal
75
Appendix 5 - Regional and local strategic policy review
Appendix 5 details how the West of England FMZ will help to meet the West of England’s strategic transport objectives – at a regional and local level.
Regional Strategic Policy Documents
The West of England FMZ will build on the region’s strengths, including:
1. Growth in bus patronage - The WECA region has achieved an unprecedented level of bus passenger growth - 30% in the last 5-years, rising to 50% in Bristol77.
2. The West of England is home to four leading universities - BRL is one of the key assets that brings together various technologies to collaborate on CAV projects in the Future Mobility sector. It is also home to the West of England Robotics Network.
3. Collaboration between leading sectors within the innovation cluster - The West of England has strong capabilities in enabling technologies for Future Mobility, including R&D capabilities in propulsion technologies (through IAAPS) and automotive materials testing (through the National Composites Centre). The region is also home to high value aerospace engineering capabilities with major international businesses such as Airbus, GKN, BAE Systems, Rolls-Royce and Boeing leading the way in aerospace design – including the exciting area of Urban Air Mobility.
4. The Government’s Industrial Strategy Creative Sector Deal describes the West of England as a “globally significant, high-growth creative cluster” - Bristol is one of only two cities outside London which feature in the top 10 for both Creative and High-Tech clusters, according to Nesta, the Innovation Foundation.
5. A strong, capable workforce - The people who live and work in the West of England are a substantial asset with 44% educated to degree level (10% points higher than Manchester and Birmingham) and 42% of graduates choose to remain here.
6. Smart Region - Building on the success of Bristol is Open, WECA has started to develop a vision to become a Smart Region, setting up a strategic alliance between the local authorities to identify digital infrastructure priorities.
7. Geographical size - It is ‘small enough and big enough’ for cross sectoral collaboration, an ideal size to attract investment, to test innovation such as the 5G Smart Tourism Test Bed and to facilitate formal and informal networks.
The West of England is unique in having a joint approach to spatial and transport planning, showing the collaborative and innovative approach that the region is known for. The key strategic regional policy documents are summarised below, with their key objectives (in bold) and alignment to the West of England FMZ noted:
1. The West of England Joint Transport Study (JTS) (2017) provided the evidence base to inform
the development of the draft JLTP 4. It highlights the need for a step change in the number of
low carbon walking and cycling journeys, transforming connectivity by improving pub-
lic transport and delivering a more resilient road network. The West of England FMZ will
support delivery of this by developing a MaaS Platform, providing a unified, digital user plat-
form, including better information for consumers on public transport, walking and cycling op-
tions. Through the Data Hub, new traffic data sources will increase road network resilience and
allow public transport operators to better plan their services.
2. The draft JLTP4 (2019) provides the strategic direction for all investment in transport in the
West of England until 2036, building on the recommendations of the JTS. The draft JLTP sets
out the challenges faced in the region, including network capacity and heavy congestion in
many areas. It highlights the opportunity that new technology could bring, including MaaS,
CAVs, open data and Smart City initiatives. The FMZ will address the objective of supporting
sustainable and inclusive economic growth by using smarter transport measures to unlock
capacity on the network, thereby allowing the development of further jobs and housing.

West of England Combined Authority – Future Mobility Zone – Final Proposal
76
Furthermore, through the MaaS Platform and the provision of new mobility services, access to employment for those living in disadvantaged areas with poor connectivity will enable improved accessibility and life opportunities.
3. Our Regional Growth provides the strategic overarching development framework to guide
housing, employment and infrastructure requirements to 2036. Like the Draft JLTP4, it priori-
tises sustainable and inclusive economic growth by promoting growth of Enterprise Zones
and Enterprise Areas as well as accessibility to jobs. It also highlights the importance of
access to public transport to reduce reliance on private cars. Accordingly, the West of
England FMZ focuses on increasing connectivity to Enterprise Areas and Zones, with Mobility
Stations and DDRT providing the means for more people of all socio-economic backgrounds
to reach these areas of employment in a sustainable fashion.
4. The Local Industrial Strategy (LIS) is coordinated by WECA and is summarised in Appendix 4.
The FMZ directly aligns to and supports the four priority areas of our LIS: cross-sectoral in-
novation, inclusive growth, productivity and innovation in infrastructure delivery.
5. The One City Plan (2019) by the Mayor of Bristol, Marvin Rees, sets out how Bristol will be-
come a fair, healthy and sustainable city by 2050. In addition to a sustainable, inclusive and
growing economy from which all benefit, it prioritises connecting people through digital ser-
vices and transport that is efficient, sustainable and inclusive. The FMZ Data Hub and
MaaS will together mean that people are better connected to a variety of transport services
and information at their fingertips. Mobility Credits and DDRT will reduce inequality of access
to transport services.
6. Our Plan to get Bath Moving (2017) was produced by Bath and North East Somerset Council
and focuses on transport issues within the city of Bath over the next 20 years. Among its ob-
jectives are reducing congestion and improving air quality by encouraging alternative
forms of transport to the car. The MaaS Platform will provide realistic, convenient and af-
fordable travel choices by offering travel combinations to solve inconvenient parts of a con-
sumer’s journey. Micromobility trials within Bath will provide attractive alternatives to the car
for short journeys and integrate with longer journeys involving public transport.
As a summary, Table 1(shown below and in the main report) shows the alignment between regional
strategic objectives and the projects being developed in the FMZ.
Table 1 – Alignment of FMZ Projects to Regional Strategic Objectives
Regional Strategic Objectives Data Hub MaaS Mobility
Stations Micromobility DDRT
Sustainable and inclusive economic
growth, increasing productivity ✔✔✔ ✔✔✔ ✔✔✔ ✔ ✔✔✔
Equality and accessibility ✔ ✔✔✔ ✔✔✔ ✔ ✔
Better health, wellbeing, safety and
security ✔ ✔✔✔ ✔✔✔ ✔ ✔
Enable independence, reduce
health inequalities ✔
✔✔✔ ✔✔✔ ✔ ✔✔✔
Access to public transport which
reduces reliance on cars ✔ ✔✔✔ ✔✔✔ ✔✔✔ ✔✔✔
Access to jobs ✔✔✔ ✔✔✔ ✔✔✔ ✔ ✔✔✔
Reducing congestion and a more
resilient road network ✔✔✔ ✔✔✔
✔✔✔ ✔✔✔ ✔✔✔
Improving air quality ✔ ✔✔✔ ✔✔✔ ✔✔✔ ✔✔✔
Well connected with digital services ✔✔✔ ✔✔✔ ✔ ✔ ✔
West of England Combined Authority – Future Mobility Zone – Final Proposal
77
Local Strategic Policy Documents
Alignment of the FMZ to local policy is also critical. Key local policy documents are summarised below, with their key objectives (in bold) and alignment to the West of England FMZ noted:
1. Bristol Temple Quarter Enterprise Zone’s Spatial Framework (2016) sets out how the zone will
become a thriving new city quarter over the next 25 years. The FMZ will address its objective
of becoming a transport hub through better connectivity and access to surrounding neigh-
bourhoods and the city beyond. The Data Hub will provide better insight for transport oper-
ators to plan their services, whilst the MaaS Platform will improve the user experience, ensur-
ing consumer demand is met and that better connections between Temple Quarter and sur-
rounding neighbourhoods are delivered.
2. The Bristol International Airport Master Plan (2006) and Surface Access Strategy (2012) dic-
tate the airport’s ambitions for easy, reliable and efficient access to the airport for passen-
gers and staff. This includes targets for public transport use to reduce congestion and air
quality impacts of traffic travelling to and from the site. The more extensive use of data and
DDRT will allow services to respond to peaks in demand, providing a more efficient and reliable
journey to the airport for employees. This, in turn, will make public transport to the airport easier
and more efficient, leading to modal shift and improved air quality.
3. The Avonmouth Severnside Outline Development Strategy Report (2012) was commissioned
by Bristol City Council and South Gloucestershire Council for this economically and environ-
mentally important area. In addition to sustainable economic growth and jobs its objectives
include bringing forward development opportunities that are attractive to the market and
protecting existing businesses and investment. The FMZ will support key growth sectors
such as transport and storage, wholesale and manufacturing by improving access for em-
ployees – a key challenge for the Enterprise Area - through MaaS, Micromobility and DDRT.
Increasing accessibility to the site will also provide greater access to the local workforce, mak-
ing the area more attractive to investment by new companies and encouraging existing com-
panies to stay.
4. Bath City Riverside Enterprise Area Masterplan (2014) provides the strategic vision for the
area until 2029. Among its objectives are green infrastructure, walking and cycling and
health and wellbeing. The FMZ aligns with this in the promotion of active travel through the
MaaS Platform. It will highlight the benefits of walking and cycling and increase consumers’
awareness of how easy it can be for certain journeys. Micromobility trials such as e-bikes will
also contribute to daily exercise and improved health and wellbeing.
5. The Bristol Transport Strategy (2019) was adopted in July 2019, identifying the challenges and
opportunities for the city and the desired outcomes from the strategy. Of particular relevance
to the FMZ, the strategy promotes the use of Mobility Stations in order to address citizen
concerns regarding improved cross-modal integration, information and wayfinding.
West of England Combined Authority – Future Mobility Zone – Final Proposal
78
Appendix 6 – Removed due to confidentiality

West of England Combined Authority – Future Mobility Zone – Final Proposal
79
Appendix 7 – AQMAs within the Northern Arc
West of England Combined Authority – Future Mobility Zone – Final Proposal
80
Appendix 8 – Removed due to confidentiality
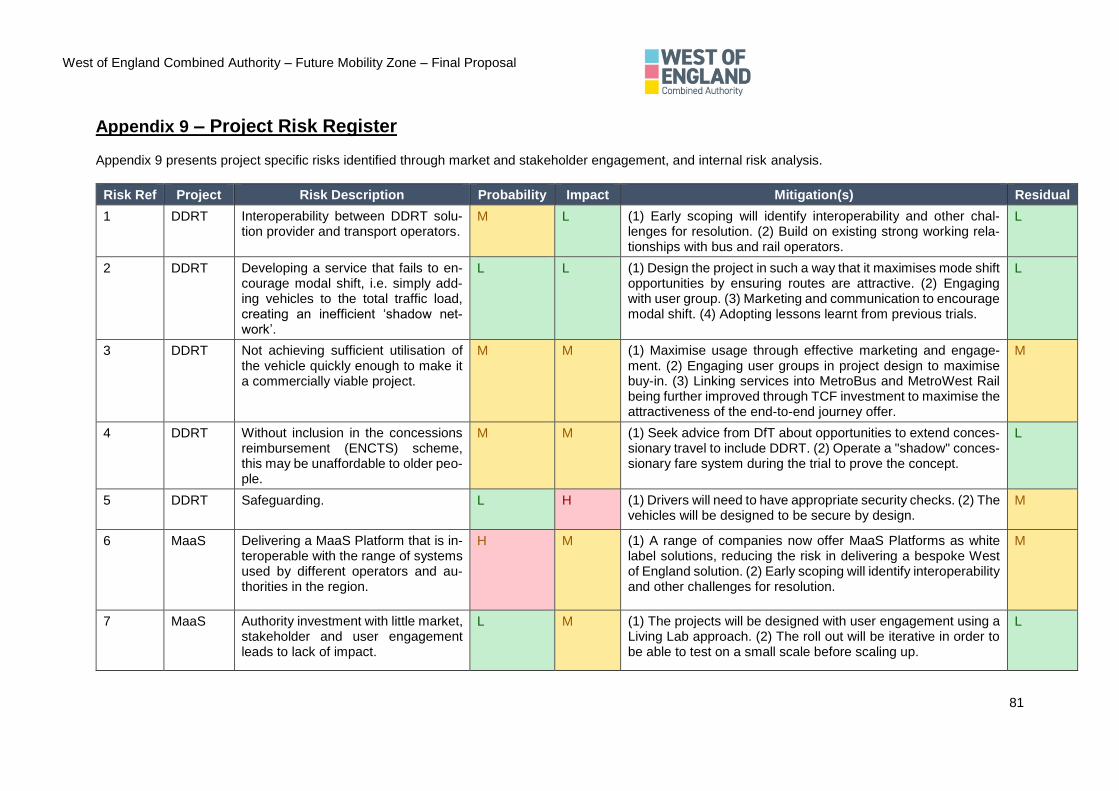
West of England Combined Authority – Future Mobility Zone – Final Proposal
81
Appendix 9 – Project Risk Register
Appendix 9 presents project specific risks identified through market and stakeholder engagement, and internal risk analysis.
Risk Ref Project Risk Description Probability Impact Mitigation(s) Residual
1 DDRT Interoperability between DDRT solu-tion provider and transport operators.
M L (1) Early scoping will identify interoperability and other chal-lenges for resolution. (2) Build on existing strong working rela-tionships with bus and rail operators.
L
2 DDRT Developing a service that fails to en-courage modal shift, i.e. simply add-ing vehicles to the total traffic load, creating an inefficient ‘shadow net-work’.
L L (1) Design the project in such a way that it maximises mode shift opportunities by ensuring routes are attractive. (2) Engaging with user group. (3) Marketing and communication to encourage modal shift. (4) Adopting lessons learnt from previous trials.
L
3 DDRT Not achieving sufficient utilisation of the vehicle quickly enough to make it a commercially viable project.
M M (1) Maximise usage through effective marketing and engage-ment. (2) Engaging user groups in project design to maximise buy-in. (3) Linking services into MetroBus and MetroWest Rail being further improved through TCF investment to maximise the attractiveness of the end-to-end journey offer.
M
4 DDRT Without inclusion in the concessions reimbursement (ENCTS) scheme, this may be unaffordable to older peo-ple.
M M (1) Seek advice from DfT about opportunities to extend conces-sionary travel to include DDRT. (2) Operate a "shadow" conces-sionary fare system during the trial to prove the concept.
L
5 DDRT Safeguarding. L H (1) Drivers will need to have appropriate security checks. (2) The vehicles will be designed to be secure by design.
M
6 MaaS Delivering a MaaS Platform that is in-teroperable with the range of systems used by different operators and au-thorities in the region.
H M (1) A range of companies now offer MaaS Platforms as white label solutions, reducing the risk in delivering a bespoke West of England solution. (2) Early scoping will identify interoperability and other challenges for resolution.
M
7 MaaS Authority investment with little market, stakeholder and user engagement leads to lack of impact.
L M (1) The projects will be designed with user engagement using a Living Lab approach. (2) The roll out will be iterative in order to be able to test on a small scale before scaling up.
L

West of England Combined Authority – Future Mobility Zone – Final Proposal
82
Risk Ref Project Risk Description Probability Impact Mitigation(s) Residual
8 MaaS Investment in a MaaS platform still es-sentially in R&D, non-delivery of in-tended solution.
L L (1) There are a number of fully functioning MaaS systems we can learn from during the concept design phase. (2) The speci-fication will ensure that the solution is delivered as planned. (3) Taking a long-term approach to delivery that lead to commer-cially viable solutions.
L
9 MaaS Future changes in technology or mo-bility rendering elements of solutions redundant.
M L (1) The solutions we choose will be designed to be flexible to allow for changes in technology or mobility habits. (2) Additional funding has been allocated to cover new or changing technology solutions.
L
10 MaaS Withdrawal of support from transport providers.
M M (1) Build on existing strong relationships with transport providers (2) Consortium approach and utilising multiple providers. (3) Early market engagement. (4) Flexible system will allow provid-ers to be swapped in and out.
L
11 MaaS Difficulty for suppliers to scale trial into commercially sustainable solution due to costs of the solution and passenger expectations.
M M (1) Test on a small scale and ensure that business plans, based on concrete examples elsewhere, are robust. (2) Early and on-going market engagement to ensure commercial focus.
L
12 MaaS Availability and accuracy of data to be used.
L L (1) Ensure that provision of data is written in to specifications so that providers are fully aware of this from the start.
L
13 Data Hub
Lack of adoption. L L (1) Current experience shows there has been substantial take up of the Bristol data hub – lessons to be drawn from this. (2) Ensure thorough user engagement so that the solution meets real needs/requirements.
L
14 Data Hub
Technology change makes it obso-lete.
M L (1) Market engagement to understand current technology read-iness, and new solutions. (2) Flexibility will be built in to the spec-ification so that new data formats and sources of data can be built in to the platform. Likewise, the ways in which data is ex-ported will be kept flexible to ensure it stays up-to-date.
L

West of England Combined Authority – Future Mobility Zone – Final Proposal
83
Risk Ref Project Risk Description Probability Impact Mitigation(s) Residual
15 Data Hub
Inability to survive beyond immediate funding.
M M (1) Ensure the system is set up such that ongoing costs are kept low and that as much as possible of the functions are linked to "Business as Usual" functions such that the additional costs are kept small. (2) Consider commercialisation of the hub/certain datasets or capabilities.
L
16 Data Hub
Potential to restrict innovation if the hub is controlled by strict change management procedures.
L L (1) Use a federated approach to the data such that different sources of data can be made available on different terms to avoid a "one size fits all" problem.
L
17 Data Hub
Potential for a mobility service opera-tor to exploit data to create a monop-oly on local services.
L L (1) The principle will be that data is released on as open a basis as possible which should minimise the risk of only one solution being developed.
L
18 Micromo-bility
Hoarding or dumping of bikes/scoot-ers away from accessible locations.
M M (1) There are a variety of security features that can be built in to the bikes/ scooters to minimise the risk of hoarding or dumping.
L
19 Micromo-bility
Vandalism to bikes/scooters. M M (1) There are a variety of security features that can be built in to the bikes/ scooters to minimise the risk of vandalism.
L
20 Micromo-bility
Safeguarding of users. M M (1) Operators will be required to demonstrate that their equip-ment is as safe as possible and maintained in good condition. (2) User terms and conditions will also set out the levels of ex-pected behaviour.
L
21 Micromo-bility
Limited knowledge of operational de-mand, sustainability and physical in-frastructure for UK use.
L L (1) We are in discussions with a number of experienced opera-tors who we would expect will have fully researched the UK mar-ket prior to engaging.
L
22 Micromo-bility
Current legislation prohibits e-scooter use on anything but private land.
H H (1) We will seek to be flexible about there "where" and the "what" that we test so that we can test solutions that are acceptable both locally and nationally. (2) Early and ongoing engagement with DfT.
M
23 Mobility Stations
Land availability / land access. L L (1) We will be flexible about where and how we test. (2) Early scoping and identification to allow enough time in the pro-gramme.
L
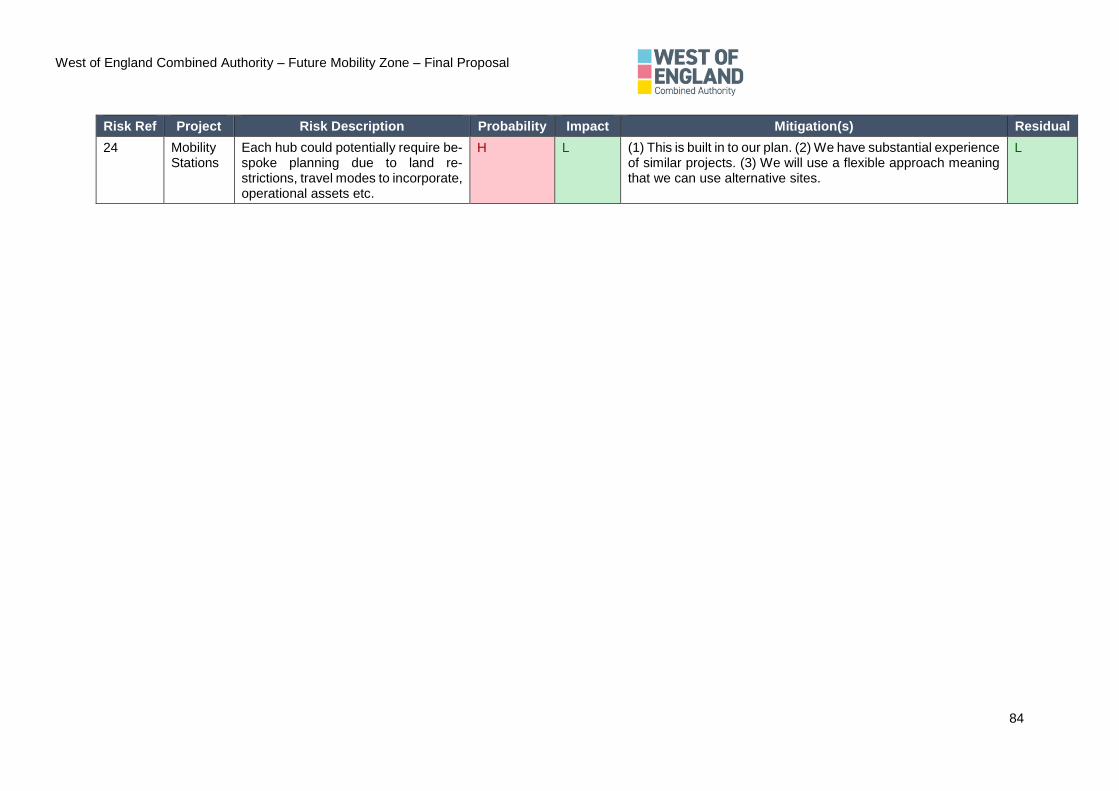
West of England Combined Authority – Future Mobility Zone – Final Proposal
84
Risk Ref Project Risk Description Probability Impact Mitigation(s) Residual
24 Mobility Stations
Each hub could potentially require be-spoke planning due to land re-strictions, travel modes to incorporate, operational assets etc.
H L (1) This is built in to our plan. (2) We have substantial experience of similar projects. (3) We will use a flexible approach meaning that we can use alternative sites.
L

West of England Combined Authority – Future Mobility Zone – Final Proposal
85
Appendix 10 – Removed due to confidentiality
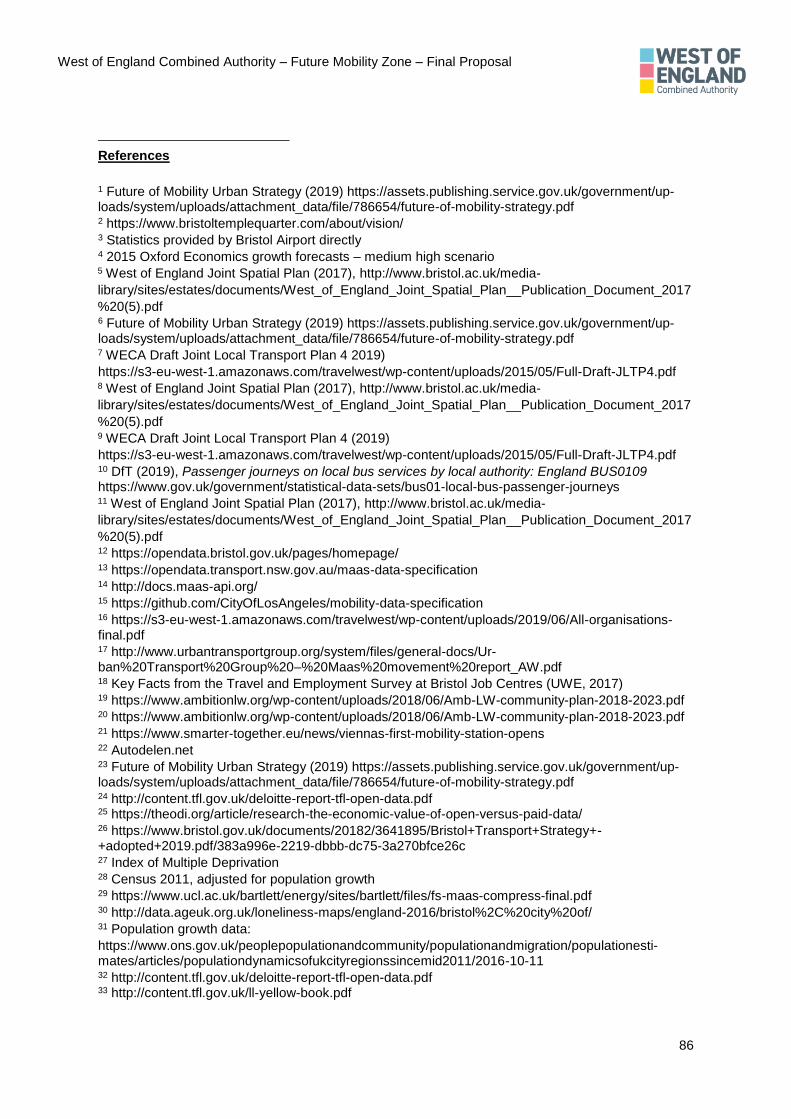
West of England Combined Authority – Future Mobility Zone – Final Proposal
86
References
1 Future of Mobility Urban Strategy (2019) https://assets.publishing.service.gov.uk/government/up-loads/system/uploads/attachment_data/file/786654/future-of-mobility-strategy.pdf 2 https://www.bristoltemplequarter.com/about/vision/ 3 Statistics provided by Bristol Airport directly 4 2015 Oxford Economics growth forecasts – medium high scenario 5 West of England Joint Spatial Plan (2017), http://www.bristol.ac.uk/media-
library/sites/estates/documents/West_of_England_Joint_Spatial_Plan__Publication_Document_2017
%20(5).pdf 6 Future of Mobility Urban Strategy (2019) https://assets.publishing.service.gov.uk/government/up-loads/system/uploads/attachment_data/file/786654/future-of-mobility-strategy.pdf 7 WECA Draft Joint Local Transport Plan 4 2019)
https://s3-eu-west-1.amazonaws.com/travelwest/wp-content/uploads/2015/05/Full-Draft-JLTP4.pdf 8 West of England Joint Spatial Plan (2017), http://www.bristol.ac.uk/media-
library/sites/estates/documents/West_of_England_Joint_Spatial_Plan__Publication_Document_2017
%20(5).pdf 9 WECA Draft Joint Local Transport Plan 4 (2019)
https://s3-eu-west-1.amazonaws.com/travelwest/wp-content/uploads/2015/05/Full-Draft-JLTP4.pdf 10 DfT (2019), Passenger journeys on local bus services by local authority: England BUS0109 https://www.gov.uk/government/statistical-data-sets/bus01-local-bus-passenger-journeys 11 West of England Joint Spatial Plan (2017), http://www.bristol.ac.uk/media-
library/sites/estates/documents/West_of_England_Joint_Spatial_Plan__Publication_Document_2017
%20(5).pdf 12 https://opendata.bristol.gov.uk/pages/homepage/ 13 https://opendata.transport.nsw.gov.au/maas-data-specification 14 http://docs.maas-api.org/ 15 https://github.com/CityOfLosAngeles/mobility-data-specification 16 https://s3-eu-west-1.amazonaws.com/travelwest/wp-content/uploads/2019/06/All-organisations-final.pdf 17 http://www.urbantransportgroup.org/system/files/general-docs/Ur-ban%20Transport%20Group%20–%20Maas%20movement%20report_AW.pdf 18 Key Facts from the Travel and Employment Survey at Bristol Job Centres (UWE, 2017) 19 https://www.ambitionlw.org/wp-content/uploads/2018/06/Amb-LW-community-plan-2018-2023.pdf 20 https://www.ambitionlw.org/wp-content/uploads/2018/06/Amb-LW-community-plan-2018-2023.pdf 21 https://www.smarter-together.eu/news/viennas-first-mobility-station-opens 22 Autodelen.net 23 Future of Mobility Urban Strategy (2019) https://assets.publishing.service.gov.uk/government/up-loads/system/uploads/attachment_data/file/786654/future-of-mobility-strategy.pdf 24 http://content.tfl.gov.uk/deloitte-report-tfl-open-data.pdf 25 https://theodi.org/article/research-the-economic-value-of-open-versus-paid-data/ 26 https://www.bristol.gov.uk/documents/20182/3641895/Bristol+Transport+Strategy+-+adopted+2019.pdf/383a996e-2219-dbbb-dc75-3a270bfce26c 27 Index of Multiple Deprivation 28 Census 2011, adjusted for population growth 29 https://www.ucl.ac.uk/bartlett/energy/sites/bartlett/files/fs-maas-compress-final.pdf 30 http://data.ageuk.org.uk/loneliness-maps/england-2016/bristol%2C%20city%20of/ 31 Population growth data:
https://www.ons.gov.uk/peoplepopulationandcommunity/populationandmigration/populationesti-mates/articles/populationdynamicsofukcityregionssincemid2011/2016-10-11 32 http://content.tfl.gov.uk/deloitte-report-tfl-open-data.pdf 33 http://content.tfl.gov.uk/ll-yellow-book.pdf

West of England Combined Authority – Future Mobility Zone – Final Proposal
87
34 http://content.tfl.gov.uk/attitudes-to-cycling-2016.pdf 35 http://content.tfl.gov.uk/cycle-parking-implementation-plan.pdf 36 https://assets.publishing.service.gov.uk/government/uploads/system/uploads/attach-ment_data/file/805253/tag-4.1-social-impact-appraisal.pdf 37 http://content.tfl.gov.uk/Exploring-the-journey-experiences-of-disabled-commuters-report.pdf 38 http://content.tfl.gov.uk/cycle-parking-implementation-plan.pdf 39 https://www.livingstreets.org.uk/media/3890/pedestrian-pound-2018.pdf 40 https://assets.publishing.service.gov.uk/government/uploads/system/uploads/attach-ment_data/file/509587/value-of-cycling.pdf 41 https://www.london.gov.uk/sites/default/files/land_value_capture_report_transport_for_london.pdf 42 https://www.arcadis.com/media/5/E/6/%7B5E6F99C5-91D3-46C2-8639-24A182A1E460%7DIm-proving%20Quality%20of%20Life%20through%20Transit%20Hubs_001.pdf 43 https://www.mckinsey.com/industries/travel-transport-and-logistics/our-insights/same-day-delivery-the-next-evolutionary-step-in-parcel-logistics 44 Population growth data:
https://www.ons.gov.uk/peoplepopulationandcommunity/populationandmigration/populationesti-mates/articles/populationdynamicsofukcityregionssincemid2011/2016-10-11 45 Bristol Quality of Life survey 2017/18, https://www.bristol.gov.uk/documents/20182/33896/Qual-ity+of+Life+survey+2017-18+report+%28finral%29.pdf/502d1c1d-24b0-5df5-a3f0-25734bd782af 46 Population growth data:
https://www.ons.gov.uk/peoplepopulationandcommunity/populationandmigration/populationesti-mates/articles/populationdynamicsofukcityregionssincemid2011/2016-10-11 47 Statistics provided directly by ViaVan, a potential DDRT service provider in the region 48 Statistics provided directly by ViaVan, a potential DDRT service provider in the region 49 https://www.nomisweb.co.uk/articles/1163.aspx 50 https://www.bristol.gov.uk/documents/20182/3641895/Bristol+Transport+Strategy+-+adopted+2019.pdf/383a996e-2219-dbbb-dc75-3a270bfce26c 51 https://www.sfchronicle.com/business/article/SF-finds-controlled-scooter-pilot-a-success-13764061.php?psid=e7DPj 52 https://www.portlandoregon.gov/transportation/78431 53 https://www.bristol.gov.uk/documents/20182/3641895/Bristol+Transport+Strategy+-+adopted+2019.pdf/383a996e-2219-dbbb-dc75-3a270bfce26c 54 https://www.livingstreets.org.uk/media/3890/pedestrian-pound-2018.pdf 55 Gössling, S., Choi, A., Dekker, K. and Metzler, D. (2019) The Social Cost of Automobility, Cycling and Walking in the European Union. Ecological Economics [online]. 158pp. 65-74. 56 http://content.tfl.gov.uk/deloitte-report-tfl-open-data.pdf 57 https://www.livingstreets.org.uk/media/3890/pedestrian-pound-2018.pdf 58 Analytical Report 9: The Economic Benefits of Open Data, European Data Portal, December 2017 https://www.europeandataportal.eu/sites/default/files/analytical_report_n9_economic_bene-fits_of_open_data.pdf 59 The Open Data Economy – Unlocking Economic Value by Opening Government and Public Data, https://www.capgemini.com/wp-content/uploads/2017/07/the_open_data_economy_unlocking_eco-nomic_value_by_opening_government_and_public_data.pdf 60 The economic value of data: discussion paper, HM Treasury, August 2018 https://assets.publish-ing.service.gov.uk/government/uploads/system/uploads/attach-ment_data/file/731349/20180730_HMT_Discussion_Paper_-_The_Economic_Value_of_Data.pdf 61 ‘Strength in numbers: How does data-driven decision making affect firm performance?’, Brynjolfs-son E and others, April 2011; SSRN:2011 62 ‘Enter the Data Economy, EU Policies for a Thriving Data Ecosystem’, European Commission, January 2017 https://ec.europa.eu/epsc/sites/epsc/files/strategic_note_issue_21.pdf 63 ‘The Value of Big Data and the Internet of Things to the UK Economy’, SAS & Centre for Econom-ics and Business Research Ltd, February 2016. 64 https://opendata.transport.nsw.gov.au/maas-data-specification 65 http://docs.maas-api.org/

West of England Combined Authority – Future Mobility Zone – Final Proposal
88
66 https://github.com/CityOfLosAngeles/mobility-data-specification 67 DfT Traffic Count Data 68 https://www.bristoltemplequarter.com/about/vision/ 69 UK Census (2011) 70 Bath Transport Plan (2017), https://www.bathnes.gov.uk/sites/default/files/siteimages/communica-tions/TransportPlan2017-11.07.17.pdf 71 South Gloucestershire Core Strategy (2013), https://www.southglos.gov.uk/health-and-social-care/strategies-plans-and-policies/council-strategies-plans/core-strategy-2006-2027/ 72 Invest in South Gloucestershire Portfolio, https://sites.southglos.gov.uk/wp-content/up-loads/sites/241/2013/03/Invest-in-South-Gloucestershire-Portfolio.pdf 73 Bristol City Council (2018), New Wards: Data Profiles https://www.bristol.gov.uk/statistics-census-information/new-wards-data-profiles 74 Statistics provided by Bristol Airport directly 75 Statistics provided by Bristol Airport directly 76 Bristol Airport Surface Access Strategy (2012) https://www.google.co.uk/url?sa=t&rct=j&q=&esrc=s&source=web&cd=1&cad=rja&uact=8&ved=2ahUKEwiz3unLkq_iAhWOSxUIHWLZDFIQFjAAegQIBRAC&url=https%3A%2F%2Fwww.bristolair-port.co.uk%2F~%2Fmedia%2Ffiles%2Fbrs%2Fabout-us%2Fbristol-airport-surface-access-strategy-2012.ashx%3Fla%3Den&usg=AOvVaw02FQwBXknQ8tonE2uBhnWR 77 DfT (2019), Passenger journeys on local bus services by local authority: England BUS0109 https://www.gov.uk/government/statistical-data-sets/bus01-local-bus-passenger-journeys