future focus-australias-skills-and-workforce-development-needs-discussion-paper
TRANSCRIPT

1
Future focus
Australia’s skills and workforce development needs
Discussion Paper July 2012

Future focus: Australia’s skills and workforce development needs A discussion paper for the 2012 National Workforce Development Strategy
July 2012


Purpose of the discussion paper
The Australian Workforce and Productivity Agency (the Agency) has developed this paper to present its research on current issues in relation to productivity and workforce participation, examine issues in relation to future demand from industry and start to explore policy options. The paper invites stakeholder input on these matters prior to the Agency providing advice to government in late 2012.
The Commonwealth Government set up the Agency to undertake research regarding the future nature of work in Australia and to support a new partnership with industry to determine skills and workforce development needs and to improve the productivity of enterprises.
Australian Workforce Futures, published in 2010, established the workforce capability that will be required to 2025, the industries that are expected to grow and the qualifications needed under three different scenarios for the future. It also considered what is holding us back from achieving this and explored strategies to address these issues.
The 2012 strategy will take this work further. To inform the strategy, the Agency is inviting discussion on the way Australia approaches and supports workforce development—at a national, industry and enterprise level.
This Discussion Paper forms part of a wider consultation process. It outlines broad issues and seeks answers to questions. It is not intended to be a draft strategy, nor does it establish the balance of issues that will be examined in the strategy itself. Policy frameworks and actions will be considered after a careful examination of the issues raised and information gathered.
You are invited to provide submissions to the 2012 National Workforce Development Strategy. Your input will help us to identify and explore critical issues in workforce development for Australia to 2025.
The deadline for submissions is 27 August 2012. Further information about the submission process and consultation sessions is available on our website www.awpa.gov.au
Unless you request otherwise, submissions will be made publicly available via the website.
Submissions can be sent to:
or mailed to:
Submissions, Skills and Workforce Development Policy Australian Workforce and Productivity Agency GPO Box 9839 CANBERRA ACT 2601

Contents
Foreword iii
List of acronyms and abbreviations v
Executive Summary 1
Introduction 3
Chapter One: Where are we now? 5
1.1 Productivity 5
1.1.1 What is our productivity growth doing and why? 5
1.1.2 How does Australia compare? 7
1.2 Innovation 8
1.2.1 Australia on the world stage 9
1.2.2 Where are the gaps in our skills for innovation? 9
1.3 Issues in participation 10
1.3.1 Low-‐skilled and unskilled workers 11
1.3.2 Men 12
1.3.3 Women 13
1.3.4 Older workers 14
1.3.5 Aboriginal and Torres Strait Islander people 15
1.3.6 People with disability 15
1.4 Regional issues 16
1.4.1 Regional development 17
1.4.2 Regional participation 18
1.5 Where are we at with skills? 23
1.5.1 The changing nature of work 23
1.5.2 Entry-‐level jobs and novice workers 24
1.5.3 Changing skill requirements 24
1.5.4 Skills for sustainability 26
1.5.5 Developing an Asia capable workforce 26
1.5.6 Migration 27
Chapter Two: What might the future hold? 30
2.1 Scenarios 30
2.1.1 Why use a scenario approach? 30
2.1.2 Developing the scenarios 30
2.1.3 Commonalities across scenarios 33
2.1.4 Differences and uncertainties across scenarios 34
2.1.5 Specific trends and challenges for each scenario 35
2.2 Modelling implications and outcomes 36
2.2.1 Modelling Parameters 38
2.2.2 Employment composition and growth 39
2.2.3 Industry forecasts: employment implications 39
2.2.4 Occupational forecasts 42
2.2.5 Demand for qualifications 46
2.2.6 Supply of qualifications 53
2.2.7 Balance of supply and demand 55
2.2.8 COAG targets for persons 20-‐64 years 56
Chapter Three: How do we get there? Achieving our vision 58
3.1 The future of work and workplaces 59
3.1.1 Building more productive workplaces 60
3.2 Transitions between education, training and work 62
3.3 The future of the tertiary education and training sector 65
3.3.1 The value of qualifications: Do we have the right mix? 66
3.3.2 Ensuring quality in the tertiary sector 70
3.3.3 Priorities for a capable and responsive education and training sector 75
3.4 Addressing issues in participation 78
3.5 Challenges of regional development 80
3.5.1 Meeting the challenges of the resources boom 80
3.5.2 Addressing the risks of regional stagnation 81
3.5.3 Adopting a flexible approach to regional and sectoral development 82
Conclusion and questions 83
Appendix 1: Australian Workforce Futures progress report 84
Appendix 2: Unemployment by selected urban Statistical Local Areas 86
References 89
Future Focus: Discussion Paper i
List of Figures Figure 1 Labour productivity in Australia, % change, 1975–2011 6
Figure 2 Labour productivity indexes by selected industry (Reference year is 2009–10=100.0) 6
Figure 3 Gross value added per hour worked, in dollars, by industry (2009–10) 7
Figure 4 Labour productivity growth in the total economy, Australia and OECD, 1990–2010 8
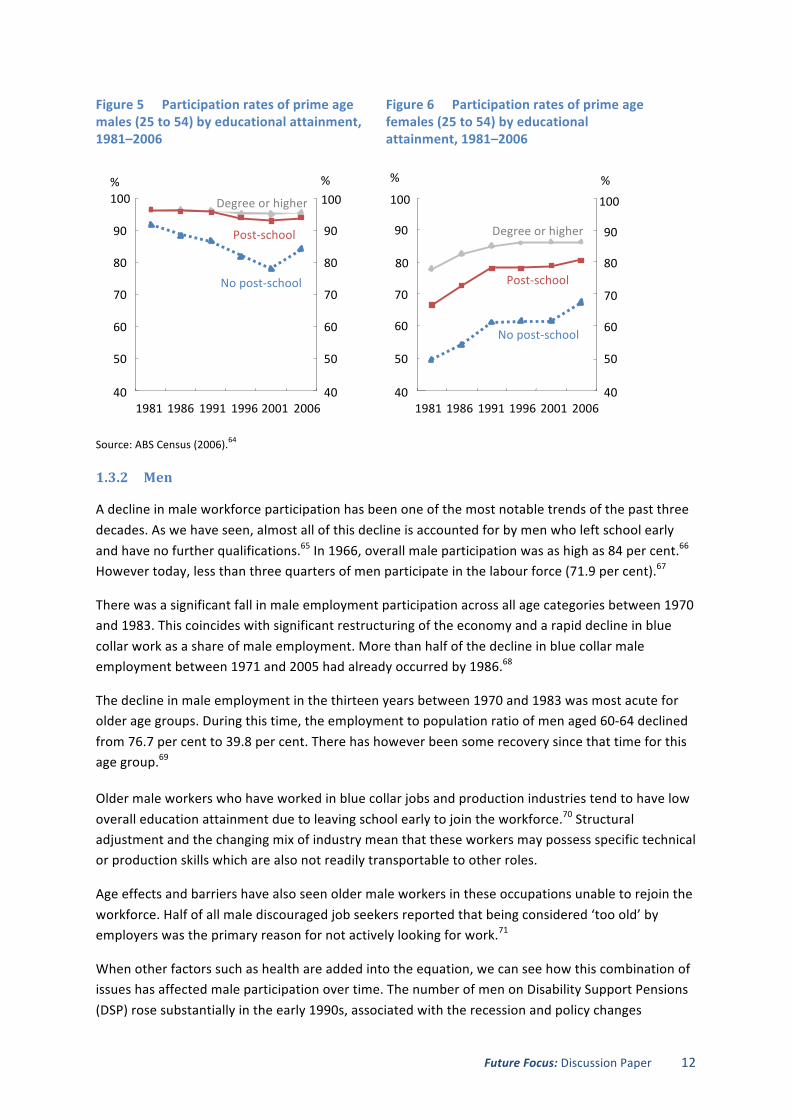
Figure 5 Participation rates of prime age males (25 to 54) by educational attainment, 1981–2006 12
Figure 6 Participation rates of prime age females (25 to 54) by educational attainment, 1981–2006 12
Figure 7 Employment by industry, Males and Females, aged 20-‐74, 2009–10 (%) 14
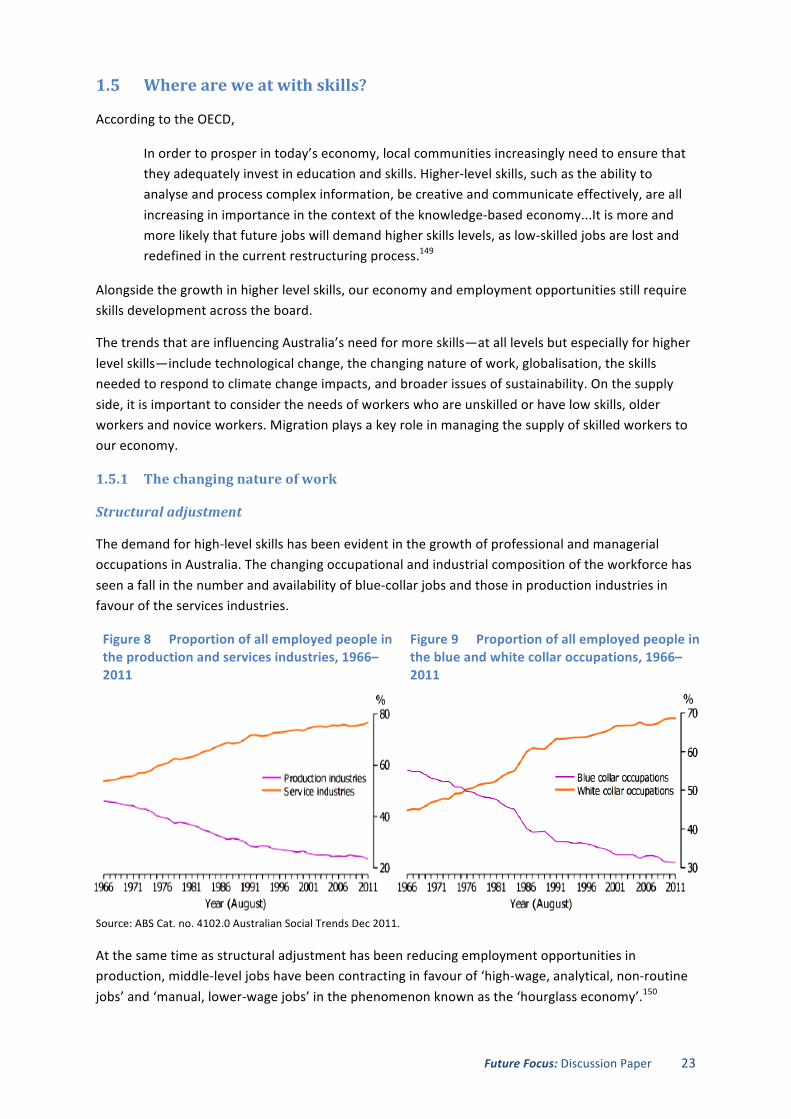
Figure 8 Proportion of all employed people in the production and services industries, 1966–2011 23
Figure 9 Proportion of all employed people in the blue and white collar occupations, 1966–2011 23
Figure 10 Graphical illustration of 2012 scenarios 31
Figure 11 Employment composition by industry, 2011 and 2025 by scenario 40
Figure 12 Employment composition by ANZSCO Major Group, 2011 and 2025 by scenario 43
List of Tables Table 1 Labour force participation rates in Australian States and Territories, average of 12 months to
January 2012 18
Table 2 Selected full-‐time unemployment rates by age group and labour force region, 12 month average to April 2012 22
Table 3 Summary assumptions by scenario 39
Table 4 Industry and occupation trends under the scenarios 41
Table 5 Top 10 occupations with largest increase in employment numbers by modal qualification 2011–2025 45
Table 6 Average annual change in projected demand for qualifications, employed, unemployed and not in the labour force 2011–2025 (%) 46
Table 7 Increase in employment of people with a Certificate III or above to meet projected demand, Long Boom 47
Table 8 Increase in employment of people with a Certificate III or above to meet projected demand, Ring of Fire 47
Table 9 Proportion of persons employed by occupation with a post-‐school qualification, current and to 2025 (%) 48
Table 10 Number of additional qualifications required per annum under each scenario, 2011 to 2025 (‘000) 50
Table 11 Total qualifications held by those employed ('000) 52
Table 12 Projected supply of qualifications by scenario and source, 2010 and 2025 54
Table 13 Projected qualification supply less demand (including those unemployed or not in the labour force) by scenario and qualification type 55

Future Focus: Discussion Paper ii
[blank page]
Future Focus: Discussion Paper iii
Foreword
Message from the Chair
Planning for Australia’s future workforce needs is not an easy task, but it is an important one. To lift our productivity and benefit from our strong economy we need to do our best to ensure that we have the qualifications and skills that we need, where and when we need them.
The future is always uncertain. As we develop the 2012 National Workforce Development Strategy, we need to take account of uncertainties and risks as well as opportunities, both now and in the years to come.
This paper considers the skills and workforce development needs that would arise from a number of different scenarios for Australia’s future, rather than making one single projection. In putting forward this paper for discussion, we seek the insights of our stakeholders into current and future issues in workforce development for Australia and how they may best be addressed. Your views will be taken into consideration in developing the final report and recommendations.
This paper cannot be completely comprehensive in its coverage, and we rely on you to alert us to key issues we may have overlooked, or different points of view that we have not taken into account. We value your input and look forward to fruitful discussions as we work together towards the development of the updated strategy, to be released later this year.
Philip Bullock Chair

Future Focus: Discussion Paper iv
[blank page]
Future Focus: Discussion Paper v
List of acronyms and abbreviations
ABS Australian Bureau of Statistics
ACCI Australian Chamber of Commerce and Industry
ACPET Australian Council for Private Education and Training
ACTU Australian Council of Trade Unions
Ai Group Australian Industry Group
AQF Australian Qualifications Framework
ASSA Academy of Social Sciences in Australia
ASQA Australian Skills Quality Authority
ATAR Australian Tertiary Admission Rank
AWPA Australian Workforce and Productivity Agency
BERD Business Expenditure on Research and Development
BRICS Brazil, Russia, India, China and South Africa
CBT Competency-‐Based Training
COAG Council of Australian Governments
DAEM Deloitte Access Economics Macro
DSP Disability Support Pension
ENS Employer Nomination Scheme
ERA Employment, Retention and Advancement
GDP Gross Domestic Product
GFC Global Financial Crisis
HE Higher Education
HILDA Household, Income and Labour Dynamics in Australia
ICT Information and Communications Technology
LLN Language, Literacy and Numeracy
LLNP Language Literacy and Numeracy Program
LSAY Longitudinal Surveys of Australian Youth
NASWD National Agreement for Skills and Workforce Development
NBN National Broadband Network
NCVER National Centre for Vocational Education Research
NILS National Institute of Labour Studies
NSSC National Skills Standards Council
NTC National Trade Cadetship
NVEAC National VET Equity Advisory Council
OECD Organisation for Economic Cooperation and Development
PISA Program for International Student Assessment
Future Focus: Discussion Paper vi
PPP Productivity Places Program
R&D Research and Development
RTO Registered Training Organisation
SCOTESE Standing Council on Tertiary Education, Skills and Employment
SES Socioeconomic status
SLA Statistical Local Area
SOL Skilled Occupations List
SpOL Specialised Occupations List
STEM Science, Technology, Engineering and Mathematics
TAFE Technical and Further Education
TDA TAFE Directors Australia
TDC TAFE Development Centre
TEQSA Tertiary Education Quality and Standards Agency
VET Vocational Education and Training
WDSDPC Workforce Development, Supply and Demand Principal Committee
WELL Workplace English Language and Literacy
Future Focus: Discussion Paper 1
Executive Summary
What challenges face our workforce now and over the years to 2025? How should we address them? This paper invites discussion and debate on issues that could potentially constrain Australia’s growth potential and our capacity to share our prosperity equitably and sustainably among our population.
Progress has been made in some key areas relating to workforce development since Australian Workforce Futures was published in 2010 but there is still a long way to go. Skills shortages in some areas and industries threaten wage inflation and risk growth-‐constraining monetary tightening. Productivity growth has been weak over the past decade. There are pockets of high unemployment across Australia’s regions, especially among young people. There is also scope for improving leadership and management skills to bolster our innovative capacity.
One way of improving productivity is maximising the skills and contributions of people in the workplace, which has been shown to optimise organisational performance. Making better use of the skills of the workforce delivers benefits to both employers and employees.1
To underpin the next National Workforce Development Strategy and help us plan for the future, the Agency has developed a set of four scenarios for Australia to 2025. These scenarios represent possible, plausible futures. They are not meant to be projections of the future nor are they based on past trends. Rather, they help us deal with the uncertainties and risks of the future as well as those developments of which we can be reasonably certain. Modelling of the supply and demand for skills and qualifications has been developed on the basis of these scenarios, and the findings of the modelling are discussed in this paper.
As we consider the present, we see that the demand for higher levels of skill is a reality. Our scenarios and modelling confirm that this can be expected to continue into the future in response to technology-‐induced change, structural adjustment, a progressive shift to services-‐based industries, and Australia’s changing demographics. Increasing globalisation is another factor affecting the demand for higher-‐level skills, with Asia a burgeoning market for Australian services.
It is important that a shift to higher skills does not leave the low-‐skilled and unskilled behind. Strategies are needed to help disadvantaged groups gain skills and employment, including better matching of human capital with those regions and industries in need. Entry-‐level positions are needed for those waiting to get a foothold on the employment ladder.
In this paper we examine the participation challenges facing men, women, young people, older workers, Aboriginal and Torres Strait Islander peoples and people with disability, as well as some issues that cut across several groups such as low skills.
Australia’s regions are not homogeneous. Localised, place-‐based solutions could provide a way forward for regions that are struggling with unemployment as well as those that cannot find enough workers to fill the existing opportunities, for example in mining and construction.
The role of the tertiary education sector is critical in meeting these challenges. How do we build generic skills and theoretical knowledge into our education system while also producing employees who have the practical skills that enable them to quickly function effectively in the workplace? How can they be ‘job-‐ready’ and employers be ‘graduate-‐ready’? What will be the impact of demand-‐led
Future Focus: Discussion Paper 2
higher education and vocational education and training (VET)? Does more need to be done to foster STEM (Science, Technology, Engineering and Mathematics) subjects for Australia’s future competitiveness in the global marketplace? How can we keep pace in the Asian century? Do delays in accreditation constrain provider innovation? Have we achieved everything we would wish for in the area of quality provision?
We look to our stakeholders for insights over an extended consultation and submission process as we work towards the new national strategy, to be released in late 2012.
� Have we got the issues right?
� Where are the gaps in our analysis?
� What kinds of policy interventions have been producing the best results?
� How can we anticipate and avoid adverse outcomes?
Future Focus: Discussion Paper 3
Introduction
There is no guarantee that Australia’s potential for future growth will be realised.
The huge opportunities in our Asian region are balanced by the risks arising from our dependence on those markets. Our high terms of trade and the associated high dollar are bringing good times to some industries but the struggle of structural adjustment to others. Many in our labour force would like to work more, yet employers say they are unable to fill vacancies in particular occupations and areas. Skills shortages are constraining growth in some areas.2
Since the publication of Australian Workforce Futures in 2010, we have seen a significant increase in enrolments in both higher education and VET. Between 2009 and 2010 higher education enrolments increased by 5.1 per cent and publicly-‐funded VET enrolments have increased by 5.4 per cent.3 This increase is greater than the three per cent average increase in enrolments per annum that we put forward in that document as essential to meet Australia’s future skill needs.
The challenge of low levels of language, literacy and numeracy skills in the working-‐age population has been acknowledged with greater investment by the Commonwealth and the development of the National Foundation Skills Strategy. Caps on university places have been removed, bringing higher qualifications within reach of more Australians. COAG has endorsed a new national skills strategy for all Australians, providing for a national student entitlement, expanded availability of income-‐contingent loans, measures to improve confidence in assessment outcomes and an emphasis on transparency and quality.
On the other side of the balance sheet, our labour productivity has grown only slowly over the past decade and our multi-‐factor productivity growth actually declined over this period. Although our terms of trade are close to historical highs and capital spending is elevated, action is needed to improve the skills and employment prospects of those on the margins of the labour force, including those most affected by structural adjustment.
Planning for workforce development contributes to Australia’s growth in two ways: by ensuring that we have the qualified people we need for the jobs of the future, and by encouraging and enabling better use of new and existing skills within the workplace. This two-‐pronged approach to workforce development was an important theme of Australian Workforce Futures.
Skills utilisation is concerned with maximising the contributions that people can make in the workplace and the extent to which people’s abilities are ‘deployed, harnessed and developed to optimise organisational performance’.4 Skills Australia identified that making better use of the skills of the workforce delivers benefits to both employers and employees, including increased productivity and job satisfaction.5
In planning our workforce for the future, we also need to do better in terms of sharing our potential prosperity and using opportunities to lift more people from disadvantage. Growing the employment prospects of those who would like to work, or to work more, will benefit everybody. Investment in strategies to increase participation will pay for itself by enhancing growth potential and helping to reduce the impact of our ageing demographic.
Future Focus: Discussion Paper 4
Australia needs to address these challenges with concentrated effort and creativity. We must design responses which take into account a range of possible futures and their implications for skills and workforce development. So to help develop an updated national workforce development strategy, we have developed a set of four scenarios for Australia’s future to 2025. Rather than being predictions or projections based on past trends, these scenarios are meant to help us explore a range of plausible futures. As we consider what is common to all of them, and where they differ, we can start to identify the stand-‐out issues that policies need to address—and the key areas of risk which we will have to plan for.
This discussion paper begins with the present by addressing some crucial questions:
� Why do we need to increase Australia’s productivity? How does our innovative capacity stand at present?
� What are the participation challenges that Australia faces, now and in the future?
� How are the regions faring?
� What is influencing the demand and supply of skills?
The paper then turns to the possible futures revealed by our scenarios and the modelling based on them. Increasingly, it seems, our future jobs will be highly-‐skilled.
� How many qualifications are we likely to need, and at what levels?
� What will be the demand across industries and occupations?
� What does this mean for our training system?
In the third part of the paper, we ask the question ‘How can the issues that currently face us, and the issues that our scenarios and modelling have revealed to us, best be addressed?’ We identify a number of key concerns that we believe are going to be critical for workforce development planning up to 2025, and explore possible policy solutions.
� How might work and workplaces change in the future?
� How good are our leadership and management skills, and why do they matter?
� Is the quality of our qualifications as good as we would like it to be?
� Will structural adjustment continue to impact our workforce to the extent that it does at present?
� How can key participation issues be addressed?
Future Focus: Discussion Paper 5
Chapter One: Where are we now?
1.1 Productivity
Measured as the increase in output per employee, Australia’s labour productivity growth has been weak over the last decade.6
This is a challenge for our future prosperity. If we do not improve productivity we cannot expect to see our living standards continue to rise. If we do succeed, however, benefits will follow for workers (in the form of higher incomes), businesses (via higher profits) and consumers (through lower prices for better goods and services).7 In fact,
Productivity is the prime determinant in the long run of a nation’s standard of living, for it is the root cause of per capita national income. High productivity not only supports high levels of income but allows citizens the option of choosing more leisure instead of longer working hours...The capacity to be highly productive also allows a nation’s firms to meet stringent social standards which improve the standard of living, such as in health and safety, equal opportunity and environmental impact.8
Workforce development contributes to productivity gains by better matching demand for skilled people with supply across industry sectors so that growth is not constrained.
Productivity is influenced by the ways enterprises and individuals develop and harness their skills and energies in the workplace. Management and leadership within firms is important in enabling and encouraging productivity gains.9 Effective leadership encourages employees to take ownership of their work so as to co-‐produce outcomes that benefit both the business and its workers. The extent to which workers have autonomy and control over their work, for example, plays an important role in productivity gains and innovation.
1.1.1 What is our productivity growth doing and why?
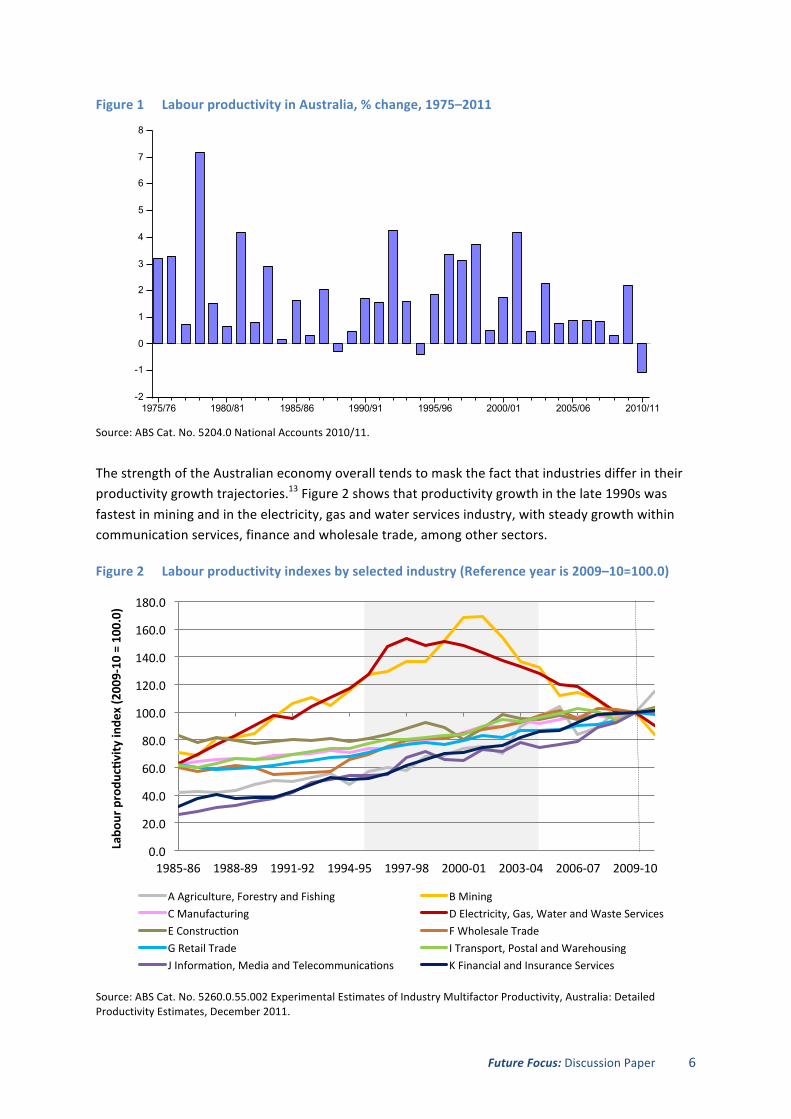
Labour productivity grew at an annual rate of 3.3 per cent per annum between 1993–94 and 1998–99, the fastest sustained growth on record.10 In the 2000s, however, productivity rates have been volatile, and generally lower.11 Economists attribute the surge in the mid-‐to-‐late 1990s to a range of factors—among them microeconomic reforms undertaken in the 1980s and early 1990s, and unprecedented innovation in ICT, leading to technological change and structural adjustment across a range of industries.12
Future Focus: Discussion Paper 6
Figure 1 Labour productivity in Australia, % change, 1975–2011
Source: ABS Cat. No. 5204.0 National Accounts 2010/11.
The strength of the Australian economy overall tends to mask the fact that industries differ in their productivity growth trajectories.13 Figure 2 shows that productivity growth in the late 1990s was fastest in mining and in the electricity, gas and water services industry, with steady growth within communication services, finance and wholesale trade, among other sectors.
Figure 2 Labour productivity indexes by selected industry (Reference year is 2009–10=100.0)
Source: ABS Cat. No. 5260.0.55.002 Experimental Estimates of Industry Multifactor Productivity, Australia: Detailed Productivity Estimates, December 2011.
1975/76 1980/81 1985/86 1990/91 1995/96 2000/01 2005/06 2010/11
8
7
6
5
4
3
2
1
0
-1
-2
Labour Productivity% change
0.0
20.0
40.0
60.0
80.0
100.0
120.0
140.0
160.0
180.0
1985-‐86 1988-‐89 1991-‐92 1994-‐95 1997-‐98 2000-‐01 2003-‐04 2006-‐07 2009-‐10
Labo
ur produ
cGvity inde
x (2009-‐10 = 100.0)
A Agriculture, Forestry and Fishing B Mining C Manufacturing D Electricity, Gas, Water and Waste Services E Construcqon F Wholesale Trade G Retail Trade I Transport, Postal and Warehousing J Informaqon, Media and Telecommunicaqons K Financial and Insurance Services
Future Focus: Discussion Paper 7
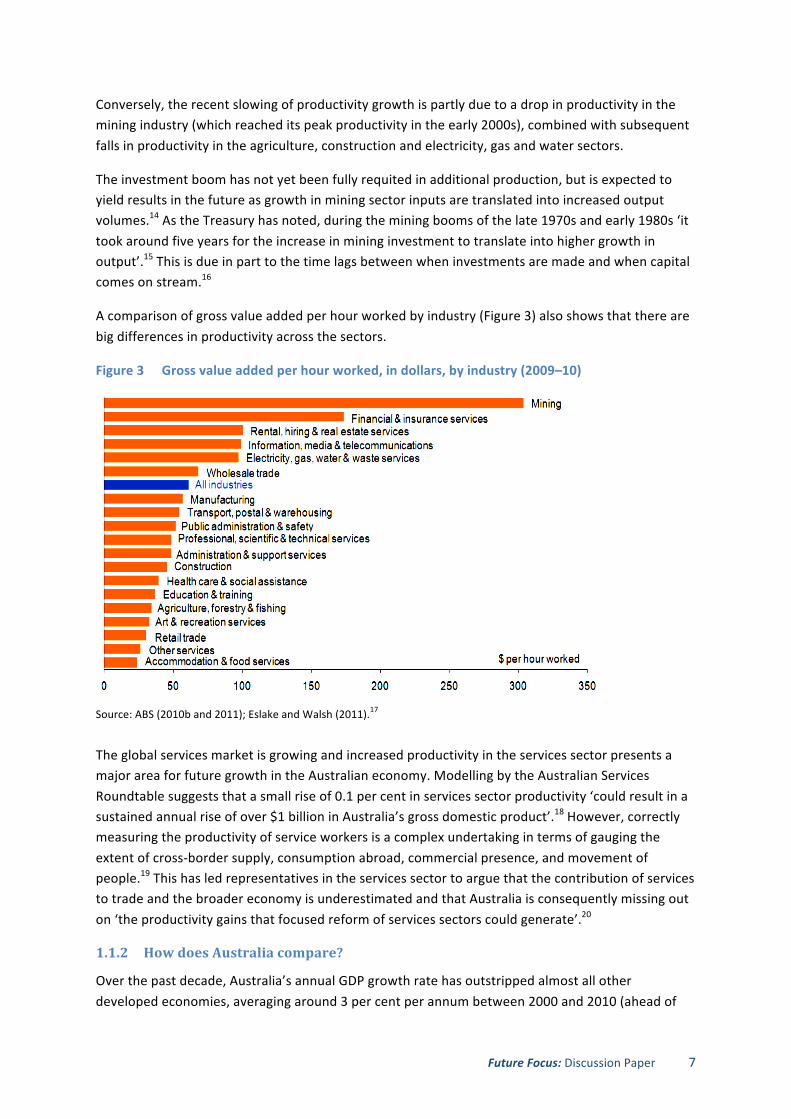
Conversely, the recent slowing of productivity growth is partly due to a drop in productivity in the mining industry (which reached its peak productivity in the early 2000s), combined with subsequent falls in productivity in the agriculture, construction and electricity, gas and water sectors.
The investment boom has not yet been fully requited in additional production, but is expected to yield results in the future as growth in mining sector inputs are translated into increased output volumes.14 As the Treasury has noted, during the mining booms of the late 1970s and early 1980s ‘it took around five years for the increase in mining investment to translate into higher growth in output’.15 This is due in part to the time lags between when investments are made and when capital comes on stream.16
A comparison of gross value added per hour worked by industry (Figure 3) also shows that there are big differences in productivity across the sectors.
Figure 3 Gross value added per hour worked, in dollars, by industry (2009–10)
Source: ABS (2010b and 2011); Eslake and Walsh (2011).17
The global services market is growing and increased productivity in the services sector presents a major area for future growth in the Australian economy. Modelling by the Australian Services Roundtable suggests that a small rise of 0.1 per cent in services sector productivity ‘could result in a sustained annual rise of over $1 billion in Australia’s gross domestic product’.18 However, correctly measuring the productivity of service workers is a complex undertaking in terms of gauging the extent of cross-‐border supply, consumption abroad, commercial presence, and movement of people.19 This has led representatives in the services sector to argue that the contribution of services to trade and the broader economy is underestimated and that Australia is consequently missing out on ‘the productivity gains that focused reform of services sectors could generate’.20
1.1.2 How does Australia compare?
Over the past decade, Australia’s annual GDP growth rate has outstripped almost all other developed economies, averaging around 3 per cent per annum between 2000 and 2010 (ahead of
Future Focus: Discussion Paper 8
New Zealand, Canada, the UK and US). While GDP growth dipped with the GFC to 1.4 per cent in 2008, it has recovered gradually, reaching 2.2 per cent growth in 2009 and 2.5 per cent in 2010.21
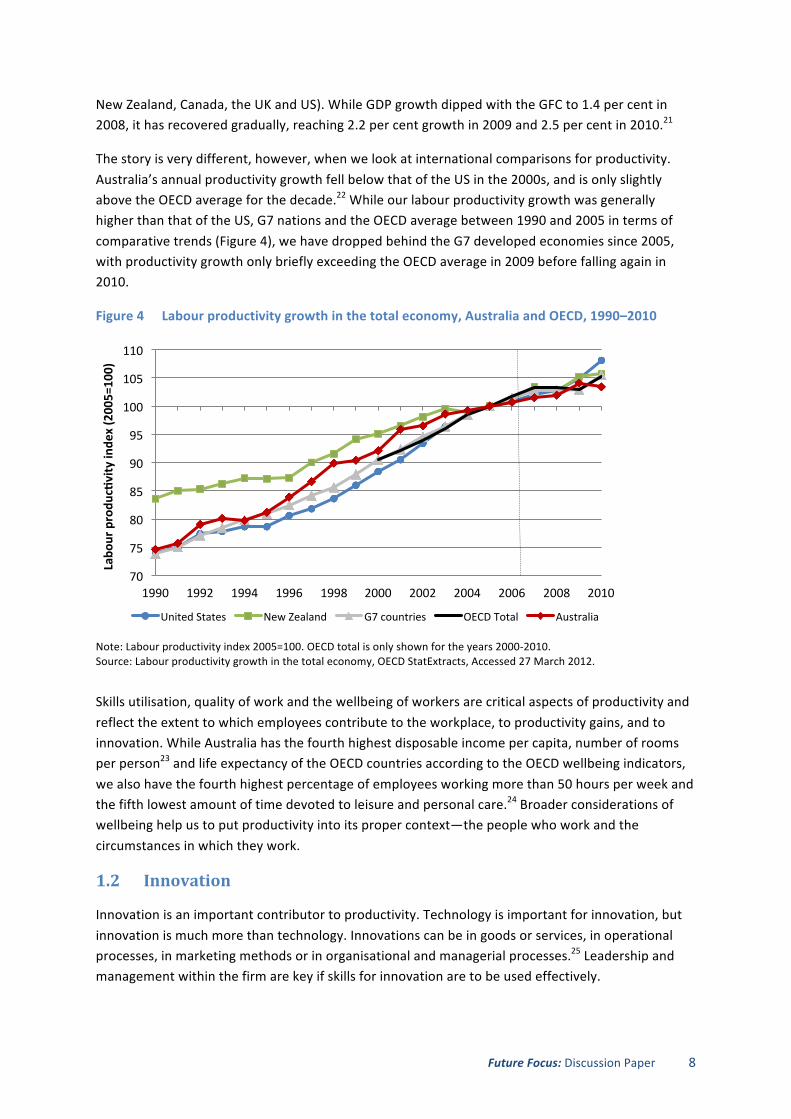
The story is very different, however, when we look at international comparisons for productivity. Australia’s annual productivity growth fell below that of the US in the 2000s, and is only slightly above the OECD average for the decade.22 While our labour productivity growth was generally higher than that of the US, G7 nations and the OECD average between 1990 and 2005 in terms of comparative trends (Figure 4), we have dropped behind the G7 developed economies since 2005, with productivity growth only briefly exceeding the OECD average in 2009 before falling again in 2010.
Figure 4 Labour productivity growth in the total economy, Australia and OECD, 1990–2010
Note: Labour productivity index 2005=100. OECD total is only shown for the years 2000-‐2010. Source: Labour productivity growth in the total economy, OECD StatExtracts, Accessed 27 March 2012.
Skills utilisation, quality of work and the wellbeing of workers are critical aspects of productivity and reflect the extent to which employees contribute to the workplace, to productivity gains, and to innovation. While Australia has the fourth highest disposable income per capita, number of rooms per person23 and life expectancy of the OECD countries according to the OECD wellbeing indicators, we also have the fourth highest percentage of employees working more than 50 hours per week and the fifth lowest amount of time devoted to leisure and personal care.24 Broader considerations of wellbeing help us to put productivity into its proper context—the people who work and the circumstances in which they work.
1.2 Innovation
Innovation is an important contributor to productivity. Technology is important for innovation, but innovation is much more than technology. Innovations can be in goods or services, in operational processes, in marketing methods or in organisational and managerial processes.25 Leadership and management within the firm are key if skills for innovation are to be used effectively.
70
75
80
85
90
95
100
105
110
1990 1992 1994 1996 1998 2000 2002 2004 2006 2008 2010
Labo
ur produ
cGvity inde
x (2005=100)
United States New Zealand G7 countries OECD Total Australia
Future Focus: Discussion Paper 9
Technical progress and innovation are crucial factors in productivity growth. In 2009-‐10, ‘over a third of innovation-‐active businesses (35 per cent) increased their productivity from the previous year, compared to just 16 per cent of non innovation-‐active businesses’.26
Platform or general purpose technologies such as ICT, nanotechnology and biotechnology have productivity-‐enhancing benefits across many sectors.27 Equally, increasing the number of Australian households connected to the Internet via the National Broadband Network is expected to improve productivity in the private sector and provide cost savings and faster, more efficient services for governments.28
Future skills needs will depend on technologies that ‘offer substantial productivity enhancing benefits and new business opportunities’ and on the ability of our enterprises to quickly adopt knowledge and technology from overseas.29 In general, Australia is an adopter rather than a developer of technologies. In fact,
The strength of the Australian innovation system is not in invention and the marketing of Australian inventions abroad (although there are major successes here) but precisely in what matters most: the ability of Australian firms in all sectors and the Australian public sector to rapidly implement productivity-‐enhancing inventions. Most of these inventions were developed outside of Australia.30
Innovations don’t have to be entirely new, but they have to be new to the organisation, either developed within the firm or introduced to it.31 Improvements in the workforce and in management practices are reflected in measures of multifactor productivity as well as economies of scale.32
Importantly, defining innovation more broadly means that the services industries are now included.33 Over the period to 2025 technology push is expected to be a less significant driver of innovation than incremental innovation responding to market demand.34 In fact, incremental innovation is more important for productivity growth than radical innovation.35
1.2.1 Australia on the world stage
Australia ranks 21st in the OECD global innovation index, behind the US (7th), Canada (8th), the UK (10th) and New Zealand (15th).36 Australia’s business expenditure on research and development (BERD) as a proportion of GDP for 2009 was 1.94 per cent, just below the OECD average.37
Four industries accounted for close to 80 per cent of BERD in Australia in 2009-‐10: manufacturing; mining; financial and insurance services; and professional, scientific and technical services.38 Large businesses (with 200 or more employees) devote a larger proportion of human resources to R&D than smaller businesses.39
As part of the Australian Government’s innovation agenda, the Enterprise Connect program has been established to support small to medium enterprises in innovation capability.40
1.2.2 Where are the gaps in our skills for innovation?
Human capital is critical to innovation.41 The skills required for innovation tend to be learnt on the job, but formal training is the foundation on which this learning is built.42 This means that both the higher education and the VET sector play a key role.
Future Focus: Discussion Paper 10
Innovation-‐active firms differ most from others in their increased use of skills in marketing, business management, finance and IT, not the skills traditionally associated with innovation. This reflects their involvement in incremental innovation rather than radical innovation.43 Innovation-‐active businesses are three times as likely to use marketing skills in undertaking core business activities as non innovation-‐active businesses.44
Once people have qualified, we need to ensure that their skills can be utilised at work and that innovation-‐specific skills can be developed and deployed. Here the culture of the workplace, leadership style and the way work is organised are critical determining factors.45 There is evidence that better management practices and organisational change contribute to multifactor productivity growth.46 Employee participation in decision making, participation in strategy and planning, and skills utilisation are tightly linked to firm productivity and profitability.47 Levels of autonomy and task discretion are critical success factors.48
While many Australian organisations perform well in operations management, few engage in advanced people management practices and this is a key factor differentiating our innovation performance from that of other countries.49 There is considerable scope for Australian firms to improve management practices and there is good reason for doing so, as research reveals that the quality of management practices can quantifiably improve productivity and outputs within an organisation.50
1.3 Issues in participation
The unemployment rate has come in at under 6 per cent since August 2003.51 However, despite Australia’s economic strength, participation challenges remain for many people and groups. Increasing workforce participation was a major theme of Australian Workforce Futures. A number of initiatives have been introduced to increase participation, including the Building Australia’s Future Workforce package announced in the 2011-‐12 Budget, continued support under the Australian Apprenticeships Access Program and the Work Bonus and Experience Plus initiatives aimed at older workers. Although the latest figures from the Australian Bureau of Statistics (ABS) and OECD show slight improvements in Australia’s overall participation rate (65.5 per cent in 2012 compared to 65.1 per cent in 2010) there is still a considerable way to go to meet the target of 69 per cent set in Australian Workforce Futures.
For all groups who struggle to participate in the workforce, there are individual consequences for those who engage in less paid work. Such people pay the penalty in the long run with less or no retirement savings, making them more likely to be financially dependent as they age.52
Gaining employment and access to economic opportunity is particularly difficult for those who experience multiple features of disadvantage such as low language, literacy and numeracy skills; low income; and disability or mental illness. They may live in remote communities or communities with concentrations of low socioeconomic status (SES) groups. They may be Indigenous Australians or new arrivals and refugees. These multiple aspects of disadvantage make it a complex task for policymakers, firstly to identify these groups and individuals and, secondly, to provide the support that is needed to address these barriers to participation.53
Future Focus: Discussion Paper 11
In comparison to the higher education sector, VET has almost double the proportion of students from low socioeconomic backgrounds, triple the proportion of students from non-‐English-‐speaking homes, and five times the proportion of Indigenous students.54 Following the Bradley Review of higher education the federal Government has introduced initiatives to support participation in higher education of students from low socioeconomic backgrounds. This includes a goal of low-‐SES students making up 20 per cent of all enrolled university students by 2020.55
1.3.1 Low-‐skilled and unskilled workers
Low skills are a strong determinant of outcomes across the lifecourse of the individual. For example, nearly nine out of ten people of working age with a post-‐school qualification (86.2 per cent) are in the labour force, compared to 68.9 per cent of those without one.56
While educational attainment has risen for both men and women in recent decades, there still remains a significant number of Australians (2.9 million) who completed Year 10 or below and do not hold a post-‐school qualification. Of these, 1.6 million are currently employed, 153,000 are currently unemployed and 1.1 million are not in the labour force.57 This means that a significant proportion of Australia’s total current labour force is low skilled and may be vulnerable to job loss during a recession or to progressive, age-‐related displacement from the workforce. Among those who are not in the labour force are people who are not working due to study, health issues or carer commitments, but also those who could potentially participate if given the opportunity.
Unemployment affects unskilled workers much more than skilled workers58 and workers with low skills are also vulnerable to churn between employment and unemployment.59 Fluctuations in the economic cycle also disproportionately affect low-‐ and unskilled workers. In times of higher unemployment skilled workers can replace or ‘bump down’ unskilled workers, but the reverse is not the case. Skilled workers are also more expensive to replace so organisations tend to keep them in preference to unskilled workers.60
Less-‐skilled workers are also less mobile than other workers and are less likely to move for work reasons, meaning that they rely more on local employment opportunities than do those with higher levels of skills.61 However, a concentration of people with low skills and capabilities in certain regions can also mean that many of the jobs available in these regions are filled from outside, ‘with employers reporting that they cannot find workers with the skills that they need’.62
Around one quarter of discouraged job seekers cited that they ‘Lacked the necessary schooling, training, skills or experience’ as the main reason for why they were not actively looking for work. This was roughly the same for both men and women, although the effect of low skills is more marked for men in terms of the relationship between educational attainment and workforce participation.63 This is shown in the drop in participation of males of prime working age who have no post-‐school qualifications. See Figure 5 below.
Future Focus: Discussion Paper 12
Figure 5 Participation rates of prime age males (25 to 54) by educational attainment, 1981–2006
Figure 6 Participation rates of prime age females (25 to 54) by educational attainment, 1981–2006
Source: ABS Census (2006).64
1.3.2 Men
A decline in male workforce participation has been one of the most notable trends of the past three decades. As we have seen, almost all of this decline is accounted for by men who left school early and have no further qualifications.65 In 1966, overall male participation was as high as 84 per cent.66 However today, less than three quarters of men participate in the labour force (71.9 per cent).67
There was a significant fall in male employment participation across all age categories between 1970 and 1983. This coincides with significant restructuring of the economy and a rapid decline in blue collar work as a share of male employment. More than half of the decline in blue collar male employment between 1971 and 2005 had already occurred by 1986.68
The decline in male employment in the thirteen years between 1970 and 1983 was most acute for older age groups. During this time, the employment to population ratio of men aged 60-‐64 declined from 76.7 per cent to 39.8 per cent. There has however been some recovery since that time for this age group.69
Older male workers who have worked in blue collar jobs and production industries tend to have low overall education attainment due to leaving school early to join the workforce.70 Structural adjustment and the changing mix of industry mean that these workers may possess specific technical or production skills which are also not readily transportable to other roles.
Age effects and barriers have also seen older male workers in these occupations unable to rejoin the workforce. Half of all male discouraged job seekers reported that being considered ‘too old’ by employers was the primary reason for not actively looking for work.71
When other factors such as health are added into the equation, we can see how this combination of issues has affected male participation over time. The number of men on Disability Support Pensions (DSP) rose substantially in the early 1990s, associated with the recession and policy changes
40
50
60
70
80
90
100
1981 1986 1991 2001 2006 40
50
60
70
80
90
100 Degree or higher
No post-‐school
Post-‐school
1996
% % % %
40
50
60
70
80
90
100
1981 1986 1991 1996 2001 2006 40
50
60
70
80
90
100
Degree or higher
No post-‐school
Post-‐school
Future Focus: Discussion Paper 13
surrounding eligibility requirements.72 By 2010, nearly half a million men (417,900) reported that they were not in the labour force due to their own long-‐term health condition or disability (377,700) or short-‐term illness or injury (40,200). Nearly three-‐quarters of these (73 per cent) were aged 45 years or older.73 DSP recipients currently number 818,850, of whom 446,600 are male (54.5 per cent) and 293,520 (35.8 per cent) are male and aged 45 and over.74 The Australian Government has sought to bring more people with a disability into employment. If work were available, consistent with the skills and physical limitations of these men, this could provide an opportunity to help these men return to the workforce.75
While there remain issues for older men in the workforce, the decline in the participation of men aged 35-‐54 has been particularly significant. In 1966, almost all 35 to 54 year old males (or 96.2 per cent) were in work. By 1983 male employment in this age group had dropped to 87.4 per cent. This figure is still around 87 per cent, with almost 400,000 men aged 35-‐54 not in employment.76 This suggests that strategies that seek to increase the participation of men in this age group are of particular importance.
1.3.3 Women
Although women are increasingly highly educated participants in the labour market, it is not yet clear that this increase in education is fully paying off. Despite the growth in female participation in the workforce since the 1970s, there remains a large gap between male participation (at 72.0 per cent) and female participation (at 58.7 per cent).77
As Figure 6 shows, the participation of women with no post-‐school qualifications has risen over time from under 50 per cent in 1981 to nearly 70 per cent in 2006. Women of prime working age (25 to 54) with post-‐school qualifications had a participation rate of more than 80 per cent in 2006, while participation rates of women with a bachelor degree or higher was above 85 per cent.78 This implies that a lack of qualifications is not such a barrier for women as it is for men, given the loss of traditionally ‘masculine’ low skilled jobs associated with production sectors, and the rise of jobs in female-‐dominated services such as retail, hospitality and the community care sector.
Accompanying the growth of women’s participation in the labour market has been the rise in part-‐time and casual jobs. Today, women account for 70 per cent of Australia’s part-‐time workforce and nearly half of all working women (45.7 per cent) work part time.79 While some women who work part-‐time would prefer to work more, there are also those who prefer part-‐time work due to caring commitments for young children or older family members.80
Underemployment is also a major issue for women and is higher than the rate for men in all age cohorts. 81 Further, withdrawing from the workplace or reducing hours contributes to ‘the persistence of significant gender pay differences, and women having great difficulty climbing the career ladder’.82 On average, women earn less than men and over their lifetime this amounts to just under $1 million.83 At present, female earnings in full-‐time standard jobs are around 83 per cent of male full-‐time earnings.84 Australia has a higher gender gap in earnings than the OECD average, and ranks 15 out of 21 OECD countries on a measure of the gender gap in median earnings of full-‐time employment.85 Female graduates also attract lower starting salaries than males graduating from the same degrees and working in the same industries.86 One estimate indicates that ‘eliminating the
Future Focus: Discussion Paper 14
whole gender wage gap from 17 per cent to zero, could be worth around $AU 93 billion’ to the economy.87
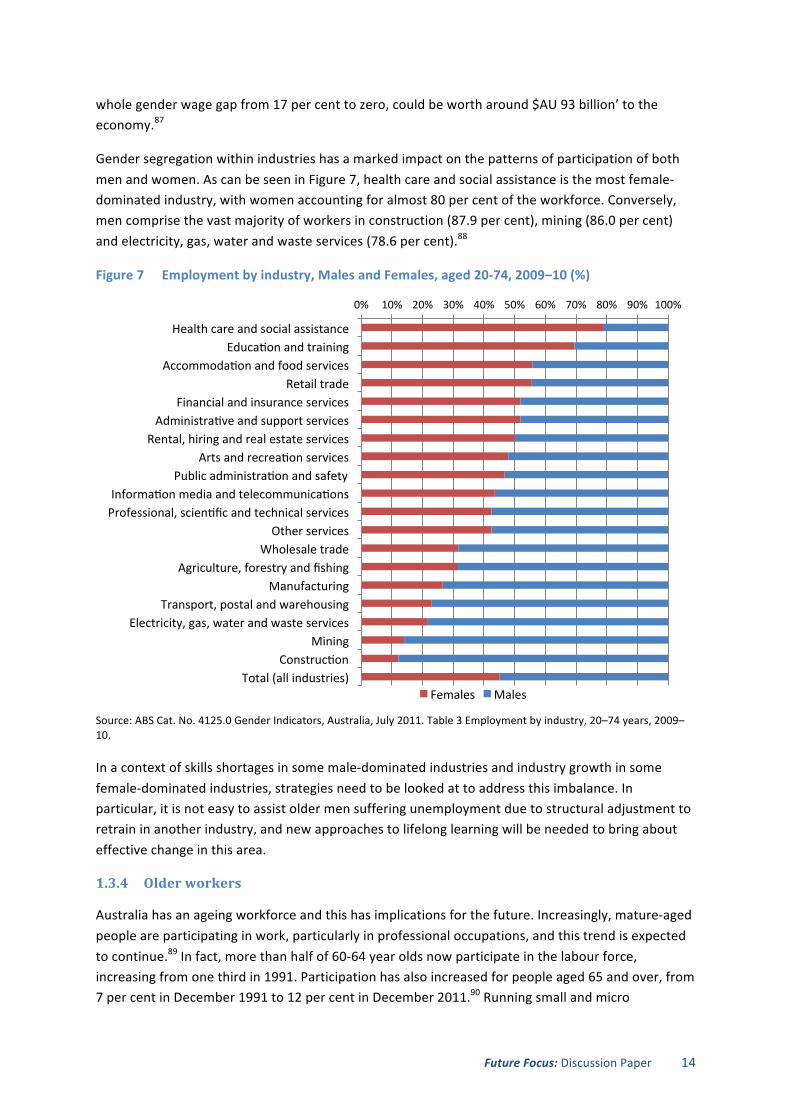
Gender segregation within industries has a marked impact on the patterns of participation of both men and women. As can be seen in Figure 7, health care and social assistance is the most female-‐dominated industry, with women accounting for almost 80 per cent of the workforce. Conversely, men comprise the vast majority of workers in construction (87.9 per cent), mining (86.0 per cent) and electricity, gas, water and waste services (78.6 per cent).88
Figure 7 Employment by industry, Males and Females, aged 20-‐74, 2009–10 (%)
Source: ABS Cat. No. 4125.0 Gender Indicators, Australia, July 2011. Table 3 Employment by industry, 20–74 years, 2009–10.
In a context of skills shortages in some male-‐dominated industries and industry growth in some female-‐dominated industries, strategies need to be looked at to address this imbalance. In particular, it is not easy to assist older men suffering unemployment due to structural adjustment to retrain in another industry, and new approaches to lifelong learning will be needed to bring about effective change in this area.
1.3.4 Older workers
Australia has an ageing workforce and this has implications for the future. Increasingly, mature-‐aged people are participating in work, particularly in professional occupations, and this trend is expected to continue.89 In fact, more than half of 60-‐64 year olds now participate in the labour force, increasing from one third in 1991. Participation has also increased for people aged 65 and over, from 7 per cent in December 1991 to 12 per cent in December 2011.90 Running small and micro
0% 10% 20% 30% 40% 50% 60% 70% 80% 90% 100%
Health care and social assistance Educaqon and training
Accommodaqon and food services Retail trade
Financial and insurance services Administraqve and support services
Rental, hiring and real estate services Arts and recreaqon services
Public administraqon and safety Informaqon media and telecommunicaqons Professional, scienqfic and technical services
Other services Wholesale trade
Agriculture, forestry and fishing Manufacturing
Transport, postal and warehousing Electricity, gas, water and waste services
Mining Construcqon
Total (all industries) Females Males
Future Focus: Discussion Paper 15
businesses is an important avenue for mature-‐aged people, especially older women re-‐entering the workforce.91
Many mature-‐aged workers have a depth of skills obtained through their experience in the workforce but lower levels of formal qualification than new entrants to the labour market. In particular, mature Australian women are less well educated than their younger counterparts, with less than half of 60-‐64 year old women having achieved a Certificate III or above.92 Literacy levels are also lower for mature Australians.93 However the situation is improving over time due to a cohort effect.94
1.3.5 Aboriginal and Torres Strait Islander people
There is considerable government activity taking place to improve employment and participation outcomes for Indigenous people, especially the COAG National Partnership Agreement for Indigenous Economic Participation (2009), which involves complementary investment and effort by the Commonwealth and state and territory governments to significantly improve opportunities for Indigenous people to engage in private and public sector jobs.95
Nevertheless, Indigenous Australians still face multiple disadvantages in a number of areas including education and employment. In 2006 the unemployment rate for Aboriginal and Torres Strait Islanders aged 15 years and older was 16 per cent compared to 5 per cent for non-‐Indigenous Australians.96 Five years later, outcomes are little changed if not worse, with an Indigenous unemployment rate of 18.2 per cent (compared to 5.1 per cent).97
Where people live has a strong bearing on employment outcomes. Indigenous Australians account for only 0.9 per cent of people living in major cities, but nearly a quarter (23.6 per cent) of those living in remote areas.98 Participation among Indigenous people in remote areas is low, at 54.4 per cent.99 This indicates that there is a high proportion of people out of the labour force altogether or not participating in work who are not necessarily classified as ‘unemployed’.
Despite these obstacles, the good news is that outcomes for Indigenous Australians improve dramatically with education. With increasing education, the employment gap between Indigenous and non-‐Indigenous people is relatively small, and narrows further at the higher qualification levels. For those Indigenous Australians with a Diploma or higher level qualification, for example, employment levels are reduced to 4.5 percentage points below the general population (with equivalent qualifications).100 Growth in Indigenous business enterprises, entrepreneurship and community-‐based organisations is another positive development in recent years, providing additional employment opportunities for Indigenous people, from urban areas to remote communities.
1.3.6 People with disability
For people disadvantaged in the labour market through disability, outcomes are below the national average, with employment levels much lower than for people without a disability. In 2009, 54.3 per cent of people with disabilities participated in the labour force as compared to 82.8 per cent of those without. Despite attempts by Government to engage people with disabilities in paid work, the labour force participation of people with disabilities has changed little since 1993, whereas the participation rate of people without disabilities has risen.101
Future Focus: Discussion Paper 16
Compounding the problem is the difficulties facing individuals with disability. Such individuals are significantly less likely than others to have completed Year 12 or have a bachelor degree, and significantly more likely to have no academic qualifications at all.102 Moreover, the number of people with a profound or severe disability is projected to more than double by 2030. This means that the number of carers will also increase, which will exert a reciprocal impact on the future labour market.103 Without encouragement of people with disability to gain education, the risks of perpetuating a cycle of exclusion are apparent.
Disability Employment Services (DES) provide specialist help for people with disability, injury or health condition who require support to find and maintain sustainable employment. The National Disability Recruitment Coordinator (NDRC) links the DES and large employers. Once employers make a commitment to work with the NDRC, the service helps the employer to implement practices to employ people with disability as well as training staff in working with people with disability. Industry driven strategies such as the Australian Network on Disability are also important in encouraging employers to take on people with disabilities.
New philanthropic forms of ‘social investment’ have also emerged to help disadvantaged people enter and remain in the labour market.104 This includes a role for social entrepreneurs105 and the development of various kinds of social enterprise. The Brotherhood of St Laurence, for example, runs a diverse range of social enterprises to employ and train job seekers who require extra support to stay in employment and these have grown into viable businesses.106
1.4 Regional issues Regional disparities in employment and education are a key challenge for policymakers. Participation in work and study varies widely across Australia according to geographical location, but the issues facing different regions are not homogenous.107 Declining industries, structural adjustment and a shift from production to services have fundamentally altered the type and amount of work available in some regions. Australia is increasingly described as a ‘patchwork economy’: one which is characterised by strong growth in some areas while others lag behind.108 Pockets of high unemployment are often correlated with the ageing of a low-‐skilled labour force, particularly where there are no longer industries located in these regions able to absorb this capacity.109
In the past, rates of labour force participation were similar across Australia, but that is no longer true. Differences in participation by location correspond with differences in socioeconomic status between different locations, thus reinforcing the loss of social capital and increasing the disadvantage experienced by the low socioeconomic status regions.110 The regions where participation has fallen tend to be those where there has been a loss of blue collar jobs, and the service jobs which are now being created are not in those regions, often making them inaccessible to people with low skills from the disadvantaged regions.
The employment rate for postcodes in the top income decile is around 20 percentage points higher than for post-‐codes in the bottom income decile. In fact, ‘in Top 10% postcodes, only 30% of all those aged 15 years and over were out of the labour force and only 3% were unemployed’, while ‘in Bottom 10% postcodes, a striking 48% were out of the labour force and 6% were unemployed’.111 This impacts on relative opportunities and can give rise to effective waste as people in disadvantaged areas have much less chance of being employed. Neighbourhoods with high
Future Focus: Discussion Paper 17
unemployment also risk becoming self-‐perpetuating in the same way as families where no-‐one works risk becoming welfare dependent. Educational achievement is also unevenly distributed by postcode it all comes together with lack of skills now becoming a prime cause of continuing disadvantage. The job market now requires education and training, and this is the most promising path out of disadvantage for those living in areas of high unemployment.
In contrast, other parts of Australia are experiencing strong growth and a resulting lack of skills and labour, particularly where there is competition from the resources sector or where there are difficulties in attracting people to work in particular locations.112 For some regions, barriers to participation are a matter of supply rather than demand, coalescing around the related issues of low skills, disadvantage and youth disengagement.113 Indeed there is evidence to show that some people who do not expect to find work, or have even dropped out of the workforce altogether, relocate to depressed regions due to the lower cost of living in these areas.114
Clearly, then, there can be no one-‐size-‐fits-‐all approach to regional challenges. The disparity in the distribution of resources, population, infrastructure, services and development are important considerations in addressing workforce participation and productivity.
1.4.1 Regional development
Regions which have not benefited from the mining boom, and which may be struggling in the wake of structural adjustment and a lack of new economic opportunities, are also characterised by low population growth. Australia is one of the most urbanised nations in the world, and this trend is only expected to increase as people move from country areas to the capital cities.115 Migrants overwhelmingly settle in our largest cities, prompted by considerations of job availability, community facilitates and other amenities.116 These population flows help concentrate economic growth, with ‘larger markets, more high quality human capital, and more infrastructure that facilitates economic interactions’.117 However, it also means that there are fewer flow-‐on job opportunities in regions with dwindling populations, particularly within services sectors such as education, health and retail.
Closures in manufacturing hubs and heavy industry have led to slow economic growth in regional centres from Newcastle to Whyalla, while the challenges facing agricultural regions are apparent in the loss of agricultural jobs, an ageing farm workforce and young people increasingly not choosing agricultural careers.
The issues facing workers and employers in resource-‐rich regions, on the other hand, are very different from those in other parts of the country. Mining centres look to attract skilled workers to meet demand, but housing large numbers of people in remote districts with very small permanent populations presents a challenge. This has led to the adoption of ‘fly-‐in, fly-‐out’ arrangements as an alternative to maintaining a residential workforce: a phenomenon which seeks to overcome the shortage of available land and housing, and the limited availability of services in remote regions of Australia.
Employers report that it costs significantly more to employ a person who lives in the Pilbara than to employ a worker on a fly-‐in, fly-‐out basis.118 Exorbitant property and rental prices in mining regions do not help. However, fly-‐in, fly-‐out arrangements can also lead to ‘unstable and poorly serviced
Future Focus: Discussion Paper 18
communities in remote locations’.119 They can also exert a toll on individual and family wellbeing, with one in three fly-‐in, fly-‐out workers in Western Australia quitting within 12 months.120 Clearly, the high salaries paid to resource workers are not the only consideration in retaining a skilled workforce within these regions. Yet without access to fly-‐in, fly-‐out arrangements, mining companies report that ‘valuable resource projects would not find a skilled local workforce and may not even proceed’.121
1.4.2 Regional participation
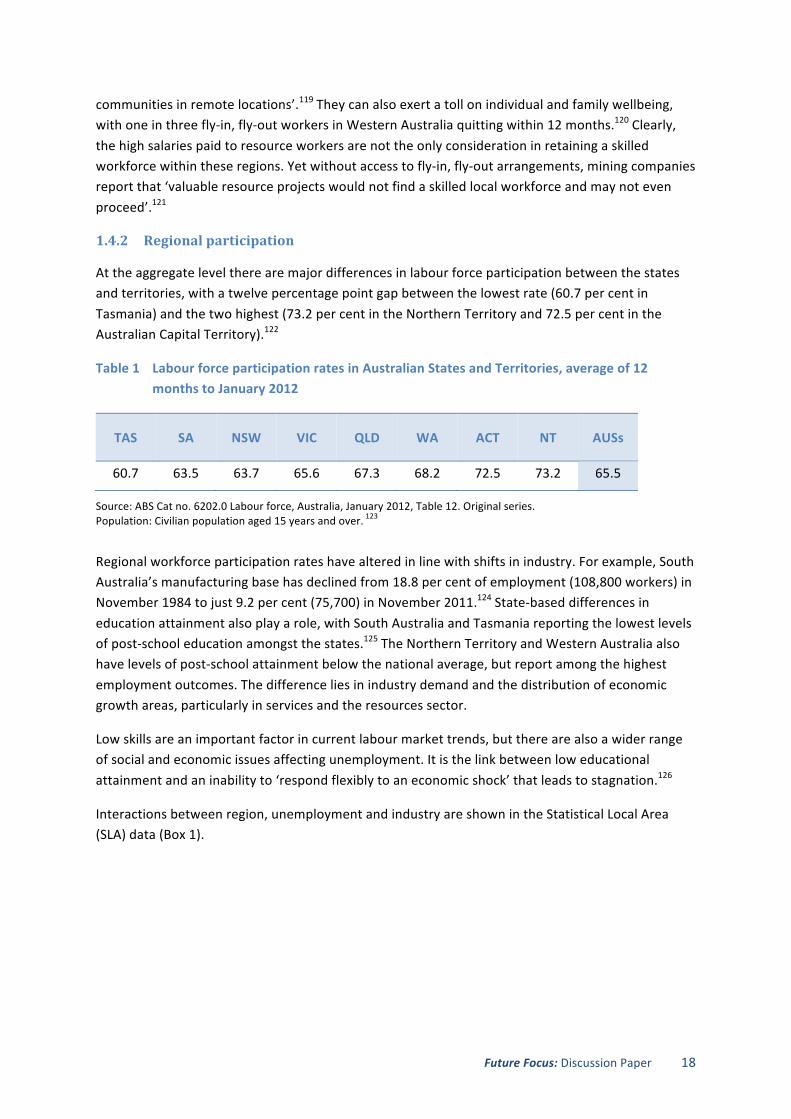
At the aggregate level there are major differences in labour force participation between the states and territories, with a twelve percentage point gap between the lowest rate (60.7 per cent in Tasmania) and the two highest (73.2 per cent in the Northern Territory and 72.5 per cent in the Australian Capital Territory).122
Table 1 Labour force participation rates in Australian States and Territories, average of 12 months to January 2012
TAS SA NSW VIC QLD WA ACT NT AUSs
60.7 63.5 63.7 65.6 67.3 68.2 72.5 73.2 65.5
Source: ABS Cat no. 6202.0 Labour force, Australia, January 2012, Table 12. Original series. Population: Civilian population aged 15 years and over. 123
Regional workforce participation rates have altered in line with shifts in industry. For example, South Australia’s manufacturing base has declined from 18.8 per cent of employment (108,800 workers) in November 1984 to just 9.2 per cent (75,700) in November 2011.124 State-‐based differences in education attainment also play a role, with South Australia and Tasmania reporting the lowest levels of post-‐school education amongst the states.125 The Northern Territory and Western Australia also have levels of post-‐school attainment below the national average, but report among the highest employment outcomes. The difference lies in industry demand and the distribution of economic growth areas, particularly in services and the resources sector.
Low skills are an important factor in current labour market trends, but there are also a wider range of social and economic issues affecting unemployment. It is the link between low educational attainment and an inability to ‘respond flexibly to an economic shock’ that leads to stagnation.126
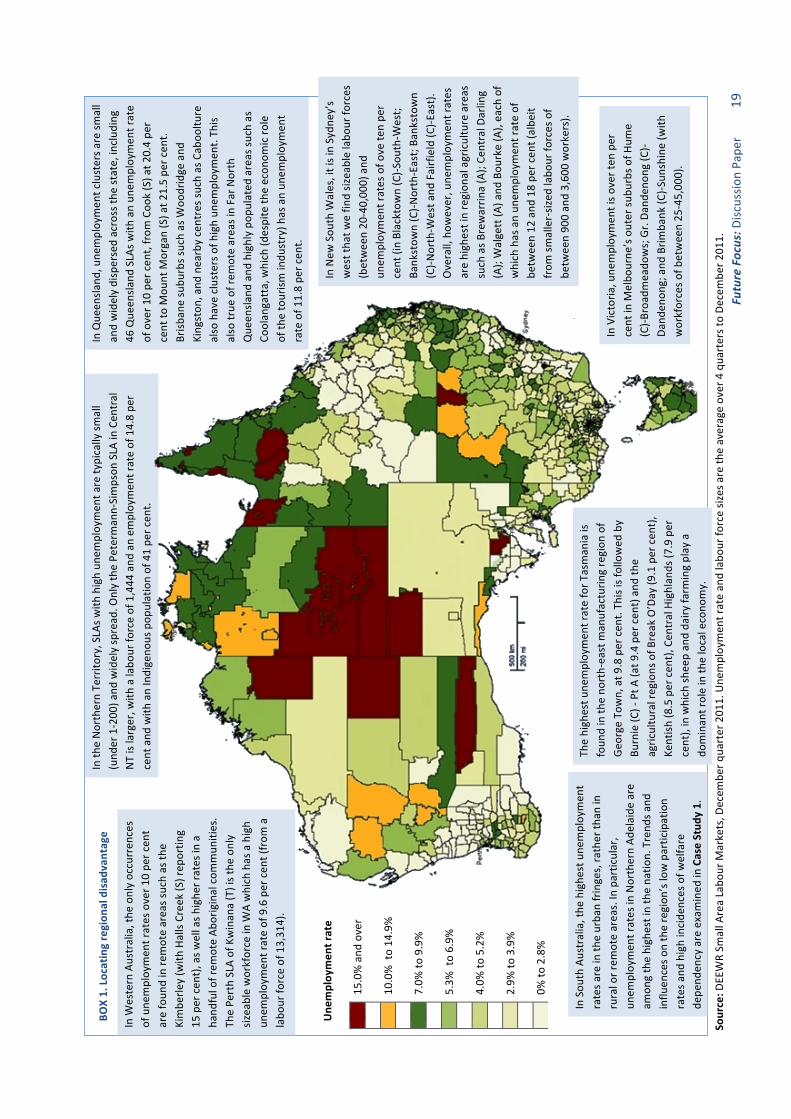
Interactions between region, unemployment and industry are shown in the Statistical Local Area (SLA) data (Box 1).
Future Focus: D
iscussio
n Pape
r 19
In Que
ensla
nd, u
nemploymen
t clusters a
re sm
all
and widely dispersed across th
e state, includ
ing
46 Que
ensla
nd SLAs w
ith an un
employmen
t rate
of over 1
0 pe
r cen
t, from
Coo
k (S) a
t 20.4 pe
r cent to
Mou
nt M
organ (S) a
t 21.5 pe
r cen
t. Brisb
ane subu
rbs s
uch as W
oodridge and
Kingston
, and
nearby centres s
uch as Cab
ooltu
re
also have clusters of h
igh un
employmen
t. Th
is also true
of rem
ote areas in Far N
orth
Que
ensla
nd and
highly po
pulated areas s
uch as
Coolan
gatta, which (d
espite th
e econ
omic ro
le
of th
e tourism
indu
stry) h
as an un
employmen
t rate of 1
1.8 pe
r cen
t.
In th
e Northern Territo
ry, SLAs w
ith high un
employmen
t are ty
pically sm
all
(und
er 1-‐200
) and
widely spread
. Only the Pe
term
ann-‐Simpson
SLA in Cen
tral
NT is larger, w
ith a labo
ur fo
rce of 1,444
and
an em
ploymen
t rate of 14.8 pe
r cent and
with
an Indigeno
us pop
ulation of 41 pe
r cen
t.
In New
Sou
th W
ales, it is in Sydn
ey’s
west tha
t we fin
d siz
eable labo
ur fo
rces
(between 20
-‐40,00
0) and
un
employmen
t rates of o
ve te
n pe
r cent (in Blacktow
n (C)-‐S
outh-‐W
est;
Bankstow
n (C)-‐N
orth-‐East; Ba
nkstow
n (C)-‐N
orth-‐W
est a
nd Fairfield (C
)-‐East).
Overall, how
ever, u
nemploymen
t rates
are highest in region
al agriculture areas
such as B
rewarrin
a (A); Ce
ntral D
arling
(A); Walgett (A
) and
Bou
rke (A), each of
which has an un
employmen
t rate of
betw
een 12
and
18 pe
r cen
t (albe
it from
smaller-‐siz
ed labo
ur fo
rces of
betw
een 90
0 an
d 3,60
0 workers).
The highest u
nemploymen
t rate for T
asman
ia is
foun
d in th
e no
rth-‐east m
anufacturin
g region
of
Geo
rge To
wn, at 9
.8 per cen
t. Th
is is followed
by
Burnie (C
) -‐ Pt A
(at 9
.4 per cen
t) and
the
agric
ultural regions of B
reak O’Day (9
.1 per cen
t),
Kentish
(8.5 per cen
t), C
entral Highlan
ds (7
.9 per
cent), in which sh
eep an
d da
iry fa
rming play a
dominan
t role in th
e local econo
my.
BOX 1. Locating region
al disad
vantage
Une
mploy
men
t rate
15
.0% and
over
10
.0% to 14
.9%
7.0%
to 9.9%
5.3%
to 6.9%
4.0%
to 5.2%
2.9%
to 3.9%
0%
to 2.8%
In W
estern Australia, the
only occurren
ces
of une
mploymen
t rates over 1
0 pe
r cen
t are foun
d in re
mote areas s
uch as th
e Kimbe
rley (w
ith Halls Creek (S) rep
ortin
g 15
per cen
t), as w
ell as h
ighe
r rates in a
hand
ful of rem
ote Ab
original com
mun
ities.
The Pe
rth SLA of Kwinan
a (T) is the
only
sizeable workforce in W
A which has a high
unem
ploymen
t rate of 9.6 per cen
t (from
a
labo
ur fo
rce of 13,31
4).
In Sou
th Australia, the
highe
st une
mploymen
t rates a
re in th
e urba
n fringes, ra
ther th
an in
rural or rem
ote areas. In
particular,
unem
ploymen
t rates in Northern Ad
elaide
are
amon
g the highest in the na
tion. Trend
s and
influ
ences o
n the region
’s low participation
rates a
nd high incide
nces of w
elfare
depe
nden
cy are examined
in Case Stud
y 1.
In Victoria
, une
mploymen
t is o
ver ten
per
cent in M
elbo
urne
’s outer su
burbs o
f Hum
e (C)-‐B
road
meado
ws; Gr. Da
nden
ong (C)-‐
Dand
enon
g; and
Brim
bank (C
)-‐Sun
shine (w
ith
workforces o
f between 25
-‐45,00
0).
Source: D
EEWR Sm
all A
rea Labo
ur M
arkets, D
ecem
ber q
uarter 201
1. Une
mploymen
t rate an
d labo
ur fo
rce siz
es are th
e average over 4 qua
rters to De
cembe
r 201
1.
Future Focus: Discussion Paper 20
Employer surveys confirm that recruitment is most difficult in Western Australia, the Northern Territory and the ACT, where employers filled less than 60 per cent of advertised vacancies. Employers generally find it harder to fill vacancies in regional Australia than in the state capitals, filling only 58 per cent of vacancies and attracting 1.6 suitable applicants per vacancy.127 Alice Springs has one of the lowest unemployment rates in the country, at around 2 per cent for some districts (despite low participation in other areas), and similar patterns of growth are apparent in other regional and remote districts where demand for services is high.128
In the 2006 Census, four of the five highest participation areas were located in rural Western Australia, reflecting growth in mining and the growth of fly-‐in-‐fly-‐out labour forces in these regions.129 The continued growth of the resources sector has seen a concomitant rise in skills shortages within industries such as construction, manufacturing and agriculture, where skilled workers in related trades (for example air conditioning and refrigeration mechanics) are being absorbed by the mining boom.130 Entrenched shortages of structural steel workers are also apparent in Western Australia, where upwards salary pressures are increasing labour costs and employers report that they ‘regularly lose workers to the resource sector due to perceptions around wages’.131
Despite the growth of employment opportunities in some areas, regional mobility remains fairly limited, particularly among less skilled workers.132 Indeed, there are signs that worker mobility is actually decreasing, with a drop in the rate of interstate migration in recent years.
In 2009-‐10, 331,400 people moved to a different state or territory, a drop of 8 per cent from the previous year, and a 17 per cent drop from the peak interstate migration estimate in 2002–03.133 The level of interstate migration for 2009-‐10 is almost the same as that experienced in 1993-‐94, which was a 20 year low.134
Some companies have found that there are barriers to relocation for individuals to take up job opportunities interstate. These include home ownership, having children in local schools, being well established in local communities and other social or family factors.135 One advantage of fly-‐in, fly-‐out strategies is that they enable the movement of workers into remote areas without requiring people to relocate.
Employer demand tells only part of the story. In other parts of the country it is supply factors – such as clusters of low skills and other demographic factors – that are at least as influential in determining employment outcomes within regions. This is reflected in the SLA data, which shows that it is generally the outer urban and inner regional areas (e.g. in South Australia, New South Wales and Victoria) that report the highest unemployment figures, rather than remote and outer regional areas. Additional maps of urban SLAs are included in Appendix 2.
Future Focus: Discussion Paper 21
CASE STUDY 1: Regional unemployment: A snapshot of the Northern Adelaide region
The persistently high unemployment rates in some of Adelaide’s Northern outer suburbs have led policymakers to conclude that intergenerational joblessness, welfare dependency and social disadvantage have become major issues for the region.136
Historical data shows that unemployment in the Playford (C)-‐Elizabeth area has not fallen below 15 per cent since records began in 1990 and currently stands at 21.6 per cent.137 Moreover, of the estimated adult working population of 310,000, nearly a quarter (24.2 per cent) are on Centrelink benefits, compared to 16.9 per cent for Australia.138 Unemployment rates in surrounding districts are also among some of the highest in the nation, at 15.6 per cent in Playford (C)-‐West Central, and 12.7 per cent in Salisbury (C)-‐Inner North and are more than twice the national average in Port Adelaide Enfield (C)-‐Inner and Salisbury (C)-‐Central.
So what accounts for these poor outcomes for a comparatively young, urban, English-‐speaking population? And why—despite myriad policy interventions—does disengagement from the labour market appear to be increasing in these areas, against the national trend? In the 12 months to March 2011, for example, the number of recipients of unemployment benefits in Northern Adelaide increased by 5.0 per cent, compared to an increase of 3.5 per cent for SA and a decrease of 3.4 per cent for Australia as a whole.139
At least part of the answer for poor employment outcomes lies in the combination of low literacy and numeracy, low or no qualifications, low expectations, discouragement from seeking work, pockets of extreme disadvantage and other interpersonal/social barriers to participation. For example, the proportion of Year 9 public school students who did not meet minimum standards for reading in 2010 was 44 per cent for the Port Adelaide Enfield (C)-‐Inner SLA and 34 per cent for Playford (C)-‐Elizabeth, compared to 9 per cent for Australia as a whole.140 Research also shows that the availability of jobs in the region is not necessarily the chief determining factor for employment. Indeed, many of the jobs that are available ‘don’t go to locals’.141 Most of those employed in the Playford area are not living within the region (60 per cent), while across Northern Adelaide as a whole, just under a quarter of persons employed in the region live elsewhere.142
Employer surveys indicate that it is applicant suitability, rather than job availability, which is the primary determinant of success in gaining work. In a survey of 249 businesses in Northern and Western Adelaide, less than 20 per cent of job applicants were reported as suitable by employers, with respondents citing that applicants lacked basic employability skills and the personal qualities sought after by employers (including a positive attitude, communication skills, teamwork skills, motivation and reliability).143
Youth disadvantage by region
Outcomes for youth in both education and work are highly influenced by where young people live. School retention rates, for example, vary widely between the states and territories, relating to differences in the age for compulsory schooling, among other factors such as parental characteristics and socioeconomic background.
While more young people are staying on at school and gaining post-‐school qualifications—therefore helping to insulate them from disengagement—this is not true for all. In the year to January 2012, more than a quarter (26.8 per cent) of teenagers of working age (15-‐19 years) were neither working
Future Focus: Discussion Paper 22
nor engaged in full-‐time learning.144 School leavers who are not engaged in either full-‐time study or work are at risk of economic marginalisation and social exclusion.145
South Australia, Tasmania and the Northern Territory face greater challenges than the other states in this respect, with nearly half of 19 year olds in the Northern Territory not in full-‐time work or study, compared to 23 per cent for Australia as a whole.146 Given the clear link that exists between completion of school and future outcomes (including employment and income level), policymakers at State and Commonwealth level clearly need to continue their emphasis on lifting retention rates and the transition from school to work.
There are worrying clusters of high youth unemployment in particular localities. These include Sydney’s west, Melbourne’s north and north-‐west, Adelaide’s north and regions such as Queensland’s Sunshine Coast (which has a teenage unemployment rate (15-‐19 years) of 34.4 per cent). Youth unemployment is also high in other tourism areas such as New South Wales’ central and north coast.147
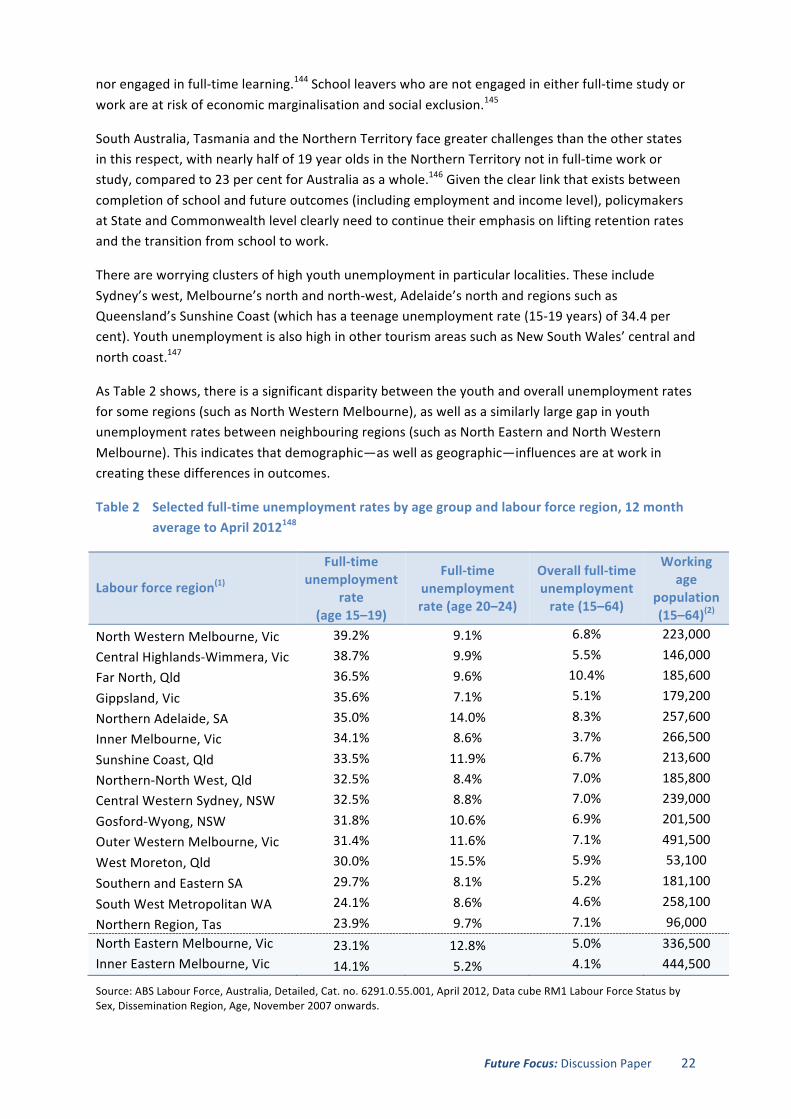
As Table 2 shows, there is a significant disparity between the youth and overall unemployment rates for some regions (such as North Western Melbourne), as well as a similarly large gap in youth unemployment rates between neighbouring regions (such as North Eastern and North Western Melbourne). This indicates that demographic—as well as geographic—influences are at work in creating these differences in outcomes.
Table 2 Selected full-‐time unemployment rates by age group and labour force region, 12 month average to April 2012148
Labour force region(1)
Full-‐time unemployment
rate (age 15–19)
Full-‐time unemployment rate (age 20–24)
Overall full-‐time unemployment rate (15–64)
Working age
population (15–64)(2)
North Western Melbourne, Vic 39.2% 9.1% 6.8% 223,000
Central Highlands-‐Wimmera, Vic 38.7% 9.9% 5.5% 146,000 Far North, Qld 36.5% 9.6% 10.4% 185,600
Gippsland, Vic 35.6% 7.1% 5.1% 179,200
Northern Adelaide, SA 35.0% 14.0% 8.3% 257,600 Inner Melbourne, Vic 34.1% 8.6% 3.7% 266,500
Sunshine Coast, Qld 33.5% 11.9% 6.7% 213,600
Northern-‐North West, Qld 32.5% 8.4% 7.0% 185,800 Central Western Sydney, NSW 32.5% 8.8% 7.0% 239,000
Gosford-‐Wyong, NSW 31.8% 10.6% 6.9% 201,500
Outer Western Melbourne, Vic 31.4% 11.6% 7.1% 491,500
West Moreton, Qld 30.0% 15.5% 5.9% 53,100
Southern and Eastern SA 29.7% 8.1% 5.2% 181,100
South West Metropolitan WA 24.1% 8.6% 4.6% 258,100
Northern Region, Tas 23.9% 9.7% 7.1% 96,000 North Eastern Melbourne, Vic 23.1% 12.8% 5.0% 336,500 Inner Eastern Melbourne, Vic 14.1% 5.2% 4.1% 444,500
Source: ABS Labour Force, Australia, Detailed, Cat. no. 6291.0.55.001, April 2012, Data cube RM1 Labour Force Status by Sex, Dissemination Region, Age, November 2007 onwards.
Future Focus: Discussion Paper 23
1.5 Where are we at with skills?
According to the OECD,
In order to prosper in today’s economy, local communities increasingly need to ensure that they adequately invest in education and skills. Higher-‐level skills, such as the ability to analyse and process complex information, be creative and communicate effectively, are all increasing in importance in the context of the knowledge-‐based economy...It is more and more likely that future jobs will demand higher skills levels, as low-‐skilled jobs are lost and redefined in the current restructuring process.149
Alongside the growth in higher level skills, our economy and employment opportunities still require skills development across the board.
The trends that are influencing Australia’s need for more skills—at all levels but especially for higher level skills—include technological change, the changing nature of work, globalisation, the skills needed to respond to climate change impacts, and broader issues of sustainability. On the supply side, it is important to consider the needs of workers who are unskilled or have low skills, older workers and novice workers. Migration plays a key role in managing the supply of skilled workers to our economy.
1.5.1 The changing nature of work
Structural adjustment
The demand for high-‐level skills has been evident in the growth of professional and managerial occupations in Australia. The changing occupational and industrial composition of the workforce has seen a fall in the number and availability of blue-‐collar jobs and those in production industries in favour of the services industries.
Figure 8 Proportion of all employed people in the production and services industries, 1966–2011
Figure 9 Proportion of all employed people in the blue and white collar occupations, 1966–2011
Source: ABS Cat. no. 4102.0 Australian Social Trends Dec 2011.
At the same time as structural adjustment has been reducing employment opportunities in production, middle-‐level jobs have been contracting in favour of ‘high-‐wage, analytical, non-‐routine jobs’ and ‘manual, lower-‐wage jobs’ in the phenomenon known as the ‘hourglass economy’.150
Future Focus: Discussion Paper 24
The changes brought about by structural adjustment are painful for the firms, regions, communities and individuals involved. As Glenn Stevens of the Reserve Bank of Australia notes:
Structural adaptation is hard work. Few volunteer for it. But we have little choice but to do it, not just to make the most of the new opportunities that have been presented, but to respond to the changed circumstances that some industries face as a result. In this sense, Australia, though blessed with many natural endowments, is in the same position as most other nations. We have to adapt to changing times. This perhaps helps to explain the sense of concern in some parts of the Australian community and the tendency to focus on the difficulties, rather than the opportunities, which come with our situation.151
1.5.2 Entry-‐level jobs and novice workers
Changing structures in entry-‐level jobs in both the public and private sectors have reduced opportunities for school leavers and graduates to undertake a period of workplace-‐based learning upon joining the workforce. Historically, employers played a larger part in moulding novice workers into effective participants in the workforce. Today, firms no longer play the significant role they once did in training new recruits, and cadetships and internships have been wound back, further reducing opportunities for entry level work and structured training in the workplace. In striving for efficiency, organisational structures have flattened and entry level positions have reduced further.152
Lack of experience is a key issue for new labour market entrants, despite the fact that over 76 per cent of university graduates work in their final year of study. Almost a third of these (32 per cent) are working full time at the time of graduation and more than half (53 per cent) continue to work for their existing employer after graduating.153 In VET, around 85.4 per cent of students study part-‐time and 56.8 per cent are employed either full-‐time or part-‐time.154 The upshot is that novice workers are increasingly relying on the employment they gained as students to segue into jobs after graduation. However, this may involve skills mismatch and working below the skill level gained through study, which has implications for both productivity and individual job satisfaction.155
1.5.3 Changing skill requirements
The OECD has indicated that future jobs will demand higher skill levels.156 While there has been a shift towards higher education, the demand for VET qualifications is still strong. There is a growing requirement for cognitive and interactive skills in addition to specialised or manual skills due to the changing technological and social nature of the workplace.
Much has been written about the link between the adoption of computer technology and the demand for graduate workers able to perform tasks that require ‘flexibility, creativity, analytical and problem solving capabilities and complex communications’.157 This change is occurring both in the services sectors and the traditional trades areas. For example, employers in the hospitality sector have reported a clear link between the quality of their employees’ interactive skills and the success of their businesses. Similarly, electricians are increasingly dealing with more complex domestic and industrial technologies such as programmable logic controllers and home security systems and in addition to updating these specialised skills are required to inform and negotiate with customers.158 This suggests that interactive skills need to be formally recognised along with technical skills, and to be integrated into training packages.
Future Focus: Discussion Paper 25
Whilst higher level VET qualifications may provide pathways into higher education, they also have a purpose and job outcomes in their own right.
For many occupations, such as engineering, Diplomas and Advanced Diplomas were traditionally used to provide employees at the paraprofessional level. However, higher level VET qualifications in engineering account for only a small part of the sector and enrolments are declining, with a 21 per cent decrease in student commencements at Diploma level or higher between 2005 and 2010.159 In contrast, the number of domestic students commencing studies in engineering at university has increased by 35 per cent between 2005 and 2010, indicating that more students are opting to pursue higher education in this field.160
Yet overall, student demand for higher level VET qualifications is growing, with 233,000 students (or 16.2 per cent of those studying AQF qualifications) undertaking a Diploma level qualification or above in 2010: an increase of more than a quarter since 2005. There is also evidence of small but growing numbers of associate degrees entering into the market share held by Diplomas and Advanced Diplomas in some occupations.161
Research on employment outcomes for students of higher level VET has found that there can be a mismatch in that people with higher level VET qualifications are employed in jobs not commensurate with their qualification level. It is particularly the case that entry level job applicants with higher level VET qualifications are in a highly competitive job market, competing with existing workers who have technical competence, greater workplace experience and in some cases are university graduates. Employment outcomes for these VET graduates can be improved through opportunities for extended and practical workplace experience and through greater understanding on the part of employers of the value and relevance of the qualification for jobs in the industry.162
Traditional jobs for university graduates in the professions (such as law, medicine and architecture) have been supplemented by growth in fields which did not exist a few decades ago. These include those professional areas driven by changes in technology (e.g. network systems, software engineering and data communications), medicine (biomedical engineering, biotechnology), healthcare support (natural therapies, osteopathy), business (marketing, entrepreneurship, HR) and environmental challenges (environmental engineering, aquaculture).163 Other traditional fields such as teaching, nursing and psychology have introduced new professional standards requiring higher level qualifications.164 Not all jobs requiring higher level skills may entail expertise in a specialised area, but will require workers to demonstrate a broad base of complex communication, analytical and problem-‐solving skills.165
Economic returns from higher level skills
As a form of human capital, higher level skills are an economic imperative, with the potential to deliver financial and social benefits to both the individual and the broader society. Around the developed world, evidence shows that graduates with higher level skills earn substantially more than high-‐school graduates.
The returns to investment in skills stem from the higher rate of employment of people with qualifications compared to those without (see Figures 5 and 6), as well as from the higher earnings of people with qualifications. Most of the studies of rates of return to education tend to concentrate
Future Focus: Discussion Paper 26
on additional earnings and do not take full account of the employment effects of qualification holding.
Estimates on the returns from education in Australia vary. Studies of the returns to higher education consistently show on average very good returns to bachelor degrees.166
Returns on vocational education vary more widely, depending on gender, age, qualification level and employment status. Returns are highest for those students who work full-‐time and undertake their course part-‐time. Males consistently receive higher returns across all categories, including high-‐level qualification such as Diplomas.167
Importantly, however, in the large majority of cases these returns on education continue to outperform other forms of investment for individuals throughout their working lives, including for mature aged students. The personal economic benefits of gaining a degree continue ‘right up until males begin their studies in their late thirties and females, much later, in their mid fifties’.168 Given Australia’s ageing workforce and the prospect of delays to retirement, these strong returns on qualifications point to the importance of individuals and governments investing in education, at any age. When full account is taken of the benefits in accessing employment the conclusion is strengthened further.
1.5.4 Skills for sustainability
Government policy aimed at cutting pollution and driving investment in clean energy will accelerate the trend of increasing demand for green skills and jobs.169 It is anticipated that there will be growing demand for multidisciplinary workers and upskilling in existing industries including construction, mining, transport and agriculture and also energy, manufacturing and service-‐related industries. There will also be significant demand for skills in emerging industries such as renewable energy, eco-‐tourism, sustainable design and carbon farming.170
The European Union’s introduction of the Emissions Trading System has generated a new industry in emissions trading and carbon accounting leading to new jobs and skills requirements.171 The Australian Government and the European Union have confirmed that they will aim to link their carbon markets together to further develop the international carbon market. This may lead to an increased demand for workers with skills in emissions trading and carbon accounting across a range of industries.172
Existing programs under the COAG Green Skills Agreement address green skills challenges and anticipated areas of demand.173 Training packages have been updated to include skills for sustainability while implementation of other objectives, such as upskilling VET practitioners and reskilling vulnerable workers in the transition to a low carbon economy, will continue over the next three years.174
1.5.5 Developing an Asia capable workforce
Despite the current general economic malaise across the global economy, Asia has managed to sustain significant economic growth.
Over the last decade there has been a steady increase in Australia’s trade engagement with Asia.175 Our relationship with China is of particular significance. In 2010-‐11, China was Australia’s largest two-‐way trading partner ($113.3 billion) whereas in 1990-‐91 China was ranked 10th (valued at $3.2
Future Focus: Discussion Paper 27
billion). Countries from Asia accounted for seven out of Australia’s top 10 trading partners in 2010-‐11—amounting to over half the share of Australia’s total trade—50.9 per cent.176
It is already evident that growing international trade and migration will change the structure of economic activity in Australia. Increasingly we will specialise more in production and service activities (such as medical services) in which we have a comparative advantage and buy the goods and services that we are less efficient at producing from lower cost countries.
This means there will be winners and losers in the Australian labour market, and we will need to develop strategies to assist those industries and individuals facing structural adjustment. Overall however it is anticipated that the economic gains from closer integration with Asia will outweigh the losses.177
How do we take advantage of the opportunity that the Asian century presents?
Skills will be fundamental to Australia’s future in the Asia Pacific region. As one commentator observes:
Our first strategy should be skills, skills, skills. Australia’s comparative advantage relative to Asia is in production activities that are intensive in high-‐skilled labour, so we need a foundation for continued specialisation in those areas.
Maintaining Australia’s position as a high-‐skilled country is largely about increasing participation in higher education, but it is also about improving the quality of education—particularly through programs with demonstrated net benefits such as early intervention programs.178
The business community also recognises the importance of Asia to their future. In 2011 Asialink and the Ai Group surveyed Ai Group members on how important Asia was to their future plans and how well prepared firms thought they were. The research findings show that 74 percent of all respondents indicated an interest in expanding into the region with almost 50 percent actively planning expansion within the next 12 months. Yet business reported a deficit of relevant skills. When asked about the skills sets required for doing business in Asia, ‘quality partnerships’, ‘appreciation of different political and legal process’, ‘managerial skill’ and ‘local cultural knowledge’ were all seen as gaps in experience and knowledge.179
These findings reflect submissions put to the Government’s Australia in the Asian Century taskforce. While strong support was expressed for the need for Australians to be more proficient in Asian languages as a means of enhancing effective engagement, overwhelmingly it was noted that being ‘Asia literate’ or ‘Asia capable’ required broader skills than language fluency, including the need for cultural understanding.180
1.5.6 Migration
Migration plays an important role in buffering the economy against the volatility of the economic cycle, acting as a ‘shock absorber’ in the Australian labour market. Permanent migration helps ensure that Australia has the skills it needs to grow, offsetting an ever-‐larger pool of older non-‐working Australians who are reliant on government support as they age. Temporary migration, meanwhile, provides fast and flexible solutions to skill shortages. Without these contributions to Australia’s working age population, labour force growth would almost cease within the next ten
Future Focus: Discussion Paper 28
years.181 At the same time, ‘home-‐grown’ skills must remain the priority if Australia is to fulfil its potential for future growth, improved living standards, and social inclusion and equity.
Yet migration is not only about the supply of skills and labour, with evidence that migration also creates demand, by helping to boost business investment and spending on goods and services.182 As Withers (2003) notes, this ‘in turn, increases demand for the labour to produce those goods and services. This is to say migrants are not only workers but are also consumers’.183 While concerns have been raised about the ‘potential impact of immigration on training opportunities for existing workers’, there is also an argument that ‘migrant-‐created demand itself induces a need for new training slots wherever that demand is sourced’.184
The composition of Australia’s migration program has changed markedly over time. Since the mid-‐1990s, the balance of permanent migration has shifted from the family stream towards independent skilled migration, with the proportion of skill stream migrants increasing from 32 per cent to 68 per cent.185 For planning levels under the 2011-‐12 Migration Program, 125,850 places were reserved for skilled migrants who gain entry on the basis of their skills and qualifications within particular occupational areas.186
This emphasis on skilled migration has resulted in an increasing proportion of people entering Australia with post-‐school qualifications, with 44 per cent of adult migrants who arrived after 2006 having a bachelor degree on arrival, compared with only 15 per cent of those who arrived before 1991.187 On average, permanent migrants who enter via the skill stream have positive employment outcomes and higher qualifications than the rest of the population.188
Yet permanent migration is just the tip of the iceberg. Also absorbed within the labour market are the contributions of international students, working holiday makers and temporary migrants who are sponsored by an employer or region. Together, these make up an additional two-‐thirds of a million people participating in the economy: including more than a third of a million student visa holders, around 131,000 working holiday makers and 141,000 temporary (long stay) visa holders present in Australia during 2011.189 In addition, over 600,000 New Zealand citizens were present in Australia as of mid-‐2011, on either a temporary or permanent basis. This is additional to planning levels under Australia’s Migration Program.190
Each of these groups contributes to Australia’s net skills in different ways. Working holiday makers, for example, are more likely to participate in casual, seasonal and low-‐skilled labour markets, while employer-‐sponsored migrants are more commonly employed within the health care and social assistance, construction and ICT industries.191 Temporary migration pathways are also used by employers to fill skills shortages left by competition with the mining sector, with the majority of Employer Nomination Scheme (ENS) visas over the past five years going to the agriculture, manufacturing and construction industries.192
The government estimates that the hospitality industry is currently short of workers, and this shortage is expected to grow by 2015.193 Moves to open up temporary migration to less skilled occupations within the hospitality sector are a way of encouraging workers such as waiters, bartenders and hotel managers to the country to fill gaps within the hospitality sector.194 However, this does not address the quality of work issues that have seen skilled and semi-‐skilled Australian workers exit the industry, nor examine why these jobs are not attracting sufficient numbers of
Future Focus: Discussion Paper 29
Australians to mitigate labour shortages. This highlights the need for comprehensive workforce development planning that takes the full range of labour market issues into account.
The economic role of international students
In considering the net balance of skills in Australia, the contribution of international students as a labour market resource is often overlooked. International students are an important part of the economy, contributing $AU 16.5 billion and some 180,000 jobs.195 Education exports represent our third largest export industry196 and Australia is positioned as the fifth-‐largest destination for international tertiary students, according to the OECD.197 Yet beyond their financial contribution, the skills and labour of international students are also integrated within industries such as retail, hospitality and administration.198
The progressive drop in international student numbers since 2010 is therefore a cause for concern for the education sector, government and employers alike, although the nexus previously existing between study and permanent residence may have skewed the numbers over the period that it was in force. Australia’s international student population grew exponentially during the 2000s, doubling between 2002 and 2009 and making up more than 20 per cent of tertiary enrolments.199 However, offshore student visa applications have fallen by some 20 per cent in 2011, driven by changes to visa regulations, pathways to permanent migration, the high Australian dollar and negative publicity surrounding the experiences of some international students in recent years.200
Future Focus: Discussion Paper 30
Chapter Two: What might the future hold?
2.1 Scenarios
So far we have considered the factors that are currently limiting Australia’s growth potential—weak productivity growth, inadequate skills in leadership and management for innovation, barriers to participation and regional disparity. But what of the future? What are the opportunities and risks, the challenges and barriers that we might have to face in developing Australia’s workforce capacity in the years to 2025? How can we anticipate them and plan our responses accordingly?
To help us develop robust policies for workforce development, we have developed a suite of plausible scenarios for Australia to 2025. These scenarios cover a range of possible futures. They are not meant to be predictions or projections, and they are not based on the assumption that the trends of the past will be recreated in the future. Rather, they are meant to embrace a range of possibilities, any of which could happen, in any combination—or equally might not.
2.1.1 Why use a scenario approach?
A national workforce development strategy must take a long view of future demands. The development of skills involves a considerable investment, particularly by individuals, but also by employers and governments. This investment in education and training often requires these various parties to make a commitment for some years. Realising the full benefits of this investment takes even longer—often a lifetime. On the other hand, the longer the view, the greater the uncertainties involved.
These uncertainties include the limitations of forecasting into the future labour market. Indeed, it is difficult to forecast with confidence more than just a few years ahead.201
Scenarios which encompass a range of plausible alternative futures can provide a framework to help us analyse and understand emerging complexities and explore areas of uncertainty. They can also assist in assessing the interdependence and coherence of possible futures and ‘what if’ events. 202
Where certain outcomes are common across all scenarios we can build aspirational policies with a reasonable degree of certainty. Where scenario outcomes differ significantly, that helps us to identify the key areas of uncertainty and the consequent risks. Furthermore the scenarios help to understand the reasons for these risks and to appreciate their significance. We can then tailor our planning to take account of the implications of those differences and the associated risks.
In effect, by comparing plausible alternative scenarios, the significance of different uncertainties can be better appreciated. A comparison of the model results based on these scenarios allows us to identify how much difference possible alternative future developments are likely to make to the demands for different skills and why, and what responses might then be most appropriate.
The scenarios are also used to develop and test strategies and generate new ideas and possible responses.
2.1.2 Developing the scenarios
In developing our Scenarios for Australia to 2025, we have departed from the approach taken in Australian Workforce Futures, where scenarios from Royal Dutch Shell were adapted for the
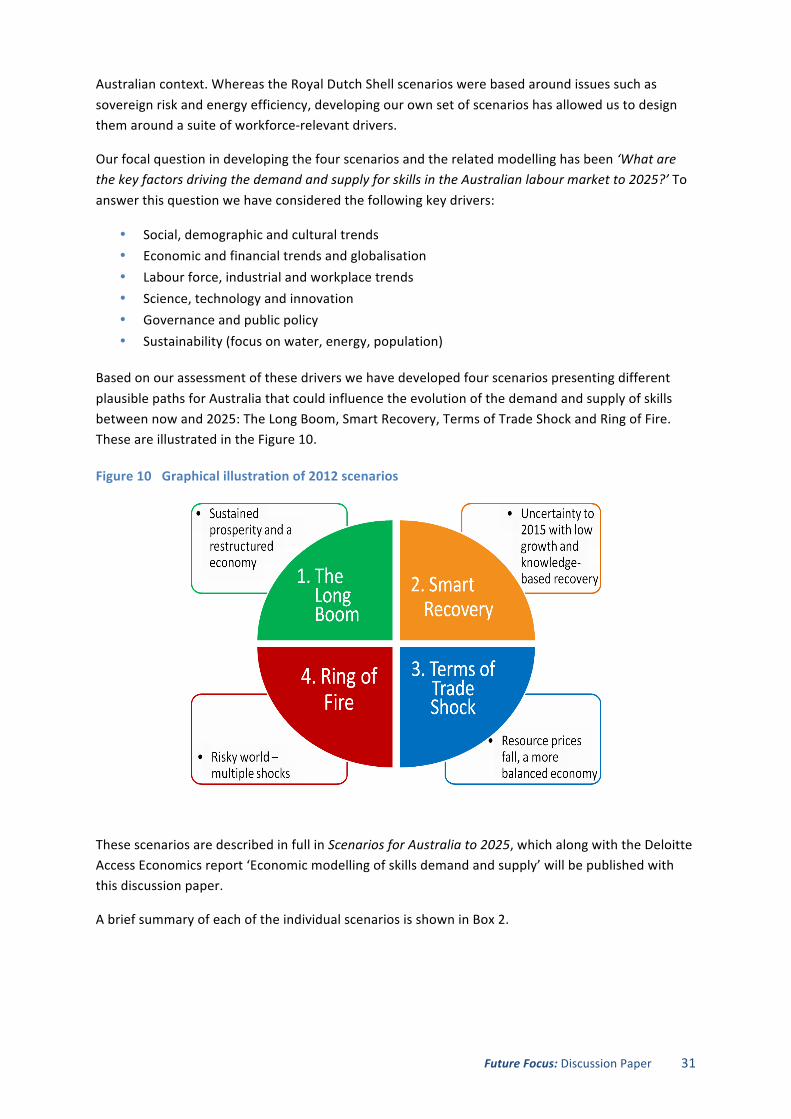
Future Focus: Discussion Paper 31
Australian context. Whereas the Royal Dutch Shell scenarios were based around issues such as sovereign risk and energy efficiency, developing our own set of scenarios has allowed us to design them around a suite of workforce-‐relevant drivers.
Our focal question in developing the four scenarios and the related modelling has been ‘What are the key factors driving the demand and supply for skills in the Australian labour market to 2025?’ To answer this question we have considered the following key drivers:
• Social, demographic and cultural trends • Economic and financial trends and globalisation • Labour force, industrial and workplace trends • Science, technology and innovation • Governance and public policy • Sustainability (focus on water, energy, population)
Based on our assessment of these drivers we have developed four scenarios presenting different plausible paths for Australia that could influence the evolution of the demand and supply of skills between now and 2025: The Long Boom, Smart Recovery, Terms of Trade Shock and Ring of Fire. These are illustrated in the Figure 10.
Figure 10 Graphical illustration of 2012 scenarios
These scenarios are described in full in Scenarios for Australia to 2025, which along with the Deloitte Access Economics report ‘Economic modelling of skills demand and supply’ will be published with this discussion paper.
A brief summary of each of the individual scenarios is shown in Box 2.
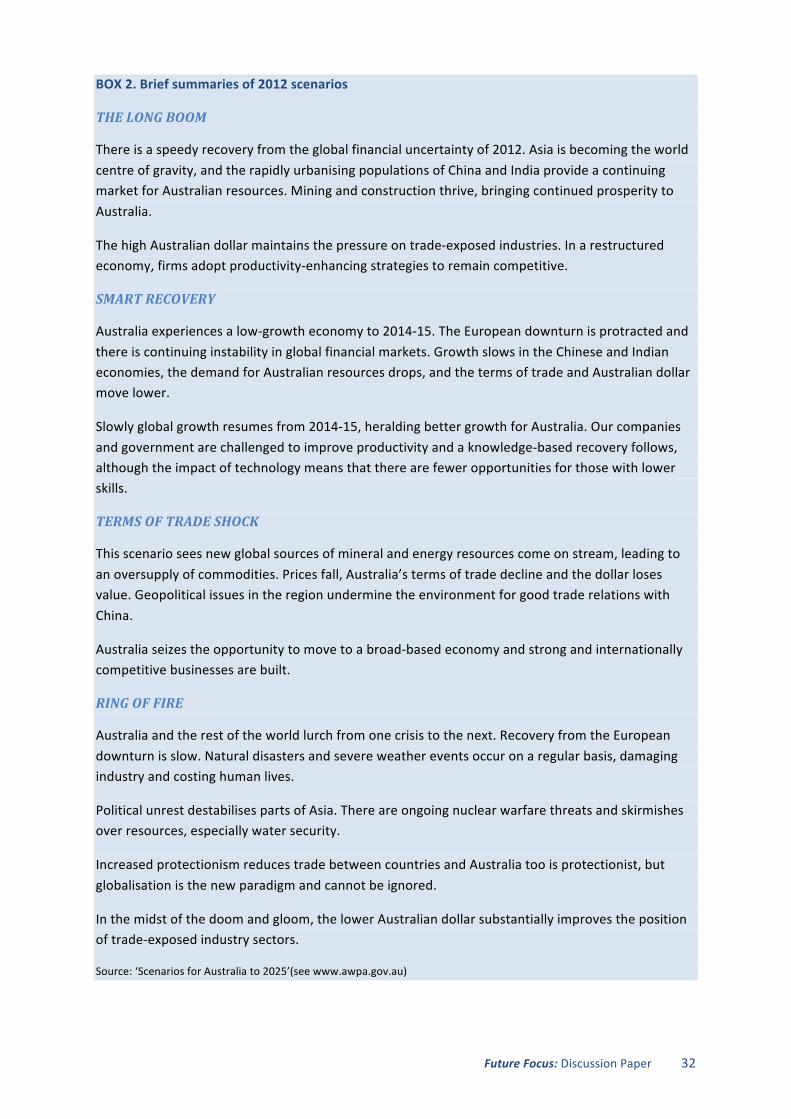
Future Focus: Discussion Paper 32
BOX 2. Brief summaries of 2012 scenarios
THE LONG BOOM
There is a speedy recovery from the global financial uncertainty of 2012. Asia is becoming the world centre of gravity, and the rapidly urbanising populations of China and India provide a continuing market for Australian resources. Mining and construction thrive, bringing continued prosperity to Australia.
The high Australian dollar maintains the pressure on trade-‐exposed industries. In a restructured economy, firms adopt productivity-‐enhancing strategies to remain competitive.
SMART RECOVERY
Australia experiences a low-‐growth economy to 2014-‐15. The European downturn is protracted and there is continuing instability in global financial markets. Growth slows in the Chinese and Indian economies, the demand for Australian resources drops, and the terms of trade and Australian dollar move lower.
Slowly global growth resumes from 2014-‐15, heralding better growth for Australia. Our companies and government are challenged to improve productivity and a knowledge-‐based recovery follows, although the impact of technology means that there are fewer opportunities for those with lower skills.
TERMS OF TRADE SHOCK
This scenario sees new global sources of mineral and energy resources come on stream, leading to an oversupply of commodities. Prices fall, Australia’s terms of trade decline and the dollar loses value. Geopolitical issues in the region undermine the environment for good trade relations with China.
Australia seizes the opportunity to move to a broad-‐based economy and strong and internationally competitive businesses are built.
RING OF FIRE
Australia and the rest of the world lurch from one crisis to the next. Recovery from the European downturn is slow. Natural disasters and severe weather events occur on a regular basis, damaging industry and costing human lives.
Political unrest destabilises parts of Asia. There are ongoing nuclear warfare threats and skirmishes over resources, especially water security.
Increased protectionism reduces trade between countries and Australia too is protectionist, but globalisation is the new paradigm and cannot be ignored.
In the midst of the doom and gloom, the lower Australian dollar substantially improves the position of trade-‐exposed industry sectors.
Source: ‘Scenarios for Australia to 2025’(see www.awpa.gov.au)
Future Focus: Discussion Paper 33
2.1.3 Commonalities across scenarios
Our analysis shows that some themes are common across all the scenarios. These themes can be taken as relatively firm foundations for policy responses.
Technology and innovation
Technology and innovation are important considerations across all scenarios (though to differing degrees) and also have important implications for the tertiary sector. Research and development is critical in this area, with both higher education and VET qualified workers playing a key role, and higher degrees by research especially important.203 The tertiary education sectors play an important role in incremental innovation. Upskilling and reskilling of existing workers will also be important to avoid skills obsolescence in the face of new technologies. There is significant opportunity for all workers to contribute to incremental innovation in processes and products to support innovation across all scenarios.
Economic impediments to participation
Labour market programs targeted at supporting people back into work—e.g. the upskilling or reskilling of older workers—will be important across all scenarios.
It can be expected that VET will play an important part in delivering labour market programs for those impacted by structural adjustment. This will include language, literacy and numeracy (LLN) and confidence-‐building and assistance to people transitioning to new industries.
Governments may consider ramping up general education foundation courses as a strategy to assist early school leavers in accessing education and training and dealing with employment churn and unemployment.
Higher level skills
All of the scenarios show the demand for higher level skills is increasing its share to 2025. Professional, Scientific and Technical Services do well across all four scenarios, with a capability for innovation key to Australia’s economic future. There are implications for qualifications at undergraduate and postgraduate level and at higher level VET.
High-‐level skills will also be required to support Australia’s economic participation in the region and make Australian business internationally competitive.
The growing importance of Asia
The continuing growth of Asian countries, especially China and India, is an area of relative certainty across the scenarios. Critically, this means a high-‐skilled future for Australia as services to Asia develop, and highlights the importance of developing the skills and knowledge to support Australia’s capability to participate in ‘the Asian Century’. The Australian workforce will need skills in Asian languages and cultures, as well as business skills for these environments.
Climate change
All the scenarios incorporate some impacts from and responses to climate change, although the scenarios have been distinguished by the severity of the impacts. The carbon price is assumed as
Future Focus: Discussion Paper 34
common to all scenarios. Structural adjustment may follow carbon pricing although Treasury predictions are that the effect will be small in comparison to the impact of other factors such as the terms of trade. Government capacity to further respond to climate change challenges will vary with Australia’s economic wealth across the scenarios and its ability to bring about a consensus for change. For example, the Ring of Fire scenario shows increasing numbers of environmental refugees in a context of constrained fiscal capacity of governments.
Demography
Under all scenarios the ageing of the Australian workforce will be a critical factor, both in terms of dependency ratios of taxpayers to people who are no longer working, and in impacts on the healthcare and services sectors. At the same time, however, new opportunities for workforce participation of mature-‐aged workers, particularly those aged over 64, can help to redress the balance. More flexibility will be required in both workplace practices and in tertiary education and training.
Increasing the workforce in Health and Aged Care and Community Services to meet the needs of an increasing proportion of old and very old people in need of care will continue to be a challenge across the years to 2025 and will continue to have implications for domestic supply and skilled migration.
Literacy, numeracy and generic skills
A number of skills issues are likely to be cross-‐cutting regardless of which scenario eventuates. There will still be a need for policies arising out of the National Foundation Skills Strategy to address low levels of language, literacy and numeracy in the Australian population. More places will be needed in LLNP and the WELL program, as well as incentives for employers to invest in WELL.
Generic skills such as problem-‐solving for complex issues, innovation, teamwork and communication will be required across scenarios. Universities and the VET sector will need to maintain the focus on these skills in graduate outcomes, and the VET sector will need to continue to address how they can most effectively be included in training packages.
2.1.4 Differences and uncertainties across scenarios
Our analysis has also identified a number of key differences across the scenarios. These are the areas that are relatively uncertain, and suggest the need for flexibility in policy responses.
Fiscal capacity
Fiscal capacity is a critical uncertainty—and risk—across the scenarios. This is important for funding and investment in education and training, and in particular government’s capacity to pay. In the Long Boom scenario it can be expected that there is funding more easily available for tertiary education. However when government budgets are constrained, this may result in greater responsibility shifted to employers and individuals, although their capacity to pay is also likely to be limited.
Future Focus: Discussion Paper 35
Migration
One of the greatest uncertainties across the scenarios is migration. Migration in Australia has traditionally been a strategy to help meet the demand for labour. This is expected to continue to 2025, with skilled migration expected to act as a shock absorber in times of strongest growth.
Permanent migration makes the most significant contribution to building Australia’s skills base. However temporary migration, which is more flexible and able to meet changing needs, is a key element in ensuring flexibility regardless of what the future holds for Australia to 2025.
Migration is part of the policy mix in meeting the needs of the labour market, but government policy is that priority be given to domestic workers and their education and training. Domestic investment in education and training needs to grow regardless of which scenario eventuates.
Industry sectors
A key difference between the scenarios is how different industries fare. Demand for health care services is expected to show relatively strong growth across all scenarios given Australia’s ageing population and likely further improvements in technology. The demand for protein from the growing Asian region is expected to benefit agriculture in all scenarios. However trade-‐exposed industries that are strongly influenced by the Australian dollar such as manufacturing, tourism and the education sector demonstrate substantially different outcomes across the scenarios.
Regardless of scenario, the expected growth in industries such as healthcare can be expected to give some certainty as to demand for qualifications. However the different industry structures in other parts of the economy also suggest a need to balance technical and professional skills with more generic skills that can be applied in different contexts.
2.1.5 Specific trends and challenges for each scenario
LONG BOOM
In this scenario the education export sector is exposed to strong competition. It is also challenged by technology including competition from prestigious universities in the US.
There is significant fiscal capacity and strong demand for skilled labour, which imply that governments would increase funds to train and help avoid skills shortages. Employers keen to retain staff may include training as part of their retention strategies. Individuals could also expect a good return on investment.
SMART RECOVERY
Knowledge work, requiring increased investment in education and training, is recognised as the most significant contributor to productivity gains and new job creation in this scenario.
However, youth unemployment is a significant problem, especially regionally, and young people without qualifications find it particularly hard to find work during the period of lower growth when there may also be less demand for training.
Among other factors, apprenticeship programs are strongly influenced by economic cycles. A period of slow growth would be likely to mean employers do not wish to take on apprentices. Conversely,
Future Focus: Discussion Paper 36
retention of existing apprentices may rise after 2014–15 as the economy picks up.
The knowledge-‐based recovery will have significant implications for the tertiary sector given its important role in incremental innovation. Consideration will need to be given to the future relationship between VET and higher education, particularly in terms of higher VET qualifications. The VET sector will play an important role in delivering labour market programs for those impacted by structural adjustment, particularly for older people but also young people who were unable to find work during the downturn. Recognition of prior learning will be an important tool.
TERMS OF TRADE SHOCK
Investment in education is critical as Australia tries to revive science, technology, engineering and mathematics (STEM) education to aid the high-‐tech sector. The tertiary sector will play a key role in contributing relevant professional skills (e.g. R&D, engineering, materials science, management) to revive manufacturing at the high-‐tech end and foster innovation. Flexibility and adaptability of providers will be critical as sectoral adjustment occurs in response to the downturn in the resources sector and demand for skills associated with manufacturing (trades, engineering professionals and technicians, management etc) increases.
RING OF FIRE
The prominent role of science and technology means that Australia continues to require considerable numbers of highly-‐qualified people, especially in STEM subjects.
In this scenario the prevalence of natural disasters means that people will be more ready to adapt to sustainable technologies and this will create demand for training to support this and other climate change adaptation and mitigation strategies in both higher education and VET.
There are impacts on the education and training system from people entering the country on a permanent basis as environmental refugees. These people will not necessarily have suitable training for jobs available in the Australian labour market.
Apprenticeship levels are low, since employers need to keep their workforces flexible in times of financial crisis. Policies to improve participation languish because there are not enough jobs.
2.2 Modelling implications and outcomes
Deloitte Access Economics was commissioned to undertake econometric modelling of the four different scenarios. The assumptions used in the modelling reflect a number of economic parameters such as the level of economic growth, annual net migration, productivity, employment growth and workforce participation rates, as well as the key characteristics and trends of each scenario. Working within these parameters the model identifies the implications for industry and occupations and as a consequence the supply and demand of qualifications for each scenario.
Key messages from the modelling are summarised below:
1. Australians will have a better skilled future. Currently almost 60 per cent of people have achieved a qualification since leaving school. By 2025, industry demand for post-‐school qualifications is expected to increase to between 65 per cent and 75 per cent, depending on the shape of and growth in our economy.
Future Focus: Discussion Paper 37
2. Industry continues to demand higher level qualifications. Higher skilled jobs are projected to grow at around 1.6 times the rate of low skilled jobs in a range of scenarios. An additional 1.7 million people with qualifications at Certificate III or above are expected to be needed from 2011 to 2015 in the workforce under a high growth scenario. This comprises both employment growth and replacement204.
3. Employment opportunities are available across the economy. Health Care and Social Assistance and Retail Trade are projected to be the top two employing industries in 2025. Other significant contributors to overall employment in 2025 are Professional, Scientific and Technical Services; Education and Training; Accommodation and Food Services; Construction; Public Administration and Safety, and Manufacturing.
4. Employment growth is expected to be strongest in the service sector. Health Care and Social Assistance, Professional, Scientific and Technical Services, Education and Training are in the top 5 growth industries to 2025 in the four scenarios.
5. Higher skilled occupations are expected to have the strongest growth. Regardless of scenario, the strongest growth to 2025 is expected to be in Professional occupations, followed by Community and Personal Service Workers and Managers.
6. Domestic qualifications supply is relatively stable across a range of scenarios. Undergraduate and postgraduate qualifications represent just over one third of all completions in all scenarios. Certificate III and IV qualifications account for slightly less than 40 per cent.
7. Migration tops up domestic qualifications supply particularly when the economy is doing well. Qualifications flowing from migration to 2025 are projected to range from 13 per cent of all qualifications under a higher growth scenario, to 5 per cent in a lower growth scenario.
8. Projected growth in the demand for qualifications is more than double the projected growth in supply. The total demand for qualifications (including qualifications for people not employed) is expected to increase between 2010 and 2025 at an average annual rate of 3.6 per cent in each scenario, except for the Ring of Fire scenario (2.7 per cent annual average increase). This increase in demand is more than twice as fast as the projected average annual increase in the total supply of qualifications (between 1.5 and 1.2 per cent for three scenarios and 0.5 per cent for the Ring of Fire scenario). For the three “growth” scenarios this difference in the increase in demand and supply is expected to lead to a growing shortfall in the required supply of qualifications over time. And while the Ring of Fire scenario suggests an excess supply of qualifications, this excess is most marked in the early years and is projected to decline to a situation where all qualifications at diploma and above are in shortfall by 2025.
9. In particular, increased investment in tertiary education is needed to avoid an undersupply of qualifications to 2025. In all scenarios in 2025, there is projected to be an undersupply of between 45,000 and 280,000 higher level qualifications (diploma and above).
10. Projected oversupply in some lower level VET qualifications needs to be seen in light of the contribution that these qualifications play in pathways and boosting management capacity. In the Long Boom the projected demand and supply for VET qualifications is approximately in balance for most of the next decade. In the other three scenarios there is a projected excess in the supply of VET qualifications which reinforces the need for better data to support student study choices. In each scenario there would appear to be a need for a shift in VET supply in
Future Focus: Discussion Paper 38
favour of more diploma level qualifications. In judging these issues, however, further consideration is needed of the role of lower level VET qualifications as pathways to higher level qualifications, and the role of Certificate III and IV qualifications in meeting the expected excess demand for front-‐line managers.
2.2.1 Modelling Parameters
A comparison of the summary assumptions for each scenario shows that there is greater variation in terms of unemployment, productivity and GDP growth than the modelling used in Australian Workforce Futures. For example,
• The slightly wider gap in unemployment rates between the new scenarios is due primarily to a higher rate of unemployment under Ring of Fire (6.6 per cent) than in the previous weakest scenario.
• The difference between scenarios in terms of productivity growth is much wider in the new scenarios due to low productivity growth under Ring of Fire (0.59 per cent) compared to the previous weakest scenario.
• The gap in real GDP growth is greater under the new scenarios, attributable to the low growth rate (1.35 per cent) under Ring of Fire, compared to the previous weakest scenario.
However, in other respects, there is less difference between the scenarios in the new modelling. For example,
• The range for population growth is less under the old scenarios.
• There is a narrower range for exports compared with the old scenarios.
A summary of key assumptions in the new scenarios is shown in Table 3.
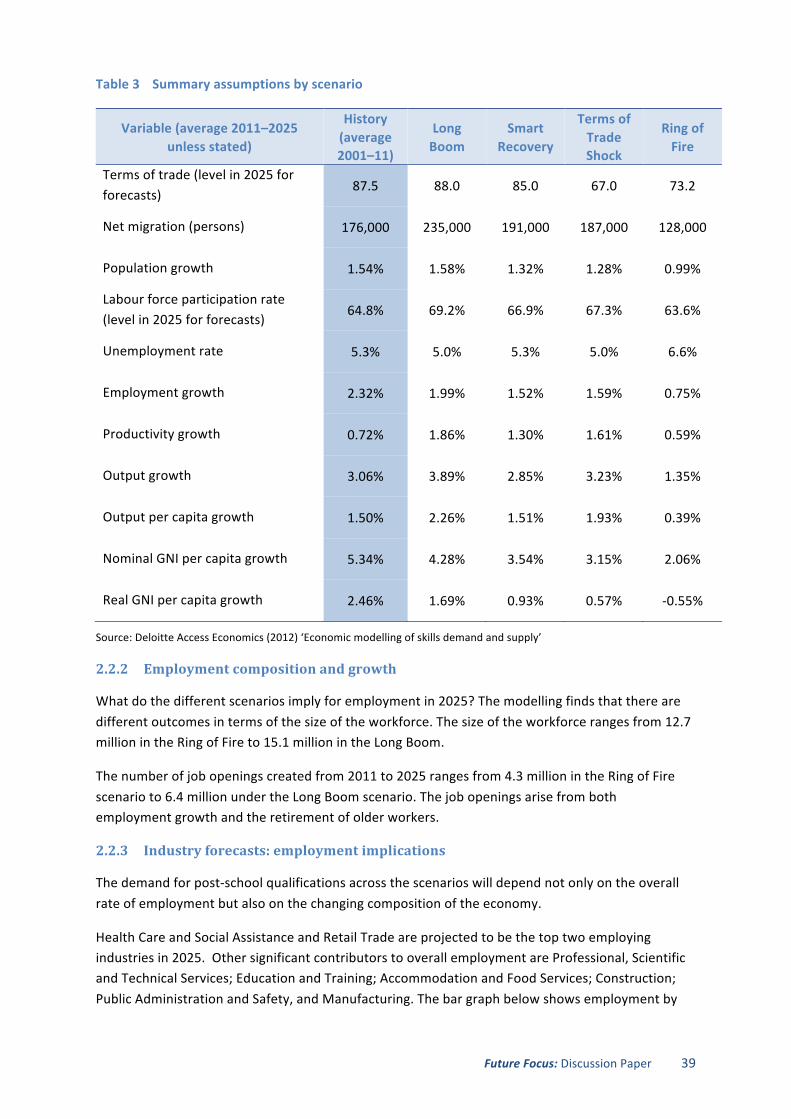
Future Focus: Discussion Paper 39
Table 3 Summary assumptions by scenario
Variable (average 2011–2025 unless stated)
History (average 2001–11)
Long Boom
Smart Recovery
Terms of Trade Shock
Ring of Fire
Terms of trade (level in 2025 for forecasts)
87.5 88.0 85.0 67.0 73.2
Net migration (persons) 176,000 235,000 191,000 187,000 128,000
Population growth 1.54% 1.58% 1.32% 1.28% 0.99%
Labour force participation rate (level in 2025 for forecasts)
64.8% 69.2% 66.9% 67.3% 63.6%
Unemployment rate 5.3% 5.0% 5.3% 5.0% 6.6%
Employment growth 2.32% 1.99% 1.52% 1.59% 0.75%
Productivity growth 0.72% 1.86% 1.30% 1.61% 0.59%
Output growth 3.06% 3.89% 2.85% 3.23% 1.35%
Output per capita growth 1.50% 2.26% 1.51% 1.93% 0.39%
Nominal GNI per capita growth 5.34% 4.28% 3.54% 3.15% 2.06%
Real GNI per capita growth 2.46% 1.69% 0.93% 0.57% -‐0.55%
Source: Deloitte Access Economics (2012) ‘Economic modelling of skills demand and supply’
2.2.2 Employment composition and growth
What do the different scenarios imply for employment in 2025? The modelling finds that there are different outcomes in terms of the size of the workforce. The size of the workforce ranges from 12.7 million in the Ring of Fire to 15.1 million in the Long Boom.
The number of job openings created from 2011 to 2025 ranges from 4.3 million in the Ring of Fire scenario to 6.4 million under the Long Boom scenario. The job openings arise from both employment growth and the retirement of older workers.
2.2.3 Industry forecasts: employment implications
The demand for post-‐school qualifications across the scenarios will depend not only on the overall rate of employment but also on the changing composition of the economy.
Health Care and Social Assistance and Retail Trade are projected to be the top two employing industries in 2025. Other significant contributors to overall employment are Professional, Scientific and Technical Services; Education and Training; Accommodation and Food Services; Construction; Public Administration and Safety, and Manufacturing. The bar graph below shows employment by
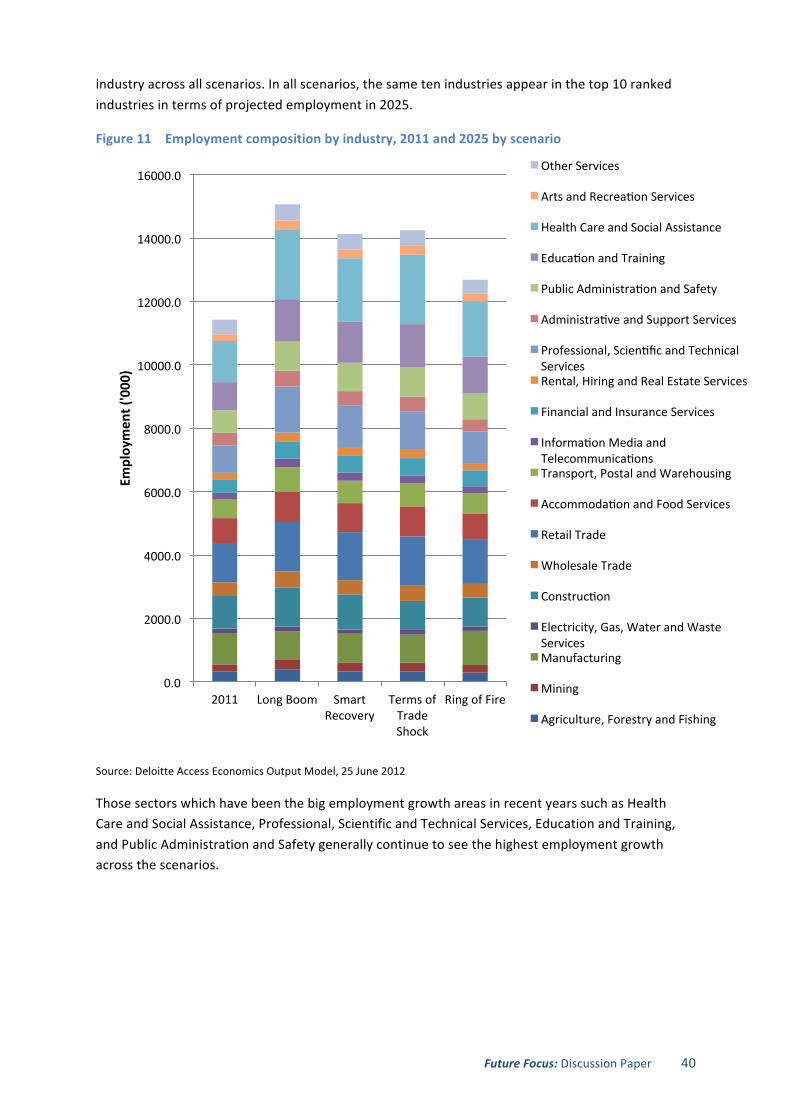
Future Focus: Discussion Paper 40
industry across all scenarios. In all scenarios, the same ten industries appear in the top 10 ranked industries in terms of projected employment in 2025.
Figure 11 Employment composition by industry, 2011 and 2025 by scenario
Source: Deloitte Access Economics Output Model, 25 June 2012
Those sectors which have been the big employment growth areas in recent years such as Health Care and Social Assistance, Professional, Scientific and Technical Services, Education and Training, and Public Administration and Safety generally continue to see the highest employment growth across the scenarios.
0.0
2000.0
4000.0
6000.0
8000.0
10000.0
12000.0
14000.0
16000.0
2011 Long Boom Smart Recovery
Terms of Trade Shock
Ring of Fire
Employmen
t ('000)
Other Services
Arts and Recreaqon Services
Health Care and Social Assistance
Educaqon and Training
Public Administraqon and Safety
Administraqve and Support Services
Professional, Scienqfic and Technical Services Rental, Hiring and Real Estate Services
Financial and Insurance Services
Informaqon Media and Telecommunicaqons Transport, Postal and Warehousing
Accommodaqon and Food Services
Retail Trade
Wholesale Trade
Construcqon
Electricity, Gas, Water and Waste Services Manufacturing
Mining
Agriculture, Forestry and Fishing
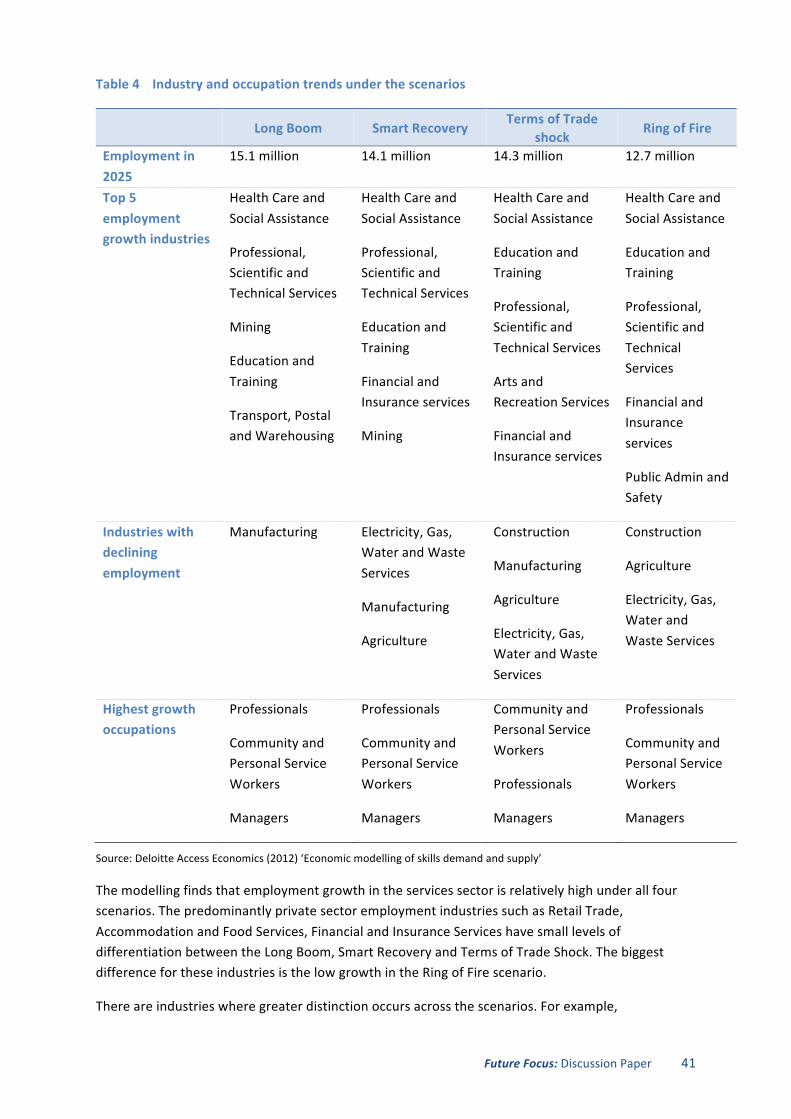
Future Focus: Discussion Paper 41
Table 4 Industry and occupation trends under the scenarios
Long Boom Smart Recovery Terms of Trade
shock Ring of Fire
Employment in 2025
15.1 million 14.1 million 14.3 million 12.7 million
Top 5 employment growth industries
Health Care and Social Assistance
Professional, Scientific and Technical Services
Mining
Education and Training
Transport, Postal and Warehousing
Health Care and Social Assistance
Professional, Scientific and Technical Services
Education and Training
Financial and Insurance services
Mining
Health Care and Social Assistance
Education and Training
Professional, Scientific and Technical Services
Arts and Recreation Services
Financial and Insurance services
Health Care and Social Assistance
Education and Training
Professional, Scientific and Technical Services
Financial and Insurance services
Public Admin and Safety
Industries with declining employment
Manufacturing Electricity, Gas, Water and Waste Services
Manufacturing
Agriculture
Construction
Manufacturing
Agriculture
Electricity, Gas, Water and Waste Services
Construction
Agriculture
Electricity, Gas, Water and Waste Services
Highest growth occupations
Professionals
Community and Personal Service Workers
Managers
Professionals
Community and Personal Service Workers
Managers
Community and Personal Service Workers
Professionals
Managers
Professionals
Community and Personal Service Workers
Managers
Source: Deloitte Access Economics (2012) ‘Economic modelling of skills demand and supply’
The modelling finds that employment growth in the services sector is relatively high under all four scenarios. The predominantly private sector employment industries such as Retail Trade, Accommodation and Food Services, Financial and Insurance Services have small levels of differentiation between the Long Boom, Smart Recovery and Terms of Trade Shock. The biggest difference for these industries is the low growth in the Ring of Fire scenario.
There are industries where greater distinction occurs across the scenarios. For example,
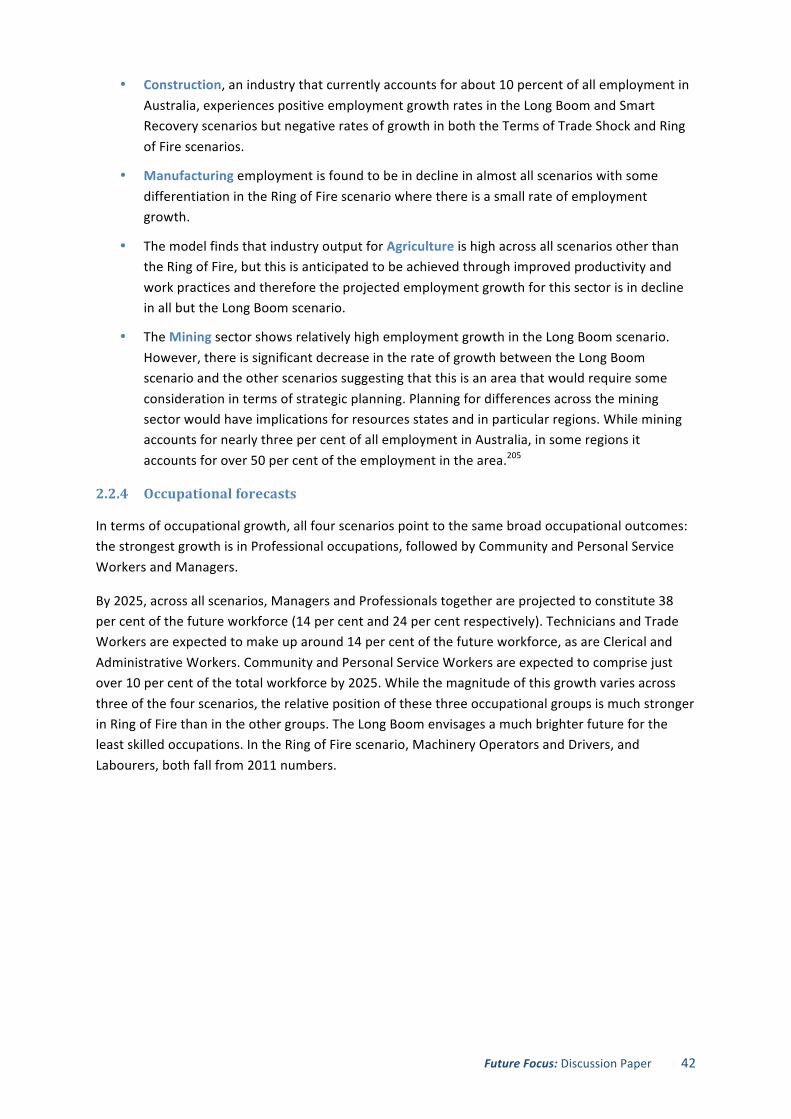
Future Focus: Discussion Paper 42
• Construction, an industry that currently accounts for about 10 percent of all employment in Australia, experiences positive employment growth rates in the Long Boom and Smart Recovery scenarios but negative rates of growth in both the Terms of Trade Shock and Ring of Fire scenarios.
• Manufacturing employment is found to be in decline in almost all scenarios with some differentiation in the Ring of Fire scenario where there is a small rate of employment growth.
• The model finds that industry output for Agriculture is high across all scenarios other than the Ring of Fire, but this is anticipated to be achieved through improved productivity and work practices and therefore the projected employment growth for this sector is in decline in all but the Long Boom scenario.
• The Mining sector shows relatively high employment growth in the Long Boom scenario. However, there is significant decrease in the rate of growth between the Long Boom scenario and the other scenarios suggesting that this is an area that would require some consideration in terms of strategic planning. Planning for differences across the mining sector would have implications for resources states and in particular regions. While mining accounts for nearly three per cent of all employment in Australia, in some regions it accounts for over 50 per cent of the employment in the area.205
2.2.4 Occupational forecasts
In terms of occupational growth, all four scenarios point to the same broad occupational outcomes: the strongest growth is in Professional occupations, followed by Community and Personal Service Workers and Managers.
By 2025, across all scenarios, Managers and Professionals together are projected to constitute 38 per cent of the future workforce (14 per cent and 24 per cent respectively). Technicians and Trade Workers are expected to make up around 14 per cent of the future workforce, as are Clerical and Administrative Workers. Community and Personal Service Workers are expected to comprise just over 10 per cent of the total workforce by 2025. While the magnitude of this growth varies across three of the four scenarios, the relative position of these three occupational groups is much stronger in Ring of Fire than in the other groups. The Long Boom envisages a much brighter future for the least skilled occupations. In the Ring of Fire scenario, Machinery Operators and Drivers, and Labourers, both fall from 2011 numbers.
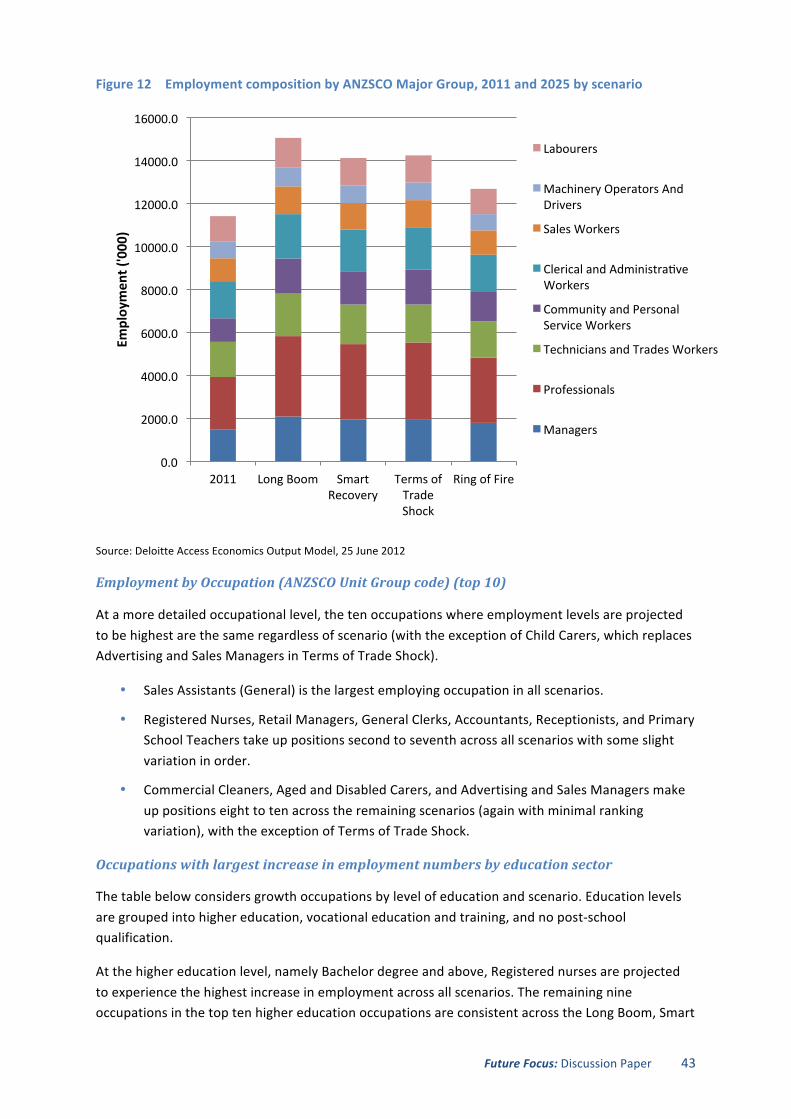
Future Focus: Discussion Paper 43
Figure 12 Employment composition by ANZSCO Major Group, 2011 and 2025 by scenario
Source: Deloitte Access Economics Output Model, 25 June 2012
Employment by Occupation (ANZSCO Unit Group code) (top 10)
At a more detailed occupational level, the ten occupations where employment levels are projected to be highest are the same regardless of scenario (with the exception of Child Carers, which replaces Advertising and Sales Managers in Terms of Trade Shock).
• Sales Assistants (General) is the largest employing occupation in all scenarios.
• Registered Nurses, Retail Managers, General Clerks, Accountants, Receptionists, and Primary School Teachers take up positions second to seventh across all scenarios with some slight variation in order.
• Commercial Cleaners, Aged and Disabled Carers, and Advertising and Sales Managers make up positions eight to ten across the remaining scenarios (again with minimal ranking variation), with the exception of Terms of Trade Shock.
Occupations with largest increase in employment numbers by education sector
The table below considers growth occupations by level of education and scenario. Education levels are grouped into higher education, vocational education and training, and no post-‐school qualification.
At the higher education level, namely Bachelor degree and above, Registered nurses are projected to experience the highest increase in employment across all scenarios. The remaining nine occupations in the top ten higher education occupations are consistent across the Long Boom, Smart
0.0
2000.0
4000.0
6000.0
8000.0
10000.0
12000.0
14000.0
16000.0
2011 Long Boom Smart Recovery
Terms of Trade Shock
Ring of Fire
Employmen
t ('000)
Labourers
Machinery Operators And Drivers
Sales Workers
Clerical and Administraqve Workers
Community and Personal Service Workers
Technicians and Trades Workers
Professionals
Managers
Future Focus: Discussion Paper 44
Recovery, and Terms of Trade Shock scenarios, with minimal changes in ordering. These occupations are mainly employed in the Health, Education, IT and Financial sectors. Although the same sectors are represented to varying degrees in the Ring of Fire scenario, General Managers and Human Resource Managers replace Secondary and Primary School Teachers in the top ten increasing higher education occupations.
With regard to VET qualifications, Child Carers and Aged and Disabled Carers are projected to experience the highest increase in employment across all four scenarios respectively, with the exception of Ring of Fire Scenario in which they exchange first and second place. There is a high degree of consistency in the remaining occupations across the scenarios, with the Health Care, Construction, and Education sectors all represented, along with Chefs. Notable differences include the replacement of Welfare Support Workers, Vocational Education Teachers, and Call or Contact Centre and Customer Service Managers in the Ring of Fire with Construction and Event Management occupations. Likewise Call or Contact Centre and Customer Service Managers and Insurance, Money Market and Statistical Clerks are replaced by Police and Real Estate Sales Agents in the Terms of Trade Shock.
With regard to occupations that currently have no post-‐school qualification as the most common qualification level, Sales Assistants, General Clerks and Retail Managers rank in the top three or four across all scenarios. Apart from Retail and Finance, other sectors represented in the top ten include Mining, Agriculture, and Administration.
Future Focus: Discussion Paper 45
Table 5 Top 10 occupations with largest increase in employment numbers by modal qualification 2011–2025206
Source: Deloitte Access Economics Output Model, 25 June 2012
Job openings
New job openings occur both from employment growth and retirements of older workers. Across the scenarios job openings due to retirement are relatively stable, whereas job openings due to employment growth vary with the economic strength of the scenario.
Long Boom Smart Recovery Terms of Trade Shock Ring of Fire
Higher Education
Change 2011-‐25 ('000) Higher Education
Change 2011-‐25 ('000) Higher Education
Change 2011-‐25 ('000) Higher Education
Change 2011-‐25 ('000)
Registered Nurses 134.0 Registered Nurses 105.2 Registered Nurses 126.7 Registered Nurses 59.2 Software and Applications Programmers 67.8 Software and Applications Programmers 56.2 Private Tutors and Teachers 60.0 Private Tutors and Teachers 44.3 Private Tutors and Teachers 59.9 Private Tutors and Teachers 55.5 Advertising and Sales Managers 52.9 Advertising and Sales Managers 37.9 Advertising and Sales Managers 63.1 Advertising and Sales Managers 52.2 Software and Applications Programmers 51.8 Chief Executives and Managing Directors 36.4 Accountants 67.9 Accountants 51.8 Accountants 48.6 Software and Applications Programmers 32.1 Chief Executives and Managing Directors 53.1 Chief Executives and Managing Directors 46.2 Chief Executives and Managing Directors 46.0 Accountants 21.4 Secondary School Teachers 46.1 Secondary School Teachers 37.7 Secondary School Teachers 45.6 General Managers 21.3 Primary School Teachers 42.5 Primary School Teachers 33.9 Primary School Teachers 41.7 Generalist Medical Practitioners 20.3 Contract, Program and Project Administrators 39.8 Contract, Program and Project Administrators 31.5 Generalist Medical Practitioners 35.4 Contract, Program and Project Administrators 17.8 Generalist Medical Practitioners 36.9 Generalist Medical Practitioners 30.5 Contract, Program and Project Administrators 33.8 Human Resource Managers 17.7VET (modal qualification is Cert I to Adv Diploma) VET (modal qualification is Cert I to Adv Diploma) VET (modal qualification is Cert I to Adv Diploma) VET (modal qualification is Cert I to Adv Diploma) Child Carers 83.3 Child Carers 68.1 Child Carers 81.8 Aged and Disabled Carers 43.9 Aged and Disabled Carers 83.4 Aged and Disabled Carers 67.9 Aged and Disabled Carers 81.6 Child Carers 43.5 Electricians 51.6 Electricians 36.7 Nursing Support and Personal Care Workers 45.4 Welfare Support Workers 19.7 Nursing Support and Personal Care Workers 46.7 Nursing Support and Personal Care Workers 35.9 Welfare Support Workers 35.2 Nursing Support and Personal Care Workers 19.5 Welfare Support Workers 36.0 Welfare Support Workers 29.8 Education Aides 29.9 Electricians 17.4 Education Aides 29.3 Education Aides 24.8 Vocational Education Teachers 23.9 Chefs 15.3 Chefs 26.3 Chefs 22.0 Chefs 22.8 Conference and Event Organisers 15.1 Vocational Education Teachers 24.3 Vocational Education Teachers 21.3 Police 21.8 Other Building and Engineering Technicians 15.0 Insurance, Money Market and Statistical Clerks 20.6 Insurance, Money Market and Statistical Clerks 19.1 Electricians 21.0 Education Aides 14.7 Call or Contact Centre and Customer Service Managers 22.9 Call or Contact Centre and Customer Service Managers 18.7 Real Estate Sales Agents 19.7 Insurance, Money Market and Statistical Clerks 14.5Entry-‐level (modal qualification is no-‐post school qualification) Entry-‐level (modal qualification is no-‐post school qualification) Entry-‐level (modal qualification is no-‐post school qualification) Entry-‐level (modal qualification is no-‐post school qualification) Sales Assistants (General) 95.7 Sales Assistants (General) 74.2 Sales Assistants (General) 90.5 General Clerks 35.7 General Clerks 87.5 General Clerks 67.8 General Clerks 73.1 Retail Managers 29.2 Receptionists 50.2 Retail Managers 54.7 Retail Managers 61.7 Sports Coaches, Instructors and Officials 26.0 Sports Coaches, Instructors and Officials 36.1 Receptionists 34.5 Receptionists 43.4 Sales Assistants (General) 25.4 Dril lers, Miners and Shot Firers 38.5 Office Managers 33.4 Sports Coaches, Instructors and Officials 36.6 Office Managers 17.7 Commercial Cleaners 39.8 Sports Coaches, Instructors and Officials 33.0 Office Managers 33.7 Dril lers, Miners and Shot Firers 15.6 Waiters 32.6 Dril lers, Miners and Shot Firers 26.0 Waiters 31.2 Other Miscellaneous Labourers 12.3 Livestock Farmers 39.2 Commercial Cleaners 25.0 Commercial Cleaners 28.5 Security Officers and Guards 12.3 Kitchenhands 31.7 Waiters 24.8 Kitchenhands 27.6 Livestock Farmers 11.5 Security Officers and Guards 21.7 Livestock Farmers 23.1 Dril lers, Miners and Shot Firers 25.3 Cafe and Restaurant Managers 11.4
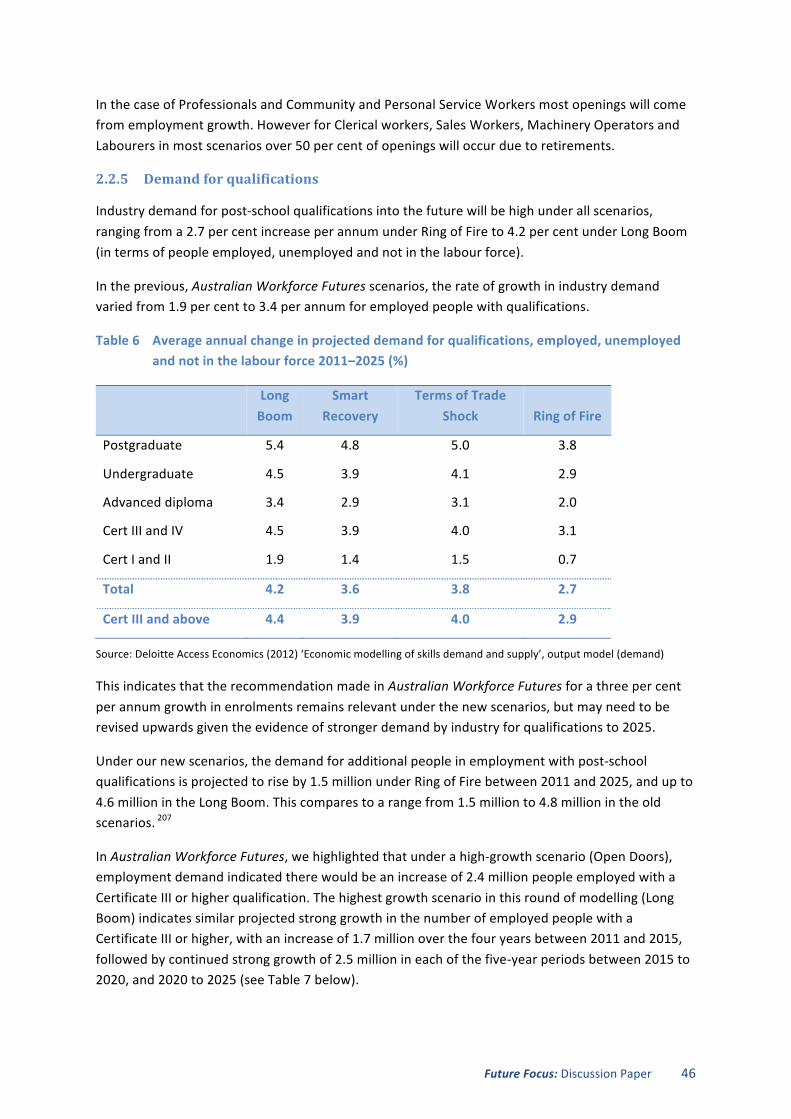
Future Focus: Discussion Paper 46
In the case of Professionals and Community and Personal Service Workers most openings will come from employment growth. However for Clerical workers, Sales Workers, Machinery Operators and Labourers in most scenarios over 50 per cent of openings will occur due to retirements.
2.2.5 Demand for qualifications
Industry demand for post-‐school qualifications into the future will be high under all scenarios, ranging from a 2.7 per cent increase per annum under Ring of Fire to 4.2 per cent under Long Boom (in terms of people employed, unemployed and not in the labour force).
In the previous, Australian Workforce Futures scenarios, the rate of growth in industry demand varied from 1.9 per cent to 3.4 per annum for employed people with qualifications.
Table 6 Average annual change in projected demand for qualifications, employed, unemployed and not in the labour force 2011–2025 (%)
Long Boom
Smart Recovery
Terms of Trade Shock Ring of Fire
Postgraduate 5.4 4.8 5.0 3.8
Undergraduate 4.5 3.9 4.1 2.9
Advanced diploma 3.4 2.9 3.1 2.0
Cert III and IV 4.5 3.9 4.0 3.1
Cert I and II 1.9 1.4 1.5 0.7
Total 4.2 3.6 3.8 2.7
Cert III and above 4.4 3.9 4.0 2.9
Source: Deloitte Access Economics (2012) ‘Economic modelling of skills demand and supply’, output model (demand)
This indicates that the recommendation made in Australian Workforce Futures for a three per cent per annum growth in enrolments remains relevant under the new scenarios, but may need to be revised upwards given the evidence of stronger demand by industry for qualifications to 2025.
Under our new scenarios, the demand for additional people in employment with post-‐school qualifications is projected to rise by 1.5 million under Ring of Fire between 2011 and 2025, and up to 4.6 million in the Long Boom. This compares to a range from 1.5 million to 4.8 million in the old scenarios. 207
In Australian Workforce Futures, we highlighted that under a high-‐growth scenario (Open Doors), employment demand indicated there would be an increase of 2.4 million people employed with a Certificate III or higher qualification. The highest growth scenario in this round of modelling (Long Boom) indicates similar projected strong growth in the number of employed people with a Certificate III or higher, with an increase of 1.7 million over the four years between 2011 and 2015, followed by continued strong growth of 2.5 million in each of the five-‐year periods between 2015 to 2020, and 2020 to 2025 (see Table 7 below).
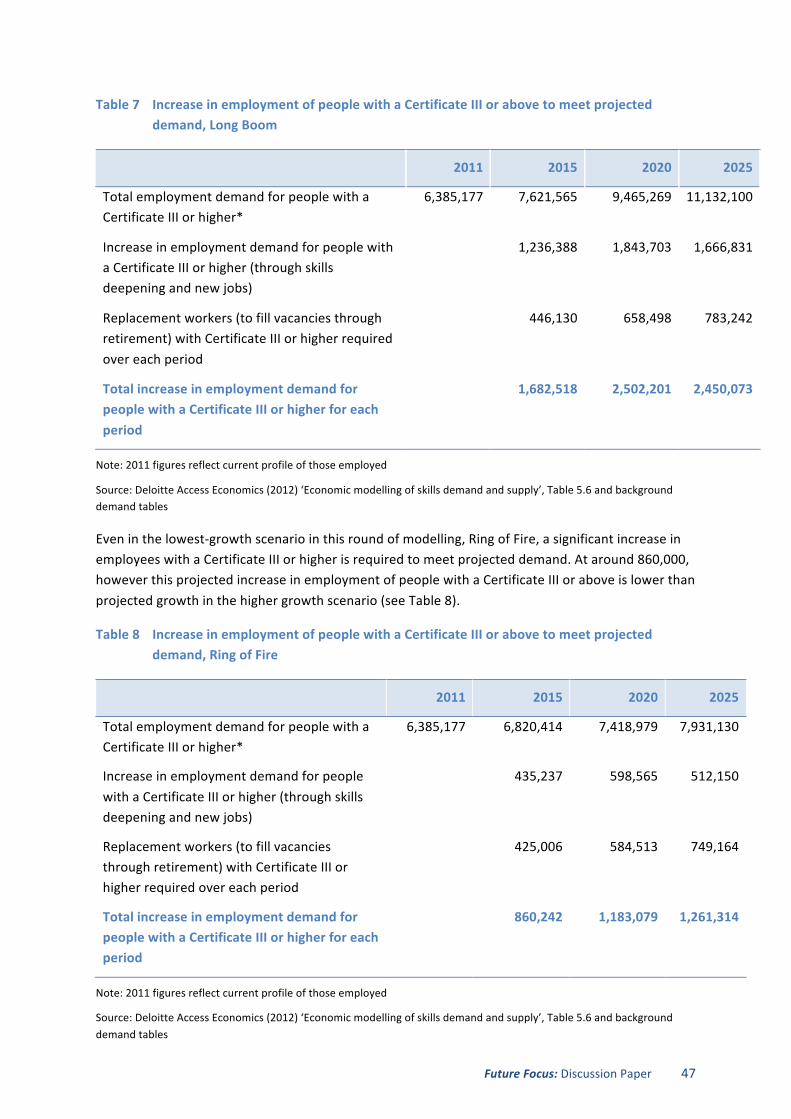
Future Focus: Discussion Paper 47
Table 7 Increase in employment of people with a Certificate III or above to meet projected demand, Long Boom
2011 2015 2020 2025
Total employment demand for people with a Certificate III or higher*
6,385,177 7,621,565 9,465,269 11,132,100
Increase in employment demand for people with a Certificate III or higher (through skills deepening and new jobs)
1,236,388 1,843,703 1,666,831
Replacement workers (to fill vacancies through retirement) with Certificate III or higher required over each period
446,130 658,498 783,242
Total increase in employment demand for people with a Certificate III or higher for each period
1,682,518 2,502,201 2,450,073
Note: 2011 figures reflect current profile of those employed
Source: Deloitte Access Economics (2012) ‘Economic modelling of skills demand and supply’, Table 5.6 and background demand tables
Even in the lowest-‐growth scenario in this round of modelling, Ring of Fire, a significant increase in employees with a Certificate III or higher is required to meet projected demand. At around 860,000, however this projected increase in employment of people with a Certificate III or above is lower than projected growth in the higher growth scenario (see Table 8).
Table 8 Increase in employment of people with a Certificate III or above to meet projected demand, Ring of Fire
2011 2015 2020 2025
Total employment demand for people with a Certificate III or higher*
6,385,177 6,820,414 7,418,979 7,931,130
Increase in employment demand for people with a Certificate III or higher (through skills deepening and new jobs)
435,237 598,565 512,150
Replacement workers (to fill vacancies through retirement) with Certificate III or higher required over each period
425,006 584,513 749,164
Total increase in employment demand for people with a Certificate III or higher for each period
860,242 1,183,079 1,261,314
Note: 2011 figures reflect current profile of those employed
Source: Deloitte Access Economics (2012) ‘Economic modelling of skills demand and supply’, Table 5.6 and background demand tables
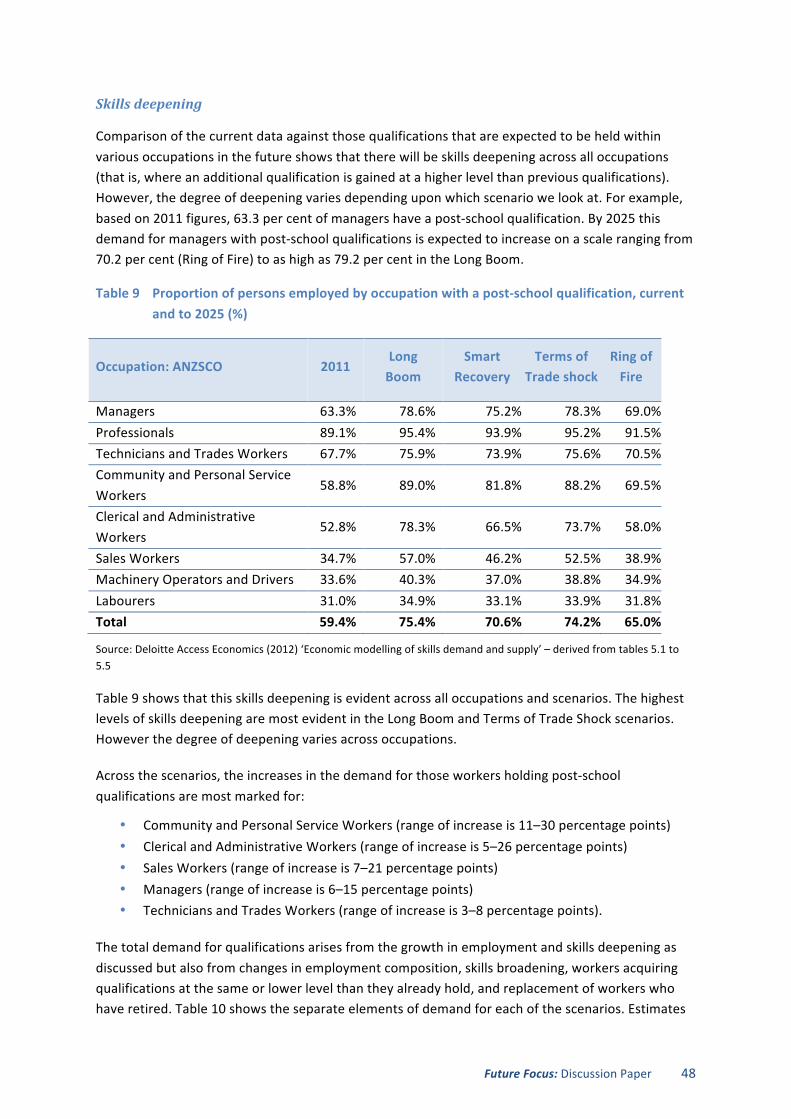
Future Focus: Discussion Paper 48
Skills deepening
Comparison of the current data against those qualifications that are expected to be held within various occupations in the future shows that there will be skills deepening across all occupations (that is, where an additional qualification is gained at a higher level than previous qualifications). However, the degree of deepening varies depending upon which scenario we look at. For example, based on 2011 figures, 63.3 per cent of managers have a post-‐school qualification. By 2025 this demand for managers with post-‐school qualifications is expected to increase on a scale ranging from 70.2 per cent (Ring of Fire) to as high as 79.2 per cent in the Long Boom.
Table 9 Proportion of persons employed by occupation with a post-‐school qualification, current and to 2025 (%)
Occupation: ANZSCO 2011 Long Boom
Smart Recovery
Terms of Trade shock
Ring of Fire
Managers 63.3% 78.6% 75.2% 78.3% 69.0% Professionals 89.1% 95.4% 93.9% 95.2% 91.5% Technicians and Trades Workers 67.7% 75.9% 73.9% 75.6% 70.5% Community and Personal Service Workers
58.8% 89.0% 81.8% 88.2% 69.5%
Clerical and Administrative Workers
52.8% 78.3% 66.5% 73.7% 58.0%
Sales Workers 34.7% 57.0% 46.2% 52.5% 38.9% Machinery Operators and Drivers 33.6% 40.3% 37.0% 38.8% 34.9% Labourers 31.0% 34.9% 33.1% 33.9% 31.8% Total 59.4% 75.4% 70.6% 74.2% 65.0%
Source: Deloitte Access Economics (2012) ‘Economic modelling of skills demand and supply’ – derived from tables 5.1 to 5.5
Table 9 shows that this skills deepening is evident across all occupations and scenarios. The highest levels of skills deepening are most evident in the Long Boom and Terms of Trade Shock scenarios. However the degree of deepening varies across occupations.
Across the scenarios, the increases in the demand for those workers holding post-‐school qualifications are most marked for:
• Community and Personal Service Workers (range of increase is 11–30 percentage points) • Clerical and Administrative Workers (range of increase is 5–26 percentage points) • Sales Workers (range of increase is 7–21 percentage points) • Managers (range of increase is 6–15 percentage points) • Technicians and Trades Workers (range of increase is 3–8 percentage points).
The total demand for qualifications arises from the growth in employment and skills deepening as discussed but also from changes in employment composition, skills broadening, workers acquiring qualifications at the same or lower level than they already hold, and replacement of workers who have retired. Table 10 shows the separate elements of demand for each of the scenarios. Estimates

Future Focus: Discussion Paper 49
by level of qualification are included in the DAE report. As a result of skills deepening and broadening a considerable proportion of employed persons hold more than one qualification.
Data from the ABS Survey of Education and Work shows that for every person who holds a postgraduate qualification, 91 per cent also hold an undergraduate degree, 24 per cent a Diploma and 20 per cent a Certificate.208 For every person who holds an Advanced Diploma or Diploma, 34 per cent also hold a certificate qualification.209 This reflects the important role that Diploma and Certificate qualifications play in providing both foundation and initial skills and knowledge which the workforce can then build on to take up higher level skills and jobs.
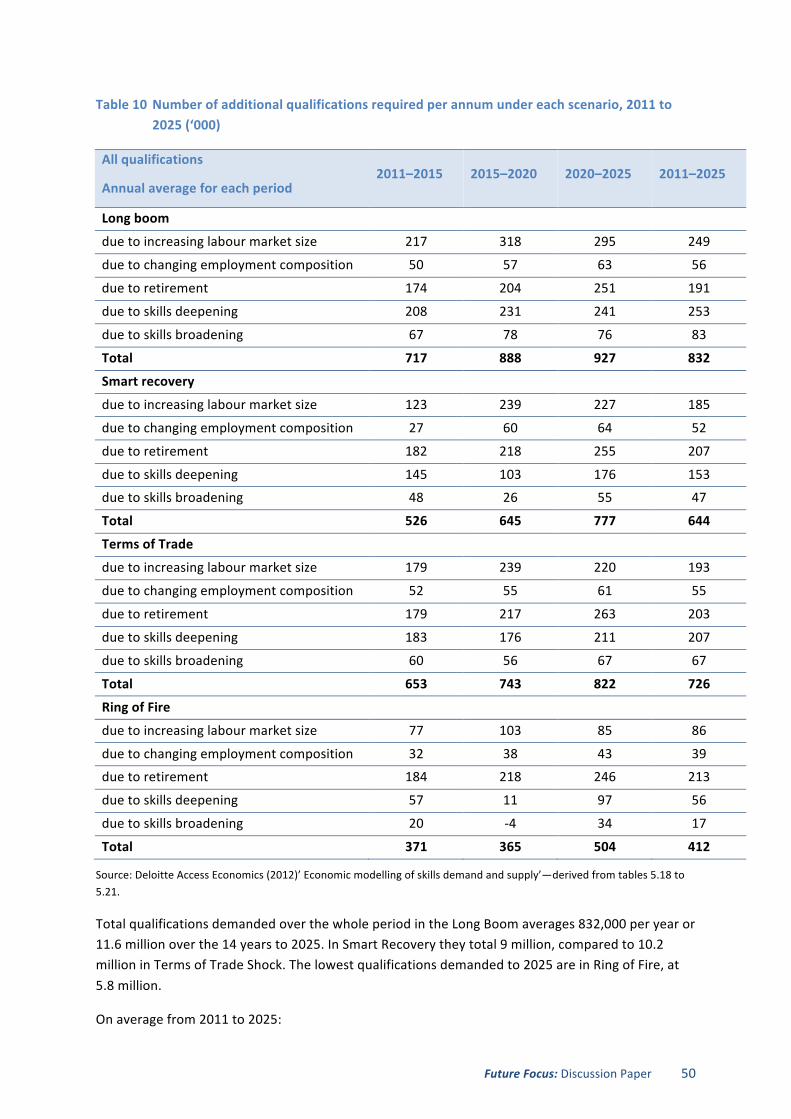
Future Focus: Discussion Paper 50
Table 10 Number of additional qualifications required per annum under each scenario, 2011 to 2025 (‘000)
All qualifications
Annual average for each period 2011–2015 2015–2020 2020–2025 2011–2025
Long boom
due to increasing labour market size 217 318 295 249
due to changing employment composition 50 57 63 56
due to retirement 174 204 251 191
due to skills deepening 208 231 241 253
due to skills broadening 67 78 76 83
Total 717 888 927 832
Smart recovery
due to increasing labour market size 123 239 227 185
due to changing employment composition 27 60 64 52
due to retirement 182 218 255 207
due to skills deepening 145 103 176 153
due to skills broadening 48 26 55 47
Total 526 645 777 644
Terms of Trade
due to increasing labour market size 179 239 220 193
due to changing employment composition 52 55 61 55
due to retirement 179 217 263 203
due to skills deepening 183 176 211 207
due to skills broadening 60 56 67 67
Total 653 743 822 726
Ring of Fire
due to increasing labour market size 77 103 85 86
due to changing employment composition 32 38 43 39
due to retirement 184 218 246 213
due to skills deepening 57 11 97 56
due to skills broadening 20 -‐4 34 17
Total 371 365 504 412
Source: Deloitte Access Economics (2012)’ Economic modelling of skills demand and supply’—derived from tables 5.18 to 5.21.
Total qualifications demanded over the whole period in the Long Boom averages 832,000 per year or 11.6 million over the 14 years to 2025. In Smart Recovery they total 9 million, compared to 10.2 million in Terms of Trade Shock. The lowest qualifications demanded to 2025 are in Ring of Fire, at 5.8 million.
On average from 2011 to 2025:
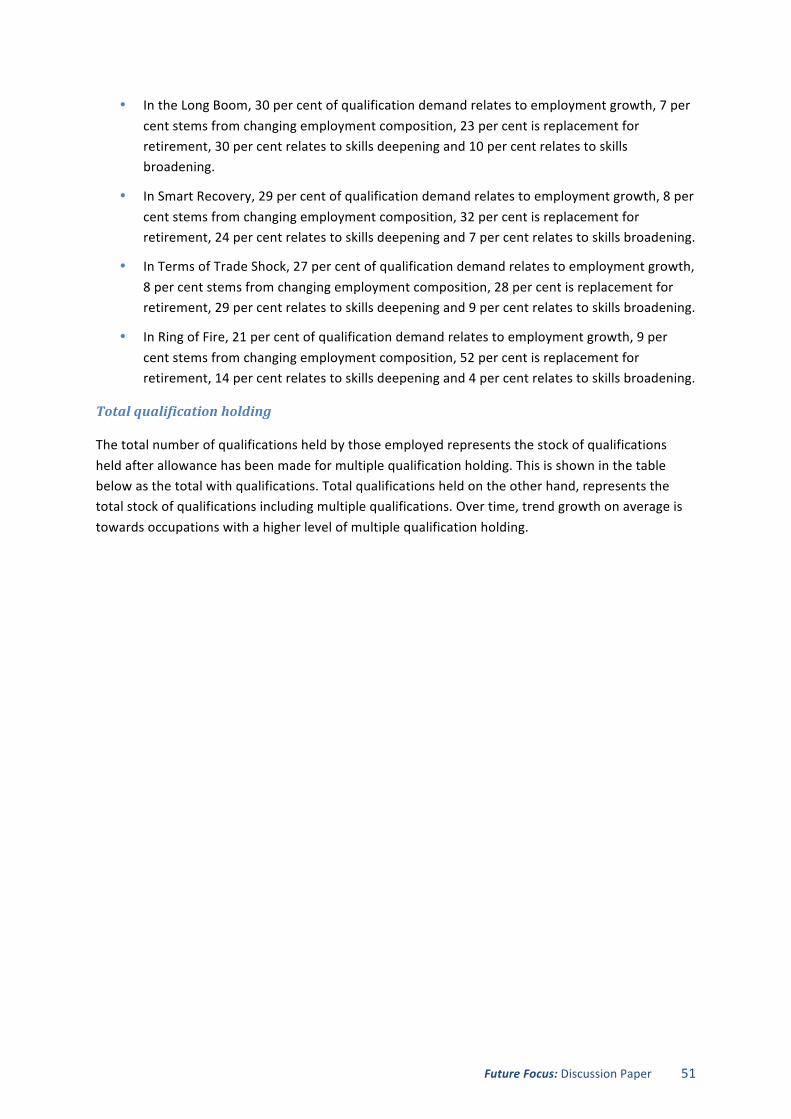
Future Focus: Discussion Paper 51
• In the Long Boom, 30 per cent of qualification demand relates to employment growth, 7 per cent stems from changing employment composition, 23 per cent is replacement for retirement, 30 per cent relates to skills deepening and 10 per cent relates to skills broadening.
• In Smart Recovery, 29 per cent of qualification demand relates to employment growth, 8 per cent stems from changing employment composition, 32 per cent is replacement for retirement, 24 per cent relates to skills deepening and 7 per cent relates to skills broadening.
• In Terms of Trade Shock, 27 per cent of qualification demand relates to employment growth, 8 per cent stems from changing employment composition, 28 per cent is replacement for retirement, 29 per cent relates to skills deepening and 9 per cent relates to skills broadening.
• In Ring of Fire, 21 per cent of qualification demand relates to employment growth, 9 per cent stems from changing employment composition, 52 per cent is replacement for retirement, 14 per cent relates to skills deepening and 4 per cent relates to skills broadening.
Total qualification holding
The total number of qualifications held by those employed represents the stock of qualifications held after allowance has been made for multiple qualification holding. This is shown in the table below as the total with qualifications. Total qualifications held on the other hand, represents the total stock of qualifications including multiple qualifications. Over time, trend growth on average is towards occupations with a higher level of multiple qualification holding.
Future Focus: Discussion Paper 52
Table 11 Total qualifications held by those employed ('000)
2011 2015 2020 2025
Long Boom Total employed 11,428 12,335 13,827 15,062 Total with qualifications 6,784 7,936 9,732 11,361 Total qualifications held 10,954 13,125 16,545 19,923 Average growth in period 4.6% 4.7% 3.8%
Smart Recovery Total employed 11,428 11,942 13,098 14,125 Total with qualifications 6,784 7,517 8,594 9,923 Total qualifications held 10,954 12,327 14,466 17,075 Average growth in period 3.0% 3.3% 3.4%
Terms of Trade Shock Total employed 11,428 12,175 13,309 14,253 Total with qualifications 6,784 7,783 9,135 10,497 Total qualifications held 10,954 12,848 15,481 18,273 Average growth in period 4.1% 3.8% 3.4%
Ring of Fire Total employed 11,428 11,750 12,268 12,688 Total with qualifications 6,784 7,194 7,527 8,247 Total qualifications held 11,428 11,750 12,268 12,688 Average growth in period 3.0% 3.3% 3.4%
Source: Deloitte Access Economics (2012) ‘Economic modelling of skills demand and supply’—derived from tables 5.6 to 5.13.
The DAE report shows that:
• Implied demand in the Long Boom by 2025 is projected to lead to 19.9 million post-‐school qualifications held by the 15.1 million persons employed, an annual average increase of 4.4 per cent from 2011. For qualifications at the Certificate III level and above, this rises to an annual average increase of 4.6 per cent.
• Implied demand in Smart Recovery by 2025 is projected to result in 17.1 million post-‐school qualifications held by the 14.1 million persons employed, an annual average increase of 3.2 per cent from 2011. For qualifications at the Certificate III level and above, this rises to an annual average increase of 3.4 per cent.
• Implied demand in the Terms of Trade Shock by 2025 is projected to lead to 18.3 million post-‐school qualifications held by the 14.3 million employed, an annual average increase of 3.7 per cent from 2011. For qualifications at the Certificate III level and above, this rises to an annual average increase of 4.0 per cent.
• Implied demand in Ring of Fire by 2025 is projected to result in 13.7 million post-‐school qualifications held by the 12.7 million employed, an annual average increase of 1.6 per cent
Future Focus: Discussion Paper 53
from 2011. For qualifications at the Certificate III level and above, this rises to an annual average increase of 1.7 per cent.
In addition, total qualifications demanded over time include both the qualifications required for those employed, and the expected increase in qualifications held by the ‘reserve’ labour force, given that a fully employed labour force includes people who are not actually employed at the time but who represent necessary excess capacity. This ‘reserve’ force comprises people who are not employed or not in the labour force but who hold post-‐school qualifications. The provision of such qualifications enhances their chances of participating in employment and may prove helpful for their broader inclusion in the community. Numbers for this group to 2025 range from 14,452 under Long Boom to 21,336 under Ring of Fire.210
2.2.6 Supply of qualifications
The supply of qualifications is based on two sources: domestic qualification completions and net overseas migration. Domestic qualifications supply in 2025 ranges between 601,895 in the Ring of Fire scenario and 677,039 in the Long Boom (see Table 12 below). The profile of qualifications is very similar across the four scenarios, with higher education (postgraduate and undergraduate) qualifications representing slightly more than one third of all completions and Certificate III and IV accounting for slightly less than 40 per cent.
The differences between the scenarios are driven by the varying age profile of the population, along with differences in the Year 12 completion rate, unemployment rate and real wage index. A capacity constraint has been applied to the Ring of Fire scenario given the fiscal challenges that this scenario would bring about. This has lowered completion numbers for Certificate I/II and III/IV qualifications that would otherwise show strong growth due to demographic influences.
Over the years 2006 to 2010, domestic student completions of Certificates I/II increased from 85,853 to 99,013. Completions at this level are projected to grow by an average of around 1 per cent per annum to 2025 in all scenarios. Around 41 per cent of people with this qualification level go on to obtain a higher level qualification. It is assumed the balance use this qualification to improve participation in the workforce.
The proportion of qualifications flowing from migration to 2025 ranges from 13 per cent under the Long Boom scenario to 5 per cent under Ring of Fire. In that scenario only 32,600 qualifications are projected to flow from net migration per year over the five years to 2025, reflecting the impact of an increased proportion of environmental refugees with lower skill levels. As noted earlier, government policy is that priority be given to domestic workers and their education and training.
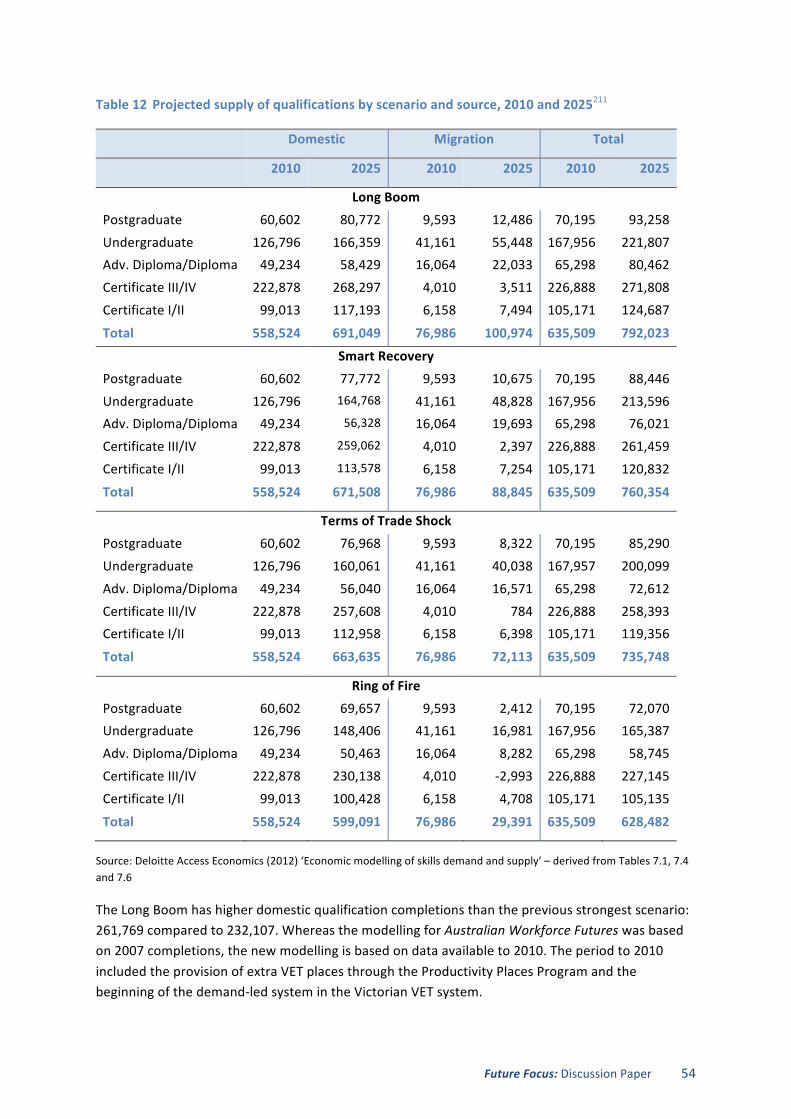
Future Focus: Discussion Paper 54
Table 12 Projected supply of qualifications by scenario and source, 2010 and 2025211
Domestic Migration Total
2010 2025 2010 2025 2010 2025
Long Boom Postgraduate 60,602 80,772 9,593 12,486 70,195 93,258 Undergraduate 126,796 166,359 41,161 55,448 167,956 221,807 Adv. Diploma/Diploma 49,234 58,429 16,064 22,033 65,298 80,462 Certificate III/IV 222,878 268,297 4,010 3,511 226,888 271,808 Certificate I/II 99,013 117,193 6,158 7,494 105,171 124,687
Total 558,524 691,049 76,986 100,974 635,509 792,023
Smart Recovery Postgraduate 60,602 77,772 9,593 10,675 70,195 88,446 Undergraduate 126,796 164,768 41,161 48,828 167,956 213,596 Adv. Diploma/Diploma 49,234 56,328 16,064 19,693 65,298 76,021 Certificate III/IV 222,878 259,062 4,010 2,397 226,888 261,459 Certificate I/II 99,013 113,578 6,158 7,254 105,171 120,832
Total 558,524 671,508 76,986 88,845 635,509 760,354
Terms of Trade Shock Postgraduate 60,602 76,968 9,593 8,322 70,195 85,290 Undergraduate 126,796 160,061 41,161 40,038 167,957 200,099 Adv. Diploma/Diploma 49,234 56,040 16,064 16,571 65,298 72,612 Certificate III/IV 222,878 257,608 4,010 784 226,888 258,393 Certificate I/II 99,013 112,958 6,158 6,398 105,171 119,356
Total 558,524 663,635 76,986 72,113 635,509 735,748
Ring of Fire Postgraduate 60,602 69,657 9,593 2,412 70,195 72,070 Undergraduate 126,796 148,406 41,161 16,981 167,956 165,387 Adv. Diploma/Diploma 49,234 50,463 16,064 8,282 65,298 58,745 Certificate III/IV 222,878 230,138 4,010 -‐2,993 226,888 227,145 Certificate I/II 99,013 100,428 6,158 4,708 105,171 105,135
Total 558,524 599,091 76,986 29,391 635,509 628,482
Source: Deloitte Access Economics (2012) ‘Economic modelling of skills demand and supply’ – derived from Tables 7.1, 7.4 and 7.6
The Long Boom has higher domestic qualification completions than the previous strongest scenario: 261,769 compared to 232,107. Whereas the modelling for Australian Workforce Futures was based on 2007 completions, the new modelling is based on data available to 2010. The period to 2010 included the provision of extra VET places through the Productivity Places Program and the beginning of the demand-‐led system in the Victorian VET system.
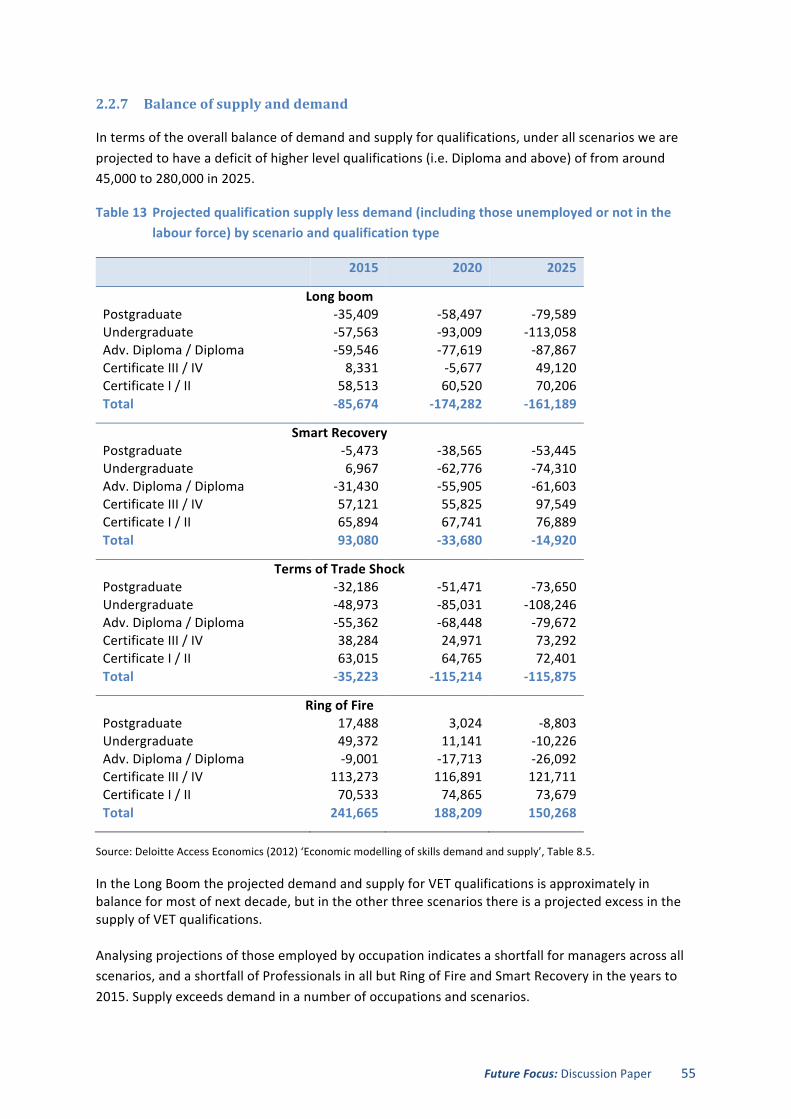
Future Focus: Discussion Paper 55
2.2.7 Balance of supply and demand
In terms of the overall balance of demand and supply for qualifications, under all scenarios we are projected to have a deficit of higher level qualifications (i.e. Diploma and above) of from around 45,000 to 280,000 in 2025.
Table 13 Projected qualification supply less demand (including those unemployed or not in the labour force) by scenario and qualification type
2015 2020 2025
Long boom Postgraduate -‐35,409 -‐58,497 -‐79,589 Undergraduate -‐57,563 -‐93,009 -‐113,058 Adv. Diploma / Diploma -‐59,546 -‐77,619 -‐87,867 Certificate III / IV 8,331 -‐5,677 49,120 Certificate I / II 58,513 60,520 70,206 Total -‐85,674 -‐174,282 -‐161,189
Smart Recovery Postgraduate -‐5,473 -‐38,565 -‐53,445 Undergraduate 6,967 -‐62,776 -‐74,310 Adv. Diploma / Diploma -‐31,430 -‐55,905 -‐61,603 Certificate III / IV 57,121 55,825 97,549 Certificate I / II 65,894 67,741 76,889 Total 93,080 -‐33,680 -‐14,920
Terms of Trade Shock Postgraduate -‐32,186 -‐51,471 -‐73,650 Undergraduate -‐48,973 -‐85,031 -‐108,246 Adv. Diploma / Diploma -‐55,362 -‐68,448 -‐79,672 Certificate III / IV 38,284 24,971 73,292 Certificate I / II 63,015 64,765 72,401 Total -‐35,223 -‐115,214 -‐115,875
Ring of Fire Postgraduate 17,488 3,024 -‐8,803 Undergraduate 49,372 11,141 -‐10,226 Adv. Diploma / Diploma -‐9,001 -‐17,713 -‐26,092 Certificate III / IV 113,273 116,891 121,711 Certificate I / II 70,533 74,865 73,679 Total 241,665 188,209 150,268
Source: Deloitte Access Economics (2012) ‘Economic modelling of skills demand and supply’, Table 8.5.
In the Long Boom the projected demand and supply for VET qualifications is approximately in balance for most of next decade, but in the other three scenarios there is a projected excess in the supply of VET qualifications. Analysing projections of those employed by occupation indicates a shortfall for managers across all scenarios, and a shortfall of Professionals in all but Ring of Fire and Smart Recovery in the years to 2015. Supply exceeds demand in a number of occupations and scenarios.

Future Focus: Discussion Paper 56
Care is needed in interpreting these data. The projections reflect the assumptions of the scenarios and need to be evaluated against them. For example the shortfall in the projected supply of Managers does not necessarily mean that there would be shortages of Managers, in the sense that vacancies would remain unfilled. There could be shortages in some specialised manager areas. But many managerial jobs can be filled with persons with a range of qualifications. The implication of a shortfall would be that some persons filling Manager jobs would be less qualified than would be the case if the assumptions of the scenario, especially those about skills deepening and broadening, had been realised.
Certificate III is also considered an entry level qualification for many industries. In this context the apparent oversupply of Certificate III and Certificates I/II could be seen as providing the first post school qualification and a pathway to qualifications in greater demand. Furthermore the interpretation of the data by level of qualifications needs to be seen against the COAG commitment of introducing a national training entitlement for a government-‐subsidised training place to at least the first Certificate III qualification.
The 40 per cent of Australians in work without the literacy skills required to effectively participate in the modern workforce is also a potential barrier to achieving the skills the Australia of the future needs.
As outlined in Australian Workforce Futures and again in this report, how skills are applied through improved work organisation and job design are just as important as increasing the supply of skills. Better use of employee skills and capabilities are a key ingredient in improving productivity. Therefore an increase in human capital through better qualifications can be used effectively to improve productivity in a high value economy.
2.2.8 COAG targets for persons 20-‐64 years
The projected demand for qualifications can be compared with government targets for higher education and the skills and workforce development COAG targets.
Several targets have been set for improvements in the proportion of the population holding qualifications. A comparison can be made between the demand for qualifications projected by Deloitte Access Economics and the target for persons aged 20 to 24. This target, which has been reaffirmed in the latest COAG National Agreement for Skills and Workforce Development, aims to:
Halve the proportion of Australians aged 20–64 years without qualifications at Certificate III level and above between 2009 and 2020. The target is 23.6% of Australians with these qualifications, based on the 2009 baseline figure of 47.1%.212
The COAG Reform Council reports the figure to have fallen from 47.1 per cent in 2009 to 45.4 per cent in 2010 (and ABS data show it to be 44.7 per cent in 2011).213
The COAG targets are expressed in terms of persons 20-‐64 who do not have at least a Certificate III qualification. In 2011, 55.3 per cent had a Certificate III qualification or higher. If the target is to be reached in 2020, then 76.4 per cent of persons aged 20-‐64 will need to have Certificate III or above. This is an increase of 21.1 percentage points in nine years.
An approximate estimate can be made of the increase in qualifications held by 20-‐64 year olds in the scenarios just discussed. In the Long Boom approximately 62.8 per cent (of all age groups) will hold a

Future Focus: Discussion Paper 57
qualification at Certificate III or higher in 2020, which is nearly 14 percentage points below the COAG target. The gap is wider for the other scenarios.
The Agency supports the entitlement of all Australians to achieve a Certificate III qualification and above. The challenge of the meeting the COAG target suggests the need for further efforts from all levels of government to coordinate in ways that will provide the skills that Australia needs in the future and to ensure that all skills gained can be used productively in employment.
Future Focus: Discussion Paper 58
Chapter Three: How do we get there? Achieving our vision
We define workforce development as:
Those policies and practices which support people to participate effectively in the workforce and to develop and apply skills in a workplace context, where learning translates into positive outcomes for enterprises, the wider community and for individuals throughout their working lives.
Our vision is to make sure that Australia’s growth potential is realised through a highly skilled and adaptable workforce where skills are used effectively to meet the increasingly complex needs of industry, and individuals are able to fulfil their potential.
To achieve this vision we need to ensure that:
• The skills needs for workplaces are being met and we have workplaces where skills are being used effectively.
• We address Australia’s productivity needs by enhancing a workforce development approach.
• The education and training system is forward-‐looking and meets the skills needs of industry.
• Enterprises are proactive in addressing their skills and workforce development needs.
• As many people as possible are participating in learning and work.
• Skills and workforce development responses are tailored to meet specific industry and regional needs.
In all scenarios we need to consider the role of various players in ensuring Australia has the skilled workforce it needs to respond to the future, including employers, governments, individuals and the education and training sectors, public and private. Intervening on the supply side is more straightforward for governments than attempting to influence what occurs within the ‘black box’ of industry, where commercial realities may impinge on decision-‐making to upskill staff, improve utilisation of existing workforce skills and address issues in recruitment and retention. While employers do invest significantly in training, more enterprises need to see skills development and utilisation as an investment rather than a cost.
Is it time for industry and government to explore alternative funding models? Industry, for example, could expand the cadetship model currently used by some organisations. This model ensures graduates obtain on-‐the-‐job experience. Government could explore tax-‐based funding models which may provide for a more effective, simpler system for funding enterprise training.
Policy responses will need to take account of new ways of working and of the growing likelihood of distributed and in some cases globalised workforces that could have employees situated in various parts of Australia or the world. In sourcing the skilled labour that industry needs, the first concern of policy is that employers source skills locally and/or ‘grow their own’. Alternatively, they may chose to ‘buy it in’ either through migration, outsourcing, long-‐distance commuting schemes or by establishing international offices. Our own graduates will also be more mobile, working across borders, both state and international.
Future Focus: Discussion Paper 59
3.1 The future of work and workplaces
The future is likely to bring about changes in work organisation and increasing demand for flexibility and mobility on behalf of employers and employees alike.214 In Australia, there are a number of identified trends that are anticipated to continue and accelerate over the next 40 years. These include: increased female participation, longer working lives, different locations of work, increasing levels of education and changing industries.215 Changing patterns of work are expected to include trends towards flexible knowledge workers, job auctioning and outsourcing of domestic duties.216 This is broadly in line with key trends identified in the scenarios.
The scenarios show that technology will influence workplaces of the future, although the speed of adoption may differ. Radical changes to manufacturing, such as 3D printing, are expected to revolutionise how products are developed. This could potentially halt and reverse the trend of outsourcing production to low cost economies and allow organisations to produce products close to where they are in demand and sold, thereby reducing barriers for small and medium enterprises.
Global mobility is expected to play an important role in hiring practices, as employers look internationally to recruit talented workers.217 The world of work will be increasingly diverse as improvements in technology influence where people live and conduct business. This may include virtual teams, outsourcing, international placements, contracting and job sharing, among other arrangements.218 The future of work will present firms with the opportunity to increase their skills and experience base, while workers can expect to have multiple careers during their lifetimes. For both, adaptability in the face of change is crucial. In the future, to what extent will individuals be responsible for their own skills, training and education as they move towards establishing multiple careers throughout their working lives?
While income security will remain important in a changing world of work, the notion of a single career is already losing currency in a world where a ‘job for life’ is largely a thing of the past.219 The linear progression of old career development models have ‘lost their potency’ as fewer organisations are in a position to offer lifelong employment in return for loyalty.220
We have over recent years seen increasing levels of part-‐time employment.221 Casual employment appears to have stabilised at just under a fifth of the total workforce.222 According to the ACTU report Lives on Hold, 40 per cent of the workforce is in a non-‐permanent form of employment, and one quarter of employees have no entitlement to sick leave or paid leave.223
People employed part-‐time are less likely to participate in work-‐related training than those employed full-‐time (62 per cent compared with 79 per cent).224 Casual workers are even less likely to participate in training. Of the nearly 60 per cent of casual workers who did not participate in formal learning in the previous 12 months, approximately one third also did not participate in work-‐related courses.225 At the same time, however, engaging in casual or part-‐time work may also help equip employees with a diversity of skills that they obtain through working in different jobs, across a range of skill areas, and within multiple occupations.
One and a half million Australians identified as self employed in the 2006 census.226 Around one million self-‐employed people are independent contractors.227 The Productivity Commission has estimated that between 26 and 41 per cent of contractors are in dependent contracting relationships.228 This suggests that many contractors are heavily reliant on a single client, making their work situation relatively insecure.229
Future Focus: Discussion Paper 60
When it comes to skills and training, the self-‐employed and independent contractors are a group that is often ignored. Many self-‐employed people have high skill levels. The 2006 Census indicates that 28.8 per cent of self-‐employed people have a Diploma or higher qualification, and that 26.5 per cent of non-‐Indigenous self-‐employed have a Certificate III or IV qualification.230 However this leaves a significant proportion of self-‐employed people with low skill levels. Unemployed people wishing to set up their own business can access training via the New Enterprise Incentive Scheme.231 Self-‐employed people can access funds for training from the National Workforce Development Fund via the relevant Industry Skills Council.232
Responding to the challenges of the future workplace
So in a future world of work with fewer certainties, how do we assist people to navigate the workplaces of the future? How is the education and training sector placed to respond to these shifts in employment? And do we have the right institutions in place for people’s career choices? The tertiary sector of the future needs to ensure that it is preparing students and employees for the challenges of rapidly changing workplaces, so that they can contribute to a firm’s productivity, make good use of their skills and manage their own ongoing learning, including use of information and communication technologies.
The implication of part-‐time and casual employees having less access to workplace training also needs to be considered, as it places greater responsibility on individuals to access education via institutions. However lack of time and energy can be a major barrier.233
This raises questions around how to upskill casual and part-‐time workers.
� Do we need more flexible delivery models or should a stronger case be made to employers around the upskilling of casual and part-‐time staff?
� Are the measures already in place sufficient to meet the diverse skills needs of the self employed and independent contractors?
Improving access to training for all staff could also be encouraged in the move to enterprise-‐led funding.
Given the rapid pace of technological change, there is also a risk that lags in our tertiary sector will become more apparent and Australia will need to become more responsive to vendor-‐driven training. All providers will need to interpret technological change more rapidly and roll out responses more quickly (e.g. within the renewable energy sector).
If training packages continue to be the mainstay of the vocational education and training system, we need to ensure that they are revised in a timely and responsive manner. Higher education will need to examine the industry relevance of its programs, while VET will need to be fluid enough to incorporate broader education principles. A ‘joined up’ approach to career progression is also important, including better articulated pathways between VET and higher education and between higher education and VET.
3.1.1 Building more productive workplaces
Harnessing the skills and capabilities of employees should be at the heart of strategies to improve productivity in the workplace. We need to maximise the investment made in skills and qualifications as part of meeting Australia’s productivity challenge. Strategies to improve the utilisation of
Future Focus: Discussion Paper 61
employee skills are important in achieving this aim. Having the right policy settings to achieve this is a challenge, and improving skills use requires buy-‐in from enterprises as well as effective leadership and management.
Better use of skills, better outcomes
Using skills and capabilities available in the workplace is just as important as skills development.
There are real business benefits for enterprises that endeavour to make the most of their employees’ skills. Benefits include improving retention (and therefore reducing costly attrition), improving productivity through innovation, and reducing costs through cutting down on wastage and improving processes.234 Employees benefit through increased job satisfaction, access to learning opportunities and career paths.
While the benefits of improving the use of employee skills are clear, the challenge is in how to facilitate workplace change to achieve this.
There are a number of levers that government can use to encourage employers to make better use of skills. Funding such as the new National Workforce Development Fund is one potential lever. The Fund is an opportunity for businesses to adopt a workforce development approach and for the skills of the workforce to be aligned with business strategy. Strategies could include conducting skills audits, reorganising work, and introducing ways of promoting better use of skills such as employee participation and greater autonomy at work.
Key challenges in leveraging government funding around supporting workforce development initiatives include the difficulties in measuring workforce development and skills utilisation. Better data on workplaces – such as how to define and benchmark improved skills utilisation – would help to improve the use of funding to achieve broader workforce development objectives.
Sharing of good practice is another role that government can take in supporting better use of skills. In analysing good practice case studies, Skills Australia identified critical success factors for improving skills utilisation and consequently, better outcomes for both employers and employees:
1. Leadership and management – encouraging and supporting staff, forward planning, managing the change process, providing opportunities for employees, maintaining accountability, transparency, and integrity
2. Organisational culture and values – supportive and inclusive workplaces with consistent values
3. Communication and consultation – active listening, involving stakeholders, encouraging staff to raise issues and discuss work
4. Good human resources practices – attracting, retaining and rewarding staff 5. Employee motivation – embracing diversity and valuing staff contributions
However making better use of skills is fundamentally a decision for within the workplace and the responsibility of employers, employees and their representatives.
Supportive management and leadership are identified as fundamental enablers in making skills utilisation work. Leaders and managers play an important role in supporting strategies to optimise the use of employee skills, but also in identifying the need for such strategies.235
Future Focus: Discussion Paper 62
Leadership and management for innovation
Limited policy attention has been given to the role of leadership and management skills in driving innovation. Organisational and workplace innovation is strongly influenced by management’s ability to nurture and tap into the skills of workers. The use of employees’ skills and knowledge contributes to productivity growth and the ability of organisations to absorb new ideas and technological innovation.236
The need to develop Australia’s management and leadership capabilities was recognised in 1995 with the Karpin Report, which made 28 recommendations.237 A government response was to introduce the Frontline Manager Program which had a significant impact in boosting leadership capability.238 This may be an area that could be revisited with further government action.
There remain significant gaps in the implementation of the Karpin recommendations, though some have been addressed by market forces, for example, the institution by business schools of industry advisory boards, practicum subjects, ‘executive in residence’ programs, placements and conferences.239 Uneven growth across different areas has caused areas such as leadership studies and strategic management to experience a lag in curriculum and staff development.240
There have been few Australian government workplace and innovation programs directed at strengthening management, leadership and organisational culture.241 Instead many programs focus on the supply side of the skills challenge or the technological or scientific aspects of innovation.242 An identified action area is to increase employee autonomy, involvement and learning at the enterprise level.
Consideration could be given to a holistic approach to improving management and leadership, skills utilisation and quality of work with a three pronged program:
1. Research: to address gaps in knowledge and maintain a relevant source of information and data. A funding scheme that invites private sector participation and research in this area could ease the cost of funding the research body and could capitalise on existing commercial interests in this area of consulting.243
2. Collaboration and dissemination: to facilitate cooperation and benchmarking and share expertise
3. Education and training: to maintain relevant, high quality education to meet ongoing industry and workplace requirements for future managers, including the trend towards more collaborative, flexible and inclusive management styles and workplace cultures. Continuing professional development could address changing conditions and demands as well as the rise of employees through the leadership ranks.244
3.2 Transitions between education, training and work
There is a need to facilitate better transitions from learning to earning in order to bridge the ‘experience gap’. As we have seen, Australia increasingly lacks ‘nurseries’ for new entrants to the workforce, and this is hindering the transition between education and work.
Young people who experience difficulties in their transition from school to full-‐time work risk prolonged periods of unemployment, a trend that is exacerbated in the case of early school leavers
Future Focus: Discussion Paper 63
and those who transition without part-‐time work.245 Research points to the need to target these disengaged young people to get them into employment as soon as possible after leaving school.246
VET in Schools programs have been shown to have a positive effect on the transition to post-‐school activities for early school leavers, particularly when linked to paid part-‐time work.247 By providing ‘real world’ experiences for school students, they give young people the benefit of exploring different career options.
School leavers who participate in a VET in Schools program and who leave school after completing Year 11 generally experience easier transitions than those who leave school after completing Year 11 without undertaking a school VET program.248 However, where a particular VET in Schools program is not directly linked to the workplace, such as transitioning into an apprenticeship or traineeship, pathways to work are less straightforward. Uptake of other transitional programs, such as school-‐based apprenticeships, also varies widely across jurisdictions.
Traditionally, apprenticeships and traineeships have served as ‘gateway’ programs into the world of paid work, enabling young people to gain the practical skills and work experience that they need to gain full time employment. Apprenticeships in the traditional trades tend to yield the best outcomes in terms of completion and employment, but these are strongly linked to the economic cycle.249 When times are hard, fewer apprenticeships are offered by industry, and apprentices risk losing their places during a downturn. Just over a quarter of non-‐completing trade apprentices in 2010 reported that they left their apprenticeship because they lost their job or were made redundant.250 Other factors influencing completion rates are the suitability of the applicant to undertake an apprenticeship and a ‘fair deal’ in what the employer offers: appropriate skills training, increasingly challenging work and responsibilities, good supervision and competency-‐based pay and progression.251
With increasing numbers of young people accessing higher education, there is also the question of whether apprenticeships suffer from an ‘image problem’ with parents and young people alike, with apprenticeships often considered ‘second-‐best’ to academic study, despite evidence to the contrary.252 In 2010, the median annual starting salary for new Australian bachelor degree graduates was $AU 49,000 for those aged less than 25 and in their first full-‐time employment253, whereas trade apprentices (of all ages) earned $52,500 per year on average in 2010 upon completing their training, and those in a non-‐trade area $45,900.254
Bridging the experience gap for novice workers
On the supply side, it is important to consider the needs of workers who are new to the workplace and who may need to bridge the gap between having the right skills and having the right experience for the job. Research shows that work experience is more important than ever. Employers continue to rank work experience above teamwork skills and emotional intelligence in workplace surveys, but below academic results and generic skills such as communication, interpersonal and analytical skills in terms of perceived importance.255
At the same time, employers feel that many current education programs are inadequate in building team skills, leadership skills, verbal communication and interpersonal skills.256 This raises the question of how teamwork and other employability skills might be integrated into formal education programs.257
Future Focus: Discussion Paper 64
There are also conflicting views of what employers want in a novice worker. Some employers recognise a role in developing novice workers but other employers ‘want novice workers to come ready-‐made with employability skills’.258 This means that workers new to the labour market face significant barriers in getting their ‘foot in the door’ and gaining access to employment opportunities.
Without employers willing to provide graduates with opportunities to gain skills and experience, novice workers may not be able to gain employment in their field of education and may face skills obsolescence. There may also be a knock-‐on effect in terms of return on investment in their education. From a broader perspective, their skills are not being utilised effectively in the economy and this may exacerbate future skills shortages.
Industry and education providers can both contribute to better understanding by promoting what they (the employers) want and what they (the education providers) can do to improve the opportunities for students to gain experience. However, more work needs to be done to transition graduates into the workforce. Actively seeking industry input regarding the types of skills and capacities expected of graduates will further arm students with a better understanding of employers’ needs.
The response of some education providers has been to adopt a matrix approach: building more generic skills while also acquiring competencies. If curricula and pedagogies are revised, there is not such a stark contrast between competencies and capabilities. This amalgamated approach could present a competitive advantage for Australia, positioning graduates to be more skilled for the challenge of today’s workplaces.
A further way of addressing this issue is to encourage employers and education providers to give students opportunities to gain formal work experience as a requirement of courses and programs to address the job-‐readiness of graduates. These initiatives are often referred to as ‘work integrated learning’ in the higher education sector and ‘work based learning’ in the VET sector. A number of qualifications already include industry partnerships and work experience components as integrated parts of the course. These can help students identify the relevance of theories taught in class, put these theories into practice, and improve their communication skills,259 and such programs are becoming increasingly common but they are expensive and time-‐consuming to run.260
Universities Australia has called for business to commit jointly with universities to enhance knowledge management and graduates’ work-‐ready skills, proposing a National Internship Scheme which will enable more Australian university students to undertake structured work-‐based learning in industry during their studies.261 A pilot which seeks to integrate study and work experience in a systematic way is currently being pursued by the Australian Technology Network of universities (ATN) in partnership with ACCI.262
Cadetship arrangements provide another model by which organisations can invest in the job-‐readiness of their future employees. Some organisations, such as BHP, have been using this model for many years. Arrangements vary from one organisation to another: some organisations (for example, Brisbane City Council) reimburse students’ HECS fees and provide subsidies for textbooks, while other models provide for one-‐off vacation employment within industry (La Trobe university, for example, provides scholarship funding for students in the faculties of science, technology and engineering to work in industry during vacations or for a full year).263
Future Focus: Discussion Paper 65
For those who are employed, the world of work provides countless learning opportunities and workplaces are dynamic places of skills transfer. Indeed people outside the workforce are increasingly at risk as the rate of change accelerates and they are excluded from exposure to developments such as new technologies not readily available outside of the workplace. This places a responsibility on providers to ensure that their students can undertake work integrated or work-‐based learning, have access to up to date equipment and technology, and gain a full understanding of the requirements of the workplace.
There is also a question whether job services should provide tailored services for new graduates seeking entry-‐level jobs to assist them to find an appropriate job for the qualification in which they and the government have invested.
However, governments and providers should not be expected to do all the work. As we established in chapter 1, there are pools of underemployed and disengaged youth in regions that are not otherwise lacking in economic opportunity. By the time these youth cohorts reach their mid to late twenties, this participation gap has almost disappeared.264 This indicates that more work needs to be done to understand this issue and to transition young people and new graduates into work.
� How can we ensure that graduates have skills that will be attractive to employers?
� What role could employers play in transitioning graduates to the workplace and providing skills for novice workers?
3.3 The future of the tertiary education and training sector
The higher education and VET sectors are pivotal to skills and workforce development. They underpin Australia’s capacity to grow skills that support industry need and provide sustainable futures for individuals. Not only do higher education and VET providers give students technical and job-‐specific skills, we also look to them to enable current and future workers to gain the knowledge base for their discipline and to develop a capacity for lifelong learning. As such they enhance and complement the critical experiential skills and workforce development that occurs on the job, within the enterprise.
The VET sector provides industry-‐designed programs for employment as well as developing core skills in areas such as literacy and numeracy and employability skills like problem solving and team work. Many VET sector and higher education providers work closely with industry to provide tailored training and workforce development solutions, some act as intermediaries in the job market, while others make substantial contributions to regional and community development. Some fulfil all three roles.
However questions remain about how best to ensure we retain the high levels of quality and responsiveness required to meet the anticipated demands of the future, to remain competitive in the global market, to take our place in the Asia-‐Pacific century and to build prosperity for all. Our tertiary sector must be well positioned, capable and clear in purpose. The increasingly critical role of employers in developing the skills of their workforce also needs attention.
The value of education in any nation will depend on the quality of what is being offered, the results achieved and the way skills and knowledge are applied.
Future Focus: Discussion Paper 66
� Are our training products and educational qualifications ‘fit for purpose’, one of the traditional tests for a quality product or service?
� Is our education and training being consistently delivered to a high standard?
In the context of this discussion paper, a key question is how effectively skills and knowledge are being applied in the workplace.
3.3.1 The value of qualifications: Do we have the right mix?
The value and suitability of qualifications for today’s workforce is an important question, particularly given the changing expectations of workplaces and individuals, changing technologies and changing skills profiles of industries and occupations. The boundaries between Australia’s education sectors are becoming increasingly blurred. This prompts the question whether the VET sector is at risk of being ‘topped and tailed’: with schools offering more lower level VET qualifications and higher education providers offering more Diplomas, bridging programs and associate degrees. At this point in our history, then, is it necessary to re-‐assess each sector’s role and purpose and/or the role of qualifications at certain levels?
� Do current VET qualifications continue to meet with the expectations of students and employers?
� Is evidence of skills mismatch in the training system a genuine cause for concern, or simply the inevitable outcome of individual choices and changing industry demand for skills?
Training packages
Training packages have evolved over time. Ongoing reforms to training packages have been undertaken to increase their flexibility and to ensure training packages provide the competency framework that will help learners gain the adaptive skills and knowledge required for the future world of work.265 This raises the question: how can we continue to develop and adapt training packages so they equip learners to deal with the future? Are training packages forward-‐looking enough or are they too grounded in current workplace competencies? Are they truly effective in achieving their aim of redefining competency to enable the transfer and application of skills and knowledge to new situations and environments?
In particular, are training packages, as some academics have argued, tied too much to specific occupational functions rather than broad areas of development? This is a pertinent issue, given the evidence of mismatch between qualifications and job outcomes in the VET sector. The Agency supports the role of industry in developing training packages, but also acknowledges that training packages need to be responsive and future-‐focused.
� Do training packages continue to be in line with employer and student needs?
Apprenticeships
Apprenticeships have a long history and provide an important pathway for skills formation, but given the rapid changes to technology, to industry needs, and expectations of employers and apprentices, will we still be using the same apprenticeship model in 2025? How do we ensure that apprenticeship pathways remain attractive for industry and individuals alike? And how might we tackle wastage in the apprenticeship system?
Future Focus: Discussion Paper 67
As identified in Skills for Prosperity, the non-‐completion of apprenticeships has long been an issue, resulting in costs for industry and wasted effort for individuals. Survey data shows that apprenticeship completers have better employment outcomes and higher incomes than non-‐completers.266 Moreover, the reasons given by apprentices for non-‐completion indicate that it is often due to avoidable factors, such as a lack of training recognition across state borders or the loss of a particular job role (despite the fact that another may be available).
An Expert Panel on Apprenticeship Reform was convened in late 2010 to look at reducing costs for industry, improving completion rates and promoting the benefits of getting formal skills qualifications. The Apprenticeships for the 21st Century review has identified areas for reform, with the Government aiming to streamline and harmonise laws and regulations for apprenticeships across jurisdictions to ensure that trainees who move between states can have their training recognised. Schedule 1 of the recently agreed National Partnership Agreement on Skills Reform endorses principles of harmonisation across national boundaries.267 A $100 million Accelerated Australian Apprenticeships package aims to address skill shortages by speeding up the supply of skilled workers into the Australian economy. The package will direct funds towards advancing apprentices as they gain required competencies while the $101 million Australian Apprenticeships Mentoring package will provide apprentices with career guidance and ongoing mentoring throughout their training.
� Beyond these reforms, is there anything more to be done to build a harmonised, simpler and more targeted national system for apprenticeships?
� How effective is the model requiring industry to provide workforce development plans and apprenticeship opportunities? Should industry be doing more?
VET in Schools
As we have already established in our discussion on the transitions of young people to work, VET in Schools plays an important role in helping make the leap from learning to earning. However, student outcomes show that some pathways are better articulated than others, particularly when VET in Schools is accompanied by staying in school for longer, working part-‐time, and building on initial qualifications by undertaking higher level qualifications and/or apprenticeships.268 When students terminate their study at the Certificate I or II level or undertake programs with low levels of workplace learning, VET in Schools is less effective in enabling youth transitions.269
Promoting better advice on pathways and careers may be one way to help students identify how to best use VET in Schools qualifications to maximise employment and learning outcomes.
� Given the varied approaches taken to VET in Schools by the jurisdictions is there merit in systematically identifying those models which are producing the best outcomes?
The Australian Quality Skills Authority is undertaking an audit of VET in Schools to ensure better quality, standards, consistency and oversight of programs in future.270
National Trade Cadetships (NTC) were announced as a mechanism to help provide a clearly defined pathway for young people into the trades, to be offered to students in Years 9 to 12 as an option under the national curriculum. The NTC scheme was due to be introduced in 2012, but has been postponed to 2013-‐14.271
Future Focus: Discussion Paper 68
New VET in Schools and apprenticeship programs have also been introduced to help young Indigenous Australians gain skills to help make the transition from school to work. These include the Indigenous Youth Career Pathways Program and Indigenous Ranger Cadetships.272
Lower level qualifications
While the focus of recent Government policy has been on higher level qualifications, it is important to assess the role and purpose of lower level qualifications. Foundation skills were identified as a vital platform for skills development in Australian Workforce Futures. Since that time we have seen some increased funding for foundation skills programs for people in and out of work and the new National Foundation Skills Strategy was recently endorsed by Ministers via COAG. Innovation and Business Skills Australia (IBSA) is also in the process of developing a training package for foundation skills, which is currently available for stakeholder comment.
However, there is ongoing debate amongst VET stakeholders about the value and purpose of Certificate I and II qualifications. Evidence suggests that the completion of lower level qualifications generates little benefit for the individual in terms of increased earnings. Yet they serve a strong role in providing foundation skills, as a potential stepping stone to higher level qualifications and for entry into the labour market. ABS data from the Survey of Education and Work shows that 67 per cent of those persons aged 25-‐64 who left school at Year 10 or earlier, but who have a Certificate I or II, had a job compared with 62 per cent of those without a qualification.273 Additionally, for some industries, such as the meat industry, the Certificate II remains the main entry point to many of their occupations. Lower level qualifications are also the mainstay of VET in Schools programs.
� What else can and should be done to address the challenge of improving foundation skills?
Higher level qualifications
Diplomas and Advanced Diplomas are considered important in many industries for training people at the technician and paraprofessional level.274 However in some occupations, such as nursing and podiatry, the Diploma has been supplanted by a degree. Further, although qualifications at the AQF 5 level have traditionally been used for higher technician and post trade training, increasingly these qualifications are being used for entry level programs, including as initial qualifications for school leavers (e.g. Childcare Diplomas). Also, as higher education attracts more of the potential pool of young learners could this weaken the intellectual basis of the training for trade and technician occupations?
� What is the role for industry in getting the qualifications it needs?
The Minerals Council of Australia has recently announced that it plans to launch national associate degrees in mining and geosciences in conjunction with four tertiary institutions to supply paraprofessional graduates to the industry to help stem skills shortages.275 This development raises the issue of the role of VET diplomas as a paraprofessional qualification.
Degree-‐level and postgraduate qualifications form the backbone of many occupations and their importance for a knowledge-‐based economy is clear:
The number of new university graduates indicates a country’s potential for assimilating, developing and diffusing advanced knowledge and supply the labour market with highly skilled and creative workers. KPMG Econtech estimated that achieving the Australian
Future Focus: Discussion Paper 69
government’s tertiary reform agenda in higher education would, by 2024, increase Australian GDP by 0.8% and employment by 0.4%.276
As we have seen, our scenarios and the modelling based on them shows growth in occupations such as health care and social assistance, education and training and professional, scientific and technical services. They also show growth in disciplinary fields that have a strong research component such as biotechnology, nanotechnology and environmental sustainability.
Science, technology, engineering and maths (STEM)
There is evidence we are slipping in terms of STEM subjects compared to our international competitors.277 This is undermining the ability of students to succeed in disciplines such as engineering.278 Current government policies to support STEM subjects in schools will take a long time to work through to tertiary sector enrolments and job-‐ready graduates. This will potentially affect the resources sector, manufacturing, the finance industry, education (including maths and science teachers) and computer applications including general ICT, electronic games and media. In particular, enrolments in the ‘enabling’ sciences (mathematics, physics and chemistry), along with agriculture, are ‘diminishing to an extent’,279 following on reduced enrolments in Year 12 science subjects:
Between 1992 and 2010 the percentage of the Year 12 cohort enrolled in Biology fell from 35.3 per cent to 24 per cent. For Chemistry the decline was from 22.9 per cent to 17.2 percent; and for Physics it was from 20.8 per cent to 14.2 per cent. Mathematics participation declined from 76.6 per cent to 72.0 per cent between 2002 and 2010, and there is a continuing shift from intermediate and advanced levels of mathematics to the elementary level.280
In the future, demand for high-‐tech manufacturing and other innovations will require a strong base of science and technological capability. We will need to ensure that we have sufficient STEM skills to meet these expectations.
Qualifications in the tertiary sector that require advanced mathematics and physics are also feeling the impact of the decline in STEM subjects and levels in senior high school:
A continuing concern for engineering faculties in universities is the need for commencing students to have high levels of attainment in mathematics and science, and the perceived inadequacy of secondary schools in providing such tuition for the majority of students. This view is shared by other stakeholders in the VET sector. The Electro Communications and Energy Utilities Industry Skills Council, EE-‐Oz, argues that secondary education is failing to provide the foundation skills required by trade apprentices in mathematics and science.281
Both VET and higher education can be expected to benefit from the provision in the 2012 budget for $54 million over four years to increase participation in STEM subjects in schools and universities.
In the VET sector partnerships with industry are essential to enable providers to specialise in leading-‐edge technologies and facilitate easy access of vendor-‐driven training. This will need to be closely aligned to new and emerging industries. Whether the VET system is adequately placed to address this need is an important issue.
Future Focus: Discussion Paper 70
In further developing policy to address the issue of STEM studies in the tertiary sector, questions arise as to whether there could be a larger role for employers, perhaps through peak bodies and professional organisations, and how universities could develop strategies to attract more students into these disciplinary areas.282
� Will our capacity in the STEM subjects be sufficient for the science and technology needs of the future?
Other training products
Skills development can take many forms and formal qualifications are often only part of the story. Private arrangements that do not draw on current registration and accreditation frameworks are a growing part of the education and training landscape, particularly in the case of on-‐the-‐job training.283 Learning on the job and through short courses builds skills, often of direct relevance to job performance. Anecdotal evidence suggests that many employers favour short courses, including ‘just in time’ training which provides ‘bite size chunks’ of education. Even within universities, enrolments in executive programs have risen faster than undergraduate degree programs.284
There is evidence that informal training, short courses, structured workplace training and skill sets are making a growing contribution to workplaces.285
� In meeting the needs of employers, are skills sets also meeting the needs of individuals to gain transferable qualifications?
Clearly, the role of non-‐accredited and informal training needs to be better understood, particularly where training is delivered in response to new and emerging industries and technologies, and where the speed of course development may be holding back the provision of accredited training. More robust data is needed for this part of the sector to assist in planning for the future workforce.
3.3.2 Ensuring quality in the tertiary sector
Australia’s education system is perceived internationally to be of high value and high quality. However, we cannot afford to be complacent. Moving beyond ‘above average’ to excellence is an important pursuit if Australia is to grow and prosper. Lifting standards, monitoring their implementation and continuing to improve quality is essential. Ageing infrastructure is another issue of concern affecting the quality of the offer to both domestic and international students.286 For the VET sector, having access to up to date labs, commercial kitchens, workshops and equipment is always a challenge.
Dents in reputation in both higher education and VET also need to be addressed. These include allegations about soft marking in awarding of assessment grades to international students in higher education and concerns about highly variable outcomes in both sectors. Governments and individual institutions have taken steps to address these threats to Australia’s reputation and to ensure that individual students, employers and the community have confidence in the outputs and outcomes of all the education and training sectors. These steps include the trialling of external independent validation of assessments as specified in the 2012 COAG National Agreement and Partnership.
The teaching workforce
In all education sectors the quality of the teaching workforce is a critical issue that deserves ongoing attention. Research shows that quality of teaching is the most important factor in lifting education
Future Focus: Discussion Paper 71
outcomes.287 Yet in the university sector, teaching and learning are sometimes seen to be of lesser importance than research which brings greater prestige and standing to academics and attracts more funding via research grants. Research outputs are also ‘worth’ more to international university rankings than teaching inputs, contributing to the pressure on academics to ‘publish or perish’.288
However, a lack of attention to pedagogy in universities is a contributor to student non-‐completion. Australia leads the world in pedagogical innovation in some areas, such as distance learning, English-‐language testing and work-‐integrated learning.289 Yet currently one in five students does not complete their university studies.290 While teaching quality is only one factor in student attrition, alongside financial, family and social issues, it is not one that should be overlooked in addressing the issues that students face in coping with study commitments and the university environment.
Australia’s relatively large higher education class sizes may also have an effect on completion rates. Higher student-‐staff ratios have been associated with declining student outcomes, and it may be difficult to improve education quality while student-‐staff ratios remain high.291 Australia is at the OECD average for base expenditure on teaching and learning in tertiary education, but would require a 20 per cent increase in this funding to rank in the top 20 per cent of OECD countries.292
� Could incentives be better targeted to bring about quality outcomes in teaching as well as research activities?
� What would it mean for Australia’s innovation capacity if our students were not being taught by research-‐active (or at least research-‐aware) staff?
As the student cohort increases so the range of student needs will expand and the capability of the education and training workforce will need to be nurtured, including in the use of technology to support new ways of learning and working. Though most large providers work across states and territories, and increasingly across borders, there is a need to increase this supply, and potentially with colleagues who are based overseas.
In both VET and higher education there is an ageing workforce and attracting, retaining and rewarding capable and committed teachers must be a priority to ensure quality teaching.293 In both sectors casualisation is a strong feature and, unless well managed, could affect quality. Coates and Goedegebuure note that academic workforce data are not conclusive but estimate that at least 20 per cent and up to 40 per cent of the academic workforce is sessional.294 The Productivity Commission also found high levels of casualisation in the VET sector,295 with up to 60 per cent of trainers and assessors in the TAFE sector in 2008 employed as casuals or under fixed-‐term arrangements, and one third in the non-‐TAFE sector.296 Employing sessional staff may be advantageous in the VET sector, bringing high levels of industry currency and up to date knowledge. In the higher education sector, sessional staff are often PhD students with research currency, for whom the teaching experience can be invaluable. However there are potential concerns with quality and student access to casual staff.297
Another issue of concern is the lack of teaching qualifications among university academic staff. Most universities have in place a professional learning framework and encourage staff to undertake professional development ranging from short workshops to formal qualifications such as the Graduate Certificate in Tertiary Education. Whilst the Southern Cross University has made the Graduate Certificate in Academic Practice mandatory for all new academic staff298, this type of mandatory requirement is an exception. In a recent survey conducted by the Centre for the Study of
Future Focus: Discussion Paper 72
Higher Education at Melbourne University, more than 70 per cent of academics indicated that teacher training was not mandatory at their institution.299
Skills for Prosperity raises the issue of variable quality in the delivery of the Certificate IV in Training and Education (TAE). The Productivity Commission recommended maintaining this qualification as high risk, with more intensive auditing of the RTOs that offer it. While the National Skills Standards Council agreed in 2011 to progressively reduce the number of VET practitioners working under supervision and without the Certificate IV in TAE, it would be helpful to more strongly progress the recommendations of the Productivity Commission and Skills for Prosperity in relation to the VET workforce.
A further recommendation of Skills for Prosperity that has not been addressed is for investment in support programs for disadvantaged learners, with a total growth in funds of $801.6 million recommended by 2025.300
� Should formal teaching qualifications be a requirement for staff with teaching responsibilities in universities, as is the case in the VET sector?
Moving from supply-‐driven to demand-‐led funding
The shift to demand-‐led funding is possibly the single most important policy initiative affecting the supply of skills. In recent years, this has included the establishment of demand-‐led funding for higher education and, most recently, the acceptance through COAG of a national training entitlement for VET. Some states have already gone down this path, for example in Victoria and South Australia.
Skills Australia has supported the introduction of demand-‐led funding but considers that it should have been delayed until effective quality assurance and external validation of assessment is in place. It is also recommended that governments will need to guard against an over-‐ or under-‐supply through caps on student enrolments and incentives based on occupations in need, such as specialised occupations.301 The impact of demand-‐led funding on the supply of skills needs to be monitored to ensure that individuals are gaining useful education and skills and that industry is able to recruit the skilled workers it needs.
Demand-‐led funding for students
While it remains premature to comment conclusively on the impact of demand-‐led funding for students, early indications show the introduction of this approach may have contributed to increased student enrolments. In higher education, domestic enrolments increased by 5.3 per cent to over 857,000 between 2009 and 2010.302 The Minister for Tertiary Education, Skills, Science and Research also highlighted at a recent conference that approximately 220,000 university offers had been made by March 2012, representing an increase of more than 4 per cent on 2011.303 Publicly funded VET enrolments increased by 5.4 per cent to almost 1.8 million between 2009 and 2010 and by a further 4.6 per cent to almost 1.9 million in 2011.304
In this increasingly competitive environment it will be essential to maintain high quality provision and enrolments in the fields where graduates are required. Quality concerns largely centre on ensuring: adequate funding, especially per student hour; necessary supporting infrastructure; accessibility to information for students; transparency in the system; maintenance of standards with a focus on completions; teacher training; and effective regulation, including external validation of assessment.
Future Focus: Discussion Paper 73
Accommodating large growth in enrolments requires significant investment in teaching and support staff, as well as facilities and technology.305 In Australian Workforce Futures we called for additional funding of 3 per cent per year to 2025 to meet the projected need for growth in tertiary enrolments. Whilst nominal funding for higher education and VET continues to increase, evidence shows that base funding for universities per student has fluctuated over time, remaining today well below 1994 levels,306 and VET funding per hour fell by 14 per cent between 2006 and 2010 on 2010 prices.307 In VET especially, continuing decline in funding per student contact hour is likely to affect quality and the provision of support for individuals with major learning needs.308
In this context, the National Agreement for Skills and Workforce Development signed in April 2012 included among its agreed reform directions 'enable public providers to operate effectively in an environment of greater competition, recognising their important function in servicing the training needs of industry, regions and local communities, and their role that spans high level training and workforce development for industries and improved skill and job outcomes for disadvantaged learners and communities'. TAFE Directors Australia recently issued a National Charter for TAFE which suggests four principles for how the public provider can operate in an increasingly contestable environment. These include recognition of TAFE’s ‘full service role’ especially in regional and rural Australia.309
The future tertiary sector needs to ensure that the clients in an entitlement system have adequate information to distinguish between providers to inform choice. The establishment of the My University and My Skills websites are steps towards achieving transparency. However, the My University website does not offer substantial information on the quality of outcomes provided. The new National Agreement states that the My Skills website (due to be launched in mid 2012) will include data on quality of providers, prices, government support, and labour market information.310 Unlike the higher education sector, ASQA may not make individual audit outcomes for registered training organisations (RTOs) publicly available. Most VET providers do not publish information about their completion rates or student outcomes, such as job success and access to further study. Many do not even provide their fee structures.
In the higher education sector it is expected that uncapping student places will lead to an increase in students from low socioeconomic status backgrounds and more students entering with lower Australian Tertiary Admission Ranks (ATAR). Without appropriate support there is the risk of ‘churn’ and non-‐completion of qualifications. However, it is also important that assessment and graduation standards remain aligned to the expectations of learning outcomes.311 In the VET sector, which is characterised by low completion rates, adequate funding is required to provide the mentoring, tutorial and other support necessary to achieve completion. Low funding levels may also encourage providers to concentrate effort on high-‐volume/low margin approaches. In the higher education sector, ‘universities should be supported in meeting the additional costs of teaching able but underprepared or disadvantaged students’.312
As we move to more market-‐oriented approaches, regulatory arrangements need to safeguard the quality of education and ensure that it is not compromised as the sectors expand.313 In both sectors it will be essential to ensure that only genuine, high quality providers are licensed to operate and that they can demonstrate that they meet standards and provide adequate learning outcomes for their qualifications. TEQSA and ASQA have been established to undertake this role nationally, but despite a recent increase in ASQA’s funding, there remain concerns about the adequacy of its resourcing, given the scale of its task.314 There is also the issue of monitoring the ongoing
Future Focus: Discussion Paper 74
implementation of policy by these bodies, given delays in financing and to priorities such as the national integration of VET, the integration of VET and HE regulations, and extending the Australian Students Tuition Assurance Scheme (ASTAS) to all providers.
Ensuring enrolments are occurring in the fields where graduates are required may be problematic from the perspective of skills needs, as a range of qualifications are often acceptable for an occupation. Analysis by the National Institute of Labour Studies (NILS) suggests that it will be easier to estimate the inflow of graduates into the occupations that typically require higher education qualifications, as they generally have a better match between field of training and field of employment.315 However, there is also a risk for students studying courses for which there is insufficient demand in the labour market, particularly where the skills learned are not transferable to other industries or occupations. The analysis by NILS suggests that Certificate level qualifications may equip workers with broader skills that are transferable to a range of occupations.
As an example of issues in matching supply and demand in a demand-‐led system, the number of government funded students in creative arts in Victorian VET increased by 32.7 per cent between 2008 and 2010, the second highest growth in all fields of education.316 Yet research shows that only a small number of creative arts graduates, especially those in communications and media studies, are employed in the same occupation as their training course.317 The oversupply of fitness instructor training in Victoria is now almost legendary. The Victorian government has acknowledged these problems and responded by announcing strategies to better manage the market and to provide a sharper focus on quality.318
In higher education, concerns are also being expressed about the future of some disciplines as students gravitate to more popular courses. Analysis over time of the ATAR required for acceptance into courses will provide a useful indication of whether specific degrees are becoming more or less desirable; the degree to which information on shortages is filtering to prospective students; and how the university system is handling change and producing graduates that meet future skills needs.319
In an increasingly demand-‐led VET system, it is essential that a focus on completions be maintained so that students don’t ‘waste’ their entitlement, especially where there may be limitations in accessing subsidised training. Improving completions in both sectors requires significant effort in pre-‐enrolment services, such as career advice and access to quality course and labour market information, as well as adequate student support throughout the course. These services require increased investment.
Funding for enterprises
Specific funding is being introduced for enterprises to help put industry at the heart of the skills system. The National Workforce Development Fund will provide $558 million over four years to industry to support training and workforce development in areas of current and future skills need.
The Fund will require co-‐investment from industry, recognising the shared responsibility for training between the Government and industry. This model permits industry to drive the delivery of the training to ensure that it responds to the needs of the business, and delivers the outcomes desired by industry. The new Australian Workforce and Productivity Agency will determine the priorities of the Fund.
Future Focus: Discussion Paper 75
Should we also explore alternative forms of incentives for industry training? For example, research and development in Australian organisations is funded via a tax deduction of 150 per cent for industries with a turnover of less than $20 million, with a reduced rate for enterprises above that level.320 Could a similar arrangement work for funding industry training, and would it be simpler for organisations to access and government to administer?
We need to ensure that independent contractors and the self-‐employed, in particular, are aware that they can access training in general small business skills, for example, through the National Workforce Development Fund. Information should be provided through channels that such people would access, such as industry magazines.
3.3.3 Priorities for a capable and responsive education and training sector
As we have seen, modelling based on our scenarios supports an ongoing emphasis on high level skills and a need for continued investment. Additional government funds have been budgeted to support the demand based approach in higher education but growth in funding for VET is less assured. Without sufficient funding, in both the higher education and VET sectors, there is a risk of either not meeting Australia’s future qualification needs, or lowering the quality of education and training.
The roles and responsibilities of the different levels of government also need to be addressed. Spending, regulation and associated legislation in areas ranging from industrial relations to urban planning remain to be resolved, with improving coordination between the Commonwealth and state and territory authorities an important challenge. Identifying these roles as a condition of further enhancement is one approach that could be taken to address these barriers to reform.
There is an important question around how to best achieve an appropriate balance between standards and flexibility. National standards and accreditation processes for qualifications, as well as industry standards for curricula and training packages, are important for quality and consistency. However local level initiatives are important to ensure that innovation, responsiveness and creativity occurs.
� How can we best establish where standards are required across institutions?
� How can we leave room for educators to develop curricula and learning processes that are innovative and that foster skills for innovation among students?
� Is the best approach to create standards around outcomes but for there to be flexibility in process and how to get there?
Capabilities and competencies
The transition to a knowledge based economy creates greater demands for theoretical knowledge and transferable skills beyond practical application and specific competencies for particular jobs.
Some academic commentators have argued that Australia has developed the notion of competence underpinning competency based training (CBT) to its full potential and that a new concept is needed so that vocational education is better able to prepare students for the future world of work.321
Workers of the future will increasingly be required to exercise judgement and contribute to innovation. One study recommends that VET should therefore prepare students for occupations within loosely defined vocational streams rather than workplace tasks and roles associated with
Future Focus: Discussion Paper 76
particular jobs.322 The authors emphasise that this is more than developing generic and employability skills. Rather it is about recognising the depth and complexity of theoretical vocational knowledge, as a core component of capability. They suggest:
The conceptual basis of qualifications will need to move from training people for specific workplace tasks and roles to a focus on the person and their development in preparing them for a broad occupational field.323
Yet many employers seek ‘job ready’ employees and would be concerned at a possible diluting of specific practical skills and CBT.
� How best then to build generic skills and theoretical knowledge and the ability to apply that knowledge in the workplace to a range of problems while also producing workers who have the practical skills that enable them to quickly come up to speed in the workplace, assuming reasonable induction training?
This also raises the question of the role of employers in providing job specific training. Though few would argue against the proposition that employers have a key role in developing their workforces, complaints from employers about inadequate preparatory education and training persist.
Engineering better connections
To meet future demand for high-‐level qualifications and skills and to maximise opportunities for students, progression between the VET and higher education sectors needs further simplification. The move to a more integrated tertiary sector is agreed national policy but hurdles and barriers persist.
Though individual providers can often broker successful pathways, differences in funding regimes, governance structures and accountability requirements between the sectors tend to handicap attempts at closer integration. Even dual sector institutions must deal with two sets of funding, quality and reporting regimes. Several commentators, most recently RMIT Vice Chancellor Margaret Gardner, have argued that effective tertiary connections are unlikely to be realised unless the funding, policy and regulation divide between the two sectors is addressed.
Anomalies also persist. For instance while universities are able to gain access to government funding for their VET provision, there is limited access to public funding for VET providers, including TAFE Institutes, delivering higher education qualifications. TAFE Directors Australia (TDA) has argued that more Commonwealth funding is needed to support the growth of degrees in VET.
The role of employers, industry and professional associations in brokering better pathways between the sectors is a strategy that may warrant more discussion The ‘3D project’ has developed a model to support this kind of approach, bringing industry and education providers together to address the concerns of employers to fill occupational gaps. As yet, however, the project appears to have had little take up.324
Lifelong learning
Literacy and numeracy will continue to be fundamental requirements for the future, but there also needs to be a policy focus on lifelong learning. Individuals are working longer and pursuing multiple careers, resulting in more ‘transitional’ stages between learning and work. The implications for skills development are apparent, in that we should not only be emphasising ‘early’ skills, but also provide
Future Focus: Discussion Paper 77
flexible pathways to and from adult learning. Adult skills are also needed in providing support to ‘on-‐call’ careers later in life.
In its current design, the Australian tertiary education system’s pedagogy and processes are focused on providing entry level training, but working lives are becoming longer and the nature of the skills demanded are changing faster than before. Employability should be thought of as including the ability to retrain for a new or dramatically changed occupation and an employee’s ability to secure advancement and promotion.325
The purposes, mode of delivery and learning process of lifelong learning are different to those of people preparing to enter a profession for the first time. By definition, the term encompasses all the learning people acquire as they think, act, work and interact. Thus, continuing education extends beyond institutional learning to promoting targeted approaches to skills development and is more likely to be supported by both workplace-‐based practitioners and teachers, involve work and study activities and emphasise individuals’ learning.326 Increased recognition of prior learning and wraparound support services also play an important role.
High-‐level skills and the Asian century
As we have seen, all scenarios have in common the need to build skills for business engagement with Asia to ensure that we can fully participate and keep pace with our neighbours. For Australia to become ‘Asia literate’, our population will need to develop high-‐level skills in language, culture and ways of doing business in Asia. The Asialink Asia Capable Workplace Taskforce, which is made up of senior business leaders, has developed a framework for building capability and is calling on the education system and Australian business to invest in developing in the skills and capabilities of their staff to progress Australian business opportunities in Asia. This would involve establishing mechanisms to build awareness and galvanise action in the business community.
To develop the necessary skills, we need more Australians to study in Asia. Our universities should encourage students to attend their Asian campuses and promote flexible degrees which incorporate study overseas. Government could facilitate this by extending HECs loans to cover living expenses of students studying in Asia.327
Although countries such as China and India are rapidly developing new educational institutions, the scenarios show that they will struggle to meet demand. This means continuing scope for Australia to attract high quality students from Asia who are not able to gain access to university study in their own country. Facilitating greater engagement of students from Asia to study in both VET and higher education will add to the skilled workforce both here and in the country of origin and build Australian education as a valuable and well regarded export industry. Since Australia first engaged in international education under the Colombo Plan, which was designed to build bridges in the region, graduates have gained senior posts in many countries which have built ties to Australia.
Australia’s advantages as a place for high quality education for Asians include being native speakers of the only common tongue (English) and being acceptable to almost every country as a partner (or place to visit and study).328 Policy should build on these advantages to maintain a key role for Australia.
� Is the tertiary sector well placed to prepare students for the challenges of the Asian century?
Future Focus: Discussion Paper 78
3.4 Addressing issues in participation
Focusing on the needs of groups facing participation challenges−such as older workers, low and unskilled people and families with children−is not the only consideration for policy development in this area. There are a number of cross-‐cutting issues that affect various groups. Structural adjustment is one of these. Being located in a regional area is a factor that can compromise employment chances for young people in particular, as we have seen, but also for other workers, especially in areas where industries are declining. People who have low skills, or no skills, face particular participation challenges across gender and age divides and these too may have a locational dimension. Being a mature-‐aged worker can further exacerbate the difficulties. People who experience multiple disadvantage, including for example people with disability who are of low socioeconomic status, may face massive challenges in gaining and keeping a job.
This means that policies to address participation challenges need to be flexible and adaptable. To address the diversity of issues we need to build in the capability to develop diverse responses appropriate to the factors or cluster of factors that impact on participation. This is particularly true in the case of low skills. Where location is an issue, policies that can be developed and implemented locally can take account of factors that are unique to that area, including the situation of local industries. Those facing multiple disadvantage require individualised and flexible support including support for employers.329 Investment in wrap-‐around services, individualised case management and individual learning plans, access to assistive technologies, and better advice to inform choices have been shown to generate better outcomes for disengaged and disadvantaged groups.330
Structural adjustment
Structural adjustment impacts both men and women, although it is often older men who are most affected. For those potentially facing redundancy due to structural adjustment, consideration may need to be given to restoring the entitlement to a training place that was provided under the Compact with Retrenched Workers during the recent Global Financial Crisis. More needs to be done to encourage lifelong learning for this cohort, especially since research shows that men are less likely to be involved in adult literacy and adult education, along with older people and people from socioeconomically disadvantaged areas.331
A regional focus on sectoral change is also required, particularly in addressing workforce mobility and ensuring that the right skills are available in the right places at the right time. In some sectors, such as the resources industry, work is geographically dependent and workers need to relocate to where the mineral wealth is. Not surprisingly, these resource-‐rich areas do not correspond with major population centres. The issue of worker mobility is also an issue for regions dependent on agriculture and pastoral production, as well as for those dominated by the tourism and hospitality industries. In these contexts, workers need to go where the work is. However, where work is less geographically dependent, consideration might be given to sending work to where the labour source is, rather than trying to move the workforce itself. As we have seen, there are large, underutilised labour markets in dispersed metropolitan and inner-‐regional areas that could be targeted by employers. While there are other barriers to participation that also need to be considered (such as the availability of suitable skills), the portability of work is likely to be as important an issue for the future as is worker mobility today.
Future Focus: Discussion Paper 79
Older workers
The Consultative Forum on Mature Age Participation, introduced as part of the Productive Ageing Package to provide advice to Government on further measures to support mature age job seekers and workers, has found that skills-‐related issues and the availability of flexible work are key barriers to mature age participation.332
Options to improve educational outcomes of mature Australians could include strategies to increase recognition of prior learning and upskilling, particularly in promoting familiarity with new technologies. Workplace learning is important, and the need for a cultural shift towards lifelong learning is clear.
Retaining mature workers is a mechanism for sharing skills and expertise. The preference of mature Australians for part-‐time employment highlights the importance of a flexible approach from employers. Research suggests that Australian employers are demonstrating a relatively strong orientation towards older workers, contrary to most overseas evidence, but there is less evidence of employer interest in training older workers.333 Employers need to be encouraged to continue investing in training of older workers to keep reaping the benefits provided by their skills and experience.
Upskilling the low-‐ and unskilled
Low-‐paid workers, especially low-‐paid women, are major clients for the VET sector and they are more likely to move to higher-‐skilled employment after VET training, with 27.7 per cent of graduates from low paid occupations moving to jobs with a higher skill level after training compared to 3 per cent of those from other occupations.334
However, a number of barriers to the upskilling of low-‐paid workers through the provision of training opportunities have been identified. Issues of poor literacy are an important consideration.335 Low-‐paid workers are ‘less confident of their employers’ support for training’.336 Study adds to work-‐life pressures, with negative impacts from training greater for low-‐paid occupations than higher-‐paid ones.337 Policies need to prioritise ‘job continuity, skills development and earnings improvement rather than simply focusing on job attainment’.338 This means that training undertaken by such workers must actually equip them with new skills and/or lead to better pay or career prospects to be worth the personal cost.339
For lower-‐skilled workers who need help to enter or re-‐enter the workforce and then remain and advance in their employment, so-‐called ‘employment retention and advancement (ERA) policies’ may be more likely to bring about more enduring participation than job-‐seeker services alone.340
Families with children
For many families, childcare is the second biggest expense after mortgage repayments.341 Some studies have found that there is a relationship between the cost of child care and women’s participation. Estimates show shows that a 10 per cent increase in the cost of child care reduces the participation rate by 0.5 per cent for single parents and 0.2 per cent for partnered women.342
Men’s and women’s participation are differently affected by the presence of children in a family. The tendency appears to be for men, rather than women, to claim unemployment benefits if both are unemployed. Policy development for women with children experiencing unemployment should
Future Focus: Discussion Paper 80
address this to ensure to ensure that women have equal access to labour-‐market programs with men.343 Further, ‘eligibility criteria for assistance, either financial or through labour-‐market programs, needs to address the hidden nature of female unemployment’.344
Prolonged periods away from the workforce often result in skills obsolescence. Women may also lose confidence in their ability to perform in job roles, especially where specialist knowledge is concerned. Where these women want to join or rejoin the workforce they have little assistance.345 This is an important area for further consideration in developing policy responses to improve women’s participation.
Workplaces that offer options such as flexible work hours, job-‐sharing or e-‐work (or work from home) can benefit from retaining women after maternity leave. A number of organisations which have implemented flexible workplace arrangements report positive outcomes including increased productivity, better attraction and retention of skilled employees and more engaged workers.346 The benefits of job-‐sharing arrangements could be promoted to employers in terms of improving retention and absenteeism of women workers with children.347
Increasing the number of women in the mining industry has been one of the policy responses to skills shortages in the resources sector. The efforts in the mining industry could be considered a pilot, and learning from this approach could be adopted in other industries. This would have the potential benefit of filling skills shortages but also making more highly paid job opportunities available for women. Conversely, further consideration could be given to strategies to encourage men into occupations in demand that are female dominated, such as aged care.
3.5 Challenges of regional development
Place-‐based approaches are important in ensuring that regions share in the economic health of the nation. It is important to address the ‘growth disparity and diversity of economic conditions between and within cities and regions’ and in doing so, consider regional approaches in addressing skills shortages, workforce mobility, the impacts of structural adjustment and barriers to participation.348
In addressing the different issues that face regions, flexibility is paramount. Regions are best placed to coordinate supporting services and ensure that communities have the tools they require to overcome these issues. This requires a tailored and whole-‐of-‐community approach. Local-‐level input and community engagement with strategies aimed at improving workforce participation is critical because of variation in labour markets.349
3.5.1 Meeting the challenges of the resources boom
The challenges of attracting and retaining a skilled workforce in booming resource regions are currently being addressed via a Commonwealth Inquiry into the use of fly-‐in, fly-‐out workforce practices in regional Australia. In its submission to the House Standing Committee on Regional Australia, the Australasian Institute of Mining and Metallurgy recommended that government and industry address the social and economic issues raised by fly-‐in, fly-‐out practices, including the availability and cost of housing and ensuring that regional infrastructure is of a level comparable to that of metropolitan Australia.
Future Focus: Discussion Paper 81
At the same time, it is argued that fly-‐in, fly-‐out is a workforce choice rather than an employer choice, and as such, government ‘should not seek to impose targets or requirements on minerals companies for the employment of residential versus fly-‐in, fly-‐out employees’.350
Skills Australia’s submission to the Inquiry noted that it seems likely that the extent of fly-‐in, fly-‐out and drive-‐in, drive out work will increase in the period ahead given the strong outlook for the sector.351 We concluded that further policy responses are needed if the resources sector’s skill needs are to be met without adverse impacts on the rest of the economy. This policy mix should include:
• Further consideration of measures to achieve sustained increases in labour force participation to better meet Australia’s overall skill needs as well as the resource sector’s skill needs;
• Options to facilitate greater increases in labour mobility, both by region and from declining to emerging industries; and
• A strong policy focus on means by which more women can be encouraged to take advantage of entry-‐level work opportunities which can be accessed relatively quickly through training provision in the resources sector, given that women continue to be significantly under-‐represented in this sector.352
It was also noted that engaging with an Indigenous workforce is important for the resources sector. We recommended to the Inquiry the need for measures to increase participation by Indigenous people so they can take advantage of entry level job opportunities in the resources sector. Closing the Gap initiatives, for example, promote ‘place based training initiatives’ with the resource sector as part of broader strategies to increase economic participation among Indigenous Australians and improve outcomes across the lifecourse.
3.5.2 Addressing the risks of regional stagnation
The scenarios show that agriculture is an important growth area across all four possible future ‘worlds’. While this growth is achieved mainly through increased outputs, rather than employment growth, there are still opportunities for regional development across the supply chain. For example, lifting output growth in agriculture will likely lead to opportunities for growth in transport, logistics, storage and warehousing. The science behind food technology will be an emerging area, which may lead to opportunities in co-‐locating food research and innovation centres in agricultural regions. Clearly, leadership is needed to make agricultural jobs an attractive proposition, to ensure that Australia does not experience a generational loss of knowledge within the sector.
Australian governments have attempted to redress the disparity in population and economic opportunity across the regions, spending more than $2 billion per year on explicit programs to promote regional growth.353 Yet in regions with no natural resources wealth, dwindling populations and declining industry sectors, governments can only do so much to address these imbalances. The investment of industry is also needed to look at growth opportunities across Australia, emerging industries and new business models. Regional partnerships and investment are just some of the approaches that might be used to help less prosperous regions and mitigate the fragmentation that is occurring across the Australian economy.
Future Focus: Discussion Paper 82
3.5.3 Adopting a flexible approach to regional and sectoral development
The recent launch of the Regional Australia Institute embeds even further the importance of informed decision making and action in the regions. In providing solutions, it is important that policy options and models ensure flexibility, collaboration and coordination.
Government programs to improve regional participation include the Regional Education, Skills and Jobs Plan initiative, designed to develop place-‐based plans to improve participation and outcomes in education, training and employment in regional Australia. The plans will be a key aspect of the Government’s strategy to improve productivity and participation in regional Australia.354 The Initiative also supports the engagement of 34 Education, Skills and Jobs Coordinators who will work with local stakeholders in 46 non-‐metropolitan Regional Development Australia areas to improve participation and outcomes in education, training and employment.355
In Skills for Prosperity it was recommended that Regional Development Australia work with local stakeholders and networks to develop appropriate regional workforce development strategies that support economic opportunities.
The establishment of priority employment areas and placement of local employment coordinators and project officers in each of the priority areas has helped to avoid duplication by facilitating linkages across national, state and local government programs.356
Overcoming regional barriers to participation
A variety of labour market issues confront regional areas including high youth unemployment, skills shortages and oversupply in some areas. However, in other areas, undersupply of suitable skills and labour is an issue, leading employers and policymakers to seek place-‐based solutions, such as the ability of places to grow and draw on their own resources.
However, a recent Australian Government scheme, Connecting People with Jobs, has not attracted many job seekers willing to move interstate. The scheme offers financial assistance to Job Services Australia or Disability Employment Services job seekers who have been unemployed for three months or more to relocate for work and apprenticeships. As at 18 June 2012, 584 eligible job seekers had relocated at a total cost of $1.5 million out of up to $29.2 million available under the initiative. Almost 80 per cent of participants have relocated within or to NSW or Queensland, whereas only 8 per cent have relocated to Western Australia. Data suggests that approximately 6 per cent of eligible participants have gained employment in mining and heavy machinery industries.357 Improving worker mobility in Australia, it seems, is no easy task for governments and business alike.
In developing collaborative approaches to address the participation issues faced by regional areas, employer-‐driven regional efforts are important. This requires engagement with employers and all stakeholders to focus on regional or sectoral development. However, it is important to avoid duplication of effort or services while ensuring the approach is streamlined.
In order to determine the value of workforce development initiatives across the regions it is important that they should be effectively evaluated to identify critical success factors. To date, however, there has been relatively little evaluation of these strategies. To achieve a greater take-‐up of initiatives across the country to meet local needs, we would need to know more about the challenges and opportunities that arise from these approaches. Consideration should also be given
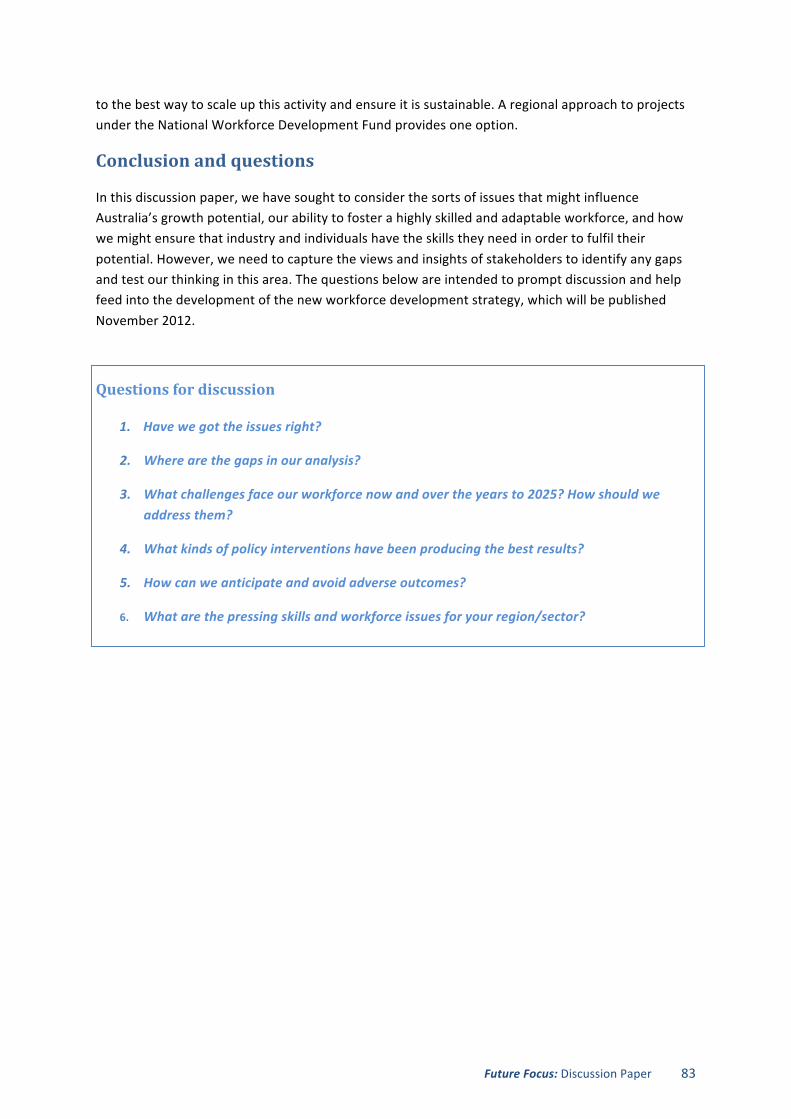
Future Focus: Discussion Paper 83
to the best way to scale up this activity and ensure it is sustainable. A regional approach to projects under the National Workforce Development Fund provides one option.
Conclusion and questions
In this discussion paper, we have sought to consider the sorts of issues that might influence Australia’s growth potential, our ability to foster a highly skilled and adaptable workforce, and how we might ensure that industry and individuals have the skills they need in order to fulfil their potential. However, we need to capture the views and insights of stakeholders to identify any gaps and test our thinking in this area. The questions below are intended to prompt discussion and help feed into the development of the new workforce development strategy, which will be published November 2012.
Questions for discussion
1. Have we got the issues right?
2. Where are the gaps in our analysis?
3. What challenges face our workforce now and over the years to 2025? How should we address them?
4. What kinds of policy interventions have been producing the best results?
5. How can we anticipate and avoid adverse outcomes?
6. What are the pressing skills and workforce issues for your region/sector?
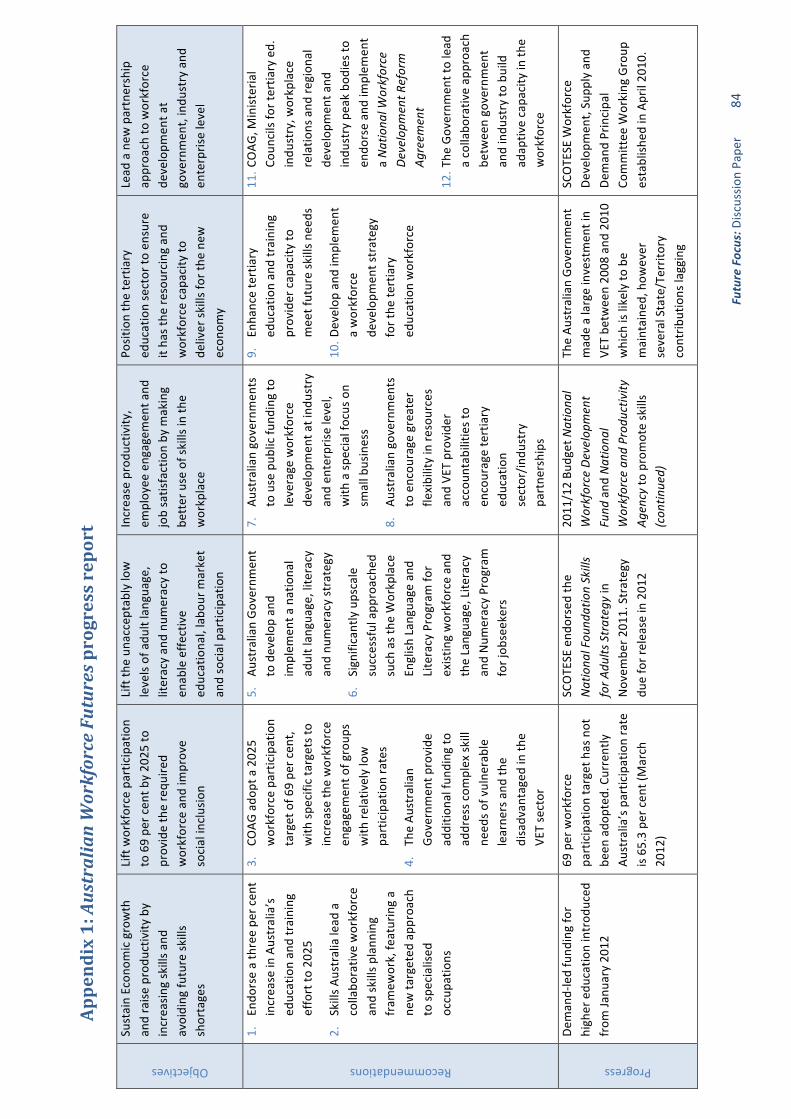
Future Focus: D
iscussio
n Pape
r 84
Appendix 1: Australian Workforce Futures progress report
Objectives
Sustain Econ
omic growth
and raise
produ
ctivity
by
increasin
g skills a
nd
avoiding fu
ture sk
ills
shortages
Lift workforce participation
to 69 pe
r cen
t by 20
25 to
provide the requ
ired
workforce and
improve
social inclusion
Lift th
e un
acceptab
ly low
levels of adu
lt langua
ge,
literacy an
d nu
meracy to
enab
le effe
ctive
educationa
l, labo
ur m
arket
and social participation
Increase produ
ctivity
, em
ployee engagem
ent a
nd
job satisfaction by m
aking
better use of skills in th
e workplace
Position the tertiary
education sector to
ensure
it ha
s the
resourcing and
workforce cap
acity
to
deliver sk
ills for th
e ne
w
econ
omy
Lead
a new
partnership
approa
ch to
workforce
developm
ent a
t go
vernmen
t, indu
stry and
en
terprise level
Recommendations
1. En
dorse a three pe
r cen
t increase in Australia’s
education an
d training
effort to
202
5
2. Skills A
ustralia lead
a
collabo
rativ
e workforce
and skills p
lann
ing
fram
ework, fe
aturing a
new ta
rgeted
app
roach
to sp
ecialised
occupa
tions
3. CO
AG ado
pt a 202
5 workforce participation
target of 6
9 pe
r cen
t, with
specific targets to
increase th
e workforce
engagemen
t of g
roup
s with
relativ
ely low
participation rates
4. Th
e Au
stralian
Governm
ent p
rovide
ad
ditio
nal fun
ding to
ad
dress c
omplex sk
ill
need
s of vulne
rable
learne
rs and
the
disadvan
taged in th
e VE
T sector
5. Au
stralian Governm
ent
to develop
and
im
plem
ent a
nationa
l ad
ult lan
guage, literacy
and nu
meracy strategy
6. Significantly upscale
successful app
roache
d such as the
Workplace
English
Lan
guage an
d Literacy Program
for
existing workforce and
the Langua
ge, Lite
racy
and Num
eracy Prog
ram
for job
seekers
7. Au
stralian go
vernmen
ts
to use pub
lic fu
nding to
leverage workforce
developm
ent a
t ind
ustry
and en
terprise level,
with
a sp
ecial focus on
small business
8. Au
stralian go
vernmen
ts
to encou
rage greater
flexibility in re
sources
and VE
T provider
accoun
tabilities to
encourage tertiary
education
sector/in
dustry
partne
rships
9. En
hance tertiary
education an
d training
provider cap
acity
to
meet future skills n
eeds
10. D
evelop
and
implem
ent
a workforce
developm
ent strategy
for the
tertiary
education workforce
11. C
OAG
, Ministerial
Coun
cils for tertia
ry ed.
indu
stry, w
orkplace
relatio
ns and
region
al
developm
ent a
nd
indu
stry peak bo
dies to
en
dorse an
d im
plem
ent
a Nationa
l Workforce
Developm
ent R
eform
Agreem
ent
12. T
he Governm
ent to lead
a collabo
rativ
e ap
proa
ch
betw
een go
vernmen
t an
d indu
stry to
build
adap
tive capa
city in th
e workforce
Progress
Deman
d-‐led fund
ing for
higher edu
catio
n introd
uced
from
Janu
ary 20
12
69 per workforce
participation target has not
been
ado
pted
. Currently
Australia’s participation rate
is 65
.3 per cen
t (March
2012
)
SCOTESE end
orsed the
Nationa
l Fou
ndation Skills
for A
dults Strategy in
Novem
ber 2
011. Strategy
due for release in 201
2
2011
/12 Bu
dget Nationa
l Workforce Develop
ment
Fund
and
Nationa
l Workforce and
Produ
ctivity
Ag
ency to
promote skills
(con
tinued)
The Au
stralian Governm
ent
mad
e a large investmen
t in
VET be
tween 20
08 and
201
0 which is likely to
be
maintaine
d, how
ever
several State/Territory
contrib
utions lagging
SCOTESE W
orkforce
Developm
ent, Supp
ly and
De
man
d Principa
l Co
mmittee W
orking Group
establish
ed in April 20
10.
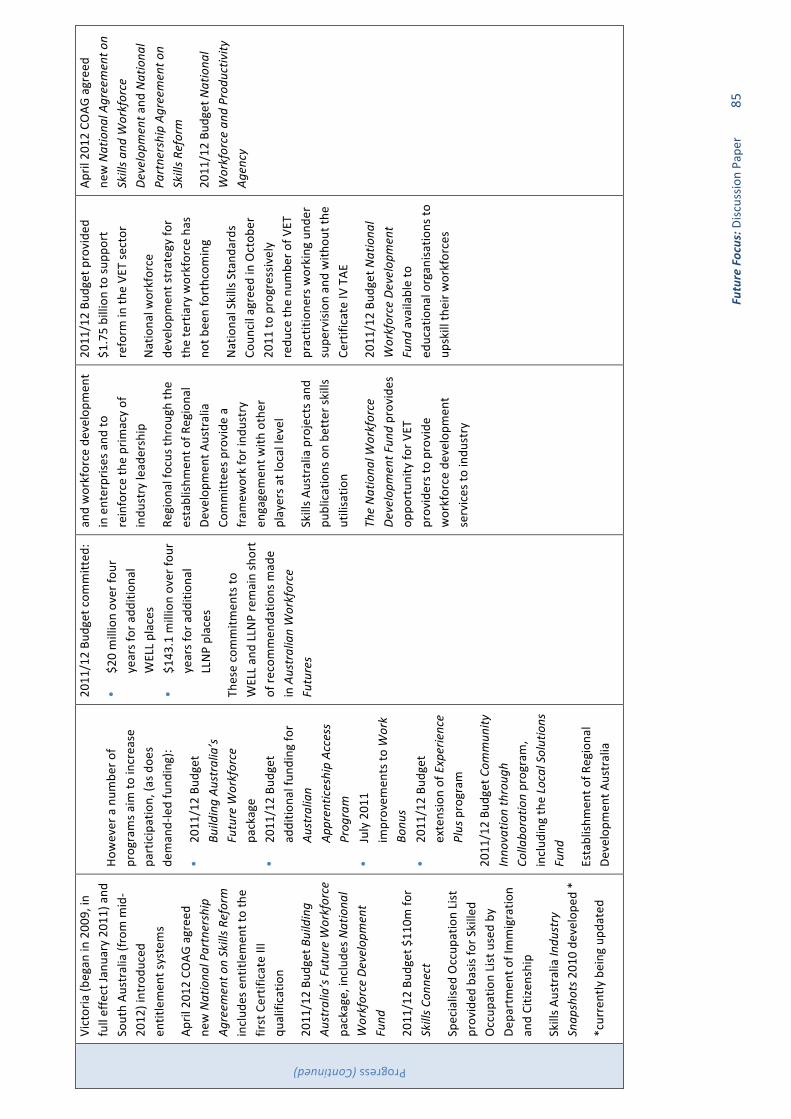
Future Focus: D
iscussio
n Pape
r 85
Progress (Continued)
Victoria (b
egan
in 200
9, in
full effect Ja
nuary 20
11) a
nd
South Au
stralia (from m
id-‐
2012
) introdu
ced
entitlemen
t systems
April 201
2 CO
AG agreed
new Nationa
l Partnership
Agreem
ent o
n Skills R
eform
includ
es entitlem
ent to the
first Certificate III
qualificatio
n
2011
/12 Bu
dget Building
Australia’s Future Workforce
package, includ
es Nationa
l Workforce Develop
ment
Fund
2011
/12 Bu
dget $11
0m fo
r Skills C
onnect
Specialised
Occup
ation List
provided
basis for S
killed
Occup
ation List used by
Depa
rtmen
t of Immigratio
n an
d Citizen
ship
Skills A
ustralia Indu
stry
Snap
shots 2
010 de
velope
d *
*currently being upd
ated
However a num
ber o
f prog
rams a
im to
increase
participation, (a
s doe
s de
man
d-‐led fund
ing):
• 20
11/12 Bu
dget
Building Au
stralia’s
Future W
orkforce
package
• 20
11/12 Bu
dget
additio
nal fun
ding fo
r Au
stralian
Apprenticeship Access
Prog
ram
• July 201
1 im
provem
ents to
Work
Bonu
s •
2011
/12 Bu
dget
extension of Experience
Plus program
2011
/12 Bu
dget Com
mun
ity
Inno
vatio
n throug
h Co
llabo
ratio
n prog
ram,
includ
ing the Local Solutions
Fund
Establish
men
t of R
egiona
l De
velopm
ent A
ustralia
2011
/12 Bu
dget com
mitted
:
• $2
0 million over fo
ur
years for add
ition
al
WELL places
• $1
43.1 m
illion over fo
ur
years for add
ition
al
LLNP places
These commitm
ents to
WELL an
d LLNP remain short
of re
commen
datio
ns m
ade
in Australian Workforce
Futures
and workforce develop
men
t in enterprise
s and
to
reinforce the prim
acy of
indu
stry lead
ership
Region
al fo
cus throu
gh th
e establish
men
t of R
egiona
l De
velopm
ent A
ustralia
Committees p
rovide
a
fram
ework for ind
ustry
engagemen
t with
other
players a
t local level
Skills A
ustralia projects a
nd
publications on be
tter sk
ills
utilisatio
n
The Nationa
l Workforce
Developm
ent F
und provides
oppo
rtun
ity fo
r VET
providers to provide
workforce develop
men
t services to
indu
stry
2011
/12 Bu
dget provide
d $1
.75 billion
to su
pport
reform
in th
e VE
T sector
Nationa
l workforce
developm
ent strategy for
the tertiary workforce has
not b
een forthcom
ing
Nationa
l Skills Stand
ards
Coun
cil agreed in Octob
er
2011
to progressiv
ely
redu
ce th
e nu
mbe
r of V
ET
practitione
rs working und
er
supe
rvision
and
with
out the
Ce
rtificate IV
TAE
2011
/12 Bu
dget Nationa
l Workforce Develop
ment
Fund
available to
educationa
l organ
isatio
ns to
up
skill th
eir w
orkforces
April 201
2 CO
AG agreed
new Nationa
l Agreement o
n Skills a
nd W
orkforce
Developm
ent a
nd Nationa
l Pa
rtnership Ag
reem
ent o
n Skills R
eform
2011
/12 Bu
dget Nationa
l Workforce and
Produ
ctivity
Ag
ency
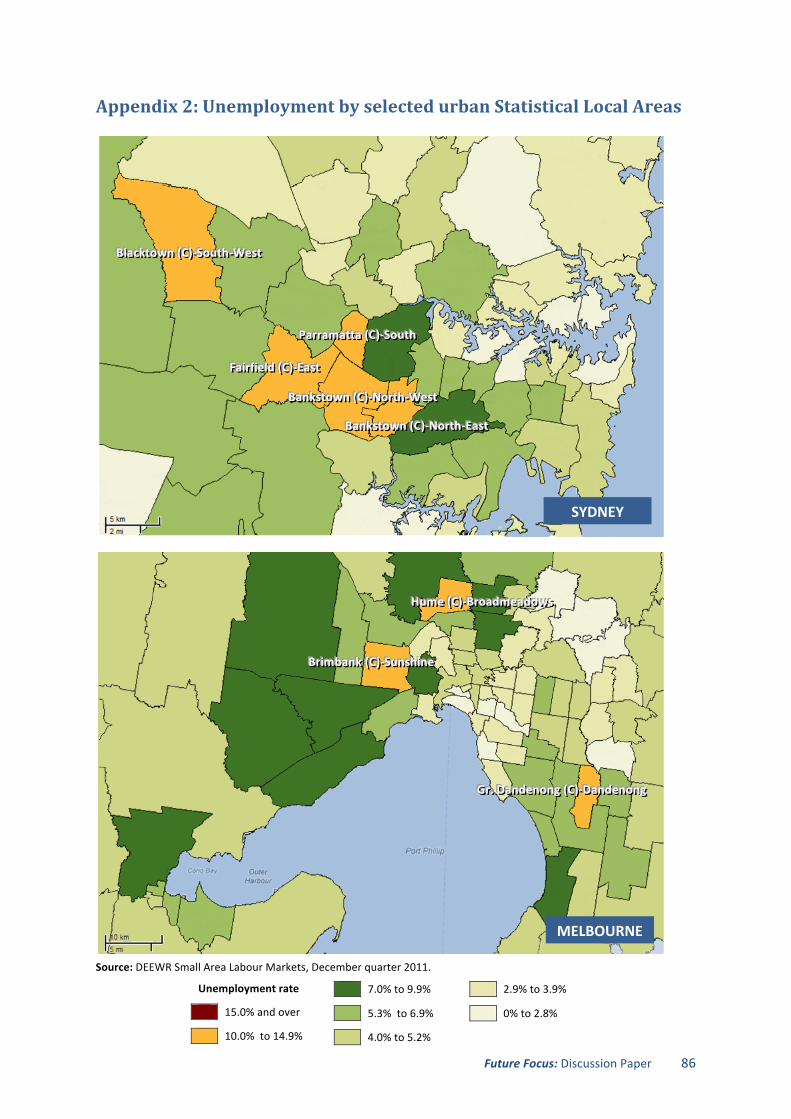
Future Focus: Discussion Paper 86
Appendix 2: Unemployment by selected urban Statistical Local Areas
Source: DEEWR Small Area Labour Markets, December quarter 2011.
BBBlllaaaccckkktttooowwwnnn (((CCC))) -‐-‐-‐SSSooouuuttthhh-‐-‐-‐WWWeeesssttt
FFFaaaiii rrr fff iiieeelllddd (((CCC))) -‐-‐-‐EEEaaasssttt
PPPaaarrrrrraaammmaaattttttaaa (((CCC))) -‐-‐-‐SSSooouuuttthhh
BBBaaannnkkkssstttooowwwnnn (((CCC))) -‐-‐-‐NNNooorrrttthhh-‐-‐-‐WWWeeesssttt
BBBaaannnkkkssstttooowwwnnn (((CCC))) -‐-‐-‐NNNooorrrttthhh-‐-‐-‐EEEaaasssttt
SYDNEY
MELBOURNE
GGGrrr ... DDDaaannndddeeennnooonnnggg (((CCC))) -‐-‐-‐DDDaaannndddeeennnooonnnggg
BBBrrr iiimmmbbbaaannnkkk (((CCC))) -‐-‐-‐SSSuuunnnssshhhiiinnneee
HHHuuummmeee (((CCC))) -‐-‐-‐BBBrrroooaaadddmmmeeeaaadddooowwwsss
Unemployment rate
15.0% and over
10.0% to 14.9%
7.0% to 9.9%
5.3% to 6.9%
4.0% to 5.2%
2.9% to 3.9%
0% to 2.8%
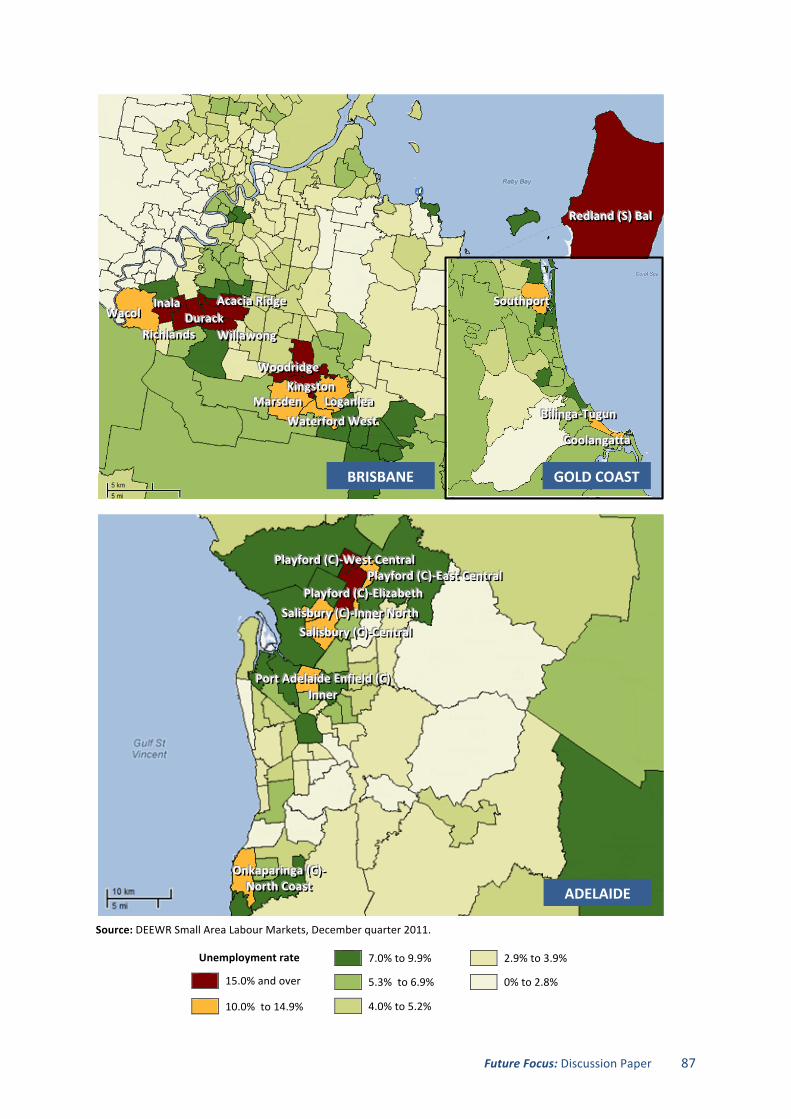
Future Focus: Discussion Paper 87
Source: DEEWR Small Area Labour Markets, December quarter 2011.
GOLD COAST BRISBANE
ADELAIDE
RRReeedddlllaaannnddd (((SSS))) BBBaaalll
AAAcccaaaccc iiiaaa RRRiiidddgggeee
WWWiii lll lllaaawwwooonnnggg DDDuuurrraaaccckkk
IIInnnaaalllaaa
RRRiiiccchhhlllaaannndddsss WWWaaacccooolll
KKKiiinnngggssstttooonnn WWWoooooodddrrr iiidddgggeee
WWWaaattteeerrr fffooorrrddd WWWeeesssttt MMMaaarrrsssdddeeennn LLLooogggaaannnllleeeaaa
SSSooouuuttthhhpppooorrrttt
BBBiii lll iiinnngggaaa-‐-‐-‐TTTuuuggguuunnn
CCCoooooolllaaannngggaaattttttaaa
PPPlllaaayyyfffooorrrddd (((CCC))) -‐-‐-‐WWWeeesssttt CCCeeennntttrrraaalll
PPPlllaaayyyfffooorrrddd (((CCC))) -‐-‐-‐EEElll iii zzzaaabbbeeettthhh PPPlllaaayyyfffooorrrddd (((CCC))) -‐-‐-‐EEEaaasssttt CCCeeennntttrrraaalll
SSSaaalll iii sssbbbuuurrryyy (((CCC))) -‐-‐-‐ IIInnnnnneeerrr NNNooorrrttthhh SSSaaalll iii sssbbbuuurrryyy (((CCC))) -‐-‐-‐CCCeeennntttrrraaalll
PPPooorrrttt AAAdddeeelllaaaiiidddeee EEEnnnfff iiieeelllddd (((CCC))) IIInnnnnneeerrr
OOOnnnkkkaaapppaaarrr iiinnngggaaa (((CCC))) -‐-‐-‐ NNNooorrrttthhh CCCoooaaasssttt
Unemployment rate
15.0% and over
10.0% to 14.9%
7.0% to 9.9%
5.3% to 6.9%
4.0% to 5.2%
2.9% to 3.9%
0% to 2.8%
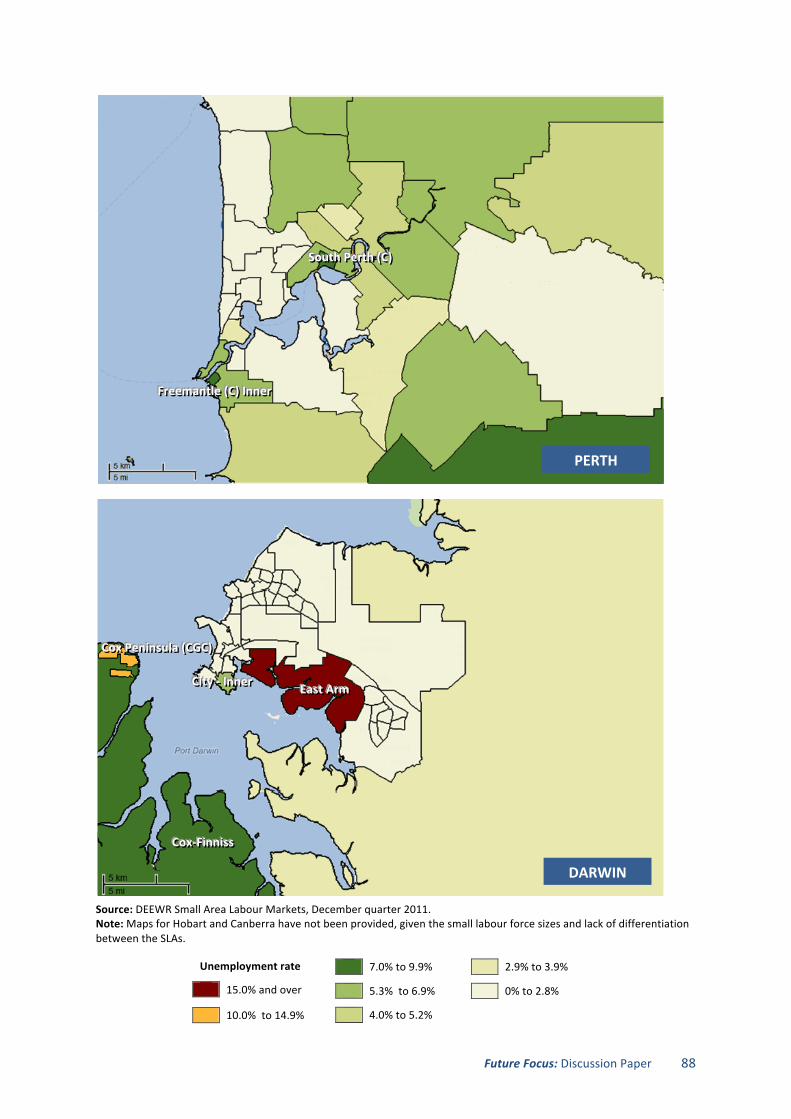
Future Focus: Discussion Paper 88
Source: DEEWR Small Area Labour Markets, December quarter 2011. Note: Maps for Hobart and Canberra have not been provided, given the small labour force sizes and lack of differentiation between the SLAs.
Unemployment rate
15.0% and over
10.0% to 14.9%
7.0% to 9.9%
5.3% to 6.9%
4.0% to 5.2%
2.9% to 3.9%
0% to 2.8%
SSSooouuuttthhh PPPeeerrrttthhh (((CCC)))
FFFrrreeeeeemmmaaannnttt llleee (((CCC))) IIInnnnnneeerrr
PERTH
DARWIN
CCCiii tttyyy -‐-‐-‐ IIInnnnnneeerrr EEEaaasssttt AAArrrmmm
CCCoooxxx PPPeeennniiinnnsssuuulllaaa (((CCCGGGCCC)))
CCCoooxxx-‐-‐-‐FFF iiinnnnnniiissssss
Future Focus: Discussion Paper 89
References
1 Skills Australia, 2012, Better use of skills, better outcomes: A research report on skills utilisation in Australia, http://www.skillsaustralia.gov.au/publications/documents/Skills-‐utilisation-‐research-‐report-‐15-‐May-‐2012.pdf, accessed 19 June 2012; Skills Australia, 2012, Better use of skills, better outcomes: Australian case studies, http://www.skillsaustralia.gov.au/publications/documents/Skills-‐utilisation-‐research-‐report-‐15-‐May-‐2012.pdf, accessed 19 June 2012. 2 The Clarius Skills Index for the March quarter 2012 shows seven of the twenty occupations analysed for the report in shortage. Three are classified as ‘extreme’: corporate services managers, engineering professionals and ICT professionals (Clarius Skills Index−March Quarter, 2012, http://www.clarius.com.au/news_centre/clarius_skills_index.aspx, accessed 31 May 2012). 3 Department of Education, Employment and Workplace Relations, 2011, Vocational education and training statistics: Students and courses – Higher education enrolment data 2011, NCVER. 4 UKCES, 2010, High Performance Working: A policy review, evidence report 18, UK Commission for Employment and Skills, London, May, p. 3. 5 Skills Australia, 2012, Better use of skills, better outcomes: A research report on skills utilisation in Australia. 6 Ewing, R et al., 2007, Recent productivity outcomes and Australia’s potential growth, Economic Roundup Winter 2007, Australian Treasury, http://www.treasury.gov.au/documents/1304/HTML/docshell.asp?URL=03_Recent_productivity_outcomes.asp, accessed 22 March 2012. 7 Parnum, D, et al., 2000, Distribution of the economic gains of the 1990s, Staff Research Paper, Productivity Commission, November, http://www.pc.gov.au/__data/assets/pdf_file/0015/8160/doteg.pdf, accessed 16 March 2012. 8 Porter, M, 1991, Competitive Advantage of Nations, The Free Press, New York. 9 Skills Australia, Better use of skills, better outcomes: A research report on skills utilisation in Australia. 10 Productivity Commission, 2012, ‘Long Term Trends’, Productivity Analysis Branch, 29 February, http://www.pc.gov.au/research/productivity/estimates-‐trends/trends, accessed 22 March 2012. 11 Ewing, R, et al., 2007, Recent productivity outcomes and Australia’s potential growth, Economic Roundup Winter 2007, Australian Treasury, http://www.treasury.gov.au/documents/1304/HTML/docshell.asp?URL=03_Recent_productivity_outcomes.asp, accessed 22 March 2012. 12 Productivity Commission, 2012, ‘Long Term Trends’, Productivity Analysis Branch, 29 February, http://www.pc.gov.au/research/productivity/estimates-‐trends/trends, accessed 22 March 2012. 13 Productivity Commission, 2012, ‘Long Term Trends’, Productivity Analysis Branch, 29 February, http://www.pc.gov.au/research/productivity/estimates-‐trends/trends, accessed 22 March 2012. 14 Edwards, J cited in Ross, J, 2012, ‘Productivity: labour not the problem’, The Australian, 29 March; Australian Treasury, 2009, Raising the level of productivity growth in the Australian economy, Treasury submission to the House of Representatives Standing Committee on Economics Inquiry into raising the level of productivity growth in the Australian economy, August, http://www.treasury.govt.nz/downloads/pdfs/tfr-‐atrlpga-‐20oct09.pdf, accessed 26 April 2012, p. 51. 15 Australian Treasury, 2009, Raising the level of productivity growth in the Australian economy, Treasury submission to the House of Representatives Standing Committee on Economics Inquiry into raising the level of productivity growth in the Australian economy, August, http://www.treasury.govt.nz/downloads/pdfs/tfr-‐atrlpga-‐20oct09.pdf, accessed 26 April 2012, p. 51. 16 Australian Treasury, 2009, Raising the level of productivity growth in the Australian economy, Treasury submission to the House of Representatives Standing Committee on Economics Inquiry into raising the level of productivity growth in the Australian economy, August, http://www.treasury.govt.nz/downloads/pdfs/tfr-‐atrlpga-‐20oct09.pdf, accessed 26 April 2012, p. 51. 17 Eslake, S, 2011, Figure 7, Productivity, Paper presented to the annual policy conference of the Reserve Bank of Australia, Sydney, 15-‐16 August, p. 9. 18 Australian Services Roundtable, 2010, The New Economic Challenge: Responding to the Rise of Services in the Australian Economy, A joint report by ACIL Tasman and the Australian Services Roundtable, September, p.xi, http://servicesaustralia.co/file_download/32/new-‐economic-‐challenge.pdf (accessed 14 June 2012). 19 Drake-‐Brockman, J, 2011, The Importance of Measuring the Delivery of Services via Commercial Presence of Offshore Foreign Affiliates: Some Case Studies from Australian Business Experience, ADBI Working Paper Series, No. 295, Asian Development Bank Institute, July, http://www.adbi.org/files/2011.07.12.wp295.measuring.delivery.service.australia.pdf. 20Drake-‐Brockman, J, 2011, The importance of measuring the delivery of services via commercial presence of offshore foreign affiliates: Some case studies from Australian business experience, ADBI Working Paper Series, No. 295, Asian Development Bank Institute, July, http://www.adbi.org/files/2011.07.12.wp295.measuring.delivery.service.australia.pdf accessed 26 May 2012. 21 OECD Gross Domestic Product annual growth rate, average for 2000-‐2010, OECD.StatExtracts, http://stats.oecd.org/Index.aspx?DataSetCode=PDYGTH#, extracted 21 March 2012. 22 Australian Treasury, 2009, Raising the level of productivity growth in the Australian economy, Treasury submission to the House of Representatives Standing Committee on Economics Inquiry into raising the level of productivity growth in the Australian economy, August, http://www.treasury.govt.nz/downloads/pdfs/tfr-‐atrlpga-‐20oct09.pdf, accessed 26 April 2012. 23 This indicator refers to the average number of rooms per person in a dwelling and is obtained by dividing the number of rooms in a dwelling by the number of people living there. Living space requirements of having at least one room per person are generally fulfilled in all OECD countries (except Turkey where the average is 0.7 rooms per person). Australia, Belgium, Canada and New Zealand have an average of 2 rooms per person or more (OECD, 2011, OECD Better Life Initiative: Compendium of OECD well-‐being indicators, http://www.oecd.org/dataoecd/4/31/47917288.pdf, accessed 27 March 2012). 24 OECD, 2011, OECD Better Life Initiative: Compendium of OECD well-‐being indicators, http://www.oecd.org/dataoecd/4/31/47917288.pdf, accessed 27 March 2012. 25 ABS, 2009-‐10, ‘Business Innovation,’ Selected Characteristics of Australian Business, 2009-‐10, Cat. No. 8167.0, http://www.abs.gov.au/ausstats/[email protected]/Latestproducts/8167.0Main%20Features72009-‐10?opendocument&tabname=Summary&prodno=8167.0&issue=2009-‐10&num=&view=, accessed 15 March 2012; Stanwick, J, 2011, Innovation: Its links with productivity and skill development, NCVER, http://www.ncver.edu.au/publications/2424.html, accessed 30 April 2012.
Future Focus: Discussion Paper 90
26 ABS, 2009-‐10, ‘Business performance’, Selected characteristics of Australian business, 2009-‐2010, Cat. No. 8167.0, http://www.abs.gov.au/ausstats/[email protected]/Products/8167.0~2009-‐10~Main+Features~Business+Performance?OpenDocument, accessed 15 March 2012. 27 Keating, M and Smith, C, 2011, Critical issues facing Australia to 2025: Summary of a scenario development forum, Academy of the Social Sciences in Australia Occasional Paper 1/2011. 28 Allen Consulting Group, 2010, Quantifying the possible economic gains of getting more Australian households online, http://www.dbcde.gov.au/__data/assets/pdf_file/0004/135508/Quantifying_the_possible_economic_gains_of_getting_more_Australian_households_online.pdf, accessed 27 March 2012. 29 Keating, M and Smith, C, 2011, Critical issues facing Australia to 2025: Summary of a scenario development forum, Academy of the Social Sciences in Australia Occasional Paper 1/2011. 30 Arundel, A, 2011, Skills for an innovative Australia to 2025, paper for Skills Australia scenario development forum, Sydney, February 2011. 31 OECD, 2005, Oslo manual: Guidelines for collecting and interpreting innovation data, http://www.oecd.org/dataoecd/35/61/2367580.pdf, accessed 19 March 2012. 32 ABS, 2010, Yearbook Australia 2009-‐10, Cat. No. 1301.0, http://www.abs.gov.au/AUSSTATS/[email protected]/Lookup/1301.0Chapter15062009%E2%80%9310, accessed 14 March 2012. 33 Stanwick, J, 2011, Innovation: Its links with productivity and skill development, NCVER, http://www.ncver.edu.au/publications/2424.html, accessed 30 April 2012. 34 Keating, M and Smith, C, 2011, Critical issues facing Australia to 2025: Summary of a scenario development forum, Academy of the Social Sciences in Australia Occasional Paper 1/2011. 35 Stanwick, J, 2011, Innovation: Its links with productivity and skill development, NCVER, http://www.ncver.edu.au/publications/2424.html, accessed 30 April 2012. 36 OECD, ‘The global innovation index 2011’, http://www.globalinnovationindex.org/gii/index.html, accessed 27 March 2012. 37 OECD, ‘R&D expenditure’, http://www.oecd-‐ilibrary.org/docserver/download/fulltext/9211041ec016.pdf?expires=1332118685&id=id&accname=guest&checksum=73535C73E4A182433B6A621336277F47, accessed 19 March 2012. The OECD average for 2011 was 2.3 per cent (‘OECD Science, technology and industry scoreboard 2011’, http://www.oecd-‐ilibrary.org/science-‐and-‐technology/oecd-‐science-‐technology-‐and-‐industry-‐scoreboard-‐2011/r-‐d-‐expenditure_sti_scoreboard-‐2011-‐16-‐en, accessed 19 March 2012). 38 ABS, 2010, Research and experimental development, Businesses, Australia, 2009-‐2010, Cat. No. 8104.0, http://www.ausstats.abs.gov.au/ausstats/subscriber.nsf/0/6BF458ABA6A3881DCA2579040013F469/$File/81040_2009-‐10.pdf, accessed 14 March 2012. 39 ABS, 2010, Research and experimental development, Businesses, Australia, 2009-‐2010, Cat. No. 8104.0, http://www.ausstats.abs.gov.au/ausstats/subscriber.nsf/0/6BF458ABA6A3881DCA2579040013F469/$File/81040_2009-‐10.pdf, accessed 14 March 2012. 40 Department of Innovation, Industry, Science and Research, 2009, Innovation and raising Australia’s productivity growth, submission to the House of Representatives Standing Committee in Economics Inquiry into Raising the level of productivity growth in the Australian economy, http://www.innovation.gov.au/Innovation/ReportsandStudies/Documents/InnovationandRaisingAustraliasProductivityGrowth.pdf, accessed 30 April 2012. 41 OECD, 2010, Innovation strategy: Getting a head start on tomorrow, http://www.oecd.org/document/15/0,3746,en_2649_34273_45154895_1_1_1_1,00.html, accessed 15 March 2012. 42 Dalitz, R, et al., 2011, ‘VET and the diffusion and implementation of innovation in the mining, solar energy and computer games sectors’, in Curtin, P (eds) et al., 2011, Fostering enterprise: The innovation and skills nexus – research readings, NCVER, http://www.ncver.edu.au/publications/2367.html, accessed 30 April 2012; Toner, P, 2011, ‘Tradespeople and technicians in innovation’ in Curtin, P (eds) et al., 2011, Fostering enterprise http://www.ncver.edu.au/publications/2367.html, accessed 30 April 2012. These references relate to VET training only. 43 Stanwick, J, 2011, Innovation: Its links with productivity and skill development, NCVER, http://www.ncver.edu.au/publications/2424.html, accessed 30 April 2012. 44 ABS, ‘Skills’, Selected characteristics of Australian business, 2009-‐2010, Cat. No. 8167.0, http://www.abs.gov.au/ausstats/[email protected]/Latestproducts/8167.0Main%20Features102009-‐10?opendocument&tabname=Summary&prodno=8167.0&issue=2009-‐10&num=&view=, accessed 15 March 2012. 45 Stanwick, J, 2011, Innovation: Its links with productivity and skill development, NCVER, http://www.ncver.edu.au/publications/2424.html, accessed 30 April 2012. 46 Multifactor productivity represents that part of the growth in output that cannot be explained by growth in labour and capital inputs, i.e. improved production techniques, better management practices, and organisational change. ABS, 2009, Measures of Australia’s Progress: Summary Indicators: Productivity, Cat. No. 1383.0.55.001, http://www.abs.gov.au/AUSSTATS/[email protected]/Lookup/1383.0.55.001Main+Features182009, accessed 30 April 2012. 47 Boedker, C et al., 2011, Leadership, Culture and Management Practices of High Performing Workplaces in Australia: The High Performing Workplaces Index, http://www.deewr.gov.au/Skills/Programs/WorkDevelop/Documents/SKEHPW.pdf, accessed 16 March 2012, pp. 47-‐48. 48 Green, F, 2009, Job Quality in Britain, United Kingdom Commission on Employment and Skills, Praxis No 1, http://www.ukces.org.uk/assets/ukces/docs/publications/praxis-‐1-‐job-‐quality-‐in-‐britain.pdf, accessed 30 April 2012, p. 10; Warhurst, C, 2011, ‘Rethinking good and bad jobs in Glasgow’, Whose Economy Seminar Paper, Oxfam, http://policy-‐practice.oxfam.org.uk/publications/rethinking-‐good-‐and-‐bad-‐jobs-‐in-‐glasgow-‐196970, accessed 1 February 2012, p. 5. 49 Cutler, T et al., 2008, Venturous Australia: Building strength in innovation, http://www.innovation.gov.au/Innovation/Policy/Documents/NISReport.pdf, accessed 15 March 2012, p. 53; Watson, I, 2008, Skills in use labour market and workplace trends in skills use in Australia, Paper presented to Jobs Australia National Conference 2008, Brisbane, http://www.ianwatson.com.au/pubs/watson_skills_paper_handout.pdf, accessed 30 April 2012.
Future Focus: Discussion Paper 91
50 Green, R, 2009, Management matters in Australia: Just how productive are we? http://www.innovation.gov.au/Industry/ReportsandStudies/Documents/ManagementMattersinAustraliaReport.pdf, accessed 30 April 2012. 51 ABS, 2012, ‘Table 01. Labour force status by Sex – Trend’, Labour Force, Australia, Cat. No. 6202.0, http://www.abs.gov.au/AUSSTATS/[email protected]/DetailsPage/6202.0Mar%202012?OpenDocument, accessed 27 April 2012. 52 ABS, 2010, Year Book Australia 2009-‐10, Cat. No. 1301.0, http://www.abs.gov.au/ausstats/[email protected]/mf/1301.0, accessed 27 April 2012. 53 National VET Equity Advisory Council, 2010, Equal futures: Achieving potential through VET: Blueprint for change 2011–2016, Discussion paper, http://www.nveac.natese.gov.au/__data/assets/pdf_file/0016/53701/blueprint_for_change.pdf, accessed 9 May 2012, p. 8. 54 NCVER, 2009, Australian vocational education and training statistics: students and courses 2008, http://hdl.voced.edu.au/10707/89927, accessed 9 May 2012; DEEWR, 2009, Students 2008; NCVER, 2007, The socioeconomic status of vocational education and training students in Australia, http://www.ncver.edu.au/publications/1690.html, accessed 9 May 2012, (2001 data). 55 Smith Family, 2011, Unequal opportunities: Life chances for children in the ‘Lucky Country’, http://www.thesmithfamily.com.au/webdata/resources/files/natsem__final_web.pdf, accessed 30 April 2012. 56 ABS, 2011, Education and Work, Cat. No. 6227.0. http://www.abs.gov.au/AUSSTATS/[email protected]/DetailsPage/6227.0May%202011?OpenDocument, accessed 27 April 2012. 57 ABS, 2011, Education and Work, Cat. No. 6227.0 Table 10. 58 This was the case for the 21 countries examined in Oesch, D, 2010, ‘What explains high unemployment among low-‐skilled workers? Evidence from 21 OECD countries’, European Journal of Industrial Relations, Vol. 16, No. 1, http://www.unige.ch/ses/spo/Membres/Enseignants/Oesch-‐1/Publications/Oesch_2010_Lowskilled_unemployment_EJIR.pdf, accessed 27 April 2012. 59 Le, A, and Miller, P, 1999, Job quality and churning of the pool of the unemployed: an application using the survey of employment and unemployment patterns, ABS Occasional Paper, Cat. No. 6293.0; Haynes, M et al., 2011, Social determinants and regional disparity of unemployment duration in Australia: A multilevel approach, Paper prepared for the Tenth anniversary HILDA Survey Research Conference, Melbourne, http://melbourneinstitute.com/downloads/conferences/HILDA%202011/HILDA11_final%20papers/Higginson,%20Angela_7A_final%20paper.pdf, accessed 20 February 2012; Gregg, P, and Tominey, E, 2005, ‘The wage scar from male youth unemployment,’ Labour Economics, Vol 12; Stewart, M, 2007, ‘The interrelated dynamics of unemployment and low-‐wage employment’, Journal of Applied Econometrics, Vol. 22; Watson, I, 2008, ‘Low paid jobs and unemployment: churning in the Australian Labour Market, 2001 to 2006’, Australian Journal of Labour Economics, Vol. 11, No.1. 60 de Grip, A and Borghans, L, eds., The overeducated Worker?: The Economics of Skill Utilisation, Research Centre for Education and the Labour Market, http://www.uva-‐aias.net/uploaded_files/regular/bookcontents-‐overeducated-‐1.pdf, accessed 27 April 2012; Oesch, D, 2010, ‘What explains high unemployment among low-‐skilled workers? Evidence from 21 OECD countries’, European Journal of Industrial Relations, Vol. 16, No. 1, http://www.unige.ch/ses/spo/Membres/Enseignants/Oesch-‐1/Publications/Oesch_2010_Lowskilled_unemployment_EJIR.pdf, accessed 27 April 2012. 61 Mitchell, W, 2008, ‘Migration and labour market outcomes by skill in Australia,’ Australian Fair Pay Commission Minimum Wage Research Forum, http://www.fairpay.gov.au/NR/rdonlyres/43D6C5C4-‐9150-‐43CA-‐8317-‐66121AA6E9D3/0/Paper1_Prof_WilliamMitchell_UniversityofNewcastle.pdf, accessed 28 May 2012. 62 Keating, M, 2006, ‘Training and employment participation’, Presentation to CEET, Independent Pricing and Regulatory Tribunal (IPART), 3 November, http://www.ipart.nsw.gov.au/files/ef3256fb-‐7354-‐42b1-‐953c-‐9f8300bc644f/Speech_-‐_Presentation_on_Training_Employment_Participation_Education_to_CEET_-‐_3_November_2006.pdf, accessed 28 May 2012. 63 Kennedy, S and Hedley, D, 2003, Educational attainment and labour force participation in Australia, Treasury Economic Roundup, Winter. 64 Kennedy, S et al., 2009, ‘Labour force participation and the influence of educational attainment’, Economic Roundup, Issue 3, p. 24. 65 Kennedy, S and Hedley, D, 2003, Educational attainment and labour force participation in Australia, Treasury Economic Roundup, Winter. 66 Keating, M, 2006, Training and employment participation, speech delivered at the Independent Pricing and Regulatory Tribunal, 3 November, 2006, p. 2. 67 ABS, 2012, ‘Table 01. Labour force status by Sex – Trend’, Labour Force, Australia, Cat. No. 6202.0, http://www.abs.gov.au/AUSSTATS/[email protected]/DetailsPage/6202.0Mar%202012?OpenDocument, accessed 27 April 2012 68 Keating, M, 2006, Training and employment participation, speech delivered at the Independent Pricing and Regulatory Tribunal, 3 November, 2006, p. 2. 69 Keating, M, 2006, Training and employment participation, speech delivered at the Independent Pricing and Regulatory Tribunal, 3 November, 2006, p. 2. 70 This is evidenced by low school retention rates which were 22.7% in 1968 and only increased to 34.7% in 1979. Surveys have shown that the primary reason for leaving school early were work-‐related. Work-‐related reasons have a greater pull on males than on females, and this trend continues with males more likely to be early school leavers than females (39% compared with 27%): Lamb, S, et al., 2004, Staying on at school: Improving student retention in Australia, http://www.curriculum.edu.au/verve/_resources/studentretention_main_file.pdf, accessed 8 March 2012, pp. 12-‐13, 15; ABS, 2001, ‘Early school leavers’, Australian Social Trends, Cat. No. 4102.0, http://www.abs.gov.au/AUSSTATS/[email protected]/2f762f95845417aeca25706c00834efa/3487ff0af8b51db7ca2570ec000c6b0c!OpenDocument, accessed 8 March 2012. 71 ABS, 2010, Persons Not in the Labour Force, Australia, Sep 2010, Cat. No. 6220.0, http://www.abs.gov.au/AUSSTATS/[email protected]/Lookup/6220.0Main+Features1Sep%202010?OpenDocument, accessed 27 April 2012, Table 1. 72 Caia, L, and Gregory, R.G, 2004, ‘Inflows, outflows and the growth of the Disability Support Pension (DSP) program’, Australian Social Policy 2002-‐03, Report published by the former Department of Families, Community Services (FACS), http://fahcsia.gov.au/about/publicationsarticles/research/austsocialpolicy/Documents/austsocpolicy_2002-‐03/article6.htm , accessed 14 June 2012; FaHCSiA, 2011, Characteristics of disability support pension recipients, http://www.fahcsia.gov.au/sa/disability/Documents/dsp_characteristics_june2011.pdf , accessed 14 June 2012.
Future Focus: Discussion Paper 92
73 ABS, 2010, Persons Not in the Labour Force, Australia, Sep 2010, Cat. No. 6220.0, http://www.abs.gov.au/AUSSTATS/[email protected]/Lookup/6220.0Main+Features1Sep%202010?OpenDocument, accessed 27 April 2012, Table 2. 74 Department of Family, Housing, Community Services and Indigenous Affairs, 2011, Characteristics of Disability Support Pension Recipients, http://www.fahcsia.gov.au/sa/disability/Documents/dsp_characteristics_june2011.pdf ,accessed 14 June 2012. 75 O’Brien, M, 2010, Exploring older male worker labour force participation across OECD countries in the context of ageing populations: A reserve army of labour?, Department of Economics, University of Wollongong, Working Paper 01-‐10, http://ro.uow.edu.au/commwkpapers/218/, accessed 14 May 2012 ; Headey, B et al., 2010, Dynamics of mature age workforce participation: Policy effects and continuing trends, Project No. 5/2010, Melbourne Institute of Applied Economic and Social Research, Research commissioned by the Australian Government Department of Education, Employment and Workplace Relations (DEEWR), September, http://www.melbourneinstitute.com/downloads/labour/5-‐10FinalReport.pdf, accessed 14 May 2012; Temple, J et al., 2011, Ageing and the barriers to mature age labour force participation in Australia, prepared by the National Seniors Productive Ageing Centre (NSPAC) on behalf of the Consultative Forum on Mature Age Participation, DEEWR, December, http://www.deewr.gov.au/Employment/Programs/ExpPlus/Documents/AgeingandBarriersLFP.pdf., accessed 14 May 2012 76 ABS 6291.0.55.001 Labour Force, Australia, Detailed -‐ Electronic Delivery Table 01. Labour force status by Social marital status, Age and Sex 77 ABS, 2012, ‘Table 01. Labour force status by Sex – Trend’, Labour Force, Australia, Cat. No. 6202.0, http://www.abs.gov.au/AUSSTATS/[email protected]/DetailsPage/6202.0Mar%202012?OpenDocument, accessed 27 April 2012. 78 ABS Census data, 2006, cited in Kennedy, S et al., 2009, ‘Labour force participation and the influence of educational attainment’, Economic Roundup, Issue 3, p. 24. 79 ABS, 2012, ‘Table 01. Labour force status by Sex – Trend’, Labour Force, Australia, Cat. No. 6202.0, http://www.abs.gov.au/AUSSTATS/[email protected]/DetailsPage/6202.0Mar%202012?OpenDocument, accessed 27 April 2012. 80 Drago, R et al., 2006, Who wants flexibility? Changing work hours preferences and life events, ftp://ftp.iza.org/SSRN/pdf/dp2404.pdf, accessed 27 April 2012. 81 ABS, 2012, ‘Table 22. Labour underutilisation by age and sex – Trend, seasonally adjusted and original’, Labour Force, Australia, Cat. No. 6202.0, http://www.abs.gov.au/AUSSTATS/[email protected]/DetailsPage/6202.0Mar%202012?OpenDocument, accessed 27 April 2012. 82 OECD, 2007, Babies and bosses -‐ reconciling work and family life: A synthesis of findings for OECD countries, http://www.oecd.org/document/45/0,3746,en_2649_34819_39651501_1_1_1_1,00.html, accessed 27 April 2012. 83 AMP-‐NATSEM, 2009, She works hard for the money: Australian women and the gender divide, AMP-‐NATSEM Income and Wealth Report Issue 22, p. 32. 84 NATSEM, 2009, The impact of a sustained gender wage gap on the Australian Economy, http://www.eowa.gov.au/Pay_Equity/Pay_Equity_Information/NATSEM%20Report%2020101%20impact_of_gender_wage_gap[1].pdf, accessed 27 April 2012. 85 OECD, 2011, ‘Chart LMF1.5 A: Gender gap in median earnings of full time workers’, Employment Outlook 2011, OECD Family Database, http://www.oecd.org/dataoecd/29/63/38752746.pdf, accessed 27 April 2012. 86 Graduate Careers Australia, 2011, Graduate Outlook 2011: The report of the Graduate Outlook Survey, http://www.graduatecareers.com.au/wp-‐content/uploads/2012/02/GOS11_Report_FINAL.pdf, accessed 27 April 2012. 87 Department of Families, Housing, Community Services and Indigenous Affairs, 2010, ‘The impact of a sustained gender wage gap on the Australian economy’, http://www.fahcsia.gov.au/sa/women/pubs/general/gender_wage_gap/Pages/default.aspx, accessed 27 April 2012. 88 ABS, 2011, ‘Labour Force’, Gender Indicators, Cat. No. 4125.0, ‘Table 6: Employment by occupation, 20–74 years, 2006–07 to 2009–10. Data calculated as an average of 4 quarters (August, November, February, May) in the financial year. http://www.abs.gov.au/ausstats/[email protected]/Lookup/by+Subject/4125.0~Jul+2011~Main+Features~Labour+force~1110, accessed 27 April 2012. 89 Atkinson, G and Beddie, F, 2011, ‘Introduction’ in Griffin, T and Beddie, F, Older workers: Research readings, NCVER, http://www.ncver.edu.au/publications/2422.html, accessed 27 April 2012, p. 10; McDonald, P, 2011, ‘Employment at older ages in Australia: Determinants and trends’ in Griffin, T and Beddie, F, Older workers: Research Readings, NCVER, http://www.ncver.edu.au/publications/2422.html, accessed 27 April 2012, p. 29. 90 ABS, 2012, Labour Force, Australia, Detailed – Electronic Delivery, Cat. No. 6291.0.55.001, Table 01, Labour force status by Social marital status, Age and Sex, http://www.abs.gov.au/AUSSTATS/[email protected]/DetailsPage/6291.0.55.001Mar%202012?OpenDocument, accessed 27 April 2012. 91 ABS, 2010, ‘Older people and the labour market’, Australian Social Trends, Cat. No. 4102.0, http://www.abs.gov.au/AUSSTATS/[email protected]/Lookup/4102.0Main+Features30Sep+2010, accessed 2 April 2012. 92 ABS, 2011, Survey of Education and Work, Additional Data Cubes, Cat. No. 6227.0.55.003, http://www.abs.gov.au/AUSSTATS/[email protected]/DetailsPage/6227.0.55.003May%202011?OpenDocument, accessed 27 April 2012, Persons aged 15-‐64 years who have completed Year 12 (or equivalent) or attained a formal qualification at Certificate III level or above. 93 ABS, 2008, Adult Literacy and Life Skills Survey, Cat. No. 4228.0, http://www.abs.gov.au/ausstats/[email protected]/mf/4228.0, accessed 27 April 2012. 94 ABS, 2008, Adult Literacy and Life Skills Survey, Cat. No. 4228.0, http://www.abs.gov.au/ausstats/[email protected]/mf/4228.0, accessed 27 April 2012. 95 Department of Education, Employment and Workplace Relations, ‘Reconciliation Action Plan (RAP) 2009-‐2011’ http://www.deewr.gov.au/Indigenous/Employment/Pages/default.aspx, accessed 1 March 2012. 96 ABS, 2006, Population Characteristics, Aboriginal and Torres Strait Islander Australians, Cat. No. 4713.0 cited in ABS, ‘Indigenous Statistics for Schools’, 2010, http://www.abs.gov.au/websitedbs/cashome.nsf/4a256353001af3ed4b2562bb00121564/3fa8ec177831c470ca25758b001232d2!OpenDocument, accessed 2 March 2012. 97 Aged 15-‐64 years: ABS, 2011, ‘Table 1. Labour force status by Remoteness, Indigenous persons aged 15 years and over – 2010’, Labour Force Characteristics of Aboriginal and Torres Strait Islander Australians, Estimates from the Labour Force Survey, 2010, Cat. No. 6287.0, http://www.abs.gov.au/AUSSTATS/[email protected]/DetailsPage/6287.02010?OpenDocument, accessed 27 April 2012.
Future Focus: Discussion Paper 93
98 ABS, 2011, ‘Table 1. Labour force status by Remoteness, Indigenous persons aged 15 years and over – 2010’, Labour Force Characteristics of Aboriginal and Torres Strait Islander Australians, Estimates from the Labour Force Survey, 2010, Cat. No. 6287.0, http://www.abs.gov.au/AUSSTATS/[email protected]/DetailsPage/6287.02010?OpenDocument, accessed 27 April 2012. 99 ABS, 2011, ‘Table 1. Labour force status by Remoteness, Indigenous persons aged 15 years and over – 2010’, Labour Force Characteristics of Aboriginal and Torres Strait Islander Australians, Estimates from the Labour Force Survey, 2010, Cat. No. 6287.0, http://www.abs.gov.au/AUSSTATS/[email protected]/DetailsPage/6287.02010?OpenDocument, accessed 27 April 2012. 100 Australian Government, 2011, Closing the Gap: Prime Minister’s Report 2011, http://www.fahcsia.gov.au/sa/indigenous/pubs/closing_the_gap/2011_ctg_pm_report/Documents/2011_ctg_pm_report.pdf, accessed 9 May 2012, p. 17. 101 ABS, 2010, ‘Table 12’, Disability, Ageing and Carers, Australia: Summary of Findings, 2009, Cat. No. 4430.0, http://www.abs.gov.au/AUSSTATS/[email protected]/DetailsPage/4430.02009?OpenDocument, accessed 27 April 2012. 102 ABS, 2009, ‘Education’, Disability, Australia, Cat. No. 4446.0, http://www.abs.gov.au/ausstats/[email protected]/Lookup/4446.0main+features102009, accessed 2 May 2012; ABS, 2011, ‘Year 12 Attainment’, Australian Social Trends, Cat. No. 4102.0, http://www.abs.gov.au/AUSSTATS/[email protected]/Lookup/4102.0Main+Features40Mar+2011, accessed 2 May 2012; ABS, 2009, ‘Disability and Mental Health’, Perspectives on Education and Training: Social Inclusion, Cat. No. 4250.0.55.001, http://www.abs.gov.au/ausstats/[email protected]/Lookup/4250.0.55.001Main+Features52009, accessed 2 May 2012. 103 Australian Human Rights Commission, 2005, Employment and disability – The statistics, National Inquiry into Employment and Disability, Issues Paper 1, http://www.hreoc.gov.au/disability_rights/employment_inquiry/papers/issues1.htm, accessed 27 April 2012. 104 ‘Social investment’ refers to the provision of capital assets to some social purpose or enterprise, or more broadly to activities conducive to this. 105 ] Anheier, H K,2010, ‘From nonprofits and philanthropy to social investment’ paper delivered at 2010 CSI International Research Conference Intersecting transformations: Business and the third sector, http://www.socialtraders.com.au/sites/www.socialtraders.com.au/files/Centre%20for%20Social%20Impact.pdf, accessed 27 April 2012, p. 22. 106 Brotherhood of St Laurence, 2011, ‘Social enterprise’, http://www.bsl.org.au/Services/Employment-‐and-‐training/Social-‐enterprise.aspx, accessed 18 May 2012. 107 Skill Australia, 2011, Skills for prosperity: a roadmap for vocational education and training, http://www.skillsaustralia.gov.au/tertiary-‐sector-‐reform/skills-‐for-‐prosperity/documents/SkillsProsperityRoadmap.pdf, accessed 30 April 2012, p. 65. 108 Daley, J, and Lancy, A, 2011, Investing in regions: Making a difference, Grattan Institute, May, http://www.grattan.edu.au/pub_page/086_report_regional_development.html, accessed 9 May 2012, p. 3. 109 ‘In 2009-‐10, SA had the second slowest state growth rate of all states and territories, behind Tasmania.’ ABS, 2011, Regional Population Growth, Australia, 2009-‐10, Cat. No. 3218.0, http://www.abs.gov.au/ausstats/[email protected]/Products/3218.0~2009-‐10~Main+Features~South+Australia?OpenDocument, accessed 5 March 2012. 110 Gregory, R and Hunter, B, 1995, ‘The macro economy and the growth of ghettos and urban poverty in Australia’, Discussion Paper No. 325, Economics Program, Research School of Social Sciences, Australian National University. 111 Money, money, money−is this a rich man’s world?, 2004, AMP.NATSEM Income and Wealth Report Issue 8, September 2004. Figures are for 2001. It should be noted that ‘about one in every 4.5 individuals living in the lowest income neighbourhoods is aged 60 years and over, compared with only one in every 6 in the highest income neighbourhoods’. This figure is based on statistical local areas rather than postcodes (AMP-‐NATSEM, 2008, Advance Australia fair?: Trends in small area socioeconomic inequality, 2001 to 2006, AMP-‐NATSEM Income and Wealth Report, Issue 20). 112 Department of Education, Employment and Workplace Relations, 2011, Skills Shortages: Western Australia, Labour Market Research and Analysis Branch, December, http://www.deewr.gov.au/Employment/LMI/SkillShortages/Documents/WASkillShortages_Dec2011.pdf, accessed 23 April 2012. 113 Strong, T, 2011, ‘Labour Market Conditions in Northern Adelaide’, Labour Market Research and Analysis Branch, Department of Education, Employment and Workplace Relations, 17 May, http://www.deewr.gov.au/Employment/LMI/RegionalReports/SA/Documents/NorthernAdelaidePresentation.pdf, accessed 6 March 2012. 114 Australian Housing and Urban Research Institute, 2005, Why low-‐income households move: the search for affordable housing and employment, AHURI UNSW-‐UWS Research Centre, Issue 53, March, www.ahuri.edu.au/publications/download/rap_issue_53, accessed 29 May 2012. 115 Daley, J, and Lancy, A, 2011, ‘Figure 1: Australian population distribution’, Investing in regions: Making a difference, Grattan Institute, May, http://www.grattan.edu.au/pub_page/086_report_regional_development.html, accessed 9 May 2012, p. 9. 116 Hugo, G, 2012, ‘Policies and Programs for Regional Migration and Settlement,’ conference presentation at A Long Way Home? The Rural and Regional Resettlement Experience of Visible Migrants and Refugees, University of Melbourne, 10 February, http://www.ssps.unimelb.edu.au/__data/assets/pdf_file/0004/538276/hugo-‐policies-‐programs-‐regional-‐migration.pdf, accessed 7 May 2012. 117 Daley, J, and Lancy, A, 2011, Investing in regions: Making a difference, Grattan Institute, May, http://www.grattan.edu.au/pub_page/086_report_regional_development.html, accessed 9 May 2012, p. 3. 118 Spooner, R, 2012, ‘Fly-‐in fly-‐out saves millions’, Sydney Morning Herald, 18 April, http://www.smh.com.au/business/flyin-‐flyout-‐saves-‐millions-‐fortescue-‐tells-‐inquiry-‐20120417-‐1x5hy.html, accessed 30 April 2012. 119 Tomaney, J, 2010, Place-‐based approaches to regional development: Global trends and Australian implications, report for the Australian Business Foundation, http://www.tcinetwork.org/media/asset_publics/resources/000/004/399/original/place_based_competitiveness_australia.pdf, accessed 27 April 2012, p. 26. 120 Deceglie, A, 2012, ‘Fly-‐in, fly-‐out workers quitting hard life’, The Sunday Times, 14 April, http://www.perthnow.com.au/news/fly-‐in-‐fly-‐out-‐workers-‐quitting-‐hard-‐life/story-‐e6frg12c-‐1226326651683, accessed 30 April 2012. 121 Tomaney, J, 2010, Place-‐based approaches to regional development: Global trends and Australian implications, report for the Australian Business Foundation, http://www.tci-‐network.org/media/asset_publics/resources/000/004/399/original/place_based_competitiveness_australia.pdf, accessed 27 April 2012, p. 26.
Future Focus: Discussion Paper 94
122 ABS, 2012, Labour Force, Australia, Cat No. 6202.0, http://www.abs.gov.au/AUSSTATS/[email protected]/DetailsPage/6202.0Mar%202012?OpenDocument, accessed 30 April 2012, Table 12. Original series. Population: Male civilian population aged 15 years and over. 123 ABS, 2012, Labour Force, Australia, Cat No. 6202.0, http://www.abs.gov.au/AUSSTATS/[email protected]/DetailsPage/6202.0Mar%202012?OpenDocument, accessed 30 April 2012, Table 12. Original series. 124 ABS, 2011, ‘Table 05. Employed persons by State and Industry’, Labour Force, Australia, Detailed Quarterly, Nov 2011, Cat. No. 6291.0.55.003, http://www.abs.gov.au/AUSSTATS/[email protected]/DetailsPage/6291.0.55.003Nov%202011?OpenDocument, accessed 30 April 2012. 125 ABS, 2011, Education and Work, Australia, May 2011, Cat. No. 6227.0, http://www.abs.gov.au/AUSSTATS/[email protected]/Lookup/6227.0Main+Features100May%202011?OpenDocument, accessed 30 April 2012, Table 14 Persons aged 15-‐64 years, Level of highest educational attainment–by state or territory of usual residence and sex. 126 Department of Education, Employment and Workplace Relations, 2010, Northern and Western Adelaide Survey of Employers’ Recruitment Experiences cited in Strong, T, 2011, ‘Labour Market Conditions in Northern Adelaide’, Labour Market Research and Analysis Branch, DEEWR, 17 May, http://www.deewr.gov.au/Employment/LMI/RegionalReports/SA/Documents/NorthernAdelaidePresentation.pdf, accessed 6 March 2012. 127 Data from the Survey of Employers who have Recently Advertised (SERA). Department of Education, Employment and Workplace Relations, 2011, Skills shortages – Summary, Labour Market Research and Analysis Branch, September, http://www.deewr.gov.au/Employment/LMI/SkillShortages/Documents/SkillShortagesSummary2011.pdf, accessed 23 April 2012. 128 Smoothed unemployment rate, Australian Standard Geographical Classification database. ABS, 2011, Australian Standard Geographical Classification (AGSC), Cat. No. 1216.0, http://www.abs.gov.au/AUSSTATS/[email protected]/Lookup/1216.0Main+Features1July%202011?OpenDocument, accessed 30 April 2012. 129 ABS, 2009, A Picture of the Nation: The Statistician’s Report on the 2006 Census, Cat. No. 2070.0, http://www.abs.gov.au/AUSSTATS/[email protected]/Latestproducts/2070.0Main%20Features99992006?opendocument&tabname=Summary&prodno=2070.0&issue=2006&num=&view=, accessed 30 April 2012, p. 139. 130 Department of Education, Employment and Workplace Relations, 2011, Electrotechnology and telecommunications trades, Labour Market Research and Analysis Branch, September, http://www.deewr.gov.au/Employment/LMI/SkillShortages/Documents/ElectrotechnologyandTelecommunicationsPaper.pdf, accessed 23 April 2012. 131 Department of Education, Employment and Workplace Relations, 2011, Skills Shortages: Western Australia, Labour Market Research and Analysis Branch, December, http://www.deewr.gov.au/Employment/LMI/SkillShortages/Documents/WASkillShortages_Dec2011.pdf, accessed 23 April 2012. 132 Mitchell, W, 2008, ‘Migration and labour market outcomes by skill in Australia’, Australian Fair Pay Commission Minimum Wage Research Forum, http://www.fairpay.gov.au/NR/rdonlyres/43D6C5C4-‐9150-‐43CA-‐8317-‐66121AA6E9D3/0/Paper1_Prof_WilliamMitchell_UniversityofNewcastle.pdf, accessed 14 June 2012. 133 ABS, 2011, ‘Interstate migration’, Migration 2009-‐10, Cat. No. 3412.0, http://www.ausstats.abs.gov.au/ausstats/subscriber.nsf/0/CAC6E05106F66A13CA2578B000119F19/$File/34120_2009-‐10.pdf, accessed 14 June 2012. 134 ABS, 2011, ‘Interstate migration’, Migration 2009-‐10, Cat. No. 3412.0, http://www.ausstats.abs.gov.au/ausstats/subscriber.nsf/0/CAC6E05106F66A13CA2578B000119F19/$File/34120_2009-‐10.pdf, accessed 14 June 2012. 135 Barr et al ,2006, An evaluation of the impact of retrenchment at Mitsubishi focussing on affected workers, their families and communities: implications for human services policies and practices, HSRIP report, Flinders University, April, http://som.flinders.edu.au/FUSA/PublicHealth/AHIP/PDF/MMAL_Report.pdf, accessed 14 June 2012; Department of Education, Employment and Workplace Relations, 2010, Resourcing the Future, National Resources Sector Employment Taskforce Discussion Paper, Australian Government, July, http://www.deewr.gov.au/Skills/Programs/National/nrset/Documents/FinalReport.pdf, accessed 14 June 2012. 136 Regional Development Australia, Adelaide Metropolitan Advisory Board, 2010, Strategic Plan 2010-‐13, http://www.rdaadelaide.com.au/sites/default/files/general_page/2010/07/rda_adelaide_strategic_plan_final_pdf_14237.pdf, accessed 8 March 2012; Carson, E and Kerr, L, 2010, Northern Adelaide Skills, Workforce and Employment Blueprint, 2010, Northern Futures Inc and SA Department of Further Education, Employment, Science and Technology (DFEEST), http://www.northernfutures.org.au/site/DefaultSite/filesystem/documents/Final%20NF%20Report_280311.pdf, accessed 6 March 2012. 137 Strong, T, 2011, ‘Labour Market Conditions in Northern Adelaide’, Labour Market Research and Analysis Branch, Department of Education, Employment and Workplace Relations, 17 May, http://www.deewr.gov.au/Employment/LMI/RegionalReports/SA/Documents/NorthernAdelaidePresentation.pdf, accessed 6 March 2012. 138 As other research has pointed out, however, the average demographics by SLA disguises a number of sub-‐regional ‘pockets’ of disadvantage such as the relatively high numbers of humanitarian migrants in Port Adelaide Enfield, Indigenous people in Playford and other Culturally and Linguistically Diverse (CALD) populations in particular suburbs. Carson, E and Kerr, L, 2010, Northern Adelaide Skills, Workforce and Employment Blueprint 2010, Northern Futures Inc and SA Department of Further Education, Employment, Science and Technology (DFEEST), http://www.northernfutures.org.au/site/DefaultSite/filesystem/documents/Final%20NF%20Report_280311.pdf, accessed 6 March 2012; Strong, T, 2011, ‘Labour Market Conditions in Northern Adelaide’, Labour Market Research and Analysis Branch, Department of Education, Employment and Workplace Relations, 17 May, http://www.deewr.gov.au/Employment/LMI/RegionalReports/SA/Documents/NorthernAdelaidePresentation.pdf, accessed 6 March 2012. 139 Strong, T, 2011, ‘Labour Market Conditions in Northern Adelaide’, Labour Market Research and Analysis Branch, Department of Education, Employment and Workplace Relations, 17 May, http://www.deewr.gov.au/Employment/LMI/RegionalReports/SA/Documents/NorthernAdelaidePresentation.pdf, accessed 6 March 2012. 140 My School data reported in Strong, T, 2011, ‘Labour Market Conditions in Northern Adelaide’, Labour Market Research and Analysis Branch, Department of Education, Employment and Workplace Relations, 17 May, http://www.deewr.gov.au/Employment/LMI/RegionalReports/SA/Documents/NorthernAdelaidePresentation.pdf, accessed 6 March 2012, p. 7.
Future Focus: Discussion Paper 95
141 Strong, T, 2011, ‘Labour Market Conditions in Northern Adelaide’, Labour Market Research and Analysis Branch, Department of Education, Employment and Workplace Relations, 17 May, http://www.deewr.gov.au/Employment/LMI/RegionalReports/SA/Documents/NorthernAdelaidePresentation.pdf, accessed 6 March 2012. 142 Strong, T, 2011, ‘Labour Market Conditions in Northern Adelaide’, Labour Market Research and Analysis Branch, Department of Education, Employment and Workplace Relations, 17 May, http://www.deewr.gov.au/Employment/LMI/RegionalReports/SA/Documents/NorthernAdelaidePresentation.pdf, accessed 6 March 2012. 143 Department of Education, Employment and Workplace Relations, 2010, Northern and Western Adelaide Survey of Employers’ Recruitment Experiences cited in Strong, T, 2011, ‘Labour Market Conditions in Northern Adelaide’, Labour Market Research and Analysis Branch, Department of Education, Employment and Workplace Relations, 17 May, http://www.deewr.gov.au/Employment/LMI/RegionalReports/SA/Documents/NorthernAdelaidePresentation.pdf, accessed 6 March 2012. 144 ABS, 2012, ‘Table 15 Labour force status by Sex and Educational attendance -‐ Persons aged 15 to 19 years’, Labour Force, Australia, Cat No. 6202.0, http://www.abs.gov.au/AUSSTATS/[email protected]/DetailsPage/6202.0Mar%202012?OpenDocument, accessed 30 April 2012. 145 The Smith Family, 2011, Unequal opportunities: Life chances for children in the ‘Lucky Country’, http://www.thesmithfamily.com.au/webdata/resources/files/natsem__final_web.pdf, accessed 30 April 2012. 146 Foundation for Young Australians, 2008, How Young People are Faring, http://www.fya.org.au/downloads/FYA_HYPAFReport_ONLINE_68pp.pdf, accessed 30 April 2012, p. 8. 147 Department of Education, Employment and Workplace Relations Labour Market Information Portal, Labour Force Region, http://www.deewr.gov.au/lmip/default.aspx?LMIP/LFR/QLD/GoldCoast, accessed 8 March 2012. (Data source: ABS Labour Force Survey. Data are three month average original data to January 2012 except for the teenage full-‐time unemployment rate and teenage full-‐time unemployment to population ratio which are 12 month average original data to January 2012. ABS Labour Force Survey estimates at the regional level, particularly for teenage unemployment, are subject to high levels of sampling error, and as such should be used with caution.) 148 Notes: (1) As data is for aggregate labour force regions (including a number of SLAs), only those with large labour forces yield reliable samples. Data for NT and ACT are not included as they are not able to be disaggregated into smaller regions. (2) Unemployment rates are 12 month averages to April 2012, while working age population (15-‐64) is the number at April 2012. ABS Labour Force Survey estimates at the regional level, particularly for teenage unemployment, are subject to high levels of sampling error, and as such should be used with caution. 149 Froy, F eds. et al., 2009, Designing Local Skills Strategies, OECD, http://www.oecd.org/document/45/0,3746,en_2649_34417_43882413_1_1_1_1,00.html, accessed 27 April 2012. 150 Hackett, L et al., 2012, The way we’ll work: Labour market trends and preparing for the hourglass, University Alliance, http://www.unialliance.ac.uk/wp-‐content/uploads/2012/03/The-‐way-‐well-‐work-‐final-‐for-‐web.pdf, accessed 27 April 2012, p. 2. 151 Stevens, G, 2012, Economic Conditions and Prospects, Address to the Credit Suisse 15th Asian Investment Conference 2012, Hong Kong, 19 March, http://www.rba.gov.au/speeches/2012/sp-‐gov-‐190312.html, accessed 27 April 2012. 152 Meehan, C, Flat vs hierarchical organizational structure, http://smallbusiness.chron.com/flat-‐vs-‐hierarchical-‐organizational-‐structure-‐724.html, accessed 7 June 2012. 153 Graduate Careers Australia, 2006, Enhancing the GCA National Surveys: An Examination of critical factors leading to enhancements in the instrument, methodology and process, http://www.dest.gov.au/NR/rdonlyres/D8C1B81C-‐103F-‐4FBA-‐97AE-‐302A8B6D54C4/14584/GDSEPnationalreportFINAL050606withISBN.pdf, accessed 20 April 2012. 154 NCVER, 2011, Students and courses, unpublished data. 155 Mavromaras, K, et al, 2012, The persistence of overskilling and its effects on wages, NCVER. 156 Froy, F eds et al., 2009, Designing Local Skills Strategies, OECD, http://www.oecd.org/document/45/0,3746,en_2649_34417_43882413_1_1_1_1,00.html, accessed 27 April 2012. 157 Hackett, L et al., 2012, The way we’ll work: Labour market trends and preparing for the hourglass, University Alliance, http://www.unialliance.ac.uk/wp-‐content/uploads/2012/03/The-‐way-‐well-‐work-‐final-‐for-‐web.pdf, accessed 27 April 2012, p. 19. 158 Richardson, S and Teese, R, 2006, ‘A well-‐skilled future,’ A well-‐skilled future: Tailoring VET to the emerging labour market – Research overviews, NCVER, http://www.ncver.edu.au/publications/1721.html, accessed 27 April 2012. 159 NCVER, 2011, ‘Students and Courses,’ unpublished data. 160 DEEWR, 2011, ‘Higher education commencements, domestic students,’ unpublished data. 161 Lebihan, R ‘Miners study plan for associate degree’, Australian Financial Review, 30 April 2012, http://www.tda.edu.au/cb_pages/files/Miners%20study%20plan%20for%20associate%20degee,%20AFR%2030%20April%202012.pdf, accessed 6 June 2012. 162 Foster, S et al., 2007, Higher level vocational education and training qualifications: Their importance in today’s training market, NCVER, http://www.ncver.edu.au/publications/1800.html, accessed 27 April 2012. 163 Carnevale, A.P et al., 2010, Help wanted: Projections of jobs and education requirements through 2018, Centre on Education and the Workforce, Georgetown University, http://www9.georgetown.edu/grad/gppi/hpi/cew/pdfs/FullReport.pdf, accessed 4 June 2012. 164 Birrell, B et al, 2008, Higher education in Australia− Demand and supply issues: A report for the Review of Australian Higher Education. 165 Hackett, L et al., 2012, The way we’ll work: Labour market trends and preparing for the hourglass, University Alliance, http://www.unialliance.ac.uk/wp-‐content/uploads/2012/03/The-‐way-‐well-‐work-‐final-‐for-‐web.pdf, accessed 27 April 2012. 166 Colegrave, A.D., 2006, Why study at a mature age? An analysis of the private returns to university education in Australia, University of Western Australia Business School, Perth, p. 1, http://www.business.uwa.edu.au/__data/assets/pdf_file/0009/99288/06_11_Colegrave.pdf, accessed 15 May 2012. 167 Long and Shah, 2008, cited in Noonan, P et al., 2010, ‘Table 1.1 Estimated rates of return to VET qualifications’, Investment in Vocational Education and Training (VET): Supporting data and analysis, A report to the Board of Skills Australia, March. 168 Colegrave, A.D., 2006, ‘Why study at a mature age? An analysis of the private returns to university education in Australia’, University of Western Australia Business School, Perth, p. 1, http://www.business.uwa.edu.au/__data/assets/pdf_file/0009/99288/06_11_Colegrave.pdf, accessed 15 May 2012. 169 Australian Government, Working together for a clean energy future: Our plan, http://www.cleanenergyfuture.gov.au/clean-‐energy-‐future/our-‐plan/, accessed 17 April 2012. 170 Van Ballegooyen, J, 2012, ‘Australia’s Green Skills Policy Framework’, presentation at the Green Economy – Green Skills Symposium, Melbourne, 13 April.
Future Focus: Discussion Paper 96
171 European Union, 2010, ‘Emissions Trading Systems (EU ETS)’, http://ec.europa.eu/clima/policies/ets/index_en.htm, accessed 23 April 2012. 172 Australian Government, 2012, ‘Australia and Europe to unite on Emissions Trading Schemes’, http://www.cleanenergyfuture.gov.au/australia-‐and-‐europe-‐to-‐unite-‐on-‐emissions-‐trading-‐schemes/, accessed 23 April 2012. 173 Ministerial Council for Tertiary Education and Employment, 2010, Green Skills Agreement Implementation Plan 2010-‐2011, http://www.deewr.gov.au/Skills/Programs/WorkDevelop/ClimateChangeSustainability/Documents/GreenSkillsAgreement.pdf, accessed 23 April 2012. 174 Department of Education, Employment and Workplace Relations, 2011, ‘Climate Change and Skills for Sustainability’, http://www.deewr.gov.au/Skills/Programs/WorkDevelop/ClimateChangeSustainability/Pages/GreenSkillsAgreement.aspx, accessed 23 April 2012. 175 The PwC Melbourne Institute Asialink Index 2011 measures Australia –Asia engagement across trade, investment, education, tourism, migration business development and humanitarian assistance finds that in 2004 trade engagement with Asia overtook our trade with the rest of the world and in 2010 it grew by 9.3 per cent to be 44 percent above our trade with the rest of the world. Melbourne Institute of Applied Economic and Social Research, PwC Melbourne Institute Asialink Index, http://www.pwc.com.au/publications/asialink/assets/Asialink-‐Dec11.pdf, accessed 27 April 2012. 176 Department of Foreign Affairs and Trade, 2012, Australia’s Trade Performance 1990-‐91 to 2010-‐11, http://www.dfat.gov.au/publications/stats-‐pubs/australias-‐trade-‐performance-‐1990-‐91-‐2010-‐11.pdf, accessed 27 April 2012. 177 Department of Foreign Affairs and Trade, 2011, Trade at a Glance 2011, http://www.dfat.gov.au/publications/trade/trade-‐at-‐a-‐glance-‐2011.html, accessed 26 April 2012; Centre for International Economics, 2009, Benefits of trade and trade liberalisation, http://www.dfat.gov.au/publications/benefits_trade_liberalisation/cie_report.pdf, accessed 26 April 2012. 178 Borland, J, 2012, A focus on skills will allow Australia to reap fruits of its labour, http://theconversation.edu.au/a-‐focus-‐on-‐skills-‐will-‐allow-‐australia-‐to-‐reap-‐fruits-‐of-‐its-‐labour-‐6306, accessed 27 April 2012. 179 Australian Industry Group and Asialink, 2011, Engaging Asia: Getting it right for Australian business, http://www.asialink.unimelb.edu.au/__data/assets/pdf_file/0007/428470/asialink_aigroup_joint_reportMarch2011.pdf, accessed 27 April 2012. 180 Department of Prime Minister and Cabinet, Australia in the Asian Century: Improving Australians Asia-‐ relevant capabilities’, http://asiancentury.dpmc.gov.au/submissions/summary/capabilities, accessed 27 April 2012. 181 Department of Immigration and Citizenship, 2010, ‘Fact Sheet 15 -‐ Population Projections’, http://www.immi.gov.au/media/fact-‐sheets/15population.htm, accessed 3 April 2012. 182 Addison, T and Worswick, C, 2002, ‘The impact of immigration on the earnings of natives: Evidence from Australian micro data,’ Economic Record, 78 (240), March, pp. 68-‐78. 183 Withers, G, 2003, ‘Immigration’ in McAllister, I et al. (eds.) The Cambridge Handbook of the Social Sciences in Australia, Cambridge University Press, Cambridge. 184 Withers, G, 2003, ‘Immigration’ in McAllister, I et al. (eds.) The Cambridge Handbook of the Social Sciences in Australia, Cambridge University Press, Cambridge. 185 Department of Immigration and Citizenship, 2012, ‘Fact Sheet 20 -‐ Migration Program Planning Levels’, http://www.immi.gov.au/media/fact-‐sheets/20planning.htm, accessed 27 February 2012. 186 Department of Immigration and Citizenship, 2012, ‘Fact Sheet 20 -‐ Migration Program Planning Levels’, http://www.immi.gov.au/media/fact-‐sheets/20planning.htm, accessed 27 February 2012. 187 ABS 2012, Learning and Work, Australia, 2010-‐11, Cat. No. 4235.0, http://www.abs.gov.au/ausstats/[email protected]/productsbyCatalogue/1839355F55AC72F6CA2579AA000F256C?OpenDocument, accessed 27 April 2012. 188 ABS, 2006, Migrants, General Social Survey, Cat. No. 3415.0 http://www.abs.gov.au/ausstats/[email protected]/Products/3415.0~2008~Chapter~Housing?OpenDocument, accessed 27 April 2012. 189 Department of Immigration and Citizenship, 2012, Immigration update: July to December 2011, http://www.immi.gov.au/media/publications/statistics/immigration-‐update/update-‐july-‐dec11.pdf, accessed 21 April 2012. 190 Department of Immigration and Citizenship, 2011, New Zealand Citizens Present in Australia – Country of Birth by Quarterly Report 2010‑11, http://www.immi.gov.au/media/statistics/statistical-‐info/temp-‐entrants/nz.htm, accessed 29 May 2012. 191 Department of Immigration and Citizenship, 2011 (BE4356.06) ‘457 Primary visa grants by select ANZSIC Industry of employer, last 5 program years.’ 192 ENS Primary visa grants by select ANZSIC Industry of employer, last 5 program years, Department of Immigration and Citizenship, 2011, unpublished data. 193 Australian Visa Bureau, 2012, ‘Australian visa rules relaxed for hospitality workers’, 26 January, http://www.visabureau.com/australia/news/26-‐01-‐2012/australian-‐visa-‐rules-‐relaxed-‐for-‐hospitality-‐workers.aspx, accessed 21 April 2012. 194 Department of Immigration and Citizenship, 2011, Guide to the 457 Program for the Tourism and Hospitality Industries, http://www.immi.gov.au/skilled/_pdf/tourism-‐info-‐pack.pdf, accessed 21 April 2012. 195 Deloitte Access Economics, 2011, Broader implications from a downturn in international students, report for Universities Australia, 30 June. 196 Universities Australia, 2009, ‘Education stronger as Australia’s third largest export’, Media Release, http://www.universitiesaustralia.edu.au/page/media-‐centre/2009-‐media-‐releases/education-‐third-‐largest-‐export/, accessed 20 April 2012. 197 Australian Education International, 2011, ‘Australia Overview’, https://aei.gov.au/International-‐network/Australia/countryoverview/Pages/Countryoverview-‐Australia.aspx, accessed 21 April 2012. 198 Australian Trade Commission, ‘Working while you study’, http://www.studyinaustralia.gov.au/en/Study-‐Costs/Working/Working-‐while-‐you-‐study, accessed 21 April 2012. 199 Iqbal, M, ‘Why are fewer international students choosing to study in Australia?’, QS Top Universities, http://www.topuniversities.com/australia/why-‐are-‐fewer-‐international-‐students-‐choosing-‐study-‐australia, accessed 21 April 2012; Australian Education International, 2011, ‘Australia Overview’, https://aei.gov.au/International-‐network/Australia/countryoverview/Pages/Countryoverview-‐Australia.aspx, accessed 21 April 2012.
Future Focus: Discussion Paper 97
200 Iqbal, M, ‘Why are fewer international students choosing to study in Australia?’, QS Top Universities, http://www.topuniversities.com/australia/why-‐are-‐fewer-‐international-‐students-‐choosing-‐study-‐australia, accessed 21 April 2012. 201 Lewis, P, 2008, The labour market, skills demand and skills formation, Occasional Paper 6, Skills Australia and Academic of the Social Sciences Australia, Canberra, http://hdl.voced.edu.au/10707/79951, accessed 30 April 2012. 202 Saliba, G and Withers, G, 2009, ‘Scenario Analysis for Strategic Thinking’, in Argyrous, G, eds., Evidence for Policy and Decision-‐Making: A Practical Guide, University of New South Wales Press. 203 Australian innovation system report–2011, Australian Government. 204 The 1.7 million figure is comprised of an additional 1.23 million employed people through employment growth holding Certificate III or above, and almost 450,000 people holding Certificate III or above to replace people who have left the workforce204 205 Lowe, P, ‘Developments in the mining and non-‐mining economies’, Address to the ADC Future Summit, 14 May 2012, http://www.rba.gov.au/speeches/2012/sp-‐dg-‐140512.html, accessed 6 June 2012. 206 Note that the level of education for each occupation has been determined by the current modal qualification for each occupation, that is, by the qualification currently held by the greatest number of workers in an occupation. Note also that it does not follow that most of the graduates with the modal qualification for a certain occupation will be employed in this occupation. 207 Under the new scenarios, the absolute number of qualifications held by employed people is generally less than in the Australian Workforce Futures scenarios, despite the higher growth rates. This is due in part to a lower base year used for the projections. The Open Doors scenario saw employment of those with qualifications grow from an estimated 7.03 million in 2010 to 11.57 million in 2025, whereas the new Long Boom scenario sees growth from 6.78 million in 2011 to 11.36 million in 2025. The initial point (although a year later) is lower because of the use of SEW 2011 data. In addition, the total level growth in the latter value is suppressed as it is only 14 years (rather than 15), although the annual growth level (as with the annual growth average) is notably higher. 208 ABS, Education and Work (Cat. no. 6227.0), May 2011. 209 ABS, 2011, Perspectives on Education and Training: Pathways in Vocational and Higher Education, 2009, Cat. No. 4250.0.55.002, http://www.abs.gov.au/ausstats/[email protected]/Lookup/4250.0.55.002Main+Features42009, accessed 11 May 2012. 210 Deloitte Access Economics, Economic modelling of skills demand and supply, forthcoming. 211 Note that the increase in qualifications held in each scenario is netof the loss of persons with qualifications who have retired. Hence the increase in the number of qualifications held by persons employed shown in Table 10 is less than the qualifications demanded over the period that is implied in Table 9. 212 COAG Reform Council report for Skills and workforce development 2010, September 2011. 213 ABS, 2011, Survey of Education and Work, Cat no. 6227.0 http://www.abs.gov.au/ausstats/[email protected]/Products/6227.0~May+2011~Main+Features~Attainment?OpenDocument, accessed 19 June 2012. 214 PricewaterhouseCoopers, Talent Mobility 2020: The next generation of international assignments, http://www.pwc.com/gx/en/managing-‐tomorrows-‐people/future-‐of-‐work/pdf/talent-‐mobility-‐2020.pdf, accessed 7 May 2012, pp. 6-‐7, 15. 215 SkillsInfo, 2010, New Jobs: Employment trends and prospects for Australian industries, http://www.skillsinfo.gov.au/sites/default/files/documents/newjobs2010.pdf, accessed 8 May 2012; Shorten, B, 2012, ‘Sydney Institute address: The Future of Work is Having a Good Job’, Sydney, 4 April, http://ministers.deewr.gov.au/shorten/sydney-‐institute-‐address-‐future-‐work-‐having-‐good-‐job, accessed 7 May 2012; Australian Human Resources Institute, 2010, people@work/2020: The Future of Work and the Changing Workplace: Challenges and Issues for Australian HR Practitioners, http://www.ahri.com.au/MMSDocuments/profdevelopment/research/research_papers/fow_white_paper.pdf, accessed 7 May 2012. 216 Shorten, B, 2012, ‘Sydney Institute address: The Future of Work is Having a Good Job’, Sydney, 4 April, http://ministers.deewr.gov.au/shorten/sydney-‐institute-‐address-‐future-‐work-‐having-‐good-‐job, accessed 7 May 2012; Australian Human Resources Institute, 2010, people@work/2020: The Future of Work and the Changing Workplace: Challenges and Issues for Australian HR Practitioners, http://www.ahri.com.au/MMSDocuments/profdevelopment/research/research_papers/fow_white_paper.pdf, accessed 7 May 2012; Brown, P et al., 2011, The Global Auction: The Broken Promise of Education, Jobs, and Incomes, Oxford University Press. 217 PricewaterhouseCoopers, Talent Mobility 2020: The next generation of international assignments, http://www.pwc.com/gx/en/managing-‐tomorrows-‐people/future-‐of-‐work/pdf/talent-‐mobility-‐2020.pdf, accessed 7 May 2012, pp. 6-‐7. 218 PricewaterhouseCoopers, Talent Mobility 2020: The next generation of international assignments, http://www.pwc.com/gx/en/managing-‐tomorrows-‐people/future-‐of-‐work/pdf/talent-‐mobility-‐2020.pdf, accessed 7 May 2012, p. 16. 219 Littleton, S M et al., 2000, ‘The future of boundaryless careers’ in Collin, A, and Young, R A, 2000, eds., The future of career, Cambridge University Press, pp. 101-‐114. 220 Darwin, A, 2000, ‘Critical reflections on mentoring in work settings’, Adult Education Quarterly, vol. 50 no. 3, May, pp. 197-‐211. 221 Australian Bureau of Statistics, 2012, Labour Force, Australia, Mar 2012, Cat. No 6202.0, http://www.abs.gov.au/ausstats/[email protected]/mf/6202.0, accessed 8 May 2012. 222 Australian Bureau of Statistics, 2012, Forms of Employment, Australia, November 2011, Cat. No 6359.0, http://www.abs.gov.au/ausstats/[email protected]/mf/6359.0, accessed 8 May 2012. 223 ACTU, 2012, Lives on hold: Unlocking the potential of Australia’s workforce: The report of the Independent Inquiry into Insecure Work in Australia, http://www.actu.org.au/Images/Dynamic/attachments/7626/Lives%20on%20Hold%20-‐%20Unlocking%20the%20potential%20of%20Australia%e2%80%99s%20workforce_v2.pdf, accessed 1 June 2012. 224 Australian Bureau of Statistics, 2010, Education and training experience, 2009, Cat. No 6278.0, March, http://www.abs.gov.au/ausstats/[email protected]/mf/6278.0, accessed 8 May 2012. 225 Australian Bureau of Statistics, 2011, Forms of Employment, November 2010, Cat. No 6359.0, http://www.abs.gov.au/ausstats/[email protected]/mf/6359.0, accessed 8 May 2012. 226 Australia Bureau of Statistics, 2006, Australia, Working Population Profile: W02 Employment type by age by sex table, http://www.censusdata.abs.gov.au/ABSNavigation/prenav/ViewData?action=404&documentproductno=0&documenttype=Details&order=1&tabname=Details&areacode=0&issue=2006&producttype=Community%20Profiles&&producttype=CommunityProfiles&javascript=true&textversion=false&navmapdisplayed=true&breadcrumb=PLD&&collection=Census&period=2006&producttype=Community Profiles&, accessed 4 June 2012. 227 Australian Bureau of Statistics, 2011, Forms of Employment, http://www.abs.gov.au/AUSSTATS/[email protected]/allprimarymainfeatures/A9CA77BFF6370AA3CA2568A90013941B, accessed 22 May 2012.
Future Focus: Discussion Paper 98
228 Productivity Commission, 2006, The role of non-‐traditional work in the Australian labour market, Commission Research Paper, Melbourne, May. 229 Australian Council of Trade Unions, 2011, Voices from Working Australia, www.actu.org.au, accessed 22 May 2012. 230 Australian Bureau of Statistics, 2006, Self-‐Employed Aboriginal and Torres Strait Islander People, http://www.abs.gov.au/ausstats/[email protected]/productsbyCatalogue/9F82431D52819BC5CA2575EB00155E27, accessed 22 May 2012. 231 Department of Education, Employment and Workplace Relations, 2012, Jobs Services Australia, http://www.deewr.gov.au/EMPLOYMENT/JSA/Pages/default.aspx, accessed 23 May 2012. 232 Department of Education, Employment and Workplace Relations, 2012, National Workforce Development Fund, http://www.deewr.gov.au/Skills/Programs/SkillTraining/nwdf/Pages/default.aspx, accessed 25 May 2012. 233 Pocock, B et al., 2011, Juggling work, home and learning in low paid occupations: A qualitative study, NCVER, http://www.ncver.edu.au/publications/2369.html, accessed 9 May 2012. 234 Skills Australia, 2012, Better Use of Skills Better Outcomes: A research report on skills utilisation in Australia (forthcoming). 235 Green, R, 2009, Management Matters in Australia: Just how productive are we? Findings from the Australian Management Practices and Productivity global benchmarking project, http://www.innovation.gov.au/Industry/ReportsandStudies/Documents/ManagementMattersinAustraliaReport.pdf, accessed 15 March 2012, p. 6. 236 Cutler, T et al., 2008, Venturous Australia: Building strength in innovation, http://www.innovation.gov.au/Innovation/Policy/Documents/NISReport.pdf, accessed 23 April 2012, pp. 53-‐55. 237 Industry Task Force on Leadership and Management Skills, 1995, Enterprising Nation: Renewing Australia’s Managers to Meet the Challenges of the Asia-‐Pacific Century [the Karpin Report], http://www.aim.com.au/research/EN_ReportonSkills.pdf, accessed 23 March 2012. 238 Cutler, T et al., 2008, Venturous Australia: Building strength in innovation, http://www.innovation.gov.au/Innovation/Policy/Documents/NISReport.pdf, accessed 23 April 2012, pp. 53 – 55. 239 Samson, D, 2011, Karpin Report Revisited: Leadership and Management Challenges in Australia, http://www.ibsa.org.au/Portals/ibsa.org.au/docs/Project%20Related/Business%20Services/leadership%20and%20produtivity%20reports/IBSA%20REPORT%20-‐%20Karpin.pdf, accessed 19 March 2012, p. 24. 240 Samson, D, 2011, Karpin Report Revisited: Leadership and Management Challenges in Australia, http://www.ibsa.org.au/Portals/ibsa.org.au/docs/Project%20Related/Business%20Services/leadership%20and%20produtivity%20reports/IBSA%20REPORT%20-‐%20Karpin.pdf, accessed 19 March 2012, p. 23. 241 The report Venturous Australia examined how management education and skills can contribute to improving productivity and innovation (Cutler, T et al., 2008, Venturous Australia: Building strength in innovation, http://www.innovation.gov.au/Innovation/Policy/Documents/NISReport.pdf, accessed 15 March 2012, pp. 56-‐7). The Department of Education, Employment and Workplace Relations (DEEWR) funded a study of the leadership, culture and management practices of high performing workplaces in Australia in 2011. (Boedker, C et al, 2011, Leadership, Culture and Management Practices of High Performing Workplaces in Australia: The High Performing Workplaces Index, http://www.deewr.gov.au/Skills/Programs/WorkDevelop/Documents/SKEHPW.pdf, accessed 16 March 2012, p. 5.). Skills Australia has just published a collection of case studies Better use of skills, better outcomes: Australian case studies, which looks at the practices of successful business. (Skill Australia, 2012, Better use of skills, better outcomes: Australian case studies, http://www.skillsaustralia.gov.au/publications/documents/Better-‐use-‐of-‐skills-‐better-‐outcomes-‐Australian-‐Case-‐Studies-‐April-‐2012.pdf, accessed 18 April 2012.) The recent Future of Management Forum run by the Australian Business Deans Council has considered management education in Australia and the role of business schools amongst other issues relating to management leadership. This work is expected to lead to a number of innovative projects in the area of management education. 242 Australian Institute of Management, 2009, Australia’s Workplace ‘Skills Gap’: Managers give their views on the impact of the escalating skills crisis, http://www.aimqld.com.au/research/documents/AustraliasWorkforceSkillsGap09.pdf, accessed 16 March 2012, p. 8; Samson, D, 2011, Karpin Report Revisited: Leadership and Management Challenges in Australia, http://www.ibsa.org.au/Portals/ibsa.org.au/docs/Project%20Related/Business%20Services/leadership%20and%20produtivity%20reports/IBSA%20REPORT%20-‐%20Karpin.pdf, accessed 19 March 2012. 243 The Society for Knowledge Economics, 2009, Leading Australia to More Innovative, Productive and Fulfilling Workplaces – The Role of Government, http://www.ibsa.org.au/Portals/ibsa.org.au/docs/reports/Society%20for%20Knowledge%20Economics%20(2009)%20Leading%20Australia%20Report%20November%2021%20Nov%202009%20FINAL.pdf, accessed 19 March 2012, pp. 13, 16-‐7, 61-‐62; Wright, J and Sissons, P, 2012, The Skills Dilemma: Skills Under-‐Utilisation and Low-‐Wage Work, http://www.theworkfoundation.com/DownloadPublication/Report/307_Skills%20Dilemma.pdf, accessed 19 March 2012, p. 30. An example of research into leadership and management and its impact on productivity and other workplace issues: Ernst & Young, 2011, Wastage adds up despite motivated workers: The Ernst & Young Australian Productivity Pulse, http://www.ey.com/Publication/vwLUAssets/Wastage_Adds_Up/$FILE/Wastage_Adds_Up_Despite_Motivated_Workers.pdf, accessed 16 March 2012. 244 Runnalls, M and Boedker, C, 2009, IBSA Enterprise Summit, Paper presented to the IBSA Enterprise Summit, Canberra, p. 9. 245 Woods, D, 2007, The role of VET in helping young people’s transition into work, NCVER. 246 G. Marks, 2006, The transition to full-‐time work of young people who do not go to university, Research report 49, Melbourne: Australian Council for Educational Research. 247 Woods, D, 2007 The role of VET in helping young people’s transition into work, NCVER. 248 Anlezark, A et al., 2006, Have school vocational education and training programs been successful? NCVER. 249 Karmel, T, 2010, ‘Trade apprenticeships hit by GFC in 2009’, Media Release, NCVER, 9 July, http://www.ncver.edu.au/newsevents/mediareleases/mr_55.html, accessed 30 May 2012. 250 NCVER, 2010, Australian vocational education and training statistics: Apprentice and trainee destinations. 251 Dickie, M et al., 2011, A fair deal: Apprentices and their employers in NSW 2011, http://www.bvet.nsw.gov.au/pdf/afairdealfinalreport.pdf, accessed 1 June 2012.
Future Focus: Discussion Paper 99
252 Misko, J et al., 2007, Doing an apprenticeship: : What young people think, NCVER; Boswell, T, 2011, Advanced apprenticeships: Progression routes in vocational education, Institute for Public Policy Research, London; Murray, J, 2012, ‘A plan for apprenticeship success’, Guardian, 15 May. 253 GCA, 2011, Graduate Salaries 2010, Graduate Careers Australia, p. 1, http://www.graduatecareers.com.au/wp-‐content/uploads/2012/01/gca002415.pdf, accessed 27 May 2012. Refers to median starting salary for bachelor degree graduates aged less than 25 and in their first full-‐time employment (self-‐reported in the Graduate Destination Survey (GDS) by graduates who qualified for the award of a bachelor degree in the calendar year 2009). The median salary of those graduates aged 25 and over with previous full-‐time employment experience was $2,000 (or 3.8 per cent) higher than the comparative group of graduates in their first full-‐time employment in 2010. (N.B. combined data for all age and job experience cohorts is not available in the survey results as ‘a direct comparison of salary levels between older graduates with previous full-‐time employment experience and younger graduates in their first full-‐time employment is confounded by the fact that it is unclear whether age or previous full-‐time employment experience is responsible for higher salary levels,’ p.6. 254 Refers to apprenticeship and traineeship completers of all ages. More than two thirds, 67.6 per cent, of completers and 16.0 per cent of non-‐completers were employed with the same employer after their apprenticeship or traineeship. NCVER, 2010, Australian vocational education and training statistics: Apprentice and trainee destinations. 255 Graduate Opportunities, ‘Skills Employers Want’, http://www.graduateopportunities.com/career_advice/skills_employers_want, accessed 20 April 2012. 256 Jackling, B and De Lange, P, 2008, ‘Do accounting graduates’ skills meet the expectations of employers? A matter of convergence or divergence’, Accounting Education: An International Journal, vol. 18, nos. 4-‐5, pp. 369-‐385. 257 Volkov, A and Volkov, M, 2007, ‘Teamwork and assessment: A critique’, e-‐Journal of Business Education & Scholarship of Teaching, vol. 1, no. 1, pp. 59-‐64. 258 Smith, E and Comyn, P, 2003, The development of employability skills in novice workers, NCVER, http://www.ncver.edu.au/publications/992.html, accessed 9 May 2012. 259 Freudenberg, B et al., 2010, ‘The penny drops: can work integrated learning improve students’ learning?’, e-‐Journal of Business Education & Scholarship of Teaching, vol. 4, no. 1, pp. 42-‐61. 260 Orrell, J, 2004, Work-‐integrated learning programmes: management and educational quality, Proceedings of the Australian Universities Quality Forum 2004, AUQA Occasional Publication; Higher education base funding review: Base funding report, 2011, http://www.deewr.gov.au/HigherEducation/Policy/BaseReview/Documents/HigherEd_FundingReviewReport.pdf, accessed 25 May 2012. 261 Withers, G, 2012, ‘Mixing business and academia’, Australian Financial Review, 4 June; Universities Australia, 2008, A National Internship Scheme: Enhancing the skills and work-‐readiness of Australian university graduates, Position Paper No. 3/08, May. 262 Universities Australia, 2008, A National Internship Scheme: Enhancing the skills and work-‐readiness of Australian university graduates, Position Paper No. 3/08, May. 263 See, for example, http://www.brisbane.qld.gov.au/about-‐council/careers/graduates-‐trainees/graduates-‐cadets/cadetships/index.htm and http://www.latrobe.edu.au/scitecheng/study/industry-‐cadetships-‐and-‐placements/cadetship. 264 ABS, 2012, Table 01. Labour force status by Social marital status, Age and Sex, Labour Force, Australia, Detailed, Cat. no. 6291.0.55.001, January 2012. 265 National Quality Council, 2009, VET products for the 21st Century; National Quality Council, 2010, Design model for streamlined training package material. 266 NCVER, 2010, Australian vocational education and training statistics: Apprentice and trainee destinations. 267 Council of Australian Governments, 2012, National Partnership Agreement on Skills Reform. 268 Woods, D, 2007, The role of VET in helping young people’s transition into work, NCVER. 269 Coates, H and Rothman, S, 2008, LSAY briefing number 15: Participation in VET in Schools, Australian Council for Educational Research. 270 Commonwealth of Australia, 2012, ‘Budget measures,’ Budget paper, No. 2, 2012-‐13, p. 221. 271 Wright, G, 2012, ‘National Trade Cadetships -‐ Fact Sheet’, http://www.scribd.com/doc/34564003/National-‐Trade-‐Cadetships-‐Fact-‐Sheet, accessed 4 June 2012. 272 Indigenous youth career pathways project, http://www.deewr.gov.au/indigenous/pages/iycpp.aspx, accessed 7 June 2012; the Hon. Peter Garrett, Indigenous ranger cadetships to start at school, media release 16 May 2011, http://ministers.deewr.gov.au/garrett/indigenous-‐ranger-‐cadetships-‐start-‐school, accessed 7 June 2012. 273 ABS, 2011, Survey of Education and Work, Additional Data Cubes, Cat. No. 6227.0.55.003, http://www.abs.gov.au/AUSSTATS/[email protected]/DetailsPage/6227.0.55.003May%202011?OpenDocument, accessed 27 April 2012. 274 Participants in the Skills Australia Engineering Pathways seminar in December 2011 agreed the need to better define the purpose and job outcomes of Diploma qualifications. There is growing evidence of an acute shortage of para-‐professional engineers, but at the same time, engineering and related technologies completions at the para-‐professional level are low, with only 3,571 Diploma, Advanced Diploma and Associate Degree completions in 2009. It is unclear whether this is due to poor marketing of job outcomes in this area, mismatch in qualification design or other factors. (Watson, L and McIntyre, J, 2011, Scaling Up: Building engineering workforce capacity through education and training, http://www.anet.org.au/?p=137, accessed 30 April 2012; Skills Australia, 2011, Engineering Pathways Seminar Background Paper, http://www.skillsaustralia.gov.au/events-‐and-‐stakeholder-‐forums/documents/Engineering-‐Seminar-‐Background-‐Paper.pdf, accessed 30 April 2012.) 275 Lebihan, R, 2012, ‘Miners study plan for associate degree’, Australian Financial Review, 30 April, http://afr.com/p/national/education/miners_study_plan_for_associate_JDfzVnoQW8NZ9HVmSsmNeJ, accessed 1 May 2012. 276 Department of Innovation, Industry, Science and Research, 2011, Australian innovation system report 2011, Australian Government. 277 Chubb, I, 2012, Health of Australian science 2012, Office of the Chief Scientist, http://www.chiefscientist.gov.au/wp-‐content/uploads/OCS_Health_of_Australian_Science_LOWRES1.pdf, accessed 29 May 2012. 278 In the most recent OECD Program for International Student Assessment (PISA) study, 12 countries performed significantly higher than Australia in mathematical literacy, seven of whom had outperformed Australia in this area of assessment in 2003 and 2006 as well. (Thomson, S, et al., 2009, Challenges for Australian Education: Results from PISA 2009, Australian Council for Educational Research, http://www.acer.edu.au/documents/PISA-‐Report-‐2009.pdf, accessed 30 April 2012). 279 Health of Australian science, 2012, Office of the Chief Scientist, http://www.chiefscientist.gov.au/wp-‐content/uploads/OCS_Health_of_Australian_Science_LOWRES1.pdf, accessed 29 May 2012.
Future Focus: Discussion Paper 100
280 Health of Australian science, 2012, Office of the Chief Scientist, http://www.chiefscientist.gov.au/wp-‐content/uploads/OCS_Health_of_Australian_Science_LOWRES1.pdf, accessed 29 May 2012. 281 Watson, L, 2011, Scaling up, http://www.anet.org.au/wp-‐content/uploads/2011/06/ANET-‐Scaling-‐Up.pdf, accessed 29 May 2012. 282 See for example Universities Australia, 2011, Submission to the Higher Education Base Funding Review, http://www.universitiesaustralia.edu.au/resources/594/1059, accessed 25 May 2012. 283 Mawer, G and Jackson, E, 2005, Training of existing workers: Issues, incentives and models, Australian National Training Authority, NCVER, http://www.ncver.edu.au/publications/1551.html, accessed 20 June 2012. 284 Universities Australia, 2008, Submission to Review of Higher Education. 285 Misko, J, 2008, Combining formal, non-‐formal and informal learning for workforce skills development, Australian Industry Group, NCVER, www.ncver.edu.au/google_search.html?cx=005466847542416725873%3Aerakacnadz0&cof=FORID%3A11&ie=UTF-‐8&q=informal+training&siteurl=www.ncver.edu.au%2Fpublications%2Fbytheme.html&ref=www.ncver.edu.au%2Fpublications%2F270.html, accessed 19 June 2012. 286 Higher education base funding review: Base funding report, 2011, http://www.deewr.gov.au/HigherEducation/Policy/BaseReview/Documents/HigherEd_FundingReviewReport.pdf, accessed 25 May 2012. 287 Zammit, K, et al., 2007, Teaching and Leading for Quality Australian Schools: A Review and Synthesis of Research-‐based Knowledge, http://www.aitsl.edu.au/verve/_resources/Teaching_and_Leading_for_Quality_Australian_Schools.pdf, accessed 30 April 2012; Goe, L, 2007, The Link Between Teacher Quality and Student Outcomes: A Research Synthesis, National Comprehensive Centre for Teacher Quality, http://www.tqsource.org/publications/LinkBetweenTQandStudentOutcomes.pdf, accessed 30 April 2012; Rowe, K, 2004, The importance of teaching: ensuring better schooling by building teacher capacities that maximize the quality of teaching and learning provision – implications of findings from the international and Australian evidence-‐based research, submission to the Australian Council for Educational Research, http://research.acer.edu.au/learning_processes/, accessed 30 April 2012. 288 Van Onselen, P, ‘Secure grants or you’re likely to publish and perish,’ The Australian, 14 September 2011, http://www.theaustralian.com.au/higher-‐education/secure-‐grants-‐or-‐youre-‐likely-‐to-‐publish-‐and-‐perish/story-‐e6frgcjx-‐1226136118991, accessed 6 June 2012. 289Jung, I, 2005, ‘Innovative and good practices of open and distance learning in Asia and the Pacific’, APEID, UNESCO Bangkok Occasional Paper Series, Paper No. 3, October, http://unesdoc.unesco.org/images/0015/001529/152961e.pdf accessed 14 June 2012; Withers, G, 2012, ‘Mixing business and academia’, Australian Financial Review, 4 June. 290 Australian Council for Educational Research, 2011, ‘University retention and completion rates have improved’, Media release, 7 November, http://www.acer.edu.au/media/university-‐retention-‐and-‐completion-‐rates-‐have-‐improved/ accessed 14 June 2012; Australian Council for Educational Research, 2011, ‘Joining the Dots,’ Research Briefing, vol. 1, no. 6, October; Dunn, A, 2002, ‘Get in, stay in, or drop out’, The Age, 22 August. 291Bradley, D et al., 2008, Review of Australian Higher Education, p71; Lomax-‐Smith, J, et al., 2011, Higher Education Base Funding Review, Final Report, pp 27-‐28. 292Lomax-‐Smith, J et al., 2011, Higher Education Base Funding Review, Final Report, p. 19. 293 Productivity Commission, 2011, Vocational Education and Training Workforce, http://www.pc.gov.au/__data/assets/pdf_file/0009/108369/vocational-‐workforce.pdf, accessed 27 April 2012, p. 44; Hugo, G and Morriss, A, 2010, Investigating the ageing academic workforce: Stocktake, http://www.professions.com.au/Files/Academic_Workforce_Study.pdf, accessed 27 April 2012. (Hugo and Morriss estimate that in the next five years the Australian university sector will need to ‘replace almost half of its staff’). 294 Coates, H and Goedegebuure, L, 2010, The Real Academic Revolution, http://www.lhmartininstitute.edu.au/userfiles/files/research/the_real_academic_revolution.pdf, accessed 27 April 2012, p. 14. 295Productivity Commission, 2011, Vocational Education and Training Workforce, http://www.pc.gov.au/__data/assets/pdf_file/0009/108369/vocational-‐workforce.pdf, accessed 27 April 2012, pp. 40-‐41. 296 The Commission found on a headcount basis about 65% of TAFE trainers and assessors are employed on a non permanent basis and in the non TAFE sector survey data indicate that a maximum of two thirds of trainers and assessors are employed on a permanent or ongoing basis. Productivity Commission, 2011, Vocational Education and Training Workforce, http://www.pc.gov.au/__data/assets/pdf_file/0009/108369/vocational-‐workforce.pdf, accessed 27 April 2012, pp. 40-‐41. 297 Department of Education, Employment and Workplace Relations, 2011, Higher education base funding review: Final Report, http://www.deewr.gov.au/HigherEducation/Policy/BaseReview/Documents/HigherEd_FundingReviewReport.pdf, accessed 25 May 2012. 298 Southern Cross University, 2012, Teaching and Curriculum http://www.scu.edu.au/teachinglearning/tlc/index.php/21, accessed on 29/05/2012. 299 Norton, A, 2012, Call in the Professionals published in The Age, Tuesday 24 April 2012. 300 Skills Australia, 2011, Skills for prosperity, p. 143. 301 Skills Australia, 2011, Skills for prosperity pp. 41-‐42 302 Department of Education, Employment and Workplace Relations (2012) Higher education statistics, unpublished data. 303 Evans, C, 2012, Speech to the Universities Australia Higher Education Conference 2012, Hotel Realm, Canberra, 7 March. 304 NCVER, 2010, Students and Courses: Australian vocational education and training statistics, http://www.ncver.edu.au/publications/2383.html, accessed 30 April 2012. 305 Gallagher, M, 2012, Plot loss in Australian Higher education policy, Conference on Institutional Performance in Higher Education, Melbourne. 306 Lomax-‐Smith, J et al., 2011, Higher Education Base Funding Review Final Report, pp. 3-‐4. 307 Productivity Commission, Report on government services 2012, Table 5A.19, http://www.pc.gov.au/__data/assets/pdf_file/0018/114912/government-‐services-‐2012-‐volume1.pdf, accessed 19 June 2012. 308 Funding per student annual hour declined by 19.4 per cent in the decade to 2009, in real terms. Productivity Commission, 2012, Report on Government Services: Volume 1: Early childhood, education and training; Justice; Emergency management, http://www.pc.gov.au/__data/assets/pdf_file/0018/114912/government-‐services-‐2012-‐volume1.pdf, accessed 30 April 2012, Table 5A.19 Government real recurrent expenditure per annual hour. 309 See http://www.tda.edu.au/cb_pages/files/TDA%20National%20Charter%202012.pdf.
Future Focus: Discussion Paper 101
310 COAG, 2012, National Partnership Agreement on Skills Reform, http://www.coag.gov.au/coag_meeting_outcomes/2012-‐04-‐13/docs/NPA_Skills_Reform.pdf, accessed 30 April 2012. 311 Gallagher, M, 2012, Plot loss in Australian Higher education policy, Conference on Institutional Performance in Higher Education, Melbourne. p. 8. 312 Higher education base funding review: Base funding report, 2011, http://www.deewr.gov.au/HigherEducation/Policy/BaseReview/Documents/HigherEd_FundingReviewReport.pdf, accessed 25 May 2012. 313 Parliament of Australia, 2011, Tertiary Education Quality and Standards Agency Bill 2011 and Tertiary Education Quality and Standards Agency (Consequential Amendments and Transitional Provisions) Bill 2011, http://www.aph.gov.au/Parliamentary_Business/Committees/Custom_Contents/SenateCommittees/eetctte/teqsa/report/c01, accessed 29 May 2012. 314 Skills Australia, 2011, Skills for Prosperity, p. 81 315 National Institute of Labour Studies, 2012, Developing a methodology for analysing the impact of demand based funding in higher education on meeting Australia’s skills needs, Interim report to Skills Australia by the NILS. p. 10. 316 NCVER, 2012, Insight, eNewsletter from the NCVER, Issue 45, March, http://www.ncver.edu.au/newsevents/insight/issue45.html, accessed 30 April 2012. 317 NCVER, 2011, Student Outcomes: Australian vocational education and training statistics, http://www.ncver.edu.au/publications/2442.html, accessed 30 April 2012. 318 Minister Hall, quoted in Campus Review, 23 April 2012. 319 National Institute of Labour Studies, 2012, Developing a methodology for analysing the impact of demand based funding in higher education on meeting Australia’s skills needs, Interim report to Skills Australia by the NILS, pp. 34 and 40. 320 See http://www.ausindustry.gov.au/programs/innovation-‐rd/RD-‐TaxIncentive/Pages/default.aspx. 321 Wheelahan, L and Moodie, G, 2012, Rethinking Skills in Vocational Education and Training: From Competencies to Capabilities, NSW Office of Education, http://www.bvet.nsw.gov.au/pdf/rethinking_skills.pdf, accessed 30 April 2012. 322 Wheelahan, L and Moodie, G, 2012, Rethinking Skills in Vocational Education and Training: From Competencies to Capabilities, NSW Office of Education, http://www.bvet.nsw.gov.au/pdf/rethinking_skills.pdf, accessed 30 April 2012. 323 Wheelahan, L and Moodie, G, 2012, Rethinking Skills in Vocational Education and Training: From Competencies to Capabilities, NSW Office of Education, http://www.bvet.nsw.gov.au/pdf/rethinking_skills.pdf, accessed 30 April 2012, p. 32. 324 The Integrated Articulation and Credit Transfer (IACT) project, also referred to as the “3D project” was instigated in 2011 as a response to the persistent lack of articulation between industry, the higher education sector and the VET sector. By applying a 3D focus, the IACT project has sought to test and document practical strategies to improve credit transfer outcomes between the sectors. As of yet, the project’s uptake has been limited (Paez D et al., 2011, Articulation: A clearer picture or a new view?, http://3darticulation.com.au/wp-‐content/uploads/00-‐Capstone-‐8.pdf, accessed 6 June 2012). 325 Billett, S et al., 2012, Change, work and learning: aligning continuing education and training, NCVER, http://www.ncver.edu.au/publications/2484.html, accessed 30 April 2012, p. 12. 326 Billett, S, et al., 2012, Change, work and learning: aligning continuing education and training, Working paper, NCVER, http://www.ncver.edu.au/publications/2484.html, accessed 30 April 2012, p. 11. 327 Withers, G and MacIntyre, A, 2012, Australia in the Asian Century: Submission: Knowledge Nation Initiatives for the Asian Century, submission for the White Paper on Australia in the Asian Century, http://asiancentury.dpmc.gov.au/sites/default/files/public-‐submissions/glenn-‐withers-‐andrew-‐macintyre.pdf, accessed 30 April 2012. 328 Pomfret, R, 2012, ‘More than a farm on top of a mine: Australia’s soft power potential in Asia’, The Conversation, 17 April, http://theconversation.edu.au/more-‐than-‐a-‐farm-‐on-‐top-‐of-‐a-‐mine-‐australias-‐soft-‐power-‐potential-‐in-‐asia-‐6328, accessed 30 April 2012. 329 Bowman, D and Lawlor, J, 2010, Evidence and experience: Report on the Individual Placement and Support project for disadvantaged job seekers with mental health issues, Brotherhood of St Laurence, http://www.bsl.org.au/pdfs/BowmanLawlor_Evidence_and_experience_report_on_IPS_2010.pdf, accessed 9 May 2012. 330 National VET Equity Advisory Council, 2010, Equity blueprint 2011-‐2015 – Creating futures: Achieving potential through VET, Australian Government. 331 National Adult Literacy Agency, 2010, Identifying and reducing barriers to participation in adult literacy and numeracy tuition, NALA Briefing Paper, http://www.nala.ie/sites/default/files/press_release_image-‐2010-‐September/files/Research%20Briefing%20Paper%202010.pdf, accessed 8 March 2012. This paper quotes as evidence: Bailey, I and Coleman, U, 1998, Access and Participation in Adult Literacy Schemes, NALA; King, J, 2004, ‘Living with Literacy and a Chronic Illness’, Literacies, Fall, 4; McGivney, V, 2004, Fixing or Changing the Patterns, National Institute of Adult Continuing Education; and Norman, M and Hyland, T, 2003, ‘The Role of Confidence in Lifelong Learning’, Educational Studies, 29, 2-‐3. 332 Productive Ageing Centre and National Seniors Australia, 2011, Ageing and Barriers to Labour Force Participation in Australia, Consultative Forum on Mature Age Participation, http://www.deewr.gov.au/Employment/Programs/ExpPlus/Documents/AgeingandBarriersLFP.pdf, accessed 27 April 2012. 333 Taylor, P, 2011, ‘Ageism and age discrimination in the labour market and employer responses’, in Griffin, T and Beddie, F, Older workers: Research Readings, NCVER, http://www.ncver.edu.au/publications/2422.html, accessed 27 April 2012, p. 59. 334 Skinner, N and King, P, 2008, Investigating the low-‐paid workforce: Employment characteristics, training and work-‐life balance, NCVER, http://w3.unisa.edu.au/hawkeinstitute/cwl/documents/investigating-‐low-‐paid.pdf, accessed 30 April 2012. 335 Pocock, B et al., 2011, Work, life and VET participation amongst lower-‐paid workers, NCVER, http://www.ncver.edu.au/publications/2378.html, accessed 30 April 2012. 336 Pocock, B et al., 2011, Work, life and VET participation amongst lower-‐paid workers, NCVER, http://www.ncver.edu.au/publications/2378.html, accessed 30 April 2012. 337 Pocock, B et al., 2011, Work, life and VET participation amongst lower-‐paid workers, NCVER, http://www.ncver.edu.au/publications/2378.html, accessed 30 April 2012. 338 Watson, I, 2008, ‘Low Paid Jobs and Unemployment: Churning in the Australian Labour Market, 2001 to 2006’, Australian Journal of Labour Economics Vol. 11, No. 1, http://www.ianwatson.com.au/pubs/watson_ajle_2008.pdf, accessed 30 April 2012. 339 Pocock, B et al., 2011, Work, life and VET participation amongst lower-‐paid workers, NCVER, http://www.ncver.edu.au/publications/2378.html, accessed 30 April 2012.
Future Focus: Discussion Paper 102
340 Disability Employment Services, 2011, Job in Jeopardy Guidelines, http://foi.deewr.gov.au/node/190, accessed 9 May 2012. 341 Howard, R, 2011, ‘Leading Business Women tell Tax Summit ‘What Women Want’’, Knowledge Today, University of New South Wales, Sydney, 30 September, http://blogs.unsw.edu.au/knowledgetoday/blog/2011/09/, accessed 29 February 2012. 342 Doiron, D and Kalb, G, 2005, ‘Demand for child care and household labour supply in Australia’, The Economic Record, vol. 81, no. 254, pp 215-‐236; Rammohan, A and Whelan, S, 2005, ‘Child care and female employment decisions’, Australian Journal of Labour Economics, vol. 8, no. 2, pp 203-‐225; Davidoff, I, 2007, Evidence on the child care market, http://www.treasury.gov.au/documents/1221/PDF/04_child_care.pdf, accessed 3 April 2012. 343 Richardson, D, 2009, The impact of the recession on women, background paper, The Australia Institute, August, http://www.security4women.org.au/wp-‐content/uploads/IP-‐3-‐Women-‐in-‐the-‐recession-‐S4Wl.pdf, accessed 27 April 2012, pp. 13-‐14. 344 Richardson, D, 2009, The impact of the recession on women, background paper, The Australia Institute, August, http://www.security4women.org.au/wp-‐content/uploads/IP-‐3-‐Women-‐in-‐the-‐recession-‐S4Wl.pdf, accessed 27 April 2012, pp. 13-‐14. 345 Richardson, D, 2009, The impact of the recession on women, background paper, The Australia Institute, August, http://www.security4women.org.au/wp-‐content/uploads/IP-‐3-‐Women-‐in-‐the-‐recession-‐S4Wl.pdf, accessed 27 April 2012, pp. 13-‐14. 346 Australian Financial Review, 15 February 2012, pp. 52-‐53 347 See for example Dubourg, L et al., 2006, ‘Can job sharing work for nurse managers?’, Journal of the Australian Healthcare and Hospitals Association, Vol. 30, No. 1, pp. 17-‐24. 348 Tomaney, J, 2010, ‘Place-‐based approaches to regional development: Global trends and Australian implications’, Report for the Australian Business Foundation, http://www.tcinetwork.org/media/asset_publics/resources/000/004/399/original/place_based_competitiveness_australia.pdf, accessed 27 April 2012, p. 26. 349 Barnett, K and Spoehr, J, 2008, Complex not simple: the vocational education and training pathway from welfare to work, NCVER, http://www.ncver.edu.au/publications/1987.html, accessed 30 April 2012. 350 The Australasian Institute of Mining and Metallurgy, 2011, Submission to the House Standing Committee On Regional Australia Inquiry Into the use of ‘fly-‐in, fly-‐out’ (FIFO) workforce Practices in regional Australia, http://www.ausimm.com.au/content/docs/submission_to_regional_australia_inquiry.pdf, accessed 30 April 2012, p. 5. 351 Skills Australia, 2011, ‘Skills Australia submission to the House of Representatives Standing Committee on Regional Australia’, October, http://www.skillsaustralia.gov.au/sector-‐specific-‐skill-‐needs/documents/FIFOsubmission.pdf, accessed 30 April 2012. 352 Skills Australia, 2011, ‘Skills Australia submission to the House of Representatives Standing Committee on Regional Australia’, October, http://www.skillsaustralia.gov.au/sector-‐specific-‐skill-‐needs/documents/FIFOsubmission.pdf, accessed 30 April 2012. 353 Daley, J, and Lancy, A, 2011, Investing in regions: Making a difference, Grattan Institute, May, http://www.grattan.edu.au/pub_page/086_report_regional_development.html, accessed 9 May 2012, p. 3. 354 Department of Education, Employment and Workplace Relations, 2011, Regional Education, Skills and Jobs, http://www.deewr.gov.au/Skills/Programs/RESJ/Pages/default.aspx, accessed 30 April 2012. 355 Department of Education, Employment and Workplace Relations, 2011, Regional Education, Skills and Jobs, http://www.deewr.gov.au/Skills/Programs/RESJ/Pages/default.aspx, accessed 30 April 2012. 356 Skill Australia, 2011, Skills for prosperity: a roadmap for vocational education and training, http://www.skillsaustralia.gov.au/tertiary-‐sector-‐reform/skills-‐for-‐prosperity/documents/SkillsProsperityRoadmap.pdf, accessed 30 April 2012, p. 70. 357 Data provided by the Department of Education, Employment and Workplace Relations.