further assessment of mvd effects in sld applications · jen-ching tsao and david n. anderson ohio...
TRANSCRIPT
Jen-Ching Tsao and David N. Anderson
Ohio Aerospace Institue, Brook Park, Ohio
Further Assessment of MVD Effects in SLDApplications
NASA/CR—2006-214125
February 2006
AIAA–2005–0072
https://ntrs.nasa.gov/search.jsp?R=20060008168 2019-02-07T16:29:48+00:00Z

NASA STI Program . . . in Profile
Since its founding, NASA has been dedicated to the
advancement of aeronautics and space science. The
NASA Scientific and Technical Information (STI)
program plays a key part in helping NASA maintain
this important role.
The NASA STI Program operates under the auspices
of the Agency Chief Information Officer. It collects,
organizes, provides for archiving, and disseminates
NASA’s STI. The NASA STI program provides access
to the NASA Aeronautics and Space Database and its
public interface, the NASA Technical Reports Server,
thus providing one of the largest collections of
aeronautical and space science STI in the world.
Results are published in both non-NASA channels and
by NASA in the NASA STI Report Series, which
includes the following report types:
• TECHNICAL PUBLICATION. Reports of
completed research or a major significant phase
of research that present the results of NASA
programs and include extensive data or theoretical
analysis. Includes compilations of significant
scientific and technical data and information
deemed to be of continuing reference value.
NASA counterpart of peer-reviewed formal
professional papers but has less stringent
limitations on manuscript length and extent of
graphic presentations.
• TECHNICAL MEMORANDUM. Scientific
and technical findings that are preliminary or
of specialized interest, e.g., quick release
reports, working papers, and bibliographies that
contain minimal annotation. Does not contain
extensive analysis.
• CONTRACTOR REPORT. Scientific and
technical findings by NASA-sponsored
contractors and grantees.
• CONFERENCE PUBLICATION. Collected
papers from scientific and technical
conferences, symposia, seminars, or other
meetings sponsored or cosponsored by NASA.
• SPECIAL PUBLICATION. Scientific,
technical, or historical information from
NASA programs, projects, and missions, often
concerned with subjects having substantial
public interest.
• TECHNICAL TRANSLATION. English-
language translations of foreign scientific and
technical material pertinent to NASA’s mission.
Specialized services also include creating custom
thesauri, building customized databases, organizing
and publishing research results.
For more information about the NASA STI
program, see the following:
• Access the NASA STI program home page at
http://www.sti.nasa.gov
• E-mail your question via the Internet to
• Fax your question to the NASA STI Help Desk
at 301–621–0134
• Telephone the NASA STI Help Desk at
301–621–0390
• Write to:
NASA STI Help Desk
NASA Center for AeroSpace Information
7121 Standard Drive
Hanover, MD 21076–1320
Jen-Ching Tsao and David N. Anderson
Ohio Aerospace Institute, Brook Park, Ohio
Further Assessment of MVD Effects in SLDApplications
NASA/CR—2006-214125
February 2006
National Aeronautics and
Space Administration
Glenn Research Center
Cleveland, Ohio 44135
AIAA–2005–0072
Prepared for the
43rd Aerospace Sciences Meeting and Exhibit
sponsored by the American Institute of Aeronautics and Astronautics
Reno, Nevada, January 10–13, 2005
Prepared under Cooperative Agreement NCC3–884 and NCC3–938
Acknowledgments
The NASA Glenn Research Center Icing Branch contributed to the work reported here. The IRT studies were supported under a
grant from NASA to the Ohio Aerospace Institute. The authors wish to thank Tom Bond, Chief of the NASA Glenn Icing
Branch, for his support of these tests and the IRT personnel for their excellent and committed technical support of
the testing effort. Our special thanks go to Gary Nosky and Craig Rieker for their assistance in the
photographic recording of data.
Available from
NASA Center for Aerospace Information
7121 Standard Drive
Hanover, MD 21076–1320
National Technical Information Service
5285 Port Royal Road
Springfield, VA 22161
Available electronically at http://gltrs.grc.nasa.gov
Level of Review: This material has been technically reviewed by NASA technical management OR expert reviewer(s).
This report contains preliminary findings,
subject to revision as analysis proceeds.

NASA/CR—2006-214125 1
Further Assessment of MVD Effects in SLD Applications
Jen-Ching Tsao and David N. Anderson Ohio Aerospace Institute Brook Park, Ohio 44142
Abstract The study reported here is part of an effort to develop scaling methods for super cooled large droplet (SLD)
conditions. Previously reported results showed that SLD main ice shapes can be simulated quite successfully by appendix C conditions using scaling methods developed for appendix C. However, when the velocity was higher than 100 kt, the feather size and density for SLD tests at MVDs well above 100 μm was not well represented by the scaled appendix C conditions. This paper reports additional results of a study of the feather region with the objective of identifying differences between SLD and appendix C feathers. Both the feather appearance and the angle at which feathers grow from the airfoil surface were recorded over a range of MVD from 20 to 190 μm for airspeeds of 100 and 200 kt and stagnation freezing fractions of 0.3 to 1.0. Tests were performed in the NASA Glenn Icing Research Tunnel (IRT) using a 91-cm-chord NACA0012 airfoil model mounted at 0° AOA. Photographs are presented to illustrate details of feather appearance. Appearance was noticeably affected by the stagnation freezing fraction of the test, but not by velocity or MVD. The angle of feather growth relative to the chord line decreased with increasing stagnation freezing fraction. For a velocity of 100 kt, no significant effect of MVD on feather angle was apparent, but at 200 kt, feather angle tended to increase with MVD for glaze conditions, but not rime. This finding is based on limited data, and its significance with respect to icing physics has not been determined.
Nomenclature Ac Accumulation parameter, dimensionless b Relative heat factor, dimensionless c Airfoil chord, cm cp Specific heat of air, cal/g K cp,ws Specific heat of water at the surface temperature, cal/g K d Cylinder radius or twice the leading-edge radius of airfoil, cm hc Convective heat-transfer coefficient, cal/s m2 K hG Gas-phase mass-transfer coefficient, g /s m2 K Inertia parameter, dimensionless K0 Modified inertia parameter, dimensionless LWC Cloud liquid-water content, g/m3 MVD Water droplet median volume diameter, μm n Freezing fraction, dimensionless n0 Stagnation freezing fraction, dimensionless p Pressure, Nt/m2 pw Vapor pressure of water in atmosphere, Nt/m2 pww Vapor pressure of water at the icing surface, Nt/m2 r Recovery factor, dimensionless Re Reynolds number of model, dimensionless Reδ Reynolds number of water drop, dimensionless s Distance along airfoil surface measured from stagnation line, cm tf Freezing temperature, °C ts Surface temperature, °C t Air temperature, °C T Absolute air temperature, K V Air velocity, kt WeL Weber number based on model size and water properties, dimensionless α Angle between feather and chord line, deg
NASA/CR—2006-214125 2
β0 Collection efficiency at stagnation line, dimensionless φ Droplet energy transfer parameter, °C λ Droplet range, m λStokes Droplet range if Stokes Law applies, m Λf Latent heat of freezing, cal/g Λv Latent heat of condensation, cal/g μ Air viscosity, g/m s θ Air energy transfer parameter, °C ρ Air density, g/m3 ρi Ice density, g/m3 ρw Liquid water density, g/m3 σw/a Surface tension of water over air, dyne/cm τ Accretion time, min Subscripts st static tot total
Introduction The study reported here is part of an effort to develop scaling methods for SLD conditions. Previously reported
(refs. 1 and 2) results showed that SLD main ice shapes can be simulated quite successfully by appendix C conditions using scaling methods developed for appendix C. However, when the velocity was higher than about 100 kt, the feather size and density for the SLD tests at MVDs greater than 100 μm was not well represented by the scaled appendix C conditions. This paper reports additional results of a study of the feather region with the objective of identifying differences between SLD and appendix C feathers. Feather appearance as well as the angle at which feathers grow from the airfoil surface were examined over a range of MVD from 20 to 190 μm for airspeeds of 100 and 200 kt and stagnation freezing fractions of 0.3 to 1.0. Tests were performed in the NASA Glenn IRT using a 91-cm-chord NACA0012 airfoil model mounted at 0° AOA.
Recent SLD-to-appendix C scaling studies in the IRT have shown that scaling methods developed for appendix C can also be applied to scale SLD drop sizes to appendix C conditions. Good simulation of the main ice shape can be achieved by matching scale and reference values of the parameters n0 and WeL, the product β0Ac and maintaining β0 within about 10 percent.
Figure 1 gives some typical examples of such scaling. Figure 1(a) shows a good simulation of both main ice shape and feather region for a reference velocity of 100 kt with model size scaled from 91 to 27 cm and MVD from 195 to 30 μm. The important similarity parameters were matched within about 10 percent, although the difference in the scale and reference WeL was somewhat larger; apparently, these matches are adequate. In figure 1(b), a reference velocity of 150 kt was used with size scaled only from 91 to 53 cm and MVD from 185 to 30 μm. Again, the main ice shapes matched fairly well, but the scale (appendix C) feathers failed to simulate the large formations recorded in the SLD test. For this example, the scale β0 was only about 85 percent of the reference value, although the other similarity parameters matched well. This result suggests either that the match of scale and reference β0 may need to be significantly better than this, or there are significant SLD effects that result in different feather formation mechanisms than occur in appendix C. If this latter situation proves to be the case, the physics of feather formation in SLD would need to be studied and incorporated into the appendix C scaling methods. In figure 1(c) a scaling comparison is shown for nearly the same scaling scenario as figure 1(b), but for which a better match of β0 was achieved. For this case, the scale feathers match the reference significantly better than the previous comparison. Finally, in figure 1(d), although the β0 for scale and reference differ by only about 4 percent, the appendix C (scale) test again failed to simulate the large feathers of the SLD (reference) test.
From scaling results alone, then, we cannot make a definitive judgment whether SLD feather features result from physical phenomena present only in that regime of icing. In the work reported here, the feather region was studied in more detail through close-up photographs to identify characteristics of feather growth that might shed clues on differences between appendix C and SLD regimes.

NASA/CR—2006-214125 3
(a) Model Chord Scaled from 91 to 27 cm; n0, 0.5. (b) Model Chord Scaled from 91 to 53 cm; n0, 0.3.
Date/Run c, cm
tst, °C
V, kt
MVD, μm
LWC, g/m3
τ, min
β0, % Ac β0Ac n0
Re, 104
WeL, 106
(a) 11-05-04/03 91.4 -18 100 195 1.46 11.0 96.2 1.87 1.80 0.49 12.1 1.18 08-28-04/03 26.7 -9 200 30 0.50 4.6 90.1 1.84 1.66 0.53 6.4 1.37
(b) 05-06-03/01 91.4 -10 150 185 0.87 12.3 96.6 1.87 1.80 0.30 16.8 2.64 08-24-04/03 53.3 -7 199 30 0.50 10.8 83.5 2.16 1.80 0.29 12.5 2.73
(c) Model Chord Scaled from 91 to 53 cm; n0, 0.5. (d) Model Chord Scaled from 91 to 27 cm; n0, 0.5.
Date/Run c, cm
tst, °C
V, kt
MVD, μm
LWC, g/m3
τ, min
β0, % Ac β0Ac n0
Re, 104
WeL, 106
(c) 11-03-04/07 91.4 -17 149 195 1.00 10.7 96.8 1.86 1.80 0.50 17.7 2.61 10-15-02/05 53.3 -10 200 38 0.49 11.5 87.4 2.24 1.96 0.47 12.6 2.73
(d) 11-03-04/07 91.4 -17 149 195 1.00 10.7 96.8 1.86 1.80 0.50 17.7 2.61 02-15-02/08 26.7 -15 276 35 0.64 2.7 93.0 1.89 1.76 0.50 8.5 2.61
Figure 1.—Examples of scaling from SLD to appendix C conditions.

NASA/CR—2006-214125 4
Similarity Parameters For completeness, the similarity parameters used in this study are defined here. They are based on the work
originally done by Ruff (ref. 3) and discussed in more detail in Anderson (refs. 4 and 5). The modified inertia parameter, K0, was defined by Langmuir and Blodgett (ref. 6):
01 18 8Stokes
K K⎛ ⎞= + −⎜ ⎟⎝ ⎠
λλ
(1)
In equation (1), K is the inertia parameter,
2
18w MVD VK
d=
ρμ
(2)
where d is the cylinder radius or twice the leading-edge radius of curvature for airfoils. For the NACA 0012 airfoil model, a leading-edge radius of 0.0158c was used (see Abbott and von Doenhoff (ref. 7), where c is the model chord. λ/λStokes is the droplet range parameter, defined as the ratio of actual droplet range to that if Stokes drag law for solid-spheres applied. It is a function only of the droplet Reynolds number, Reδ.
δV MVD ρ=Re
μ (3)
Langmuir and Blodgett’s tabulation of the range parameter was fit to the following expression for this study:
1
0.8388 0.001483 0.1847 δ
λ =λ Re ReStokes δ
(4)
Of more practical interest than K0 is the collection efficiency at the stagnation point, β0, which was shown by Langmuir and Blodgett to be a function only of K0,
.84
.84
11.408
11+1.408
0
0
0
K -β
K -
⎛ ⎞⎜ ⎟⎝ ⎠=
⎛ ⎞⎜ ⎟⎝ ⎠
(5)
The accumulation parameter is:
c
i
LWCVAd
=τ
ρ (6)
If all the water impinging on the leading edge freezes at that location and the leading-edge collection efficiency is 100 percent, Ac is a measure of the normalized thickness of ice that will accrete.
The freezing fraction is defined as the ratio of the mass of water that freezes at a given location on the surface to the total mass of water that impinges the surface at that location. From Messinger’s (ref. 8) steady-state surface en-ergy balance formulation, the stagnation freezing fraction is
,p ws0
f
cn
b⎛ ⎞= +⎜ ⎟⎝ ⎠
θφΛ
(7)

NASA/CR—2006-214125 5
The individual terms in this expression are φ, the water energy transfer parameter, θ, the air energy transfer parameter, and b, the relative heat factor, introduced by Tribus, et al. (ref. 9)
2
,2f stp ws
Vφ t tc
= − −
(8)
2
12.622
ww tot w
G st tot sts st v
tot wwp c
tot st
p p ph T T pVθ t t r Λp pc h
T T
⎛ ⎞−⎜ ⎟⎛ ⎞⎜ ⎟= − − +⎜ ⎟⎜ ⎟ ⎜ ⎟⎝ ⎠ −⎜ ⎟⎝ ⎠
(9)
0 ,p ws
c
LWC V cb
hβ
= (10)
Equation (9) given by Ruff includes compressibility effects. Simpler forms without compressibility have also
been used by Charpin and Fasso (ref. 10) and others, but the differences in values are not significant. The Reynolds number of the model, Re, is based on the twice the nose radius of airfoil:
VdRe =ρ
μ (11)
and the Weber number used here employs a model dimension along with water density:
2
/
wL
w a
V dWe =
ρσ
(12)
Test Description The icing tests were performed in the NASA Glenn Icing Research Tunnel (IRT). The IRT is a closed-loop, re-
frigerated, sea-level tunnel with a 1.8 by 2.7 m rectangular test section. It uses 10 spray bars, a configuration in operation since 1998, to generate a cloud of super-cooled water droplets.
The IRT cloud calibrations for both appendix C and SLD conditions used for these tests was performed in the summer of 2004. The LWC and MVD measurements were made using methods reported previously (ref. 11). However, drop-sizing instruments have been updated from past calibration work. Thus, the definition of MVD for a particular cloud may differ from interpretations previously reported, particularly for the SLD regime. For example, for given spray-bar pressures, the latest calibration gives MVDs of 85 to 95 percent of those obtained in a 2002 calibration. The MVDs reported in this paper are based on an analysis of the MVD calibration data completed in November, 2004.
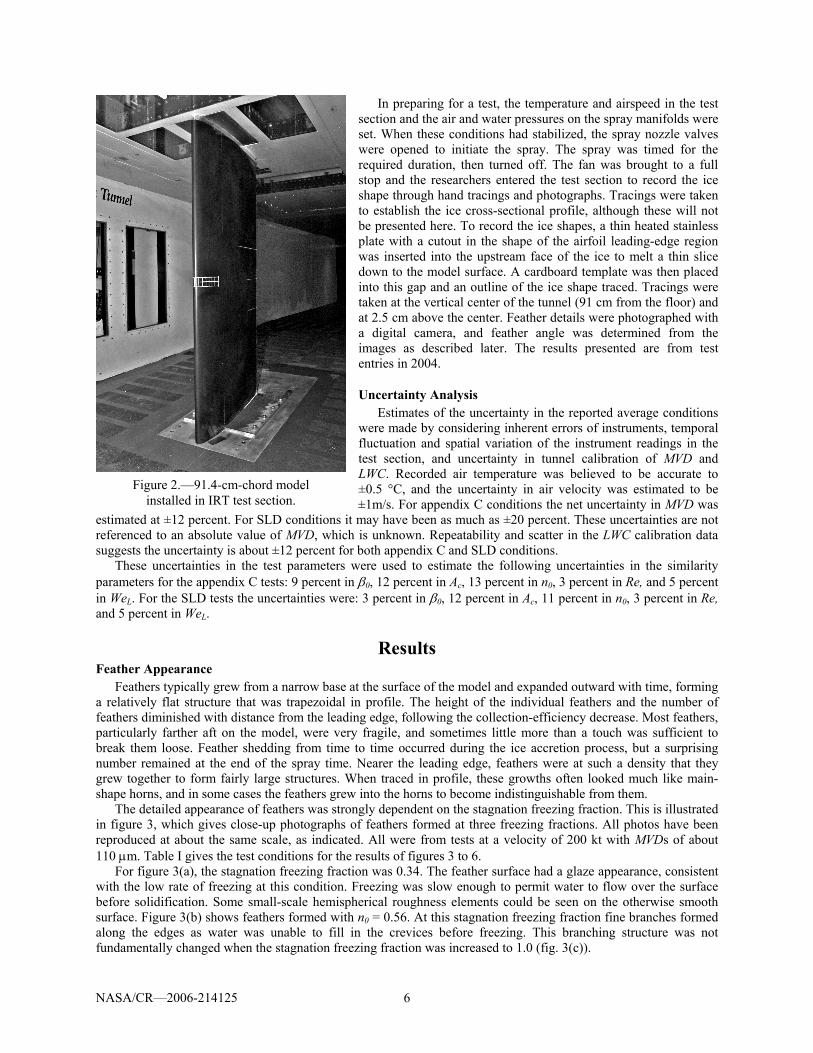
The feather study used a fiberglass 1.8-m-span 91.4-cm-chord NACA 0012 airfoil section pictured in figure 2. Horizontal lines at the leading edge were drawn at the tunnel vertical center (model mid span) and ±2.5 cm from the center to position tracing templates. Vertical lines were located at increments of 2.5 cm, measured along the surface from stagnation. These lines helped to identify sites on the model for close-up photographs. The model was mounted vertically at 0°AOA for all tests. Because of the quick start capability of the IRT spray system, no shielding of the models was required during the initiation of the spray.
NASA/CR—2006-214125 6
In preparing for a test, the temperature and airspeed in the test section and the air and water pressures on the spray manifolds were set. When these conditions had stabilized, the spray nozzle valves were opened to initiate the spray. The spray was timed for the required duration, then turned off. The fan was brought to a full stop and the researchers entered the test section to record the ice shape through hand tracings and photographs. Tracings were taken to establish the ice cross-sectional profile, although these will not be presented here. To record the ice shapes, a thin heated stainless plate with a cutout in the shape of the airfoil leading-edge region was inserted into the upstream face of the ice to melt a thin slice down to the model surface. A cardboard template was then placed into this gap and an outline of the ice shape traced. Tracings were taken at the vertical center of the tunnel (91 cm from the floor) and at 2.5 cm above the center. Feather details were photographed with a digital camera, and feather angle was determined from the images as described later. The results presented are from test entries in 2004.
Uncertainty Analysis Estimates of the uncertainty in the reported average conditions
were made by considering inherent errors of instruments, temporal fluctuation and spatial variation of the instrument readings in the test section, and uncertainty in tunnel calibration of MVD and LWC. Recorded air temperature was believed to be accurate to ±0.5 °C, and the uncertainty in air velocity was estimated to be ±1m/s. For appendix C conditions the net uncertainty in MVD was
estimated at ±12 percent. For SLD conditions it may have been as much as ±20 percent. These uncertainties are not referenced to an absolute value of MVD, which is unknown. Repeatability and scatter in the LWC calibration data suggests the uncertainty is about ±12 percent for both appendix C and SLD conditions.
These uncertainties in the test parameters were used to estimate the following uncertainties in the similarity parameters for the appendix C tests: 9 percent in β0, 12 percent in Ac, 13 percent in n0, 3 percent in Re, and 5 percent in WeL. For the SLD tests the uncertainties were: 3 percent in β0, 12 percent in Ac, 11 percent in n0, 3 percent in Re, and 5 percent in WeL.
Results Feather Appearance
Feathers typically grew from a narrow base at the surface of the model and expanded outward with time, forming a relatively flat structure that was trapezoidal in profile. The height of the individual feathers and the number of feathers diminished with distance from the leading edge, following the collection-efficiency decrease. Most feathers, particularly farther aft on the model, were very fragile, and sometimes little more than a touch was sufficient to break them loose. Feather shedding from time to time occurred during the ice accretion process, but a surprising number remained at the end of the spray time. Nearer the leading edge, feathers were at such a density that they grew together to form fairly large structures. When traced in profile, these growths often looked much like main-shape horns, and in some cases the feathers grew into the horns to become indistinguishable from them.
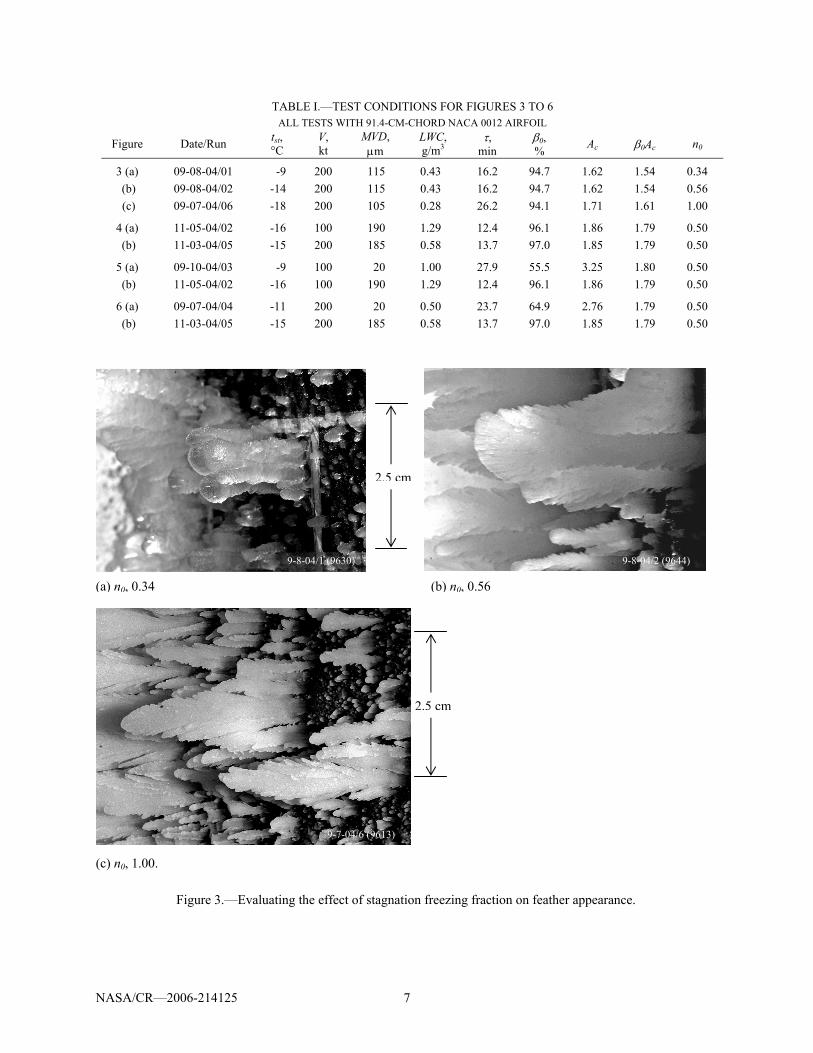
The detailed appearance of feathers was strongly dependent on the stagnation freezing fraction. This is illustrated in figure 3, which gives close-up photographs of feathers formed at three freezing fractions. All photos have been reproduced at about the same scale, as indicated. All were from tests at a velocity of 200 kt with MVDs of about 110 μm. Table I gives the test conditions for the results of figures 3 to 6.
For figure 3(a), the stagnation freezing fraction was 0.34. The feather surface had a glaze appearance, consistent with the low rate of freezing at this condition. Freezing was slow enough to permit water to flow over the surface before solidification. Some small-scale hemispherical roughness elements could be seen on the otherwise smooth surface. Figure 3(b) shows feathers formed with n0 = 0.56. At this stagnation freezing fraction fine branches formed along the edges as water was unable to fill in the crevices before freezing. This branching structure was not fundamentally changed when the stagnation freezing fraction was increased to 1.0 (fig. 3(c)).
Figure 2.—91.4-cm-chord model installed in IRT test section.
NASA/CR—2006-214125 7
(a) n0, 0.34 (b) n0, 0.56
2.5 cm
9-8-04/1 (9630) 9-8-04/2 (9644)
(c) n0, 1.00.
9-7-04/6 (9613)
2.5 cm
TABLE I.—TEST CONDITIONS FOR FIGURES 3 TO 6 ALL TESTS WITH 91.4-CM-CHORD NACA 0012 AIRFOIL
Figure Date/Run tst, °C
V, kt
MVD, μm
LWC, g/m3
τ, min
β0, % Ac β0Ac n0
3 (a) 09-08-04/01 -9 200 115 0.43 16.2 94.7 1.62 1.54 0.34 (b) 09-08-04/02 -14 200 115 0.43 16.2 94.7 1.62 1.54 0.56 (c) 09-07-04/06 -18 200 105 0.28 26.2 94.1 1.71 1.61 1.00
4 (a) 11-05-04/02 -16 100 190 1.29 12.4 96.1 1.86 1.79 0.50 (b) 11-03-04/05 -15 200 185 0.58 13.7 97.0 1.85 1.79 0.50
5 (a) 09-10-04/03 -9 100 20 1.00 27.9 55.5 3.25 1.80 0.50 (b) 11-05-04/02 -16 100 190 1.29 12.4 96.1 1.86 1.79 0.50
6 (a) 09-07-04/04 -11 200 20 0.50 23.7 64.9 2.76 1.79 0.50 (b) 11-03-04/05 -15 200 185 0.58 13.7 97.0 1.85 1.79 0.50
Figure 3.—Evaluating the effect of stagnation freezing fraction on feather appearance.
NASA/CR—2006-214125 8
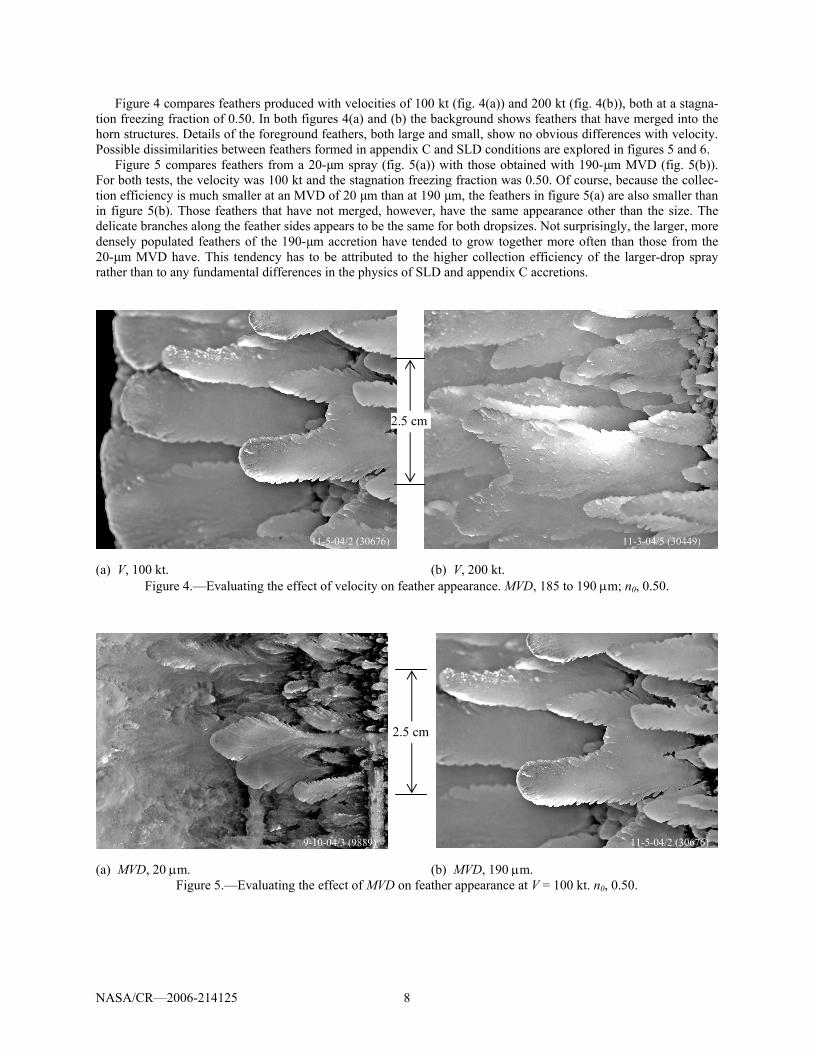
Figure 4 compares feathers produced with velocities of 100 kt (fig. 4(a)) and 200 kt (fig. 4(b)), both at a stagna-tion freezing fraction of 0.50. In both figures 4(a) and (b) the background shows feathers that have merged into the horn structures. Details of the foreground feathers, both large and small, show no obvious differences with velocity. Possible dissimilarities between feathers formed in appendix C and SLD conditions are explored in figures 5 and 6.
Figure 5 compares feathers from a 20- m spray (fig. 5(a)) with those obtained with 190- m MVD (fig. 5(b)). For both tests, the velocity was 100 kt and the stagnation freezing fraction was 0.50. Of course, because the collec-tion efficiency is much smaller at an MVD of 20 m than at 190 m, the feathers in figure 5(a) are also smaller than in figure 5(b). Those feathers that have not merged, however, have the same appearance other than the size. The delicate branches along the feather sides appears to be the same for both dropsizes. Not surprisingly, the larger, more densely populated feathers of the 190- m accretion have tended to grow together more often than those from the 20- m MVD have. This tendency has to be attributed to the higher collection efficiency of the larger-drop spray rather than to any fundamental differences in the physics of SLD and appendix C accretions.
(a) V, 100 kt. (b) V, 200 kt. Figure 4.—Evaluating the effect of velocity on feather appearance. MVD, 185 to 190 μm; n0, 0.50.
11-3-04/5 (30449)11-5-04/2 (30676)
2.5 cm
9-10-04/3 (9889) 11-5-04/2 (30676)
2.5 cm
(a) MVD, 20 μm. (b) MVD, 190 μm. Figure 5.—Evaluating the effect of MVD on feather appearance at V = 100 kt. n0, 0.50.

NASA/CR—2006-214125 9
Figure 6 provides another comparison between appendix C and SLD feathers, but at a velocity of 200 kt. As in
figure 5, the stagnation freezing fraction was 0.50. Aside from disparities attributable to collection efficiency, no differences in basic structure between the two cases could be identified. Feather Angle
Because of the difficulty of identifying significant appearance features that could be explained by differences in the physics of feather formation between appendix C and SLD, more quantitative measurements were next at-tempted. It was reasoned that if the water contributing to feather growth came from different sources for the two cloud regimes, the feather angle might show that. For example, evidence exists (ref. 12) that splashing of water droplets occurs as larger drops impact either the iced surface or puddles of water on that surface. If the ejected drop-lets are re-entrained in the airstream to impinge farther aft, one might expect their trajectories to differ from those of droplets from the free stream. Consequently, the feather angle could vary along the chord for those SLD conditions where splashing is most prevalent, and SLD feathers might well display different feather angles from those formed during appendix C icing.
The feather angle reported here is that formed between the feather and model chord line as defined in figure 7. Figure 7(a) shows a lower-surface feather angle and figure 7(b) an upper-surface angle. No differentiation was made between the lower-surface and the upper-surface feathers when measuring the angle; i.e., the lower-surface feather angle was not recorded as a negative angle.
The angle was determined by photographing the feather region of the accretion against a background of a dimen-sioned grid. Figure 8 is an example of such a photo. The camera lens was placed as close to the model as possible for these photographs to avoid distortion of the grid, although some distortion is inevitable. For each test three to five pictures were taken altogether, with some of both the lower surface and upper surface feather regions. Angles measured from different photos from the same test showed no significant differences within the scatter of data, and data from all the photos for a particular test were included in determining average values for that test. Feather angles were recorded from each photograph along with the corresponding chord-wise location. The angle was determined with image-measuring software after calibrating for the horizontal and vertical distance scales on the grid.
9-7-04/4 (9551)
11-3-04/5 (30449)
2.5 cm2
(a) MVD, 20 μm. (b) MVD, 185 μm.
Figure 6.—Evaluating the effect of MVD on feather appearance at V = 200 kt. n0, 0.50.

NASA/CR—2006-214125 10
Figure 8.—Ice photographed against a grid for feather angle measurement. Horizontal lines areparallel to chord line. The scale is marked ininches, and the grid is square. This is the same ice shape for which the tracing appears infigure 7. c, 91.4 cm; V, 200 kt; MVD, 115 μm; n0, 0.56.
(a) Feather angle measured on lower surface. (b) Feather angle measured on upper surface.
Figure 7.—Definition of feather angle. c, 36 in; V, 200 kt; MVD, 115 μm; n0, 0.56.
NASA/CR—2006-214125 11
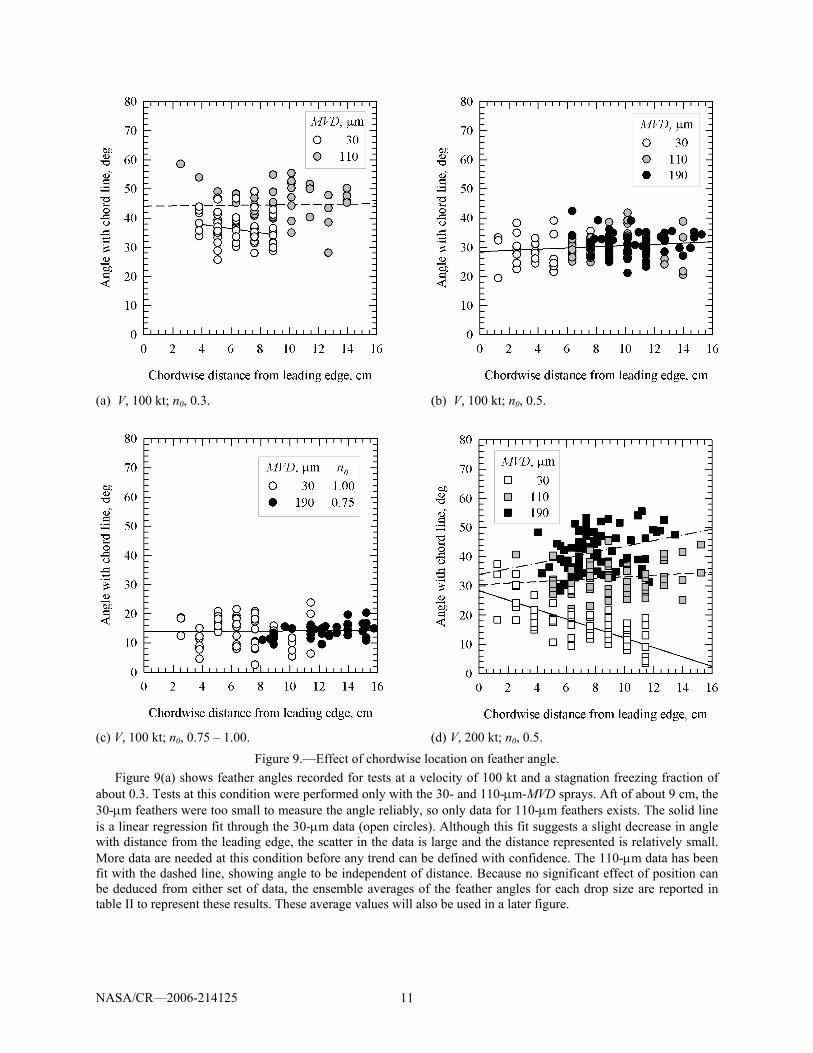
Figure 9(a) shows feather angles recorded for tests at a velocity of 100 kt and a stagnation freezing fraction of
about 0.3. Tests at this condition were performed only with the 30- and 110-μm-MVD sprays. Aft of about 9 cm, the 30-μm feathers were too small to measure the angle reliably, so only data for 110-μm feathers exists. The solid line is a linear regression fit through the 30-μm data (open circles). Although this fit suggests a slight decrease in angle with distance from the leading edge, the scatter in the data is large and the distance represented is relatively small. More data are needed at this condition before any trend can be defined with confidence. The 110-μm data has been fit with the dashed line, showing angle to be independent of distance. Because no significant effect of position can be deduced from either set of data, the ensemble averages of the feather angles for each drop size are reported in table II to represent these results. These average values will also be used in a later figure.
(c) V, 100 kt; n0, 0.75 – 1.00. (d) V, 200 kt; n0, 0.5.
Figure 9.—Effect of chordwise location on feather angle.
(a) V, 100 kt; n0, 0.3. (b) V, 100 kt; n0, 0.5.

NASA/CR—2006-214125 12
The 110-μm ensemble average angle in figure 9(a) is nearly 25 percent higher than the 30-μm average, although there is considerable overlap of angles from the two datasets. Additional data are needed to resolve whether there is perhaps a small effect of MVD on feather angle at this condition.
Similar conditions are reported in figure 9(b), but for a stagnation freezing fraction increased to about 0.5. Data are shown for all three drop sizes. Angles are somewhat lower overall than for the stagnation freezing fraction of 0.3, and no difference is apparent between the feather angles for the range of MVD from 30 to 190 μm. The data fit (solid line) to all the data shows no meaningful effect of chordwise distance on angle.
The last 100-kt example (fig. 9(c)) is for a stagnation freezing fraction. of 0.75 to 1.0. Tests were made for 30- μm MVD with fully rime conditions and for 190-μm at a stagnation freezing fraction of 0.75. At this latter n0, conditions over much of the accretion were fully rime; therefore, in the absence of rime data at 190 μm, this com-parison should be valid. The solid line is a linear regression fit to both sets of data. As in the results for lower stagnation freezing fractions at this velocity, no effect of distance from the leading edge was apparent, so ensemble averages of the data are suitable representations of each set. Again, no difference between the appendix C and SLD feather angle was evident.
Figure 9(d) shows feather angles for a velocity of 200 kt, MVDs of 30, 110, and 190 μm and a stagnation freezing fraction of 0.5. Unlike the data at 100 kt at a stagnation freezing fraction of 0.5 (fig. 9(b)), the angle was no longer independent of distance along the model. Linear regression fits showed a significant decrease of feather angle with distance for the 30-μm data, effectively no influence of distance on angle for 110 μm, and a small increase in angle with distance for 190-μm MVD. Because the angle decreased with stagnation freezing fraction for the 100-kt tests and we know the local freezing fraction increases with distance from the leading edge of the model, a decrease in angle with distance for the 30-μm data is not surprising. The lack of an effect of distance on the 110-μm data is consistent with the 100-kt results. While the apparent 190-μm data trend is surprising, the scatter in those angles may simply mask the correct trend. Thus, ensemble averages appear to be justified to summarize the 200-kt results at both 110- and 190-μm MVD. For convenience, an ensemble average value was also used to represent the 30-μm data in table II and in figure 10, below, as well. At distances greater than 5 cm from the leading edge angles in-creased with MVD, and the average angles reported in table II show this increase. The significance of this difference in angle between the appendix C tests and the SLD is not presently known: we neither understand the underlying physics causing the difference nor do we know how closely scale tests must simulate the correct SLD feather angle.
TABLE II.—TEST CONDITIONS AND FEATHER ANGLES FOR FIGURES 9 AND 10 ALL TESTS WITH 91.4-CM-CHORD NACA 0012 AIRFOIL
Figure Date/Run tst, °C
V, kt
MVD, μm
LWC, g/m3
τ, min
β0, % Ac β0Ac n0
avg. α, °
std. dev., °
9 (a), 10 09-09-04/03 -4 100 30 0.70 28.0 68.8 2.28 1.57 0.33 36.1 5.1 09-10-04/01 -9 100 110 0.98 14.4 92.9 1.64 1.52 0.33 44.5 6.5
9 (b), 10 09-10-04/02 -9 100 30 0.70 28.0 68.9 2.29 1.58 0.56 29.2 4.5 09-10-04/04 -15 100 110 0.98 14.4 92.9 1.64 1.53 0.55 30.5 4.8 11-05-04/02 -16 100 190 1.29 12.4 96.1 1.86 1.79 0.50 30.8 3.9
9 (c), 10 09-15-04/03 -19 100 30 0.70 28.0 69.0 2.29 1.58 1.00 14.1 4.9 11-05-04/06 -26 100 190 1.29 12.4 96.1 1.87 1.80 0.75 14.0 2.5
9 (d), 10 09-07-04/05 -12 200 30 0.50 19.4 76.2 2.26 1.72 0.51 17.3 6.9 09-08-04/02 -14 200 110 0.43 16.2 94.7 1.62 1.54 0.56 32.8 5.0 11-03-04/04 -14 200 190 0.52 15.3 97.0 1.85 1.80 0.50 41.6 6.5
10 09-07-04/03 -8 200 30 0.50 19.4 76.2 2.26 1.72 0.31 39.2 7.5 09-07-04/06 -18 200 105 0.28 26.2 94.1 1.71 1.61 1.00 16.7 3.6 09-08-04/01 -9 200 115 0.43 16.2 94.7 1.62 1.54 0.34 52.5 5.9

NASA/CR—2006-214125 13
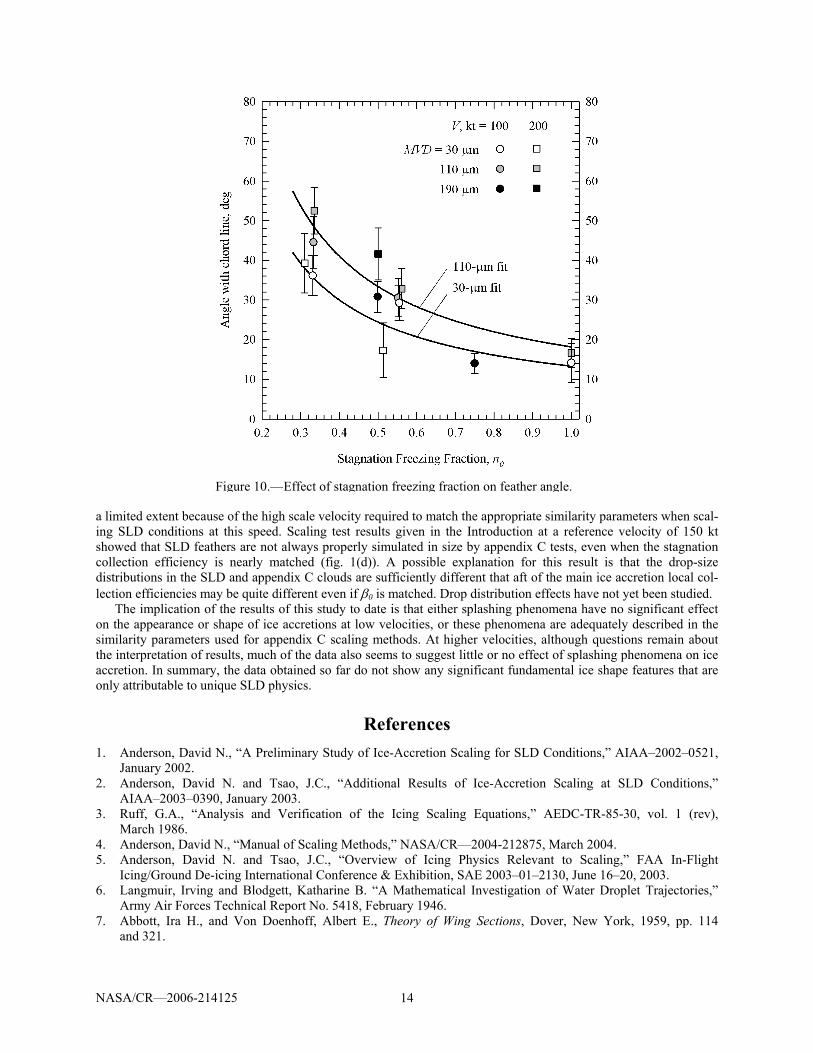
In figure 10, the ensemble averages of the feather angles are plotted against stagnation freezing fraction. The error bars on each point show the standard deviations. In addition to averages of the data given in figure 9, data are included in figure 10 for three conditions at 200 kt that were not shown in figure 9. These are for a stagnation freezing fraction of approximately 0.3 for MVDs of 30 and 110 μm and a rime case with an MVD of 110 μm. None of these sets of data showed an effect of distance on the feather angle.
Figure 10 shows clearly that the variable with the strongest effect on feather angle was stagnation freezing fraction. The two lines shown are the linear regression curve fits to the 30- and the 110-μm data, respectively. Data for both 100- and 200-kt velocities were included in these fits. Because of the scarcity of 190-μm results, no fit was made for this MVD. It appears that MVD may have a small effect on feather angle. From the data analyzed to date, no significant effect of velocity was apparent at most conditions. However, at 110 μm with a stagnation freezing fraction of 0.3, angles appeared to be about 20 percent higher for the 200-kt tests than for the 100-kt. For 0.5, two notable differences were seen between 100 and 200 kt. First, 30-μm tests at 100 kt produced feather angles independent of chordwise distance, while angles decreased with distance at 200 kt with the same MVD. As noted previously, the latter condition was the only one for which the data showed a significant effect of distance. Second, 190-μm tests at 200 kt gave angles significantly higher than the 190-μm tests at 100 kt. The meaning of these observations is not understood, and additional data are needed to confirm the results reported here.
Summary and Concluding Remarks Although the effect of MVD and velocity on feather characteristics has not been fully explored, the limited data
analyzed to date permit some tentative conclusions to be made. It is not apparent from the close-up photographic records that SLD feather structure is fundamentally different from that of Appendix-C feathers. Feather appearance was primarily dependent on stagnation freezing fraction. Feather surfaces were relatively smooth at a stagnation freezing fraction of 0.3, while at stagnation freezing fractions of both 0.5 and 1.0 feathers consisted of fine branches growing up and away from the surface of the model. The change in surface structure appeared to be independent of either V or MVD.
Quantitative measurements of feather angle also showed a major effect of stagnation freezing fraction. For a velocity of 200 kt and an MVD of 110 μm, for example, the average angle of feathers with respect to the chord line decreased from about 52° for n0 = 0.34 to 17° at n0 = 1.0. The effects of distance from the model leading edge, of velocity or of MVD were not as straightforward. At a velocity of 100 kt, the angle was dependent on neither distance nor MVD. However, at 200 kt, the angle increased as MVD increased, it decreased with distance for 30-μm drops, was independent of distance for 110-μm and appeared to increase modestly with distance for 190-μm. Additional data are needed to confirm these results and to examine drop-size effects at other conditions.
The lack of a difference in feather appearance or angle between appendix C conditions and SLD for 100 kt suggests that any phenomena related to droplet distortion, breakup and splashing do not appear to affect the feather region of ice accretions at this speed. Previously published results showed that appendix C drop sizes could success-fully simulate the main accretion of SLD encounters. That fact combined with the feather data presented here, indi-cates that for low velocities, appendix C scaling methods can be applied without modification to SLD conditions to scale both the main ice and the feather region.
The situation at 200 kt is not so clear. Although the present results showed some influence of MVD on feather angle, there appeared to be no effect on appearance. In addition, for the SLD drop sizes studied to date, feather angle was uniform, or nearly so, with chordwise distance from the leading edge of the model. Because we do not yet un-derstand either the physics of feather growth or the phenomena of drop distortion, breakup and splashing, we cannot completely appreciate how the latter might affect the former. It seems reasonable to speculate, however, that splashed drops if re-entrained in the airstream to re-impinge farther aft would produce feathers with a different angle than that of feathers produced by directly impinging drops in the cloud. Thus, local variations in feather angle along the model surface in the chordwise direction might have been a clue that there was some droplet distortion, breakup and/or splashing activity. Of course, the lack of angle variation with chordwise distance does not prove there is no significant amount of distortion, breakup or splashing incidents, but it does suggest that such activity can not play a significant part in the final ice accretion. Furthermore, we do not know if the magnitudes of the changes in feather angle with MVD reported here make any significant difference in the aerodynamic effects of ice accretion. Thus, the practical implication of the 200-kt results for scaling has to be left undetermined for now.
Scaling tests have not yet been performed to determine even if main ice shapes at 200-kt in SLD conditions can be adequately simulated with Appendix-C conditions and such tests would be helpful. Such tests are only possible to
NASA/CR—2006-214125 14
a limited extent because of the high scale velocity required to match the appropriate similarity parameters when scal-ing SLD conditions at this speed. Scaling test results given in the Introduction at a reference velocity of 150 kt showed that SLD feathers are not always properly simulated in size by appendix C tests, even when the stagnation collection efficiency is nearly matched (fig. 1(d)). A possible explanation for this result is that the drop-size distributions in the SLD and appendix C clouds are sufficiently different that aft of the main ice accretion local col-lection efficiencies may be quite different even if β0 is matched. Drop distribution effects have not yet been studied.
The implication of the results of this study to date is that either splashing phenomena have no significant effect on the appearance or shape of ice accretions at low velocities, or these phenomena are adequately described in the similarity parameters used for appendix C scaling methods. At higher velocities, although questions remain about the interpretation of results, much of the data also seems to suggest little or no effect of splashing phenomena on ice accretion. In summary, the data obtained so far do not show any significant fundamental ice shape features that are only attributable to unique SLD physics.
References 1. Anderson, David N., “A Preliminary Study of Ice-Accretion Scaling for SLD Conditions,” AIAA–2002–0521,
January 2002. 2. Anderson, David N. and Tsao, J.C., “Additional Results of Ice-Accretion Scaling at SLD Conditions,”
AIAA–2003–0390, January 2003. 3. Ruff, G.A., “Analysis and Verification of the Icing Scaling Equations,” AEDC-TR-85-30, vol. 1 (rev),
March 1986. 4. Anderson, David N., “Manual of Scaling Methods,” NASA/CR—2004-212875, March 2004. 5. Anderson, David N. and Tsao, J.C., “Overview of Icing Physics Relevant to Scaling,” FAA In-Flight
Icing/Ground De-icing International Conference & Exhibition, SAE 2003–01–2130, June 16–20, 2003. 6. Langmuir, Irving and Blodgett, Katharine B. “A Mathematical Investigation of Water Droplet Trajectories,”
Army Air Forces Technical Report No. 5418, February 1946. 7. Abbott, Ira H., and Von Doenhoff, Albert E., Theory of Wing Sections, Dover, New York, 1959, pp. 114
and 321.
Figure 10.—Effect of stagnation freezing fraction on feather angle.

NASA/CR—2006-214125 15
8. Messinger, B.L., “Equilibrium Temperature of an Unheated Icing Surface as a Function of Airspeed,” J. Aeron. Sci., vol. 20 no. 1, January 1953, pp. 29–42.
9. Tribus, Myron, Young, G.B.W. and Boelter, L.M.K., “Analysis of Heat Transfer Over a Small Cylinder in Icing Conditions on Mount Washington,” Trans. ASME, vol. 70, November 1948, pp. 971–976.
10. Charpin, Francois and Fasso, Guy, “Essais de givrage dans la grande soufflerie de Modane sur maquettes a echelle grandeur et echelle reduite,” L’Aeronautique et l’Astronautique, no. 38, 1972, pp. 23–31. English trans-lation published as “Icing Testing in the Large Modane Wind-Tunnel on Full-Scale and Reduced Scale Models,” NASA TM–75373, March 1979.
11. Ide, Robert F. and Oldenburg, John R., “Icing Cloud Calibration of the NASA Glenn Icing Research Tunnel,” AIAA–2001–0234, January 2001.
12. Papadakis, Michael, Rachman, Arief, Wong, See-Cheuk, Bidwell, Colin and Bencic, Timothy, “An Experimen-tal Investigation of SLD Impingement on Airfoils and Simulated Ice Shapes,” SAE 2003–01–2129, June 2003.
This publication is available from the NASA Center for AeroSpace Information, 301–621–0390.
REPORT DOCUMENTATION PAGE
2. REPORT DATE
19. SECURITY CLASSIFICATION OF ABSTRACT
18. SECURITY CLASSIFICATION OF THIS PAGE
Public reporting burden for this collection of information is estimated to average 1 hour per response, including the time for reviewing instructions, searching existing data sources,gathering and maintaining the data needed, and completing and reviewing the collection of information. Send comments regarding this burden estimate or any other aspect of thiscollection of information, including suggestions for reducing this burden, to Washington Headquarters Services, Directorate for Information Operations and Reports, 1215 JeffersonDavis Highway, Suite 1204, Arlington, VA 22202-4302, and to the Office of Management and Budget, Paperwork Reduction Project (0704-0188), Washington, DC 20503.
NSN 7540-01-280-5500 Standard Form 298 (Rev. 2-89)Prescribed by ANSI Std. Z39-18298-102
Form Approved
OMB No. 0704-0188
12b. DISTRIBUTION CODE
8. PERFORMING ORGANIZATION REPORT NUMBER
5. FUNDING NUMBERS
3. REPORT TYPE AND DATES COVERED
4. TITLE AND SUBTITLE
6. AUTHOR(S)
7. PERFORMING ORGANIZATION NAME(S) AND ADDRESS(ES)
11. SUPPLEMENTARY NOTES
12a. DISTRIBUTION/AVAILABILITY STATEMENT
13. ABSTRACT (Maximum 200 words)
14. SUBJECT TERMS
17. SECURITY CLASSIFICATION OF REPORT
16. PRICE CODE
15. NUMBER OF PAGES
20. LIMITATION OF ABSTRACT
Unclassified Unclassified
Final Contractor Report
Unclassified
1. AGENCY USE ONLY (Leave blank)
10. SPONSORING/MONITORING AGENCY REPORT NUMBER
9. SPONSORING/MONITORING AGENCY NAME(S) AND ADDRESS(ES)
National Aeronautics and Space AdministrationWashington, DC 20546–0001
Available electronically at http://gltrs.grc.nasa.gov
February 2006
NASA CR—2006-214125AIAA–2005–0072
E–15460
WBS–22–077–41–17NCC3–884NCC3–938
21
Further Assessment of MVD Effects in SLD Applications
Jen-Ching Tsao and David N. Anderson
Icing physics; Scaling; SLD; LWC
Unclassified -UnlimitedSubject Category: 03
Ohio Aerospace Institute22800 Cedar Point RoadBrook Park, Ohio 44142
Prepared for the 43rd Aerospace Sciences Meeting and Exhibit sponsored by the American Institue of Aeronautics andAstronautics, Reno, Nevada, January 10–13, 2005. Project manager, Thomas H. Bond, Propulsion Systems Division,Glenn Research Center, organization code RTI, 216–433–3900.
The study reported here is part of an effort to develop scaling methods for super cooled large droplet (SLD) conditions.
Previously reported results showed that SLD main ice shapes can be simulated quite successfully by appendix C conditions
using scaling methods developed for appendix C. However, when the velocity was higher than 100 kt, the feather size and
density for SLD tests at MVDs well above 100 μm was not well represented by the scaled appendix C conditions. This paper
reports additional results of a study of the feather region with the objective of identifying differences between SLD and
appendix C feathers. Both the feather appearance and the angle at which feathers grow from the airfoil surface were
recorded over a range of MVD from 20 to 190 μm for airspeeds of 100 and 200 kt and stagnation freezing fractions of 0.3
to 1.0. Tests were performed in the NASA Glenn Icing Research Tunnel (IRT) using a 91-cm-chord NACA0012 airfoil
model mounted at 0° AOA. Photographs are presented to illustrate details of feather appearance. Appearance was noticeably
affected by the stagnation freezing fraction of the test, but not by velocity or MVD. The angle of feather growth relative to
the chord line decreased with increasing stagnation freezing fraction. For a velocity of 100 kt, no significant effect of MVD
on feather angle was apparent, but at 200 kt, feather angle tended to increase with MVD for glaze conditions, but not rime.
This finding is based on limited data, and its significance with respect to icing physics has not been determined.

