furniture industry in kenya
TRANSCRIPT

Pub
lic D
iscl
osur
e A
utho
rized
Pub
lic D
iscl
osur
e A
utho
rized
Pub
lic D
iscl
osur
e A
utho
rized
Pub
lic D
iscl
osur
e A
utho
rized


Furniture industryin Kenya
Situational Analysis and Strategy
disclaimer: This volume is a product of the staff of the International Bank for Reconstruction and Development/ The World Bank. The findings, interpretations, and conclusions expressed in this paper do not necessarily reflect the views of the Executive Directors of The World Bank or the governments they represent. The World Bank does not guarantee the accuracy of the data included in this work. The boundaries, colors, denominations, and other information shown on any map in this work do not imply any judgment on the part of The World Bank concerning the legal status of any territory or the endorsement or acceptance of such boundaries.
Copyright statement: The material in this publication is copyrighted. Copying and/or transmitting portions or all of this work without permission may be a violation of applicable law. The International Bank for Reconstruction and Development/ The World Bank encourages dissemination of its work and will normally grant permission to reproduce portions of the work promptly.
For permission to photocopy or reprint any part of this work, please send a request with complete information to the Copyright Clearance Center, Inc., 222 Rosewood Drive, Danvers, MA 01923, USA, Telephone 978-750-8400, fax 978-750-4470, http://www.copyright.com/.
All other queries on rights and licenses, including subsidiary rights, should be addressed to the Office of the Publisher, The World Bank, 1818 H Street NW, Washington, DC 20433, USA, fax 202-522-2422, [email protected]
This report, funded through the generous sponsorship of DFID and the Netherlands, has been prepared jointly by a team from Creapo Oy, Helsinki, Finland (Harri Ahveninen, MSc. forest
products and economics, CEO); Stephen Irura Ng´ang`a (PhD, associate professor and Dean School of Business, Katarina University); and Meshack Odera Muga (principal research officer, KEFRI forest products research program) and the World Bank (Maria Paulina (Ina) Mogollon, Finance and Private Sector Development Specialist; Georgia Dowdall, Senior Analyst; and Farah Manji, writer and Editor). The report benefited from the comments and support of World Bank team colleagues, Ganesh Rasagam, Aref Adamali, Karuna Ramakrishnan, and Kennedy Mukuna Opala. The team would like to thank those who provided support with data gathering and review of report drafts, especially Adan Mohamed (Cabinet Secretary), Wilson Songa (Principal Secretary), Julius K. Korir, Hezekiah Bunde Okeyo, and Julius Kirima of the Ministry of Industrialization. Finally, the team would like to thank the many furniture sector stakeholders – timber merchants, furniture manufacturers, furniture outlets, training providers – interviewed for this study.
Acknowledgements

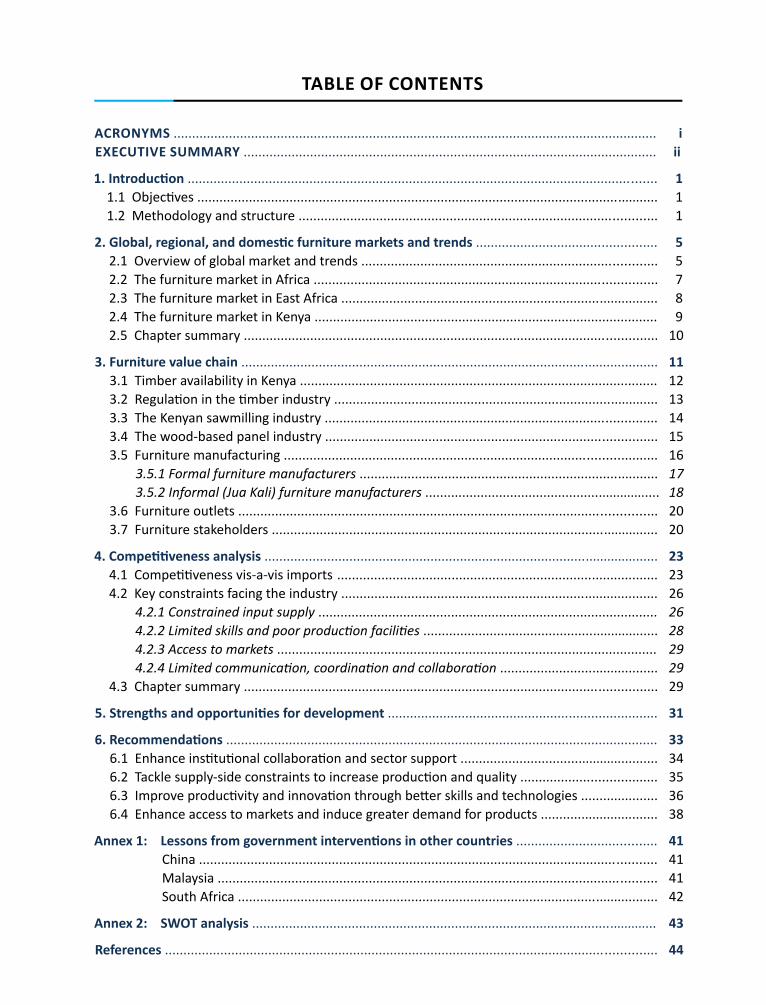
taBLe OF COntents
aCrOnyms ................................................................................................................................... iexeCutive summary ................................................................................................................ ii
1. Introduction ............................................................................................................................... 11.1 Objectives ............................................................................................................................. 11.2 Methodology and structure ................................................................................................. 1
2. Global, regional, and domestic furniture markets and trends ................................................. 52.1 Overview of global market and trends ................................................................................ 52.2 The furniture market in Africa ............................................................................................. 72.3 The furniture market in East Africa ...................................................................................... 82.4 The furniture market in Kenya ............................................................................................. 92.5 Chapter summary ................................................................................................................ 10
3. Furniture value chain ................................................................................................................. 113.1 Timber availability in Kenya ................................................................................................. 123.2 Regulation in the timber industry ........................................................................................ 133.3 The Kenyan sawmilling industry .......................................................................................... 143.4 The wood-based panel industry .......................................................................................... 153.5 Furniture manufacturing ..................................................................................................... 16
3.5.1 Formal furniture manufacturers ................................................................................. 173.5.2 Informal (Jua Kali) furniture manufacturers ................................................................ 18
3.6 Furniture outlets ................................................................................................................. 203.7 Furniture stakeholders ......................................................................................................... 20
4. Competitiveness analysis ........................................................................................................... 234.1 Competitiveness vis-a-vis imports ....................................................................................... 234.2 Key constraints facing the industry ...................................................................................... 26
4.2.1 Constrained input supply ............................................................................................ 264.2.2 Limited skills and poor production facilities ................................................................ 284.2.3 Access to markets ....................................................................................................... 294.2.4 Limited communication, coordination and collaboration ........................................... 29
4.3 Chapter summary ................................................................................................................ 29
5. Strengths and opportunities for development ......................................................................... 31
6. Recommendations ..................................................................................................................... 336.1 Enhance institutional collaboration and sector support ...................................................... 346.2 Tackle supply-side constraints to increase production and quality ..................................... 356.3 Improve productivity and innovation through better skills and technologies ..................... 366.4 Enhance access to markets and induce greater demand for products ................................ 38
Annex 1: Lessons from government interventions in other countries ...................................... 41 China ............................................................................................................................ 41 Malaysia ....................................................................................................................... 41 South Africa .................................................................................................................. 42
annex 2: sWOt analysis .............................................................................................................. 43
References ..................................................................................................................................... 44
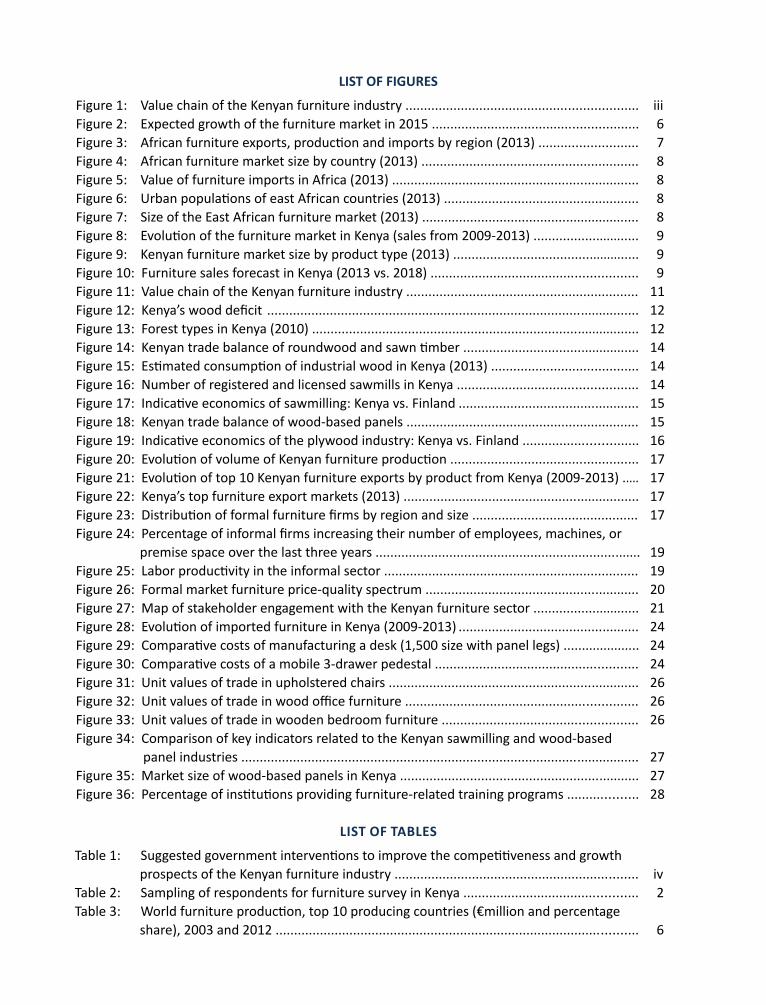
List OF FiGures
Figure 1: Value chain of the Kenyan furniture industry ............................................................... iiiFigure 2: Expected growth of the furniture market in 2015 ........................................................ 6Figure 3: African furniture exports, production and imports by region (2013) ........................... 7Figure 4: African furniture market size by country (2013) ........................................................... 8Figure 5: Value of furniture imports in Africa (2013) ................................................................... 8Figure 6: Urban populations of east African countries (2013) ..................................................... 8Figure 7: Size of the East African furniture market (2013) ........................................................... 8Figure 8: Evolution of the furniture market in Kenya (sales from 2009-2013) ............................. 9Figure 9: Kenyan furniture market size by product type (2013) ................................................... 9Figure 10: Furniture sales forecast in Kenya (2013 vs. 2018) ........................................................ 9Figure 11: Value chain of the Kenyan furniture industry ............................................................... 11Figure 12: Kenya’s wood deficit ..................................................................................................... 12Figure 13: Forest types in Kenya (2010) ......................................................................................... 12Figure 14: Kenyan trade balance of roundwood and sawn timber ................................................ 14Figure 15: Estimated consumption of industrial wood in Kenya (2013) ........................................ 14Figure 16: Number of registered and licensed sawmills in Kenya ................................................. 14Figure 17: Indicative economics of sawmilling: Kenya vs. Finland ................................................. 15Figure 18: Kenyan trade balance of wood-based panels ............................................................... 15Figure 19: Indicative economics of the plywood industry: Kenya vs. Finland ............................... 16Figure 20: Evolution of volume of Kenyan furniture production ................................................... 17Figure 21: Evolution of top 10 Kenyan furniture exports by product from Kenya (2009-2013) ..... 17Figure 22: Kenya’s top furniture export markets (2013) ................................................................ 17Figure 23: Distribution of formal furniture firms by region and size ............................................. 17Figure 24: Percentage of informal firms increasing their number of employees, machines, or premise space over the last three years ........................................................................ 19Figure 25: Labor productivity in the informal sector ..................................................................... 19Figure 26: Formal market furniture price-quality spectrum .......................................................... 20Figure 27: Map of stakeholder engagement with the Kenyan furniture sector ............................. 21Figure 28: Evolution of imported furniture in Kenya (2009-2013) ................................................. 24Figure 29: Comparative costs of manufacturing a desk (1,500 size with panel legs) ..................... 24Figure 30: Comparative costs of a mobile 3-drawer pedestal ....................................................... 24Figure 31: Unit values of trade in upholstered chairs .................................................................... 26Figure 32: Unit values of trade in wood office furniture ............................................................... 26Figure 33: Unit values of trade in wooden bedroom furniture ..................................................... 26Figure 34: Comparison of key indicators related to the Kenyan sawmilling and wood-based panel industries ............................................................................................................ 27Figure 35: Market size of wood-based panels in Kenya ................................................................. 27Figure 36: Percentage of institutions providing furniture-related training programs ................... 28
List OF taBLes
Table 1: Suggested government interventions to improve the competitiveness and growth prospects of the Kenyan furniture industry .................................................................. ivTable 2: Sampling of respondents for furniture survey in Kenya ............................................... 2Table 3: World furniture production, top 10 producing countries (€million and percentage share), 2003 and 2012 .................................................................................................. 6

Table 4: Kenyan plantation species for the furniture industry (2013) ........................................ 13Table 5: High level impact indicators of wood plantations ......................................................... 13Table 6: High level impact indicators of the sawmilling industry ............................................... 15Table 7: High level impact indicators of the wood-based panel industry ................................... 16Table 8: Characteristics of the formal furniture sector .............................................................. 18Table 9: High level impact indicators for the formal furniture sector ........................................ 18Table 10: Characteristics of the informal furniture sector ........................................................... 19Table 11: High level impact indicators of Jua Kali sector .............................................................. 20Table 12: Percentage share and value of imports in the Kenyan furniture market (2013) in USD millions .............................................................................................................. 23Table 13: Summary of cost differences between Kenya and China .............................................. 24Table 14: Cost comparisons of furniture inputs and manufacturing among select competitors 25Table 15: Proposed strategy targeting Kenyan furniture manufacturing and exports ................. 31Table 16: Summary table of recommendations ........................................................................... 33

ABBReVIAtIons
CAGR Compound Annual Growth RateCSIL Center for Industrial StudiesCOMESA Common Market for Eastern and Southern Africa EAC East African CommunityEU European UnionFDI Foreign Direct Investment GRDS Global Research & Development ServicesKFS Kenya Forest Service KNBS Kenya National Bureau of StatisticsMDF Medium Density Fireboard MOED Ministry of Industrialization and Enterprise Development NITA National Industrial Training AgencyOBM Original Brand ManufacturingODM Original Design Manufacturing PPP Public-Private Partnership SADC Southern African Development Community
FURNITURE INDUSTRy IN KENyA i
eXecUtIVe sUmmARY
The performance of the furniture and timber value chain in Kenya is crucial both to
employment and growth in the country. The sector employs 160,000 people---starting from the forestry sector and going all the way through manufacturing—produces approximately US$452 million of furniture per year and exports US$22 million. With this in mind, the Ministry of Industrialization and Enterprise Development (MOIED) requested the World Bank analyze these sectors in order to understand their current state of development, their main constraints, and the interventions necessary to accelerate their growth. This report intends to summarize these.
Global output of furniture amounts to US$480 billion and global trade in furniture stands at US$140 billion.1 Over the last decade, world furniture production has increased year on year with the exception of 2008 and 2009. In 2010, for the first time, the share of wood furniture production from middle and low income countries was over half of total world furniture production, at 53 percent.2 Africa accounts for 2.2% of output and 2.8% of trade, with net imports amounting to US$2.5 billion, with demand in the region being driven by rapid urbanization and increasing purchasing power. The East African furniture market is valued at US$1.2 billion and trade in the region is worth US$298 million.3 Kenya is the largest producer of furniture in East Africa.
Kenya’s furniture industry is well positioned to expand its furniture sales domestically and regionally to capitalize on the growing local
and regional markets in East Africa, other parts of the continent, and beyond. Kenya is the strongest regional producer in East Africa. It has a logistically advantageous geographic position that confers it comparatively easy access to local, regional and international markets, a supply of raw materials from neighboring countries that is relatively accessible, and a large workforce with a strong tradition of working in both the informal and formal segments of the furniture value chain.
The furniture market in Kenya stood approximately at US$496 million in sales in 2013, with a Compound annual Growth rate (CaGr) of 10% over the past five years. Similar growth over the coming years is expected. Furniture imports stand at US$66 million and constitute 13 percent of the total market. Imports are taking an increasingly large portion of the Kenyan market, growing at a CAGR of 24% between 2009-20134. Exports are growing more slowly at a 10% CAGR. Without a significant push for the development of the local industry, an increasing proportion of consumption in these markets will be met by imports.
The furniture value chain in Kenya consists of six core segments. It begins with the forestry sector, and progresses through timber harvesting and transport, timber processing, and timber trading. The furniture industry sources from timber traders and processors, and may sell through furniture outlets or directly to consumers. Figure 1 illustrates the value chain, and identifies the key stakeholders at every stage in the process.
1 Creapo.2 European Commission, (2014), “The EU Furniture Market Situation and a Possible Furniture Products Initiative.” Available at: http://ec.europa.eu/growth/
tools-databases/newsroom/cf/itemdetail.cfm?item_id=7918&lang=en&title=Study-on-the-EU-furniture-market-situation-and-a-possible-furniture-products-initiative-
3 Creapo.4 Creapo.
Situational Analysis and Strategy ii
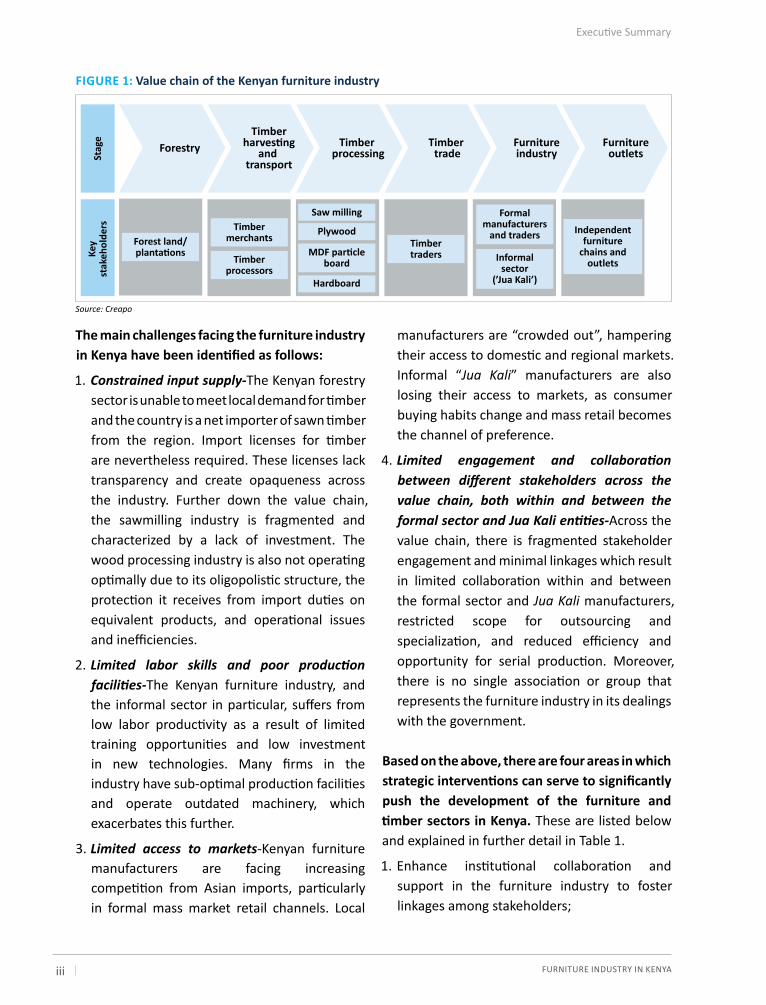
The main challenges facing the furniture industry in Kenya have been identified as follows:
1. Constrained input supply-The Kenyan forestry sector is unable to meet local demand for timber and the country is a net importer of sawn timber from the region. Import licenses for timber are nevertheless required. These licenses lack transparency and create opaqueness across the industry. Further down the value chain, the sawmilling industry is fragmented and characterized by a lack of investment. The wood processing industry is also not operating optimally due to its oligopolistic structure, the protection it receives from import duties on equivalent products, and operational issues and inefficiencies.
2. Limited labor skills and poor production facilities-The Kenyan furniture industry, and the informal sector in particular, suffers from low labor productivity as a result of limited training opportunities and low investment in new technologies. Many firms in the industry have sub-optimal production facilities and operate outdated machinery, which exacerbates this further.
3. Limited access to markets-Kenyan furniture manufacturers are facing increasing competition from Asian imports, particularly in formal mass market retail channels. Local
manufacturers are “crowded out”, hampering their access to domestic and regional markets. Informal “Jua Kali” manufacturers are also losing their access to markets, as consumer buying habits change and mass retail becomes the channel of preference.
4. Limited engagement and collaboration between different stakeholders across the value chain, both within and between the formal sector and Jua Kali entities-Across the value chain, there is fragmented stakeholder engagement and minimal linkages which result in limited collaboration within and between the formal sector and Jua Kali manufacturers, restricted scope for outsourcing and specialization, and reduced efficiency and opportunity for serial production. Moreover, there is no single association or group that represents the furniture industry in its dealings with the government.
Based on the above, there are four areas in which strategic interventions can serve to significantly push the development of the furniture and timber sectors in Kenya. These are listed below and explained in further detail in Table 1.
1. Enhance institutional collaboration and support in the furniture industry to foster linkages among stakeholders;
FiGure 1: Value chain of the Kenyan furniture industry
Source: Creapo
Forestry
Forest land/plantations
Timbermerchants Timber
traders
Formalmanufacturers
and traders Independentfurniture
chains andoutletsInformal
sector(’Jua Kali’)
Saw milling
Plywood
MDF particleboard
Hardboard
Timberprocessors
Timber processing
Timber trade
Furnitureindustry
Furnitureoutlets
Timberharvesting
and transport
Stag
eKe
yst
akeh
olde
rs
Executive Summary
FURNITURE INDUSTRy IN KENyA iii
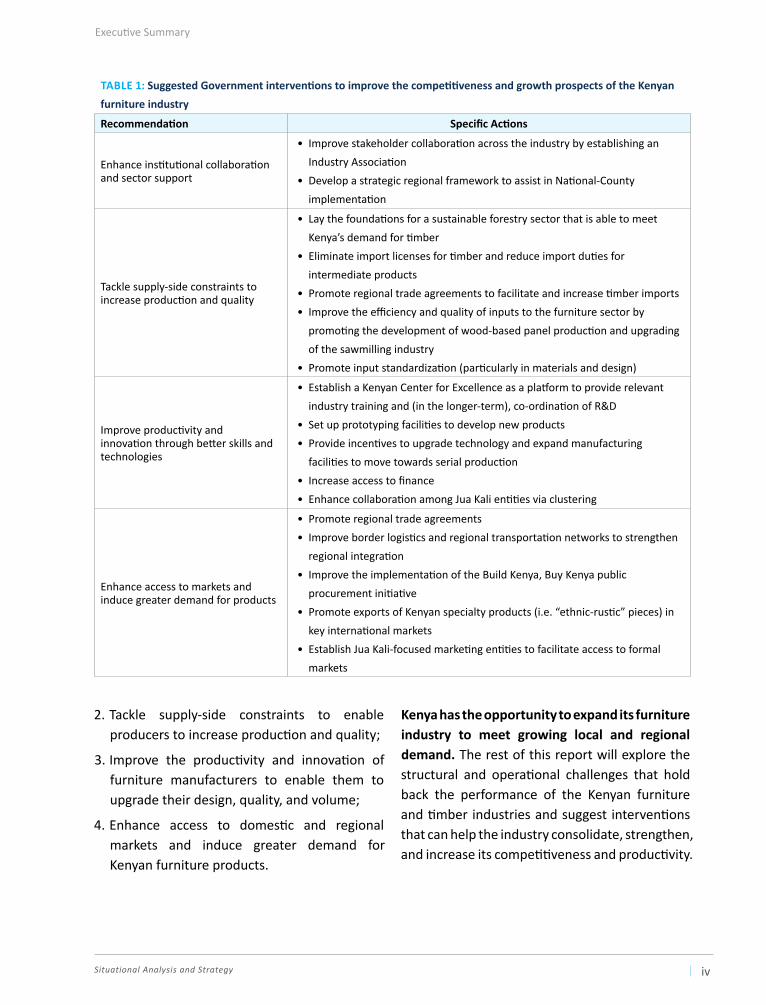
taBLe 1: Suggested Government interventions to improve the competitiveness and growth prospects of the Kenyan furniture industry
Recommendation Specific Actions
Enhance institutional collaboration and sector support
• Improve stakeholder collaboration across the industry by establishing an Industry Association
• Develop a strategic regional framework to assist in National-County implementation
Tackle supply-side constraints to increase production and quality
• Lay the foundations for a sustainable forestry sector that is able to meet Kenya’s demand for timber
• Eliminate import licenses for timber and reduce import duties for intermediate products
• Promote regional trade agreements to facilitate and increase timber imports• Improve the efficiency and quality of inputs to the furniture sector by
promoting the development of wood-based panel production and upgrading of the sawmilling industry
• Promote input standardization (particularly in materials and design)
Improve productivity and innovation through better skills and technologies
• Establish a Kenyan Center for Excellence as a platform to provide relevant industry training and (in the longer-term), co-ordination of R&D
• Set up prototyping facilities to develop new products• Provide incentives to upgrade technology and expand manufacturing
facilities to move towards serial production• Increase access to finance• Enhance collaboration among Jua Kali entities via clustering
Enhance access to markets and induce greater demand for products
• Promote regional trade agreements• Improve border logistics and regional transportation networks to strengthen
regional integration• Improve the implementation of the Build Kenya, Buy Kenya public
procurement initiative • Promote exports of Kenyan specialty products (i.e. “ethnic-rustic” pieces) in
key international markets• Establish Jua Kali-focused marketing entities to facilitate access to formal
markets
Executive Summary
2. Tackle supply-side constraints to enable producers to increase production and quality;
3. Improve the productivity and innovation of furniture manufacturers to enable them to upgrade their design, quality, and volume;
4. Enhance access to domestic and regional markets and induce greater demand for Kenyan furniture products.
Kenya has the opportunity to expand its furniture industry to meet growing local and regional demand. The rest of this report will explore the structural and operational challenges that hold back the performance of the Kenyan furniture and timber industries and suggest interventions that can help the industry consolidate, strengthen, and increase its competitiveness and productivity.
Situational Analysis and Strategy iv

Situational Analysis and Strategy 1
1. IntRodUctIon
1.1 Objectives
The Government of Kenya recognizes that the performance of the furniture sector is crucial
both to employment and growth in the country. The Ministry of Industrialization and Enterprise Development (MOIED) therefore requested an analysis of both the furniture and timber sectors, in order to understand their current state of development, their main constraints, and the interventions necessary to accelerate their growth.
The objective of this report is to provide a comprehensive value-chain analysis of the Kenyan furniture industry, including the timber sub-sector, in order to assess policy options available to the MOIED and recommend critical interventions to stimulate the industry’s development. By situating Kenya’s furniture industry within the global and regional context, this paper also aims to identify ways in which to boost Kenya’s competiveness in the East African markets and beyond.
The analysis in this report is largely focused on the wooden furniture sector (versus plastics, composites, and other furniture). The bulk of Kenya’s furniture industry is focused on wood, and Kenya has a competitive advantage in wood relative to South Africa, Asian countries, and Europe, which have very competitive value chains in furniture made from other materials.
1.2 methodology and structure
To meet the above objectives, available data was analyzed and field surveys of formal
and informal furniture businesses, timber traders, and training providers were conducted. Data was collected by way of oral interviews, administrative questionnaires, and observations of 244 businesses along different stages of the furniture value chain in different parts of the country. In addition, conversations with industry stakeholders were held to deepen the analysis and verify findings. Official data was used as a starting point (KNBS Census of Industrial Production, KNBS Economic Survey and Abstract, and World Bank Enterprise Survey for Informal Firms), and complemented where needed. The above provided the basis for a comprehensive and strategic analysis of the industry and informed the development of policy recommendations and interventions.
Data collection, in the form of oral interviews and administrative questionnaires, was directed at six categories of respondents, selected from 16 counties with major towns as focal points. The main criteria for choosing the counties to be surveyed was the perceived concentration of furniture enterprises and volume of trade in furniture and related wood products.
FURNITURE INDUSTRy IN KENyA 2
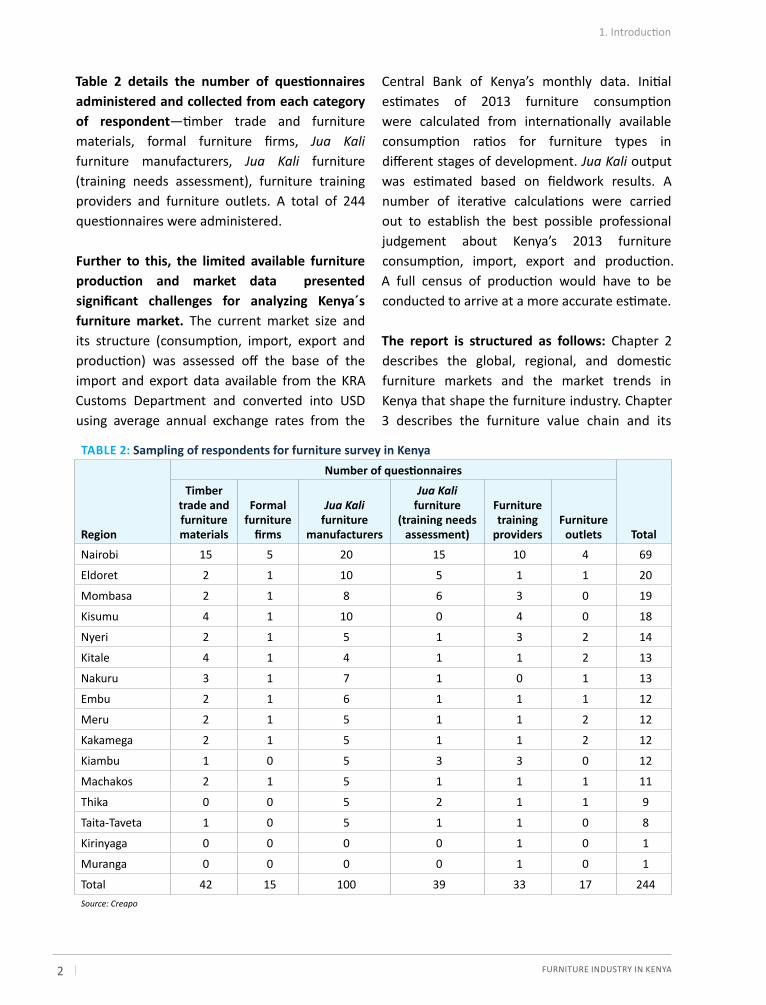
Table 2 details the number of questionnaires administered and collected from each category of respondent—timber trade and furniture materials, formal furniture firms, Jua Kali furniture manufacturers, Jua Kali furniture (training needs assessment), furniture training providers and furniture outlets. A total of 244 questionnaires were administered.
Further to this, the limited available furniture production and market data presented significant challenges for analyzing Kenya´s furniture market. The current market size and its structure (consumption, import, export and production) was assessed off the base of the import and export data available from the KRA Customs Department and converted into USD using average annual exchange rates from the
Central Bank of Kenya’s monthly data. Initial estimates of 2013 furniture consumption were calculated from internationally available consumption ratios for furniture types in different stages of development. Jua Kali output was estimated based on fieldwork results. A number of iterative calculations were carried out to establish the best possible professional judgement about Kenya’s 2013 furniture consumption, import, export and production. A full census of production would have to be conducted to arrive at a more accurate estimate.
The report is structured as follows: Chapter 2 describes the global, regional, and domestic furniture markets and the market trends in Kenya that shape the furniture industry. Chapter 3 describes the furniture value chain and its
taBLe 2: Sampling of respondents for furniture survey in Kenya
region
Number of questionnaires
total
timber trade and furniture materials
Formal furniture
firms
Jua Kali furniture
manufacturers
Jua Kali furniture
(training needs assessment)
Furniture training
providersFurniture
outlets
Nairobi 15 5 20 15 10 4 69
Eldoret 2 1 10 5 1 1 20
Mombasa 2 1 8 6 3 0 19
Kisumu 4 1 10 0 4 0 18
Nyeri 2 1 5 1 3 2 14
Kitale 4 1 4 1 1 2 13
Nakuru 3 1 7 1 0 1 13
Embu 2 1 6 1 1 1 12
Meru 2 1 5 1 1 2 12
Kakamega 2 1 5 1 1 2 12
Kiambu 1 0 5 3 3 0 12
Machakos 2 1 5 1 1 1 11
Thika 0 0 5 2 1 1 9
Taita-Taveta 1 0 5 1 1 0 8
Kirinyaga 0 0 0 0 1 0 1
Muranga 0 0 0 0 1 0 1
Total 42 15 100 39 33 17 244Source: Creapo
1. Introduction
Situational Analysis and Strategy 3
historic growth, including forestry, sawmills, plywood mills, furniture manufacturers, and retail outlets. Chapter 4 focuses on Kenya’s performance against imports, and highlights critical constraints that hold back the industry. Chapter 5 elaborates on the sector’s strengths,
competitive advantages, and opportunities for development. Chapter 6 concludes with recommendations to accelerate the growth of the industry. Where possible, chapters end with a summary of key points and conclusions.
1. Introduction

Situational Analysis and Strategy 5
This chapter explores the global, regional and domestic furniture markets as well as
the market trends that shape the industry. It examines key historical and forecast demand and supply dynamics, identifies Kenya’s most important furniture products and highlights its most significant segments. The chapter concludes by describing key trends in domestic and export markets.
2.1 Overview of Global Market and Trendstechnological advances and decreased trading costs have lowered furniture prices and opened markets up to foreign competition. Indeed, in the last ten years, world trade of furniture, which accounts for about 1 percent of world trade of manufactured goods, has grown faster than furniture production.5 This increase has been due to:
• Improvements in technology, which have increased the productivity of manufacturing and reduced the impact of labor costs on total productivity. Some of these improvements include: new furniture designs, new types of wood products, new packing methods enabling efficient use of cargo space, and overall reductions in material costs due to lower barriers of entry for competitive supply sources.
• Development of standards and certification for wood and furniture for export markets.
• Strengthened presence of furniture distribution chains and outlets in import markets.
• Assertive Government policies and strategies in China and Malaysia, and strong Government and firm-negotiated conditions in Turkey and Poland, as well as in a number of other emerging countries, which have resulted in lower production costs and increased competitiveness.
Over the last decade, world furniture production has increased year on year with the exception of 2008 and 2009. In 2014, global furniture production was worth US$480 billion and global furniture trade amounted to US$140 billion.6 The top furniture importing countries were the United States, Germany, France, UK, and Canada, while the top exporting countries were China, Italy, Germany, Poland, the United States, and Malaysia. In the last decade, China emerged as the world leader in terms of furniture production, more than doubling its exports from US$25 billion in 2009 to US$53 billion in 2014.7 Table 3 shows the top 10 countries in terms of furniture production and percentage share in 2003 and in 2014. Notably, the top furniture producing countries somewhat coincide with the top furniture importing countries, further underlining the importance and dynamism of trade in the furniture industry.
2. gloBAl, RegIonAl, And domestIc FURnItURe mARkets And tRends
5 European Commission, (2014), “The EU Furniture Market Situation and a Possible Furniture Products Initiative.”Indeed, between 2013-2014, global furniture trade increased by 3.2 percent according to Furniture Today, (2013), “CSIL: Global furniture trade to climb 3.2% in 2014,” December 30.
Available at: http://www.furnituretoday.com/article/483967-csil-global-furniture-trade-to-climb-32-in-20146 Furnishing Idea, (2014), “CSIL: The Global Scenario of markets,” December 15. Available at:http://www.furnishingidea.com/news/economy-and-
marketing/2014/csil--the-global-scenario-of-markets_346.html7 Furnishing Idea, (2014), “CSIL: The Global Scenario of markets,” December 15. Available at:http://www.furnishingidea.com/news/economy-and-
marketing/2014/csil--the-global-scenario-of-markets_346.html
FURNITURE INDUSTRy IN KENyA 6
In 2010, for the first time, the share of production of middle and low income countries was over half of total world furniture production, at 53 percent. This was due to increased production in emerging economies to satisfy increased demand in domestic markets (Brazil, India), and investments made by companies from advanced economies in new plants designed to boost growth in exports.9
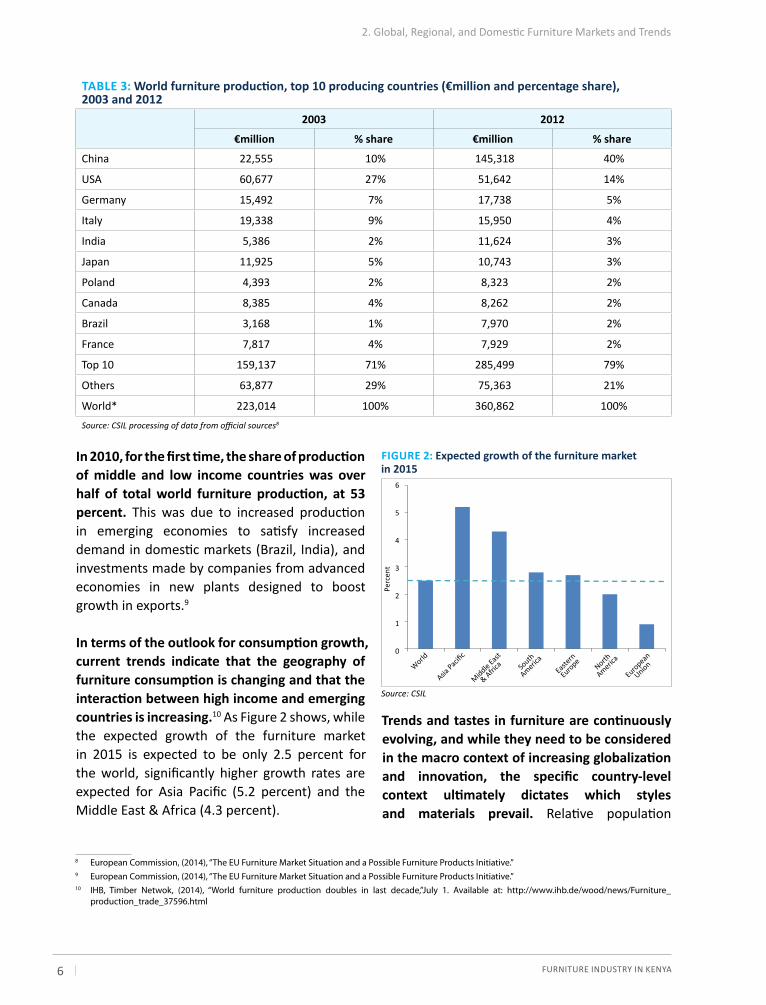
In terms of the outlook for consumption growth, current trends indicate that the geography of furniture consumption is changing and that the interaction between high income and emerging countries is increasing.10 As Figure 2 shows, while the expected growth of the furniture market in 2015 is expected to be only 2.5 percent for the world, significantly higher growth rates are expected for Asia Pacific (5.2 percent) and the Middle East & Africa (4.3 percent).
Trends and tastes in furniture are continuously evolving, and while they need to be considered in the macro context of increasing globalization and innovation, the specific country-level context ultimately dictates which styles and materials prevail. Relative population
FiGure 2: Expected growth of the furniture market in 2015
Source: CSIL
0
1
2
3
4
5
Perc
ent
6
World
Asia Pac
ific
Middle East
& Africa So
uth
America
Eastern
EuropeNorth
America
European
Union
2. Global, Regional, and Domestic Furniture Markets and Trends
taBLe 3: World furniture production, top 10 producing countries (€million and percentage share), 2003 and 2012
2003 2012
€million % share €million % share
China 22,555 10% 145,318 40%
USA 60,677 27% 51,642 14%
Germany 15,492 7% 17,738 5%
Italy 19,338 9% 15,950 4%
India 5,386 2% 11,624 3%
Japan 11,925 5% 10,743 3%
Poland 4,393 2% 8,323 2%
Canada 8,385 4% 8,262 2%
Brazil 3,168 1% 7,970 2%
France 7,817 4% 7,929 2%
Top 10 159,137 71% 285,499 79%
Others 63,877 29% 75,363 21%
World* 223,014 100% 360,862 100%Source: CSIL processing of data from official sources8
8 European Commission, (2014), “The EU Furniture Market Situation and a Possible Furniture Products Initiative.” 9 European Commission, (2014), “The EU Furniture Market Situation and a Possible Furniture Products Initiative.”10 IHB, Timber Netwok, (2014), “World furniture production doubles in last decade,”July 1. Available at: http://www.ihb.de/wood/news/Furniture_
production_trade_37596.html
Situational Analysis and Strategy 7
demographics and family formation, spatial layout of housing and other building construction that emerge in countries, cities or towns are fundamentally important, as are dynamics like the role of the home and the lifestyle enabled by a specific location (office, retail, education and health facilities, etc.). Residents of highly congested cities, for example, are likely to have a preference for furniture that is smaller, more compact and easier to transport and assemble in high rise apartment buildings.
environmental awareness is increasingly gaining momentum as a powerfulforce in furniture manufacturing. This takes many forms - from ensuring wood is sourced from a sustainable forest (with a source authentication label provided), to using eco-friendly finishing materials, to awareness about the carbon-footprint of manufacturing (fuel used to transport, distance from input sources, use of recycled materials, etc.). Linked to this is the prevalence of long-standing vintage furniture, globally. In terms of tastes—globally inspired designs and gently profiled furniture have become more common (versus furniture with sharp, large edges), as have multifunctional/all-round pieces, often with an IT functionality. The niche for custom-made furniture, special bedroom furniture (mattresses with health functions), and niche markets (leather furniture) also remains prominent, as does demand for subsectors like outdoor and leather furniture.
In terms of production and business development trends, the demand for high quality products continues to increase. Across the world, retailers are increasingly accustomed to obtaining large volume orders from outlet chains, and operating with flexible production lines that can accommodate changes in orders
and designs. They are also increasingly used to ever-shorter delivery times, sophisticated distribution channels that are continuously evolving, and access to e-trade.
2.2 The Furniture Market in Africa
Demand for furniture in Africa is rising due to growing populations, urbanization, and
purchasing power. Africa accounts for about 2.2 percent of the global consumption of furniture and about 2.8 percent of the global furniture trade, with net imports at US$2.5 billion11. Demand is being met both through local production and imports: between 2009 and 2015, furniture production in Africa and the Middle East grew by 15 percent.12
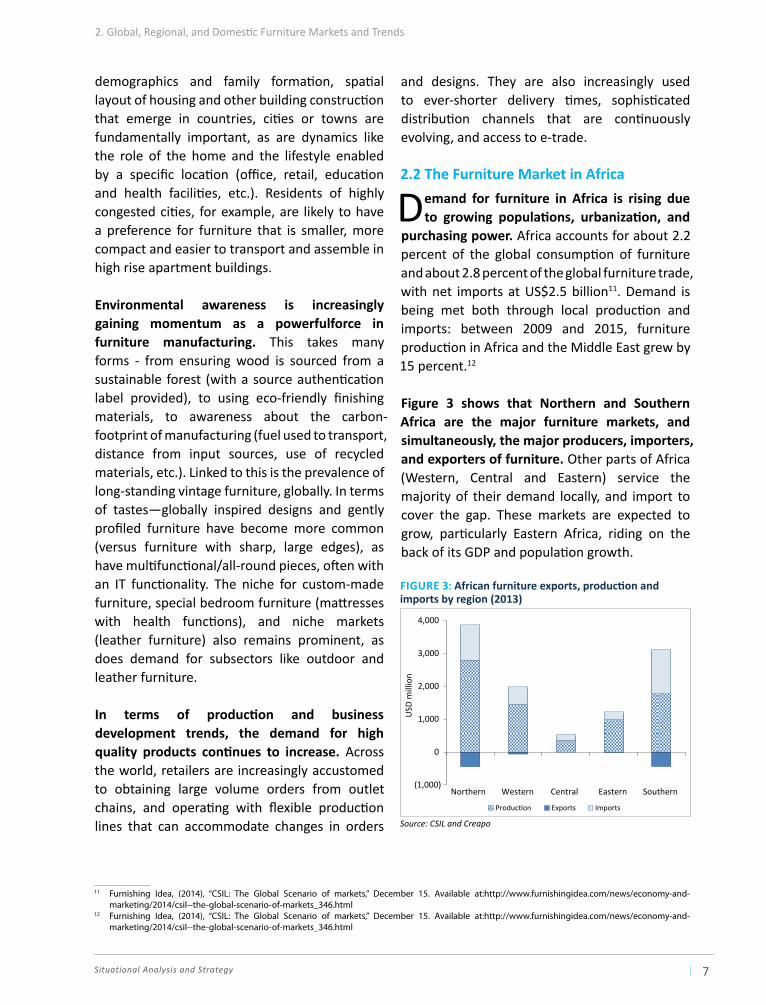
Figure 3 shows that northern and southern Africa are the major furniture markets, and simultaneously, the major producers, importers, and exporters of furniture. Other parts of Africa (Western, Central and Eastern) service the majority of their demand locally, and import to cover the gap. These markets are expected to grow, particularly Eastern Africa, riding on the back of its GDP and population growth.
FiGure 3: African furniture exports, production and imports by region (2013)
Source: CSIL and Creapo
(1,000)
0
1,000
2,000
3,000
4,000
Northern Western Central Eastern Southern
USD
mill
ion
Production Exports Imports
2. Global, Regional, and Domestic Furniture Markets and Trends
11 Furnishing Idea, (2014), “CSIL: The Global Scenario of markets,” December 15. Available at:http://www.furnishingidea.com/news/economy-and-marketing/2014/csil--the-global-scenario-of-markets_346.html
12 Furnishing Idea, (2014), “CSIL: The Global Scenario of markets,” December 15. Available at:http://www.furnishingidea.com/news/economy-and-marketing/2014/csil--the-global-scenario-of-markets_346.html
FURNITURE INDUSTRy IN KENyA 8
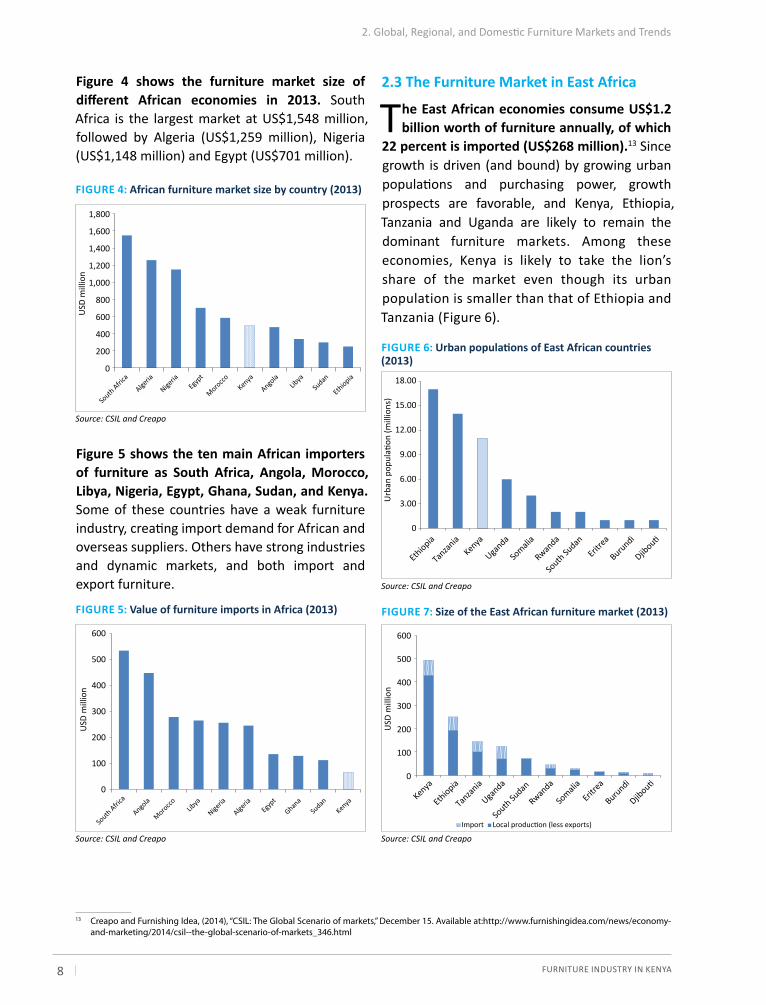
Figure 4 shows the furniture market size of different African economies in 2013. South Africa is the largest market at US$1,548 million, followed by Algeria (US$1,259 million), Nigeria (US$1,148 million) and Egypt (US$701 million).
Figure 5 shows the ten main African importers of furniture as South Africa, Angola, Morocco, Libya, nigeria, egypt, Ghana, sudan, and Kenya. Some of these countries have a weak furniture industry, creating import demand for African and overseas suppliers. Others have strong industries and dynamic markets, and both import and export furniture.
2.3 The Furniture Market in East Africa
The East African economies consume US$1.2 billion worth of furniture annually, of which
22 percent is imported (US$268 million).13 Since growth is driven (and bound) by growing urban populations and purchasing power, growth prospects are favorable, and Kenya, Ethiopia, Tanzania and Uganda are likely to remain the dominant furniture markets. Among these economies, Kenya is likely to take the lion’s share of the market even though its urban population is smaller than that of Ethiopia and Tanzania (Figure 6).
FiGure 6: Urban populations of East African countries (2013)
Source: CSIL and Creapo
0
3.00
Ethiopia
Tanzan
iaKenya
Uganda
Somali
a
Rwanda
South Su
danErit
rea
Burundi
Djibouti
6.00
9.00
12.00
15.00
18.00U
rban
pop
ulati
on (m
illio
ns)
FiGure 7: Size of the East African furniture market (2013)
Source: CSIL and Creapo
0
100
200
300
400
500
600
Kenya
Ethiopia
Tanzan
ia
Uganda
South Su
dan
Rwanda
Somali
a
Eritrea
Burundi
Djibouti
USD
mill
ion
Import Local production (less exports)
2. Global, Regional, and Domestic Furniture Markets and Trends
FiGure 4: African furniture market size by country (2013)
Source: CSIL and Creapo
0
200
400
600
800
1,000
1,200
1,400
1,600
1,800
USD
mill
ion
FiGure 5: Value of furniture imports in Africa (2013)
Source: CSIL and Creapo
0
100
200
300
400
500
600
USD
mill
ion
13 Creapo and Furnishing Idea, (2014), “CSIL: The Global Scenario of markets,” December 15. Available at:http://www.furnishingidea.com/news/economy-and-marketing/2014/csil--the-global-scenario-of-markets_346.html
Situational Analysis and Strategy 9
as illustrated in Figure 7, Kenya is the largest market for furniture in East Africa. It is also the largest producer of furniture—manufacturing twice as much as Ethiopia, the next biggest market.
2.4 The Furniture Market in Kenya
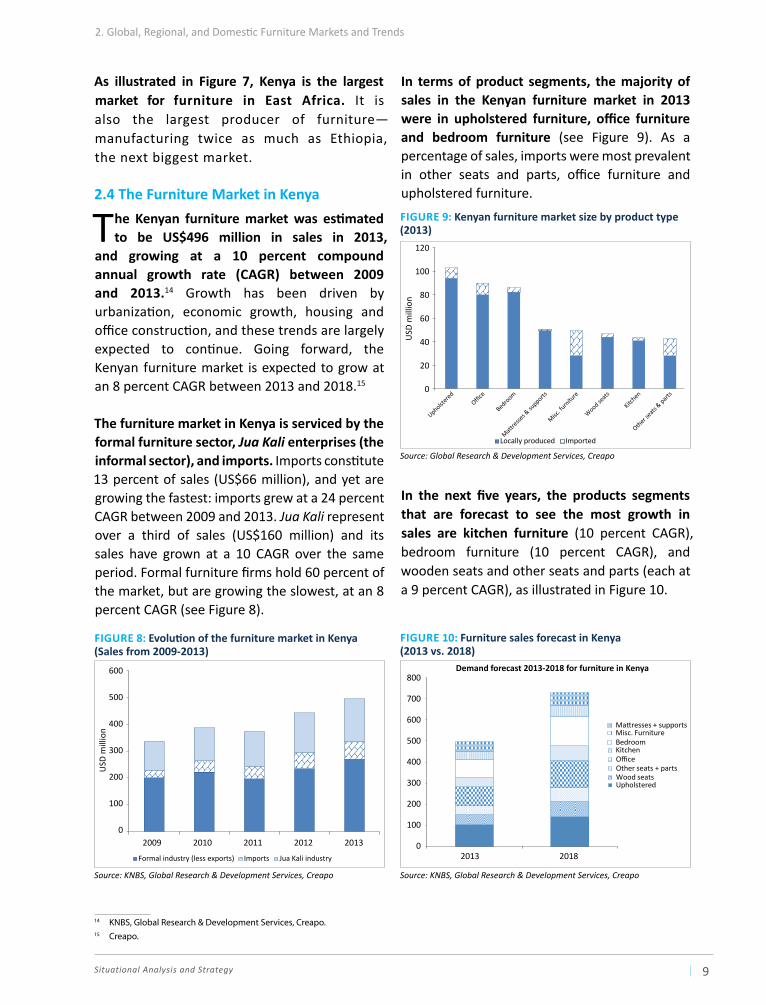
The Kenyan furniture market was estimated to be US$496 million in sales in 2013,
and growing at a 10 percent compound annual growth rate (CAGR) between 2009 and 2013.14 Growth has been driven by urbanization, economic growth, housing and office construction, and these trends are largely expected to continue. Going forward, the Kenyan furniture market is expected to grow at an 8 percent CAGR between 2013 and 2018.15
The furniture market in Kenya is serviced by the formal furniture sector, Jua Kali enterprises (the informal sector), and imports. Imports constitute 13 percent of sales (US$66 million), and yet are growing the fastest: imports grew at a 24 percent CAGR between 2009 and 2013. Jua Kali represent over a third of sales (US$160 million) and its sales have grown at a 10 CAGR over the same period. Formal furniture firms hold 60 percent of the market, but are growing the slowest, at an 8 percent CAGR (see Figure 8).
In terms of product segments, the majority of sales in the Kenyan furniture market in 2013 were in upholstered furniture, office furniture and bedroom furniture (see Figure 9). As a percentage of sales, imports were most prevalent in other seats and parts, office furniture and upholstered furniture.
in the next five years, the products segments that are forecast to see the most growth in sales are kitchen furniture (10 percent CAGR), bedroom furniture (10 percent CAGR), and wooden seats and other seats and parts (each at a 9 percent CAGR), as illustrated in Figure 10.
FiGure 10: Furniture sales forecast in Kenya (2013 vs. 2018)
Source: KNBS, Global Research & Development Services, Creapo
0
100
200
300
400
500
600
700
800
2013 2018
Demand forecast 2013-2018 for furniture in Kenya
Mattresses + supportsMisc. FurnitureBedroomKitchenOfficeOther seats + partsWood seatsUpholstered
FiGure 9: Kenyan furniture market size by product type (2013)
Source: Global Research & Development Services, Creapo
0
20
40
60
80
100
120
USD
mill
ion
Locally produced Imported
FiGure 8: Evolution of the furniture market in Kenya (Sales from 2009-2013)
Source: KNBS, Global Research & Development Services, Creapo
0
100
200
300
400
500
600
2009 2010 2011 2012 2013
USD
mill
ion
Formal industry (less exports) Imports Jua Kali industry
2. Global, Regional, and Domestic Furniture Markets and Trends
14 KNBS, Global Research & Development Services, Creapo.15 Creapo.
FURNITURE INDUSTRy IN KENyA 10
2.5 Chapter summary
This chapter explored the global, regional and domestic furniture markets and the trends
that most shaped them.
The global furniture market (worth US$480 billion in 2014) demonstrated positive growth over the last decade (except for 2008 and 2009). This growth was driven largely by lower furniture prices and more internationally competitive markets. The expected growth of the furniture market in 2015 is expected to be only 2.5 percent globally, with emerging markets expected to grow more rapidly, and Middle East & Africa forecast to grow at 4.3 percent. In this context, Africa accounts for about 2.2 percent of the global consumption of furniture and about 2.8 percent of the global furniture trade, with northern and southern Africa being the biggest regional markets, and South Africa, Algeria, Nigeria, Egypt, Morocco and Kenya being the largest country markets.
The East African economies consume US$1.2 billion worth of furniture annually, with Kenya being the largest market for furniture in East Africa (US$496 million) and largest producer of furniture. Within Kenya, the formal furniture and informal furniture sectors respectively supply around US$452 million worth of furniture annually, with the difference being met by net imports. Our analysis found that in 2013, upholstered furniture, bedroom furniture and office furniture held the bulk of the value in sales, with the products segments that are forecast to see the most growth in sales being kitchen furniture, bedroom furniture and wooden seats.
The following chapter explores the structure, key stakeholders and dynamics along the furniture value chain in Kenya, and serves as the foundation on which the competitiveness analysis in Chapter 4 is built.
2. Global, Regional, and Domestic Furniture Markets and Trends

Situational Analysis and Strategy 11
The furniture value chain in Kenya has six main parts to it (Figure 11 shows these graphically).
Each part is explained in turn in this Chapter, with regulations for each highlighted where relevant. The Chapter concludes with a map of key stakeholders and supporting institutions for the furniture value chain.
• Forestry: the key stakeholders are public and private owners of forest lands and plantations in Kenya and in neighboring countries.
• Timber harvesting and transport: key stakeholders are timber merchants and processors, responsible for moving wood from forest to processing factories. While timber merchants sell to smaller processing mills, large mills typically harvest and transport their inputs themselves.
• timber processers include mills for sawn timber, plywood, medium density fireboard
(MDF) particle board, and hardboard. These mills transform logs into processed timber to be used by furniture manufactures.
• timber traders sell processed wood to formal firms and Jua Kali entities. Timber traders exist in only some segments of the industry, as a significant portion of processed wood is sold directly to manufacturers.
• Furniture manufacturers include both formal and informal enterprises. Formal firms are typically small and medium enterprises, while informal ones are mostly individual craftsmen. Both of these segments sell directly to customers.
• Furniture outlets are typically independent furniture chains and retail outlets that sell finished furniture items, whether locally sourced from formal furniture manufacturers, imported, or both.
FiGure 11: Value chain of the Kenyan furniture industry
Source: Creapo
Forestry
Forest land/plantations
Timbermerchants Timber
traders
Formalmanufacturers
and traders Independentfurniture
chains andoutletsInformal
sector(’Jua Kali’)
Saw milling
Plywood
MDF particleboard
Hardboard
Timberprocessors
Timber processing
Timber trade
Furnitureindustry
Furnitureoutlets
Timberharvesting
and transport
Stag
eKe
yst
akeh
olde
rs
3. FURnItURe VAlUe chAIn
FURNITURE INDUSTRy IN KENyA 12
3.1 timber availability in Kenya
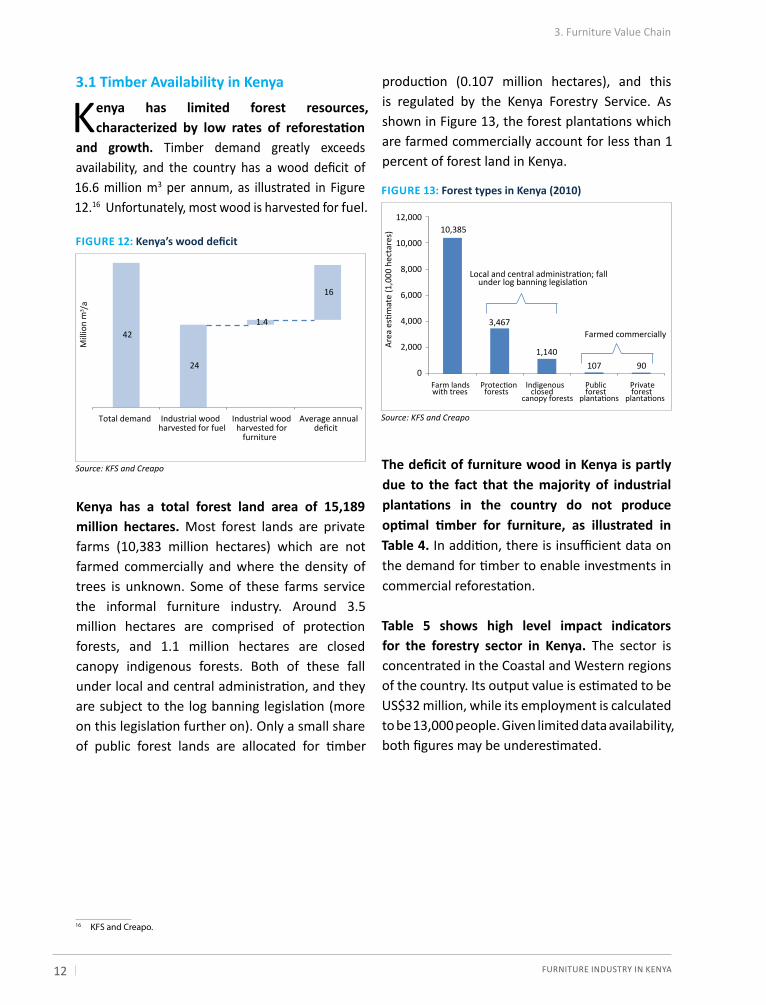
Kenya has limited forest resources, characterized by low rates of reforestation
and growth. Timber demand greatly exceeds availability, and the country has a wood deficit of 16.6 million m3 per annum, as illustrated in Figure 12.16 Unfortunately, most wood is harvested for fuel.
Kenya has a total forest land area of 15,189 million hectares. Most forest lands are private farms (10,383 million hectares) which are not farmed commercially and where the density of trees is unknown. Some of these farms service the informal furniture industry. Around 3.5 million hectares are comprised of protection forests, and 1.1 million hectares are closed canopy indigenous forests. Both of these fall under local and central administration, and they are subject to the log banning legislation (more on this legislation further on). Only a small share of public forest lands are allocated for timber
production (0.107 million hectares), and this is regulated by the Kenya Forestry Service. As shown in Figure 13, the forest plantations which are farmed commercially account for less than 1 percent of forest land in Kenya.
the deficit of furniture wood in Kenya is partly due to the fact that the majority of industrial plantations in the country do not produce optimal timber for furniture, as illustrated in table 4. In addition, there is insufficient data on the demand for timber to enable investments in commercial reforestation.
table 5 shows high level impact indicators for the forestry sector in Kenya. The sector is concentrated in the Coastal and Western regions of the country. Its output value is estimated to be US$32 million, while its employment is calculated to be 13,000 people. Given limited data availability, both figures may be underestimated.
FiGure 12: Kenya’s wood deficit
Source: KFS and Creapo
42
24
1.4
16
Total demand Industrial wood harvested for fuel
Industrial wood harvested for
furniture
Average annual deficit
Mill
ion
m3 /a
FiGure 13: Forest types in Kenya (2010)
Source: KFS and Creapo
10,385
3,467
1,140107 90
0
2,000
4,000
6,000
8,000
10,000
12,000
Farm lands with trees
Protection forests
Indigenous closed
canopy forestsPublic forest
plantationsPrivate forest
plantationsAr
ea e
stim
ate
(1,0
00 h
ecta
res)
Local and central administration; fall under log banning legislation
Farmed commercially
3. Furniture Value Chain
16 KFS and Creapo.

Situational Analysis and Strategy 13
3.2 Regulation in the Timber Industry
Kenyan furniture production used to be based on the utilization of indigenous hardwoods.
However, decreasing availability of hardwoods and an increasing emphasis on environmental protection of natural forests led to a timber harvesting ban on indigenous hardwoods in 1986, which resulted in a 50 percent decline of furniture production volume. On top of the ban on indigenous hardwoods, harvesting of plantation trees was banned from 1998 to 2012.17 In 2012, the ban on plantation trees was lifted on pre-qualification of sawmillers and analysis of plantation timber resources. The ban was re-introduced in November 2014 following a Presidential meeting with County Governors, and lifted in March 2015 following an enquiry on the status of forest plantations.
throughout these bans, there have been a small proportion of sanitary fellings each year that have provided some timber for the furniture industry. The Kenya Forestry Service (KFS) has also granted import licenses for timber. Timber species for furniture are imported primarily from Tanzania (mainly pine and cypress), the Democratic Republic of Congo (DRC, hardwoods) and Uganda. Between 2009 and 2013 the total value of timber imported into the country from both DRC and Tanzania was KSh 15.6 billion (US$184 million).18
the logging bans have had three major implications:
• They have enabled Kenyan private farmers to sell wood, but have also required Kenya to increase imports of logs and wood products from neighboring countries.
• Kenya has become a net importer of sawn timber (see Figure 14), though timber trade statistics have been criticized as inaccurate, and actual import volumes likely exceed licensed import allowances.
• The market price of timber products has increased consistently since 1998, likely due to the local timber harvesting bans, the logistical challenges of importing sawn timber, the transport costs associated with doing so, and the difficulties in securing consistent flows of import quantities and qualities.
taBLe 4: Kenyan plantation species for the furniture industry (2013)Forest area Hagenia Podo Cedar Meru Oak Markhamia Olea Mbambakofi Camphor
Aberdare
Mt. Elgon
Kakamega
Mt. Kenya
Mau
Arabuko Sokoke
KilimanjaroSource: KFS and Creapo
taBLe 5: High level impact indicators of wood plantationsEstimated value of output (annually) US$32 million
Location Coastal and Western regions
No. of people employed by KFS 5,400
No. of people employed in silviculture and forestry 6,600
No. of people employed in logging 1,150
Source: Creapo
3. Furniture Value Chain
17 Three companies, Raiply, Comply and Timsales, all associated with the Rai Group, were exempted from this ban on plantation trees.18 Kenya Forestry Research Institute, (2015), “KEFI-Policy brief No. 4.” Available at: http://www.kefri.org/pdf/POTENTIAL%20OPPORTUNITIES.pdf
FURNITURE INDUSTRy IN KENyA 14
3.3 the Kenyan sawmilling industry
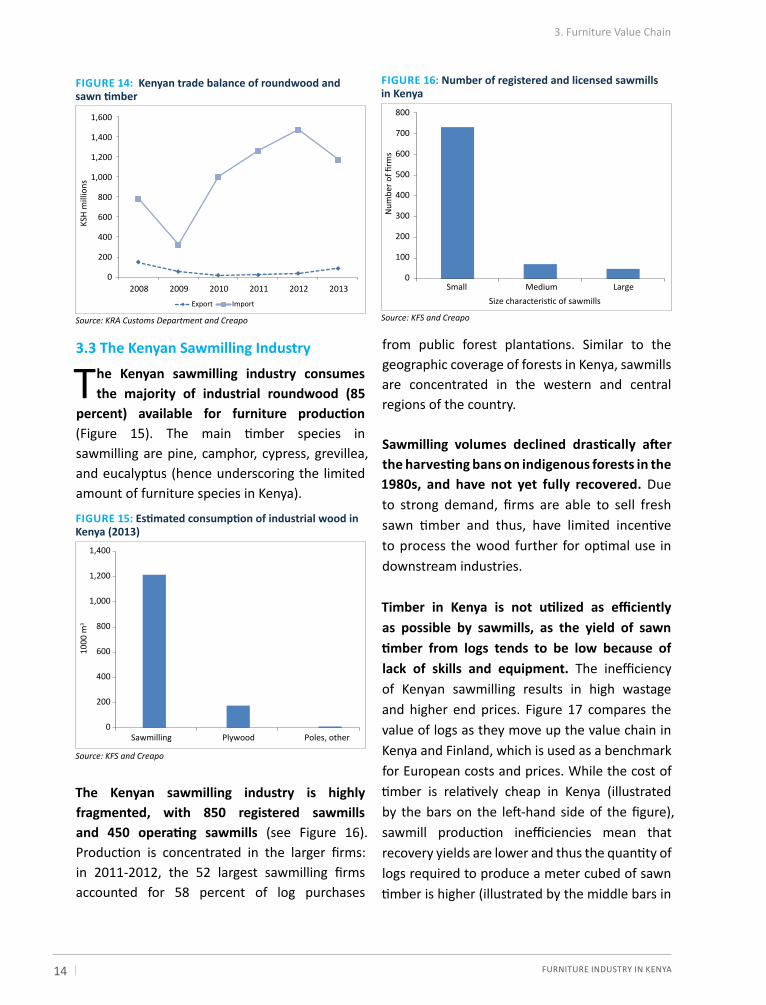
The Kenyan sawmilling industry consumes the majority of industrial roundwood (85
percent) available for furniture production (Figure 15). The main timber species in sawmilling are pine, camphor, cypress, grevillea, and eucalyptus (hence underscoring the limited amount of furniture species in Kenya).
the Kenyan sawmilling industry is highly fragmented, with 850 registered sawmills and 450 operating sawmills (see Figure 16). Production is concentrated in the larger firms: in 2011-2012, the 52 largest sawmilling firms accounted for 58 percent of log purchases
from public forest plantations. Similar to the geographic coverage of forests in Kenya, sawmills are concentrated in the western and central regions of the country.
Sawmilling volumes declined drastically after the harvesting bans on indigenous forests in the 1980s, and have not yet fully recovered. Due to strong demand, firms are able to sell fresh sawn timber and thus, have limited incentive to process the wood further for optimal use in downstream industries.
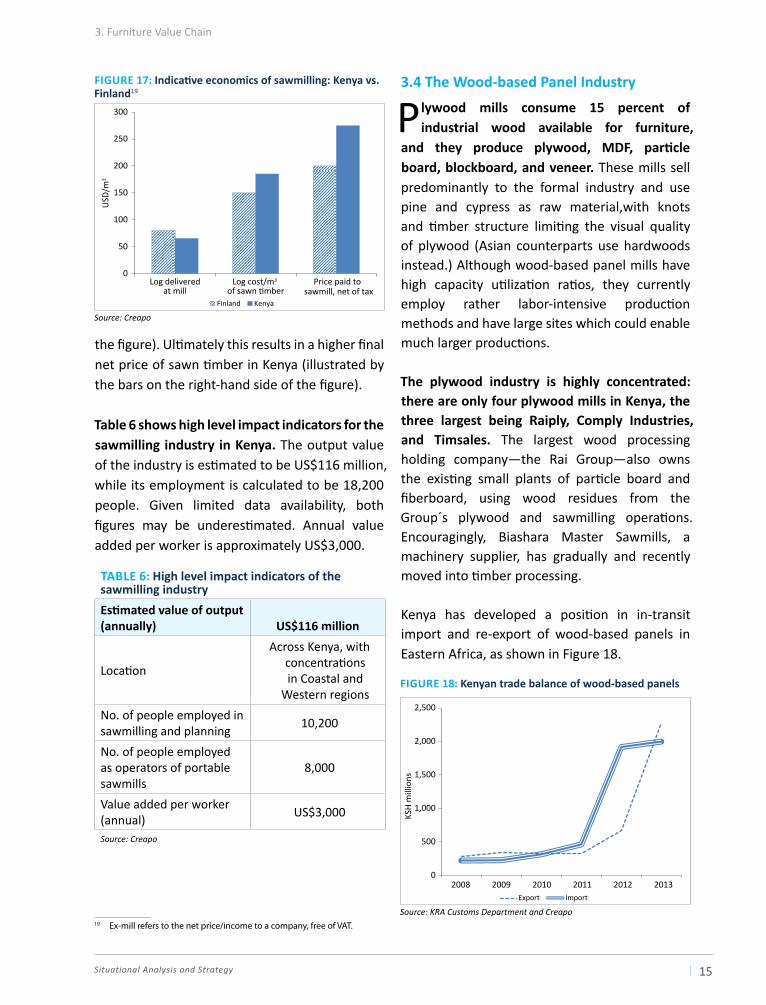
Timber in Kenya is not utilized as efficiently as possible by sawmills, as the yield of sawn timber from logs tends to be low because of lack of skills and equipment. The inefficiency of Kenyan sawmilling results in high wastage and higher end prices. Figure 17 compares the value of logs as they move up the value chain in Kenya and Finland, which is used as a benchmark for European costs and prices. While the cost of timber is relatively cheap in Kenya (illustrated by the bars on the left-hand side of the figure), sawmill production inefficiencies mean that recovery yields are lower and thus the quantity of logs required to produce a meter cubed of sawn timber is higher (illustrated by the middle bars in
FiGure 16: Number of registered and licensed sawmills in Kenya
Source: KFS and Creapo
0
100
200
300
400
500
600
700
800
Small Medium Large
Num
ber o
f firm
s
Size characteristic of sawmills
3. Furniture Value Chain
FiGure 15: Estimated consumption of industrial wood in Kenya (2013)
Source: KFS and Creapo
0
200
400
600
800
1,000
1,200
1,400
Sawmilling Plywood Poles, other
1000
m3
FiGure 14: Kenyan trade balance of roundwood and sawn timber
Source: KRA Customs Department and Creapo
0
200
400
600
800
1,000
1,200
1,400
1,600
2008 2009 2010 2011 2012 2013
KSH
mill
ions
Export Import
Situational Analysis and Strategy 15
the figure). Ultimately this results in a higher final net price of sawn timber in Kenya (illustrated by the bars on the right-hand side of the figure).
Table 6 shows high level impact indicators for the sawmilling industry in Kenya. The output value of the industry is estimated to be US$116 million, while its employment is calculated to be 18,200 people. Given limited data availability, both figures may be underestimated. Annual value added per worker is approximately US$3,000.
3.4 the Wood-based Panel industry
Plywood mills consume 15 percent of industrial wood available for furniture,
and they produce plywood, MDF, particle board, blockboard, and veneer. These mills sell predominantly to the formal industry and use pine and cypress as raw material,with knots and timber structure limiting the visual quality of plywood (Asian counterparts use hardwoods instead.) Although wood-based panel mills have high capacity utilization ratios, they currently employ rather labor-intensive production methods and have large sites which could enable much larger productions.
the plywood industry is highly concentrated: there are only four plywood mills in Kenya, the three largest being raiply, Comply industries, and timsales. The largest wood processing holding company—the Rai Group—also owns the existing small plants of particle board and fiberboard, using wood residues from the Group´s plywood and sawmilling operations. Encouragingly, Biashara Master Sawmills, a machinery supplier, has gradually and recently moved into timber processing.
Kenya has developed a position in in-transit import and re-export of wood-based panels in Eastern Africa, as shown in Figure 18.
FiGure 17: Indicative economics of sawmilling: Kenya vs. Finland19
Source: Creapo
0
50
100
150
200
250
300
Log deliveredat mill
Log cost/m3 of sawn timber
Price paid to sawmill, net of tax
USD
/m3
Finland Kenya
taBLe 6: High level impact indicators of the sawmilling industryEstimated value of output (annually) US$116 million
Location
Across Kenya, with concentrations in Coastal and
Western regionsNo. of people employed in sawmilling and planning 10,200
No. of people employed as operators of portable sawmills
8,000
Value added per worker (annual) US$3,000
Source: Creapo
FiGure 18: Kenyan trade balance of wood-based panels
Source: KRA Customs Department and Creapo
0
500
1,000
1,500
2,000
2,500
2008 2009 2010 2011 2012 2013
KSH
mill
ions
Export Import
3. Furniture Value Chain
19 Ex-mill refers to the net price/income to a company, free of VAT.
FURNITURE INDUSTRy IN KENyA 16
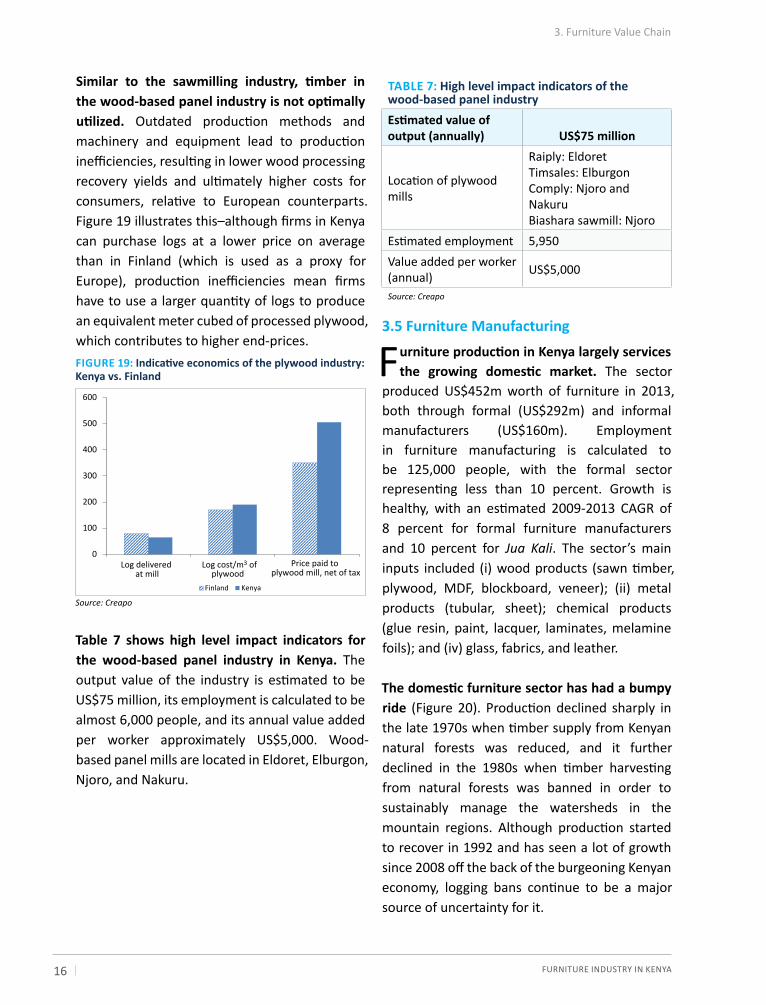
Similar to the sawmilling industry, timber in the wood-based panel industry is not optimally utilized. Outdated production methods and machinery and equipment lead to production inefficiencies, resulting in lower wood processing recovery yields and ultimately higher costs for consumers, relative to European counterparts. Figure 19 illustrates this–although firms in Kenya can purchase logs at a lower price on average than in Finland (which is used as a proxy for Europe), production inefficiencies mean firms have to use a larger quantity of logs to produce an equivalent meter cubed of processed plywood, which contributes to higher end-prices.
Table 7 shows high level impact indicators for the wood-based panel industry in Kenya. The output value of the industry is estimated to be US$75 million, its employment is calculated to be almost 6,000 people, and its annual value added per worker approximately US$5,000. Wood-based panel mills are located in Eldoret, Elburgon, Njoro, and Nakuru.
3.5 Furniture Manufacturing
Furniture production in Kenya largely services the growing domestic market. The sector
produced US$452m worth of furniture in 2013, both through formal (US$292m) and informal manufacturers (US$160m). Employment in furniture manufacturing is calculated to be 125,000 people, with the formal sector representing less than 10 percent. Growth is healthy, with an estimated 2009-2013 CAGR of 8 percent for formal furniture manufacturers and 10 percent for Jua Kali. The sector’s main inputs included (i) wood products (sawn timber, plywood, MDF, blockboard, veneer); (ii) metal products (tubular, sheet); chemical products (glue resin, paint, lacquer, laminates, melamine foils); and (iv) glass, fabrics, and leather.
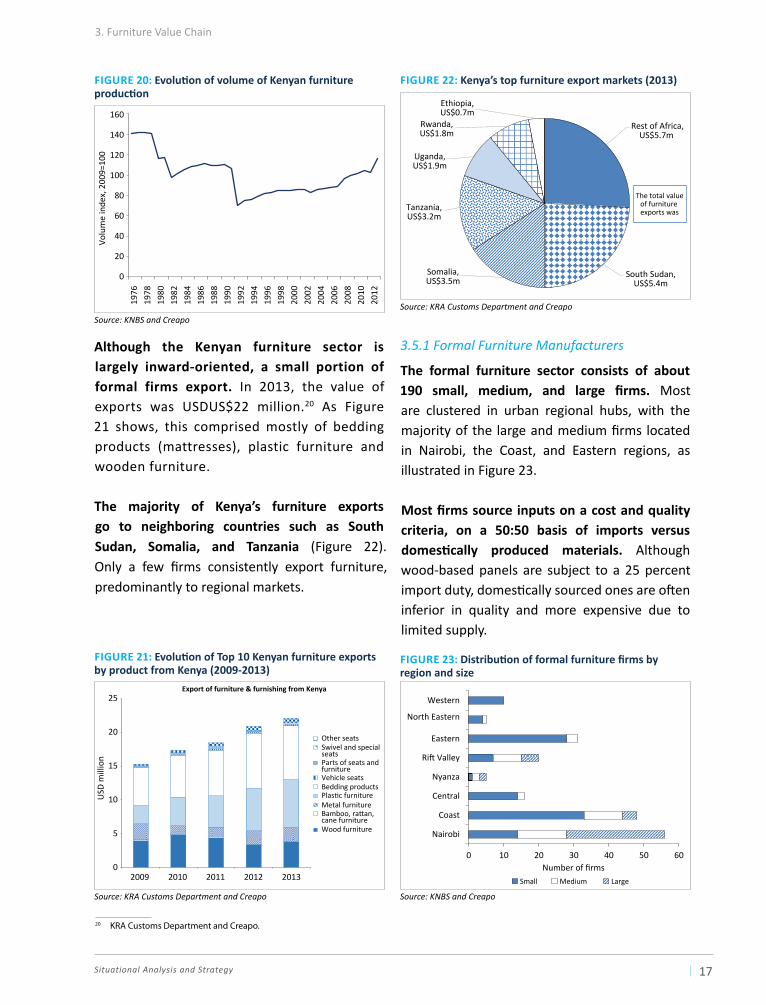
The domestic furniture sector has had a bumpy ride (Figure 20). Production declined sharply in the late 1970s when timber supply from Kenyan natural forests was reduced, and it further declined in the 1980s when timber harvesting from natural forests was banned in order to sustainably manage the watersheds in the mountain regions. Although production started to recover in 1992 and has seen a lot of growth since 2008 off the back of the burgeoning Kenyan economy, logging bans continue to be a major source of uncertainty for it.
3. Furniture Value Chain
FiGure 19: Indicative economics of the plywood industry: Kenya vs. Finland
Source: Creapo
0
100
200
300
400
500
600
Log delivered at mill
Log cost/m3 of plywood
Price paid to plywood mill, net of tax
Finland Kenya
taBLe 7: High level impact indicators of the wood-based panel industryEstimated value of output (annually) US$75 million
Location of plywood mills
Raiply: EldoretTimsales: ElburgonComply: Njoro and NakuruBiashara sawmill: Njoro
Estimated employment 5,950Value added per worker (annual) US$5,000
Source: Creapo
Situational Analysis and Strategy 17
Although the Kenyan furniture sector is largely inward-oriented, a small portion of formal firms export. In 2013, the value of exports was USDUS$22 million.20 As Figure 21 shows, this comprised mostly of bedding products (mattresses), plastic furniture and wooden furniture.
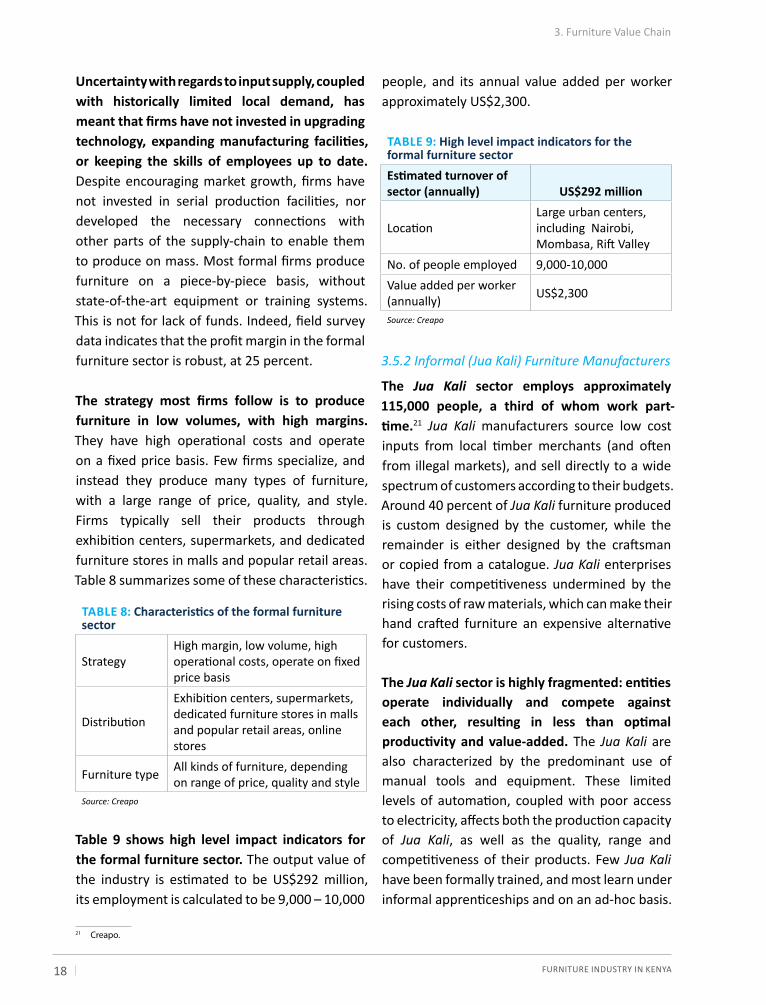
The majority of Kenya’s furniture exports go to neighboring countries such as south sudan, somalia, and tanzania (Figure 22). Only a few firms consistently export furniture, predominantly to regional markets.
3.5.1 Formal Furniture Manufacturers
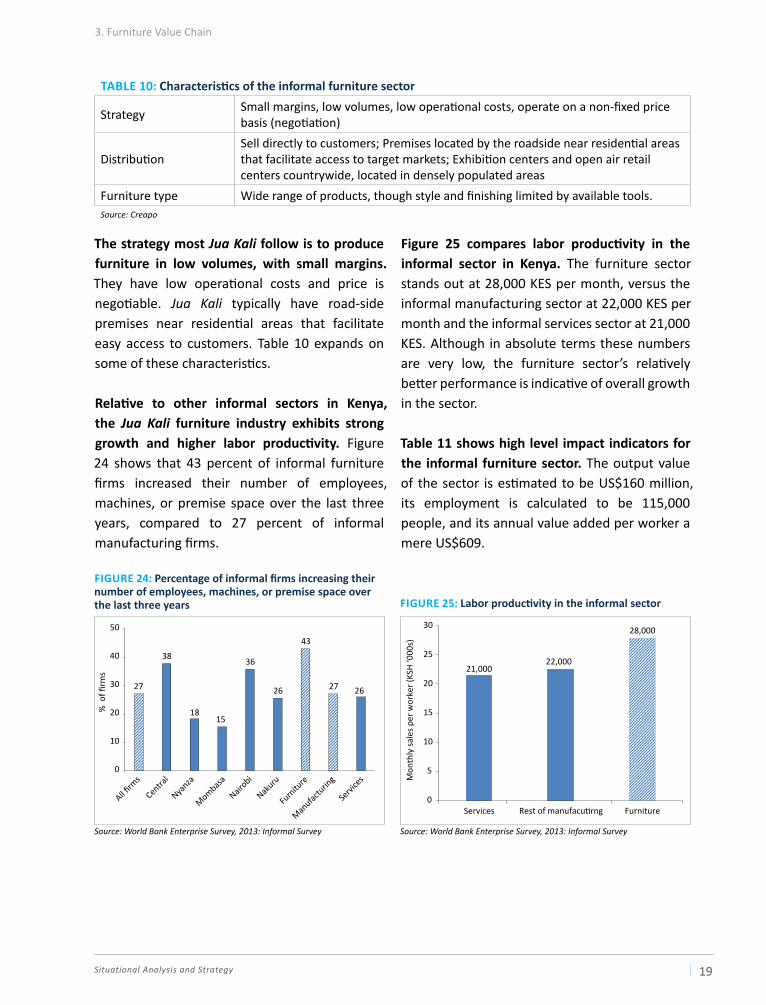
The formal furniture sector consists of about 190 small, medium, and large firms. Most are clustered in urban regional hubs, with the majority of the large and medium firms located in Nairobi, the Coast, and Eastern regions, as illustrated in Figure 23.
Most firms source inputs on a cost and quality criteria, on a 50:50 basis of imports versus domestically produced materials. Although wood-based panels are subject to a 25 percent import duty, domestically sourced ones are often inferior in quality and more expensive due to limited supply.
FiGure 21: Evolution of Top 10 Kenyan furniture exports by product from Kenya (2009-2013)
Source: KRA Customs Department and Creapo
0
5
10
15
20
25
2009 2010 2011 2012 2013
USD
mill
ion
Export of furniture & furnishing from Kenya
Other seatsSwivel and specialseatsParts of seats andfurnitureVehicle seatsBedding productsPlastic furnitureMetal furnitureBamboo, rattan, cane furnitureWood furniture
FiGure 22: Kenya’s top furniture export markets (2013)
Source: KRA Customs Department and Creapo
Rest of Africa,US$5.7m
South Sudan, US$5.4m
Somalia,US$3.5m
Tanzania,US$3.2m
Uganda,US$1.9m
Rwanda,US$1.8m
Ethiopia,US$0.7m
The total value of furniture exports was
FiGure 23: Distribution of formal furniture firms by region and size
Source: KNBS and Creapo
0 10 20 30 40 50 60
Nairobi
Coast
Central
Nyanza
Rift Valley
Eastern
North Eastern
Western
Number of firmsSmall Medium Large
3. Furniture Value Chain
FiGure 20: Evolution of volume of Kenyan furniture production
Source: KNBS and Creapo
0
20
40
60
80
100
120
140
160
1976
1978
1980
1982
1984
1986
1988
1990
1992
1994
1996
1998
2000
2002
2004
2006
2008
2010
2012
Volu
me
inde
x, 2
009=
100
20 KRA Customs Department and Creapo.
FURNITURE INDUSTRy IN KENyA 18
uncertainty with regards to input supply, coupled with historically limited local demand, has meant that firms have not invested in upgrading technology, expanding manufacturing facilities, or keeping the skills of employees up to date. Despite encouraging market growth, firms have not invested in serial production facilities, nor developed the necessary connections with other parts of the supply-chain to enable them to produce on mass. Most formal firms produce furniture on a piece-by-piece basis, without state-of-the-art equipment or training systems. This is not for lack of funds. Indeed, field survey data indicates that the profit margin in the formal furniture sector is robust, at 25 percent.
The strategy most firms follow is to produce furniture in low volumes, with high margins. They have high operational costs and operate on a fixed price basis. Few firms specialize, and instead they produce many types of furniture, with a large range of price, quality, and style. Firms typically sell their products through exhibition centers, supermarkets, and dedicated furniture stores in malls and popular retail areas. Table 8 summarizes some of these characteristics.
Table 9 shows high level impact indicators for the formal furniture sector. The output value of the industry is estimated to be US$292 million, its employment is calculated to be 9,000 – 10,000
people, and its annual value added per worker approximately US$2,300.
3.5.2 Informal (Jua Kali) Furniture Manufacturers
the Jua Kali sector employs approximately 115,000 people, a third of whom work part-time.21 Jua Kali manufacturers source low cost inputs from local timber merchants (and often from illegal markets), and sell directly to a wide spectrum of customers according to their budgets. Around 40 percent of Jua Kali furniture produced is custom designed by the customer, while the remainder is either designed by the craftsman or copied from a catalogue. Jua Kali enterprises have their competitiveness undermined by the rising costs of raw materials, which can make their hand crafted furniture an expensive alternative for customers.
the Jua Kali sector is highly fragmented: entities operate individually and compete against each other, resulting in less than optimal productivity and value-added. The Jua Kali are also characterized by the predominant use of manual tools and equipment. These limited levels of automation, coupled with poor access to electricity, affects both the production capacity of Jua Kali, as well as the quality, range and competitiveness of their products. Few Jua Kali have been formally trained, and most learn under informal apprenticeships and on an ad-hoc basis.
3. Furniture Value Chain
TABLE 8: Characteristics of the formal furniture sector
Strategy High margin, low volume, high operational costs, operate on fixed price basis
Distribution
Exhibition centers, supermarkets, dedicated furniture stores in malls and popular retail areas, online stores
Furniture type All kinds of furniture, depending on range of price, quality and style
Source: Creapo
TABLE 9: High level impact indicators for the formal furniture sectorEstimated turnover of sector (annually) US$292 million
LocationLarge urban centers, including Nairobi, Mombasa, Rift Valley
No. of people employed 9,000-10,000Value added per worker (annually) US$2,300
Source: Creapo
21 Creapo.
Situational Analysis and Strategy 19
the strategy most Jua Kali follow is to produce furniture in low volumes, with small margins. They have low operational costs and price is negotiable. Jua Kali typically have road-side premises near residential areas that facilitate easy access to customers. Table 10 expands on some of these characteristics.
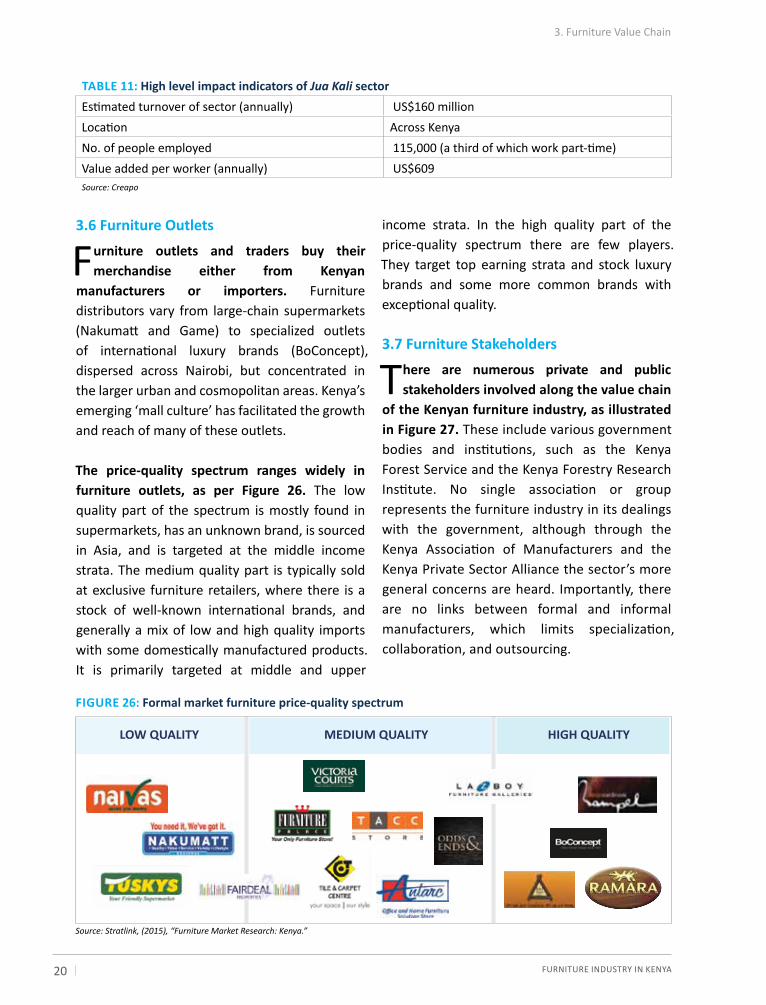
Relative to other informal sectors in Kenya, the Jua Kali furniture industry exhibits strong growth and higher labor productivity. Figure 24 shows that 43 percent of informal furniture firms increased their number of employees, machines, or premise space over the last three years, compared to 27 percent of informal manufacturing firms.
Figure 25 compares labor productivity in the informal sector in Kenya. The furniture sector stands out at 28,000 KES per month, versus the informal manufacturing sector at 22,000 KES per month and the informal services sector at 21,000 KES. Although in absolute terms these numbers are very low, the furniture sector’s relatively better performance is indicative of overall growth in the sector.
Table 11 shows high level impact indicators for the informal furniture sector. The output value of the sector is estimated to be US$160 million, its employment is calculated to be 115,000 people, and its annual value added per worker a mere US$609.
TABLE 10: Characteristics of the informal furniture sector
Strategy Small margins, low volumes, low operational costs, operate on a non-fixed price basis (negotiation)
Distribution Sell directly to customers; Premises located by the roadside near residential areas that facilitate access to target markets; Exhibition centers and open air retail centers countrywide, located in densely populated areas
Furniture type Wide range of products, though style and finishing limited by available tools.Source: Creapo
FiGure 24: Percentage of informal firms increasing their number of employees, machines, or premise space over the last three years
Source: World Bank Enterprise Survey, 2013: Informal Survey
27
38
1815
36
26
43
27 26
0
10
All firm
s
Central
Nyanza
Mombasa
Nairobi
Nakuru
Furnitu
re
Servi
ces
Manufac
turing
20
30
40
50
% o
f firm
s
FiGure 25: Labor productivity in the informal sector
Source: World Bank Enterprise Survey, 2013: Informal Survey
21,00022,000
28,000
0
5
10
15
20
25
30
Services Rest of manufacutirng Furniture
Mon
thly
sale
s per
wor
ker (
KSH
‘000
s)
3. Furniture Value Chain
FURNITURE INDUSTRy IN KENyA 20
3. Furniture Value Chain
3.6 Furniture Outlets
Furniture outlets and traders buy their merchandise either from Kenyan
manufacturers or importers. Furniture distributors vary from large-chain supermarkets (Nakumatt and Game) to specialized outlets of international luxury brands (BoConcept), dispersed across Nairobi, but concentrated in the larger urban and cosmopolitan areas. Kenya’s emerging ‘mall culture’ has facilitated the growth and reach of many of these outlets.
The price-quality spectrum ranges widely in furniture outlets, as per Figure 26. The low quality part of the spectrum is mostly found in supermarkets, has an unknown brand, is sourced in Asia, and is targeted at the middle income strata. The medium quality part is typically sold at exclusive furniture retailers, where there is a stock of well-known international brands, and generally a mix of low and high quality imports with some domestically manufactured products. It is primarily targeted at middle and upper
income strata. In the high quality part of the price-quality spectrum there are few players. They target top earning strata and stock luxury brands and some more common brands with exceptional quality.
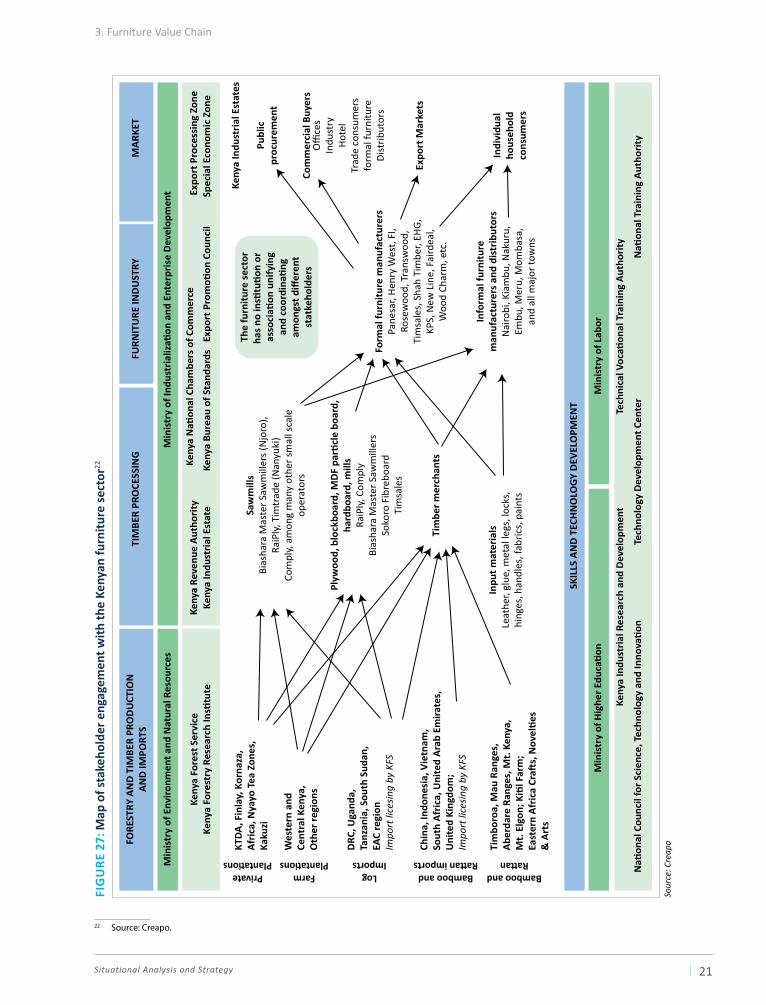
3.7 Furniture Stakeholders
There are numerous private and public stakeholders involved along the value chain
of the Kenyan furniture industry, as illustrated in Figure 27. These include various government bodies and institutions, such as the Kenya Forest Service and the Kenya Forestry Research Institute. No single association or group represents the furniture industry in its dealings with the government, although through the Kenya Association of Manufacturers and the Kenya Private Sector Alliance the sector’s more general concerns are heard. Importantly, there are no links between formal and informal manufacturers, which limits specialization, collaboration, and outsourcing.
FiGure 26: Formal market furniture price-quality spectrum
Source: Stratlink, (2015), “Furniture Market Research: Kenya.”
LOW QUALITY MEDIUM QUALITY HIGH QUALITY
taBLe 11: High level impact indicators of Jua Kali sectorEstimated turnover of sector (annually) US$160 millionLocation Across KenyaNo. of people employed 115,000 (a third of which work part-time) Value added per worker (annually) US$609Source: Creapo
Situational Analysis and Strategy 21
FiG
ure
27:
Map
of s
take
hold
er e
ngag
emen
t with
the
Keny
an fu
rnitu
re se
ctor
22
Sour
ce: C
reap
oFORE
STRY
AN
D T
IMBE
R PR
OD
UCT
ION
AND
IMPO
RTS
PrivatePlantations
FarmPlantations
LogImports
Bamboo andRattan imports
Bamboo andRattan
Min
istr
y of
Hig
her E
duca
tion
SKIL
LS A
ND
TEC
HN
OLO
GY
DEV
ELO
PMEN
T
Min
istr
y of
Lab
or
Keny
a In
dust
rial R
esea
rch
and
Dev
elop
men
t
Nati
onal
Cou
ncil
for S
cien
ce, T
echn
olog
y an
d In
nova
tion
Min
istr
y of
Env
ironm
ent a
nd N
atur
al R
esou
rces
Keny
a Fo
rest
Ser
vice
Keny
a Fo
rest
ry R
esea
rch
Insti
tute
Min
istr
y of
Indu
stria
lizati
on a
nd E
nter
pris
e D
evel
opm
ent
Keny
a Re
venu
e Au
thor
ityKe
nya
Indu
stria
l Est
ate
Keny
a Bu
reau
of S
tand
ards
Expo
rt P
rom
otion
Cou
ncil
Spec
ial E
cono
mic
Zon
eEx
port
Pro
cess
ing
Zone
Keny
a N
ation
al C
ham
bers
of C
omm
erce
Tech
nolo
gy D
evel
opm
ent C
ente
r
Tech
nica
l Voc
ation
al T
rain
ing
Auth
ority
Nati
onal
Tra
inin
g Au
thor
ity
KTDA
, Fin
lay,
Kor
naza
,Af
rica,
Nya
yo T
ea Z
ones
,Ka
kuzi
Wes
tern
and
Cent
ral K
enya
,O
ther
regi
ons
Keny
a In
dust
rial E
stat
es
Publ
icpr
ocur
emen
t
Com
mer
cial
Buy
ers
Expo
rt M
arke
ts
Inpu
t mat
eria
lsLe
athe
r, gl
ue, m
etal
legs
, loc
ks,
hing
es, h
andl
es, f
abric
s, p
aint
s
Tim
ber m
erch
ants
Form
al fu
rnitu
re m
anuf
actu
rers
Pane
sar,
Hen
ry W
est,
FI,
Rose
woo
d, T
rans
woo
d,Ti
msa
les,
Sha
h Ti
mbe
r, EH
G,
KPS,
New
Lin
e, F
aird
eal,
Woo
d Ch
arm
, etc
.
Info
rmal
furn
iture
man
ufac
ture
rs a
nd d
istr
ibut
ors
Nai
robi
, Kia
mbu
, Nak
uru,
Embu
, Mer
u, M
omba
sa,
and
all m
ajor
tow
ns
Plyw
ood,
blo
ckbo
ard,
MD
F pa
rticl
e bo
ard,
hard
boar
d, m
ills
RaiP
ly, C
ompl
yBi
asha
ra M
aste
r Saw
mill
ers
Soko
ro F
ibre
boar
dTi
msa
les
Saw
mill
sBi
asha
ra M
aste
r Saw
mill
ers (
Njo
ro),
RaiP
ly, T
imtr
ade
(Nan
yuki
)Co
mpl
y, a
mon
g m
any
othe
r sm
all s
cale
oper
ator
s
The
furn
iture
sec
tor
has
no in
stitu
tion
or
asso
ciati
on u
nify
ing
and
coor
dina
ting
amon
gst d
iffer
ent
stat
keho
lder
s
Indi
vidu
alho
useh
old
cons
umer
s
Offices
Indu
stry
Hot
elTr
ade
cons
umer
sfo
rmal
furn
iture
Dist
ribut
ors
Tim
boro
a, M
au R
ange
s,Ab
erda
re R
ange
s, M
t. Ke
nya,
Mt.
Elgo
n; K
itil F
arm
; Ea
ster
n Af
rica
Craft
s, N
ovel
ties
& A
rts
Chin
a, In
done
sia,
Vie
tnam
,So
uth
Afric
a, U
nite
d Ar
ab E
mira
tes,
Uni
ted
King
dom
;Im
port
lice
sing
by K
FS
DRC
, Uga
nda,
Tanz
ania
, Sou
th S
udan
,EA
C re
gion
Impo
rt li
cesin
g by
KFS
TIM
BER
PRO
CESS
ING
FURN
ITU
RE IN
DU
STRY
MAR
KET
3. Furniture Value Chain
22 Source: Creapo.

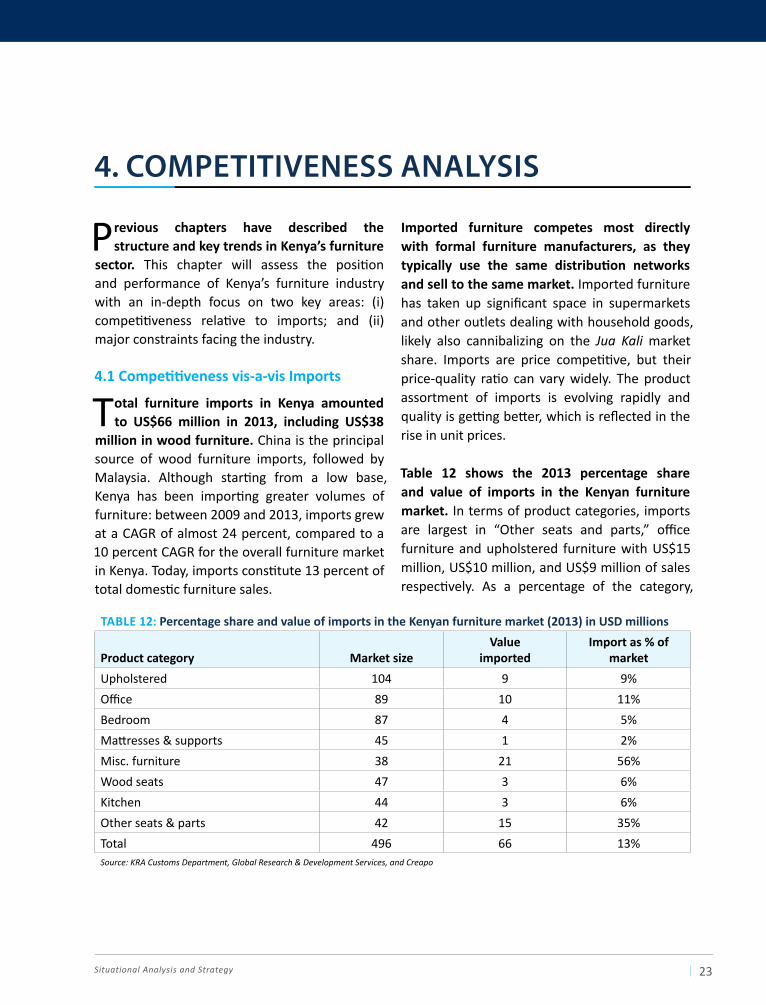
Situational Analysis and Strategy 23
Previous chapters have described the structure and key trends in Kenya’s furniture
sector. This chapter will assess the position and performance of Kenya’s furniture industry with an in-depth focus on two key areas: (i) competitiveness relative to imports; and (ii) major constraints facing the industry.
4.1 Competitiveness vis-a-vis Imports
Total furniture imports in Kenya amounted to US$66 million in 2013, including US$38
million in wood furniture. China is the principal source of wood furniture imports, followed by Malaysia. Although starting from a low base, Kenya has been importing greater volumes of furniture: between 2009 and 2013, imports grew at a CAGR of almost 24 percent, compared to a 10 percent CAGR for the overall furniture market in Kenya. Today, imports constitute 13 percent of total domestic furniture sales.
Imported furniture competes most directly with formal furniture manufacturers, as they typically use the same distribution networks and sell to the same market. Imported furniture has taken up significant space in supermarkets and other outlets dealing with household goods, likely also cannibalizing on the Jua Kali market share. Imports are price competitive, but their price-quality ratio can vary widely. The product assortment of imports is evolving rapidly and quality is getting better, which is reflected in the rise in unit prices.
Table 12 shows the 2013 percentage share and value of imports in the Kenyan furniture market. In terms of product categories, imports are largest in “Other seats and parts,” office furniture and upholstered furniture with US$15 million, US$10 million, and US$9 million of sales respectively. As a percentage of the category,
taBLe 12: Percentage share and value of imports in the Kenyan furniture market (2013) in USD millions
Product category Market sizevalue
importedImport as % of
marketUpholstered 104 9 9%Office 89 10 11%Bedroom 87 4 5%Mattresses & supports 45 1 2%Misc. furniture 38 21 56%Wood seats 47 3 6%Kitchen 44 3 6%Other seats & parts 42 15 35%Total 496 66 13%Source: KRA Customs Department, Global Research & Development Services, and Creapo
4. competItIVeness AnAlYsIs
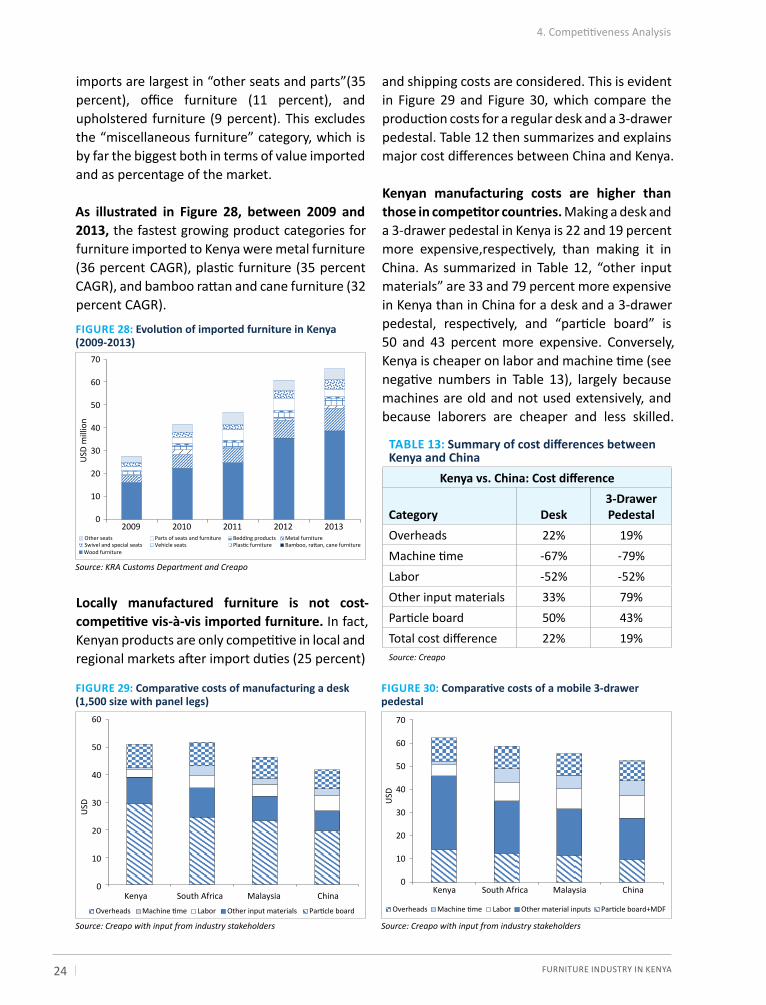
FURNITURE INDUSTRy IN KENyA 24
imports are largest in “other seats and parts”(35 percent), office furniture (11 percent), and upholstered furniture (9 percent). This excludes the “miscellaneous furniture” category, which is by far the biggest both in terms of value imported and as percentage of the market.
As illustrated in Figure 28, between 2009 and 2013, the fastest growing product categories for furniture imported to Kenya were metal furniture (36 percent CAGR), plastic furniture (35 percent CAGR), and bamboo rattan and cane furniture (32 percent CAGR).
Locally manufactured furniture is not cost-competitive vis-à-vis imported furniture. In fact, Kenyan products are only competitive in local and regional markets after import duties (25 percent)
and shipping costs are considered. This is evident in Figure 29 and Figure 30, which compare the production costs for a regular desk and a 3-drawer pedestal. Table 12 then summarizes and explains major cost differences between China and Kenya.
Kenyan manufacturing costs are higher than those in competitor countries. Making a desk and a 3-drawer pedestal in Kenya is 22 and 19 percent more expensive,respectively, than making it in China. As summarized in Table 12, “other input materials” are 33 and 79 percent more expensive in Kenya than in China for a desk and a 3-drawer pedestal, respectively, and “particle board” is 50 and 43 percent more expensive. Conversely, Kenya is cheaper on labor and machine time (see negative numbers in Table 13), largely because machines are old and not used extensively, and because laborers are cheaper and less skilled.
FiGure 29: Comparative costs of manufacturing a desk (1,500 size with panel legs)
Source: Creapo with input from industry stakeholders
0
10
20
30
40
50
60
Kenya South Africa Malaysia China
USD
Overheads Machine time Labor Other input materials Particle board
FiGure 30: Comparative costs of a mobile 3-drawer pedestal
Source: Creapo with input from industry stakeholders
6.3
8.8
0
10
20
30
40
50
60
70
Kenya South Africa Malaysia China
USD
Overheads Machine time Labor Other material inputs Particle board+MDF
taBLe 13: Summary of cost differences between Kenya and China
Kenya vs. China: Cost difference
Category Desk3-drawer Pedestal
Overheads 22% 19%Machine time -67% -79%Labor -52% -52%Other input materials 33% 79%Particle board 50% 43%Total cost difference 22% 19%Source: Creapo
4. Competitiveness Analysis
FiGure 28: Evolution of imported furniture in Kenya (2009-2013)
Source: KRA Customs Department and Creapo
0
10
20
30
40
50
60
70
2009 2010 2011 2012 2013
USD
mill
ion
Other seatsSwivel and special seats
Parts of seats and furnitureVehicle seats
Bedding productsPlastic furniture
Metal furnitureBamboo, rattan, cane furniture
Wood furniture
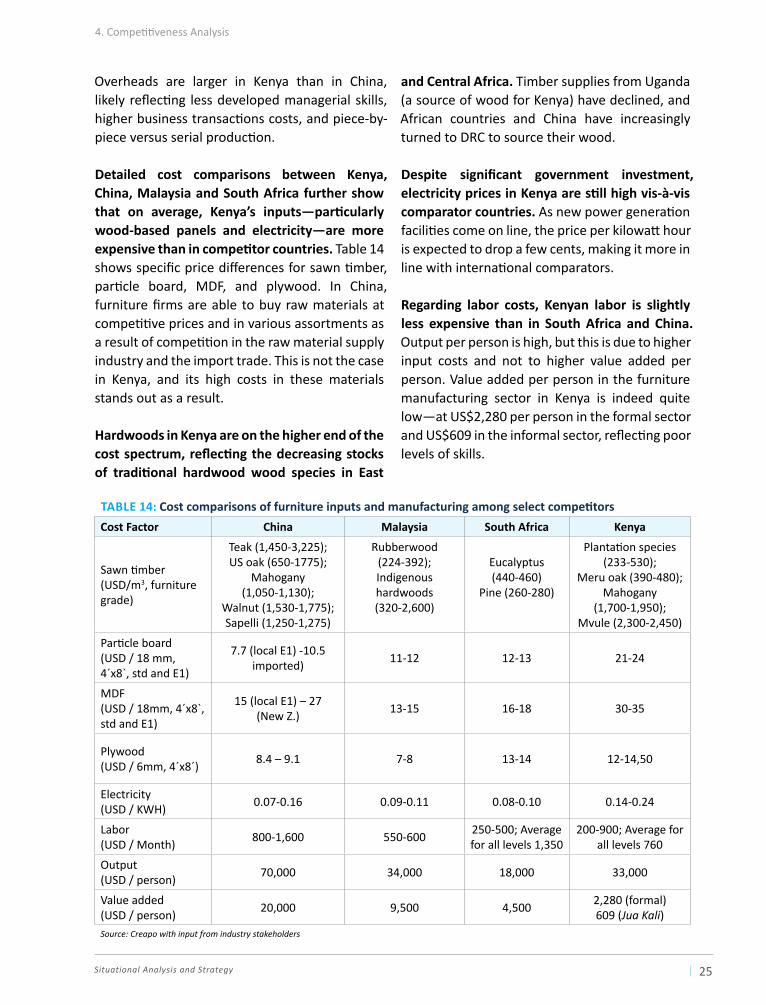
Situational Analysis and Strategy 25
Overheads are larger in Kenya than in China, likely reflecting less developed managerial skills, higher business transactions costs, and piece-by-piece versus serial production.
detailed cost comparisons between Kenya, China, Malaysia and South Africa further show that on average, Kenya’s inputs—particularly wood-based panels and electricity—are more expensive than in competitor countries. Table 14 shows specific price differences for sawn timber, particle board, MDF, and plywood. In China, furniture firms are able to buy raw materials at competitive prices and in various assortments as a result of competition in the raw material supply industry and the import trade. This is not the case in Kenya, and its high costs in these materials stands out as a result.
Hardwoods in Kenya are on the higher end of the cost spectrum, reflecting the decreasing stocks of traditional hardwood wood species in East
and Central Africa. Timber supplies from Uganda (a source of wood for Kenya) have declined, and African countries and China have increasingly turned to DRC to source their wood.
Despite significant government investment, electricity prices in Kenya are still high vis-à-vis comparator countries. As new power generation facilities come on line, the price per kilowatt hour is expected to drop a few cents, making it more in line with international comparators.
regarding labor costs, Kenyan labor is slightly less expensive than in South Africa and China. Output per person is high, but this is due to higher input costs and not to higher value added per person. Value added per person in the furniture manufacturing sector in Kenya is indeed quite low—at US$2,280 per person in the formal sector and US$609 in the informal sector, reflecting poor levels of skills.
taBLe 14: Cost comparisons of furniture inputs and manufacturing among select competitorsCost Factor China malaysia South Africa Kenya
Sawn timber (USD/m3, furniture grade)
Teak (1,450-3,225);US oak (650-1775);
Mahogany (1,050-1,130);
Walnut (1,530-1,775); Sapelli (1,250-1,275)
Rubberwood (224-392); Indigenous hardwoods (320-2,600)
Eucalyptus (440-460)
Pine (260-280)
Plantation species (233-530);
Meru oak (390-480);Mahogany
(1,700-1,950);Mvule (2,300-2,450)
Particle board (USD / 18 mm, 4´x8`, std and E1)
7.7 (local E1) -10.5 imported) 11-12 12-13 21-24
MDF (USD / 18mm, 4´x8`, std and E1)
15 (local E1) – 27 (New Z.) 13-15 16-18 30-35
Plywood (USD / 6mm, 4´x8´) 8.4 – 9.1 7-8 13-14 12-14,50
Electricity (USD / KWH) 0.07-0.16 0.09-0.11 0.08-0.10 0.14-0.24
Labor (USD / Month) 800-1,600 550-600 250-500; Average
for all levels 1,350200-900; Average for
all levels 760
Output (USD / person) 70,000 34,000 18,000 33,000
Value added (USD / person) 20,000 9,500 4,500 2,280 (formal)
609 (Jua Kali)Source: Creapo with input from industry stakeholders
4. Competitiveness Analysis

FURNITURE INDUSTRy IN KENyA 26
Competition in the Kenyan furniture market is primarily based on price, with design and quality playing a secondary role. In this regard, the quality, design, and prices of import furniture have been moving upwards in recent years, requiring the Kenyan industry to improve its productivity and product assortment to compete.
Figure 31, Figure 32, and Figure 33 show the unit values of trade in upholstered chairs, wood office furniture, and wood bedroom furniture, respectively. The figures compare the unit price of imports from China and Malaysia in these categories, against the unit price of Kenyan exports in these categories, using the latter as a proxy for the local price. The figures show that Chinese and Malaysian imports are moving upmarket in terms of price, particularly in upholstered chairs and wood office furniture.
4.2 Key Constraints Facing the industry
A Strengths, Weaknesses, Opportunities, and threats (sWOt) approach was used
to analyze the competitiveness of the Kenyan furniture industry and put forward recommendations for its development (the full SWOT diagram is contained in the annex 2). We have used this analysis to identify significant structural challenges hindering the competitiveness of the Kenyan furniture industry, which are listed below and each explained in turn. 1. Constrained input supply raises the cost and
lowers the quality of furniture manufacturing. 2. Limited skills and poor production facilities
results in suboptimal productivity and lower quality products.
3. Decreasing access to markets means difficult to defend market share vis-à-vis imports.
4. Limited industry communication, coordination and collaboration undermines the potential of the furniture sector.
4.2.1 Constrained Input Supply
a constrained input supply raises the cost and lowers the quality of furniture manufacturing.
Supplies of domestic timber are insufficient, and lack of information on local timber supply and demand helps undermine the long-term sustainability of the wooden furniture industry.
FiGure 33: Unit values of trade in wooden bedroom furniture
Source: KRA Customs Department and Creapo
0
2,000
4,000
6,000
8,000
10,000
12,000
2008 2009 2010 2011 2012 2013
KSH/
Uni
t
China to Kenya Malaysia to Kenya Kenyan export
4. Competitiveness Analysis
FiGure 31: Unit values of trade in upholstered chairs
Source: KRA Customs Department and Creapo
0
4,000
8,000
12,000
16,000
2008 2009 2010 2011 2012 2013
KSH/
Uni
t
China to Kenya Malaysia to Kenya Kenyan export
FiGure 32: Unit values of trade in wood office furniture
Source: KRA Customs Department and Creapo
0
2,000
4,000
6,000
2008 2009 2010 2011 2012 2013
KSH/
Uni
t
China to Kenya Malaysia to Kenya Kenyan export
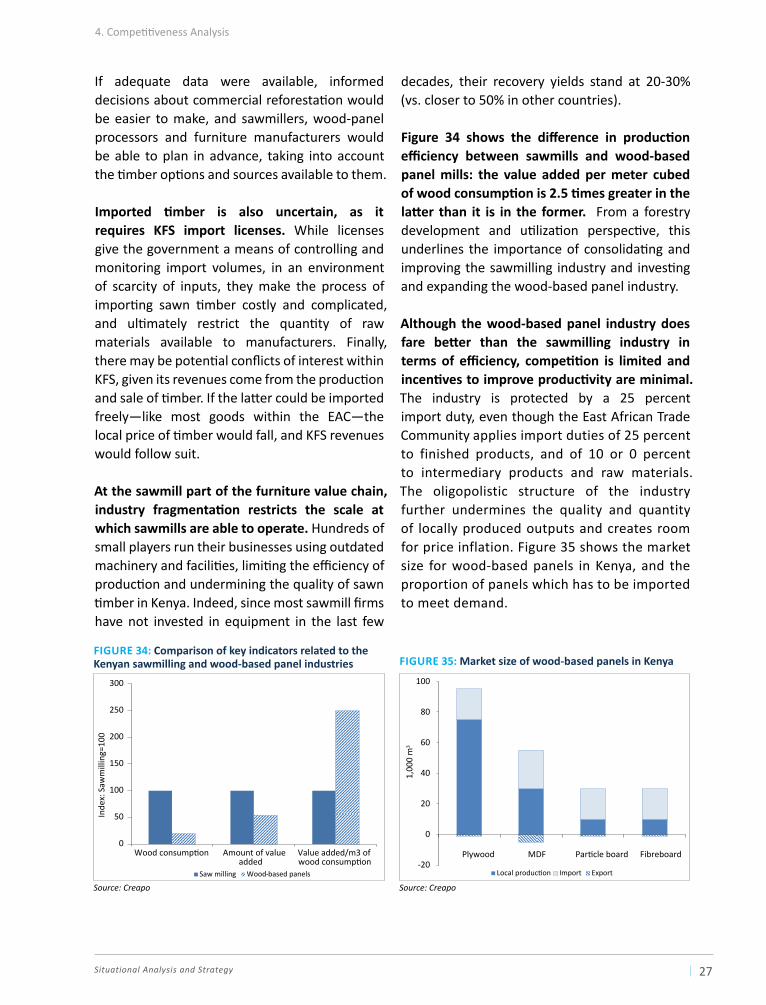
Situational Analysis and Strategy 27
If adequate data were available, informed decisions about commercial reforestation would be easier to make, and sawmillers, wood-panel processors and furniture manufacturers would be able to plan in advance, taking into account the timber options and sources available to them.
Imported timber is also uncertain, as it requires KFS import licenses. While licenses give the government a means of controlling and monitoring import volumes, in an environment of scarcity of inputs, they make the process of importing sawn timber costly and complicated, and ultimately restrict the quantity of raw materials available to manufacturers. Finally, there may be potential conflicts of interest within KFS, given its revenues come from the production and sale of timber. If the latter could be imported freely—like most goods within the EAC—the local price of timber would fall, and KFS revenues would follow suit.
At the sawmill part of the furniture value chain, industry fragmentation restricts the scale at which sawmills are able to operate. Hundreds of small players run their businesses using outdated machinery and facilities, limiting the efficiency of production and undermining the quality of sawn timber in Kenya. Indeed, since most sawmill firms have not invested in equipment in the last few
decades, their recovery yields stand at 20-30% (vs. closer to 50% in other countries).
Figure 34 shows the difference in production efficiency between sawmills and wood-based panel mills: the value added per meter cubed of wood consumption is 2.5 times greater in the latter than it is in the former. From a forestry development and utilization perspective, this underlines the importance of consolidating and improving the sawmilling industry and investing and expanding the wood-based panel industry.
although the wood-based panel industry does fare better than the sawmilling industry in terms of efficiency, competition is limited and incentives to improve productivity are minimal. The industry is protected by a 25 percent import duty, even though the East African Trade Community applies import duties of 25 percent to finished products, and of 10 or 0 percent to intermediary products and raw materials. The oligopolistic structure of the industry further undermines the quality and quantity of locally produced outputs and creates room for price inflation. Figure 35 shows the market size for wood-based panels in Kenya, and the proportion of panels which has to be imported to meet demand.
FiGure 34: Comparison of key indicators related to the Kenyan sawmilling and wood-based panel industries
Source: Creapo
0
50
100
150
200
250
300
Wood consumption Amount of value added
Value added/m3 of wood consumption
Inde
x: S
awm
illin
g=10
0
Saw milling Wood-based panels
FiGure 35: Market size of wood-based panels in Kenya
Source: Creapo
75
3010 10
20
25
20 20
-20
0
20
40
60
80
100
Plywood MDF Particle board Fibreboard
1,00
0 m
3
Local production Import Export
4. Competitiveness Analysis
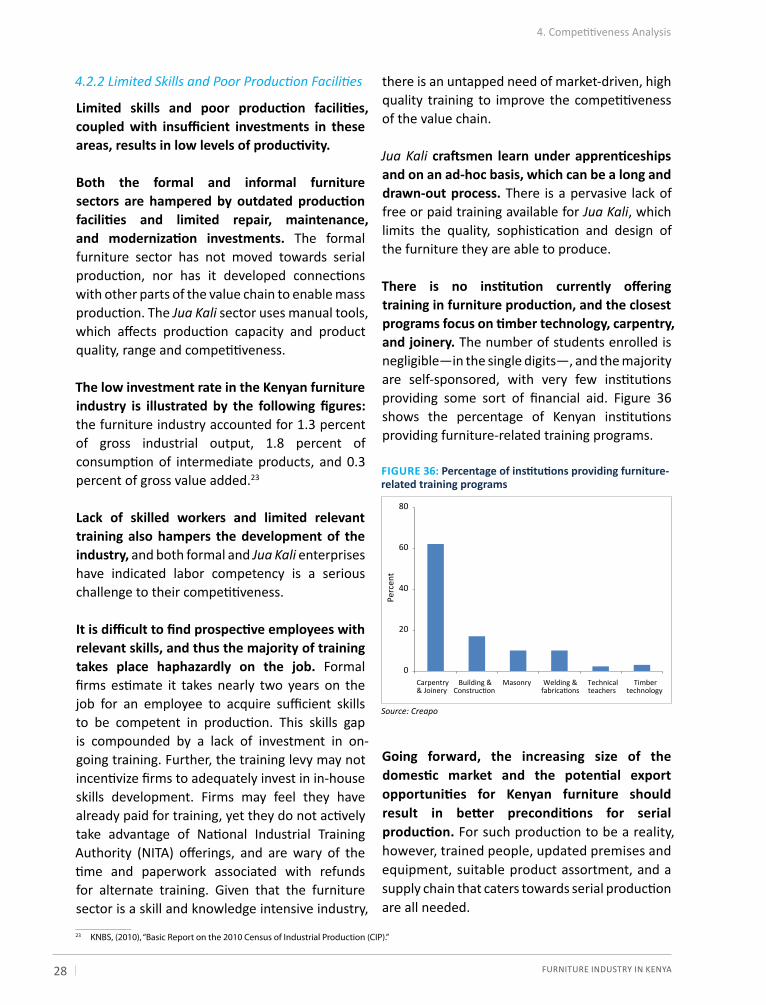
FURNITURE INDUSTRy IN KENyA 28
4.2.2 Limited Skills and Poor Production Facilities
Limited skills and poor production facilities, coupled with insufficient investments in these areas, results in low levels of productivity.
Both the formal and informal furniture sectors are hampered by outdated production facilities and limited repair, maintenance, and modernization investments. The formal furniture sector has not moved towards serial production, nor has it developed connections with other parts of the value chain to enable mass production. The Jua Kali sector uses manual tools, which affects production capacity and product quality, range and competitiveness.
The low investment rate in the Kenyan furniture industry is illustrated by the following figures: the furniture industry accounted for 1.3 percent of gross industrial output, 1.8 percent of consumption of intermediate products, and 0.3 percent of gross value added.23
Lack of skilled workers and limited relevant training also hampers the development of the industry, and both formal and Jua Kali enterprises have indicated labor competency is a serious challenge to their competitiveness.
It is difficult to find prospective employees with relevant skills, and thus the majority of training takes place haphazardly on the job. Formal firms estimate it takes nearly two years on the job for an employee to acquire sufficient skills to be competent in production. This skills gap is compounded by a lack of investment in on-going training. Further, the training levy may not incentivize firms to adequately invest in in-house skills development. Firms may feel they have already paid for training, yet they do not actively take advantage of National Industrial Training Authority (NITA) offerings, and are wary of the time and paperwork associated with refunds for alternate training. Given that the furniture sector is a skill and knowledge intensive industry,
there is an untapped need of market-driven, high quality training to improve the competitiveness of the value chain.
Jua Kali craftsmen learn under apprenticeships and on an ad-hoc basis, which can be a long and drawn-out process. There is a pervasive lack of free or paid training available for Jua Kali, which limits the quality, sophistication and design of the furniture they are able to produce.
There is no institution currently offering training in furniture production, and the closest programs focus on timber technology, carpentry, and joinery. The number of students enrolled is negligible—in the single digits—, and the majority are self-sponsored, with very few institutions providing some sort of financial aid. Figure 36 shows the percentage of Kenyan institutions providing furniture-related training programs.
Going forward, the increasing size of the domestic market and the potential export opportunities for Kenyan furniture should result in better preconditions for serial production. For such production to be a reality, however, trained people, updated premises and equipment, suitable product assortment, and a supply chain that caters towards serial production are all needed.
4. Competitiveness Analysis
FiGure 36: Percentage of institutions providing furniture-related training programs
Source: Creapo
0
20
40
60
Perc
ent
80
Carpentry& Joinery
Building &Construction
Masonry Welding &fabrications
Technicalteachers
Timbertechnology
23 KNBS, (2010), “Basic Report on the 2010 Census of Industrial Production (CIP).”
Situational Analysis and Strategy 29
4.2.3 Access to Markets
Access to markets is challenging both domestically and internationally.
Domestically, Kenyans are increasingly shopping in malls and supermarket chains, where imported furniture is stocked and sold. Mall retailers source large volumes of standardized pieces, contrary to the piece-by-piece production that local manufacturers typically focus on. Jua Kali enterprises have limited access to formal retail because their products lack quality assurance,standardization, and volume. This means growing consumer demand is increasingly met by imports in the first place, and formal manufacturers in the second place.
Government initiatives such as the Buy Kenya, Build Kenya public procurement program have the potential to provide significant local demand for Kenyan manufacturers. Although supportive regulation exists, generalities and loopholes in the policy definition, as well as weak implementation, has so far undermined the program’s impact on local firms.
Internationally, companies looking to export furniture are discouraged by cumbersome border procedures, where transport permits, corruption, security and complicated rules make concluding export deals challenging. In addition, lack of market knowledge and limited contact with potential buyers further complicate access to international markets. To export beyond the region, buyers are increasingly demanding the origin of wood be certified, to ensure protected forests are not depleted. For local manufactures, the latter is difficult given the amount of wood currently imported, the lack of clarity regarding its origin, and its limited traceability.
4.2.4 Limited Communication, Coordination and Collaboration
There is no official industry association to represent sector interests, collect relevant data, organize demand and supply for specialized training, promote Public Private Partnerships (PPPs), and share best practices. This limits the capacity of the industry to invest in necessary resources and respond to changes in the market.
The different parts of the furniture value chain operate in silos, with minimal communication, engagement and linkages amongst them. The latter results in limited collaboration within and between formal and informal players, and restricted scope for outsourcing, specialization, and serial production.
4.3 Chapter summary
This chapter considered Kenya’s competitive positioning relative to imports and explored
the key constraints facing the sector.
Imports currently constitute 13 percent of the total furniture market, and have grown at a CAGR of 24 percent between 2009-2013. These products compete most directly with the formal sector because they use the same retail channels. Kenyan manufacturing costs are higher than those in competitor countries on all dimensions other than machine time and labor.
The performance of the furniture industry is currently undermined by four key constraints: (1) constrained input supply, which raises the cost and lowers the quality of furniture manufacturing; (2) limited skills and poor production facilities that result in suboptimal productivity and lower quality products; (3) decreased access to markets, which makes it difficult to defend market share vis-à-vis imports; and (4) limited industry communication, coordination and collaboration, which undermines the potential of the furniture sector.
4. Competitiveness Analysis


Situational Analysis and Strategy 31
The furniture industry in Kenya could potentially grow and expand its domestic,
regional and global market share. Five important strengths underpin this:
• Potential for economies of scale in the industry. Kenya is the largest producer of furniture in East Africa and has a long tradition of furniture making. Firms in the furniture industry thrive with economies of scale, and formal and informal firms in Kenya are already geographically clustered. Significant industry expertise, a large workforce, and some firms with updated equipment can be leveraged for further growth and development.
• Logistical advantage in serving local and regional markets, particularly relative to neighboring countries and Asian competitors.
• Strong growth in the formal and informal manufacturing sectors (8 and 10 percent CAGRs, respectively, between 2009 and 2013).
• Attractive profit margins for existing formal manufacturers (25 percent after tax in survey sample).
• Strong political will to support industry development.
Given the expected growth in demand for furniture in Africa, Kenya, and the East African Community, and the forthcoming EAC, SADC, and COMESA Free Trade Agreements, three target strategies for the furniture sector seem appropriate, as illustrated in Table 15.
No strategy comes without risks, and this is no exception. The risk for the formal sector is that firms might be unable to position themselves in the medium to high-end part of the market. They may also no longer be able to maintain their current market positions in the local market because of imports and the consolidation of outlet chains.
For the informal sector, the risk is that if their costs increase without a commensurate improvement in quality and design, entities may no longer be competitive. Also, increased efficiency may come at the cost of jobs. Finally, difficulties may be encountered when adapting new furniture styles and when marketing to Kenyan furniture preferences.
taBLe 15: Proposed strategy targeting Kenyan furniture manufacturing and exportsMarket segment Strategy / Opportunity in Next 10 Years
Market niche business Increase production and exports of differentiated “ethnic - rustic” / Swahili Coast furniture to regional and developed markets.
Formal sector Move towards serial production, and develop and produce higher value-added furniture pieces to meet increasing demand in local and regional markets.
Jua Kali sectorImprove productivity and value addition, refine quality and design, develop clustering and specialization, and enter into the local furniture trade to maintain market share.
5. stRengths And oppoRtUnItIes FoR deVelopment

FURNITURE INDUSTRy IN KENyA 32
For the ethnic-rustic niche furniture, the risk is that Swahili Coast furniture pieces might not be adequately differentiated, that Asian "ethnic-rustic" furniture may already have saturated
the existing market (thus calling for a new push to expand the market), and that from a price perspective, the Kenyan-made furniture may not be competitive.
5. Strengths and Opportunities for Development

Situational Analysis and Strategy 33
In order to develop the furniture industry in Kenya into an internationally competitive
one, concerted public-private efforts are required. Specifically, four major action initiatives are proposed, each designed to address critical binding constraints hampering the competitiveness of the furniture industry. They are:
1. Enhance institutional collaboration and support in the furniture industry to foster linkages among stakeholders;
2. Tackle supply-side constraints to enable producers to increase production and quality;
3. Improve the productivity and innovation of furniture manufacturers to enable them to upgrade their design, quality, and volume;
4. Enhance access to domestic and regional markets and induce greater demand for Kenyan furniture products.
this chapter describes each recommended initiative and sub-initiative, summarized in Table 16, and highlights both their benefits and risks.
6. RecommendAtIons
taBLe 16: Summary table of recommendationsRecommendation Specific ActionsEnhance institutional collaboration and sector support
• Improve stakeholder collaboration across the industry by establishing an Industry Association
• Develop a strategic regional framework to assist in National-County implementation
Tackle supply-side constraints to increase production and quality
• Lay the foundations for a sustainable forestry sector that is able to meet Kenya’s demand for timber
• Eliminate import licenses for timber and reduce import duties for intermediate products
• Promote regional trade agreements to facilitate and increase timber imports• Improve the efficiency and quality of inputs to the furniture sector by promoting
the development of wood-based panel production and upgrading of the sawmilling industry
• Promote input standardization (particularly in materials and design)
Improve productivity and innovation through better skills and technologies
• Establish a Kenyan Center for Excellence as a platform to provide relevant industry training and (in the longer-term), co-ordination of R&D
• Set up prototyping facilities to develop new products• Provide incentives to upgrade technology and expand manufacturing facilities to move
towards serial production• Increase access to finance• Enhance collaboration among Jua Kali entities via clustering
FURNITURE INDUSTRy IN KENyA 34
6.1 Enhance Institutional Collaboration and sector support
Enhancing institutional collaboration and fostering linkages among stakeholders in
the furniture industry is key given the highly fragmented structure of the sector, the limited linkages among stakeholders, and the lack of a coherent and shared competitiveness strategy by the private sector, government, and other institutions. Two important initiatives are proposed.
6.1.1 Improve stakeholder collaboration across the industry by establishing an Industry Association
Establishing an industry association would support the development of the entire industry value chain across Kenya and would give the furniture sector a voice vis-à-vis the government. It would have several functions:
• Fostering linkages and encouraging dialogue between stakeholders, with a view to facilitating outsourcing and contracting.
• Putting forward a unified representative voice of the industry to the government and other stakeholders.
• Collecting statistics on the furniture industry, including data on market information, cost competitiveness, and local and regional benchmarking. The association would also coordinate with KNBS and KFS regarding statistics of wood supply and demand.
• Liaising with the proposed Center of Excellence, explained further on, to increase the levels of skills across the industry.
• Developing a marketing and branding program to promote a distinguishing strategy for higher-end Kenyan furniture styles and products, to increase visibility and demand.
• Organizing study tours for firms to meet buyers and see cutting-edge technologies and designs, and up-and-coming consumer trends.
to be effective, the industry association will need buy-in from all parties, both formal through KAM and informal through the National Jua Kali Federation. It will need to represent and consolidate the interests of the entire furniture manufacturing industry and ensure they can work cooperatively together.
6.1.2 Develop a strategic regional framework to assist in National-County implementation
Although programs for the furniture sector are formulated at the national level, they require implementation at the county level. A framework involving county governments and timber stakeholders across the country in the implementation of interventions is recommended. If county governments are not consulted and included, implementation may struggle given the importance of local nuances.
6. Recommendations
Enhance access to markets and induce greater demand for products
• Promote regional trade agreements• Improve border logistics and regional transportation networks to strengthen regional
integration• Improve the implementation of the Build Kenya, Buy Kenya public procurement
initiative • Promote exports of Kenyan specialty products (i.e. “ethnic-rustic” pieces) in key
international markets• Establish Jua Kali-focused marketing entities to facilitate access to formal markets
taBLe 16: Summary table of recommendations (continued)Recommendation Specific Actions
Situational Analysis and Strategy 35
6.2 Tackle Supply-side Constraints to Increase Production and Quality
Tackling supply-side constraints is key to increasing production and quality
in the furniture industry. Five actions are recommended:
• Laying the foundations for a sustainable forestry sector that is able to meet Kenya’s demand for timber;
• Eliminating import licenses for timber and reducing import duties for intermediate products;
• Promoting regional trade agreements to facilitate and increase timber imports
• Improving the efficiency and quality of inputs to the furniture sector by promoting the development of wood-based panel production and upgrading of the sawmilling industry
• Promoting input standardization (particularly in materials and design)
• Enhancing the collaboration and productivity of Jua Kali entities via clustering
6.2.1 Lay the foundations for a sustainable forestry sector that is able to meet Kenya’s demand for timber
Consideration should be given to the current mechanisms of harvesting and sales under KFS and whether these are optimal, or if outsourcing and further privatization would be more effective. In addition, the mandate of KFS should be broadened to ensure it collects and publishes statistics on demand and supply of local wood.
This intervention would furnish the furniture industry with an inventory of existing plantations and would clarify the short-term availability of wood, which could then be incorporated in new forest planting schemes. Considering the
business model and potential conflict of interest issues at KFS could then further optimize the efficiency of their operations.
In the event the information shortage of existing forest plantations persists, planting rates by the State, private investors, and farmers will continue to be misinformed regarding timber demand in Kenya.
6.2.2 Eliminate import licenses for timber and reduce import duties for intermediate products
The Government should consider the objective of import licenses in light of the scarcity of wood in Kenya. Given a significant amount of wood is smuggled into the country today, removing the strict licensing requirements would enable more wood to be imported legally. In addition, it would serve to decrease smuggling, and consequently, all the intermediation payments their illegal import requires. A decrease in smuggling would also help clarify for stakeholders in the EAC region what the demand for wood in Kenya is, and how much needs to be planted to satisfy it.
Wood based panels are a relatively scarce intermediary product, and as such their classification should be corrected from
“finished goods” to “intermediary goods,” with the applicable duty amended from 25 percent to 10 percent or 0 percent. Correcting this classification would increase the availability of key inputs at international market prices, which is a precondition for Kenyan and foreign investments to expand furniture and joinery production. While competitive pressure on local suppliers on price and quality will no doubt intensify—and significant lobbying on behalf of wood-based panel mills may result—reducing the import duty is crucial for the future competitiveness and expansion of the Kenyan furniture industry.
6. Recommendations
FURNITURE INDUSTRy IN KENyA 36
6.2.3 Promote regional trade agreements to facilitate and increase timber imports
Trade cooperation relationships with neighboring countries should be developed to bolster Kenya’s opportunities as a furniture producer and exporter to East African markets, and to allow easier imports of logs and sawn timber into Kenya. The benefit of this would be improved availability of wood input products at regional market prices.
6.2.4 Improve the efficiency and quality of inputs to the furniture sector by promoting the development of wood-based panel production and upgrading of the sawmilling industry
Greater competition in the wood-based panel industry should be encouraged and facilitated. This can be done by reducing or removing import duties and assessing potential barriers to entry given the limited number of players in the industry and the high levels of demand for wood-based products. Simultaneously, a formal statement should be issued supporting the development of the sector.
For sawmills, incentives should be provided for their consolidation and upgrading. Achieving scale in the industry would allow for significant investment in machinery, allowing for increased quality and quantities, and more added value via secondary processing. Issuing a formal statement and offering subsidized loans with conditions that tie into policy directions could expedite consolidation and upgrading.
Upgrading of locally sourced furniture inputs such as glue, glass, metal, laminate, leather, could be encouraged via formal connections to facilitate offtake agreements and outsourcing. An industry association could potentially play this role.
Facilitating the expansion of the wood-based panel industry and the upgrading and consolidation of the sawmilling industry is essential for furniture and other end-use industries. This would also have significant positive environmental consequences, as firms are able to invest in new technologies and processes that waste less timber. Importantly, not doing this would hinder competitiveness, expansion, and investments in the furniture sector and result in further dependence on imports.
6.2.5 Promote input standardization (particularly in materials and design)
The longer term supply of the high-end Kenyan market and developed export markets will hinge on standardization and certification. The Kenyan Bureau of Standards should be consulted as a partner to develop input standards and ensure that their implementation is adhered to. Doing this will enhance business transparency and will facilitate certification and branding of furniture made in Kenya.
6.3 Improve Productivity and Innovation through Better Skills and Technologies
Improving the productivity and innovation of furniture manufacturers by enabling them to
upgrade their design, quality, and volume is key for the development of the industry. Several actions are suggested:
• Establishing a Kenyan center for excellence as a platform to provide relevant industry training and (in the longer-term), co-ordination of R&D.
• Setting up prototyping facilities to develop new products
• Providing incentives to upgrade technology and expand manufacturing facilities to move towards serial production
• Increasing access to finance
• Enhance collaboration among Jua Kali entities via clustering
6. Recommendations
Situational Analysis and Strategy 37
6.3.1 Establish a Kenyan Center for Excellence as a platform to provide relevant industry training and (in the longer-term), co-ordination of R&D
To improve development and dissemination of new technologies and skills across the furniture industry, a virtual (or physical) Center of Excellence could provide an important platform. The Center could be established as a public-private partnership, and seed capital (or a government investment) would enable the setup and basic capabilities. Over time, it would operate as a demand-driven entity.
A Center for Excellence could improve the availability and relevance of training programs in Kenya. It could initially be set up virtually and begin with the provision of technical and managerial extension services in firms, with the government incentivizing demand through vouchers. The Center would have the capacity to provide training-needs assessments and technology extension services, and develop tailored training curriculums. In addition, it should be able to provide training on different materials used in furniture, including composite materials that use less wood. Initially, the Center could conduct industry research to focus program content and build credibility, liaising and coordinating with the Industry Association.
Challenges to setting up a Center would include: (i) sourcing appropriate owners and seed capital for its development and initial operations; (ii) quickly understanding the requirements of the industry, (iii) offering demand-driven services at a competitive cost, and; (iv) having the high-quality personnel (and access to facilities) to provide them. Most importantly, the Center would need to address the mentality among the industry regarding the need for advisory and training services, but the reticence to pay for and use them.
6.3.2 Set up prototyping facilities to develop new products
Providing common facilities with shared professional tools and machinery to create professional prototypes that can be used to assess demand would give aspiring and small businesses the opportunity to (i) enhance quality and design; and (ii) minimize the risk of investing working capital in pre-produced furniture items.
Government or donor financing would be required to cover start-up costs, but these facilities would ultimately run as private businesses, with individuals paying to use machines and tools. The government could incentivize demand initially by providing vouchers to individuals looking to use these facilities. Similar entities currently exist in Kenya—Gearbox, for instance—and may be useful platforms from which to pilot and extend these facilities more widely.
For a prototyping facility to be successful, the concept would have to be widely publicized to overcome industry reticence to using (and paying for) external facilities and services. In addition, examining best practices in other countries would be important, as would be ensuring the facility is empowered to develop new prototypes on order as well as on its own.
6.3.3 Provide incentives to upgrade technology and expand manufacturing facilities to move towards serial production
In light of the growth in local demand, enabling serial production by investing in facilities and collaborating with stakeholders along the value chain makes economic sense. The government could make available soft loans for investments in upgraded, large-scale manufacturing facilities as a signaling mechanism to stimulate demand. This would enable increases in output, productivity, sales, exports, and value addition.
6. Recommendations
FURNITURE INDUSTRy IN KENyA 38
6.3.4 Increase access to finance
Explicit government support for the furniture sector, coupled with education for financial institutions, could assist in the development of more appropriate financial products for the industry (and particularly for its SMEs). Focused efforts to help customize and pilot these financial products could make a significant difference in access to finance for the sector.
6.3.5 Enhance collaboration among Jua Kali entities via clustering
Enhancing collaboration amongst Jua Kali would enable the sustained development of businesses, including potentially sub-contracting to larger furniture firms and exporting. This can be done by promoting “cluster initiatives” and by (literally) further clustering Jua Kali entities such that the provision of common services and facilities can be targeted more effectively. These activities would promote collaboration—allowing Jua Kali to take advantage of economies of scale, facilitate specialization, enhance market linkages, and encourage improvements in productivity and value-addition.
To be successful, this strategy would need buy-in from local existing Jua Kali associations. The latter would need to be on board with spatial clustering, improvement of premises, technology and skills, and sharing of common services (including marketing).
6.4 Enhance Access to Markets and Induce Greater Demand for Products
Enhancing access to domestic and regional markets and inducing greater demand for
Kenyan furniture products is key for the growth of the industry. Several actions are suggested:
• Promoting regional trade agreements
• Improving border logistics and regional transportation networks to strengthen regional integration
• Improving the implementation of the Build Kenya, Buy Kenya public procurement initiative
• Promoting exports of Kenyan specialty products (eg., “ethnic- rustic” pieces) in key international markets
• Establishing Jua Kali-focused marketing entities to facilitate access to formal markets
• Organizing study tours for firms to meet buyers and see cutting-edge technologies and designs, and up-and-coming consumer trends.
6.4.1 Promote regional trade agreements
Kenya is currently the strongest furniture producer in the East African Community. Regional trade agreements within the EAC provide Kenya with a competitive advantage to capture market share relative to furniture producers from countries further afar.
In preparation for the Continental Free Trade Area to be implemented by 2017, EAC countries should facilitate increased trade amongst each other in terms of raw materials and finished products. This would help build the industry and consolidate its strength vis-à-vis the rest of Africa. This has been a successful model in countries like Malaysia, where the government cooperates with countries in the region to facilitate mutual trade of input materials and final goods.
If Kenya is not able to leverage and grow regional trade quickly, the Kenyan furniture industry will come under significant pressure if the Africa Free Trade Zone agreement goes ahead in 2017 as planned. This will give regional powers (most notably South Africa) the opportunity to sell their products to other African markets, duty free. If Kenyan formal and informal manufacturers are unable to lower costs, improve efficiency, upgrade production methods and enhance quality and design, they will struggle to compete.
6. Recommendations
Situational Analysis and Strategy 39
6.4.2 Improve border logistics and regional transportation networks to strengthen regional integration
Given the poor conditions of road networks in Kenya, tanzania, south sudan, and uganda, it is essential to improve border procedures, governance, and transparency to promote trade in furniture and strengthen regional integration.
To increase the propensity of Kenyan firms to export regionally, the Government can: (i) simplify and streamline border procedures and rules (the electronic single window for customs clearance is a great first step), (ii) bolster security; and (iii) curb corruption at the border.
It is important to note that the promotion of smooth border logistics is not restricted to Kenya, but also requires the participation and cooperation of neighboring countries.
6.4.3 Improve the implementation of the Build Kenya, Buy Kenya public procurement initiative
Public procurement can provide significant opportunities to the furniture sector in Kenya, and can play a role in upgrading of the industry in terms of product quality and quantity. The Buy Kenya, Build Kenya program,24 should be fully implemented, with the amendments that have been proposed to it by the Ministry of Industrialization. A few additions are also suggested:
• Sunset clauses should be included, to force review of the policy and enable extensions if found deserving.
• Stringent quality controls should be added as part of implementation, as well as mechanisms to enable public entities to provide feedback to manufacturers on their products.
• Provisions to maintain furniture should also be encouraged, such that manufacturers see first-hand the sturdiness, durability, and uses of their products.
• A catalogue that provides specifications for furniture design and quality, and puts a percentage cap on the prices that can be paid for it would be desirable because it would maximize transparency. While this theoretically provides equal opportunities for all Kenyan furniture manufacturers (formal and informal), the reality is that the tendering process calls for technical, design, standardization, and procurement know-how.
Importantly, there is a risk that the above measures are insufficient to make the system fully transparent, and that open public procurement does not adequately cater to local manufacturers and Jua Kali entities.
6.4.4 Promote exports of Kenyan specialty products (i.e. “ethnic-rustic” pieces) in key international markets
Kenyan manufacturers have a natural competitive advantage in traditional Swahili Coast furniture, given their pieces meet the design standards of developed, consumer markets. The industry association, with the support of the government, should facilitate connections between global furniture outlets and craftsmen producing these unique specialty products. In addition, it should consider organizing study tours for firms to meet buyers and consumers.
Given high-end, “ethnic-rustic” furniture is by definition a niche play, it will likely take some time for efficient distribution channels in developed markets to be established. Also, this furniture may struggle to differentiate itself from Asian “ethnic rustic” furniture and achieve adequate export scale.
6. Recommendations
24 The Ministry of Industrialization and Enterprise Development is in the process of finalizing the Buy Kenya, Build Kenya policy, which is seen as a way of creating markets for local products and services. The policy aims to reduce government and private expenditure on imported products and services and reduce the unemployment rate by supporting the local economy to grow.
FURNITURE INDUSTRy IN KENyA 40
6.4.5 Establish Jua Kali-focused marketing entities to facilitate access to formal markets
establishing Jua Kali-focused marketing entities that secure contracts, facilitate volume, and ensure quality control could enhance Jua Kali access to markets. This would allow Jua Kali entities to supply formal furniture outlets, manufacture bulk components for formal furniture market outsourcing, access export markets, and compete for government public procurement.
This will likely take some time to develop given scale and consistency is an important prerequisite for formal markets. While some Jua Kali entities can meet requirements for small volumes of individual products, a sustained supply calls for spatial clustering, upgrading of manufacturing and consolidation of outputs.
The Kenyan furniture industry has a strong foundation. Nevertheless, the challenges it currently faces constrain its competitiveness and efficiency in local, regional and international markets. Implementing the above cross-cutting interventions could unlock specific bottlenecks, and bring about a new performance trajectory for the industry and its value chain.
6. Recommendations
Situational Analysis and Strategy 41
To actively promote the competitiveness of the sector, the Kenyan Government can draw on
lessons of successful interventions from China, Malaysia, and South Africa. The governments in these countries initiated furniture-sector development policies that included, among others, incentives for furniture firms, investments in the industry to systematically develop the value chain, clustering of micro-firms, and certification standards and branding.
China
In the 1970’s, due to a national shortage of wood, the government targeted specific value added-industries, including the furniture industry, with the intention of generating employment, meeting domestic demand, and increasing export revenues. The Chinese government implemented wide-ranging initiatives, initiated the following:
• Ensuring a competitive supply of production inputs, by allowing imports of wood for all wood-processing industries.
• Clustering manufacturing entities in a number of coastal cities and industrial parks, which had access to support services. Clustering within these cities and industry parks was further specialised into pre-selected product lines.
• Support of training institutions to ensure availability of human capital, and formulation of standards and operating regulations.
• Financial incentives to promote local industry and attract FDI, which included tax “windows” for rebates and refunding on development costs and investments in new technology.
• Formulation of a strategy to target key export destinations and attainable market niches, and active support of international marketing campaigns and distribution relationships
• Establishing provincial and national furniture industry associations to develop and share industry knowledge and contribute to international marketing.
malaysia
the malaysian government recognized the competitive pressure from leading low-cost producers like China and Vietnam and aimed to move the malaysian industry towards increasingly higher value-added timber industry exports. The various policy frameworks they have implemented have been highly comprehensive, and have included the following interventions, amongst others:
• Government support of the plantation and forestry sectors, and sourcing of logs and wood products from neighboring countries.
• A range of financial and other incentives—including a refundable tax to incentivize firms to invest in manufacturing and export value added products, the Investment Tax Allowance, and the Small & Medium Industry Development Corporation (which provides tax incentivizes for the modernization and upgrading of SME furniture firms, subject to qualifying criteria).
• A proactive role in establishing public private partnerships and the establishment of various niche and industry-wide associations to drive the development of the industry.
Annex 1: lessons from government interventions in other countries
FURNITURE INDUSTRy IN KENyA 42
South Africa
The South African government regards the furniture industry as an important sector, and carried out extensive analytical work to find ways of restoring the international competitiveness of the industry. The current sector development strategies and policies include:
• Emphasis that competitiveness is to be based on furniture design and manufacturing technology.
• The SME segment is powered by increased clustering, specialization, networking and cooperation, with enhanced capacity and flexibility.
• Demand-driven vocational training has been enhanced, based on benchmarking the South African industry against the main import supplier countries to accelerate the upgrading of South African furniture manufacturers.
• Horizontal governmental policies and investment projects are closely coordinated with the development strategy of the furniture industry.
Annex
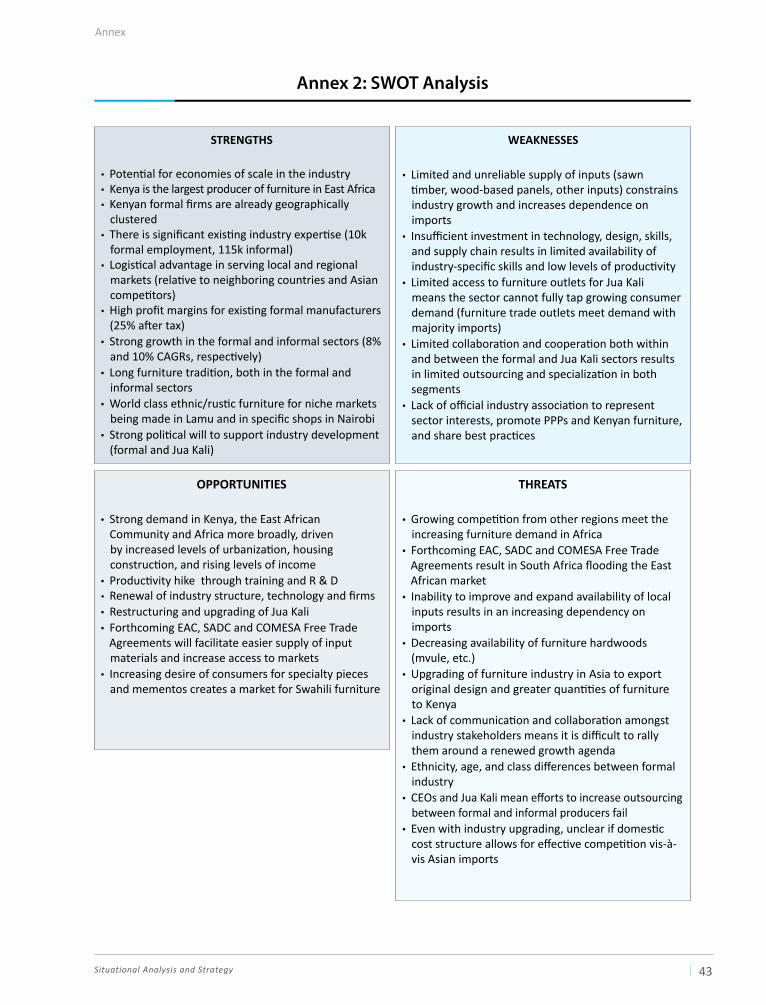
Situational Analysis and Strategy 43
Annex 2: swot Analysis
Annex
strenGtHs
• Potential for economies of scale in the industry• Kenya is the largest producer of furniture in East Africa • Kenyan formal firms are already geographically
clustered• There is significant existing industry expertise (10k
formal employment, 115k informal) • Logistical advantage in serving local and regional
markets (relative to neighboring countries and Asian competitors)
• High profit margins for existing formal manufacturers (25% after tax)
• Strong growth in the formal and informal sectors (8% and 10% CAGRs, respectively)
• Long furniture tradition, both in the formal and informal sectors
• World class ethnic/rustic furniture for niche markets being made in Lamu and in specific shops in Nairobi
• Strong political will to support industry development (formal and Jua Kali)
OPPOrtunities
• Strong demand in Kenya, the East African Community and Africa more broadly, driven by increased levels of urbanization, housing construction, and rising levels of income
• Productivity hike through training and R & D • Renewal of industry structure, technology and firms • Restructuring and upgrading of Jua Kali• Forthcoming EAC, SADC and COMESA Free Trade
Agreements will facilitate easier supply of input materials and increase access to markets
• Increasing desire of consumers for specialty pieces and mementos creates a market for Swahili furniture
WeaKnesses
• Limited and unreliable supply of inputs (sawn timber, wood-based panels, other inputs) constrains industry growth and increases dependence on imports
• Insufficient investment in technology, design, skills, and supply chain results in limited availability of industry-specific skills and low levels of productivity
• Limited access to furniture outlets for Jua Kali means the sector cannot fully tap growing consumer demand (furniture trade outlets meet demand with majority imports)
• Limited collaboration and cooperation both within and between the formal and Jua Kali sectors results in limited outsourcing and specialization in both segments
• Lack of official industry association to represent sector interests, promote PPPs and Kenyan furniture, and share best practices
tHreats
• Growing competition from other regions meet the increasing furniture demand in Africa
• Forthcoming EAC, SADC and COMESA Free Trade Agreements result in South Africa flooding the East African market
• Inability to improve and expand availability of local inputs results in an increasing dependency on imports
• Decreasing availability of furniture hardwoods (mvule, etc.)
• Upgrading of furniture industry in Asia to export original design and greater quantities of furniture to Kenya
• Lack of communication and collaboration amongst industry stakeholders means it is difficult to rally them around a renewed growth agenda
• Ethnicity, age, and class differences between formal industry
• CEOs and Jua Kali mean efforts to increase outsourcing between formal and informal producers fail
• Even with industry upgrading, unclear if domestic cost structure allows for effective competition vis-à-vis Asian imports
FURNITURE INDUSTRy IN KENyA 44
Abonyi, George. ( 2006). “Linking Greater Mekong SubregionEnterprises to International Markets:The Role of Global Value Chains, International Production Networks and Enterprise Clusters.” Global Expert Meeting in Kunming on Promoting SME’s Participation in Global Value Chains in the Greater Mekong Subregion.
ABTV. 2013. “The American Furniture Industry: Industry Watch Update.” October. Available at: http://www.abtv.com/uploads/files/2013%20Furniture%20Industry%20Watch%20Update%20Final.pdf
AfDB, OECD, UNDP, UNECA. 2012. "African Economic Outlook." http://www.africaneconomicoutlook.org/fileadmin/uploads/PAGES-%20Pocket%20Edition%20AEO2012-EN.pdf
African Forest Forum (AFF). 2011. “Forest Plantations and Woodlots in Kenya,” African Forest Forum Working Paper Series, Volume 1, Issue 13, Nairobi.
Carsan, Sammy, and Christine Holding. 2009. "Growing Farm Timber: Practices, Markets and Policies; The Meru Timber Marketing Pilot Programme Case Studies and Reviews." World Agroforestry Centre, Nairobi.
Central Bureau of Statistics (CBS), International Center for Economic Growth (ICEG), and K-Rep Holdings. 1999. "National Micro and Small Enterprise Baseline Survey." Nairobi.
Cheboiwo, Joshua K. 2011. "Proposal on Market Studies on Timber Market Dynamics in Kenya in Relation to Potential Imports from Tanzania." Londiani Regional Research Centre, Kenya.
Cheboiwo, Joshua K. 2011. "State of the Art Knowledge on Wood Processing and Utilization in Kenya."
Cheboiwo, Joshua K. 2011. “The Potential Role of Timber Trade in Promoting Economic Development in the East and Central Africa.” Paper presented at Moi University International
Conference on Knowledge Creation and Dissemination for the Realization of the Millennium Development Goals, September 6-10. Available at: http://41.215.78.76:8282/handle/123456789/425
Cheboiwo, Joshua K., H.K. Maritim, and W.K. yabann. 2011. "Tree Product Market Structure and Performance in Western Kenya: A look at Comparative Gross Marketing Margins and Product Price Correlations."
Cohen, David. 2005. “Impacts of China on the Global Supply Chain: The Wood Sector.” University of British Columbia.
COMESA. 2012. "Country Profile: Kenya." Egypt. Available at: http://www.comesaria.org
COMESA Regional Investment Agency. 2012. "COMESA Investment Teaser 2012-2013: Kenya." Egypt.
Crispus, Karanja. 2012. "An Investigation into the Factors that Influence the Effectiveness of the Manufacturing and Marketing of Furniture Products and Possible Ways of Improving their Performance: The Case of Gikomba, Kariobangi andMathare Areas of Nairobi Province." Thesis at Kenyatta University.
CSIL. 2014. "Africa Furniture Outlook." Milan.
CSIL. 2014. “World Furniture – International Markets Review.”
ReFeRences
Situational Analysis and Strategy 45
Council of Asian Furniture Manufacturers. 2014. "The Best of Asian Furniture."
Deloitte. 2013. "2013 Global Manufacturing Competitiveness Index."
Deloitte. 2014. "East Africa Private Equity Confidence Survey." Available at: http://finnpartnership.fi/__kehitysmaatieto__/2466/Private%20Equity%20Confidence%20Survey%202014.pdf
Department of Trade and Industry, Republic of South Africa. 2008. "Draft Strategy for the Development of the Furniture Industry." Available at: http://pmg-assets.s3-website-eu-west-1.amazonaws.com/docs/081107furniturestrategy.pdf
Desing, Frank Sander. 2013. "Statistics for the Furniture Industry and Trade."
Dunne, Nikki. 2000. “International Trends in the Timber Furniture Industry and the Implications for South African Furniture Exporters.” CSDS Working Paper No. 25, School of Development Studies, University of Natal, Durban.
EAC. 2007. “EAC Common External Trade Tariffs.” http://www.eac.int/customs/index.php?option=com_content&id=98:eac-customs-union-common-external-tariffs-2007&Itemid=141
EAWLS (East African Wild Life Society) and TNRF (Tanzania Natural Resources Forum). 2012. "Trade in Forest Products between Kenya and Tanzania." Arusha. Available at: http://www.tnrf.org/files/TNRF-EAWLS%20report%20FINAL.pdf
EPZA (Kenya Export Processing Zones Authority). 2005. "Wood and Wood Products." Nairobi.
European Commission. 2014. “The EU Furniture Market Situation and a Possible Furniture Products Initiative.” Available at: http://ec.europa.eu/growth/tools-databases/newsroom/cf/itemdetail.cfm?item_id=7918&lang=en&title=Study-on-the-EU-furniture-market-situation-and-a-possible-furniture-products-initiative-
European Union. 2008. "Furniture Industry Restructuring: Systems and Tools, Guidelines on Managing the Process of Change of the Furniture Manufacturer, Brussels."
European Union. 2010. “The Furniture Market in 2020.” EU Working Document.
Everts, Ben. 2012. "Draft Strategy for the Development of Kenya State Plantation Forests." Nairobi, MMMB/KFS.
FAO Corporate Document Repository. 1991/4. “An Overview of Forest Industry in Eastern and Southern Africa.” Unasylva - No. 167 - Forest industry, Volume 42. Available at: http://www.fao.org/docrep/u4200e/u4200e07.htm
FAO Corporate Documentary Repository. "Country Report Kenya: Internal and External Factors Influencing Forestry."
FAO Corporate Document Repository. 2005. "Current Status of Forestry Sector and the Vision for the Year 2020." Rome. Available at: http://www.fao.org/docrep/003/ab569e/AB569E04.htm
FAO Corporate Documentary Repository. “Wood Products and their Use in Construction.” Available at: http://www.fao.org/docrep/c3848e/c3848e05.htm
FAO. "Forest Products Yearbooks 2010-2013 (statistical data)." Rome. Available at:http://www.fao.org/forestry/statistics/80570/en/
References
FURNITURE INDUSTRy IN KENyA 46
FAO/UNECE. "Forest Products Annual Market Review, 2011-2013."
Favada, Ibrahim M. 2009. "Overview of the Study on Intra-regional Timber Trade in Africa." Report prepared for ITTO (International Tropical Timber Organization).
Forest Monitor. 2007. "Value Chain for DRC Mahogany Sold in Kampala and Nairobi." Available at: http://www.forestsmonitor.org/uploads/2e90368e95c9fb4f82d3d562fea6ed8d/Value_Chain_for_DRC_Mahogany_sold_in_Kampala_and_in_Nairobi.pdf
Furnishing Idea. 2014. “CSIL: The Global Scenario of Markets.” December 15. Available at: http://www.furnishingidea.com/news/economy-and-marketing/2014/csil--the-global-scenario-of-markets_346.html
Furniture Foresight Centre (CEFFOR). 2008. "The Furniture Industry in 2016, Competitive Scenarios: Trends and Strategic Implications." AIDIMA, Furniture, Wood and Packaging Technology Institute, Spain.
Furniture Today. 2013. “CSIL: Global furniture trade to climb 3.2% in 2014.” December 30. Available at: http://www.furnituretoday.com/article/483967-csil-global-furniture-trade-to-climb-32-in-2014
Gatsby and PWC. 2014. “Meeting the Wood Supply Challenge: The Need for Commercial Forestry in Kenya.” Discussion paper.
Gelb, Alan, and VijayaRamachandran. 2005. “Business Environment and Comparative Advantage in Africa: Evidence from Investment Climate Data.” Working Paper 56, Centre for Global Development.
GGDA (Gauteng Growth and Development Agency). 2014. "Sector Sheet: Furniture in Gauteng."
Githiomi, Joseph. 2010. "A Forest of Activities: An Overview of the Wood Industry in Kenya." Miti Magazine, April-June. Available at: http://41.215.78.76:8282/handle/123456789/706
Global Research and Data Services (GRDS). 2014. "Furniture Market in Kenyato 2018 - Market Size, Trends, and Forecasts." http://www.grdsreports.com/furniture-and-furnishing/furniture/furniture-market-in-kenya-to-2018-market-size-trends-and-forecasts-p-96118.html
Guangqian, Zhu. 2013. "Overview of China’s Timber Market." Timber and Wood Products Distribution Association, Guangzhou.
Guasch, José Luis, Liliana Rojas-Suarez, and Veronica Gonzales. 2012. "Competitiveness in Central America: The Road to Sustained Growth and Poverty Reduction." Centre for Global Development, Washington, DC.
Han, Xiao. 2007. "Competitiveness of Chinese Wooden Furniture Industry – From the Vision of Export." Beijing Forestry University and University of Toronto.
Han, Xiao, yali Wen, and Shashi Kant. 2009. “The Global Competitiveness of the Chinese Wooden Furniture Industry.” Forest Policy and Economics, Volume 11, Issue 8: 561-569.
Hedemann, Lars, and Mogens Rostgaard Nissen. 2013. "The Internationalization of Danish Furniture. A Value Chain Perspective." Available at: http://ojs.statsbiblioteket.dk/index.php/eaa/article/view/15649/13523
Held, Christian, Grit Techel, and Kai Windhorst. 2010. "SPGS Timber Market Study in Uganda."
HKTDC Research. 2013. “China’s Furniture Market.” Hong Kong.
IFC. 2013. "Kenya Country Profile."
References
Situational Analysis and Strategy 47
IHB, Timber Network. 2014. “World Furniture Production Doubles in Last Decade.” July 1. Available at: http://www.ihb.de/wood/news/Furniture_production_trade_37596.html
IMF. 2012. "World Economic Outlook." Washington, DC.
IMF. 2012. "Regional Economic Outlook: Sub-Saharan Africa Sustaining Growth amid Global Uncertainty." Washington, DC.
International Trade Centre UNCTAD/WTO (ITC), and International Tropical Timber Organization (ITTO). 2004. "International Wooden Furniture Markets: A Review. Geneva."
Italian Trade Commission. 2012. “Furniture Market in China.” Shanghai.http://www.ice.gov.it/paesi/asia/china/upload/174/market
KAM. 2012. “Timber, Wood Products & Furniture Sector in Kenya.” KAM Working Paper, Nairobi.
Kaplinsky, Raphael, Mike Morris, and Jeff Readman. 2002. “The Globalization of Product Markets and Immiserizing Growth: Lessons from the South African Furniture Industry.” World Development, Volume 30, Issue 7: 1159-1177.
Kaplinsky, Raphael, O. Memedovic, Mike Morris, and Jeff Readman. 2003. "The Global Wood Furniture Value Chain. What Prospects for Upgrading by Developing Countries; The Case of South Africa." UNIDO, Vienna.
Kaplinsky, Raphael, and Mike Morris. 2006. “The Impact of the Asian Drivers on Sub-Saharan Africa’s Wooden Furniture Industry.” TIPS, Trade and Industry Monitor, Volume 38.
Kaplinsky, Raphael, Jeff Readman, and O. Memedovic. 2008. “Upgrading Strategies in Global Furniture Value Chains.” Working Paper 9, UNIDO, Vienna.
Kenya Association of Manufacturers (KAM) website.http://www.kam.co.ke/index.php/about-us/organization-structure/industrial-sectors/179-timber-wood-products-and-furniture-sector
KEFRI (Kenya Forestry Research Institute). 2010. "Role of Agroforestry in Tropical Timber Supply in Kenya."
KEFRI. 2015. “KEFRI-Policy Brief No. 4.”
Kenya Gazette Supplement, No. 132, Legislative Supplement No. 38. 2012. “The Forests (Fee and Charges) Rules.” September 28.
Kiuru, Juha. 2009. Competence Development and Capacity Building of Sawmill Enterprises in Kenya – A Human Resources Development Approach. Master´s thesis, Lappeenranta University of Technology, Finland.
KNBS (Kenya National Bureau of Statistics). "Statistical Abstract 2013-2014."
KNBS. 2010. Basic Report on the "2010 Census of Industrial Production (CIP)."
KNBS. 2014. "Economic Survey 2014." Nairobi, Kenya. Available at: http://www.knbs.or.ke/index.php?option=com_phocadownload&view=category&id=107&Itemid=1181
KRA (Kenya Revenue Authority), "Customs Department. Foreign Trade Statistics of Kenya 2008-2013."
Kwee Ng Boon. 2011 “Malaysia National Innovation Strategy: National Innovation Study in Wood-Based Industry.” Working Paper submitted to Special Innovation Unit, Prime Minister´s Department, May 2011.
References
FURNITURE INDUSTRy IN KENyA 48
Lescuyer, Guillaume, Paolo Omar Cerutti, EdouardEssiane, and Raphaël Tsanga. 2012. "Sustainable Forest Management and Chainsaw Milling in Central Africa." CIFOR Central Africa Regional Office, IUFRO-FORNESSA 2012 Regional Congress, Nairobi, 25-29, June.
Luorens, A.S., and J.A. Jonker. 2013. “An Integrated Approach for Developing a Technology Strategy Framework for Small tomedium Sized Furniture Manufacturers to Improve Competitiveness.” South African Journal of Industrial Engineering, Volume 24:1: 50-67.
“Major Furniture Manufacturers in Nairobi.” Unpublished internal memo of a furniture manufacturer.
Malaysian Timber Industry Board. 2012. "Furniture Industry in Malaysia: Status and Market Prospects."
Marshall, Nina, and Martin Jenkins. (1994). "Hard Times for Hardwood – Indigenous Timber and Timber Trade in Kenya." Traffic International, Cambridge, United Kingdom.
MATRADE. 2005. "Product Market Study: Office Furniture Market in Kenya." Malaysia.
McKinsey Global Institute. 2010. "Lions on the Move: The Progress and Potential of African Economies." Available at: http://www.mckinsey.com/insights/africa/lions_on_the_move
McKinsey & Company. 2012. "Manufacturing the Future: The Next Era of Global Growth and Innovation. McKinsey Global Institute."
Ministry of Environment, Water and Natural Resources. 2014. "Forest Policy, 2014. Kenya."
Ministry of Forestry. 2007. “A Road Map for the Revitalization of Indonesia's Forest Industry.” In-house Experts Working Group, Jakarta.
Ministry of Forestry and Wildlife. 2012. "Draft National Forest Policy." Nairobi.
Ministry of Plantation Industries and Commodities. 2009. "National Timber Industry Policy 2009-2020." Malaysia
Ministry of Trade and Industry. (2005). "Trade Facilitation Project in Kenya: Handbook on Importing and Exporting In Kenya." Nairobi. Available at: https//www.kenyaembasy.com/pdfs/handbookimportingexporting.pdf.
Miti Magazine. 2011. “Up and Still Rising: The Construction Industry Records Rapid Growth Offering Opportunities and Challenges.” Issue 11, July-September.
MitiMingiMaisha Bora (MMMB). 2007. "Support to forest sector in Kenya: Analysis of Policy, Regulatory and Fiscal Framework for Small and Medium Enterprise Development in Sawmilling." Nairobi.
MNRT (Ministry of Natural Resources and Tourism). 2011. "Timber Market Dynamics in Tanzania and in Key Export Markets." Indufor, Dar Es Salaam, Tanzania.
Ndiema, Linnet, a and Joseph Githiomi. 2010. "Status of Timber Standardization in Kenya." ISO Conference in Beijing, China.
Ogweno, D.O, Paul Opanga, and Alex O.Obara, eds. 2009. "Forest Landscape and Kenya’s Vision 2030." Forestry Society of Kenya, Nairobi.
Osano, Evans, Peter Kiuluku, Henry Njuguna, and Lucas Turuka. 2008. “Round Table Presentation on Manufacturing Industry in Kenya.” Round Table Africa, May 21.
References
Situational Analysis and Strategy 49
Porter, Michael E. 2007. "Global Competitiveness: Implications for Kenya. Institute for Strategy and Competitiveness." Harvard Business School/Strathmore Business School, Nairobi, Kenya. Available at: http://www.hbs.edu/faculty/Publication%20Files/20070626_Kenya_b9ce9a9d-549d-46cd-b552-839925ce84d7.pdf
PWC. 2012. "South African Retail and Consumer Products Outlook 2012-2016." Available at:http://www.pwc.co.za/en/publications/retail-and-consumer-outlook.jhtml
RISI. 2015. "Particleboard and MDF Dashboard." Amsterdam. Available at: http://www.risiinfo.com/Marketing/Commentaries/MDF.pdf
Stratlink. 2015. "Furniture Market Research: Kenya." Nairobi.
The Government of Kenya. "The Public Procurement and Disposal Acts 2005 and 2011." http://ppoa.go.ke/downloads/The%20Act/public_procurement_and_disposal_act_2005.pdf
The Kenya Institute for Public Policy and Research Analysis (KIPPRA). 2013. "Kenya Economic Report: Creating an Enabling Environment for Stimulating Investment for Competitive and Sustainable Counties." Nairobi.
The Office of the President of the Republic of Kenya. 2010. “Infrastructure of Kenya.” Available at: http://republicofkenya.org/economy/infrastructure/
TIPS, and AusAid. "Trade Information Brief: Furniture." http://www.sadctrade.org/files/Furniture%20TIB.pdf
UNEP. 2010. "Forest Resources: Sudan Post-Conflict Environmental Assessment." http://postconflict.unep.ch/publications/sudan/09_forests.pdf
UNEP. 2012. "The Role and Contribution of Montane Forests and Related Ecosystem Services to the Kenyan Economy." Nairobi.
UNIDO. 2011. "Diagnostics for Industrial Value Chain Development - An Integrated Tool." Vienna. Available at: http://www.ids.ac.uk/files/dmfile/UNIDO2011-IVCDiagnosticTool.pdf
US Bureau of Labor Statistics. 2013. “International Comparisons of Hourly Compensation Costs in Manufacturing Industries: Furniture Hourly Compensation Costs (ISIC 31), 2008-2012.” Available at: http://www.bls.gov/fls/ichccindustry.htm#31
WANLEyS Consultancy Services. 2013. "Analysis of Demand and Supply of Wood Products in Kenya." Nairobi.
Wesgro. 2014. "Furniture sector in Cape Town and Western Cape." South Africa. Available at: http://wesgro.co.za/publications/publications/2014-furniture-sector-in-the-western-cape
World Bank. 2011. “Comparative Value Chain and Economic Analysis of the Furniture/Wood Processing Sector (Chairs) in Ethiopia, Tanzania, Zambia, China and Vietnam,” in Light Manufacturing in Africa: Focused Policies to Enhance Private Investment and Create Millions of Productive Jobs. Volume II: The Value Chain and Feasibility Analysis; Domestic Resource Cost Analysis. Available at: http://siteresources.worldbank.org/DEC/Resources/VolumeIICh5.pdf
World Bank. 2011. "Africa’s Future and World Banks’ Support to it." Washington, DC. Available at: http://siteresources.worldbank.org/INTAFRICA/Resources/AFR_Regional_Strategy_3-2-11.pdf
World Bank. 2012. "Doing Business in a More Transparent World." Washington, DC. Available at: http://www.doingbusiness.org/reports/global-reports/doing-business-2012
References

FURNITURE INDUSTRy IN KENyA 50
World Bank. 2013. Enterprise Survey for Informal Firms: Kenya, Washington, DC. Available at: http://www.enterprisesurveys.org
World Bank. 2013. "Global Economic Prospects, Sub-Saharan Africa." Washington, DC.
World Bank. 2013. "Manufacturing Export Competitiveness in Kenya: A Policy Note on Revitalizing and Diversifying Kenya’s Manufacturing Sector" Washington, DC.
World Bank. 2014. “Kenya’s Economy Continues to Grow in a Challenging Environment.” Available at: http://www.worldbank.org/en/country/kenya/publication/kenya-economic-update-economy-facing-headwinds-2014-special-focus-delivering-primary-healthcare-services
World Bank. 2014. "Enhancing the Competitiveness of Kenya’s Manufacturing Sector: The Role of the Investment Climate." Available at: http://www-wds.worldbank.org/external/default/WDSContentServer/WDSP/IB/2005/09/29/000090341_20050929102801/Rendered/PDF/336640KE0ICA007.pdf
World Economic Forum. 2012. "Global Competitiveness Index Report 2012–2013: Country Profile Highlights." Geneva.
yumkella, Kandeh K., Patrick M. Kormawa, Torben, M. Roepstorff, and Anthony M. Hawkins, eds. 2011. Agribusiness for Africa’s prosperity. UNIDO, Austria.
References