furnace performance and runlength improvement …...typical cracking furnace performance...
TRANSCRIPT
Furnace Performance and
Runlength Improvement
Through Multi-Model Techniques
Dr. Pratap Nair & Sameer Thorat
Ingenero Inc. Houston
Furnace Performance Improvement Impact
• Ethylene production increase
• Furnace throughput increase
• Furnace yield improvement
• Furnace Run length improvement (increased uptime/availability)
• Cost reduction
• Energy utilization efficiency and recovery efficiency
• Decoke costs
• Effective cost based on tube replacement frequency
• Effective cost based on unforseen shutdown frequency
• Maintenance costs
2
The ultimate arbiter for Furnace Performance improvement is improved ethylene production and reduced cost to maintain and operate the furnaces

Typical Cracking Furnace Performance Considerations
• Reduced furnace run lengths are often a problem triggered by Tube Metal Temperatures being too high
Coking / decoking issues Channeling Flame impingement
Coil Pressure Ratio being too high from coking Feed imbalance
TLE limitations
• Need for calculated adjustments of heat flux and/or dilution steam to optimize cracking severity versus run length instead of fixed settings Adjustments in coil level-wise heat flux by monitoring coking rate helps in
reducing differential coking and abnormal CIP/TMT rise Differential coking if arrested properly helps in max. severity and gains Increasing the dilution steam flow to certain level of SHC ratio helps in
improving yields and reducing coking rate, however maintaining optimum ratio is critical as higher SHC ratio increases firing and CIP
• Need for proper feed and heat flux balancing based on identification of abnormal deviations and faulty indications
3
Ethylene plants tend to have common furnace section issues, which when addressed provide the necessary improvement
Abbreviations:CIP: Coil Inlet Pressure, TMT: Tube Metal Temperature, SHC: Steam to Hydrocarbon

Furnace Performance Improvement Using Analytics
• Process analytics impacts throughput, availability, yield and efficiency
Simulation/modeling Data Analytics Dashboards DMAIC Process for implementation
• Equipment Focused analytics impacts availability and performance
Predictability: maintenance, functional life profile Operational status within optimal boundary conditions
• Safety/Environmental analytics Prevention of accidents / spills / non-compliance
Information availability and access Real-time status Predictability of problems
4
Furnace performance and hence plant profitability has been substantially improved safely by micro tracking and multi dimensional analytics of furnace data

Cracking Performance Improvement MethodologyWe know of consistent cracking furnace performance improvement at over 15 ethylene sites using multi-model based analysis and tracking methodology, followed by Ingenero
5

Models At The Core Of Ethylene Plant Analytics
Fundamental first principle Yield models (reaction kinetics, mass & heat transfer, thermodynamics)
• COILSIM1D
Steady state process simulation & optimization• Aspen suite, Hysys, PRO II, FRNC, HTFS, HTRI
Computational Fluid Dynamics (CFD)• Fluent, OpenFOAM
Data driven models• Statistical, neural net, pattern recognition, Weibull analysis, PCA, PLS, time series
LP models• Integrated supply chain model (supply, production, inventory, distribution), strategic
planning models, scheduling models, Optimal feed distribution
Dynamic models• Operator training, model predictive control
6
Different types of models form an essential part of the process, equipment and compliance analytics
Abbreviations:PCA: Principle Component Analysis, PLS: Partial Least Squares

Appropriate Technology Utilization
• Reaction kinetics model to compute yield as a function of key parameters like Feed type, SHC, COT, COP
• Convection section modeling (e.g. FRNC 5, HTRI Fired Heaters) to achieve maximum throughput / cracking safely
• Fire box modeling (geometry / heat flux) to control rate of fouling at the individual coil level
• CFD to address flue gas channeling, flame impingement and hot spots on tubes
• Data driven models allow appropriate adjustments for incoming feed and key furnace parameters (COT, S/HC, COP)
• ANN modeling to predict and adjust run lengths to plan decoking cycle
• LP Model to maximize production options appropriately
7
Use of appropriate models and technology is key to help the plant to maximize profits/production and extend furnace run lengths
Abbreviations: SHC: Steam to Hydrocarbon, COT: Coil Outlet Temperature, COP: Coil Outlet Pressure, ANN: Artificial Neural Network, LP: Linear Programming

Furnace Yield Prediction ModelsPredictions provide insights on impact of feed, cracking severity and other production parameters and thereby allow appropriate adjustments to be made to optimize performance and production
8Abbreviations: SHC: Steam to Hydrocarbon, CIP: Coil Inlet Pressure, COP: Coil Outlet Pressure, CIT: Coil Inlet Temperature
Coil AB Coil BA Coil BC Coil CB Coil CD Coil DC Coil AB Coil BA Coil BC Coil CB Coil CD Coil DC
XX XX XX XX XX XX XX XX XX XX XX XX
0.50 0.45 0.45 0.45 0.45 0.45 0.50 0.45 0.45 0.45 0.45 0.45
39.5 42.0 43.1 41.3 42.8 39.6 39.5 42.0 43.1 41.3 42.8 39.6
- - - - - - - -
66.6 66.6 66.6 66.6 66.6 66.6 67.8 67.3 65.9 66.3 66.3 67.2
1561 1561 1561 1561 1561 1561 1561 1561 1561 1561 1561 1561
1556 1558 1564 1563 1562 1559 1561 1561 1561 1561 1561 1561
- - - - - - - - - - - -
3.91 3.90 3.89 3.91 3.89 3.90 3.97 3.93 3.86 3.89 3.88 3.93
6.37 6.50 6.46 6.38 6.49 6.42 6.64 6.64 6.31 6.31 6.44 6.53
51.17 50.99 51.14 51.25 51.02 51.15 51.88 51.37 50.72 51.05 50.87 51.48
32.63 32.60 32.59 32.59 32.65 32.59 31.41 31.96 33.28 32.92 32.89 32.06
1.32 1.36 1.35 1.33 1.36 1.34 1.34 1.37 1.34 1.33 1.36 1.34
0.24 0.25 0.25 0.25 0.25 0.24 0.24 0.24 0.25 0.25 0.25 0.24
Furnace Coilwise Imbalance - Impact on Conversion, Yields
Case-1: Constant severity for differential COT's
Effluent (Wt%)
C3H8
66.6 66.6
Actual COT(Plant Tag)
Severity Plant Tag
Severity Calculated
C3H6
C2H6
C2H4
HC Feed Rate
SHC
CIP
COP
H2
CH4
Heat Absorbed
Calculated COT(Coilsim)
Case-2: Differential severity at constant COT's
15.3714.6116.5016.50 14.61 15.37
Utility Of Furnace Yield Models
• Furnace Models help identify differential cracking among coils and help identify limiting/fast coking coils
• Propylene, C4, Aromatics optimization based on sensitivity analysis on Severities
• Integrated Radiant Box and Convection section to track furnace efficiencies on daily basis
• Furnace effluent being used as input to plant wide simulation flow sheet for material and energy balance reconciliation
• Yield model outputs used for tracking TLE performance including fouling and steam generation
• Yield model built in Aspen Custom Modeler integrated with planning model in Aspen PIMS
9
The furnace yield models provide insights into the furnace operation that helps improve performance
Radiant and Convection Section Models
• Combination of radiant and convection section models, aids to monitor and adjust burners to maximize run length and production while ensuring that tube metal temperatures are within allowable limits
Determines the parameter settings for maximum safe production
• Further convection section models helps in overall thermal efficiency improvement
Prediction/evaluation of convection section individual pass performances
Monitoring of fouling in individual passes for both flue gas and process side
Identification of possibility of channeling of flue gas
10
Ingenero customizes its proprietary heat flux model or commercially available fired heater modeling packages (HTRI) to develop models to match individual furnace geometry

Convection Section Model Utilization Example
11
Convection section modeling allows maximum throughput without exceeding design tube skin temperature
Header 17/11 H-112 CONVECTION SECTION 17/11 Tube Date (dd/mm)
design 17:44 17:44 Design Time (hrs)
temp 14.1 14.1 14.5 Z5 Load, tph
15.3 15.3 14.5 Z6 Load, tph
Hydrocarbon feed 95 40 96 300
30 to 39 144 300 HC preheat
195 124 29 130 300
Boiler Feed Water 28 166 379
25 to 27 226 379 BFW
230 24 249 379
269 122 23 191 568
17 to 22 485 568 HC + stm 1
418 16 516 568
15 378 464
14 414 526
13 453 586
Attemperation water 12 485 630 HPSS
11 534 615
10 479 536
509 475 9 491 556
Dilution steam 8 677 694
572 519 7 729 776
Secondary Steam 418 385 6 698 815
5 727 848
4 756 888 HC + stm 2
3 702 810
2 725 835
1 751 920Crossover 652 634
= Finned Tubes = Bare Tubes
DSS
Capacity limitation: DSS design skin temperature
12
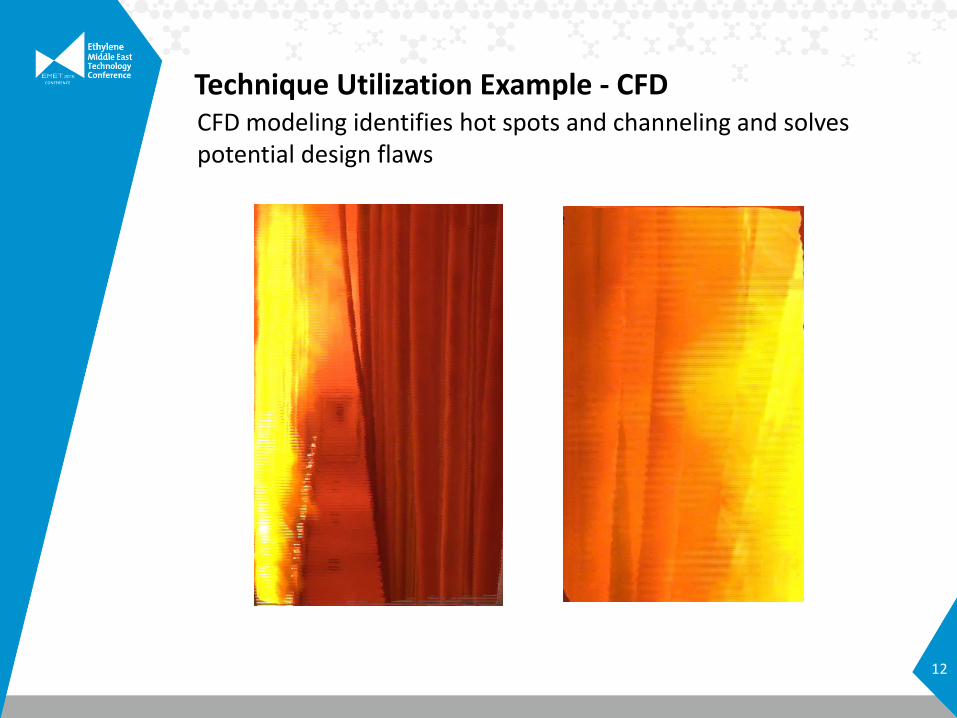
Technique Utilization Example - CFDCFD modeling identifies hot spots and channeling and solves potential design flaws
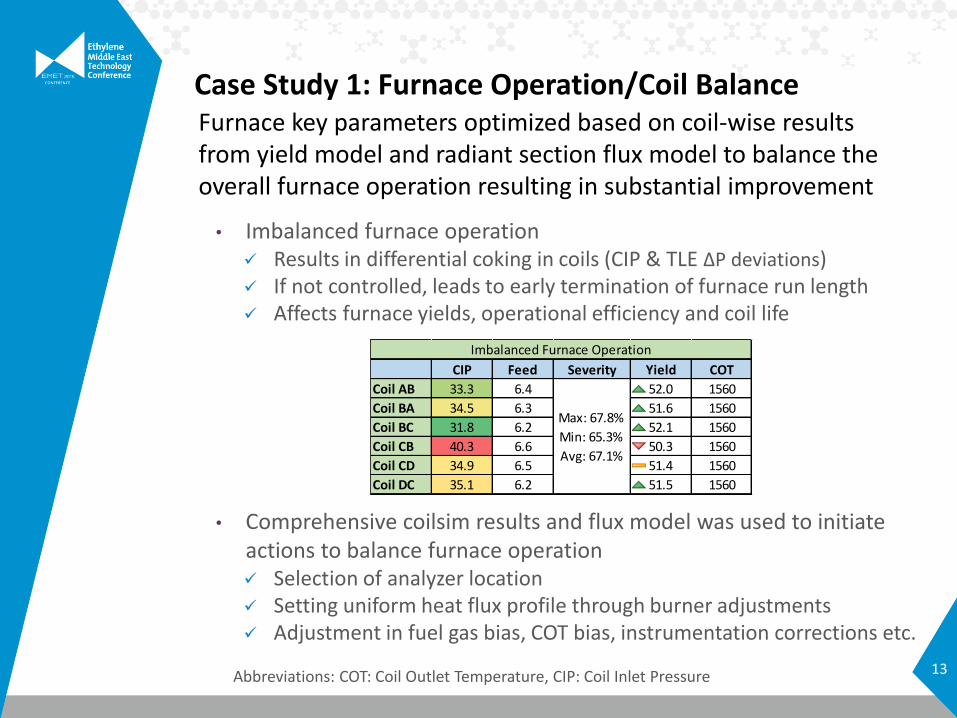
Case Study 1: Furnace Operation/Coil Balance
• Imbalanced furnace operation Results in differential coking in coils (CIP & TLE ΔP deviations) If not controlled, leads to early termination of furnace run length Affects furnace yields, operational efficiency and coil life
• Comprehensive coilsim results and flux model was used to initiate actions to balance furnace operation Selection of analyzer location Setting uniform heat flux profile through burner adjustments Adjustment in fuel gas bias, COT bias, instrumentation corrections etc.
13
Furnace key parameters optimized based on coil-wise results from yield model and radiant section flux model to balance the overall furnace operation resulting in substantial improvement
Abbreviations: COT: Coil Outlet Temperature, CIP: Coil Inlet Pressure
CIP Feed Severity Yield COT
Coil AB 33.3 6.4 52.0 1560
Coil BA 34.5 6.3 51.6 1560
Coil BC 31.8 6.2 52.1 1560
Coil CB 40.3 6.6 50.3 1560
Coil CD 34.9 6.5 51.4 1560
Coil DC 35.1 6.2 51.5 1560
Imbalanced Furnace Operation
Max: 67.8%
Min: 65.3%
Avg: 67.1%

Case Study 1: Furnace Operation/Coil Balance
Feed deviation reduced from 6% to 1% Difference in min-max conversions reduced from 2.5 to 0.5 CIP rise observed to be uniform and rate of rise controlled well
• Benefits : Balanced operation resulted in uniform coking in coils, which helped in improving furnace performance Scope for extending furnace run length and/or severity Reduced coking in coils and fouling in TLE’s
Lower CIP’s and COP’s Lower coil TMT’s Shorter decoke period
Improvement in ethylene yield by 1.3 wt% 14
Corrective actions helped in improving overall furnace balance, resulting in sizeable performance improvement
CIP Feed Severity Yield COT
Coil AB 29.2 5.9 53.0 1556
Coil BA 30.9 5.9 52.5 1556
Coil BC 29.2 5.9 52.8 1556
Coil CB 29.2 5.9 52.8 1556
Coil CD 29.4 5.9 52.8 1556
Coil DC 29.3 5.9 52.9 1556
Balanced Furnace Operation
Max: 68%
Min: 67.5%
Avg: 67.8%

Statistical Models – PCA For Outlier detection
• Key features and benefits of PCA models
Multivariate correlations between several variables captured easily
Compares current furnace run with the past performance
Possibility of missing out on outliers/abnormal operation is very rare
Which variable caused the sample to be an outlier?
Q contribution plot gives that insight
Model is linked to Process Historian and updates automatically
Filtering out outliers is easy and less time consuming
Aids in early detection of faults, improves reliability
15
Statistical models based on PCA (Principal Component Analysis) are developed for furnaces, used for identifying the deviations in normal operation/performance and aid improvement

Outlier detection example using PCA: Contribution Plots
16
0
1
2
3
4
5
6
Coil 5
"3" statistical threshold value decided based on value of Q critical. Any Variable crossing this value for a particular sample is treated as an outlier, needs to be investigated further.
Outlier Example:COP is suspected as an outlier, as value of 21.3 is higher than normal

Case Study 2: Furnace PCAAbnormal deviation in furnace operating parameters was accurately detected and subsequent actions helped in reducing differential coking and thereby extending furnace run length
Model predictions ~ 10th day: Normal Performance
Model predictions ~ 15th day: Some Variation in Performance
17
0123456
Coil A
0123456
Coil ASome disturbance was observed
in indicated coil feed flow

Case Study 2: Furnace PCAModel predictions ~ 25th day: Differential coking observed
PCA model predictions on ~25th day of furnace operation indicated:
Higher rate TLE fouling, which may affect furnace runlength
Deviation in coil feed flow possibly affecting coil performance/coking
Based on further analysis, it was identified that drift in indicated coil outlet temperature (COT) which controls the coil feed flow was causing higher coking
Instrumentation error in COT indication was corrected, additional actions like heat flux balancing was carried out
Facilitated in extending the furnace runlength considerably
Differential coking could have restricted run length to 35 – 40 days
Early identification and corrective actions helped in extending furnace run length to 55 days
18
0
2
4
6Coil A
Along with feed, COP also showed
deviation indicating deteriorating
furnace performance

Furnace Predictions using Partial Least Squares (PLS)
• Key features Partial Least Squares (PLS) is a powerful multivariate predictive
technique PLS fits equations between dependent and independent variables Coefficient indicates which variable impacts predicted variable the
most
• Furnace predictions Model predicts critical furnace parameters such as COT, Feed flow, CIT,
COP, CIP etc. based on historical furnace data
• Benefits of PLS models Finding the deviations from normal/best operation accurately Early detection of faults, equipment reliability Assist in root cause analysis and optimizing furnace parameters for
given condition19
Statistical models based PLS technique is used to predict key furnace parameters to assist identifying deviations precisely and aid furnace performance improvement
Abbreviations: COT: Coil Outlet Temperature, CIT: Coil Inlet Temperature, COP: Coil Outlet Pressure,CIP: Coil Inlet Pressure

Predictive Analysis: Forecasting ToolsFurnace CPR predictions/forecasting supports furnace scheduling and corrective measures to improve/optimize runlength
20

LP Models : OptimizerBased on an objective function (profit/production); customized LP models provides optimal operating parameters settings and distribution of feeds among multiple furnaces
21
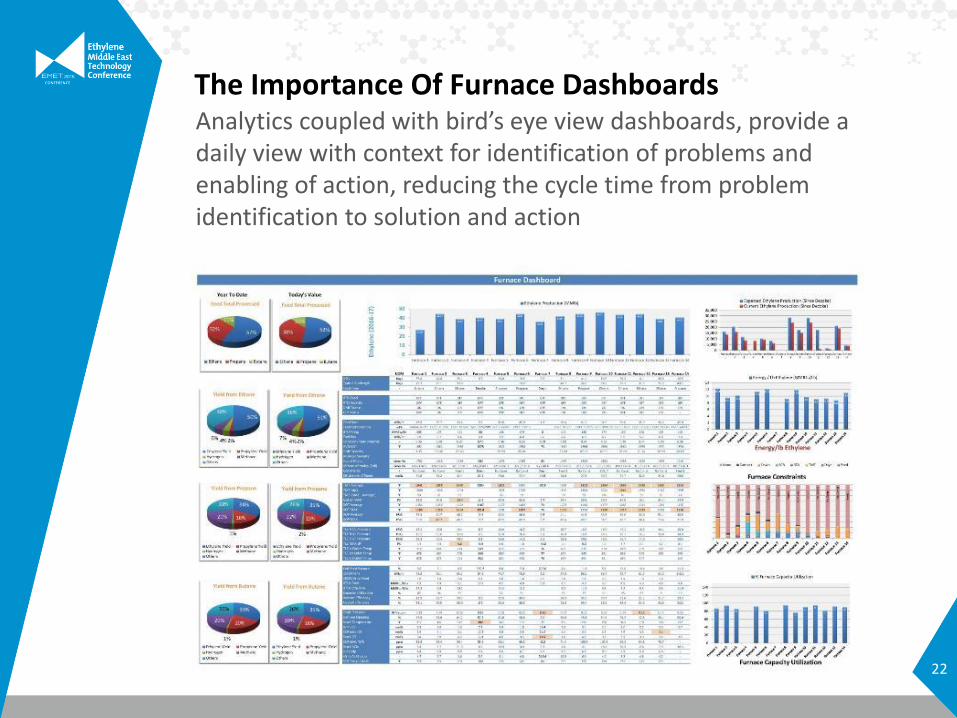
The Importance Of Furnace DashboardsAnalytics coupled with bird’s eye view dashboards, provide a daily view with context for identification of problems and enabling of action, reducing the cycle time from problem identification to solution and action
22

Furnace Reliability Matrix – An Intelligent DashboardThe furnace reliability matrix is a reliable tool which provides a visual, faster identification of furnace anomalies and deviations based on variations from model prediction
23

Furnace Reliability Matrix Example – An ExcerptSample reliability dashboard generated from analysis using the Technology tools, enabling identification and focus for actions
24
Matrix Deviations Computed based on:1. Difference between predicted and actual values2. Difference between actual value and pre-defined limits based on furnace run length
Matrix Predicted ValuesPredicted value is calculated for key furnace parameters viz. COT, XOT, CIP, TMT based onmodels calibrated by historical plant measurements and maintained to reflect currentconditions.
Matrix Variable LimitsWhile furnace operating parameter limits are defined and set to be automatically cross-checked with, as part of the matrix computations and flagging/alert, some parameter limitswithin the matrix have been set variable to the furnace run length. This is because thesignificance of certain critical operating parameters like CIP, TMT, TLE ΔP etc. changes withdays of operation.
Abbreviations: COT: Coil Outlet Temperature, CIT/XOT: Coil Inlet Temperature, CIP/XOP: Coil Inlet Pressure, TMT: Tube Metal Temperature

Consistent Improvement In Furnace Run LengthsApplication of multi-model techniques in several ethylene units has been helpful to consistently improve furnace run lengths across various technologies
25
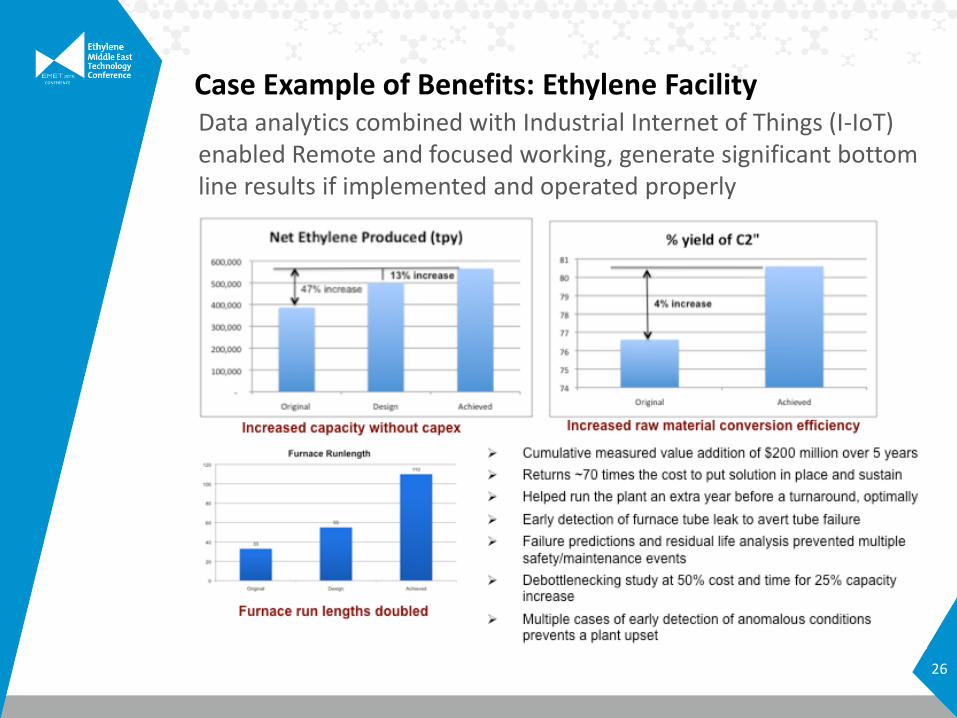
Case Example of Benefits: Ethylene FacilityData analytics combined with Industrial Internet of Things (I-IoT) enabled Remote and focused working, generate significant bottom line results if implemented and operated properly
26

The Necessary Three For True Value CaptureTechnology tools, knowledge of both analytical techniques and manufacturing process, and appropriate methodology to ensure implementation are required for value capture and sustenance
27
Define, Measure,
Analyze, Improve and
Control
To interpret the analysis provide by the
tools and link it to actions
To ensure the results are understood
and utilized, actions taken and tracked
Results

28
Excellence Through Insight
www.ingenero.com
Houston Mumbai Jubail Doha