fundamentals to do acoustical measurements · easera manual - appendix - 2 - fundamentals to...
TRANSCRIPT

Fundamentals to perform acoustical measurements
Dr. Wolfgang Ahnert and Dr. Wolfgang Schmidt
Appendix to EASERA
EASERA Manual - Appendix - 1 -

EASERA Manual - Appendix - 2 -
Fundamentals to perform acoustical measurements 1
1 Preface 5
2 Room-acoustical Overall Criteria for Speech and Music Performances 7
2.1. Reverberation Times EDT, T10, T20, T30 7 2.1.1. Measurement Basis 7 2.1.2. Calculation of the Reverberation Time in EASERA 14 2.2. Bass Ratio according to BERANEK [21] 16 2.2.1. Measurement Basis 16 2.2.2. Subjective Assessment 16
3 Seat-related Listener Criteria with Speech Performances 17
3.1. 50-ms Part (D) according to THIELE [1] 17 3.1.1. Measurement Basis 17 3.1.2. Subjective Assessment 17 3.1.3. Calculation of the „50-ms Part“ D in EASERA 17 3.2. Definition Measure C50 according to AHNERT [3] 19 3.2.1. Measurement Basis 19 3.2.2. Subjective Assessment of the Definition Measure C50 20 3.2.3. Subjective Assessment of the Frequency Dependence of the Definition
Measure C50 20 3.2.4. Calculation of the Definition Measure C50 in EASERA 20 3.3. Articulation Loss of Consonants Alcons 22 3.3.1. Measurement Basis 22 3.3.2. Subjective Assessment of the Alcons Values 22 3.3.3. Calculation of Alcons in EASERA 23 3.4. Speech Transmission Index STI and RASTI according to STEENEKEN and
HOUTGAST [4; 5] 24 3.4.1. Measurement Basis 24

EASERA Manual - Appendix - 3 -
3.4.2. Calculation of the (Ra)STI Values in EASERA 25 3.5. Center Time ts according to KÜRER [2] 26 3.5.1. Measurement Basis 26 3.5.2. Subjective Assessment 26 3.5.3. Subjective Assessment of the Frequency Dependence of the Center Time ts 26 3.5.4. Calculation of the Center Time ts in EASERA 27 3.6. Echo criterion EKSpeech according to DIETSCH [8] 29 3.6.1. Measurement Basis 29 3.6.2. Subjective Assessment of the Echo criterion EKspeech and Frequency
Dependence of the same 30 3.6.3. Calculation of EKspeech in EASERA 30
4 Seat- and Sound Source-related Listener Criteria with Music Performances 32
4.1. Direct Sound Level C7 32 4.1.1. Measurement Basis 32 4.1.2. Subjective Assessment 32 4.1.3. Calculation of the Direct Sound Measure C7 in EASERA 32 4.2. Clarity Measure C80 according to ABDEL ALIM [9] 34 4.2.1. Measurement Basis 34 4.2.2. Subjective Assessment of the Clarity Measure C80 35 4.2.3. Calculation of the Clarity Measure C80 in EASERA 35 4.3. Interaural Cross Correlation IACC according to BERANEK [29;30] 36 4.3.1. Measurement Basis 36 4.3.2. Subjective Assessment of IACC incl. Frequency Dependence of the Same 37 4.3.3. Calculation of IACC in EASERA 38 4.4. Strength Measures G according to LEHMANN [11] 38 4.4.1. Measurement Basis 38 4.4.2. Subjective Assessment of the Strength Measure G and Frequency
Dependence of the Same 39 4.4.3. Calculation of the Strength Measure G in EASERA 39
5 Room- or Seat-related Criteria 41
5.1. Reverberance Measure R according to BERANEK [16] 41 5.1.1. Measurement Basis 41 5.1.2. Subjective Assessment Reverberance Measure 41

EASERA Manual - Appendix - 4 -
5.1.3. Calculation of the Reverberance Measure R in EASERA 42 5.2. Lateral Efficiency LE according to JORDAN [18] and Lateral Fraction LF
according to BARRON [20] 42 5.2.1. Measurement Basis 42 5.2.2. Subjective Assessment of the Lateral Efficiency LE and LEM or LF and LFM 43 5.2.3. Calculation of LF in EASERA 44 5.3. Modified LF by Consideration of the Angle of Incidence with the: LFC
according to KLEINER [34] 44 5.3.1. Measurement Basis 44 5.3.2. Subjective Assessment of LFC 45 5.3.3. Calculation of LFC in EASERA 45 5.4. Echo Criterion EKmusic according to DIETSCH [8] 46 5.4.1. Measurement Basis 46 5.4.2. Subjective Assessment of the Echo Criterion EKmusic and its Frequency
Dependence 46 5.4.3. Calculation of EKmusic in EASERA 46
6 Musicians' Criteria 48
6.1. Mutual Hearing (Monitoring) - Early Ensemble Level EEL according to GADE [16;17] 48
6.1.1. Measurement Basis 48 6.1.2. Subjective assessment of EEL and Frequency Dependence of the same 48 6.2. Room Support ST1(2) according to GADE [16; 17] 48 6.2.1. Measurement Basis 48 6.2.2. Subjective assessment of ST1(2) and it’s Frequency Dependence 49 6.2.3. Calculation of ST1(2) in EASERA 49
7 Bibliography 50

EASERA Manual - Appendix - 5 -
1 Preface
In order to do acoustic measurements, you have to know how to measure and also what to measure.
The first point will be covered for all acoustic measurement tools by a good tutorial as part of a well-done operation manual. In the following chapters, we will deal more extensively with the second item, i.e. what must be measured to obtain the right answers for questions and problems that are discovered.
Numerous subjective and objective room-acoustical criteria have been defined and their correlation determined in order to objectify these assessments. However, these individual criteria are closely linked with each other and their acoustic effects can neither be exchanged nor individually altered. They become effective for assessment only in their weighted totality. Based on subjective considerations and well-founded, objective measurement, technical examinations and subjective tests, partially in reverberation-free rooms within artificially generated sound fields, it was possible to define room-acoustical quality criteria that enable an optimum listening and acoustical experience in compliance with the usage function of the room. The wider the spectrum of usage, the broader the limit of the desirable reference value ranges of these criteria. Without extensive variable acoustical measures – also electronic ones – only a compromise brings about a somewhat satisfactory solution. It stands to reason that this compromise can only be as good as the degree to which the room-acoustical requirements coincide with it.
A precondition for an optimum room-acoustical design of auditoriums and concert halls is the very early coordination in the planning phase. The basis here is the establishment of the room's primary structure according to its intended use (room shape, volume, topography of the spectators’ and the platform areas). The secondary structure that decides the design of the details on walls and ceilings as well as their acoustic effectiveness has to be worked out on this basis. A planning methodology for guaranteeing the room-acoustical functional and quality assurance of first-class concert halls and auditoriums as well as rooms with a complicated primary structure is reflected in the application of simulation tests using mathematical and physical models.
The acoustical evaluation by listeners and actors of the acoustical playback-quality of a signal that is emitted from a natural acoustic source or via electro-acoustical devices is mostly very imprecise. This evaluation is influenced by existing objective causes like disturbing climatic, seating and visibility conditions as well as by subjective circumstances such as the subjective attitude and receptiveness towards the content and the antecedents of the performance.
Numerous room-acoustical criteria have been defined in order to clarify the terms used for the subjective and objective assessment of a spoken or musical performance. In the following we have listed a relevant selection of them, in which context one should note that there is a close correlation between the individual criteria. Also included are previously published overviews /32/. One single optimally determined parameter might not at all be acoustically satisfactory, because another parameter influences the assessment in a negative way.
In principle, the room-acoustical quality criteria can be subdivided into time and energy criteria. The main type of use – speech or music, then determines the recommendations for the guide values to be targeted. With multi-purpose halls (without available variable measures for

EASERA Manual - Appendix - 6 -
changing the acoustics), a compromise is required that should orient itself to the main type of use.
In the assessment of the room-acoustic quality with speech presentations (classroom, auditorium, congress hall, sermon church) and with music presentations (concert hall, opera-house) one distinguishes between "overall parameters" and the source - receiver position-related room-acoustic quality criteria for listeners (seats) as well as with music presentations for musicians (seats on the stage) and for the conductor's position.
The "overall parameters” are, among others: • the reverberation times T10 ,T20 and T30
• the Early Decay Time EDT as well as
• the Bass-Ratio BR
As a rule, the "overall criteria" are measured with an omni-directional microphone.
The position-related assessment of the room-acoustic quality in the case for speech presentations happens with the help of quality criteria such as:
• 50-ms-part or Definition D according to THIELE [1]
• Speech Clarity C50 according to AHNERT [3]
• Articulation Loss ALcons according to PEUTZ [5]
• Speech Transmission Index STI or RASTI according to STEENEKEN and HOUTGAST [4; 5]
• Center time ts according to KÜRER [2]
• Echo criterion EKspeech according to DIETSCH [8] for the perception of (annoying) reflections (echo)
For the listener position-related assessment of the room-acoustic quality in the case for music presentations, the following objective room-acoustic quality criteria for the listeners have been developed or suggested:
Sound source-related criteria: • Direct sound measure C7 for the sensation of the directness and nearness of the
sound source [3]
• Clarity measure C80 according to ABDEL ALIM [9] for the transparency of musical structures (time and register clarity)
• Interaural cross correlation coefficient IACC according to ANDO [29; 30] for the apparent sound source width ASW subjectively felt by the listener.
• Strength measure G according to LEHMANN [11] for the sound volume (level) of music presentation felt at the listener's place.
Space-related criteria:
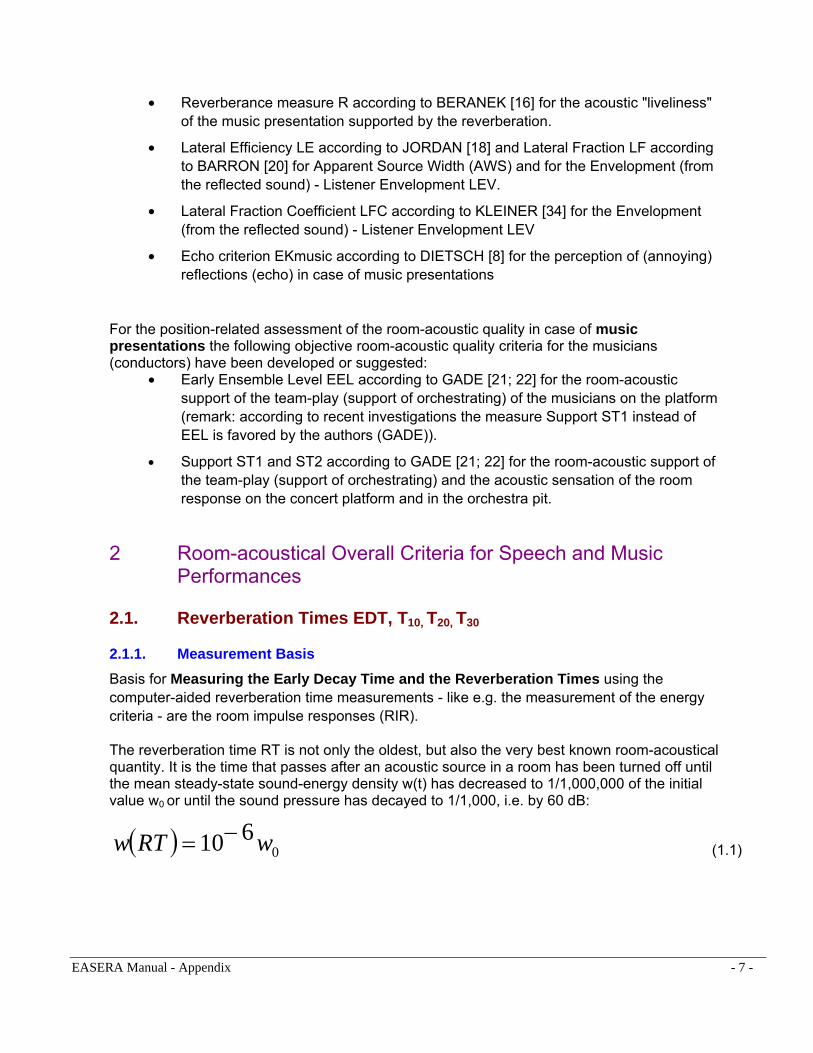
• Reverberance measure R according to BERANEK [16] for the acoustic "liveliness" of the music presentation supported by the reverberation.
• Lateral Efficiency LE according to JORDAN [18] and Lateral Fraction LF according to BARRON [20] for Apparent Source Width (AWS) and for the Envelopment (from the reflected sound) - Listener Envelopment LEV.
• Lateral Fraction Coefficient LFC according to KLEINER [34] for the Envelopment (from the reflected sound) - Listener Envelopment LEV
• Echo criterion EKmusic according to DIETSCH [8] for the perception of (annoying) reflections (echo) in case of music presentations
For the position-related assessment of the room-acoustic quality in case of music presentations the following objective room-acoustic quality criteria for the musicians (conductors) have been developed or suggested:
• Early Ensemble Level EEL according to GADE [21; 22] for the room-acoustic support of the team-play (support of orchestrating) of the musicians on the platform (remark: according to recent investigations the measure Support ST1 instead of EEL is favored by the authors (GADE)).
• Support ST1 and ST2 according to GADE [21; 22] for the room-acoustic support of the team-play (support of orchestrating) and the acoustic sensation of the room response on the concert platform and in the orchestra pit.
2 Room-acoustical Overall Criteria for Speech and Music Performances
2.1. Reverberation Times EDT, T10, T20, T30
2.1.1. Measurement Basis Basis for Measuring the Early Decay Time and the Reverberation Times using the computer-aided reverberation time measurements - like e.g. the measurement of the energy criteria - are the room impulse responses (RIR).
The reverberation time RT is not only the oldest, but also the very best known room-acoustical quantity. It is the time that passes after an acoustic source in a room has been turned off until the mean steady-state sound-energy density w(t) has decreased to 1/1,000,000 of the initial value w0 or until the sound pressure has decayed to 1/1,000, i.e. by 60 dB:
( ) 0610 wRTw −= (1.1)
EASERA Manual - Appendix - 7 -

Thus the time response of the sound energy density in reverberation [36] results as:
( ) ⎟⎠⎞
⎜⎝⎛−=⎟
⎠⎞
⎜⎝⎛−=
RTt82.13expw
RTt10ln6expwtw 00 (1.2)
The steady-state condition is reached only after the starting time tst of the even sound distribution in a room (approximately 20 sound reflections within 10 ms) [37]:
V)34.0...17.0(2...1tst = (1.3)
tst in ms V in m³ (ft3)
The defined drop of the sound pressure level of 60 dB corresponds roughly to the dynamic range of a large orchestra [38]. The listener, however, can follow the decay process only until the noise level in the room becomes perceptible. This subjectively assessed parameter reverberation time duration thus depends on the excitation level as well as on the noise level.
The required evaluation dynamic range is difficult to achieve even with objective measuring, especially in the low-frequency range. Therefore, the reverberation time is determined by measuring the sound level decay in a range from -5 dB to -35 dB and then defined as T30dB (also T30). The socalled initial reverberation time (IRT , T15dB between -5 dB and -20 dB) and the early decay time (EDT according to JORDAN, /18/, T10dB between 0 dB and -10 dB) are more in conformity with the subjective assessment of the duration of reverberation, especially at low-level volumes. This also explains why the reverberation time subjectively perceived in the room may vary, while the values measured objectively according to the classical definition with a dynamic range of 60 dB or 30 dB are, except for permissible fluctuations, generally independent of the location.
Serving as a single indicator for the principal characterization of the room in an occupied or unoccupied state, the reverberation time is used as the mean value of the two octave bandwidths 500 Hz and 1000 Hz or the 4 one-third octave bandwidths 500 Hz, 630 Hz, 800 Hz and 1000 Hz, and referred to as the mean reverberation time.
The desired value of the reverberation time RT depends on the kind of performance (speech or music) and the size of the room. For auditoriums and concert halls, the desired values for the mean reverberation time from 500 Hz to 1000 Hz with a room occupation between 80 % and 100 % are given in Fig. 1.1, and the allowed frequency tolerance ranges are shown in Figs. 1.2 and 1.3. This shows that in order to guarantee specific warmth of sound with musical performances, an increase of the reverberation time in the low frequency range is preferred (see section 1.1.2), while with spoken performances a decrease of the reverberation time is desired in this frequency range (see section 1.2.9).
EASERA Manual - Appendix - 8 -
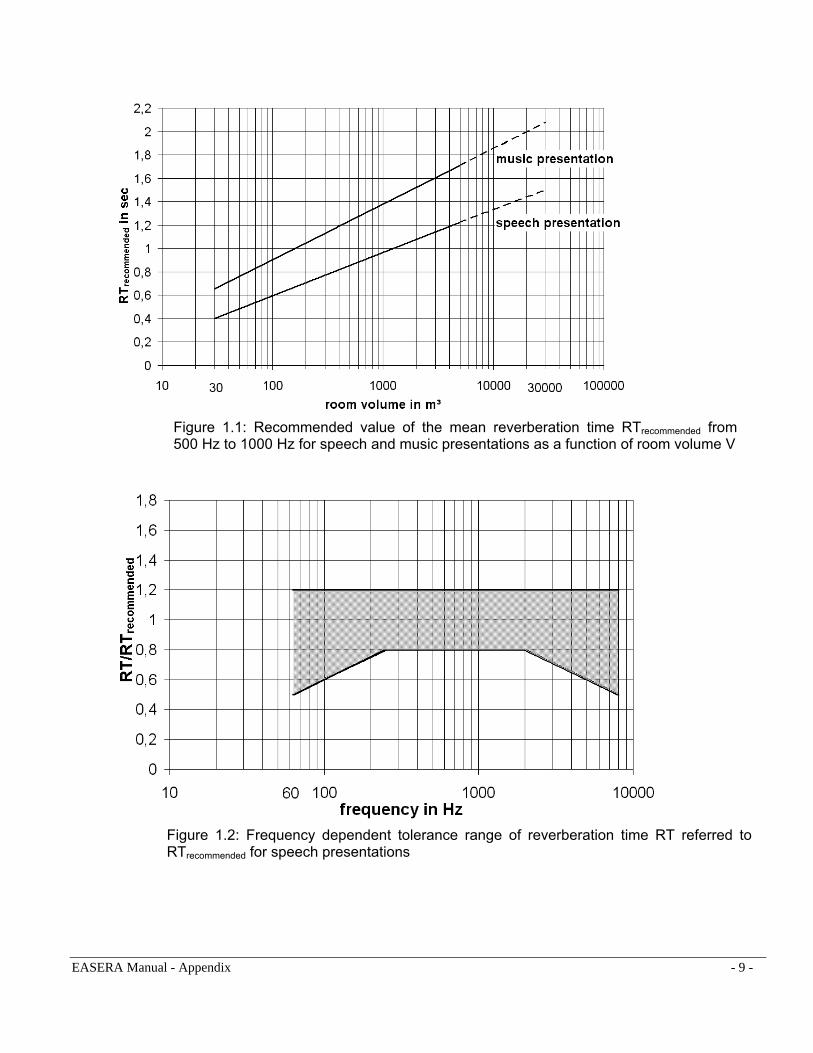
Figure 1.1: Recommended value of the mean reverberation time RTrecommended from 500 Hz to 1000 Hz for speech and music presentations as a function of room volume V
Figure 1.2: Frequency dependent tolerance range of reverberation time RT referred to RTrecommended for speech presentations
EASERA Manual - Appendix - 9 -
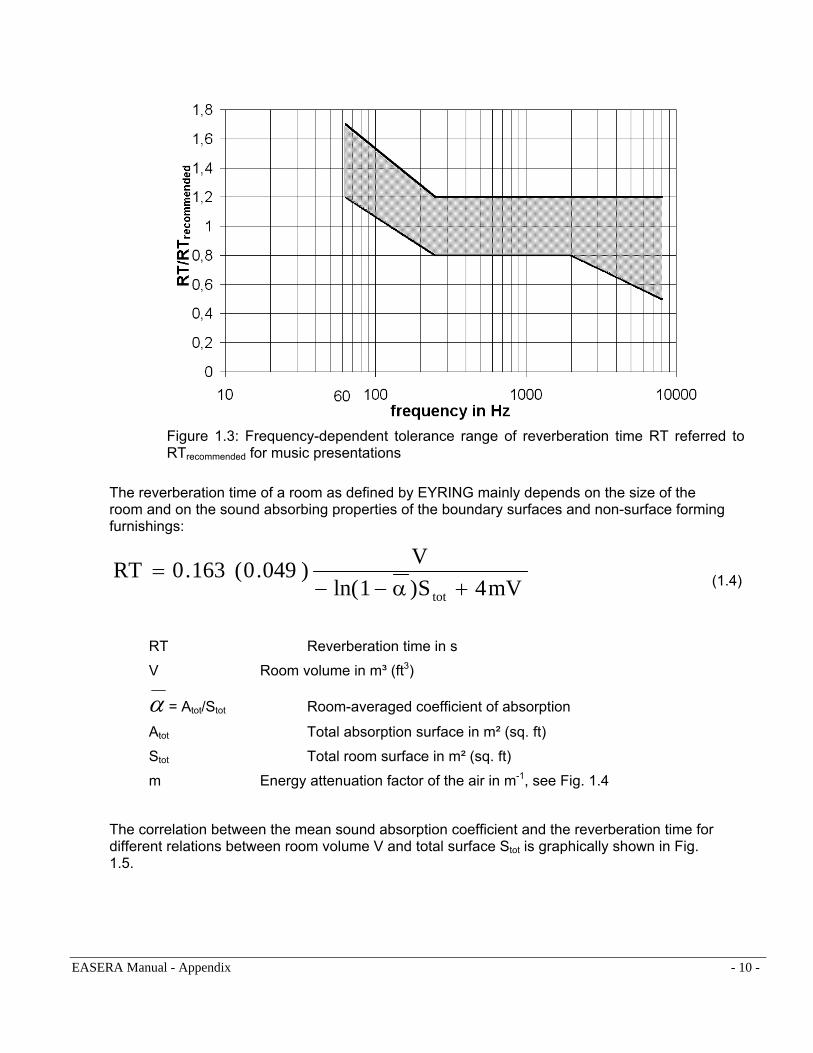
Figure 1.3: Frequency-dependent tolerance range of reverberation time RT referred to RTrecommended for music presentations
The reverberation time of a room as defined by EYRING mainly depends on the size of the room and on the sound absorbing properties of the boundary surfaces and non-surface forming furnishings:
mV4S)1ln(V)049.0(163.0RT
tot +α−−= (1.4)
RT Reverberation time in s
V Room volume in m³ (ft3)
α = Atot/Stot Room-averaged coefficient of absorption
Atot Total absorption surface in m² (sq. ft)
Stot Total room surface in m² (sq. ft)
m Energy attenuation factor of the air in m-1, see Fig. 1.4
The correlation between the mean sound absorption coefficient and the reverberation time for different relations between room volume V and total surface Stot is graphically shown in Fig. 1.5.
EASERA Manual - Appendix - 10 -

The total sound absorption surface of the room Atot consists with the corresponding partial surfaces Sn and the corresponcoefficient of sound absorption αn plus the non-surface formiconsisting e.g. of the audience and the furnishings:
∑ ∑+=n k
knntot ASA α
For an average sound absorption coefficient of up to α = 0.can be simplified using series expansion according to SABIN
mV4AV)049.0(163.0RT
tot +=
RT Reverberation time in s
EASERA Manual - Appendix
Figure 1.4: Air absorptioncoefficient m as a function ofrelative humidity F
Figure 1.5: Correlation betweenaverage sound absorptioncoefficient and reverberation timefor various ratios of room volume Vand room surface Stot
of the planar absorption surfaces ding frequency-dependent ng absorption surfaces Ak
(1.5)
25, the formula (1.4) by EYRING E (see [37]) to:
(1.6)
- 11 -

V Room volume in m³ (ft3)
Atot Total absorption surface in m² (sq. ft)
m Energy attenuation factor of the air in m-1, see Fig. 1.4
The correlation between the reverberation time RT, the room volume V, the equivalent sound absorption surface Atot including unavoidable air damping m is graphically shown in Fig. 1.6.
The above stated frequency-dependent sound absomeasurement or calculation of the diffuse all-rounddone in the reverberation room by using formula (1measured by using an impedance tube (or KUNDTresults can only be converted to the diffuse sound iand BOLT [37], if one can assume that the complexindependent of the angle, i.e. if the lateral sound prporous material with a high specific flow resistance
Properly speaking, the above-mentioned derivativeabsorption in the room are only valid for approximadistribution of the sound absorbing surfaces within heavily from a cube or a parallelepiped, or in case oabsorbing audience area, these factors also have aWith the same room volume and the same equivaleinclining the side wall surfaces towards the room's caudience area results in deviations of the measurednumerous room shapes there exist calculation methshown by Kuttruff [37] for cylinder-shaped rooms . Twith the geometrical conditions of the room and thethe sound rays determining the reverberation.
EASERA Manual - Appendix
Figure 1.6: Correlation betweenreverberation time RT, roomvolume V and equivalent soundabsorption area A, according toequation (1.6)
rption coefficient has to be determined by sound incidence. Measurement is generally .6). If the sound absorption coefficient is 's tube) with vertical sound incidence, the ncidence using the diagrams of MORSE input impedance of the absorber is
opagation is inhibited in the absorber (e.g. ).
s of the reverberation time from the sound tely cube-shaped rooms with an even the room. With room shapes deviating f a necessary one-sided layout of the decisive effect on the reverberation time. nt sound absorption surface in the room, eiling or towards the sound absorbing reverberation time of up to 100 %. For ods with different degrees of precision, as he cause of these differences lies mainly
ir influence on the resulting path length of
- 12 -

The absorbed sound power Pab of a room can be derived from the ratio energy density w = sound energy W/volume V by using the differential coefficient Pab = dW/dt representing the rate of energy decay in the room and taken from (1.6) and (1.5) (see. [39], p.18/):
cwAPab 41
= (1.7)
c Sound velocity
w energy density
A Area
In steady-state, the absorbed sound power is equal to the Power P fed into the room. This results in the average sound energy density wr in the diffuse sound field of the room as:
cAPwr
4=
(1.8)
While the sound energy density wr in the diffuse sound field is approximately constant, the direct sound energy and thus also its density wd decreases at close range to the source with the square of the distance r from the source, according to:
241rc
Pwd π= (1.9)
(Strictly speaking, this is valid only for spherical acoustic sources [39]; given a sufficient distance it can be applied, however, to most practically effective acoustic sources).
For the sound pressure in this range of predominantly direct sound, this results in a decline with 1/r. If the direct sound and the diffuse sound energy densities are equal (wd = wr), the equations (1.8) and (1.9) can be equated, which means it is possible to determine a specific distance from the source, the reverberation radius (critical distance for omni-directional sources) rH. With a spherical acoustic source this is:
RTV057.0A141.0
50A
16ArH ≈≈≈
π= (1.10)
rH in m, A in m² or sq. ft, V in m³ or ft3, RT in s
With a directional acoustic source (speaker, sound transducer), this distance is replaced by the critical distance rR:
EASERA Manual - Appendix - 13 -

HR rr ⋅Γ= γϑ)( (1.11)
Γ (ϑ): angular directivity ratio of the acoustic source (the ratio between the sound pressure that is radiated at the angle δ from the reference axis and the sound pressure that is generated on the reference axis at the same distance, in other words – the polars)
γ: front-to-random factor of the acoustic source
EASERA calculates the reverberation times T10, T20, T30 in frequency-weighted form (optionally third-octave- or octave-filtered) .
The steepness of the backward-integrated and logarithmic room impulse response (the so-called SCHROEDER PLOT [25]) allows calculating the reverberation time.
In EASERA the reverberation times are determined by this procedure, i.e. according to ISO 3382 [19] across the energy ranges –5 dB to -15 dB (→T10) , -5 dB to -25 dB (→T20) and –5 dB to -35 dB (→T30).
To minimize measuring errors owing to an insufficient S/N ratio it is necessary to limit the measurement time (integration time). It is recommended that a measurement time of about 0.6 to 0.7 of the expected reverberation time Texp [19] be chosen.
This allows you to obtain an „optimum“ reverberation line with a high correlation degree of the regression line. In addition to limiting the measurement time, there are procedures, as in EASERA, of noise reduction or compensation that can be used.
2.1.2. Calculation of the Reverberation Time in EASERA
In EASERA calculation of the reverberation time is done based on the impulse response by using the function Calculation/Schroeder RT selected from the tree as shown here, or by selection of the corresponding menu item or tool bar button.
Then the SCHROEDER Plot [25] is shown as a Graph (see below) and the corresponding reverberation time values and EDT values are indicated under Details.Graph (SCHROEDER Plot)
EASERA Manual - Appendix - 14 -

Details
Display of the octave-filtered reverberation times in EASERA using the selection Calculation/EDT, RT (Octave).
Display of the third-octave-filtered reverberation times in EASERA using the selection Calculation/Advanced/EDT, RT (1/3rd).
EASERA Manual - Appendix - 15 -

2.2. Bass Ratio according to BERANEK [21]
2.2.1. Measurement Basis A single criterion for the reverberation-time frequency response at low frequencies uses the bass ratio according to BERANEK [21]:
mids,20
lows,20
1000,20500,20
250,20125,20
TT
TTTT
BR =++
=
at T20,x the index x indicates the respective octave mid-band frequency or the 2-octave filter range with the frequency-dependent reverberation time measurement or evaluation.
2.2.2. Subjective Assessment
For music, the desirable bass ratio is BR ≈ 1.0 to 1.3, for speech, on the other hand, the bass ratio should at most have a value of BR ≈ 0.9 to 1.0.
EASERA Manual - Appendix - 16 -
3 Seat-related Listener Criteria with Speech Performances 3.1. 50-ms Part (D) according to THIELE [1]
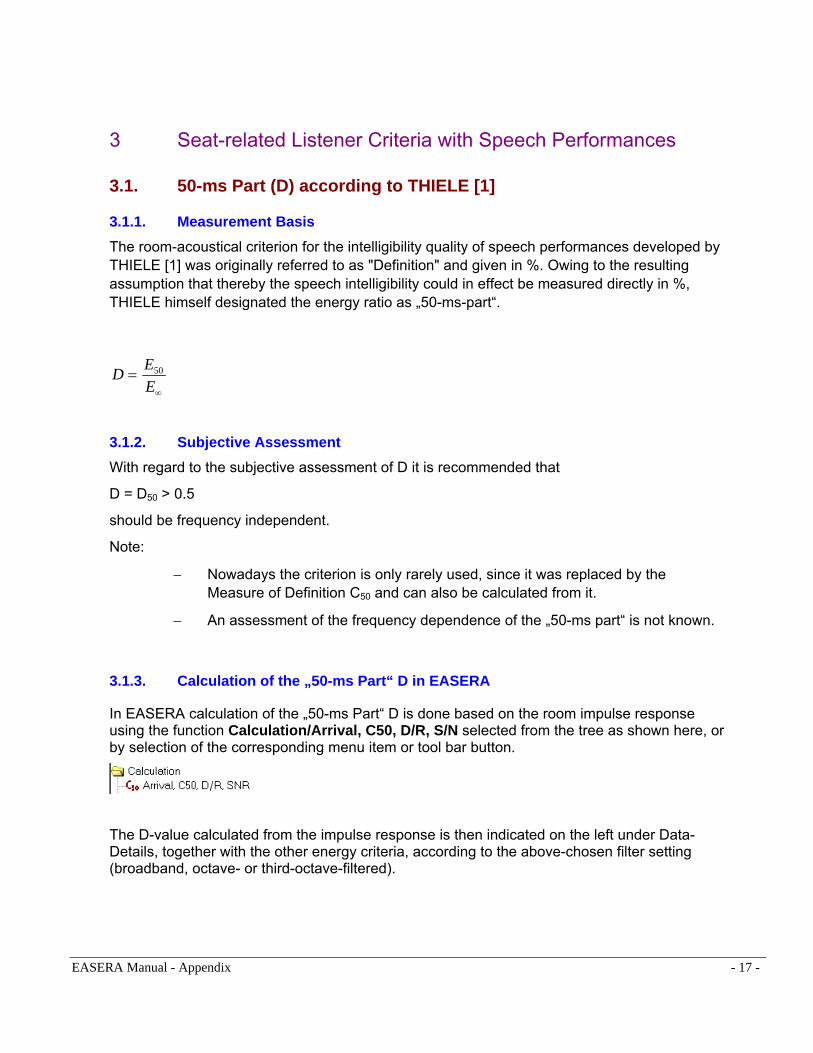
3.1.1. Measurement Basis The room-acoustical criterion for the intelligibility quality of speech performances developed by THIELE [1] was originally referred to as "Definition" and given in %. Owing to the resulting assumption that thereby the speech intelligibility could in effect be measured directly in %, THIELE himself designated the energy ratio as „50-ms-part“.
∞
=EED 50
3.1.2. Subjective Assessment With regard to the subjective assessment of D it is recommended that
D = D50 > 0.5
should be frequency independent.
Note:
− Nowadays the criterion is only rarely used, since it was replaced by the Measure of Definition C50 and can also be calculated from it.
− An assessment of the frequency dependence of the „50-ms part“ is not known.
3.1.3. Calculation of the „50-ms Part“ D in EASERA
In EASERA calculation of the „50-ms Part“ D is done based on the room impulse response using the function Calculation/Arrival, C50, D/R, S/N selected from the tree as shown here, or by selection of the corresponding menu item or tool bar button.
The D-value calculated from the impulse response is then indicated on the left under Data-Details, together with the other energy criteria, according to the above-chosen filter setting (broadband, octave- or third-octave-filtered).
EASERA Manual - Appendix - 17 -

Display of the octave-filtered D-values in EASERA using the selection Calculation/Advanced/Definition (Octave).
Display of the third-octave-filtered D-values in EASERA using the selection Calculation/Advanced/Definition (1/3rd).
EASERA Manual - Appendix - 18 -

3.2. Definition Measure C50 according to AHNERT [3]
3.2.1. Measurement Basis
The measure C50 is relevant for speech intelligibility and calculated from:
⎟⎟⎠
⎞⎜⎜⎝
⎛−
=∞ 50
501050 log10
EEEC dB.
The EASERA measurement should be carried out using a sound source with the characteristic of a normal talker (front-to-random factor γS ≈ 3).
Based on a diffuse„statistical“ sound-field structure, the known room volume V and the predicted reverberation time RT60, it is possible to compute the anticipated value C50,E for the definition measure C50 as a function of the distance between the sound source - listener seat (rx). The formula is:
EASERA Manual - Appendix - 19 -
dBe
e1rr
log10CT
05.08.13
T05.08.132
x
HS
10E,50 ⋅−
⋅−
−+⎟⎟⎠
⎞⎜⎜⎝
⎛⋅γ
⋅=
rx distance sound source (talker) → listener seat in m
rH Half-room diffuse-field distance TV057.0rH ⋅= in m
V Volume in m3
T Reverberation time in s
γs Front-to random factor of the speaker characteristic
3.2.2. Subjective Assessment of the Definition Measure C50
For the definition measure C50 there does not exist any normative room-acoustical rules. Assessment rules establishing a qualitative relation between speech intelligibility and definition measure C50 are known notwithstanding. These rules show that C50 should be ≥ -2 dB to avoid the syllable intelligibility decreasing below 80 %. Phrase intelligibility (text intelligibility), however, which thanks to the context is higher than the syllable intelligibility, amounts still to approx. 95 %. A value of C50 = -2 dB is therefore considered as the bottom "admissible" limit value for a good speech or text intelligibility.
3.2.3. Subjective Assessment of the Frequency Dependence of the Definition Measure C50
The subjective assessment of the frequency dependence of the definition measure C50 is not yet sufficiently investigated. Initial attempts in this respect can be found reported by HOFFMEIER [24].
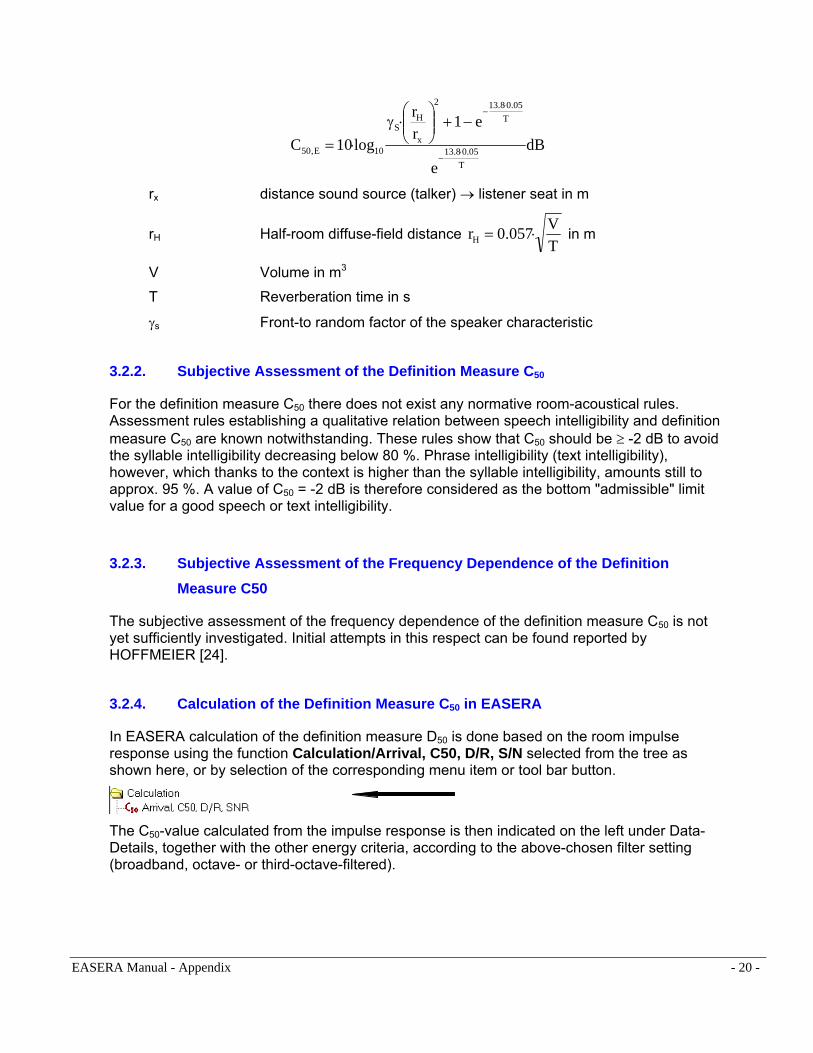
3.2.4. Calculation of the Definition Measure C50 in EASERA
In EASERA calculation of the definition measure D50 is done based on the room impulse response using the function Calculation/Arrival, C50, D/R, S/N selected from the tree as shown here, or by selection of the corresponding menu item or tool bar button.
The C50-value calculated from the impulse response is then indicated on the left under Data-Details, together with the other energy criteria, according to the above-chosen filter setting (broadband, octave- or third-octave-filtered).
EASERA Manual - Appendix - 20 -

Display of the octave-filtered C50 -values is done in EASERA together with the other „clarity measures“ using Calculation/C50, C80 (Octave) blue curve.
Display of the third-octave-filtered C50 -values is done in EASERA together with the other „clarity measures“ using Calculation/Advanced /C50, C80 (1/3rd) blue curve.
EASERA Manual - Appendix - 21 -

3.3. Articulation Loss of Consonants Alcons
3.3.1. Measurement Basis
The objective criterion Alcons (Articulation Loss of Consonants) is an alternative measure in addition to C50 for objective assessment of speech intelligibility in rooms or with sound reinforcement systems. PEUTZ and KLEIN [7] have found that the articulation loss of spoken consonants ALcons is useful for the evaluation of speech intelligibility in rooms.
Calculation of Alcons from the room impulse responses determined by EASERA is done using the Speech Transmission Index (STI) developed by HOUTGAST and STEENEKEN [4; 5] or using the "fast" variant, the Rapid Speech Transmission-Index (RASTI).
3.3.2. Subjective Assessment of the Alcons Values
The calculated Alcons values can be combined with a rating scale so as to allow a verbal assessment of the speech intelligibility.
Assigning the results to speech intelligibility yields:
Alcons ≤ 3% ideal intelligibility
Alcons = 3 to 8% very good intelligibility
Alcons = 8 to 11% good intelligibility
Alcons > 11 to 20 % poor intelligibility
Alcons > 20% worthless intelligibility (limit value 15%)
Long reverberation times cause an increased articulation loss. With the corresponding duration, this reverberation acts like noise on the following signals and thus reduces the intelligibility.
EASERA Manual - Appendix - 22 -
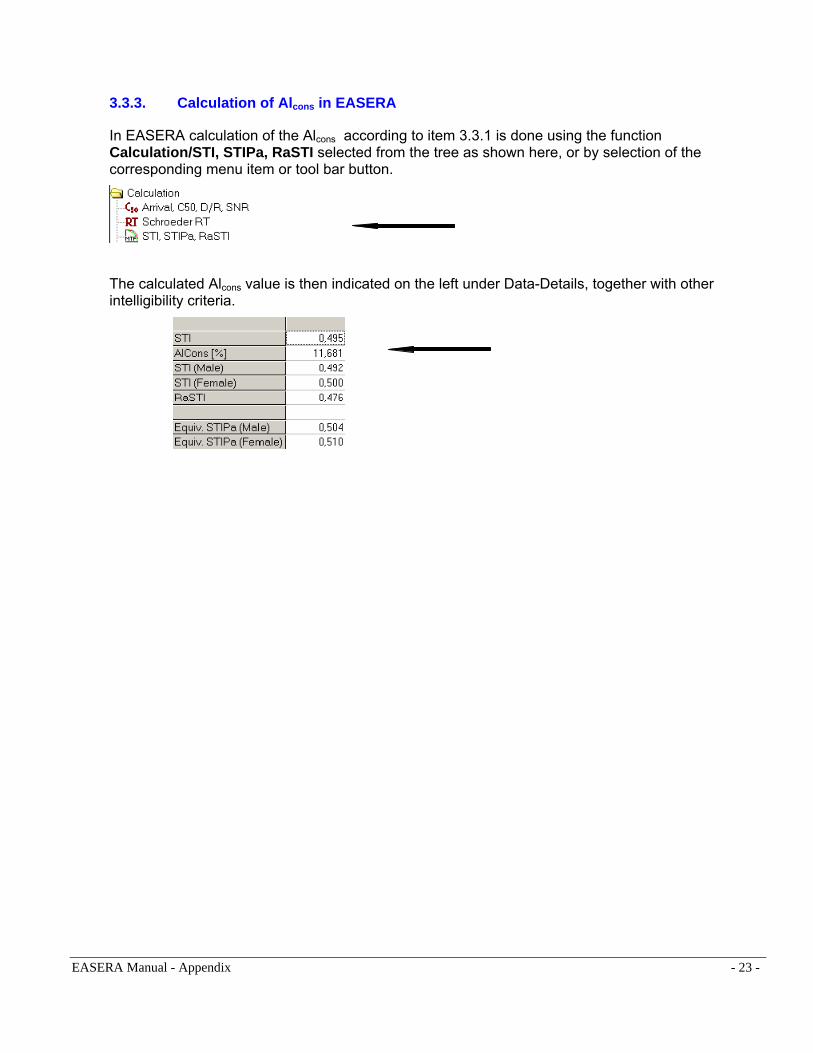
3.3.3. Calculation of Alcons in EASERA
In EASERA calculation of the Alcons according to item 3.3.1 is done using the function Calculation/STI, STIPa, RaSTI selected from the tree as shown here, or by selection of the corresponding menu item or tool bar button.
The calculated Alcons value is then indicated on the left under Data-Details, together with other intelligibility criteria.
EASERA Manual - Appendix - 23 -
3.4. Speech Transmission Index STI and RASTI according to
STEENEKEN and HOUTGAST [4; 5]
3.4.1. Measurement Basis The determination of the STI-values is based on measuring the reduction of the signal modulation between the location of the sound source, e.g. on stage, and the reception measurement position with octave center frequencies of 125 Hz up to 8000 Hz.
The authors proceeded on the assumption that not only reverberation and noise reduce the intelligibility of speech, but generally all external signals or signal changes that occur on the path from source to listener. For ascertaining this influence they employ the Modulation Transfer Function (MTF) for acoustical purposes. The available useful signal S (signal) is put into relation with the prevailing interfering signal N (noise). The determined modulation reduction factor m(F) is a factor that characterizes the interference with speech intelligibility:
( )( ) dB10
N/S2
101
1
8.13/RTF21
1Fm−
+
⋅⋅π+
=
F modulation frequency in Hz,
RT reverberation time in s, S/N signal/noise ratio in dB.
Modulation frequencies from 0.63 Hz to 12.5 Hz in third octaves are used for the calculation. In addition, the modulation transfer function is subjected to a frequency weighting (WMTF - weighted modulation transfer function), in order to achieve a complete correlation to speech intelligibility. In doing so, the modulation transfer function is divided into 7 frequency bands which are each modulated with the modulation frequency. This results in a matrix of 7 x 14= 98 modulation reduction factors mi.
In order to render this relatively time-consuming procedure to be practical so that it can be applied in "real-time operation", the RASTI-procedure (rapid speech transmission index) was developed from it in cooperation with the company Brüel & Kjaer [33]. The modulation transfer function here is calculated only for two octave bands (500 Hz and 2 kHz) that are especially important for the intelligibility of speech and for select modulation frequencies, i.e. in all for 9 modulation reduction factors mj.
To obtain the RASTI value the (apparent) effective signal-noise ratio X can be calculated afterwards from the modulation reduction factors mi :
∑=
=9
1iiX
91X dB
m1m
lg10Xi
ii ⎟⎟
⎠
⎞⎜⎜⎝
⎛−
=
EASERA Manual - Appendix - 24 -
(To obtain STI you have to consider all 98 mi values in this calculation).
According to definition the (RA)STI-value then is:
( )dB
dBXSTIRA30
15+=
(compare also IEC 60268-16:2003)
3.4.1.1. Subjective Assessment of the (Ra)STI Values
Based on the comparison of subjective examination results with a maximum possible intelligibility of syllables of 96%, the (RA)STI-values are graded in subjective values for syllable intelligibility according to the following table:
Syllable intelligibility (Ra)STI-valuepoor 0 to 0.3
satisfactory 0.3 to 0.45
good 0.45 to 0.6
very good 0.6 to 0.75
excellent 0.75 to 1.0
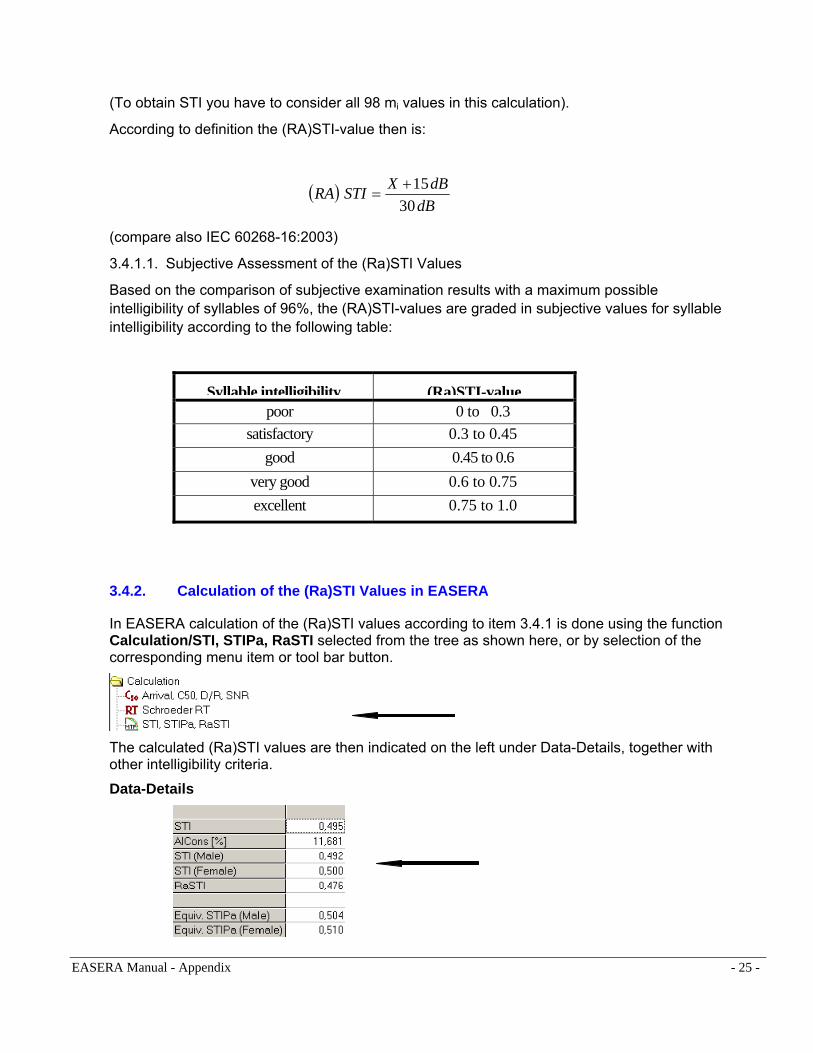
3.4.2. Calculation of the (Ra)STI Values in EASERA
In EASERA calculation of the (Ra)STI values according to item 3.4.1 is done using the function Calculation/STI, STIPa, RaSTI selected from the tree as shown here, or by selection of the corresponding menu item or tool bar button.
The calculated (Ra)STI values are then indicated on the left under Data-Details, together with other intelligibility criteria. Data-Details
EASERA Manual - Appendix - 25 -

3.5. Center Time ts according to KÜRER [2]
3.5.1. Measurement Basis
This quality criterion is relevant for speech intelligibility and musical clarity and measured and calculated according to KÜRER [2] using EASERA as follows:
( )
( )t
t p t dt
p t dtS =
⋅∞
∞
∫
∫
2
0
2
0
Anticipated Value In the „statistic“ sound field, i.e. for listener seats located at larger distance from the sound source (rx >> rH) the anticipated value ts,E for the center time ts according to KÜRER [2] is:
ms8.13
RTt E,s =
RT Reverberation time in ms
3.5.2. Subjective Assessment
A relationship between the (subjective) syllable intelligibility VS and the center time ts is given by KÜRER [2] by the following correlation rule:
( )V tS S= ⋅ − ⋅ −96 1 102 5 %
ts in ms
For a syllable intelligibility of VS ≥ 80 % the results according to the above-mentioned rule are ts ≤ 130 ms.
3.5.3. Subjective Assessment of the Frequency Dependence of the Center Time ts The higher the center time ts is, the more spatial is the acoustic impression at the listener's position. The maximum achievable center time ts is based on the optimum reverberation time. According to HOFFMEIER [24], there is a good correlation between center time and intelligibility of speech with a frequency evaluation of the 4 octaves bands 500 Hz, 1000 Hz, 2000 Hz and 4000 Hz.
For music, the desirable center time ts is: EASERA Manual - Appendix - 26 -
ts ≈ (70 to 150) ms with a 1000 Hz octave and for speech: ts ≈ (60 to 80) ms with four octaves between 500 Hz to 4000 Hz
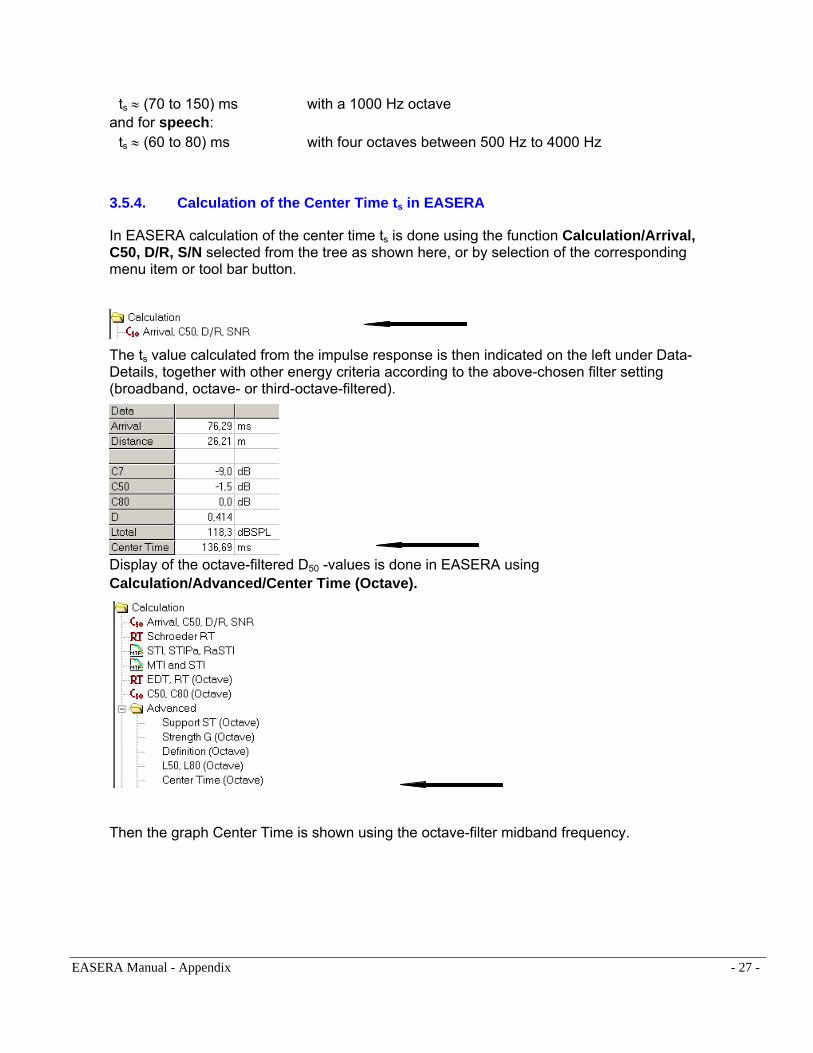
3.5.4. Calculation of the Center Time ts in EASERA
In EASERA calculation of the center time ts is done using the function Calculation/Arrival, C50, D/R, S/N selected from the tree as shown here, or by selection of the corresponding menu item or tool bar button.
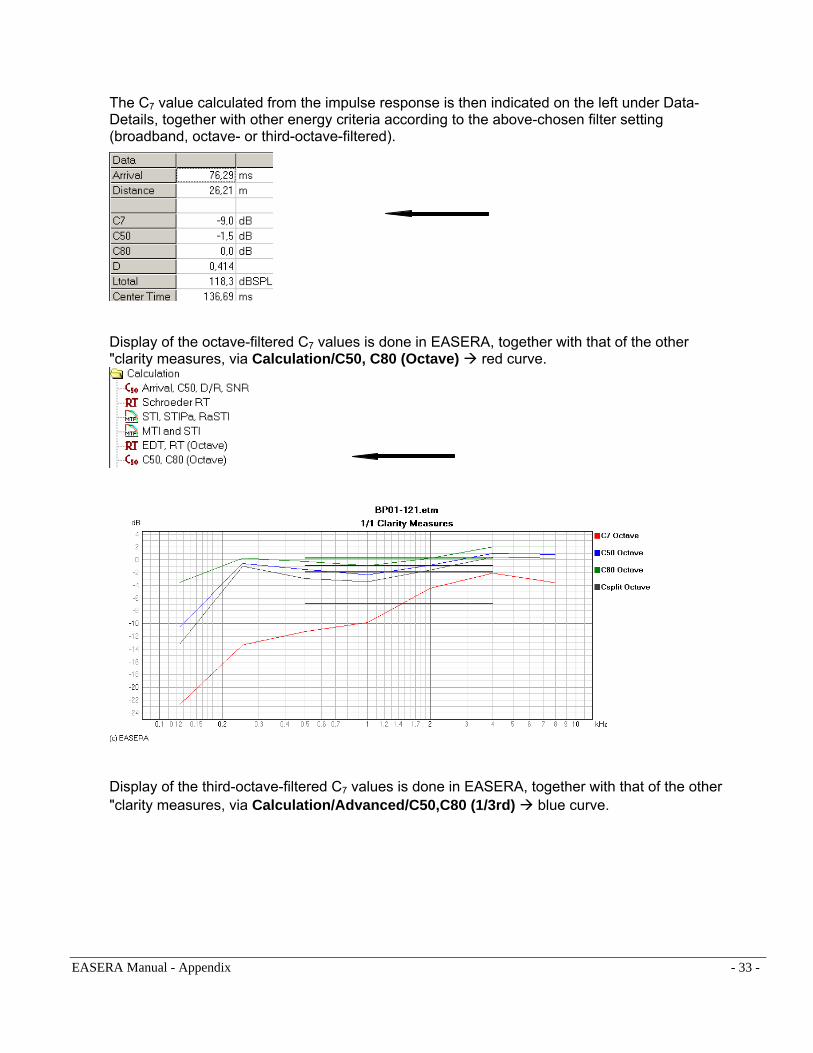
The ts value calculated from the impulse response is then indicated on the left under Data-Details, together with other energy criteria according to the above-chosen filter setting (broadband, octave- or third-octave-filtered).
Display of the octave-filtered D50 -values is done in EASERA using Calculation/Advanced/Center Time (Octave).
Then the graph Center Time is shown using the octave-filter midband frequency.
EASERA Manual - Appendix - 27 -

Display of the octave-filtered ts-values is done in EASERA using Calculation/Advanced/Center Time (1/3rd).
Then the graph Center Time is shown using the third-octave-filter midband frequency.
EASERA Manual - Appendix - 28 -

3.6. Echo criterion EKSpeech according to DIETSCH [8]
3.6.1. Measurement Basis In addition to the above-mentioned criteria, the reflection sequence is also of importance for assessing the acoustic overall impression of a room. The reflectograms show in which temporal sequence and with which intensity reflections arrive at a listener's position.
When planning a hall one tries to design the surfaces of the room in such a way that at all seats the reflections sequence is as uniform and dense as possible and that no high-energy late reflections (echoes) occur.
The designer examines the sound-pressure records as to whether this uniformity is given and whether the intensity of the reflections decreases along with the increasing temporal distance from the direct sound.
Strong reflections which in speech performances arrive later than 50 ms after the direct sound and which are not preceded by any or only few weaker reflections, are subjectively perceived by the ear as signals not related to the direct sound, i.e. as an echo.
According to KUHL [27] an Echo is defined as a subjectively „clearly audible repetition of the direct-sound phenomenon“.
A certain echo impression (but not in the sense proposed by KUHL) may also come about when low-energy groups of reflections occur at a late moment during the decay process. Such a phenomenon „amplifies“ the spatial impression in a certain way and may even be considered as positive in a room-acoustical sense.
The decision as to whether a group of reflections is an echo can frequently not be reached on the basis of the sound-pressure reflectogram, but only by assessing the behavior of the sound-level decay process at a receiving position. This is why not only the sound-pressure behavior over time is recorded and evaluated at a receiving position, but also the sound-level behavior and the sound intensity behavior.
A further possibility for recognizing echoes in the reflectograms is offered by the so-called DIETSCH criterion [8].
This is an echo criterion EK which DIETSCH calculates, differently weighted for speech and music performances, as follows:
( )E
sSpeech
tEKτ
τ∆
∆=
with:
( )( )
( )t
t p t dt
p t dts
n
nτ
τ
τ=∫
∫
0
0
EASERA Manual - Appendix - 29 -

For speech performances use these values:
∆τE = 9 ms
n = 2/3
EKlimit = 1
3.6.2. Subjective Assessment of the Echo criterion EKspeech and Frequency Dependence of the same
An echo occurs when EKmax > EKlimit.
If EKmax > EKlimit occurs periodically (periodicity 50 ms with speech, 80 to 100 ms with music), a flutter echo becomes audible.
With band-limited evaluation of the room impulse responses you have to keep in mind that especially the high-frequency signal components tend to cause echo disturbances.
According to DIETSCH [8] it is, however, sufficient to employ:
− for Speech: Test signals with a bandwidth of one octave and a midband frequency of fM = 1 kHz,
3.6.3. Calculation of EKspeech in EASERA
In EASERA calculation of EKspeech graphs in done based on the room impulse response using the function Time (Full IR)/Advanced/Echo Speech selected from the tree as shown here, or by selection of the corresponding menu item or tool bar button.
EASERA Manual - Appendix - 30 -

A frequency assessment does not take place, but the EKspeech graph is calculated from the broadband impulse response (Full IR) by default. The octave and third-octave filtered responses can also be viewed.
EASERA Manual - Appendix - 31 -

4 Seat- and Sound Source-related Listener Criteria with Music Performances
4.1. Direct Sound Level C7
4.1.1. Measurement Basis
This measure reflects the sound energy component of the direct sound in relation to the sound energy of the reflections and of the reverberation arriving after the direct sound at the listener position.
This measure is relevant for the subjective perception of "nearness" or "directness" of the sound sources (singers, orchestra register, soloists).
The measuring rule is [15]:
dBEE
Elog10C
7
7107 ⎟
⎟⎠
⎞⎜⎜⎝
⎛
−=
∞
made with monaural measurements using an omni-directional microphone K:
dt)t(pEmsx
0
2KK,x ∫=
the cumulative energy of the squared room impulse response [p2K(t)] until x ms after the direct
sound.
4.1.2. Subjective Assessment
The direct sound measure C7 should in correlation to the distance from the sound source - listener not fall below a range of -10 to -15 dB.
An assessment method for the frequency dependence of the direct sound level is not yet known.
4.1.3. Calculation of the Direct Sound Measure C7 in EASERA
In EASERA calculation of the direct sound measure is done based on the room impulse response using the function Calculation/Arrival, C50, D/R, S/N selected from the tree as shown here, or by selection of the corresponding menu item or tool bar button.
EASERA Manual - Appendix - 32 -
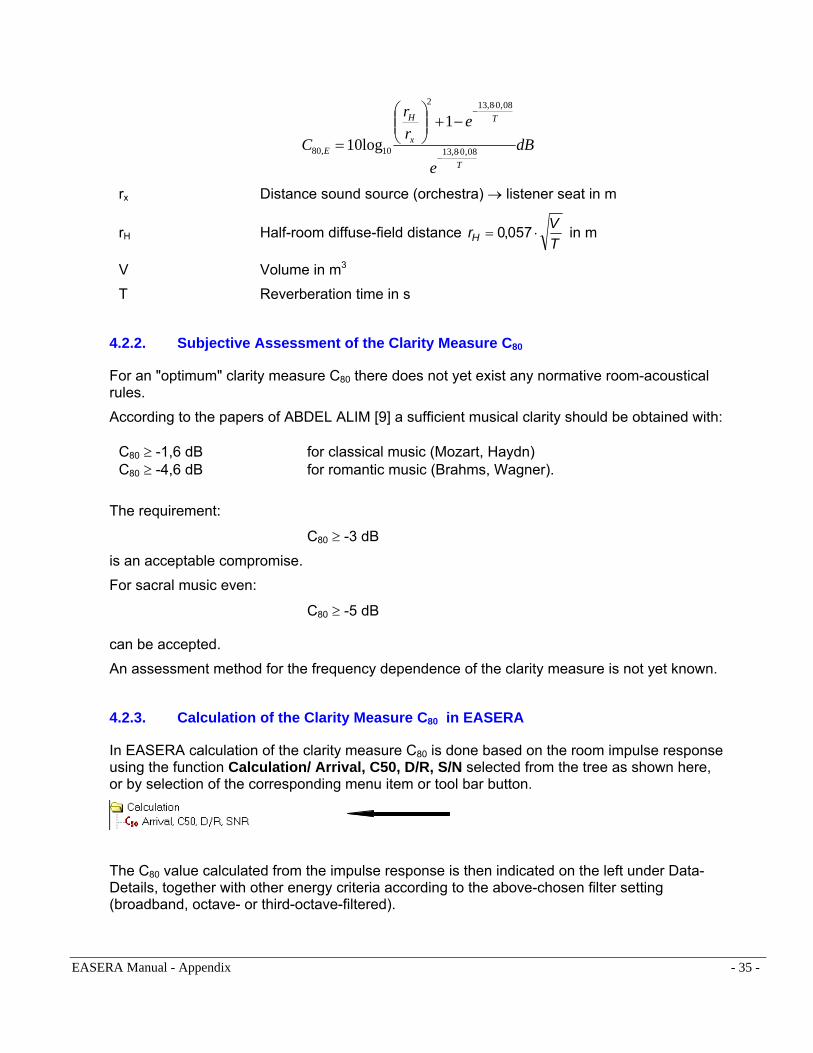
The C7 value calculated from the impulse response is then indicated on the left under Data-Details, together with other energy criteria according to the above-chosen filter setting (broadband, octave- or third-octave-filtered).
Display of the octave-filtered C7 values is done in EASERA, together with that of the other "clarity measures, via Calculation/C50, C80 (Octave) red curve.
Display of the third-octave-filtered C7 values is done in EASERA, together with that of the other "clarity measures, via Calculation/Advanced/C50,C80 (1/3rd) blue curve.
EASERA Manual - Appendix - 33 -

4.2. Clarity Measure C80 according to ABDEL ALIM [9]
4.2.1. Measurement Basis
The clarity measure C80 is relevant for temporal and the register clarity of music performance, especially of rapid musical passages. It is calculated from:
dBEE
EC ⎟⎟⎠
⎞⎜⎜⎝
⎛−
=∞ 80
801080 log10
Based on the assumption of a diffuse „statistical“ sound-field structure, the known room volume V and the predicted reverberation time T, it is possible to compute the anticipated value C80,E for the clarity measure C80 as a function of the distance from the sound source - listener seat (rx). The formula is:
EASERA Manual - Appendix - 34 -
dBe
err
CT
T
x
H
E 08,08,13
08,08,132
10,80
1log10 ⋅
−
⋅−
−+⎟⎟⎠
⎞⎜⎜⎝
⎛
=
rx Distance sound source (orchestra) → listener seat in m
rH Half-room diffuse-field distance r VTH = ⋅0 057, in m
V Volume in m3 T Reverberation time in s
4.2.2. Subjective Assessment of the Clarity Measure C80
For an "optimum" clarity measure C80 there does not yet exist any normative room-acoustical rules.
According to the papers of ABDEL ALIM [9] a sufficient musical clarity should be obtained with: C80 ≥ -1,6 dB for classical music (Mozart, Haydn) C80 ≥ -4,6 dB for romantic music (Brahms, Wagner). The requirement:
C80 ≥ -3 dB
is an acceptable compromise.
For sacral music even:
C80 ≥ -5 dB can be accepted.
An assessment method for the frequency dependence of the clarity measure is not yet known.
4.2.3. Calculation of the Clarity Measure C80 in EASERA
In EASERA calculation of the clarity measure C80 is done based on the room impulse response using the function Calculation/ Arrival, C50, D/R, S/N selected from the tree as shown here, or by selection of the corresponding menu item or tool bar button.
The C80 value calculated from the impulse response is then indicated on the left under Data-Details, together with other energy criteria according to the above-chosen filter setting (broadband, octave- or third-octave-filtered).
EASERA Manual - Appendix - 35 -
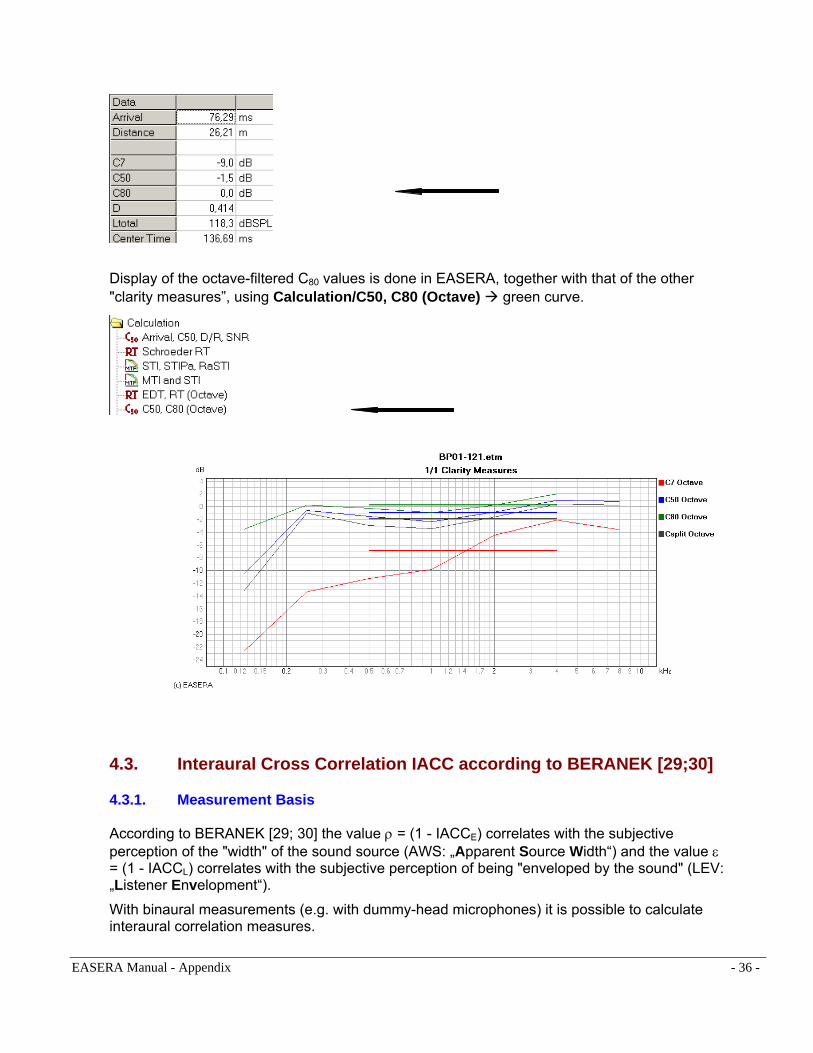
Display of the octave-filtered C80 values is done in EASERA, together with that of the other "clarity measures”, using Calculation/C50, C80 (Octave) green curve.
4.3. Interaural Cross Correlation IACC according to BERANEK [29;30]
4.3.1. Measurement Basis
According to BERANEK [29; 30] the value ρ = (1 - IACCE) correlates with the subjective perception of the "width" of the sound source (AWS: „Apparent Source Width“) and the value ε = (1 - IACCL) correlates with the subjective perception of being "enveloped by the sound" (LEV: „Listener Envelopment“).
With binaural measurements (e.g. with dummy-head microphones) it is possible to calculate interaural correlation measures.
EASERA Manual - Appendix - 36 -
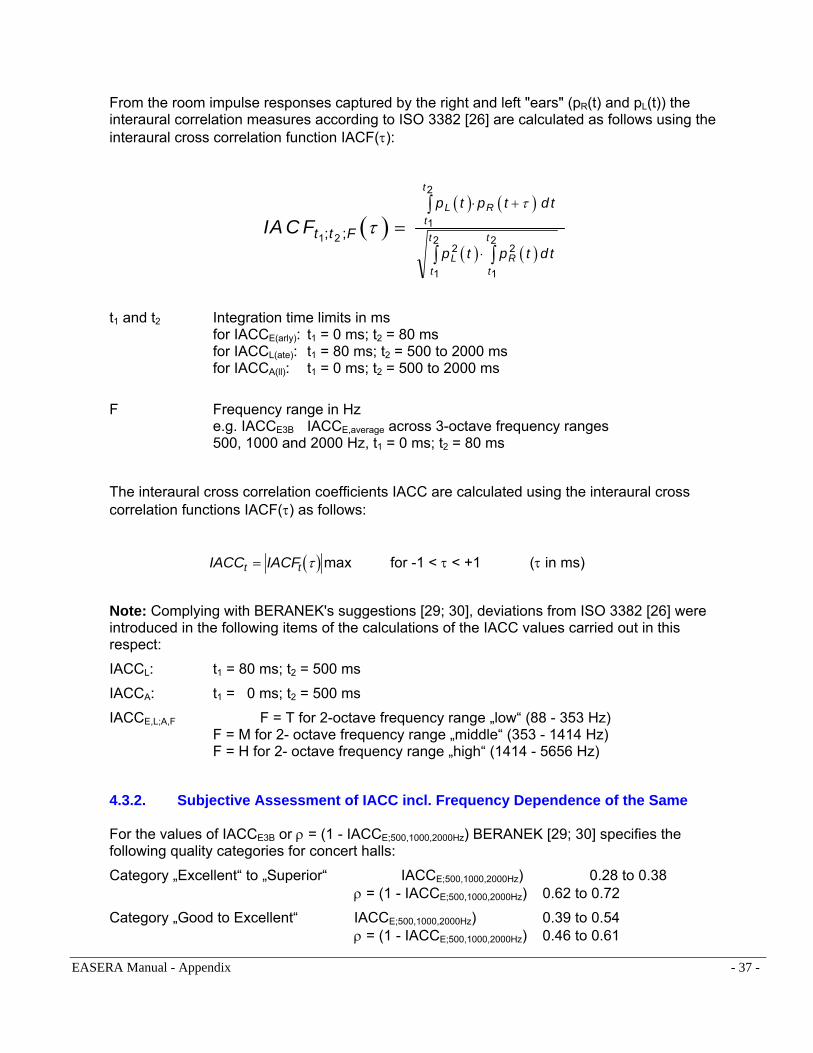
From the room impulse responses captured by the right and left "ears" (pR(t) and pL(t)) the interaural correlation measures according to ISO 3382 [26] are calculated as follows using the interaural cross correlation function IACF(τ):
( )
( ) ( )
( ) ( )IA C Ft t F
p t p t d t
p t p t d t
L Rt
t
L Rt
t
t
t1 21
2
2 2
1
2
1
2; ; ττ
=∫
∫∫
⋅ +
⋅
t1 and t2 Integration time limits in ms for IACCE(arly): t1 = 0 ms; t2 = 80 ms for IACCL(ate): t1 = 80 ms; t2 = 500 to 2000 ms for IACCA(ll): t1 = 0 ms; t2 = 500 to 2000 ms
F Frequency range in Hz e.g. IACCE3B IACCE,average across 3-octave frequency ranges 500, 1000 and 2000 Hz, t1 = 0 ms; t2 = 80 ms
The interaural cross correlation coefficients IACC are calculated using the interaural cross correlation functions IACF(τ) as follows:
( )IACC IACFt t= τ max for -1 < τ < +1 (τ in ms)
Note: Complying with BERANEK's suggestions [29; 30], deviations from ISO 3382 [26] were introduced in the following items of the calculations of the IACC values carried out in this respect:
IACCL: t1 = 80 ms; t2 = 500 ms
IACCA: t1 = 0 ms; t2 = 500 ms
IACCE,L;A,F F = T for 2-octave frequency range „low“ (88 - 353 Hz) F = M for 2- octave frequency range „middle“ (353 - 1414 Hz) F = H for 2- octave frequency range „high“ (1414 - 5656 Hz)
4.3.2. Subjective Assessment of IACC incl. Frequency Dependence of the Same
For the values of IACCE3B or ρ = (1 - IACCE;500,1000,2000Hz) BERANEK [29; 30] specifies the following quality categories for concert halls:
Category „Excellent“ to „Superior“ IACCE;500,1000,2000Hz) 0.28 to 0.38 ρ = (1 - IACCE;500,1000,2000Hz) 0.62 to 0.72
Category „Good to Excellent“ IACCE;500,1000,2000Hz) 0.39 to 0.54 ρ = (1 - IACCE;500,1000,2000Hz) 0.46 to 0.61
EASERA Manual - Appendix - 37 -
Category „Fair to Good“ IACCE;500,1000,2000Hz) 0.55 to 0.59 ρ = (1 - IACCE;500,1000,2000Hz) 0.41.. 0.45
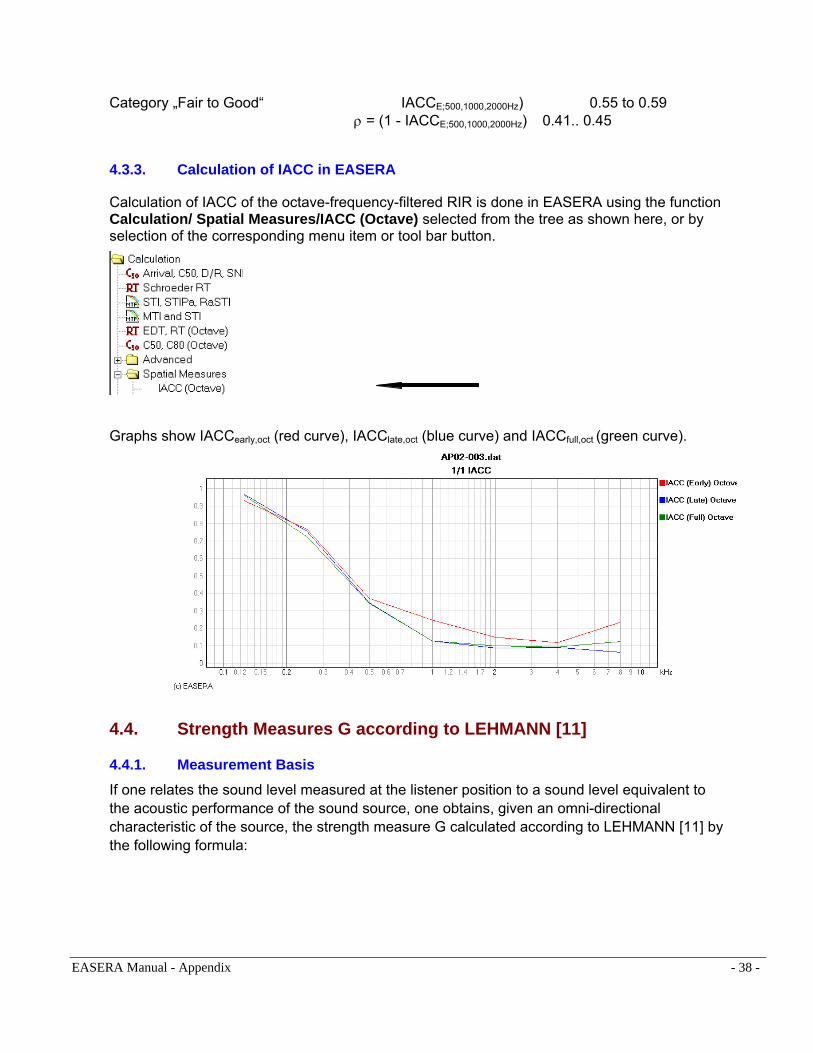
4.3.3. Calculation of IACC in EASERA
Calculation of IACC of the octave-frequency-filtered RIR is done in EASERA using the function Calculation/ Spatial Measures/IACC (Octave) selected from the tree as shown here, or by selection of the corresponding menu item or tool bar button.
Graphs show IACCearly,oct (red curve), IACClate,oct (blue curve) and IACCfull,oct (green curve).
4.4. Strength Measures G according to LEHMANN [11]
4.4.1. Measurement Basis If one relates the sound level measured at the listener position to a sound level equivalent to the acoustic performance of the sound source, one obtains, given an omni-directional characteristic of the source, the strength measure G calculated according to LEHMANN [11] by the following formula:
EASERA Manual - Appendix - 38 -

( )
( )dB
ms
dttsp
dttxpG ms ⎟⎟
⎠
⎞⎜⎜⎝
⎛−
⋅=
∫
∫∞
2
2
7
0
2
0
2
10 4log10,
,log10 π
γ
s Reference distance (approx. 10 m)
x Distance of the measuring position from the sound source, in m
γ Front-to-Random factor of the sound source ( )= ratio of the sound-pressure square in the main radiation direction to that which would result with omni-directional uniform radiation at the same distance and with equal overall performance of the sound source). Measurements made with a (non-directional) dodecahedron loudspeaker produced γ ≈ 1.
Note:
Provided the acoustic output of the source remains constant over the time which a measurement series runs, a one-off measurement of the same before starting the series (if need be also a control measurement after conclusion of the series) is sufficient.
4.4.2. Subjective Assessment of the Strength Measure G and Frequency Dependence of the Same
For the strength measure G the recommendation is for G ≥ 0 dB (in the mean frequency range of 500 to 1000 Hz).
An assessment method for the frequency dependence of the strength measures is not yet known.
4.4.3. Calculation of the Strength Measure G in EASERA Calculation and display of the octave-filtered strength measures is done in EASERA via Calculation/Advanced/Strength G (Octave) selected from the tree as shown here, or by selection of the corresponding menu item or tool bar button.
EASERA Manual - Appendix - 39 -
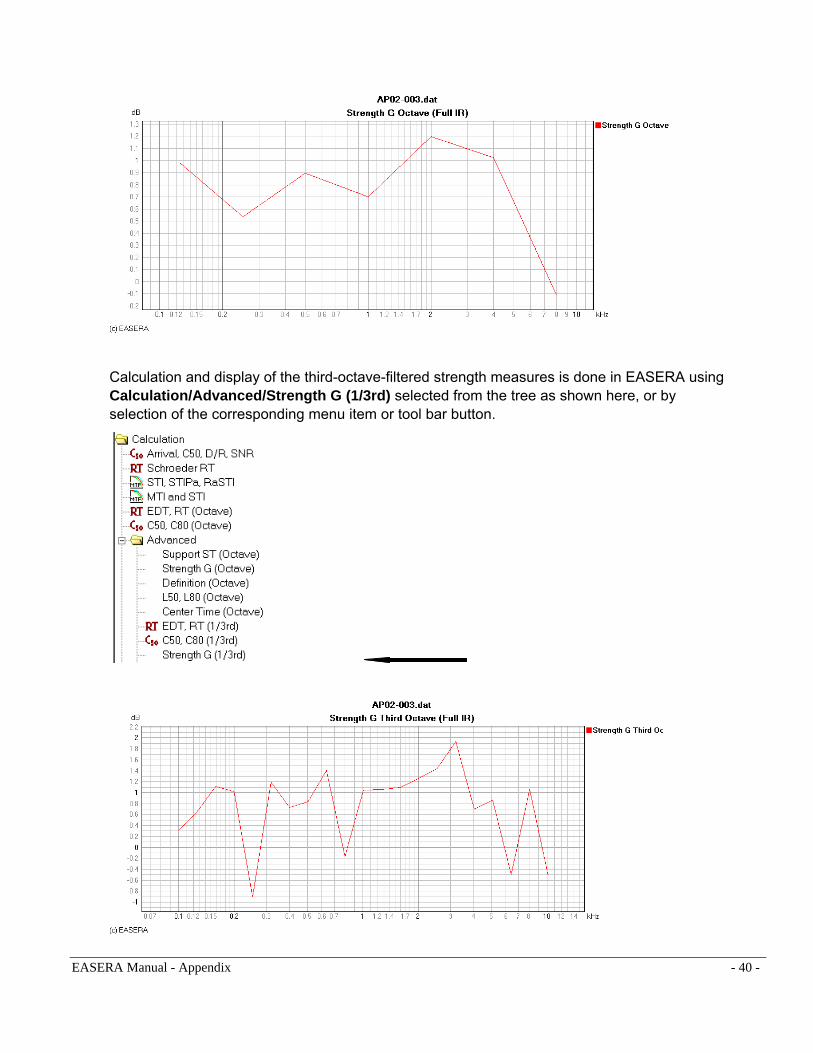
Calculation and display of the third-octave-filtered strength measures is done in EASERA using Calculation/Advanced/Strength G (1/3rd) selected from the tree as shown here, or by selection of the corresponding menu item or tool bar button.
EASERA Manual - Appendix - 40 -

5 Room- or Seat-related Criteria 5.1. Reverberance Measure R according to BERANEK [16]
5.1.1. Measurement Basis
The reverberance measure R is with music performances relevant for the acoustic liveness or "reverberance" of the acoustic impression.
The formula is:
dBE
EER ⎟⎟⎠
⎞⎜⎜⎝
⎛ −= ∞
50
5010log10
Based on the assumption of a diffuse „statistical“ sound-field structure, the known room volume V and the predicted reverberation time RT, it is possible to compute the anticipated value RE for the reverberance measure R as a function of the distance from the sound source - listener seat (rx). The formula is:
dB
e1rr
elog10RRT
05.08.132
x
H
RT05.08.13
10E ⋅−
⋅−
−+⎟⎟⎠
⎞⎜⎜⎝
⎛=
rx Distance sound source (orchestra) → listener seat in m
rH Half-room diffuse-field distance TV057.0rH ⋅= in m
V Volume in m3
RT Reverberation time in s
5.1.2. Subjective Assessment Reverberance Measure
According to the papers of BERANEK and SCHULTZ [16], the values for the reverberance measure should be within the range of:
+6 dB ≥ R ≥ +2 dB.
An assessment method for the frequency dependence of the reverberance measure is not yet known.
EASERA Manual - Appendix - 41 -

5.1.3. Calculation of the Reverberance Measure R in EASERA
Calculation of the reverberance measure R is not explicitly implemented in EASERA.
The reverberance measure R may, however, be easily calculated on the basis of C50 through the relationship
R = - C50
5.2. Lateral Efficiency LE according to JORDAN [18] and
Lateral Fraction LF according to BARRON [20]
5.2.1. Measurement Basis
The objective measure defined by JORDAN [18] for the acoustic overall impression of a room is calculated as:
)80...0)(()80...25(msallSidesytotalEnerg
msrgylateralEneLE =
According to BARRON [20] it is the sound reflections arriving from the side at a listener's position within a time window from 5 ms to 80 ms that are responsible for the acoustically perceived extension of the musical sound source (contrary to JORDAN who considers a time window from 25 ms to 80 ms).
BARRON [20] calls the Lateral Efficiency LE according to JORDAN [18] Lateral Energy Fraction LF giving the following formula:
80
BI5BI80
EEE
LF−
=
Ex BI Sound energy component, measured with a bi-directional (figure8) microphone (gradient microphone).
For the subjective assessment of the apparent extension of a musical sound source, e.g. on stage, the early sound reflections arriving at a listener's seat from the side are of greatest importance, as compared with all other directions. Therefore the ratio between the laterally arriving sound energy components and those arriving from all sides, each within a time of up to 80 ms, is determined and its tenfold logarithm is calculated.
If one multiplies the arriving sound reflections with cosΦ, with Φ being the angle between the direction of the sound source and that of the arriving sound wave, one achieves the more important evaluation of the lateral reflections. With measurements this angle-dependent evaluation is achieved by employing a microphone with bi-directional characteristics.
The higher the lateral efficiency, the acoustically broader the sound source appears.
EASERA Manual - Appendix - 42 -
For obtaining a uniform representation of the energy measures in room acoustics, LE and LF can also be defined as lateral efficiency measure LEM = 10 Iog LE dB and as lateral energy fraction measure LFM = 10 Iog LF dB, respectively.
Note
The overall measurement of e.g. a concert hall with diverse microphone arrangements such as the combination of omni-directional and figure 8 microphone and dummy-head microphone is frequently not possible for time and financial reasons.
Thus it stands to reason to content oneself with only one microphone arrangement for a complete measurement run.
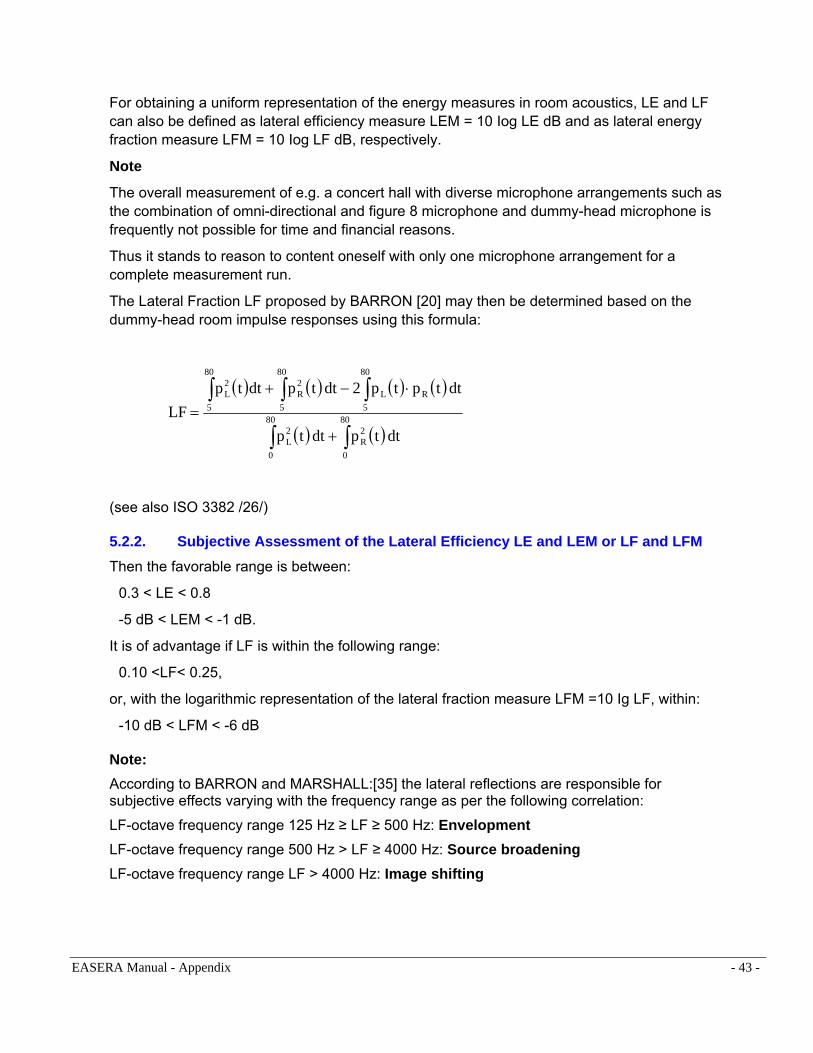
The Lateral Fraction LF proposed by BARRON [20] may then be determined based on the dummy-head room impulse responses using this formula:
( ) ( ) ( ) ( )
( ) ( )∫ ∫
∫ ∫∫
+
⋅−+= 80
0
80
0
2R
2L
80
5
80
5RL
80
5
2R
2L
dttpdttp
dttptp2dttpdttpLF
(see also ISO 3382 /26/)
5.2.2. Subjective Assessment of the Lateral Efficiency LE and LEM or LF and LFM Then the favorable range is between:
0.3 < LE < 0.8
-5 dB < LEM < -1 dB.
It is of advantage if LF is within the following range:
0.10 <LF< 0.25,
or, with the logarithmic representation of the lateral fraction measure LFM =10 Ig LF, within:
-10 dB < LFM < -6 dB
Note: According to BARRON and MARSHALL:[35] the lateral reflections are responsible for subjective effects varying with the frequency range as per the following correlation:
LF-octave frequency range 125 Hz ≥ LF ≥ 500 Hz: Envelopment LF-octave frequency range 500 Hz > LF ≥ 4000 Hz: Source broadening
LF-octave frequency range LF > 4000 Hz: Image shifting
EASERA Manual - Appendix - 43 -
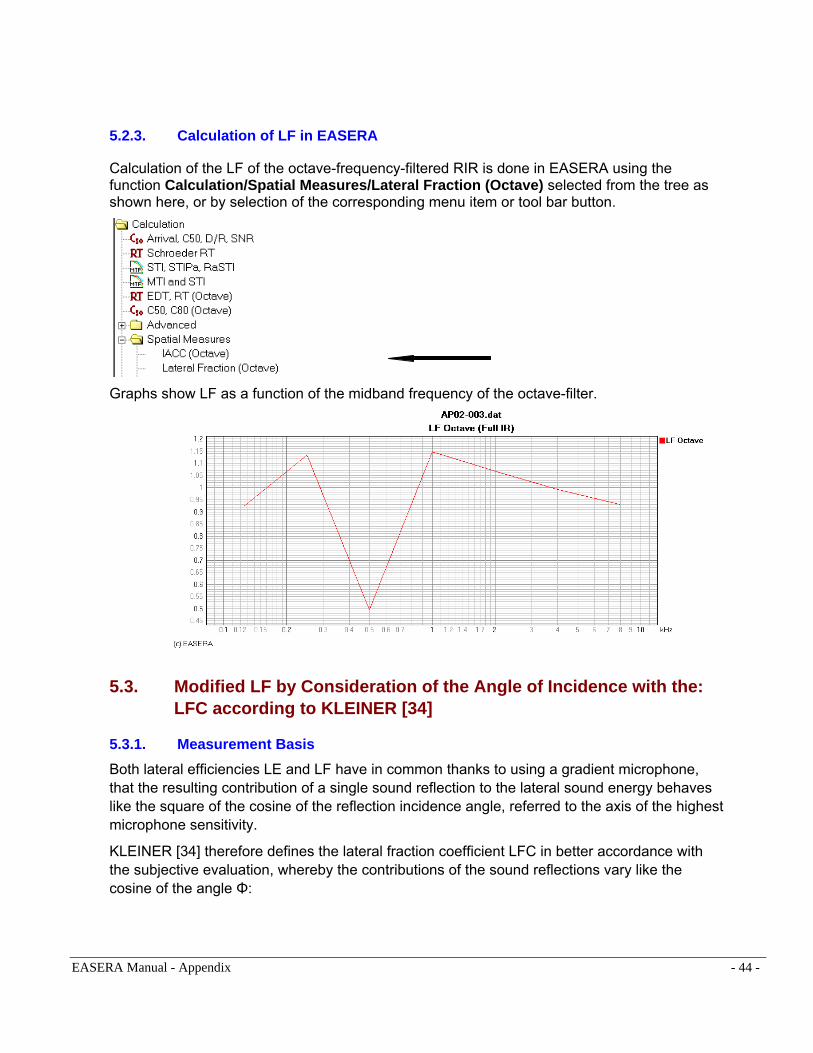
5.2.3. Calculation of LF in EASERA
Calculation of the LF of the octave-frequency-filtered RIR is done in EASERA using the function Calculation/Spatial Measures/Lateral Fraction (Octave) selected from the tree as shown here, or by selection of the corresponding menu item or tool bar button.
Graphs show LF as a function of the midband frequency of the octave-filter.
5.3. Modified LF by Consideration of the Angle of Incidence with the: LFC according to KLEINER [34]
5.3.1. Measurement Basis Both lateral efficiencies LE and LF have in common thanks to using a gradient microphone, that the resulting contribution of a single sound reflection to the lateral sound energy behaves like the square of the cosine of the reflection incidence angle, referred to the axis of the highest microphone sensitivity.
KLEINER [34] therefore defines the lateral fraction coefficient LFC in better accordance with the subjective evaluation, whereby the contributions of the sound reflections vary like the cosine of the angle Φ:
EASERA Manual - Appendix - 44 -
( ) ( )
80
80
0BI
E
dttptpLFC
∫ ⋅=
(see also ISO 3382 /26/)
5.3.2. Subjective Assessment of LFC Though a subjective assessment is not known explicitly, it can be assumed, however, that the ranges mentioned under 5.2.2 for LE and LF are by approximation applicable also to LFC.
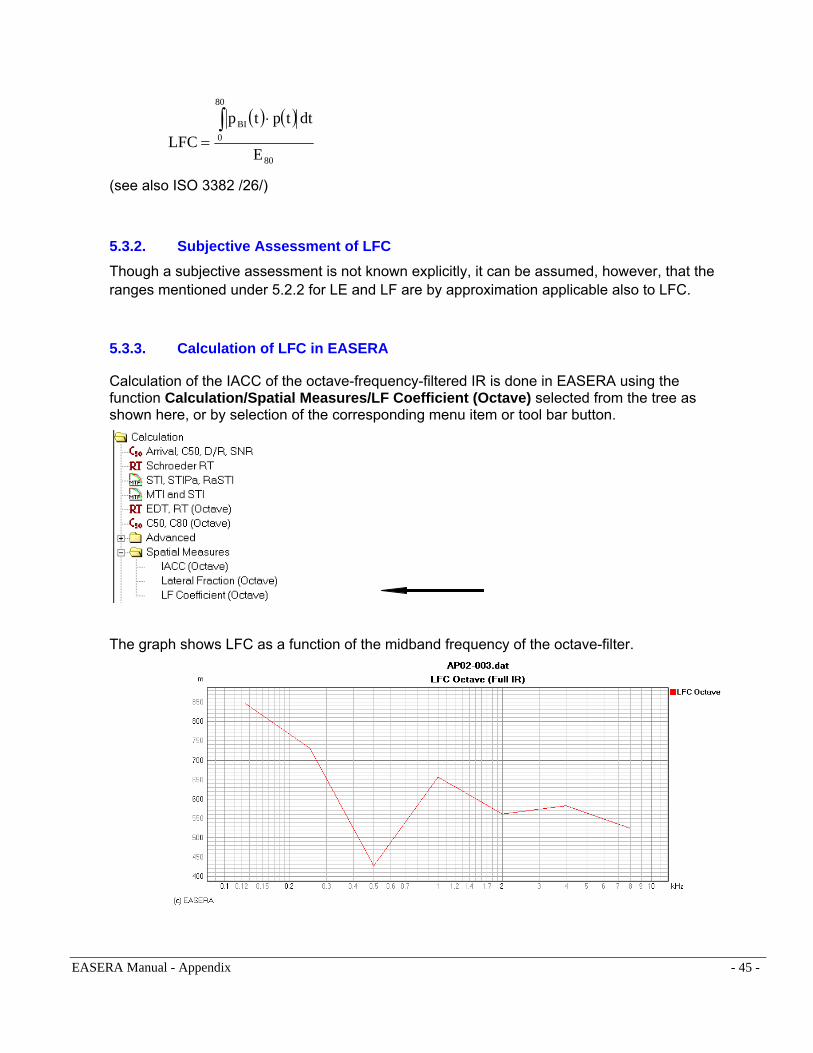
5.3.3. Calculation of LFC in EASERA
Calculation of the IACC of the octave-frequency-filtered IR is done in EASERA using the function Calculation/Spatial Measures/LF Coefficient (Octave) selected from the tree as shown here, or by selection of the corresponding menu item or tool bar button.
The graph shows LFC as a function of the midband frequency of the octave-filter.
EASERA Manual - Appendix - 45 -

5.4. Echo Criterion EKmusic according to DIETSCH [8]
5.4.1. Measurement Basis
See clause 3.6: Echo Criterion EKspeech,
5.4.2. Subjective Assessment of the Echo Criterion EKmusic and its Frequency Dependence
An echo occurs when EKmusic,max > EKmusic,limit .
For musical performances use these values:
∆τE = 14 ms
n = 1
Mozart (most critical motive) EKmusic,limit = 1.8 to 2 Piano music EKmusic,limit = 3 "Sustained" music (Wagner) EKmusic,limit = 7
If EKmax > EKlimit occurs periodically (periodicity 80 to 100 ms with music), a flutter echo becomes audible.
With band-limited evaluation of the room impulse responses one has to keep in mind that especially the high-frequency signal components tend to cause echo disturbances.
According to DIETSCH [8] it is, however, sufficient to employ:
− for Music: Test signals with a bandwidth of two octaves and a midband frequency of fM = 1.4 kHz.
5.4.3. Calculation of EKmusic in EASERA
Calculation of the of the EKmusic –graphs from the room impulse response is done in EASERA using the function Time (Full IR)/Advanced/Echo Music selected from the tree as shown here, or by selection of the corresponding menu item or tool bar button.
EASERA Manual - Appendix - 46 -

EKMusic –graph
A frequency assessment does not take place, but the EKmusic –graph is calculated from the broadband impulse response (Full IR) by default. The octave and third-octave filtered responses can also be viewed.
EASERA Manual - Appendix - 47 -

6 Musicians' Criteria 6.1. Mutual Hearing (Monitoring) - Early Ensemble Level EEL
according to GADE [16;17]
6.1.1. Measurement Basis According to GADE [16; 17], the energy measure EEL is considered as a measure for the "mutual hearing" among the musicians.
It is calculated by:
dBE
Elog10EEL
)m1(ms5
)ms80...0(x10⋅=
In this case Ex(0 to 80 ms) is the accumulative sound energy measured in the receiver-source position coupling (x) until 80 ms after the direct sound, referred to the direct sound energy E5ms(1 m) measured at 1 m distance from the sound source.
6.1.2. Subjective assessment of EEL and Frequency Dependence of the same Investigations by GADE in 14 European concert halls have revealed that the EEL values at middle frequencies (500…1000 Hz) lie in the range of EEL = -15 dB to -10 dB. A quantitative correlation of these values to the quality of mutual hearing can not yet be established. This applies also to the frequency dependence of the EEL values.
6.2. Room Support ST1(2) according to GADE [16; 17]
6.2.1. Measurement Basis The energy measures ST1 and ST2 are regarded, according to GADE [11], as measures for the acoustical (subjective) perception of the musicians that the room „answers“, „carries“ or supports the playing.
They are calculated as:
( ) ( ) dBE
EST
mms
msx
)1(5
)200100...20(10log1021 =
In this case Ex(20 to 100 ms) is the accumulative acoustic energy measured at 1 m distance from the musician's location x within the period from 20 to 100ms or 200ms after the direct sound, referred to the direct acoustic energy E5ms(1 m) (measured at 1 m distance).
EASERA Manual - Appendix - 48 -

6.2.2. Subjective assessment of ST1(2) and it’s Frequency Dependence Typical ST1 values measured on the platforms of 14 European concert halls by GADE [23] lie within a range of:
-15 dB < ST1 <-12 dB.
A quantitative correlation of these values to the quality of room support can not yet be established. This applies also to the frequency dependence of the ST1(2) values.
6.2.3. Calculation of ST1(2) in EASERA
Calculation of the of the ST1(2) –graphs from the room impulse response is done in EASERA using the function Calculation/Advanced/Support ST (Octave) selected from the tree as shown here.
Graphs show ST1(2) as a function of the midband frequency of the octave-filter
EASERA Manual - Appendix - 49 -

EASERA Manual - Appendix - 50 -
7 Bibliography
[1] THIELE, R. Die Richtungsverteilung und Zeitfolge der Schallrückwürfe in Räumen (Directional distribution and time sequence of sound reflections in rooms) Acustica, Vol. 1 (1956); p. 31
[2] KÜRER, R.: Einfaches Messverfahren zur Bestimmung der „Schwerpunktzeit“ raumakustischer Impulsantworten (A simple measuring procedure for determining the "center time" of room acoustical impulse responses) 7th Intern. Congress on Acoustics, Budapest 1971
[3] AHNERT, W.; Akustik in Kulturbauten (Acoustics in cultural buildings) SCHMIDT, W.: Institut für Kulturbauten, Berlin 1980
[4] STEENEKEN, H.J.M., A physical Method for measuring Speech HOUTGAST, T. Transmission Quality J. Acoust. Soc. Am. Vol. 19 (1980),
[5] HOUTGAST, T., A review of the MTF concept in room acoustics and its STEENEKEN, H.J.M.: use for estimating speech intelligibility in auditoria J. Acoust. Soc. Amer. 77 (1985), pp. 1060-1077
[6] PEUTZ, V.M.A. Articulation Loss of Consonants as a Criterion for Speech Transmission in a Room J. Audio Eng. Soc. Vol 19, pp. 915 - 919
[7] PEUTZ, V.M.A. Articulation Loss of Consonants influenced by Noise, KLEIN, W. Reverberation and Echo Acust. Soc. Netherlands, Vol 28, pp. 11 – 18
[8] DIETSCH, L. Ein objektives Kriterium zur Erfassung von KRAAK, W.: Echostörungen bei Musik- und Sprachdarbietungen (An objective criterion for capturing echo disturbances with music and speech performances) Acustica 60 (1986), p 205
[9] ABDEL ALIM, O.: Abhängigkeit der Zeit- und Register- durchsichtigkeit von raumakustischen Parametern bei Musikdarbietungen (Dependence of time and register definition of room acoustical parameters with music performances) Dissertation, TU Dresden 1973

EASERA Manual - Appendix - 51 -
[10] de V. KEET, W.: The influence of early reflections on the Spatial Impression 6. ICA-Kongreß, Tokyo 1968, E 2 - 4
[11] LEHMANN, P.: Über die Ermittlung raumakustischer Kriterien und deren Zusammenhang mit subjektiven Beurteilungen der Hörsamkeit (On the ascertainment of room acoustical criteria and correlation of the same with subjective assessments of the acoustic overall impression) Dissertation TU Berlin, 1976
[12] BLAUERT, J.: Räumliches Hoeren (Spatial hearing). The MIT Press, Cambridge, Massachusetts and London/England 1983
[13] BLAUERT, J.: Nachschrift zu "Räumliches Hören" Neue Ergebnisse und Trends seit 1972 Postscript to "Spatial hearing" New results and trends since 1972) Bochum 1982
[14] TENNHARDT, H.P. Modellmessverfahren für Balanceuntersuchungen am Beispiel der Projektierung des Großen Saales im Neuen Gewandhaus Leipzig (Model measuring procedures for balance investigations by the example of the great hall in the Neues Gewandhaus Leipzig) Acustica 50 (1984), 127
[15] SCHMIDT, W.: Raumakustische Kriterien für Musik und Sprache (Room acoustical criteria for music and speech) Chapter 9.1 in Taschenbuch Akustik Verlag Technik Berlin 1984
[16] BERANEK, L. L., Some recent experiences in the design and testing SCHULTZ, T. J.: of concert halls with suspended panel arrays Acustica 15 (1965), 307
[17] DANILENKO, L.: Binaurales Hören im nichtstationären diffusen Schallfeld (Binaural hearing in the non-stationary diffuse sound field) Dissertation TH Aachen 1967
[18] JORDAN, V. L.: Acoustical design of concert halls and theaters Applied Science Publishers Ltd. 1980
EASERA Manual - Appendix - 52 -
[19] KÜRER, R. Integrationsverfahren zur Nachhallauswertung KURZE, A.: (Integration procedure for evaluating reverberation) Acustica 19 (1967/68), p. 313
[20] BARRON, M.: Auditorium Acoustics and Architectural Design Verlag E & FN SPON London 1993
[21] GADE, A.C.: Investigations of musicians' room-acoustic conditions in concert halls. Part I: Methods and laboratory experiments Acustica 69 (1989), p 193
[22] GADE, A.C.: Investigations of musicians' room-acoustic conditions in concert halls. Part II: Field experiments and synthesis of results Acustica 69 (1989), S. 249
[23] GADE, A.C.: Acoustical survey of eleven European concert halls The Acoustics Laboratory, Technical University of Denmark Report No. 44, 1989
[24] HOFFMEIER, J.:: Untersuchungen zum Einfluß von Raumklang- färbungen auf die Deutlichkeit von Sprache (Investigations on the influence of room timbres on speech definition) Technical University of Denmark Thesis for a degree at the TU Dresden, 1996
[25] SCHROEDER, M.R.: New method of measuring reverberation time JASA 38 (1965), S. 329 and 40, S. 549
[26] ISO 3382 „Measurement of the Reverberation Time of Rooms with Reference to other acoustical Parameters“, Annex B: „Binaural Auditorium Measures derived from Impulse Responses“
[27] KUHL, W.: In der Raumakustik benutzte hörakustische Termini (Audio acoustical terms used in room-acoustics) Acustica 39 (1977), S. 57
[28] KUHL, W.: Räumlichkeit als Komponente des Raumeindrucks (Spaciousness as a component of spatial impression) Acustica 40 (1978) pp. 167 ff.
[29] BERANEK, L. L.: Music, Acoustics and Architecture John Wiley and Sons New York, London 1962

EASERA Manual - Appendix - 53 -
[30] BERANEK, L. L.: Concert and Opera Halls -How they Sound- Acoustical Society of America 1996
[31] GOTTLOB, D.: Vergleich objektiver akustischer Parameter An Konzertsälen mit Ergebnissen subjektiver Untersuchungen (Comparison of objective acoustic parameters in concert halls with the results of subjective investigations) Dissertation A, Göttingen 1973
[32] AHNERT, W. Acoustics for Auditoriums and Concert Halls, in TENNHARDT, H.-P.: Glen Ballou, Handbook for SOUND ENGINEERS, Focal Press Boston 2002
[33] Bruel & Kjaer: RASTI-Sprachübertragungsmesser Typ 3361 (RASTI speech transmission meter type 361) Specification Sheet Fa. Brüel & Kjær
[34] KLEINER, M.: A New Way of Measuring Lateral Energy Fractions App. Acoust., Vol. 27, 321 ff (1989).
[35] BARRON, M. Spatial impression due to early lateral reflections in MARSHALL: concert halls: The derivation of a physical measure Journal of Sound and Vibration 1981 77(2), 211-231
[36] AHNERT, W. Grundlagen der Beschallungstechnik, REICHARDT, W.: S. Hirzel Verlag Stuttgart 1981
[37] KUTTRUFF, H.: Room Acoustics, E&FN SPON, London, 2000
[38] MEYER: J.: Akustik und musikalische Aufführungspraxis. Verlag Erwin Bochinsky Frankfurt am Main, 1999.
[39] AHNERT, W., Sound Reinforcement Engineering, Fundamentals STEFFEN, F.: and Practice, E&FN SPON, London, 2000