fundamentals of the prescription drug market
TRANSCRIPT

NHPF Background PaperAugust 24, 2004
Fundamentals of thePrescription Drug MarketChristie Provost Peters, Consultant
OVERVIEW — This background paper is a primer on the prescription drugmarket. It provides information on the fundamentals of the pharmaceuticalindustry and various marketplace stakeholders, including manufacturers,retailers, consumers, regulators, researchers, and purchasers. This paper alsoexamines the various ways the federal government interacts with the phar-maceutical market. Due to the breadth of material addressed, some complexissues and relationships are presented in broad conceptual terms withoutextensive technical detail.

2
NHPF Background Paper August 24, 2004
National Health Policy Forum2131 K Street NW, Suite 500Washington DC 20037
202/872-1390202/862-9837 [fax][email protected] [e-mail]www.nhpf.org [web]
Judith Miller JonesDirector
Sally CoberlyDeputy Director
Monique MartineauPublications Director
NHPF is a nonpartisan education andinformation exchange for federalhealth policymakers.
Contents
MARKET DYNAMICS ...................................................................... 4
Growth Trends.............................................................................. 4Table 1: U.S. Prescription Drug Sales Growth Rate ........................ 4
Top Performers ............................................................................. 5
Table 2: Ten Leading Corporations Ranked by Total U.S.Sales (in billions of dollars) and U.S. Dispensed Prescriptions(in millions), 2003 ....................................................................... 6
Research and Development .......................................................... 7Marketing .................................................................................. 10
Figure 1: Total Promotional Spending (in billions of dollars) in the
United States by Type ............................................................... 11Growth of Generic Drugs ........................................................... 13
Table 3: Patent Expiration Dates for Five Top-Selling Prescription
Drugs (in billions of dollars) ....................................................... 14A Complicated Marketplace ....................................................... 15
FEDERAL GOVERNMENT ............................................................... 19Regulation .................................................................................. 19
Research..................................................................................... 22
Purchasing.................................................................................. 24
NEW CHALLENGES ....................................................................... 28
ENDNOTES ................................................................................... 29
APPENDIX 1: Glossary ................................................................... 33
APPENDIX 2: Legislation Guide ..................................................... 34

3
NHPF Background Paper August 24, 2004
Fundamentals of thePrescription Drug Market
For millions of Americans, prescription drugs save lives, ease suffering,reduce disability, and restore vitality. Vaccines have virtually eliminatedthe threat of horrible diseases, such as polio, diphtheria, and whoopingcough, that once made childhood a more precarious time of life. Pro-tease inhibitors can commute the death sentence that HIV infection onceconferred; antipsychotic medications allow many mentally ill personsto live full, productive lives in their communities; and beta blockers canhelp prevent repeated heart attacks. These are only a few examples ofthe many medical “miracles” that have built the public’s faith in andexpectations for pharmaceutical interventions.
The history of pharmaceuticals is replete with success stories, but pre-scription drug products and the miracles they enable come with a heftyprice tag. In 2002, over $160 billion was spent on prescription drugs inthe United States, representing a fourfold increase since 1990.1 Alreadyhigh costs of prescription drugs continue to rise, alarming consumers,motivating private and public purchasers to establish aggressive costcontrol measures, and stimulating Congress to enact major policychanges. Although the importance of prescription drugs to modernmedicine is well accepted, some critics question whether current spend-ing levels and prescribing patterns are an efficient use of the alreadystretched health care dollar.
Though the factors driving the growth of prescription drug spending andthe impact of such growth on coverage and access are a source of debate,few question the benefits of a robust, innovative pharmaceutical market.New pharmaceutical treatments and those in development offer hope tothe sick and may ultimately reduce the burden of disease. Prescriptiondrugs can facilitate cost-effective management of chronic illnesses andmay potentially minimize “downstream” costs associated with hospital-izations and other health crises. Advances in science such as gene therapy,cell regeneration, therapeutic cloning, and the completion of the humangenome sequencing provide hope for the prevention and treatment ofdisease in the future.
Policy efforts to influence the pharmaceutical market are complex and con-tentious, as with any high-stakes endeavor. The narrow passage of theMedicare Prescription Drug, Improvement, and Modernization Act (MMA)of 2003 and the continuing debate over the importation of prescription drugsreflect the strongly held—and often conflicting—views and interests ofpatients, providers, payers, manufacturers, researchers, regulators, and

4
NHPF Background Paper August 24, 2004
investors. This paper does not attempt to mediate these interests oradvocate for any of these perspectives; it is intended to provide a de-scriptive overview of the prescription drug market, examine the roles ofthe various parties that contribute to this market dynamic, and alert thereader to disputed issues.
MARKET DYNAMICS
Growth Trends
Although they account for a relatively small portion of total healthspending, expenditures for prescription drugs are growing faster thanany other major health care sector. Hospital and physician services rep-resent the largest shares of total health care spending: 31 percent and 22percent of total expenditures, respectively. Although spending on pre-scription drugs has been a distant third, accounting for 11 percent oftotal U.S. health care spending in 2002,2 it grew by 15.3 percent in 2002—an increase that far outpaced spending increases in hospital (9.5 per-cent) and physician (7.7 percent) services.3 Analysts expect this trend tocontinue over the next 10 years.
Increases in both utilization and price contribute to the recent growth inprescription drug spending, although the relative contribution of eachis unclear. Utilization increases have been attributed to a wide varietyof factors, including the growth in the number of elderly persons, theintroduction of new drug products, the marketing practices of manu-facturers, and the increase in consumer awareness and empowerment.The rationale behind the large increase in prescription drug use is hotlydebated, and conclusive evidence pinpointing the driving factorsremains elusive. The extent to which price increases spur overall spend-ing increases is also controversial. Many contend that the introductionof new drug products—often significantly more expensive than the prod-ucts they replace—is at least partially responsible for the growth inprescription drug spending.
Regardless of the debates over causation, most experts believe that thegrowth of prescription drug costs will likely continue to surpass growth inother components of health care spending. However, the rate of that growthis expected to decelerate. These projections are largely based on beliefs thatthe market share of lower-priced generic drug products will increase, higherlevels of consumer cost sharing will dampen utilization increases, and fewernew drugs will be introduced. Taken together, these factors will likely slowthe growth in prescription drug spending in future years.4 This decelera-tion continues a recent trend. In 2003, U.S. prescription drug sales grew11.5 percent to reach $216.4 billion.5 Though 11.5 percent sales growth isconsidered strong, particularly in the 2003 economy, the declining growthtrend is a cause for concern for investors (Table 1).
TABLE 1U.S. Prescription Drug Sales
Growth Rate
Year Growth (%)
1999 18.8
2000 14.9
2001 16.9
2002 11.8
2003 11.5
Source: IMS Health, “U.S. Total SalesGrowth, 1996-2000,” available atwww.imshealth.com/ims/portal/front/a r t i c l e C / 0 , 2 7 7 7 , 6 5 9 9 _ 4 0 0 5 4 5 9 3 _1004844,00.html; “IMS Reports 16.9 PercentGrowth In 2001 U.S. Prescription Sales,”available at www.imshealth.com/ims/portal/f r o n t / a r t i c l e C / 0 , 2 7 7 7 , 6 5 9 9 _ 3 6 6 5 _1003965,00.html; “IMS Reports 11.8%Dollar Growth in 2002 U.S. PrescriptionSales,” available at www.imshealth.com/ims/portal/front/articleC/0,2777,6599_3665_41276589,00.html; “IMS Reports 11.5 Per-cent Dollar Growth in '03 U.S. PrescriptionSales,” available at www.imshealth.com/ims/portal/front/articleC/0,2777,6599_3665_44771558,00.html

5
NHPF Background Paper August 24, 2004
The prescription drug industry is highly profitable, although accuratelymeasuring the industry’s profitability is difficult. Responding to concernsabout the magnitude of the industry’s profit margins, industry representa-tives contend that standard accounting that measures current revenues rela-tive to current costs does not adequately address the fact that revenuesfrom drug research investments are not realized for many years. Regard-less of measurement, however, it is accurate to say the U.S. prescriptiondrug industry performs well relative to other U.S. industries.
Top Performers
Overall, the U.S. prescription drug market is relatively fragmented. Onlyfive of the leading companies reported sales revenues in excess of 5 per-cent of the market. In 2003, the ten top-ranked companies in terms ofsales had a combined market share of 59.6 percent,6 and all of them werelarge research-based manufacturers. The top eight rankings did not changefrom those of 2002 (Table 2).
Rankings of companies on the basis of prescription volume are a bitdifferent. Three of the top ten companies—Watson, Mylan, and Teva,ranked number 3, 4, and 5, respectively—are generic firms. Genericproducts account for less than 10 percent of total sales for the U.S. pre-scription drug market7; however, they account for 51 percent of the to-tal prescriptions filled.8
Major mergers between pharmaceutical companies have occurred at arate of about one per year over the last 15 years.9 Pharmaceutical com-pany mergers peaked in the early 1990s with six mergers occurring in1994.10 Higher research and development costs are a factor cited for thetrend in mergers and acquisitions. In recent years, merger activity inthe industry has involved biotechnology companies. Research manu-facturers increasingly turn to biotech companies to fill their researchand development needs, sometimes by buying a biotech firm’s entirepipeline of products. According to BIO, an association representingbiotech companies, academic institutions, and state biotech centers,merger and acquisition activity rose 86 percent in 2003 compared with2002. Despite this merger activity, the prescription drug market remainsfragmented in aggregate.
Although by total sales and prescription volume the market is divided acrossmany manufacturers, market share within therapeutic classes is a differentmatter. A therapeutic class represents a group of drug products that aresimilar in terms of chemical structure, clinical indications, pharmacology,or therapeutic activity.11 Unlike many other product markets, in the pre-scription drug market there is little ability to shift consumer demand fromone class of products to another. Consumers require a particular type oftherapy and generally cannot substitute a different type of prescriptiondrug product. In the food market, for example, consumers might be per-suaded to buy less bread and eat more beef. But in the prescription drug
Generic products ac-count for less than 10percent of total salesfor the U.S. prescrip-tion drug market but51 percent of the totalprescriptions filled.

6
NHPF Background Paper August 24, 2004
market, antihistamines cannot substitute for antidepressants. For this rea-son, the competitiveness of the prescription drug market must be consid-ered within the context of therapeutic class. It is also important to note thateven within therapeutic classes, drugs may not be interchangeable. Thetrue degree of competitiveness within a therapeutic class is highly contin-gent on the clinical indications for, the pharmacology of, the side effectsrelated to, and other characteristics of the particular drugs within that class.
Market dominance by a single company within a given therapeutic class isnot uncommon. Patent laws provide a market advantage to manufacturersof new drugs by precluding competitors from selling that specific productuntil the patents expire. As a result, brand name products typically driveexpenditures within therapeutic classes. Although competition can occurbetween branded products within a therapeutic class, competitive forcesare perhaps most robust when generic equivalents for a particular brandedproduct are available.
Cholesterol-lowering drugs were the top-selling therapeutic class in 2003,with over $13.9 billion in sales.12 The cholesterol-lowering drug Lipitor,with $6.8 billion in sales, has been the best selling prescription drug
Source: IMS Health, “Leading 20 Corporations by U.S. Sales, 2003,” available at www.imshealth.com/ims/portal/front/articleC/0,2777,6599_42720942_44304255,00.html; and IMS Health, “Leading 20 Corporations by Total U.S. Dispensed Prescriptions, 2003,” available atwww.imshealth.com/ims/portal/front/articleC/0,2777,6599_42720951_43989649,00.html.
TABLE 2Ten Leading Corporations Ranked by Total U.S. Sales (in billions of dollars)
and U.S. Dispensed Prescriptions (in millions), 2003
Total Market Total MarketCorporation Sales ($B) Share (%) Corporation Rx’s (M) Share (%)
1 Pfizer 29.2 13.4 1 Pfizer 377.4 11.0
2 GlaxoSmithKline 18.6 8.5 2 Novartis 230.8 6.7
3 Johnson & Johnson 15.2 7.0 3 Mylan Labs 207.2 6.0
4 Merck & Co. 14.1 6.5 4 Teva 206.4 6.0
5 AstraZeneca 10.4 4.8 5 Watson 164.8 4.8
6 Bristol-Meyers Squibb 9.6 4.4 6 GlaxoSmithKline 159.6 4.6
7 Novartis 9.5 4.4 7 Merck & Co. 126.2 3.7
8 Amgen 7.7 3.6 8 Johnson & Johnson 104.8 3.0
9 Wyeth 7.6 3.5 9 Abbott 96.8 2.8
10 Lilly 7.5 3.5 10 AstraZeneca 91.8 2.7

7
NHPF Background Paper August 24, 2004
every year since 2001.13 Other top-selling drugs include the cholesteroldrug Zocor ($4.4 billion), the heartburn drug Prevacid ($4 billion), thebiotech anemia drug Procrit ($3.3 billion), and the psychotherapeutic drugZyprexa ($3.2 billion).14 Lipitor was also the most dispensed product in2003, with over 69 million filled prescriptions.15 Other leading productsin terms of volume sold include the thyroid medicine Synthroid by Abbott(49.8 million prescriptions), the blood pressure drug Norvasc by Pfizer(36.4 million prescriptions), and the antidepressant Zoloft by Pfizer (32.7million prescriptions).
Financial performance of individual manufacturers varies widely. Forresearch-based manufacturers, financial performance is tied to the dis-covery of new products and the marketing of new and existing products.In contrast, financial performance for generic drug manufacturers is tiedto the rapidity of market penetration and prescription sales volume.
Research and Development
Research is a critical element of success for pharmaceutical manufactur-ers. Research and development (R&D) that results in new products is es-sential for long-term revenue growth. A handful of innovator (that is,breakthrough) or branded drugs will provide the majority of a researchmanufacturer’s revenues. The revenues from these products must paynot only for the investment costs of the successful products but for theones that fail as well. According to the Pharmaceutical Research and Manu-facturers of America (PhRMA), only three out of every ten prescriptiondrugs on the market generate revenues that meet or exceed average re-search and development costs.
In 2002, PhRMA member companies (including foreign-owned compa-nies) invested $32 billion in drug research and development—a 7.7% in-crease in R&D investment over 2001. R&D expenditures were 16 percentof total 2002 sales for these companies.16 According to PhRMA, the U.S.pharmaceutical industry invests a greater percentage of their sales in re-search than other American industries, including electronics, communi-cations, and aerospace sectors.17
Discovering and developing new medicines is increasingly expensive andtime-consuming. An increased focus on more complex diseases and theproduction of more sophisticated drug delivery systems increases the timeneeded for drug research and development. Furthermore, the complexityof clinical trials affiliated with the therapeutic classes researched extendsthe time and cost it takes to bring a product to market.18
According to the industry, it takes 12 to 15 years to discover and developa new drug and bring it to market. Industry estimates that the direct costof developing a new drug is approximately $403 million (in year 2000dollars). When capitalized, accounting for lost opportunity costs, the av-erage “cost” of new drug innovation is approximately $802 million (in
A handful of innovatordrugs will provide themajority of a researchmanufacturer’s rev-enues, which must payfor the investmentcosts of both the suc-cessful products andthe ones that fail.
8
NHPF Background Paper August 24, 2004
year 2000 dollars).19 If post-approval R&D costs such as the developmentof new formulations are included, industry sources argue that the truecosts rise to $897 million (in year 2000 dollars).20
These estimates have been challenged extensively, however. Critics con-tend that industry estimates of research and development costs aregrossly inflated. Many believe that these costs include activities that areactually marketing functions and that the estimates do not provide off-sets for federal tax credits and other subsidies to support research anddevelopment costs.
Though the industry provides much of the intellectual and financial capitalto develop products and bring them to market, the federal governmentalso invests in drug development through intellectual property protec-tion, federal support for research and development, and tax subsidies.21
These federal vehicles for supporting drug research and developmentare created to ensure patient access to new medical therapies, but theyalso are important to the finances of pharmaceutical companies.
■■■■■ Patents and marketing exclusivity provisions limit competition for adefined period of time, allowing brand name products to dominate themarket and establish name recognition. The effective patent life forpharmaceutical products receiving U.S. Food and Drug Administration(FDA) approval is generally less than the 20 years provided by the U.S.Patent and Trademark Office because companies file for patents early inthe development process. Opportunities for patent restoration and othermarketing exclusivities are provided through a variety of federal acts,including the Hatch-Waxman Act, which provides up to five years ofpatent restoration; the Orphan Drug Act, which provides seven years ofmarketing exclusivity for products designated as “orphan drugs”22 byFDA; and the Food and Drug Administration Modernization Act, whichprovides six additional months of marketing exclusivity beyond patentsor other exclusivities for companies performing pediatric studies ap-proved by the FDA. These laws have had an impact on effective patentlife for new drugs. According to one estimate, the effective patent life ofdrugs has increased from 8.1 years for drugs approved between 1980 and1984 to 15.1 years for some drugs approved in the late 1990s.23
■■■■■ Federal government support for drug R&D also includes financialsupport of biomedical research at the National Institutes of Health (NIH)and other research facilities. Federally funded research can result directlyor indirectly in new pharmaceuticals. Much of the federally sponsoredresearch is “basic” in nature without thought to specific drug therapies;however, it can lead to biological materials or lab processes that make itpossible for the industry to pursue R&D that is directly relevant to newpharmaceuticals.24 There are no recent estimates of how much NIHspends on drug R&D. A study by the former Congressional Office ofTechnology Assessment (OTA) estimated that in 1988 federal agenciesspent about $400 million on preclinical drug discovery, or 14 cents for
Industry providesmuch of the capital,but the federal gov-ernment also investsin drug developmentthrough intellectualproperty protection,support for research,and tax subsidies.

9
NHPF Background Paper August 24, 2004
every $1 spent by industry on preclinical R&D. The OTA also foundthat federal agencies spent about $200 billion on clinical R& D, or 11cents for every $1 spent by industry on clinical drug R&D.25
■ Federal tax policy provides subsidies in the form of tax credits forindustry R&D. The Research and Experimentation (R&E) Tax Credit,created in 1981 to encourage firms to increase R&D expenditures fromyear to year, covers all R&D necessary to obtain FDA approval tomarket a drug.26 Other tax credits available to the pharmaceuticalindustry for R&D include the Orphan Drug tax credit—equal to 50percent of qualified expenses for human clinical trials of drugs desig-nated as orphan drugs—and the U.S. possessions tax credit, whichprovides tax credits to businesses that invest in U.S. possessions, suchas Puerto Rico.27
Research investment by U.S. pharmaceutical firms has climbed steadilyover the last two decades; however, rising R&D spending has not resultedin increased development of new innovator products. The majority of newdrug applications approved by FDA each year are for drugs that are modi-fied versions of existing approved drugs, commonly referred to as “metoo” or drugs. These types of drugs require less R&D investment and rep-resent less commercial risk than the initial innovators in their therapeuticclass. They also offer little in terms of new clinical benefit over their prede-cessors. Instead, their benefits can be found in fewer side effects, differentdosage, or different delivery methods (for example, oral, injection, patch,etc.) than the innovator product. Their differences from the innovator prod-ucts, however, are enough to qualify them as a new drug and thereforequalify for patents. As a result, “me too” drugs are often criticized for driv-ing rising prescription drug costs, because they essentially extend patentprotections and limit access of generic drugs to the market.
The annual number of new drugs receiving FDA approval that are con-sidered to be marks of innovation—drugs that are different in structurefrom those already on the market, categorized as “new molecular enti-ties” (NME)—is low. In 2002, only 17 were approved, the fewest numberapproved by FDA since 1983.28 In 2003, 21 were approved in comparisonto the high of 35 approved in 1999.29 This lack of innovator productivityraises concerns about the impact of the industry’s R&D investment.
Several factors are believed to contribute to this return on research in-vestment. Advances in basic science have significantly increased researchopportunities. The number of drug targets—disease-specific proteins,receptors, enzymes and genes—has risen dramatically from 500 to morethan 5000 in recent years, and there has been an expansion in researchto investigate them. R&D might be becoming more expensive becausethe “low-hanging fruit” has already been picked and because areas ofunmet medical need are in complex diseases difficult to understand andcontrol.30 This leads to longer development processes with more com-plicated clinical trials.
The majority of newdrug applications ap-proved by FDA are fordrugs that are modi-fied versions of exist-ing drugs, known as“me too” drugs.

10
NHPF Background Paper August 24, 2004
Changing industry structure may also affect industry productivity. Thirtyyears ago, most research affiliated with drug discovery was conducted “inhouse.” During the 1980s, the industry became more complex with theintroduction of biotechnology companies. Biotech drugs differ from tradi-tional chemical pharmaceuticals in key ways. Biotech medicines are syn-thetic versions of natural biologic substances (for example, proteins,enzymes, and antibodies) and are generally injected or infused directly intothe bloodstream. Only a handful of traditional research-based manufactur-ers (also known as “Big Pharma”) actually research and develop biotechdrugs. Instead, research manufacturers use agreements with biotech firmsto keep their drug development pipelines robust. These agreements maybe driving up the cost of drug development.
Contractual agreements and collaborative arrangements between manu-facturers and biotech firms have been increasing. In 2003, the pharma-ceutical industry struck more than 300 new deals with biotech companiesto manufacture and market biotech’s drug products,31 and 21 new biotechproducts received FDA approval, including products for HIV, Alzheimer’sdisease, cancer, psoriasis, and asthma. Sales for biotech drugs also grew22 percent in 2003, with the global market for biotech drugs exceeding$30 billion.32 Twenty-five to forty percent of industry sales are reported tocome from drugs that originated in the biotech sector.33
Regardless of the contributing factors, measuring industry productivityand the ultimate impact of R&D investment is difficult because the “pay-off” from such investment takes a long time to materialize. R&D in thecurrent market contributes to new drug development far into the future.Therefore, the true impact of increased R&D spending in recent yearsmay not be realized yet.
Marketing
To help offset revenue losses due to fewer new drug launches and genericentries, manufacturers try to maximize performance of existing brands.Product promotion is a critical element of this effort. In 2002, drug manu-facturers spent over $19 billion on total product promotion, includingsamples, brochures, drug detailing (in other words, sales people mar-keting drugs directly to doctors in their offices), and direct-to-consumeradvertising (DTC) (Figure 1).34
The bulk of all promotional spending is targeted toward physicians andother providers. Over 80 percent of all promotional spending can be cat-egorized as “professional spending.” Professional promotional spendingincludes costs of journal advertisement, promotion and sales activities ofdrug representatives at hospitals and physician offices, and free drugsamples. The retail value of free drug samples provided to physician’s of-fices reached almost $12 billion in 2002, making it the largest component ofprofessional promotional spending,35 followed by physician office promo-tion at over $5 billion. The dollar value of free product sampling grew fasterthan any other form of promotion in 2002.36
Over 80 percent of allpromotional spendingcan be categorized as“professional spend-ing,” which includesjournal advertisement,activities of drug rep-resentatives, and freedrug samples.
11
NHPF Background Paper August 24, 2004
Manufacturers are allocating a large portion of marketing resources to phy-sician detailing; however, the traditional detail-based marketing model forprofessional promotion is being challenged. Increasingly, physicians usethe Internet for medical information, including continuing medical educa-tion initiatives and point-of-care decision tools like electronic prescribing.Manufacturers are committing greater resources to “e-marketing.” Somemarket experts believe that point-of-care e-prescribing and related inte-grated drug reference tools are on the verge of becoming the most power-ful marketing tools. Various estimates have projected that over 50 percentof physicians will adopt e-prescribing by 2005.37
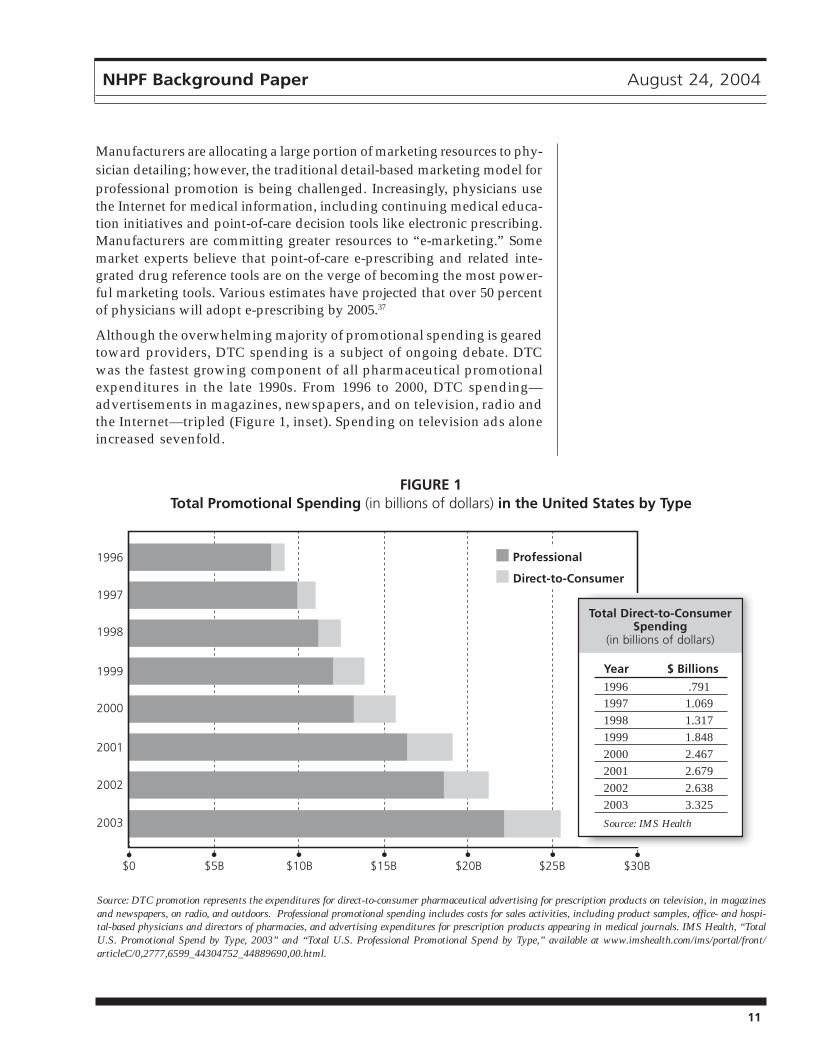
Although the overwhelming majority of promotional spending is gearedtoward providers, DTC spending is a subject of ongoing debate. DTCwas the fastest growing component of all pharmaceutical promotionalexpenditures in the late 1990s. From 1996 to 2000, DTC spending—advertisements in magazines, newspapers, and on television, radio andthe Internet—tripled (Figure 1, inset). Spending on television ads aloneincreased sevenfold.
Source: DTC promotion represents the expenditures for direct-to-consumer pharmaceutical advertising for prescription products on television, in magazinesand newspapers, on radio, and outdoors. Professional promotional spending includes costs for sales activities, including product samples, office- and hospi-tal-based physicians and directors of pharmacies, and advertising expenditures for prescription products appearing in medical journals. IMS Health, “TotalU.S. Promotional Spend by Type, 2003” and “Total U.S. Professional Promotional Spend by Type,” available at www.imshealth.com/ims/portal/front/articleC/0,2777,6599_44304752_44889690,00.html.
Year $ Billions
1996 .7911997 1.0691998 1.3171999 1.8482000 2.4672001 2.6792002 2.6382003 3.325
Source: IMS Health
FIGURE 1Total Promotional Spending (in billions of dollars) in the United States by Type
Professional
Direct-to-Consumer
Total Direct-to-ConsumerSpending
(in billions of dollars)

12
NHPF Background Paper August 24, 2004
Some believe the surge in DTC spending is linked to the relaxing of FDArules on mass media advertising for prescription drugs, which occurredin 1997. However, others point out that the increase in spending startedbefore 1997 and therefore the new guidelines may not be the sole reasonfor the increase.38
DTC advertising is concentrated on a few products in a variety of thera-peutic classes. According to IMS Health, the top DTC-promoted brands in2001 were the anti-inflammatory drug Vioxx by Merck & Co ($135 million),the arthritis drug Celebrex by Pfizer ($130 million), the heartburn medi-cine Nexium by AstraZeneca ($127 million), the erectile dysfunction therapyViagra by Pfizer ($101 million), and the allergy medicine Allegra by Aventis($90 million). In general, top-selling products have large DTC expenditures,although the products with the most promotional expenditures do not al-ways correspond to the top-selling products.
Manufacturers tend to spend the most on consumer ads for drugs used totreat chronic conditions that require treatment over extended periods oftime such as asthma, depression, allergies, arthritis, and diabetes. Drugswith low occurrence of mild side effects are also better candidates becausethere is less information on risk that needs to be conveyed to the consumer.DTC advertising for certain types of drugs such as “lifestyle” drugs (forexample, Viagra) is viewed as a good investment because insurance usu-ally does not cover such products, leaving most consumers to pay for themcompletely out-of- pocket. Within a specific class of drugs, the intensity ofDTC advertising varies, and the amount of advertising for specific prod-ucts changes over time.39
Critics argue that DTC advertising drives spending as well as inappro-priate utilization and takes money away from R&D. They claim DTC ad-vertising leads consumers to seek drugs when other treatments may bemore appropriate or to seek newer, more expensive drugs that may (ormay not) be as effective as their predecessors.
Supporters argue that DTC advertising educates consumers about treat-ment options and that increased drug utilization encouraged by DTC hasimproved public health.40 Furthermore, they argue that it prompts patientsto seek medical advice about health concerns, resulting in new diagnosesand additional health care recommendations.
The U.S. General Accounting Office [(GAO), renamed the U.S. GovernmentAccountability Office in July 2004] concluded in a 2002 study on DTC ad-vertising that it appears to increase prescription drug spending and utili-zation. The GAO also found that spending on heavily advertised drugsincreased faster than other sales and that this was due to an increase inutilization, not increasing prices. It also noted, however, that the spur inutilization may be due to the type of drug that is heavily advertised, namelythe chronic condition drugs. Another fact to consider is that many of thesame drugs promoted through DTC advertising are also promoted to phy-sicians through drug detailing; therefore, determining the true influenceof DTC is difficult.
The GAO found thatspending on heavilyadvertised drugs in-creased faster thanother sales and thatthis was due to in-creased utilization,not increasing prices.

13
NHPF Background Paper August 24, 2004
Growth of Generic Drugs
Despite the efforts of research-based firms to fend off the advances ofgeneric products, generic drugs are a growing component of the phar-maceutical industry with a steady increase in share of total prescrip-tions. When Congress passed the Drug Price Competition and PatentTerm Restoration Act in 1984 (also known as the Hatch-Waxman Act) tostreamline the approval process for generic drugs and increase theiraccess to the market, generic drugs accounted for only 18 percent of theprescriptions filled. By 2003, generic products accounted for 51 percentof all prescriptions filled.41 Between 2002 and 2003 alone, generic salesgrew by 22 percent and the volume of generic prescriptions grew by 9.2percent.42 These levels represent new highs in both dollars spent on andprescriptions for generic drugs.
Generic drug manufacturers do not have to conduct clinical trials andprove safety and efficacy the way brand name drug manufacturers do fora new patented drug. Instead, they have to prove “bioequivalence,” whichin general terms means their product must deliver the same active ingre-dient in the same dosage and in the same time frame as the innovator orbrand product.43 The cost for proving bioequivalence is about $1 million,significantly less than the cost to develop a new drug.44
The lower R&D costs of generics allow drug manufacturers to price gener-ics aggressively, usually at about a third of the price of brand name prod-ucts. This translates into significant savings for consumers and purchasers.According to the Generic Pharmaceutical Association, the average priceper prescription for a brand name drug is $84.21, whereas the average pricefor a generic drug is $30.56.
According to the FDA, brand name firms are involved with the produc-tion of approximately 50 percent of generic drugs. Creators of patentedproducts sometimes manufacture the generic versions, and sometimesthey also use licensing agreements with generic manufacturers for theproduction of generic versions of their patented drugs. Some of theseagreements have been criticized as financial arrangements intended onlyto delay the production and distribution of generic substitutes.
Patent expirations for brand name drugs are one of the driving forces be-hind rising generic drug sales. The expiration of patents for top-selling brandname drugs creates market opportunities for generic drugs. In year 2005alone, several major branded drugs that collectively represent over $13 bil-lion in sales (in year 2003 dollars) will lose patent protection (Table 3).
Pravachol and Zocor are top-selling cholesterol medications, and Zoloft isa leader in the antidepressant category. The loss of patent protection forthese products will likely a have major impact on the overall expendituresin these therapeutic classes.
Payer cost-containment trends are another driving force behind thegrowing market share of generics. Generic substitution requirements in
In 2003, genericsales grew by 22 per-cent and the volumeof generic prescrip-tions grew by 9.2 per-cent, representing newhighs for the genericdrug market.

14
NHPF Background Paper August 24, 2004
Medicaid programs and multitiered copays in private health plans effec-tively reduce cost while helping to accelerate the conversion from brandname to generic products. Years ago, it would take over six months for ageneric product to capture 50 percent of the dispensed market; in thecurrent market, it can happen in as little as six to eight weeks.45
Though generic drugs are gaining ground in the U.S. pharmaceuticalmarket, barriers to entry remain. Patent extensions, restorations, andperiods of market exclusivity granted to brand name manufacturers candelay when generics are able to enter the market. Patent challenges bybrand name manufacturers also impose legal fees, delaying generic ap-provals and thus market entry. Product management strategies by brandname manufacturers, such as product oversampling to physicians, ag-gressive DTC marketing, and other strategies, can delay marketpenetration and affect the rate of conversion from brand name to ge-neric. For example, ulcer medications and antidepressant drugs, thesecond- and third-ranked therapeutic classes by U.S. prescription salesfor 2002, maintained their sales rankings in 2003 even though both classeshave generic substitutes available and there is an over-the-counterulcer medication available.
The MMA contains provisions to close unintentional loopholes in theHatch-Waxman law that delayed the marketing of generic drugs. Amongits provisions, MMA allows brand name manufacturers filing patent in-fringement litigation against generic drug manufacturers only one 30-month stay of marketing exclusivity. Previously allowed were multiplestays, which could be overlapping and consecutive and could delay ge-neric drug market entry for years. The limitation imposed in the new lawis contentious and will continue to generate policy discussion.
TABLE 3Patent Expiration Dates for Five Top-Selling Prescription Drugs
(in billions of dollars)
2003Drug Name (Manufacturer) Sales ($B) Date
Prevacid (TAP Pharmaceuticals) 4.0 July 2005
Pravachol (Bristol Myers Squibb) 2.0 October 2005
Zocor (Merck & Co.) 4.4 December 2005
Zoloft (Pfizer) 2.9 December 2005
Source: Sales data from IMS Health, “Leading 20 Products by U.S. Sales, 2003,” available atwww.imshealth.com/ims/portal/front/articleC/0,2777,6599_42720942_44304277,00.html; patent expira-tion dates from the Generic Pharmaceutical Association, “Drug Patent Expiration List 2002 - 2006,” avail-able at www.medvantx.com/550.asp?nav=500.

15
NHPF Background Paper August 24, 2004
Access to the lucrative biotech market is currently not available to ge-neric manufacturers. When the Hatch-Waxman Act was passed in 1984,the biotech industry was in its beginning stages and none of its drugs hadbeen approved yet. As a result, Hatch-Waxman provides no guidance tothe FDA regarding approval for generic versions of biotech products.Unlike chemical medicines, biologics cannot be tested for bioequivalency;new tests must be developed to determine whether a generic version of abrand name biologic offers the same therapeutic effect.
Biotech drugs are among the most expensive drugs to develop and arepriced accordingly. As patent expirations for the initial products of the25-year-old biotech industry approach [reportedly 17 biotech drugs worthmore than $10 billion in sales (in year 2000 dollars) will lose patent pro-tection in 2006], the industry, Congress, and the FDA are beginning todebate whether generic biologics should be allowed and what the ap-proval process should require.
The research-based pharmaceutical industry argues that making biologicsis still so complex that generic firms should have to prove safety andeffectiveness as if they were creating a new medicine. The FDA is in theprocess of putting together scientific guidelines on how to prove that cop-ies of biologics are similar to the original medicines, but it has cautionedin the past that there are significant scientific issues about how to show“sameness” to assure the agency that generics are safe, pure, and potent,as well as equivalent to the brand.
A Complicated Marketplace
The marketplace that links consumers to manufacturers is highly complexand involves a number of intermediaries. The “sell” side of the prescrip-tion drug transaction includes manufacturers who produce the product, aswell as wholesalers and retail distributors who buy the product and resellit to the consumer. On the “buy” side of the transaction, the consumer isactually an amalgamation of multiple parties including (a) the patient whowill use the product and will likely pay for at least a portion of the pur-chase price, (b) the physician, or other health care provider, who prescribesthe drug, and (c) the insurer (if the patient has prescription drug coverage)who shares the financial burden of the purchase with the consumer, maynegotiate prices with retailers and the manufacturer, and can play a role inlimiting or shaping product options.
Individuals — According to surveys by the Kaiser Family Foundation46
over half (54 percent) of Americans say they take prescription drugs on aregular basis, and one-fourth (24 percent) say they take three or moredrugs regularly. Thirty percent say they currently have more than fiveprescription drugs in their medicine cabinet.
Unlike most consumer products, users of prescription drugs have limitedchoice in selecting a particular product. Purchases must be initiated by
As biotech patent expi-rations approach, theindustry, Congress, andthe FDA are beginningto debate whether ge-neric biologics shouldbe allowed and whatthe approval processshould require.

16
NHPF Background Paper August 24, 2004
physicians or other appropriate health care providers via prescription of aparticular drug. Patients generally lack the clinical expertise necessary toinfluence providers’ prescribing choices, although the aim of DTC adver-tising is clearly to motivate patients in this regard. Despite the increase inDTC advertising, most manufacturer marketing focuses on physicians inrecognition of the role they play in product selection.
Insurers — Insurance coverage also directly affects access to prescriptiondrugs. The Kaiser survey found that 25 percent of respondents did nothave prescription drug coverage, and 29 percent said they have not filleda prescription because of the cost. Insurers can also influence the types ofdrugs used by an individual. In general, consumers with drug insuranceuse more prescriptions, including more brand name drugs, and havegreater prescription expense than people without insurance. A drivingforce of this dichotomy is the price insulation that third party coverageprovides—particularly for higher-priced brand name drugs. Faced witha flat copayment instead of a retail price, people with drug insurance areless sensitive to price differentials between drug products.
Third party payment (public and private) continues to steadily offset theconsumer’s out-of-pocket share of drug spending. In 1994, out-of-pocketand third party shares of total drug expenditures were nearly equal. By2002, the consumer out-of-pocket share was down to 30 percent.47 Therise in third party payment over the years is due to an expanding share oftotal expenditures paid by private insurers, which reflects an expansionin drug coverage. In 2002, private third party payers paid $77.6 billionfor prescription drugs.48
Out-of-pocket spending for prescription drugs, however, is growing at afaster rate than private health insurance spending.49 A driving factor forthis trend is the cost-containment measures imposed by third party payers,most notably managed care plans and their pharmacy benefit managers(PBMs).50 PBMs are private firms that manage drug benefit programs foremployers, insurers, and managed care plans. PBMs perform a variety offunctions, including formulary design and management, pharmacy net-work and payment administration, mail order, rebate negotiations or man-agement, and patient compliance programs.
Prescription drug formularies were introduced by health plans to influ-ence prescribing patterns with the goal of reducing costs. Drugs on theformulary are covered, whereas nonformulary drugs are not. In recentyears, fairly inclusive formularies with multitiered copayment levels havebecome the general rule in the administration of drug coverage. Suchformularies create lower copayments for generic drugs and feature lessexpensive or more effective brand name products on a preferred drug list(PDL). Manufacturers are often willing to offer discounted prices inexchange for the guaranteed market share likely to result from inclusionin the PDL. The different copayment levels create incentives for benefi-ciaries to use generic or low-cost brand name drugs. This approach
Out-of-pocket spend-ing for prescriptiondrugs is growing at afaster rate than pri-vate health insurancespending.

17
NHPF Background Paper August 24, 2004
provides coverage for a broad range of drugs, but shifts more of the ex-pense for certain products (such as high-cost brand name drugs) to con-sumers. For most consumers, these copays and formularies affect themwhen they present their prescription to a pharmacist at a retail pharmacy.
Retailers — According to the National Association of Chain Drug Stores,there are over 35, 000 chain drug store pharmacies (for example, CVS),mass merchandiser pharmacies (such as Target), and supermarketpharmacies nationwide. In addition, there are over 20,000 independentpharmacies that are small, privately owned individual pharmacies or smallchain pharmacies.
In recent years, the distribution market has shifted away from indepen-dent, privately owned pharmacies toward chain drug stores, food stores,and mass merchandisers. These retail pharmacies dominate the distribu-tion market, dispensing approximately 60 percent of all prescription drugsin the United States.51
Mail order service is a fast-growing segment of the distribution market.Mail order sales grew by 15.5 percent in 2003, resulting in a 13.2 percentmarket share.52 Lower copayments for mail order services offered bymanaged care organizations and PBMs are a driving force behind thegrowth in mail order purchases.
The Internet has expanded consumer access to prescription drugs.“Internet pharmacies” mimic traditional retail pharmacies in terms ofproducts and services and compete directly with them; they dispense asimilar line or range of drugs to consumers and may offer patient educa-tion and/or drug interaction screenings. There also are Internet “prescrip-tion sites” that offer access to a limited selection of drugs. Lifestyle drugsare promoted this way. Prescription order writing and filling services areprovided at these sites. Finally, traditional retail pharmacies provideInternet sites as an option for consumers to place their refill and prescrip-tion orders.
Internet access to prescription drugs appears to provide convenience andeasy availability; however, such pharmacy outlets raise significant safetyconcerns, regarding, in particular, patient education and safeguards, themonitoring of prescription writing, and the quality of the drugs them-selves.53 Internet pharmacies have already been implicated in scandalsinvolving counterfeit and contaminated drugs.
Wholesalers — The majority of pharmaceutical drugs sold in the UnitedStates are purchased through drug wholesalers. Wholesalers provide acost effective means for manufacturers and retailers to purchase, deliver,and sell prescription drugs. Serving as a middleman, wholesalers helplower manufacturers’ costs through large volume purchases while pro-viding “one-stop shopping” for retailers, thus eliminating the need tonegotiate contracts with individual manufacturers.
Chain drug stores,food stores, and massmerchandisers (suchas Target) dispenseabout 60 percent of allprescription drugs inthe United States.
18
NHPF Background Paper August 24, 2004
Wholesalers generate revenue from both manufacturers and retailers. Re-tailers pay fees for distribution services, and manufacturers provide cashrebates and discounts for prompt or early payment. Wholesalers operateon narrow profit margins; the wholesale markup is modest, usually just afew cents for every dollar of prescription drugs sold. The average whole-sale price (AWP) is intended to represent the average price at which whole-salers sell drugs to physicians, pharmacies, and other customers.
These “sticker prices” or “list prices” are commercially published andsold to public and private purchasers. They serve as a reference pricefor purchasers, with payments usually corresponding to AWP, less aspecified percentage (for example, AWP minus 15 percent). AWP, how-ever, is not an accurate reflection of actual market prices because it doesnot include discounts available to various purchasers. It is generallyconsidered to be an overstated price and is facetiously referred to as“ain’t what’s paid.”54
The recently enacted MMA addressed the problem of AWP by replacingit with the average sales price (ASP) as the basis for prescription drugreimbursement under Medicare Part B. The ASP is the average of a drug’sfinal sales prices in the United States, net of rebates or other discounts.The new payment basis will be implemented in 2005.
The wholesale industry is highly concentrated, with 90 percent of all salesmade by only three companies. The “Big Three” are McKesson HBOC,Inc; Cardinal Health, Inc.; and AmeriSource Corp. As the principal pipe-line of drug distribution, these large wholesalers purchase a full line ofpharmaceutical products from manufacturers and resell them to retail-ers. In some cases, the products are warehoused by the large wholesalerthen resold and distributed directly to retailers. In other cases, these whole-salers provide “brokerage services,” which can include delivery directlyfrom the manufacturers without warehousing as well as allowing retail-ers and manufacturers to submit orders and payments through the whole-saler without involving the wholesaler in the delivery of the purchase.55
Regional wholesalers deal with a smaller volume of drugs than the BigThree, but they sell to the same purchasers and compete with the largewholesalers. Small wholesalers vary in their size, product lines, and ser-vices. Some provide a full line of drug products, others provide only cer-tain products such as injectables, and yet others team with medical supplycompanies to provide combination products of drugs and medical devices.
There also are secondary wholesalers who specialize in the purchasingand selling of select discounted pharmaceutical products to other whole-salers. The sources for these discounted products can be manufacturersoffering sales to clear their inventory or meet sales quarter goals, andpharmacies and other wholesalers with overstocks. A distinguishingfeature of secondary wholesalers is their willingness to risk capital bybuying discounted products for quick resale. Secondary wholesalers com-pete entirely on price. Purchasing prescription drugs from secondary
The wholesale indus-try is highly concen-trated, with 90 percentof all sales made byonly three companies.

19
NHPF Background Paper August 24, 2004
wholesalers is attractive to large and regional wholesalers because theirdiscounted prices can undercut the regular contract price offered by themanufacturer. As a result, large and regional wholesalers may reducecontract purchases with manufacturers for certain drugs so they can takeadvantage of the secondary market sales.
The secondary wholesale market generates concerns regarding productsafety, integrity, and pricing practices. There is no formal definition orcount of secondary wholesalers, and regulation of the entire wholesaleindustry varies from state to state. Corrupt secondary wholesalers havebeen the root of several large counterfeit drug cases (for example, fakeLipitor) and “drug diversion” schemes—a sales practice that sends lower-cost drugs intended for institutional settings to retail settings—to make aprofit. States have responded by tightening licensing requirements forwholesale businesses, and FDA is pursuing product packaging and track-ing changes to ensure product safety.
FEDERAL GOVERNMENTAs might be expected for such an unwieldy segment of the U.S. economy,the federal government is a unique stakeholder in the pharmaceuticalmarketplace. It plays three distinct roles; as regulator, researcher, andpurchaser, the government is an influential participant in the industry.
Regulation
The pharmaceutical industry is one of the most regulated industries inthe United States, and the FDA is the federal agency responsible for over-seeing the pharmaceutical industry.
FDA oversight of new prescription drugs can be classified into preapprovaland postapproval activities. Preapproval activities focus on ensuring thata drug is safe and effective before it is marketed to consumers.Postapproval activities include postmarketing surveillance to ensure theongoing safety of marketed drugs, the enforcement of good manufactur-ing practices so that drugs are manufactured in a consistent and controlledmanner, and the monitoring of prescription drug advertising to ensurethe truthful presentation of information regarding effectiveness, side ef-fects, and so forth.
FDA is also responsible for overseeing the generic and over-the-counter(OTC) drug development, as well as marketing.
New Drugs — Regulatory authority for the agency is provided in theFood, Drug and Cosmetic Act (FD&C Act), which was passed in 1938.United States drug law has evolved dramatically since then, with themost significant change occurring with the Kefauver-Harris DrugAmendments of 1962. The Amendments fundamentally restructured theway in which FDA regulated new medicines, transforming a system ofpremarket notification into one that requires individual premarket approval
As regulator, researcher,and purchaser, the gov-ernment is an influentialparticipant in the phar-maceutical industry.

20
NHPF Background Paper August 24, 2004
of the safety and effectiveness of every new drug.56 Some believe that withpassage of this legislation the regulation of drugs became the single mostcontroversial (and perhaps the most important) of FDA’s activities.57
According to the FDA, no drug is absolutely “safe,” and therefore theagency follows a “risk-based approach” for new drug approval. When aproposed drug’s benefits outweigh its known risks, the FDA considersthe drug safe enough to approve.58
In general, the new drug development process starts with the discoveryof NMEs, which are compounds that have not been previously approvedby the FDA. Preclinical testing is performed on animals to determine safetyand biological activity. The drug’s sponsor, usually the manufacturer,eventually pursues an investigational new drug (IND) application fromthe FDA, which allows the sponsor to conduct human studies.
Controlled clinical trials (that is, human studies) are designed to assessthe safety and efficacy of a drug for its proposed use. Clinical trials pro-vide the only legal basis for demonstrating a drug’s effectiveness.59 Clini-cal trials are conducted in a three-phase process. Each phase requires largerpatient populations and greater scrutiny of the drug’s performance.
Phase I clinical trials typically involve healthy subjects and are designedto test a compound for metabolic properties, safety, and tolerance. PhaseII trials involve selected populations with the disease or condition to betreated, diagnosed, or prevented and are designed to obtain informa-tion on safety and initial data on efficacy. Phase III trials are large-scaletrials involving subjects with the target disease or condition and aredesigned to gather data on efficacy, safety, and drug-related adverseeffects. Throughout the process, many potential new therapies fall bythe wayside: Approximately 70 percent of drugs entering clinical trialscomplete Phase I, 33 percent complete Phase II, and 27 percentcomplete phase III.60
Once clinical testing is completed, the drug’s sponsor submits aNew Drug Application (NDA), which is the basis for FDA approval.The NDA tells the drug’s whole story, including what happened duringclinical trials, what is included in its components and constitution,how the drug performed in animal studies, how the drug behaves inthe human body, and lastly how it would be manufactured, processed,and packaged.61
New drugs typically qualify for 20 years of patent protection. This pro-tection precludes competitors from marketing products with the sameactive ingredients. The “clock” for patents begins with the submission ofthe IND. Therefore, clinical testing and FDA review and approval timecan consume a large portion of a drug’s patent life, although some of thislost protection can be restored.
The amount of time it takes the FDA to review a new drug applicationhas been reduced. The Prescription Drug User Fee Act (PDUFA) of 1992
No drug is absolutely“safe”; the FDA ap-proves a proposed newdrug when its benefitsoutweigh its knownrisks.

21
NHPF Background Paper August 24, 2004
provided the FDA with a series of fees (for example, application fees, es-tablishment fees, product fees, etc.) to hire additional staff to help quickenthe NDA review process. As a result of the PDUFA and its reauthorizationsin 1997 and 2002, the FDA is currently reviewing more than 90 percent ofpriority drug applications in 6 months or less and standard drug applica-tions in 12 months or less.62 Before the passage of the PDUFA, NDA reviewtook upward of 18 months.63 According to PhRMA, this reduction in re-view time largely eliminated the lag time to approval that had existed be-tween the United States and other industrialized countries.
The FDA has “fast track” policies and procedures in place to help qualifiedapplicants navigate the NDA submission and review process. FDA staffwork closely with applicants throughout the process to reduce potentialdelays in application submission and review. Products eligible for fast trackdesignation address an unmet medical need.
The FDA has taken additional steps to make urgently needed drugs—namely drugs promising significant benefit over existing therapy to treatserious or life-threatening diseases—available sooner. Under the “accel-erated approval “ rule, FDA is allowed to approve a drug on the basis ofa “surrogate endpoint,” which is a positive effect on a marker of the dis-ease rather than an actual positive effect on survival of an illness.64
FDA also allows broader use of investigational drugs prior to market ap-proval. “Treatment INDs” and the “parallel track mechanism” for AIDSand HIV-related drugs allow promising drugs not yet approved to beused in expanded access protocols. This means individuals not qualify-ing to participate in the controlled clinical trials may be able to enroll inspecial protocols that allow them access to the drugs and provide manu-facturers with additional information.
Generic Drugs — Regulation of generic drugs was dramatically reformedwith a complex law called The Drug Price Competition and Patent TermRestoration Act of 1984, commonly referred to as the Hatch-Waxman Act.This law amended the FD&C Act and various federal statutes that governU.S. patents. It basically established the framework for the approval of ge-neric drugs and their entry into the marketplace.
The Hatch-Waxman Act permits generic manufacturers to use and refer-ence the safety and effectiveness research conducted by the brand namecompany when seeking FDA approval to market a copy of a brand namedrug. Before 1984, generic manufacturers were required to duplicate thisresearch. The law requires generic manufacturers to prove that their copiesof the brand drugs they seek to market are chemically and biologicallyequivalent to the original drug. Generic manufacturers are permitted tobegin testing of their drugs before the patent on the innovator drug ex-pires, and brand name manufacturers must share relevant data withgeneric companies so such tests can be performed.
Under this law, the first generic company to file an abbreviated new drugapplication (ANDA) with the FDA for a copy of a patented drug gets 180
The FDA has takensteps to make urgentlyneeded drugs—thosepromising significantbenefit over existingtreatments for seriousdiseases—availablesooner.

22
NHPF Background Paper August 24, 2004
days of “exclusivity,” meaning no other generic copy of that drug cancome to market in that period. Finally, generic companies are required to“certify” to the FDA how their products will or will not infringe all exist-ing patents on the drug they seek to copy.
The Hatch-Waxman Act also provides a vehicle for brand name compa-nies to “restore” some of their product’s patent life lost during the testingand approval process. The maximum restored patent life is five years,and the maximum total effective patent life—meaning the time betweenFDA approval and a drug’s patent expiration after any restored patentlife—cannot exceed 14 years. This lengthens a brand name drug’s protec-tion from generic competition. The law also permits periods of “marketexclusivity” for brand name products for new uses of a drug and for newactive ingredients that have not been previously marketed.
Over-the-Counter Drugs — The FDA has a separate process for approv-ing over-the-counter (OTC) products. Instead of reviewing and approvingthousands of individual products, the FDA evaluates the active ingredi-ents found in them. The FDA then publishes standards for specific OTCtreatment categories (for example, antacids, laxatives, etc.). An OTC drugproduct does not need specific approval before marketing as long as theproduct meets its category standards.65
Sometimes an approved prescription drug is deemed appropriate by FDAfor self-use and the drug’s status is switched to OTC. To take this action,the FDA would determine that the drug treats a condition consumers candiagnose and manage themselves and, therefore, that the drug is suffi-ciently safe for use without prescriber supervision. The drug’s label mustalso explain potential adverse effects and conditions with clear direction.
Status switching from prescription to OTC is usually prompted by thedrug manufacturer; however, other parties can petition FDA for OTCswitches as well. This was the case with the top-selling allergy medicineClaritin. An insurance company initiated the process for an OTC switchfor Claritin. Its motivation to pursue the switch was the savings that wouldresult from the removal of Claritin from their formulary once it becameavailable over the counter. The manufacturer, Schering-Plough, initiallyfought the petition because Claritin had a few years left on its patent.Shortly before Claritin’s patent expired, however, the manufacturer peti-tioned FDA for the OTC switch itself, which was granted. By getting anOTC version of Claritin on the market, the manufacturer was able to geta jump on the generic competition.
Research
The federal government is the largest supporter of academic-based researchin life and health sciences66 The National Institutes of Health (NIH) is theprincipal federal agency that funds and conducts biomedical research,including research on drugs.67 In fiscal year 2003, the NIH’s budget wasover $27 billion.68
The federal govern-ment is the largestsupporter of academic-based research in lifeand health sciences.

23
NHPF Background Paper August 24, 2004
Technology transfer is basically the “sharing and dissemination of scien-tific knowledge between researchers and research organizations and thosewho make practical use of the information including physicians, healthcare providers, and industry.”69 According to the GAO, “much of the phar-maceutical related technology transfer between the public and privatesector originates with research conducted by or funded by the NIH.”70
The transfer of technology from government-based medical research labo-ratories to the private sector is an effort to have new pharmaceuticalsbrought to market more efficiently than would be possible for the federalagency acting alone.
In general, government and academic scientists conduct basic researchidentifying compounds, methods, and chemical reactions that may be ofvalue in treating disease. Both the NIH and academic institutions con-duct preclinical and clinical testing (that is, Phase I and Phase II clinicaltrials). In general, industry conducts the Phase III clinical trials and pur-sues approval for marketing.
Public-Private Partnerships — The key component of successful public-private technology transfer is the incentive to develop and commercial-ize government-owned research or inventions. Historically, the govern-ment generally retained the title to any inventions created under fed-eral research grants and contracts. In 1980, however, Congress enactedtwo laws focusing on encouraging the commercialization of government-developed and -funded technologies:■ The Stevenson-Wydler Technology Innovation Act addressedgovernment-owned technology. It declared that inventions owned bythe government remained the property of the agencies that developedthem. It also established guidelines for the licensing of government-produced technologies to U.S. businesses.
■ The Bayh-Dole Act addressed technology developed by federalcontractors and grantees. It authorized federal agencies to providelicense agreements with private entities to develop federally ownedinventions. The agencies could collect royalties for such licenses.Under the Act, businesses could profit from inventions or productsdeveloped from federally funded research.
The ultimate goal of these laws was the public benefit from federally con-ducted research. NIH’s goals in the technology transfer process empha-size public benefits over financial consideration.71 However, the financialsuccess of certain drugs that benefited from government-funded researchhas raised concerns about whether the federal government is getting afair return on its investment.
The GAO recently examined the public-private technology transfer pro-cess involving the cancer drug Taxol as a case study in federal technologytransfer policies. The GAO determined that NIH’s total investment inTaxol-related research reached $484 million and that five of the six stud-ies submitted to FDA by Taxol manufacturer Bristol Myers Squibb (BMS)
Transferring technol-ogy from government-based laboratories tothe private sector is aneffort to bring newdrugs to market moreefficiently.

24
NHPF Background Paper August 24, 2004
in support of its marketing approval were either conducted or funded byNIH. Furthermore, the federal government (via, for example, Medicare)has been a major purchaser of Taxol, paying over $687 million from 1994to 1999. The GAO found that NIH only received $35 million in royaltypayments from BMS.
In comparison, the GAO determined that BMS invested approximately $1billion in its efforts to bring Taxol to market and that worldwide sales forTaxol totaled over $9 billion from 1993 to 2002. The GAO concluded thatthe NIH had invested heavily in research related to Taxol but that NIH’sfinancial benefits—$35 million through 2002—from the collaboration withBMS have not been significant in comparison to the drug’s revenue.
A related concern is the inherent conflict of interest that can accompanypublic-private collaborations. Balancing the need to maintain the integ-rity of the distribution of public funds with the need to encouragesuccessful public-private collaboration can be a challenge. The NIH’s con-flict-of-interest policies with respect to consulting practices of govern-ment officials in the private sector have come under scrutiny. The policiesin place until now have allowed some NIH officials to earn large sums ofmoney outside their government duties by consulting with private in-dustries. In addition, the rules did not uniformly require full disclosureof the outside arrangements.
The NIH announced in August 2004 that a new oversight system willprohibit NIH employees with grantmaking powers from consulting forpharmaceutical or biotech companies. NIH indicates that other scientistswill be allowed to consult because of the potential to speed the transla-tion of research to cures; however, such consulting will be limited.
Purchasing
The passage of the MMA greatly expanded the government’s role as a pur-chaser of prescription drugs. Providing a prescription drug benefit to 40million Medicare beneficiaries, the MMA represents the most significantchange to the entitlement program’s benefit structure since its enactmentin 1965. It will have a significant impact on the pharmaceutical market aswell, particularly with respect to drug access, prices, and sales volume forthe aged population—the industry’s largest consumer group. Once the lawis fully implemented, Medicare will become the largest purchaser of pre-scription drugs, although that purchasing power will be decentralizedthrough private prescription drug and managed care plans.
Even before MMA, however, the government played a substantial role inpurchasing prescription drugs. Federal and state governments have longbeen providers of prescription drugs to various programs and popula-tions, but their role as purchaser is complicated. Industry representativeswarn that too much consolidation of government purchasing power wouldamount to price setting, which would negatively affect R&D efforts and
The MMA will have asignificant impact onthe pharmaceuticalmarket, particularlywith respect to drugaccess, prices, and salesvolume for the aged.

25
NHPF Background Paper August 24, 2004
the rate of development of new products. Policymakers try to providecost-effective access to prescription drugs for their populations in needwithout setting prices. As a result, a variety of drug purchasing programs,each different in design and administration, exist under the umbrella ofgovernment purchasing.
Medicaid, Medicare Part B, the Veterans Administration (VA), and thePublic Health Service (PHS) each have different approaches toward pur-chasing prescription drugs. Though each secures prescription drugs at adiscount, the size of the discounts and the methodologies for determin-ing and securing the discounted prices differ. Further complicating thesituation is that participation in certain programs is conditional on par-ticipation in others. This results in a complicated network of pricing anddiscount requirements for manufacturers wanting to sell their productsto federal programs.
Medicaid — The Medicaid program is currently the largest single pur-chaser of prescription drugs, accounting for 17 percent of national prescrip-tion drug expenditures in 200272; in that same year, Medicaid spendingreached $250 billion and served over 50 million beneficiaries, includingmore than 6 million low-income Medicare beneficiaries (that is, dual eli-gibles).73 Medicaid drug expenditures exceeded $23 billion in 2002, with$13.4 billion—approximately 58 percent of total drug expenditures—spenton dual eligibles.74
The Medicaid Prescription Drug Rebate program was created in 1990 outof concern for the costs Medicaid was paying for outpatient prescriptiondrugs. Though the rebates help state Medicaid programs receive discountssimilar to what is provided in the nonfederal market, states are seekingnew ways to contain their growing prescription drug costs. Medicaid drugspending has increased by more than 18 percent per year since 1997.75
The Medicaid drug rebate program requires manufacturers to enter intoagreements to provide states with rebates in order for their prescriptiondrug products to be covered by Medicaid. The rebate formula is based ontwo industry-reported prices: the average manufacturer price (AMP) andthe manufacturer’s best price as paid by pharmacies in the retail trade andlarge private sector entities (that is, nonfederal purchasers. The rebateamount a manufacturer must pay for brand name drugs is the greater of15.1 percent of the AMP or the difference between the AMP and the bestprice offered by the manufacturer to nonfederal purchasers. For genericdrugs, manufacturers must provide 11 percent of the AMP rebate.
The accuracy of a manufacturer’s reported pricing data directly affectsthe rebate amount owed. There is no uniform formula or definition ofmarkets to be used for calculating AMP. As a result, different manufac-turers include different markets in their AMP calculations, and the AMPcan be undervalued, which lowers a manufacturer’s rebate liability.AMP data is self-reported and considered proprietary, so the governmentgenerally does not audit manufacturers.
The Medicaid program,the largest single pur-chaser of prescriptiondrugs, accounted for 17percent of drug expen-ditures in 2002.

26
NHPF Background Paper August 24, 2004
“Best price” determinations can be misrepresented as well. Certain dis-counts and fees (for example, partnership fees) paid by manufacturers tovarious purchasers as part of purchasing negotiations are not included inthe definition of best price, yet they directly lower the price paid by somepurchasers. By excluding these discounts and fees from the best pricecalculation, any drug’s best price can be inflated, which also results inlower rebate liability.
To help contain cost increases for Medicaid drugs, states have imple-mented a variety of policies aimed at limiting use of certain medica-tions. These policies target expensive or risky medications and includethe use of PDLs, prior authorization, increased cost sharing, limits onprescriptions, and “fail first” requirements (in which alternative, inex-pensive drugs must be tried before an expensive one).76 States are alsoimplementing disease management programs to improve the effective-ness of treatment and care. The goal of these state cost-containment ef-forts is to reduce costs without reducing appropriate care.77 However,such policies can have powerful effects on high-volume prescriptiondrug users. Some of these cost-containment efforts may lose their ap-peal with the full implementation of the new Medicare outpatient pre-scription drug benefit when Medicare takes over the provision of suchdrugs to dually eligible beneficiaries.
Medicare Part B — Medicare Part B covers approximately 450 drugsand biologicals. Part B–covered drugs are purchased by physicians andother providers and are typically provided in an outpatient setting, suchas a dialysis center or doctor’s office. Part B–covered drugs include non–self-administered drugs furnished “incident to” a physician’s services,self-administered oral cancer and antinausea drugs, immunosuppres-sive drugs, and certain vaccines. In 2002, Medicare spent more than $8.4billion78 on outpatient drugs,79 with most of that cost attributed to 35drugs, primarily cancer, inhalation therapy, and oral immunosuppres-sive medications.80
Payment for Part B drugs has undergone several changes and has beenscrutinized for years. Medicare Part B drugs have been reimbursed basedon the following models: the physician’s acquisition cost, 100 percent ofAWP, the lower of the estimated acquisition costs or 95 percent of AWP, 95percent of AWP, and 85 percent of AWP. The underlying problem with PartB reimbursement is that it has been found to exceed the actual prices atwhich providers are able to acquire the drugs, resulting in overpayment.
In an effort to address the overpayment issue, MMA established a newpayment system based on manufacturer’s ASP. Manufacturers are requiredto report their drugs’ ASPs to the Centers for Medicare and MedicaidServices (CMS) on a quarterly basis. This is to ensure that reimbursementreflects market prices. The switch to payment based on ASP is expectedto bring reimbursement in line with Medicare provider acquisition costsfor drugs and biologics covered under Part B. Payment for Part B drugs
In 2002, Medicarespent more than $8.4billion on outpatientdrugs, most of which isattributable to 35 med-ications.

27
NHPF Background Paper August 24, 2004
has been highly controversial, however, and continuing debate surround-ing these policies is likely.
VA — The VA purchases drugs based on actual prices paid by privatepurchasers. The VA negotiates directly with drug manufacturers to gar-ner the discount prices available through the Federal Supply Schedule(FSS). The FSS is a catalogue of a broad range of products and pricesavailable to federal government purchasers [for example, the VA and theDepartment of Defense (DoD)]. The FSS for pharmaceuticals contains over23,000 products, including brand name and generic products, and is main-tained by the VA. The VA purchases over 70 percent of the government’stotal prescription drug purchases from the FSS.
The amount of the discount depends on how successful the VA is in nego-tiating the price, but the goal is to obtain a discount equal to the largestdiscount given to most-favored nonfederal customers. Many FSS pricesare as much as 50 percent below the nonfederal AMP.
There is a federal ceiling price that applies to roughly one-quarter of theschedule’s drugs. However, these drugs represent approximately 75 per-cent of the dollars spent. The ceiling price, equal to 76 percent of thenonfederal AMP, can be accessed only by the VA, DoD, the Indian HealthService, and the Coast Guard.
The VA also uses competitive bidding to obtain favorable prices for certaindrugs. Through competitive bidding, the VA can obtain national contractsfor selected drugs that are priced lower than the FSS prices. In 2000, the VAcontract prices averaged 33 percent less than corresponding FSS prices.81
Drug companies voluntarily participate in the FSS for several reasons.One is that participation in FSS is required in order to participate in Med-icaid, which is a much larger percent of total U.S. sales. Another reason isthat many physicians receive at least part of their medical training at VAhospitals, and the manufacturers have every incentive to have their drugsavailable to physicians in training who will theoretically continue to pre-scribe the same drugs when they leave the VA system. Finally, the per-centage of U.S. sales subject to the discount is relatively small. Becausethe FSS was not designed for use by retail pharmacies, there is a cleardelineation between retail pricing strategies and FSS pricing for manu-facturers, such that providing FSS discounts will have a relatively smallimpact on other areas of business.
PHS Entities — Section 340 B of the Public Health Service Act estab-lishes an up-front price break on prescription drugs for safety net pro-viders who are not covered by the Medicaid drug rebate program or thefederal ceiling price provisions under FSS. Organizations qualified topurchase at the discounts include Community Health Centers, RyanWhite grantees, and ADAPs (AIDS Drug Assistance Programs). Manu-facturers wanting to sell their products to these safety net providers mustsign federal agreements to provide drugs at a discount, which is linked to
The VA can obtain na-tional contracts for se-lected drugs; in 2000,contract prices aver-aged 33 percent lessthan correspondingFSS prices.

28
NHPF Background Paper August 24, 2004
the rebate provided to the Medicaid program. Under the agreement, drugprices for 340 B entities cannot exceed a ceiling price that is defined instatute as AMP, less the Medicaid rebate percentage. Usually, the pricesare in line with what Medicaid ultimately pays. Manufacturers wantingto participate in other federal programs such as Medicaid must sign 340B federal agreements to provide drugs to these safety net providers at the340 B prices.
Although manufacturers that want to sell drugs to the government un-der this program are required to sell them at a defined discount, 340 Bentities are not required to purchase their drugs at that price. Some enti-ties choose not to participate in the purchasing program because theybelieve they can negotiate better prices on their own. To simplify the pro-cess for obtaining 340 B drugs, the Health Resource and Services Agency(HRSA) has established a prime vendor program in which a single “pre-ferred” wholesaler, AmerisourceBergen, supplies prescription drugs tocovered entities at or below 340 B prices.
NEW CHALLENGESThe prescription drug market is changing. In addition to drug costs thatcontinue to climb, new challenges on the horizon affect stakeholders in-dividually and the market collectively. The government’s role in the mar-ket is changing as well, as policymakers continue to take steps to combatgrowing drug costs, provide cost-efficient access, encourage new drugdevelopment, and ensure safety.
The implementation of the new Medicare drug benefit will impact drugaccess, prices, and prescription volume for the industry’s largest consumergroup, and it will also create new dynamics in the government’s role. Thefederal government will continue to rely on the retail market to deter-mine prices; however, in an effort to minimize market disruption, therewill be no set price ceilings or formulas as there are in other federal pur-chasing programs to contain costs.
A dynamic shift between state and federal governments will occur, andMedicare beneficiaries also eligible for Medicaid will now receive drugbenefits through Medicare (instead of Medicaid). However, MMA’s“clawback” provisions require states to continue financing much of the costof prescription drug coverage for the Medicaid population. States are con-cerned that they will remain financially at risk for drug costs but will nothave direct control in how the prescription drug benefit is managed, giv-ing them little ability to contain cost or influence quality of care.
It is also unclear whether the significantly increased federal role in fi-nancing prescription drugs will influence the other ways in which thefederal government interacts with the prescription drug market. Theongoing debate related to the importation of prescription drugs suggeststhat regulatory and research policies may be shaped, in part, by financial
In addition to drugcosts that continue toclimb, new challengesare on the horizon thataffect stakeholdersindividually and themarket collectively.

29
NHPF Background Paper August 24, 2004
concerns. Although policy discussions related to importation precededthe enactment of the Medicare drug benefit, many feel that thegovernment’s newly expanded financial stake in prescription drugs hashelped to provide political traction for this issue. Similarly, many policyanalysts are beginning to question whether FDA should consider cost-effectiveness in its approval process. Such a policy would be extremelycontroversial, and it remains to be seen whether Medicare financial pres-sures will have an impact on such debates.
These and other challenges will continue to generate much discussion inand out of Washington as the prescription drug marketplace, its variousstakeholders, and the government evolve to meet their individual needsand maximize their positions within this very profitable and importantsector of the U.S. economy.
ENDNOTES1. Office of the Actuary, National Health Statistics Group, “Table 2: National Health Expen-ditures Aggregate Amounts and Average Annual Percent Change, by Type of Expenditure:Selected Calendar Years 1980-2002,” Centers for Medicare and Medicaid Services, revisedJanuary 8, 2004; available at www.cms.hhs.gov/statistics/nhe/historical/t2.asp.
2. Office of the Actuary, National Health Statistics Group, “The Nation’s Health Dollar,2002: Where it Went”; Centers for Medicare and Medicaid Services, revised January 8, 2004;accessed May 1, 2004, at www.cms.hhs.gov/statistics/nhe/historical/chart.asp.
3. Katharine Levit et al., “Health Spending Rebound Continues in 2003,” Health Affairs(January/February 2004): 154–155.
4. Office of the Actuary, “Highlights – National Health Expenditures, 2001,” Centers forMedicare and Medicaid Services.
5. IMS Health, “IMS Reports 11.5 Percent Dollar Growth in ’03 U.S. Prescription Sales”;accessed March 19, 2004 at www.imshealth.com/ims/portal/front/articleC/0,2777,6599_3665_44771558,00.html.
6. IMS Health, “Leading 20 Corporations by U.S. Sales, 2003"; accessed March19, 2004 atwww.imshealth.com/ims/portal/front/articleC/0,2777,6599_42720942_44304255,00.html.
7. Generic Pharmaceutical Association, “Frequently Asked Questions”; accessed January26, 2004 at www.gphaonline.org/aboutgenerics/faqs.html.
8. Generic Pharmaceutical Association, “Generic Pharmaceutical Facts at a Glance”;accessed August 12, 2004 at www.gphaonline.org/aboutgenerics/factsabout.html.
9. Centers for Medicare and Medicaid Services, Health Care Industry Market Update: Phar-maceuticals, January 10, 2003, 35; available at www.cms.hhs.gov/reports/hcimu/hcimu_01102003.pdf.
10. CMS, Health Care Industry Market Update: Pharmaceuticals, 35.
11. VA Pharmacy Formulary Analysis Committee, Division of Health Care Services,Description and Analysis of the VA National Formulary, David Blumenthal and Roger Herdman,Eds., Institute of Medicine(Washington, DC: National Academy Press, January 1, 2000).
12. IMS Health, “IMS Reports 11.5 Percent Dollar Growth.”
13. IMS Health, “IMS Reports 11.5 Percent Dollar Growth.”
14. IMS Health, “IMS Reports 11.5 Percent Dollar Growth.”

30
NHPF Background Paper August 24, 2004
15. IMS Health, “Leading 20 Products by Total U.S. Dispensed Prescriptions, 2003";accessed March 19, 2004 at www.imshealth.com/ims/portal/front/articleC/0,2777,6599_42720951_43989671,00.html.
16. Pharmaceutical Research and Manufacturers Association (PhRMA), PharmaceuticalIndustry Profile 2003, (Washington, DC: PhRMA, 2003), 10.
17. PhRMA, Pharmaceutical Industry Profile 2003, 11.
18. PhRMA, Pharmaceutical Industry Profile 2003, 2–5.
19. Joseph A. DiMasi, Ronald W. Hansen, Henry G. Grabowski “The Price of Innovation:New Estimates of Drug Development Costs” Journal of Health Economics, 22 (2003) 151–185.
20. Tufts Center for the Study of Drug Development “Total Cost to Develop a new Pre-scription Drug, Including Cost of Post Approval Research is $897,” May 13, 2004; accessedJune 24, 2004 at http://csdd.tufts.edu/NewsEvents/RecentNews.asp?newsid=29.
21. Michael Gluck, Georgetown University Institute for Health Care Research and Policy,“Federal Policies Affecting the Cost and Availability of New Pharmaceuticals,” preparedfor The Kaiser Family Foundation, July 2002; available at www.kff.org/rxdrugs/loader.cfm?url=/commonspot/security/getfile.cfm&PageID=14078.
22. The Orphan Drug Act of 1983, P.L. 98-551. Orphan drugs are for orphan diseases whichare defined in P.L. 98-551 as the following: “...the term rare disease or condition means anydisease or condition which (a) affects less than 200,000 persons in the U.S. or (b) affectsmore than 200,000 persons in the U.S. but for which there is no reasonable expectation thatthe cost of developing and making available in the U.S. a drug for such disease or condi-tion will be recovered from sales in the U.S. of such drug.”
23. Gluck, “Federal Policies,” 10.
24. Gluck, “Federal Policies,” 19.
25. Gluck, “Federal Policies,” 19.
26. Gluck, “Federal Policies,” 23.
27. In 1995 Congress repealed the tax credit for firms that make new investments in PuertoRico, and established a 10 year phase out for firms already benefitting from this tax credit.
28. IMS Health, “IMS Reports 11.5 Percent Dollar Growth.”
29. Food and Drug Administration (FDA), “Approval Times for Priority and StandardNMEs Calendar Years 1993-2003,” January 21, 2004; accessed January 30, 2004 atwww.fda.gov/cder/rdmt/NMEapps93-03.htm.
30. Iain Cockburn, “The Changing Structure of the Pharmaceutical Industry” Health Affairs,23, no. 1 (January/February 2004): 10–21.
31. “Solid Performance and Products that Matter: Biotechnology on a Roll Health into BIO2004,” BIO, press release June 3, 2003.
32. Reported by IMS Health for 12 months that ended in November 2003 (IMS Health, “IMSSession at BIO 2003 to Feature Leading BIOTech CEOs,” press release accessed June 10, 2004at www.imshealth.com/ims/portal/front/articleC/0,2777,6599_5266_43216296,00.html).
33. Cockburn, “The Changing Structure,” 16.
34. IMS Health, “Total U.S. Promotional Spend by Type”; accessed March 2004 atwww.imshealth.com/ims/portal/front/articleC/0,2777,6599_41551570_41718516,00.html.
35. Pankaj Kumar and Ana-Maria Zaugg, “IMS Review: Steady but Not Stellar” IMS HealthBusiness Watch, May 2003; accessed January 12, 2004 at http://www.imshealth.com/vgn/images/portal/cit_40000873/42912029Business%20Watch.pdf.
36. Kumar and Zaugg, “IMS Review.”

31
NHPF Background Paper August 24, 2004
37. Lisa Tercha and Mark Gleason, “E-marketing at the point of prescription”; accessedJanuary 13, 2004 at www.imshealth.com/vgn/images/portal/cit_40000873/40876142E-prescribing-MMM.pdf.
38. Meredith B. Rosenthal et al., “Promotion of Prescription Drugs to Consumers,” NewEngland Journal of Medicine, 346, no. 7 (February 14, 2002): 498–505.
39. Rosenthal, “Promotion of Prescription Drugs to Consumers.”
40. U.S. General Accounting Office, “Prescription Drugs: FDA Oversight of Direct-to-Con-sumer Advertising Has Limitations” (GAO-03-177), October 2002; available atwww.gao.gov/new.items/d03177.pdf.
41. Generic Pharmaceutical Association, “Generic Pharmaceutical Facts at a Glance.”
42. IMS Health, “IMS Reports 11.5 Percent Dollar Growth.”
43. The regulatory definition of bioequivalence can be found in title 21 of the Code ofFederal Regulations, section 320.1(e).
44. PhRMA, Pharmaceutical Industry Primer 2001, (Washington, DC: PhRMA, 2001), 4, cita-tion of C. E. Barfield and C. Beltz, “Balancing and Rebalancing the National Interest in thePatent System,” American Enterprise Institute, October 1995.
45. CMS, Health Care Industry Market Update: Pharmaceuticals, 26.
46. Kaiser Family Foundation, “Kaiser Public Opinion Update: The Public and Prescrip-tion Drugs,” September 2000; accessed on May 5, 2004 at www.kff.org/rxdrugs/loader.cfm?url=/commonspot/security/getfile.cfm&PageID=13541.
47. Cynthia Smith, “Retail Prescription Drug Spending in the National Health Accounts”Health Affairs, 23, no. 1 (January/February 2004): 160–167.
48. Smith, “Retail Prescription Drug Spending.”
49. M. B. Levit et al., “Health Spending Rebound,” 157.
50. For more information see Robin J. Strongin, “The ABCs of PBMs,” Issue Brief 749,National Health Policy Forum, October 27, 1999.
51. IMS Health, “U.S. Purchase Activity by Channel, 2003"; accessed March 19, 2004 atwww.imshealth.com/ims/portal/front/articleC/0,2777,6599_42720942_44800060,00.html.
52. IMS Health, “U.S. Purchase Activity by Channel, 2003.”
53. David H. Kreling et al., “Prescription Drug Trends—A Chartbook,” Kaiser Family Foun-dation, July 2000, 79.
54. For a more in depth review of AWP see Dawn M. Gencarelli, “Average Wholesale Pricefor Prescription Drugs: Is There a More Appropriate Pricing Mechanism?” Issue Brief 775,National Health Policy Forum, June 7, 2002.
55. Food and Drug Administration, “Profile of the Prescription Drug Wholesaling In-dustry,” attachment G of “The Prescription Drug Marketing Act,” Report to Congress,Department of Health and Human Services, June 2001; accessed December 11, 2003 atwww.fda.gov/oc/pdma/report2001.
56. Peter Barton Hutt and Richard A. Merrill, Food and Drug Law: Cases and Materials, Uni-versity Casebook Series (New York: Foundation Press, ed. 2, 1991), 13.
57. Hutt and Merrill, Food and Drug Law, 13.
58. FDA Consumer Special Report, “Benefit vs. Risk: How CDER Approves New Drugs,”Food and Drug Administration, revised January 1995; accessed January 12, 2004 atwww.fda.gov/fdac/special/newdrug/benefits.html.
59. FDA, “Benefit vs. Risk.”
60. C. D. Mullins, F. Palumbo, B. Stuart, “Projections of Drug Approvals, Patent Expira-tions, and Generic Entry from 2000 to 2004,” background report for the U.S. Department
32
NHPF Background Paper August 24, 2004
of Health and Human Services conference “What is known and what needs to be knownabout prescription drug costs and pricing practices.” August 8–9, 2000, GeorgetownUniversity, Washington, DC.
61. FDA, “Benefit vs. Risk.”
62. Reviews for NDAs are designated as either “standard” or “priority.” A standard desig-nation sets a time frame target for completing all aspects of a review and FDA taking actionon the application (i.e., approve, not approve) of 10 months after the date is was filed. Apriority designation sets the target for FDA action at 6 months.
63. PhRMA, Pharmaceutical Industry Profile 2003.
64. FDA, “Benefit vs. Risk.”
65. FDA, “Benefit vs. Risk.”
66. Eric G. Campbell et al., “Inside the Triple Helix: Technology Transfer and Commercial-ization in the Life Sciences” Health Affairs, 25, no. 1 (January/February 2004 ): 64–76.
67. U.S. General Accounting Office (GAO), “Technology Transfer: NIH-Private Sector Part-nership in the Development of Taxol” (GAO-03-829), June 4, 2003; available atwww.gao.gov/new.items/d03829.pdf.
68. Campbell et al., “Inside the Triple Helix.”
69. Campbell et al., “Inside the Triple Helix.”
70. GAO, “Technology Transfer.”
71. GAO, “Technology Transfer.”
72. Kaiser Commission on Medicaid and the Uninsured, “The Medicaid Program at aGlance,” fact sheet, January 2004; accessed June 23, 2004 at www.kff.org/medicaid/loader.cfm?url=/commonspot/security/getfile.cfm&PageID=30463.
73. Kaiser Commission, “The Medicaid Program.”
74. Kaiser Commission, “The Medicaid Program.”
75. Stephen Soumerai, “Benefits and Risks of Increasing Restrictions on Access to CostlyDrugs in Medicaid.” Health Affairs, 23, no. 1 (January/February 2004): 135–146.
76. Soumerai, “Benefits and Risks.”
77. For more information on state cost containment efforts see Dawn M. Gencarelli, “Med-icaid Prescription Drug Coverage: State Efforts to Control Costs,” National Health PolicyForum, Issue Brief 790, May 10, 2003.
78. Medicare Payment Advisory Commission (MedPAC), A Data Book: Healthcare Spendingand the Medicare Program, June 2004, 161; available at www.medpac.gov/publications/congressional_reports/Jun04DataBook_Entire_report_links.pdf.
79. Does not include drugs provided through hospital outpatient departments or dialysisfacilities.
80. William J. Scanlon, U.S. General Accounting Office, “Medicare Part B Drugs: ProgramPayments Should Reflect Market Prices” (GAO-01-1142T), testimony before the Subcom-mittee on Health and the Subcommittee on Oversight and Investigations, Committee onEnergy and Commerce, U.S. House of Representatives, September 21, 2001; available atwww.gao.gov/new.items/d011142t.pdf.
81. Scanlon, testimony.

33
NHPF Background Paper August 24, 2004
APPENDIX 1: Glossary
Accelerated Approval: A process used by FDA to speed approval of drugspromising significant benefit over existing therapy for serious or life-threatening illnesses.
Bioequivalence: Scientific basis on which generic and name brand drugs arecompared. To be considered bioequivalent, the rate and extent to which thedrugs are absorbed or otherwise available to the treatment site in the bodycannot be significantly different.
Clinical Trials: Human studies designed to distinguish a drug’s effect fromother influences. Clinical trials conducted in the United States must be underan approved IND and in accord with FDA rules on human studies and in-formed consent of participants.
IND: Investigational New Drug application. Drug sponsors must submit anIND application to the FDA before beginning tests of a new drug on humans.
New Molecular Entity (NME): A compound that can be patented which hasnot been previously approved by FDA.
Parallel Track Mechanism: FDA policy that makes promising investigationaldrugs for AIDS and other HIV-related diseases available under special proto-cols while the controlled clinical trials for the drugs are being conducted. Thismechanism is designed to make the drugs more widely available to patientswho have no therapeutic alternatives and cannot participate in clinical trials.
Phase I Clinical Trials: The first trials in humans that test a compound forsafety, tolerance and pharmacokinetics. The trials usually involve normal,healthy volunteers.
Phase II Clinical Trials: Pilot studies to define efficacy and safety in selectedpopulations of patients with the disease or condition to be treated, diagnosed,or prevented.
Phase III Clinical Trials: Expanded clinical trials intended to gather additionalevidence of effectiveness for specific indications and to better understandsafety and drug-related adverse effects.
Phase IV: Studies performed after a drug is approved for marketing. Studiesare used to determine incidence of adverse reactions and long-term effects ofthe drug and for marketing comparisons against other products and uses.
Preclinical studies: Studies that test a drug on animals and other nonhumantest systems.
Treatment IND: Mechanism for FDA to allow use of investigational productsin expanded access protocols, which are generally unrestricted studies to learnmore about a drug and provide treatment for people with immediately life-threatening or otherwise serious diseases for which there is no real alternative.

34
NHPF Background Paper August 24, 2004
APPENDIX 2: Legislation Guide
Food and Drugs Act (1906): The first drug law. It required only that drugsmeet standards of strength and purity. The burden of proof was on the gov-ernment to show that a drug’s labeling was false and fraudulent before itcould be taken off the market.
Federal Food, Drug and Cosmetic Act (1938): Under this law, manufactur-ers were required for the first time to prove the safety of a drug before it couldbe marketed. This congressional action was prompted by the “elixir sulfanil-amide” tragedy of 1937 in which over 100 people died from a poisonous in-gredient in the product.
Kefauver-Harris Drug Amendments (1962): Considered the most significantchange to U.S. drug law, the drug amendments of 1962 required drug manu-facturers to demonstrate effectiveness for the product’s intended use as wellas its safety.
Stevenson-Wydler Technology Innovation Act (1980): Established that in-ventions owned by the government remain the property of the agencies thatproduce them. Also provided guidelines and priorities that encourage com-mercialization of government inventions through the licensing of technology toU.S. businesses.
Bayh-Dole Act (1980): Authorized federal agencies to execute license agree-ments with commercial entities to promote the development of federally ownedinventions and to collect royalties for such licenses. Business, universities andnonprofit organizations can retain title to and profit from inventions arisingfrom their federally funded research; however, the government retains the rightto use the inventions without paying royalties.
Orphan Drug Act (1983): Allowed drug manufacturers to receive seven-yearmarketing exclusivity and tax deductions for the majority of the clinical trialcosts for drugs and other products for treating rare diseases. Financial incen-tives are intended to encourage research and development of these “orphan”drugs which provide little or no profit to the manufacturer but may benefitpeople with these diseases.
Drug Price Competition and Patent Term Restoration Act (1984): This lawallowed generic drug approval under abbreviated new drug applications, mak-ing it less costly and time-consuming for generic drugs to reach the market. Thelaw also provided restoration of lost patent protection for innovator products.
Prescription Drug User Fee Act (1992): Established fees, including establish-ment fees, application fees, and products fees, to be paid by manufac-turers. Fees were used to expand staff and quicken the new drug applicationreview process.
FDA Modernization Act (1997): Contained sweeping changes to Food, Drugand Cosmetic Act of 1938, including the reauthorization of the Prescription

35
NHPF Background Paper August 24, 2004
Drug User Fee Act. The act also codified FDA’s accelerated approval regula-tions and required guidance on fast-track policies and procedures.
Medicare Prescription Drug, Improvement and Modernization Act (2003):Established a new voluntary outpatient prescription drug benefit under Medi-care that will go into effect in 2006. Created a transition program involvingdrug discount purchasing cards effective in 2004. Replaced average whole-sale price (AWP) as basis for prescription drug reimbursement under Part Bwith average sales price (ASP).
Appendix 2, continued