fundamentals of electro- and thermochemistry in the...
TRANSCRIPT

Fundamentals of electro- and thermochemistry in the anode ofsolid-oxide fuel cells with hydrocarbon and syngas fuels—a
review
J. Hannaa,∗, W.Y. Leea, Y. Shib, A.F. Ghoniema
aDepartment of Mechanical Engineering, Massachusetts Institute of Technology, Cambridge, MA02139, USA.
bDepartment of Thermal Engineering, Tsinghua University, Beijing 100084, China.
Abstract
High fuel flexibility of solid-oxide fuel cells (SOFCs) affords the possibility to use rel-
atively cheap, safe, and readily available hydrocarbon (e.g., CH4) or coal syngas (i.e.,
CO-H2 mixtures) fuels. Utilization of such fuels would greatly lower fuel cost and increase
the feasibility of SOFC commercialization, especially for near-term adoption in anticipa-
tion of the long-awaited so-called “hydrogen economy.” Current SOFC technology has
shown good performance with a wide range of hydrocarbon and syngas fuels, but there
are still significant challenges for practical application. In this paper, the basic operating
principles, state-of-the-art performance benchmarks, and SOFC-relevant materials are
summarized. More in-depth reviews on those topics can be found in Kee and co-workers
[Combust. Sci. and Tech. 2008;180:1207–1244 and Proc. Combust. Inst. 2005;30:2379–
2404] and McIntosh and Gorte [Chem. Rev. 2004;104:4845–4865]. The focus of this re-
view is on the fundamentals and development of detailed electro- and thermal (or simply,
electrothermal) chemistry within the SOFC anode, including electrochemical oxidation
mechanisms for H2, CO, CH4, and carbon, as well as the effects of carbon deposition and
sulfur poisoning. The interdependence of heterogeneous chemistry, charge-transfer pro-
cesses, and transport are discussed in the context of SOFC-membrane-electrode assembly
(MEA) modeling.
Keywords: SOFC, hydrocarbon, syngas, elementary chemistry and electrochemistry,
modeling
Preprint submitted to Elsevier February 18, 2013

Contents
1 Introduction 3
2 Operating principles and materials 4
2.1 Requirements of the membrane-electrode assembly . . . . . . . . . . . . . 5
2.2 Common SOFC electrolyte and electrode materials . . . . . . . . . . . . . 5
3 Modeling of SOFC membrane-electrode assemblies 11
3.1 Equilibrium, open-circuit, or Nernst potential . . . . . . . . . . . . . . . . 12
3.2 Current-dependent overpotentials . . . . . . . . . . . . . . . . . . . . . . . 14
3.2.1 Activation overpotential. . . . . . . . . . . . . . . . . . . . . . . . 16
3.3 Role of electrochemistry in SOFC anode models . . . . . . . . . . . . . . . 18
3.3.1 Formulation for detailed kinetics. . . . . . . . . . . . . . . . . . . 18
3.3.2 Butler-Volmer kinetics. . . . . . . . . . . . . . . . . . . . . . . . . 24
4 Electrochemistry in SOFC anodes 29
4.1 H2 electrochemical oxidation . . . . . . . . . . . . . . . . . . . . . . . . . 30
4.1.1 Hydrogen spillover. . . . . . . . . . . . . . . . . . . . . . . . . . . 30
4.1.2 Oxygen spillover. . . . . . . . . . . . . . . . . . . . . . . . . . . . 37
4.1.3 Interstitial hydrogen charge transfer. . . . . . . . . . . . . . . . . 38
4.1.4 Improved and combined mechanisms. . . . . . . . . . . . . . . . . 39
4.1.5 The role of surface diffusion. . . . . . . . . . . . . . . . . . . . . . 41
4.1.6 Detailed mechanism with kinetic data. . . . . . . . . . . . . . . . 42
4.2 CO electrochemical oxidation . . . . . . . . . . . . . . . . . . . . . . . . . 45
4.2.1 CO electrochemical oxidation mechanisms. . . . . . . . . . . . . . 46
4.2.2 The role of surface diffusion. . . . . . . . . . . . . . . . . . . . . . 49
4.2.3 Detailed mechanism with kinetic data. . . . . . . . . . . . . . . . 51
4.2.4 Summary of published mechanisms. . . . . . . . . . . . . . . . . . 54
4.2.5 Unstable reaction rates. . . . . . . . . . . . . . . . . . . . . . . . 55
4.3 Syngas electrochemical oxidation . . . . . . . . . . . . . . . . . . . . . . . 56
4.4 Hydrocarbon electrochemical oxidation . . . . . . . . . . . . . . . . . . . . 59
4.5 Carbon electrochemical oxidation . . . . . . . . . . . . . . . . . . . . . . . 61
∗Corresponding author. Fax: +1 617-253-5981; Tel: +1 617-253-2411Email address: [email protected] (J. Hanna)
2

5 Thermochemistry in SOFC anodes 77
5.1 Reforming and shifting reactions . . . . . . . . . . . . . . . . . . . . . . . 77
5.1.1 Steam reforming. . . . . . . . . . . . . . . . . . . . . . . . . . . . 79
5.1.2 Dry reforming. . . . . . . . . . . . . . . . . . . . . . . . . . . . . 80
5.1.3 Partial oxidation. . . . . . . . . . . . . . . . . . . . . . . . . . . . 80
5.1.4 Autothermal reforming. . . . . . . . . . . . . . . . . . . . . . . . 80
5.1.5 Thermal decomposition. . . . . . . . . . . . . . . . . . . . . . . . 81
5.2 Carbon deposition . . . . . . . . . . . . . . . . . . . . . . . . . . . . . . . 81
5.2.1 Deposition and growth mechanisms. . . . . . . . . . . . . . . . . 82
5.2.2 Coking resistant anode materials. . . . . . . . . . . . . . . . . . . 86
5.3 H2S poisoning and oxidation . . . . . . . . . . . . . . . . . . . . . . . . . 89
5.3.1 H2S poisoning. . . . . . . . . . . . . . . . . . . . . . . . . . . . . 89
5.3.2 H2S as a fuel, rather than pollutant. . . . . . . . . . . . . . . . . 90
6 Concluding remarks 94
1. Introduction
Solid-oxide fuel cells (SOFCs) are the most efficient devices known to convert the
chemical energy of a fuel directly into electricity.1 Research on SOFCs is vast, and their
development has been long and continuous, primarily because these devices carry a set
of attractive features.1–17 SOFCs (and other fuel cells) offer high conversion efficiencies
and an environmentally friendly alternative to modern combustion-based systems, but
their high operating temperature (600–1000C) allows greater fuel flexibility than most
other fuel cells (though materials selection and sealing can be an issue at very high
temperatures).
The high fuel flexibility of SOFCs affords the possibility to use relatively cheap, safe,
and readily available carbon-based fuels instead of hydrogen. Additionally, CO2 capture
in SOFC-based systems can be achieved at lower cost and lower system complexity than
in conventional combustion systems, because the fuel and oxidizer in a SOFC are not in
direct contact as in traditional combustion processes. This facilitates CO2 sequestration
without the need for expensive gas-separation technologies.
3

Despite the apparent promise and advantages of SOFC as an energy-conversion tech-
nology, several obstacles must be overcome before SOFCs move beyond the early stages
of commercialization. For example, improving efficiencies without the use of precious
metal catalysts, finding catalysts with higher tolerances to fuel impurities, preventing
deactivation of the anode as a result of carbon deposition when using carbon-based fu-
els, long-term operational reliability and durability, sealing problems, stack and system
integration issues, and overall production costs.
A comprehensive review on the operating principles, performance, and current chal-
lenges associated with SOFCs utilizing hydrocarbon and syngas fuels can be found in Kee
and co-workers5,6 and McIntosh and Gorte.18 In this paper, we provide a further review
on the research and developmental status of typical hydrocarbon- or coal-syngas-fueled
SOFCs by focusing on the following topics:
• fundamental mechanisms of electrode chemical and electrochemical reactions, specif-
ically in the anode;
• anode materials, particularly in the context of carbon deposition and tolerance to
sulfur poisoning;
• coupling of electro- and thermochemistry with transport in physics-based models
of SOFC membrane-electrode assemblies (MEAs).
A better understanding of these topics is essential for further improvement and optimiza-
tion of SOFCs operating on hydrocarbon or coal-derived fuels.
2. Operating principles and materials
The electrochemical charge-transfer reactions and some of the thermochemical (re-
forming) reactions in a SOFC take place in the membrane-electrode assembly (MEA)
as shown in Fig. 1. At the positive electrode (cathode), oxygen is reduced to generate
oxygen ions O2−, which are conducted through the electrolyte to the negative electrode
(anode), where they electrochemically oxidize the fuel (e.g., CO, H2, CH4) to produce
electrons, which flow through the external electrical circuit generating a current. During
this process, the Gibbs free energy (or chemical potential energy) of the global reaction
of fuel and oxidizer is converted into electricity and heat.4

2.1. Requirements of the membrane-electrode assembly
The membrane-electrode assembly (MEA) is the heart of any fuel cell. In a SOFC,
the MEA consists of a dense oxygen-ion-conducting electrolyte sandwiched between two
porous electrodes. On the anode side, gas species in the fuel channel are transported
through the porous cermet network of the electrode to electrochemically reactive sites
known as triple- or three-phase boundaries (TPBs). It is generally accepted that current-
producing charge-transfer reactions only occur at or very near the TPB, where the elec-
tron conductor (metal), ion conductor (oxide), and necessary gas-phase reactants (in the
pore space) come together. Each phase is necessary for the transport of reactants to or
removal of products from the reactive site. The interdependence of heterogeneous chem-
istry, charge-transfer reactions, and transport (ion, electron, and gas phase)—and the
influence of electrode microstructure on these processes—determine the rate and ability
of the cell to deliver current.
The basic operating principles of SOFCs determine key requirements for each compo-
nent. For instance, the electrolyte should possess maximum ionic conductivity and min-
imum electronic transport over a wide range of oxygen chemical potentials at relatively
high temperature. The anode and cathode should possess high catalytic activity for fuel
oxidation and oxygen reduction, respectively. In addition, the porous electrodes should
be designed with appropriate microstructure to provide an abundance of chemical and
electrochemical reaction sites (to promote charge-transfer), high solid-phase connectivity
(for electron and ion conduction), and a connected pore network (to reduce limitations
of mass transport).19–21 If one tries to produce a high-porosity cermet, the result may
be low connectivity between the solid phases and therefore low electrochemical activity;
if one tries to create more surface area for electrochemistry by creating smaller pores,
the result is hindered gas transport. SOFC components should also be mechanically and
chemically compatible, and should be stable under fabrication and operating conditions.
These requirements and other considerations (e.g., material degradation issues) are the
key driving forces for continued studies on SOFC materials.
2.2. Common SOFC electrolyte and electrode materials
As one of the core components of the MEA, the electrolyte is usually made of a dense
solid metal-oxide. One of the most common electrolyte materials in SOFCs is yttria-5

stabilized zirconia (YSZ)—zirconia (ZrO2) with 8% yttrium added as a dopant. In the
temperature range 650–1000C, YSZ is a good conductor of oxygen ions, O2−.1 In addi-
tion, a number of novel ionic conductors have been studied (for a brief review, the reader
is referred to Ref. 9), e.g., La1−xSrxGa1−yMgyO3−(x+y)/2 (LSGM)-based perovskites;
La2Mo2O9 (LAMOX); Bi4V2−xMxO11−y (BIMEVOX); several pyro-chlores with rela-
tively high ionic transport, such as (Gd,Ca)2Ti2O7−δ; apatite materials derived from
Ln10−xSi6O26±δ, where Ln represents a lanthanide-series element, collectively known as
rare-earth elements;15 as well as proton-conducting materials, which allow for a sig-
nificant decrease in operating temperature while improving performance.22 Moreover,
gadolinia-doped ceria (GDC), samaria-doped ceria (SDC), and other ceria-based elec-
trolytes have received a great deal of attention because of their ability to conduct oxygen
ions at lower temperatures than YSZ.23–27
The cathode in SOFCs is usually composed of porous perovskite materials, which
are oxides characterized by relatively good electronic conduction at high temperatures
in an oxidizing atmosphere. The most widely used cathode materials in SOFCs are
strontium-doped lanthanum manganite (La1−xSrxMnO3, or LSM), strontium-doped lan-
thanum colbaltite (La1−xSrxCoO3−δ, or LSC), the relatively novel strontium-doped lan-
thanum ferrite (La1−xSrxFeO3−δ, or LSF), and strontium-doped lanthanum cobalt fer-
rite (La1−xSrxCo1−yFeyO3−δ, or LSCF).12 These cathode materials act as mixed ionic-
electronic conductors (MIECs), which eliminates the need for a metal to serve as an
electrocatalyst and current collector. Unfortunately, many of the cathode materials are
excellent for applications in an oxidizing atmosphere, but are subject to reduction by the
fuel of an SOFC and therefore cannot be used on the anode side.
SOFC anodes are generally porous ceramic-metallic (cermet) composites of an elec-
trolyte (e.g., YSZ) and a metal (such as nickel, Ni). The metal acts as a catalyst to
promote fuel oxidation, and serves as an electronic conductor; while YSZ serves to con-
duct O2− ions up into the porous anode, effectively extending the TPB region, and
provides a support structure to prevent the sintering of nickel.11,16 The YSZ also helps
to closely match the thermal-expansion coefficients of the anode and electrolyte, pre-
venting cracking and leakage caused by thermal cycling. To convert hydrocarbon fuels,
Cu is preferred because of its resistance to carbon deposition, and ceria-based oxides
6

(e.g., Ce1−xGdxO2−δ, or GDC) are commonly used because ceria is an excellent elec-
trocatalyst for CH4 (in addition to being a good oxygen-ion conductor at reduced tem-
peratures).7,28,29 When using natural gas or coal syngas as a fuel, possible homogeneous
gas-phase reactions occurring within the anode include methane reforming, the water-gas
shift (WGS), methane cracking, the Boudouard reaction, and CO hydrogenation.
Porous Ni-YSZ cermets (and small variations thereof) are currently the most common
anode material used for SOFC applications because of their low cost, chemical stability
in reducing atmospheres at high temperatures, and closely matched thermal-expansion
coefficients with the dense YSZ electrolyte. In addition, nickel and YSZ are essentially
immiscible in each other and non-reactive over a wide temperature range. This enables
relatively simple preparation of Ni-YSZ anodes by sintering a mixture of NiO and YSZ
powders (generally in the range of NiO:YSZ = 1:1 by weight), then reducing in an atmo-
sphere of the gaseous fuel. However, the Ni-YSZ anode is especially prone to carbon de-
position when using carbon-based fuels, and exhibits low tolerance to sulfur. Additional
drawbacks include low oxidation/reduction cycling stability, and nickel agglomeration
with long-term operation.13,14,18,30,31 Nickel is an excellent catalyst for hydrocarbon fuel
reforming, shifting, and cracking, which leads to rapid carbon deposition inside the SOFC
anode and causes coking and deactivation at desired operating temperatures. To some
extent, optimizing SOFC operating conditions can avoid carbon deposition. For example,
increasing steam content can suppress carbon deposition by steam reforming and WGS
reactions. Also, reducing the operating temperature below 750C can prevent carbon
deposition on many oxides by disabling CH4 dissociation.24 Recent work has shown that
nanostructured barium-oxide/nickel (BaO/Ni) interfaces (created by vapor deposition of
BaO into Ni-YSZ) facilitate water-mediated carbon-removal reactions.32 The nanostruc-
tures readily adsorb water, and the dissociated OHad(BaO) from H2Oad(BaO) reacts
with Cad(Ni) near the BaO/Ni interface to produce CO and H species, which can be
electrochemically oxidized at the TPB in the anode. The BaO/Ni-YSZ anode displayed
stable operation and high power density in C3H8, CO, and gasified carbon fuels at 750C,
with no observable microstructural change and minimal carbon buildup.
In recent years, researchers have rigorously investigated SOFC performance with dif-
ferent fuels, including hydrogen, hydrocarbons, and syngas, and with various material
7

and support structures. Table 1 shows selected examples of cell performance from recent
studies, which provides a representation of the state-of-the-art research and developmen-
tal status of SOFCs fueled with hydrogen, hydrocarbon, or syngas. Because materials
Table 1Impact of fuel and MEA materials on SOFC performance
T Ppeak
Research group MEA composition (a/el/c) a (C) Fuel composition (W/cm2)
Jiang and Virkar, Ni-YSZ/YSZ-SDC/LSC-SDC 800 Pure H2 1.82003 (Ref. 33) 800 Pure CO 0.7
Liu and Barnett, Ni-YSZ/YSZ/LSM-YSZ 800 CH4+3% H2O 0.962003 (Ref. 34)
Lin et al., 2005 Ni-YSZ/YSZ/LSCF-GDC 800 H2+3% H2O 1.44(Ref. 35) 800 CH4+3% H2O 1.27
Shao et al., 2006 Ni-SDC/SDC/SDC-BSCF b 787 18.8% CH4+16.2% O2 0.76(Ref. 36) +65% He (by vol.)
Hibino et al., 2003 Ru-Ni-GDC/GDC/SSC c 600 H2+2.9% H2O 0.769(Ref. 37) 600 Dry CH4 0.750
600 Dry C2H6 0.716600 Dry C3H8 0.648
Park et al., 2000 Cu-CeO2-YSZ/YSZ/LSM-YSZ d 800 Pure H2 0.31(Ref. 38) 800 n-C4H10 0.18
Zhan and Barnett, NiO-YSZ/YSZ/LSCF-GDC e 770 5% iso-C8H18+9% air 0.62005 (Ref. 39) +86% CO2
Zhan and Barnett, NiO-SDC/SDC/LSCF-SDC f 600 H2+3% H2O 1.002006 (Ref. 26) 590 6% iso-C8H18+94% air 0.60
Yang et al., 2011 (BaO/Ni-YSZ)/YSZ/SDC-LSCF 750 Dry C3H8 0.88(Ref. 32) 750 CO+3% H2O 0.70
850 96% CO+1% H2g 1.08
a The membrane-electrode assembly (MEA) composition follows as “a” for anode/“el” for electro-lyte/“c” for cathode. All cells are anode supported unless otherwise noted.
b Single chamber cellc The cathode material is Sm0.5Sr0.5CoO3 (SSC).d Electrolyte-supported celle With an anode catalyst layer of Ru-CeO2/PSZ/Ru-CeO2f With an anode catalyst layer of Ru-CeO2/PSZ-CeO2/Ru-CeO2g This fuel mixture was produced using an integrated fluidized-bed gasifier operating with solid
carbon and CO2+3% H2O. The major species in the remaining 3% are H2O, CO2, and CH4.
8

are important for chemistry and electrochemistry, additional details of anode material
development with hydrocarbon and syngas fuels will be discussed in the next section.
9

Electrolyte (e.g., YSZ)Electrolyte (e.g., YSZ)Anode (e.g., Ni-YSZ)Anode (e.g., Ni-YSZ)
Cathode (e.g., LaMnO -YSZ)Cathode (e.g., LaMnO -YSZ)33
Air
Fuel
Load
i
e−
CO , H O2 2
CO, H , CH 42
OO2−2−
O2
ee−−ee−−ee−−ee−−
OO2−2−
OO2−2− OO2−2−
O2
Fig. 1.
10

3. Modeling of SOFC membrane-electrode assemblies
Detailed physics-based models are important for fuel cell development because they
afford the opportunity to study each process independently, as well as how one process
is connected to the others. It is difficult to study them experimentally in porous elec-
trodes because of, among other challenges, physical access limitations to inner regions
of the electrode. The fundamental conservation equations (e.g., momentum, energy, and
species transport) that underlie all models are more or less the same, but the detailed for-
mulations and implementations vary widely based on general assumptions and modeling
specifics.
Single-cell or MEA models are critical for informing larger macroscale models, but
they are also highly useful in interpreting and planning button-cell-type experiments, in-
vestigating rate-limiting processes, and exploring the impact of electrode microstructure
on fuel cell performance. Many of these models employ elementary chemistry and elec-
trochemistry coupled with complex porous-media transport in the electrodes. The level
of detail in such a model can vary widely, from detailed elementary reaction mechanisms
for heterogeneous chemistry40,41 and charge-transfer42–46 (each formulated from more
specific chemical-kinetics models and pattern-anode experiments), to reduced Butler-
Volmer representations based on an assumed rate-limiting or global reaction;47–49 and
from particle-level representations of the electrode microstructure,50 to averaged homog-
enized parameters describing its structure. Just as well, because porous-media transport
plays a central role in the performance in SOFCs, approaches to modeling mass transfer
are also widely varied. Due to the level of detail and physically-based foundation of the
MEA-type models, they can provide excellent predictive capabilities that can be used for
SOFC design and optimization.
The coupling and incorporation of electro- and thermochemistry with species trans-
port into physics-based models are discussed below. The discussion introduces the equa-
tions that need to be solved and terms to be evaluated based on chemical and electro-
chemical kinetics. The fundamental equations can be solved if the species’ (neutral and
charged) production rates are known. These rates are determined by the mechanisms
discussed in the second half of this paper.
11

3.1. Equilibrium, open-circuit, or Nernst potential
The reversible cell potential (Nernst potential) Erev between the fuel and oxidizer
streams is the theoretical maximum potential difference the cell could achieve for a given
fuel composition. Because of depletion and dilution of the fuel and oxidizer streams, this
potential can vary along the length of the cell. The Nernst potential is calculated as
Erev = −∆rG
neF= −∆G
neF− RT
neFln
(∏k
pνk
k
)(1)
where ∆rG and ∆G are the temperature-dependent Gibbs free energy of reaction and
standard-state free energy change, respectively, associated with the global oxidation re-
action, ne is the number of transferred electrons, F = 96485.34 C/mol is the Faraday
constant, R is the universal gas constant, T is the temperature, pk is the partial pressure
of species k (in atmospheres), and νk are the stoichiometric coefficients in the global
reaction (with νk < 0 for reactants). Assuming chemical equilibrium exists for species in
the anode channel,∏k p
νk,a
k,a = Kp = exp(−∆G/RT ), where Kp is the thermodynamic
equilibrium constant. The Nernst potential can therefore be written in terms of the
oxygen partial pressures in the anode and cathode channels
Erev = |νO2 |RT
neFln(pO2,c
pO2,a
)(2)
where |νO2 | is the absolute value of the stoichiometric coefficient for oxygen, and pO2,c
and pO2,a are the partial pressures of oxygen (in atmospheres) at the cathode and anode
(subscripts c and a), respectively. The anodic partial pressure pO2,a is determined by
equilibrium chemistry in the anode fuel channel. Note that regardless of which oxidation
reaction is taking place, the number of electrons per mole of oxygen is constant (i.e.,
ne/|νO2 | = 4). This is because the stoichiometry is set by the cathodic reduction reac-
tion, and is independent of fuel type (and therefore, the anodic half-cell reaction). The
influence of the anodic chemistry and electrochemistry appears indirectly through the
anode oxygen partial pressure pO2,a.
The overall half-cell reduction-oxidation (redox) reactions for four typical fuels (an-
12

ode) and oxygen (cathode) can be written as
Anode half-cell oxidation reactions:
H2(g) + O2−(el) H2O(g) + 2e−(a) (3)
CO(g) + O2−(el) CO2(g) + 2e−(a) (4)
CH4(g) + 4O2−(el) CO2(g) + 2H2O(g) + 8e−(a) (5)
C(s) + 2O2−(el) CO2(g) + 4e−(a) (6)
Cathode half-cell reduction reaction:
O2(g) + 4e−(a) 2O2−(el) (7)
Note that this nomenclature uses generic names in place of specific material names (i.e.,
“el” for electrolyte instead of “YSZ”); both will be used in this paper. To make the
Nernst equation concrete, consider the case of CO electrochemical oxidation, for which
the global oxidation reaction is
CO(g, a) +12
O2(g, a) CO2(g, a)
The reversible potential follows as
Erev =RT
2Fln
(p1/2O2,c
p1/2O2,a
)=RT
4Fln(pO2,c
pO2,a
)The approach to computing the reversible cell potential in Eq. 1 or Eq. 2 is not
obvious when many different global oxidation reactions can be written. For example,
consider the case of full or partial oxidation of methane, (i) CH4 + 2O2 CO2 + 2H2O
or (ii) CH4 + (1/2)O2 CO + 2H2, followed by oxidation of carbon monoxide and
hydrogen, CO + (1/2)O2 CO2 and H2 + (1/2)O2 H2O. It is not obvious which, if
any, should be used to calculate Erev, and the answer depends on which of the anode-side
half reactions is in partial equilibrium. If even a small amount of H2 is present in the
fuel stream, reaction 3 is likely to be close to partial equilibrium at open circuit, since
the elementary steps that comprise this global half reaction are all fast and reversible.6
Even if the entering fuel stream contains no H2, it may be generated in situ within the
anode by catalytic cracking, reforming, and/or shifting chemistry with a hydrocarbon
fuel. The open-circuit voltage (OCV) will therefore generally be close to the reversible13

potential for hydrogen oxidation, and not the higher value that would be obtained for
the global hydrocarbon-oxidation reaction.6
Fig. 2 shows the calculated reversible cell potential of different fuels over a range of
temperatures using Eq. 2. The results indicate that the reversible cell potential from
the oxidation of H2 (top left panel) or CO (top right) decreases with a higher system
temperature and increases with a higher system pressure. Alternatively, the reversible
cell potential from the full oxidation of CH4 (bottom left, straight lines) or solid carbon
(bottom right, slight negative-sloping line) is pressure independent. The influence of
controlling oxidation reaction on the OCV is illustrated graphically in the bottom two
panels. For both, the curves (as opposed to the straight lines) are calculated assuming
all anode-side half reactions are in partial equilibrium, so the fuel stream is in a state
of full chemical equilibrium and the reversible potential is calculated according to Eq. 2
using the equilibrium anode-side oxygen partial pressure. For methane oxidation, it
is immediately evident that full oxidation (straight lines) of CH4 determines the OCV
at lower temperatures, while partial oxidation (not shown) of CH4 is correlated to the
positive-sloping behavior at higher temperatures and higher methane partial pressures.
Moreover, oxidation of H2 contributes to the decreasing OCV at higher temperatures
and higher product partial pressures. For the electrochemical oxidation of solid carbon,
the competing oxidation mechanisms and their influence on the reversible cell potential
are very clear—at lower temperatures, full oxidation to CO2 is favored, while partial
oxidation to CO is preferred at higher temperatures.
3.2. Current-dependent overpotentials
Under operating conditions, the actual operating cell voltage Ecell will be reduced
from the open-circuit potential by several irreversibilities. These irreversibilities are
associated with various internal losses (polarizations), each characterized as a voltage
loss (overpotential). Common losses include the ohmic polarization loss ηohm due to
electronic and ionic resistivities; activation polarization losses (at the anode ηact,a and
cathode ηact,c) due to reaction barriers and charge-transfer limitations; concentration
polarization losses (at the anode ηconc,a and cathode ηconc,c) due to spatial variations
in reactant and product concentrations at chemically active sites (controlled by gas-
phase transport); and other losses ηother from mechanical contact resistance between14

the electrodes and the electrolyte structure, current leakage, leakage of oxygen from the
cathode to the anode due to inadequate sealing, and so on. In terms of current-dependent
overpotentials, the operating cell potential may be written as
Ecell = Erev −ηact,a(i)− ηconc,a(i)− ηohm(i)
−ηact,c(i)− ηconc,c(i)− ηother(i) (8)
Each of the overpotentials increases with increasing current density i, so the difference
Erev − Ecell also increases (i.e., as the cell delivers higher current, the internal losses
increase, and the operating potential moves further from the reversible potential). The
limiting current is reached when the sum of the internal losses equals the reversible
potential and Ecell = 0. Moreover, each of the overpotentials can be obtained from MEA
models, facilitating a better understanding of the sources of loss and how to minimize
them.
There are inherent limitations to beginning with the Nernst potential and subtract-
ing various overpotentials according to Eq. 8, namely its application to equilibrium fuel
mixtures only (e.g., it cannot be applied to non-equilibrated CH4-H2O mixtures) and the
required Butler-Volmer assumption used to compute an activation overpotential (which
disallows the use of a full elementary kinetic description of the electrochemistry). How-
ever, this traditional view of fuel-cell function has practical utility in developing predictive
models, and provides a platform to research, characterize, and understand each of the po-
larization losses. The reader is referred to Kee and co-workers47,48,51 for an explanation
and discussion of each of the overpotentials. We provide an overview of the concentration
and ohmic overpotentials in Appendix A.
Fig. 3 illustrates the dependence of cell voltage and power density on current density
for a fuel mixture of 50% H2 in H2O. The shaded areas elucidate the relative magnitudes
and contributions of the various overpotentials plotted in a cumulative fashion (i.e., each
overpotential appears as its value plus the sum of overpotentials below it). In other words,
the top of the shaded region is a quantitative measure of the total amount of available
chemical potential that is used to overcome internal losses, decreasing the cell potential
from its open-circuit value. The curves are calculated using a one-dimensional anode-
supported MEA model already described in the literature.47–49 Because the cathode is
15

very thin, the cathode concentration overpotential is essentially zero. Different MEA
structures will have different characteristic overpotentials and performance curves based
on materials and fabrication (e.g., see Ref. 52), microstructure (e.g., see Ref. 44), and
operating conditions (e.g., see Ref. 33)—for an experimental investigation of these effects,
see Ref. 53. Nonetheless, the principles remain the same. At open circuit (i.e., no current
flow), the cell potential is given by the Nernst potential. As the current density increases,
so too do the overpotentials, until the total losses equal the Nernst potential. At this
current, the cell voltage and power go to zero. This is known as the limiting current
density and occurs when all the available chemical potential is used to overcome internal
losses. Generally, at low currents, the cell response is dominated by charge-transfer
reaction kinetics quantified by the activation overpotentials. The linear central portion
of the cell voltage curve is often attributed to ohmic losses, while the concentration
overpotentials affect the shape of the curve at high current densities (and are therefore
typically responsible for limiting the maximum attainable current from the cell). At
high current densities, reactants are quickly used in charge-transfer reactions and new
reactants cannot be sufficiently supplied through the phases of the porous electrodes.
3.2.1. Activation overpotential.
Because the electrodes are electronic conductors and the electrolyte is an ionic con-
ductor, the charge cannot directly move between the electrode and electrolyte. Alter-
natively, one or more electrochemical charge-transfer reactions are needed. Since the
electrodes and the electrolyte all have free charge carriers, each one is, to a good ap-
proximation, internally charge neutral, with any excess charge being distributed on its
surface. The interface behaves as a capacitor, with buildup of excess charge on one side
of the interface and equal but opposite charge on the other. The very thin (nanometer
scale) region at the interface where charge is stored is termed the electric double layer,
and the electric potential varies sharply in this region. As electrons are transported
across the double-layer region, charge-transfer reactions must overcome the potential
difference from one side to the other. The electric potential difference between the elec-
trode and electrolyte Ei = Φi − Φe,i is written in terms of the electrode potential Φi
and the potential within the electrolyte Φe,i just outside the double-layer region at the
electrode/electrolyte interface. Here, as before, i is used as a general index to indicate
16

“a” for anode or “c” for cathode. This potential difference less the equilibrium potential
difference Eeqi (i.e., the potential difference with no net current flow) is the activation
overpotential ηact,i = Ei−Eeqi . Other than being a function of current density, the acti-
vation overpotential depends on charge-transfer kinetics, which are sometimes controlled
by surface diffusion or adsorption/desorption reactions.
Charge-transfer processes are among the least understood aspects of fuel cell chem-
istry. A number of charge-transfer mechanisms have been proposed in the literature,
even for the relatively simple electrochemical oxidation of pure H2, and many of these
are discussed in the sections to follow. The main focus of this paper concerns the electro-
chemistry of H2, CO, and syngas mixtures. A hydrocarbon fuel is generally reduced to
these active species through reforming and shifting processes (internal or external of the
anode) and/or partial oxidation reactions within the anode. For fuels containing only a
small amount of H2, it is generally assumed that the hydrogen electro-oxidation path-
way is dominant.48 Although this is a nearly universal assumption in SOFC modeling,
it is also well known that cells can run on pure CO.33 Zhu et al.48 noted that as the
incorporation of elementary electrochemistry into SOFC modeling advances, it will be
important to include multiple competing charge-transfer pathways in the electrochemical
reaction mechanism.
In general, proposed mechanisms are either used (i) to support experimental observa-
tions by structure, e.g., dependence on global oxidation reaction species partial pressures,
or identifying the anodic and cathodic charge-transfer coefficients from Tafel plots; or
(ii) to be predictive tools, in which case the kinetic parameters must be known for all
reactions in the mechanism. Models that incorporate detailed multistep electrochemistry
consisting of elementary reactions involving only a single transferred electron with no a
priori assumption about a rate-limiting process (e.g., see Refs. 42–46) will almost cer-
tainly be necessary when multiple competing charge-transfer pathways are open. Some
modeling efforts consider only a global charge-transfer process;54 while others begin with
a detailed multistep mechanism, but reduce the full mechanism to a single rate-limiting
step and derive a Butler-Volmer formalism55 by assuming all other reactions are in equi-
librium.20,21,47–49,56,57
The activation overpotentials quantify the polarization losses in each electrode due
17

to charge-transfer limitations and reaction barriers. Just as the reactants in a chem-
ical reaction process must overcome an energy barrier, i.e., the activation energy, the
reactants in charge-transfer electrochemical reactions must overcome not only a thermal
energy barrier, but also an electric potential.47 Temperature-dependent rate constants
for a chemical reaction are typically expressed using an Arrhenius relation of the form
k = ATn exp(−E/RT ), where A is a pre-factor and E is the activation energy. Similarly,
the rate expressions for an electrochemical reaction can be written generally as
k = ATn exp(−E/RT ) exp(±αneFηact,i
RT
), (9)
where A is again a pre-factor, E the activation energy, ne the number of electrons trans-
ferred in the reaction, F is Faraday’s constant, and ηact,i is the activation overpotential
for electrode i. The sign of the argument in the last exponential is positive if the reac-
tion proceeds in the anodic direction (i.e., the reaction produces electrons) and negative
if the reaction proceeds in the cathodic direction (consuming electrons). The parame-
ter α is usually called a charge-transfer coefficient, the asymmetry factor, or conversely,
the symmetry factor. Its value sets the fraction of overpotential barrier height to the
charge-transfer reaction in the anodic and cathodic directions. For elementary reactions
transferring a single electron, it is common to write α as β, the latter of which are con-
strained by βc = 1 − βa, where subscripts “a” and“c” indicate the anodic or cathodic
reaction directions, respectively. For a reaction transferring more than one electron, αa
and αc are not so simply related.51
3.3. Role of electrochemistry in SOFC anode models
The discussion in this section centers around approaches to representing charge-
transfer chemistry in models of SOFC electrodes, particularly the anode. It is worthwhile
to mention these approaches before reviewing various electrochemical oxidation mecha-
nisms to provide a baseline for the type of data needed and the different ways of using
that data.
3.3.1. Formulation for detailed kinetics.
For any phase p (e.g., gas, anode surface, oxide surface), complex chemical, elec-
trochemical, and transport interactions are linked through a reaction-diffusion equation
18
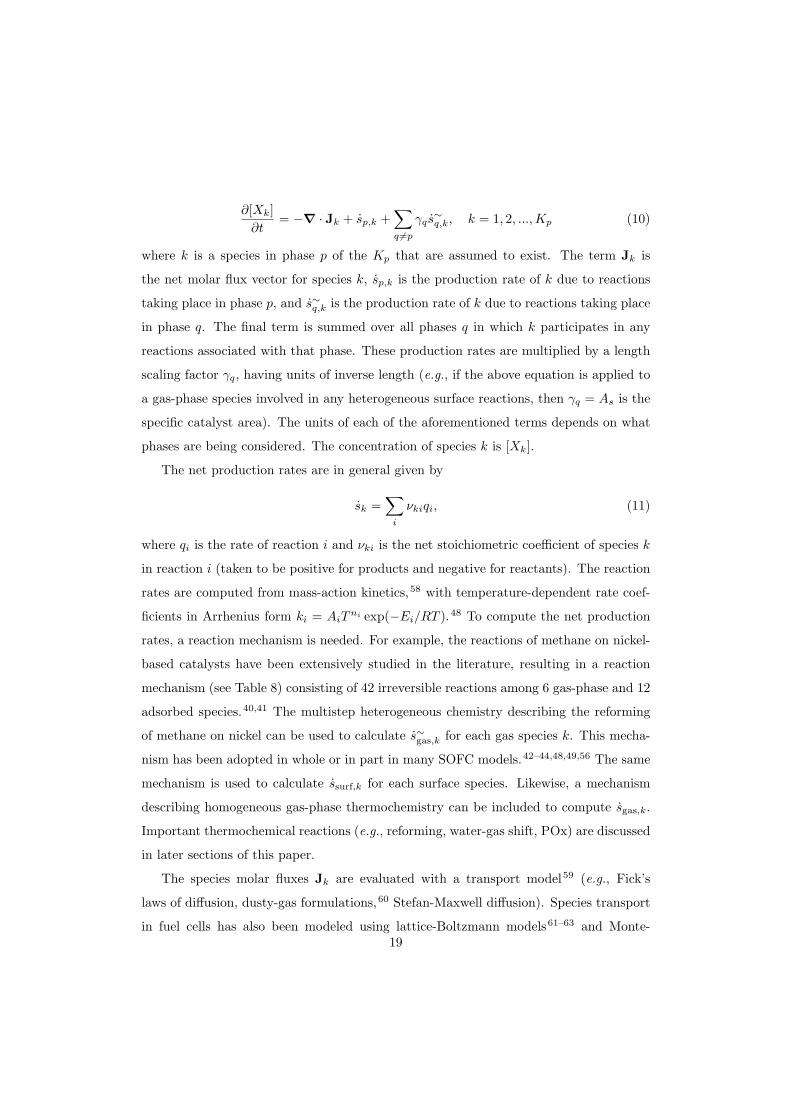
∂[Xk]∂t
= −∇ · Jk + sp,k +∑q 6=p
γq s∼q,k, k = 1, 2, ...,Kp (10)
where k is a species in phase p of the Kp that are assumed to exist. The term Jk is
the net molar flux vector for species k, sp,k is the production rate of k due to reactions
taking place in phase p, and s∼q,k is the production rate of k due to reactions taking place
in phase q. The final term is summed over all phases q in which k participates in any
reactions associated with that phase. These production rates are multiplied by a length
scaling factor γq, having units of inverse length (e.g., if the above equation is applied to
a gas-phase species involved in any heterogeneous surface reactions, then γq = As is the
specific catalyst area). The units of each of the aforementioned terms depends on what
phases are being considered. The concentration of species k is [Xk].
The net production rates are in general given by
sk =∑i
νkiqi, (11)
where qi is the rate of reaction i and νki is the net stoichiometric coefficient of species k
in reaction i (taken to be positive for products and negative for reactants). The reaction
rates are computed from mass-action kinetics,58 with temperature-dependent rate coef-
ficients in Arrhenius form ki = AiTni exp(−Ei/RT ).48 To compute the net production
rates, a reaction mechanism is needed. For example, the reactions of methane on nickel-
based catalysts have been extensively studied in the literature, resulting in a reaction
mechanism (see Table 8) consisting of 42 irreversible reactions among 6 gas-phase and 12
adsorbed species.40,41 The multistep heterogeneous chemistry describing the reforming
of methane on nickel can be used to calculate s∼gas,k for each gas species k. This mecha-
nism has been adopted in whole or in part in many SOFC models.42–44,48,49,56 The same
mechanism is used to calculate ssurf,k for each surface species. Likewise, a mechanism
describing homogeneous gas-phase thermochemistry can be included to compute sgas,k.
Important thermochemical reactions (e.g., reforming, water-gas shift, POx) are discussed
in later sections of this paper.
The species molar fluxes Jk are evaluated with a transport model59 (e.g., Fick’s
laws of diffusion, dusty-gas formulations,60 Stefan-Maxwell diffusion). Species transport
in fuel cells has also been modeled using lattice-Boltzmann models61–63 and Monte-19

Carlo-type simulations to predict species diffusivities.19 Fuel cell models must accurately
represent the major physical processes that affect transport in porous media, including
molecular diffusion, Knudsen diffusion, surface diffusion, and viscous Darcy flow.
Gas transport. The most comprehensive transport model is arguably the dusty-gas model
(DGM),60 which is a multicomponent transport model derived from kinetic theory. It
is applicable over a full range of Knudsen numbers, from values much larger than one
(molecule-wall collisions dominate, and Knudsen diffusion is the controlling mechanism),
to values much less than one (molecule-molecule collisions dominate, and bulk diffusion
is controlling).48 The DGM can be written as an implicit relationship among the molar
concentrations [Xk] (mol/m3/s), molar fluxes Jk (mol/m2/s), concentration gradient,
and pressure gradient as∑6=k
[X`]Jk − [Xk]J`[XT ]De
k`
+Jk
Dek,Kn
= −∇[Xk]− [Xk]Dek,Kn
B
µ∇p, (12)
for k = 1, 2, ...,Kg. Here, [XT ] = p/RT is the total molar concentration, B is the perme-
ability of the porous electrode, µ the mixture viscosity, and Dek` and De
k,Kn the effective
ordinary and Knudsen diffusion coefficients, respectively (m2/s for both). Because Knud-
sen diffusion is governed by molecule-wall collisions, it is highly dependent on the porous
electrode microstructure, including porosity φ, tortuosity τ , and average pore radius rp.
The effective diffusivities can be evaluated as
Dek` =
φ
τDk`, De
k,Kn =23rpφ
τ
√8RTπWk
, (13)
where Wk is the molecular weight of species k. The ordinary multicomponent binary
diffusion coefficients Dk` and mixture viscosity µ are determined from kinetic theory.58
Alternatively, software packages such as Cantera64 can be used to easily compute these.
Surface transport. In one dimension, without loss of generality, the molar fluxes (mol/m/s)
are related to the diffusion coefficients Dk (m2/s) as
Jk = −Dk∂[Xk]∂x
, k = 1, 2, ...,Ks (14)
The surface concentrations [Xk] (mol/m2) are related to the coverages θk by the available
site density as [Xk] = Γθk. The number of surface adsorbates is Ks. These equations20

can be applied to the metal and electrolyte surfaces, but the allowable surface species,
diffusion coefficients, and reaction mechanisms are different for each surface. As it relates
to the multistep mechanism in Table 3, the flux, diffusion coefficient, and net production
rate of each adsorbate on nickel can be calculated based on reactions 1–5; likewise for
surface species on YSZ using reactions 6–9.
The solution to Eq. 10 and its coupling to the appropriate relation for Jk depends
upon boundary conditions, and this is where the charge-transfer reactions enter. The
reaction-diffusion equation is a parabolic partial differential equation requiring two bound-
ary conditions on the species concentrations [Xk]. Typically, depending on model geom-
etry, one of these can be a zero-flux condition at a symmetry plane so that ∂[Xk]/∂x = 0
at the x-location of the symmetry plane (e.g., patterned anode geometries). For porous
electrodes, the concentration itself is specified at the channel/electrode interface. The
other boundary condition applies at the TPB and relates the flux to the production (or
consumption) of species due to charge-transfer reactions at the TPB. For the metal (Ni)
surface,
Dk∂[Xk]∂x
∣∣∣∣TPB
= ck, k = 1, 2, ...,Ks,Ni. (15)
The term ck is the net production rate of species k due to charge-transfer chemistry at the
TPB. It is nonzero only for surface species that participate directly in the charge-transfer
reactions. Just as the species production rates sk due to nonfaradaic chemistry act as
sources or sinks for a given phase, the production rates from charge-transfer chemistry
act as sources or sinks at the TPB. As with the metal surface, the adsorbates on the
electrolyte (YSZ) are subject to an equal and opposite condition
Dk∂[Xk]∂x
∣∣∣∣TPB
= −ck, k = 1, 2, ...,Ks,YSZ. (16)
In Eqs. 15 and 16, Ks,Ni and Ks,YSZ refer to the number of species on the nickel and YSZ
surfaces, respectively. Because the TPB is defined as the three-phase boundary between
gas, metal, and oxide phases, a similar equation can be written for gas species involved
in charge-transfer chemistry.
Unlike the surface production rates, the rates of reaction and production rates of
species from electrochemical reactions are dependent on the electric-potential difference
across the double layer at the TPB interface. Species production rates at the TPB are
21

calculated from
ck =∑i
νkiqi (17)
where νki are the stoichiometric coefficients for species k in reaction i and qi is the rate
of reaction i. Of primary interest is the production rate of electrons ce =∑i νeiqi, where
νei is positive for reactions written in the anodic direction, and negative for those written
in the cathodic direction.
For a generic elementary charge-transfer reaction written in the anodic direction (i.e.,
producing electrons)
AzA + BzB CzC + DzD + e− (18)
where kzk is a generic representation for a species k (A, B, C, or D) having charge zk
(positive, neutral, or negative). Along with element balance, it is necessary that the
reaction be charge balanced, which requires zA + zB = zC + zD − 1.
The net rate of progress is the difference between the anodic and cathodic rates
q = qa − qc (19)
As with all reaction rates, these are a function of temperature, but they also depend
on the electric-potential difference Ea = Φa − Φe,a across the double layer. Admittedly,
there can be much confusion surrounding the various defined potential differences within
each anode and across the cell itself. Here we use Ea to represent the potential differ-
ence across the anode/electrolyte interface. Similarly, the potential difference across the
cathode/electrolyte interface is Ec. The electric potential difference between the anode
and electrolyte Ea is written in terms of the anode potential Φa and the potential within
the electrolyte Φe,a just outside the double-layer region at the anode/electrolyte inter-
face. As introduced in the previous subsection, the activation overpotential at the anode
ηact,a = Ea−Eeqa is defined to be the difference between Ea and Eeq
a , the latter of which
is the equilibrium potential difference across the double layer. The ohmic overpotential
ηohm = Φe,a−Φe,c (defined in Eq. A-10), is the potential difference across the electrolyte,
and Ecell = Φc−Φa = Erev− ηact,a− ηohm− ηact,c, where Erev = Eeqc −Eeq
a at the TPB.
The anodic and cathodic rates of reaction can be written as
qa = ka(T )aAaB exp(βaFEaRT
)(20)
22

and
qc = kc(T )aCaD exp(−βcFEa
RT
)(21)
The temperature-dependent rate constants ka and kc can typically be written in Arrhe-
nius form, and the application of this approach requires these values for all reactions, akin
to combustion. The species activities are ak. The anodic and cathodic symmetry factors
βa and βc determine the relative contributions of the anodic and cathodic currents to the
net current. These factors are sometimes called the charge-transfer coefficients, and for
elementary reactions, take on values 0 < β < 1, and are constrained by βa + βc = 1. In
global reactions, symmetry factors are generally called α not β, and there are no specific
constraints on the values of α.43 The rates of all charge-transfer reactions are evaluated
to produce the faradaic current at the TPB
iTPB = F∑i
(qi,a − qi,c) (22)
The faradaic current is related to the measurable current density through a parameter
that characterizes the total TPB length of the electrode.
For a complete description of a computational model that couples elementary chem-
istry, electrochemistry, and surface transport in the vicinity of the TPB, the reader is
referred to Goodwin et al.42,43 or Bessler and co-workers.45,46
Computing the production rates from faradaic and nonfaradaic reactions requires the
kinetic parameters for every reaction. In almost all cases, the charge-transfer kinetics are
not known, and are instead used as fitting parameters to match model predictions with
actual measured cell performance. For models in which the anode potential Ea, species
activities ak, and current density iTPB are all computed self-consistently, the Butler-
Volmer form (discussed next) for representing charge transfer offers no substantial ad-
vantages compared to the elementary mass-action form. More importantly, representing
reactions in mass-action form does not suffer from restrictions that are inherent in the
Butler-Volmer form. Only if the charge transfer is indeed rate limiting, such that the
activities are established by much faster processes (e.g., adsorption/desorption), can the
Butler-Volmer equation be used.
23

3.3.2. Butler-Volmer kinetics.
The assumption of a single charge-transfer reaction, either through a global represen-
tation or reduction of a detailed mechanism controlled by a rate-limiting step, facilitates
the ability to relate the current density and activation overpotential through the Butler-
Volmer equation,55
i = i0
[exp
(αanBV
e Fηact,iRT
)
− exp
(− αc
nBVe Fηact,iRT
)]. (23)
This equation includes the net anodic and cathodic currents due to a single electrochem-
ical reaction transferring nBVe electrons. Note that we adopt a notation in which nBV
e
is the number of electrons transferred in the rate-limiting step that the Butler-Volmer
equation represents, while ne (used in Eq. 1, for example) is the number of electrons
transferred in the anode half-cell oxidation reaction (e.g., ne = 2 for H2 and CO). Of
course, if the electrochemistry is only represented with a global charge-transfer reaction,
nBVe = ne. For an electrode i (i.e., a for “anode,” c for “cathode”), the activation overpo-
tential ηact,i = Ei−Eeqi is the potential difference above the equilibrium electric potential
between the electrode and electrolyte (this is discussed in more detail later). For global
reactions, the are no constraints on the values of the symmetry factors αa and αc. For
elementary reactions transferring a single electron (i.e., nBVe = 1), it is common to write
α as β. The anodic and cathodic symmetry factors βa and βc determine the relative
contributions of the anodic and cathodic currents to the net current. These factors are
sometimes called the charge-transfer coefficients, generally take on values between zero
and one, and are constrained by βa+βc = 1. Because there is an activation overpotential
for the anode and cathode, there is a different set of charge-transfer coefficients for the
two electrodes. The exchange current density i0 is the current density at the equilibrium
potential difference Eeqi . A high exchange current density means the charge-transfer
reaction proceeds rapidly when the potential is varied from its equilibrium value.
At equilibrium and only at equilibrium, the two partial current densities at the elec-
trode are equal in magnitude and opposite in direction. When ηact,i is negative, there
will be a net cathodic electron flow (transfer of negative charge) from the electrode to
24

the electrolyte. Conversely, when ηact,i is positive, there will be a net anodic electron
flow from the electrolyte to the electrode. In general, the anodic and cathodic current
contributions are
ia = i0 exp
(αanBV
e Fηeqact,i
RT
),
and
ic = −i0 exp
(− αc
nBVe Fηeq
act,i
RT
),
with net current density i = ia + ic. At equilibrium, ieqa = −ieqc = i0 because Ei = Eeqi ,
giving ηeqact,i = 0.
Applying the Butler-Volmer equation for an electrochemical reaction represents a
semi-empirical approach, in which parameters such as the exchange current density i0
must be measured from experiments. The exchange current density i0 is a measure
of the electrocatalytic activity of the electrode/electrolyte interface for a given electro-
chemical reaction. It depends on charge-transfer kinetics (which are generally unknown
and not well understood), the concentrations of reactants and products at the TPB,
temperature, pressure, and microstructure of the electrode (also unknown, though re-
cent efforts19,44,65–70 have shed some light on this). Determining the dependence of the
exchange current density on reactant and product concentrations from a detailed elec-
trochemical reaction mechanism will reveal the apparent reaction order, which might not
always be evident based on a global oxidation reaction.48,49
The Butler-Volmer equation is the central equation of phenomenological electrode
kinetics, valid under conditions where there is a plentiful supply of reactant by easy
transport to and from the electrodes in the electrolyte.71 This ensures the rate of reaction
is indeed controlled by the electric charge transfer at the TPB, and not by transport of
ions to the electrode or away from it. One interesting limiting case of the Butler-Volmer
equation is discussed below, specifically in the context of an elementary charge-transfer
reaction (i.e., a reaction involving only one exchanged electron).
The high overpotential case. When ηact,i RT/βF (here, β is used as a generic repre-
sentation of βa or βc),2 one of the exponential terms in the Butler-Volmer equation will
2Assuming a typical value of β = 1/2, RT/βF = 0.15 V at 600C, and 0.22 V at 1000C. SOFCsare normally operated in the range 600–1000C.
25

be negligible:
i = i0 exp
(βaFηact,iRT
)for
βaFηact,iRT
1, (24)
or
i = −i0 exp
(− βc
Fηact,iRT
)for − βcFηact,i
RT 1. (25)
The anodic and cathodic branches of the current density are easily manipulated to pro-
duce
ηact,i =
RTβaF
ln(ii0
): βaFηact,i
RT 1
− RTβcF
ln(− ii0
): −βcFηact,i
RT 1(26)
These two relationships represent Tafel-type equations55,71 (i.e., an equation such that
ηact,i ∝ ln i, which produces straight lines on a semi-logarithmic plot). This sort of plot
is useful for determining the anodic and cathodic charge-transfer coefficients βa and βc
from the slope of the line. That is, it is relatively simple to set up an experiment to vary
the activation overpotential and measure the current with all other conditions held fixed.
Since the other constants in the lead term are known, the charge-transfer coefficients
can be found for both positive bias (anodic branch) and negative bias (cathodic branch)
overpotentials.
Absent this information, it is quite common and reasonable to take βa = βc =
1/2 for elementary charge-transfer reactions,55,71 which corresponds to a symmetrical
energy barrier at the charge-transfer interface. The remaining unknown in many of
these equations is the exchange current density i0. This parameter represents a kinetic
equilibrium of the exchange of charge across the TPB. It is a significant and useful arbiter
of the dynamic nature of the electrode reaction that determines the rate of electrode
reactions for any potential difference Ei across the electrode.71
26

98% H2+H2O
20% H2
98% H2+H2O
10 at
m
1 atm
H2 + (1/2)O2 <=> H2O
0.6
0.8
1.0
1.2
1.4
400 600 800 1000 1200
Rev
ersi
ble
cell
pote
ntia
l Ere
v (V
)
Temperature (oC)
0.6
0.8
1.0
400 800 1200
Rev
ersi
ble
effic
ienc
yre
v
Temperature (oC)
60% H220% H2
60% H2
10 at
m10
atm
1 atm
0.6
0.8
1.0
1.2
1.4
400 600 800 1000 1200
Rev
ersi
ble
cell
pote
ntia
l Ere
v (V
)
Temperature (oC)
0.6
0.8
1.0
400 800 1200
Rev
ersi
ble
effic
ienc
yre
v
Temperature (oC)
98% CO+CO2
20% CO
98% CO+CO2
10 a
tm
1 at
m
CO + (1/2)O2 <=> CO2
60% CO
20% CO
60% CO1 at
m
10 a
tm
0.6
0.8
1.0
1.2
1.4
400 600 800 1000 1200
Rev
ersi
ble
cell
pote
ntia
l Ere
v (V
)
Temperature (oC)
0.8
1.0
1.2
400 800 1200
Rev
ersi
ble
effic
ienc
yre
v
Temperature (oC)
Full ox.
CH4 + 2O2 <=> CO2 + 2H2OLines are labeled with x inx% CH4+(1 CO2:1 H2O)
60
20
GRI30
GRI30
20
98 60 98Full ox.
60
2010 atm1 atm
98
1 atm
1 atm
10 atm
10 at
m
1 atm
C(gr) + (1/2)O2 <=> CO
10 atm
0.6
0.8
1.0
1.2
1.4
400 600 800 1000 1200
Rev
ersi
ble
cell
pote
ntia
l Ere
v (V
)
Temperature (oC)
0.8
1.0
1.2
400 800 1200
Rev
ersi
ble
effic
ienc
yre
v
Temperature (oC)
Full ox.
C(gr) + O2 <=> CO2
Full equil.
1 atm 10 atm
Fig. 2.
27

0.0
0.5
1.0
1.5
2.0
0.0
0.2
0.4
0.6
0.8
1.0
1.2
0 1 2 3
Power density (W
/cm2)
Volta
ge (V
)
Current density (A/cm2)
50% H2 in H2O800ºC1 atm
Cathode act.Cathode act.
Anode conc.Anode conc.
Cathode conc.Cathode conc.
OhmicOhmic
Anode act.
Anode act.
LeakageLeakage
E cell
Fig. 3.
28

4. Electrochemistry in SOFC anodes
The reaction mechanism describing chemistry and electrochemistry within a SOFC
anode is extremely complex. The elementary reaction steps may include homogeneous
gas-phase chemistry, heterogeneous surface reactions of ad/desorbing species, homoge-
neous surface dissociation and reactions between adsorbed species, and heterogeneous
charge-transfer reactions. To complicate things further, reaction kinetics are governed
by a host of phenomena spanning many length scales (e.g., continuum mass transport,
heat transfer, percolation theory, molecular and Knudsen diffusion, surface diffusion,
catalysis, thermodynamics). Understanding of the reaction mechanism and chemical and
electrochemical kinetics are paramount to optimize the anode and operating conditions.
The primary focus for studying the anode reaction mechanism is to identify the rate-
limiting step (or steps, which likely depend on temperature, current density, and/or
other variables). The rate-limiting or rate-determining step (RDS) controls the rate at
which all other elementary steps can proceed—just as its name implies—and therefore,
the ability of the cell to produce current. Its identification is necessary for electrode
performance improvement by minimizing its limiting effects. Knowledge of the RDS
informs electrode design and optimization (e.g., by using different materials, changing
the operating conditions, or altering the microstructure). To pinpoint the RDS, de-
tailed knowledge of chemical and electrochemical reaction rates is required, as well as an
understanding of the surface species and their conversion paths, and the combinations
of elementary reaction parameters. In addition, the rate-limiting step depends on the
materials and operating conditions, such as temperature, fuel composition, polarization
voltage, and more. Because of the complexity and interrelation of so many variables,
various rate-limiting steps have been proposed in the literature under different operat-
ing conditions,72,73 including reactivities and charge transfer,74–76 surface diffusion,75,77
adsorption,75 sintering and/or impurities, rates of hydrogen desorption, catalytic effects
of water, the role of the YSZ support, and others.
In this section, recent studies on SOFC anode reaction mechanisms are summarized,
with primary focus on the elementary electrochemical oxidation reaction mechanisms of
H2, CO, CH4, and solid carbon; these constitute the main species in practical fuels such
as hydrocarbons, coal syngas, and biogas. Furthermore, particular attention is given to29

carbon deposition and issues related to sulfur poisoning.
4.1. H2 electrochemical oxidation
As discussed in the foregoing section, the Ni-YSZ cermet anode is the most widely
studied anode for SOFC applications. This cermet structure effectively increases adhe-
sion between anode and electrolyte, and achieves large electrochemical active area by
extending the three-phase boundaries (TPBs) from the anode/electrolyte interface, up
into the porous anode. Due to the complex microstructure of typical Ni-YSZ cermet
anodes, the three phases (i.e., metal, oxide, and pore/gas) are composed of various inter-
connected networks.19,68,70 These networks form a highly convoluted structure marked
by TPB regions that cannot easily be probed by experiment. Since the TPB is where
current-producing reactions occur, exposing this area to study is necessary to make clear
the reaction path in the anode. Therefore, researchers carry out studies on anode reaction
mechanisms using electrodes that are designed to have geometrically simple TPBs, e.g.,
so-called point or pattern anodes.77–79 However, a point or pattern electrode in a flow-
ing system may not necessarily be affected by the same phenomena as a porous cermet,
because the inherent and deliberate open design of the MEA and TPB facilitates gas
transport—gas-phase reactants are always readily available, and products are whisked
away from reactive sites (i.e., species residence times near the TPB are greatly reduced
compared to a true porous cermet). For example, a point or pattern anode would not
be expected to exhibit significant readsorption of the water vapor created by reaction
because that water vapor is removed by the gas stream (whereas in a porous cermet, the
water vapor must diffuse through the pores).73
There are three different main reaction mechanisms that have been proposed: (i)
hydrogen spillover, (ii) oxygen spillover, and (iii) interstitial hydrogen charge transfer
(see Ref. 80 for additional discussion and references on each of these). The term spillover
is used to describe the process by which a molecule adsorbs or reacts on one of the phases
(Ni or YSZ) before diffusing over onto the second phase, where it is free to react with
other adsorbed species on that phase.
4.1.1. Hydrogen spillover.
A hydrogen-spillover mechanism was first reported by Mogensen and Lindegaard81
Gas-phase molecular hydrogen H2(g) is adsorbed and subsequently dissociates on the30

Ni surface (Ni). The adsorbed hydrogen atoms H(Ni) are then transported as protons
H+(Ni)—which requires the release of an electron to the anode e−(Ni)—to the TPB
region. Oxygen ions on the electrolyte O2−(YSZ) react with the protons and form
adsorbed hydroxyl ions OH−(YSZ). Two hydroxyl ions then react on the YSZ surface to
form water and O2−(YSZ). The hypothesized elementary reactions for this mechanism
are81
1. Adsorption/desorption on the Ni surface
H2(g) + 2(Ni) 2H(Ni)
2. Ionization of adsorbed atomic hydrogen on the Ni surface
2×[
H(Ni) H+(Ni) + e−(Ni)]
3. Diffusion of H+(Ni) to the TPB
4. Charge transfer at the TPB region
2×[
H+(Ni) + O2−(YSZ) (Ni) + OH−(YSZ)]
5. Formation of water by reactions on the YSZ surface
2OH−(YSZ) (YSZ) + H2O(g) + O2−(YSZ)
This mechanism was proposed after interpretation of measured electrochemical impedance
spectra (EIS) for oxidation of H2 on a Ni-YSZ cermet electrode. The EIS data show two
separate circles dependent on H2 partial pressure pH2 , as well as the ratio of pH2/pH2O. It
was suggested that the high-frequency semicircle (low pH2 values, 0.05–0.3 atm) is related
to proton transfer across the TPB (step 4), and is limited by the TPB length—here, the
reaction rate has a first-order dependence on H2 partial pressure (i.e., the rate scales
with pH2). The second semicircle at lower frequencies (high pH2 values, 0.5–0.97 atm)
is attributed to a reaction resistance caused by the formation of water (step 5), which
is assumed to occur on the YSZ surface. The adsorption/desorption of hydrogen on the
Ni surface (step 1) could also be rate-determining in this limit. In the range of high H2
partial pressures, a reaction order of two was found (i.e., the rate scales with p2H2
), which
is not consistent with the suggested mechanism.
De Boer76 later proposed a slightly different reaction process to enable discussion
of his own data from experiments on porous nickel electrodes on YSZ. The inclusion
31

of step 3, involving interstitial protons as a mediator in the reaction scheme, was first
proposed by Mogensen and co-workers.76,82 De Boer notes, however, that there is no
direct evidence from experiment for the involvement of interstitial protons in the reac-
tion kinetics. De Boer’s mechanism still involves the hydroxyl intermediate on the YSZ
surface, but without the existence of chemisorbed protons on the nickel surface (only
neutral hydrogen atoms):76
1. Adsorption/desorption on the Ni surface
H2(g) + 2(Ni) 2H(Ni)
2. Charge-transfer bulk reaction at the TPB region
H(Ni) + O×O(Ni) (Ni) + OH·O(Ni) + e−(Ni)
3. Transfer of hydroxyl ions between surface and bulk YSZ
OH·O(Ni) + (Ni) OH−(Ni) + V··O(Ni)
4. Charge-transfer surface reaction at the TPB region
H(Ni) + OH−(YSZ) (Ni) + H2O(YSZ) + e−(Ni)
5. Adsorption/desorption on the YSZ surface
H2O(YSZ) (Ni) + H2O(g)
An important distinction between De Boer’s mechanism and that of Mogensen et al.81,82
is that surface-adsorbed hydrogen on the anode reacts first with an oxygen ion (in the
electrolyte sublattice) to produce a protonated ion (step 2) at the TPB, then the proto-
nated ion moves from the oxygen sublattice to the electrolyte surface (step 3) where it
reacts with a second hydrogen atom (step 4). In the mechanism postulated by Mogensen
et al., the hydrogen atoms (albeit, protons) only react with oxygen ions and the resulting
hydroxyl ions then react with each other.
Many researchers have cited De Boer’s mechanism. Goodwin et al.42,43 developed a
complete kinetic and thermodynamic database for H2 electrochemical oxidation on nickel
according to De Boer’s mechanism. Zhu et al.48 detailed a computational framework for
modeling chemically reacting flow in anode-supported SOFCs using a modified version
of the De Boer reactions (all charge-transfer reactions involve surface species only, and
oxygen ions are transferred between the surface and bulk YSZ instead of hydroxyl ions).32

The novel approach by Zhu et al. assumed that the rate-limiting oxidation step is H(Ni)
reacting with OH−(YSZ) at the TPB, forming adsorbed H2O(YSZ) as described by step
4 in De Boer’s scheme. The other reactions are assumed to be equilibrated. Under
this assumption, the Butler-Volmer form of the relationship between current density and
activation overpotential can be formulated as48
i = i0
[exp
((β4,a + 1)Fηact,a
RT
)− exp
(β4,cFηact,a
RT
)](27)
where ηact,a = Ea − Eeqa is the anode activation overpotential and the exchange current
density is given as
i0 = i∗H2
(pH2/p∗H2
)1/4p3/4H2O
1 + (pH2/p∗H2
)1/2(28)
The anodic and cathodic symmetry factors are constrained by β4,a + β4,c = 1, and each
is taken to be 1/2, typical for an elementary reaction.55 The exchange current density
reveals the apparent reaction order of the charge-transfer process, and it is evident that
the exchange current density has a positive dependence on pH2O (i.e., it is enhanced by the
presence of water). Other than gas-phase partial pressures, the exchange current density
depends on the parameter i∗H2, which itself is comprised of constants that are generally
not known (e.g., reaction-rate constants, reaction equilibrium constants, specific TPB
length), so it is used as an empirical parameter that can be adjusted to fit measured fuel-
cell performance. The parameter p∗H2is determined from the balance between adsorption
and desorption of hydrogen on the Ni surface. It is related to the equilibrium constant
of reaction 1, p∗H2= 1/K1, and more information about its calculation can be found in
Ref. 48.
Lee et al.49 further analyzed the possibility that a different intermediate step in
the hydrogen electrochemical oxidation model is rate limiting at high current densities,
and proposed a rate-limiting switchover model to explain the limiting current density.
The model improves the prediction of the limiting current density and provides better
agreement with experimental results. The reaction steps used by Lee et al.49 and Zhu
33

et al.48 are detailed below:
1. Adsorption/desorption on the Ni surface
H2(g) + 2(Ni) 2H(Ni)
2. Charge-transfer reactions at the TPB region
H(Ni) + O2−(YSZ) (Ni) + OH−(YSZ) + e−(Ni)
H(Ni) + OH−(YSZ) (Ni) + H2O(YSZ) + e−(Ni)
3. Adsorption/desorption on the YSZ surface
H2O(YSZ) (YSZ) + H2O(g)
4. Transfer of oxygen ions between surface and bulk YSZ
O×O(YSZ) + (YSZ) O2−(YSZ) + V··O(YSZ)
As with the mechanisms before it, this scheme assumes OH−(YSZ) is the reaction inter-
mediate in the two-electron charge-transfer process. The distinguishing feature of this
mechanism compared to that of De Boer is that the first charge-transfer reaction is as-
sumed to be a surface process (not interstitial), so that only oxygen ions move between
the surface and bulk of the electrolyte (step 4).
Fig. 4 compares results from the rate-limiting switchover model of Lee et al.49 to
experimental data from Jiang and Virkar.33 The model is formulated around a Butler-
Volmer description of hydrogen charge transfer, in which the rate-limiting reaction changes
from H(Ni) reacting with OH−(YSZ) at the TPB (i.e., the second charge-transfer reac-
tion in the scheme above), to adsorption/desorption of H2 on the Ni surface at current
densities close to the limiting value. The model incorporates porous media transport in
the electrodes, heterogeneous surface chemistry in the anode, and charge transfer at the
TPB. Simulation results compare very favorably with measured performance over a wide
range of compositions, with the exception of very high concentrations of H2.
In an effort to better explain observed catalytic effects of water in the anode, Jiang
and Badwal75,83 introduced yet another mechanism for H spillover to YSZ—note that
all previous mechanisms also involve hydrogen spillover to the electrolyte, as opposed to
oxygen spillover to the anode—that accounts for competitive adsorption of oxygen on the
anode from water dissociation. In the absence of water, however, the mechanism greatly
34

differs from those above in that the hydrogen atom is allowed to sit on the YSZ surface
after spilling over the TPB (step 3), where it reacts with an oxygen in the sublattice to
form water in a two-electron process (step 4).
1. Hydrogen dissociative adsorption on the Ni surface
a. In dry hydrogen:
H2(g) + 2(Ni) 2H(Ni)
b. In wet hydrogen:
H2O(g) + (Ni) (Ni–O) + H2(g)
H2(g) + 2(Ni) 2H(Ni)
H(Ni) + (Ni–O)→ (Ni) + H(Ni–O)
2a. Diffusion of H(Ni) to the TPB
2b. Diffusion of H(Ni–O) to the TPB
3. Hydrogen spillover at or near the TPB region
H(Ni) and/or H(Ni–O) H(YSZ)
4. Charge-transfer and H2O formation on YSZ at the TPB
O×O(YSZ) + 2H(YSZ) H2O(g) + (YSZ)
+ V··O(YSZ) + 2e−(YSZ)
e−(YSZ) e−(Ni)
In the notation above, (Ni–O) is an active metal site adjacent to an O(Ni) or sub-NiO.
Jiang and Badwal discounted the existence of adsorbed H2O, hydroxide, or hydroxyl
species on nickel because these have not been detected at elevated temperatures.83 This
follows the precedent of the previous mechanisms in which these species only exist on
the electrolyte surface. Moreover, the authors comment that hydrogen dissociative ad-
sorption (step 1a) is very fast at SOFC operating temperatures, but coverage of H(Ni)
is low, indicating that surface diffusion on the metal surface (step 2a) is rate limiting in
dry hydrogen.83 In a real cermet electrode under operation with dry hydrogen, however,
the oxidation process will produce H2O, whose presence will impact the overall process.
Although the site density on the nickel surface for hydrogen dissociation is reduced in
35

wet hydrogen due to competitive adsorption of oxygen from water dissociation (the first
reaction under step 1b), the overall reaction rate is increased due to the much faster
surface diffusion via a spillover mechanism (step 3) that further frees up metal sites for
dissociative adsorption of hydrogen.83 The transfer of hydrogen species from Ni to YSZ
(step 3) and the charge transfer on YSZ (step 4) limit the overall reaction rate in wet
hydrogen.75
In addition to the work of Jiang and Badwal, Bieberle et al.84 used nickel-patterned-
anode experiments and measured EIS to postulate on the reaction mechanism and cat-
alytic effects of water for Ni-YSZ cermets. That group also suggests a H-to-YSZ spillover
mechanism, illustrated pictorially in Fig. 5. In a dry fuel gas atmosphere, the YSZ sur-
face is assumed to be primarily covered with oxygen, and the electrochemically active
sites are restricted to the vicinity of the TPB. In contrast to this, the YSZ surface is
hydroxylated in a wet fuel gas atmosphere. In Fig. 5a, H2 dissociatively adsorbs onto
the Ni surface, and O2− diffuses to the YSZ surface. The adsorbed hydrogen atoms are
oxidized to protons H+ on the Ni surface and the O2− is removed from the electrolyte
bulk, which causes an adjacent hydroxyl group on the YSZ to be deprotonated (Fig. 5b).
A cascading of protonation and deprotonation of the adsorbed YSZ hydroxyl groups
follows (Fig. 5c), eventually causing one of the protons on the Ni surface to jump to a
nearby adsorbed hydroxyl ion on YSZ. This cascading effect represents a proton migra-
tion from the Ni surface to the location where an O2− was transferred from the YSZ bulk
to the YSZ surface. A second H+ then migrates to this location and reacts with OH− on
YSZ. Water is formed and desorbs from the YSZ surface. A summary of the step-wise
mechanism described above is shown in the center of Fig. 5. This scheme is similar to
a combination of that from Mogensen et al. (protonation as a separate step) and the
modified De Boer mechanism used by Zhu et al. and Lee et al., in which OH−(YSZ)
is first formed on the electrolyte surface by reaction of surface oxygen ions and a pro-
ton, then H2O by reaction with another proton (instead of two hydroxides reacting on
the surface). Bieberle has also investigated the catalytic effects of water in a modeling
context using an oxygen-spillover mechanism that is discussed in the next section.
In general, the spillover of hydrogen from the Ni to the YSZ surface is characterized
by adsorption of molecular hydrogen on the Ni surface, and desorption of water from
36

the YSZ surface. While there is, to the best of our knowledge, no direct experimental
evidence of hydrogen spillover, the feasibility of this mechanism is supported by the fast
surface transport of both, adsorbed hydrogen on the Ni surface (see Ref. 33 in Bessler
et al.80) and protons on the YSZ surface (see Ref. 34 in Bessler et al.80).
4.1.2. Oxygen spillover.
Oxygen spillover suggests that oxygen ions are transported by surface spillover from
the electrolyte (i.e., YSZ) to the nickel at (or very near) the TPB, where they react
with adsorbed hydrogen to generate water and electrons. Unlike hydrogen spillover,
the adsorption of molecular hydrogen and desorption of water both take place on the Ni
surface. Mizusaki et al.,77 who introduced the concept of pattern electrodes to design the
morphology and length of the TPB to study reaction kinetics, first published the oxygen-
spillover mechanism. They studied hydrogen electrochemical oxidation on nickel-pattern
electrodes with different pattern widths and separations. The authors argue that the
observed linear relation between the electrode interface conductivity—σE = 1/(ARE),
where A is the electrode area, and RE is the resistance due to the electrode reaction
obtained from the intercept of the electrode impedance arc with the real axis of the
complex impedance plane (σE is proportional to the exchange current, which represents
the magnitude of the reaction rate and reaction order)—and TPB length suggests that the
rate-determining reaction process takes place around the TPB. From their measured EIS
and the dependence of σE as a function of hydrogen and water gas-phase partial pressures
(pH2 and pH2O), it was concluded that the reaction site for the rate-determining step was
the Ni surface close to the TPB.
Bieberle and Gauckler78,79 compared experimental EIS to simulation results of nickel-
patterned anodes exposed to gaseous H2-H2O mixtures. In their model, an oxygen-
spillover mechanism was assumed and the unknown reaction kinetics were tuned to pro-
vide a best fit between model results and measured data. The electrochemical model
is illustrated in Fig. 6, and the numbers in the figure correspond to the reaction steps
37

below.79
Adsorption/desorption on the Ni surface:
4 H2(g) + 2(Ni) 2H(Ni)
5 H2O(g) + (Ni) H2O(Ni)
Surface reactions on the Ni surface:
6 O(Ni) + H(Ni) (Ni) + OH(Ni)
7 H2O(Ni) + O(Ni) 2OH(Ni)
8 H2O(Ni) + (Ni) OH(Ni) + H(Ni)
Interface reaction (spillover from bulk YSZ to Ni surface):
9 O×O(YSZ) + (Ni) O(Ni) + V··O(YSZ) + 2e−(Ni)
The model and simulations carried out by Bieberle and Gauckler were, at the time,
unique in detailing the kinetics of an electrochemical model for SOFC anodes. While the
validity of the modeling framework was clearly demonstrated, the number of unknowns
and a priori assumptions limit its applicability for unambiguous interpretation of the
kinetics. Differences between experiment and simulation are attributed to shortcomings
of the model and the oxygen-spillover mechanism. In particular: (i) the YSZ surface was
not considered to be electrochemically active; (ii) reaction-rate constants are assumed
to be independent of surface coverages; and (iii) surface diffusion is assumed to be fast
and gas-phase diffusion is not included. The authors admit that even in their detailed
study, it is risky to conclude that a specific reaction mechanism dominates.79
Because the oxygen spillover process does not involve the fuel species to be oxidized,
it can be at the origin of electrochemical oxidation of any fuel.
4.1.3. Interstitial hydrogen charge transfer.
At the high operating temperatures of SOFCs (600–1000C), interstitial hydrogen
atoms in bulk Ni and interstitial protons in bulk YSZ are known to be present in rela-
tively high concentrations (around 0.1 mol%), with high enough diffusivities to support
the anode half-cell hydrogen oxidation.80 Charge-transfer at the Ni/YSZ interface (a
two-dimensional interface, as opposed to the one-dimensional TPB) can then proceed
according to H×i (Ni) H·i(YSZ) + e−(Ni), where Kroger-Vink notation has been used38

(this reaction appears as reaction 5 in Table 2).
Holtappels et al.74 suggest the possible role of interstitial hydrogen and hydroxyl
formation at Ni/YSZ interfaces. This is illustrated graphically in Fig. 7(d). Interstitial
hydrogen and protons are formed via adsorption and surface/bulk exchange from hy-
drogen on Ni and water on YSZ, respectively.80 Because the solubility and diffusivity of
H in a metal lattice is relatively high, the Ni/YSZ interface can affect the anodic reac-
tion. The elementary reaction steps include: (1) diffusion of gas-phase reactants to the
solid surfaces (i.e., H2 to Ni and H2O to YSZ); (2) dissociative adsorption of gas-phase
reactants at the solid surfaces (e.g., forming Had, Oad, OHad); (3) surface diffusion of
adsorbed species or bulk diffusion of H within the anode metal to reaction sites; and
(4) charge transfer at the TPB region or across the Ni/YSZ interface to eventually form
H2O, which desorbs from the YSZ surface.
4.1.4. Improved and combined mechanisms.
Bessler et al.80 address the general misunderstanding in most SOFC reaction-kinetic
studies (including those discussed above) that electrochemical reaction rates depend only
on reactant concentrations. To be thermodynamically sound, reaction rates and electro-
chemical equilibrium depend on reactant and product concentrations, because it is a
dynamic equilibrium between forward and backward reactions. The authors develop a
thermodynamic model of the TPB that describes the coupling of electroactive interme-
diates with global gas-phase species. The model is used to study the behavior of the
reaction pathways discussed above, and results are compared to published experimental
data. The five charge-transfer reactions (and associated references mentioned here in
which they appear) are summarized in Table 2.80
The well-established activating effects of water on the anode kinetics can be explained
by Nernst-potential (equilibrium-potential) effects alone, argue Bessler et al., without the
need to assume any additional kinetic or catalytic effect. The results indicate that all
charge-transfer reactions have a strong and highly nonlinear kinetic dependence on gas-
phase hydrogen and water partial pressures due to equilibrium-potential effects, and this
behavior is distinctly different for the various mechanisms. All mechanisms given in
Table 2 show an increase in exchange current density with increasing pH2O. However,
with increasing pH2 , the O and OH spillover reactions show decreasing kinetics, while
39

Table 2Elementary charge-transfer reactions analyzed in Ref. 80
No. Label Reaction
1 O spillover a (Refs. 77–79,85) O2−(YSZ) + (Ni) O(Ni) + (YSZ) + 2e−(Ni)2 OH spillover (Ref. 85) OH−(YSZ) + (Ni) OH(Ni) + (YSZ) + e−(Ni)
3 H spillover to O b (Refs. 48,49,76,81,85) H(Ni) + O2−(YSZ) (Ni) + OH−(YSZ) + e−(Ni)4 H spillover to OH (Refs. 48,49,76,84,85) H(Ni) + OH−(YSZ) (Ni) + H2O(YSZ) + e−(Ni)5 H interstitial c (Refs. 74,80) H×i (Ni) H·i(YSZ) + e−(Ni)
a As lattice oxygen O×O(YSZ) to (Ni) (Refs. 78,79) or as written.b As H+(Ni) to O2−(YSZ) (Ref. 81), H(Ni) to O×O(YSZ) (Ref. 76), or H(Ni) to O2−(YSZ) (Refs. 48,49).c Refs. 75,83 include H spillover on the surface across the TPB as H(Ni) and/or H(Ni–O) H(YSZ).
the H spillover and H interstitial reaction kinetics are increasing. This finding supports a
conclusion that the dominating reaction mechanism and kinetics of charge-transfer may
change with operating conditions. In addition, although the model is unable to consis-
tently interpret all published experimental results simultaneously, they agree mostly that
the rate-limiting step in pattern anodes is charge-transfer, and the observations are most
consistent with a surface hydrogen spillover reaction (Table 2, No. 4) as rate-determining.
Recently, Vogler et al.85 presented a quantitative elementary kinetic model of the hy-
drogen oxidation reaction for Ni-YSZ pattern anodes. Their model describes the coupling
of surface reactions and surface diffusion with charge-transfer through spillover reactions.
In total, 15 elementary steps are considered (including three surface reactions on YSZ,
five surface reactions on Ni, and seven charge-transfer reactions near the TPB), which is
the most comprehensive published model for H2 electrochemical oxidation. Aside from
the first four charge-transfer elementary reaction steps in the model of Bessler et al.
(i.e., Nos. 1–4 from Table 2; No. 5, H interstitial is not included), three additional
charge-transfer reactions are considered, introducing the surface species O−(YSZ) and
O−(Ni),
O2−(YSZ) O−(YSZ) + e−(Ni)
O2−(YSZ) + (Ni) O−(Ni) + (YSZ) + e−(Ni)
O−(Ni) O(Ni) + e−(Ni)
These reactions appear as O1, O2, and O4, respectively, in Table III of Ref. 85. Each of
these reactions, together with reaction Nos. 1–4 from Table 2 (which are O5, OH, H2,40

and H1, respectively), is illustrated pictorially in Fig. 7.
The possible reaction pathways for hydrogen oxidation in Vogler et al. are com-
pared to experimental patterned-anode data published by Bieberle et al.84 under a range
of operating conditions. From various combinations of the seven charge-transfer reac-
tions, only one reaction pathway, based on two hydrogen spillover reactions (Table 2,
Nos. 3 and 4), was able to consistently describe the complete experimental data set. The
double-hydrogen spillover pathway was then examined based on different modeling ap-
proaches/assumptions described in the literature: (A) a full reaction-diffusion model;85
(B) a full reaction-diffusion model without water dissociation on YSZ, an approach pre-
viously employed by Goodwin et al.;42,43 and (C) a charge-transfer model where the
charge transfer takes place over the entire surface area as used by Gewies et al.,86 which
corresponds to the full model assuming infinitely fast surface transport. Each of the
approaches involves solving Eq. 10 under the appropriate assumptions. The results are
reproduced in Fig. 8 (adapted from Ref. 85), where lines in the figure are labeled with
the apparent Tafel slope βF/RT (e.g., see Eq. 26). The transfer coefficient of the exper-
imental data is close to unity, which is in good agreement with predictions from model
A, whereas simulations B and C predict too high or too low apparent Tafel slopes.
4.1.5. The role of surface diffusion.
Vogler et al.85 also suggest that surface diffusion is a key process (at least for patterned
anodes) contributing to the electrochemical behavior at the TPB. The electrochemically
active surface area is confined to a narrow region (less than 100 nm) from the TPB,
because of the interaction of fast surface reactions with slow surface diffusion. In fact,
from all of the possible reaction pathways, the competitive adsorption of gas species on
the electrode or electrolyte surface, as well as the following surface diffusion processes,
are candidates for rate-limiting steps. Ihara et al.87 investigated the detailed depen-
dence of DC-polarization and interfacial conductivity of Ni-YSZ cermet anodes on the
partial pressure of hydrogen. They developed a Langmuir reaction model, which links
the chemical reactions on the anode with the electrical characteristics of the anode, such
as the DC-polarization and the interfacial conductivity. In their model, they assumed
competitive adsorption equilibrium of H2, H2O, and O on Ni surfaces at the TPB, and
assumed the rate-determining step to be Langmuir-type reactions of Had with Oad. Ihara
41

et al. concluded that their measured dependencies and previously published dependen-
cies were both successfully reproduced by their reaction model. Furthermore, they found
the adsorption of H2 at the TPB (which generally occurs on the metal surface) is affected
by the presence of the electrolyte (YSZ) at the TPB in a cermet anode. Williford and
Chick88 proposed a model with surface diffusion to explain the limiting current density.
They used an analogous circuit model to determine the dominant reaction pathway de-
pending on operating conditions, especially when the SOFC is working at high current
density or high fuel utilization. The dominant reaction pathways considered in the model
include competitive adsorption of reactants in areas adjacent to the reactive TPB sites,
and slow surface diffusion to the reactive sites. It was suggested that SOFC anode design
improvements should focus on optimization of the reactive area, adsorption, and surface
diffusion at the anode/electrolyte interface.
4.1.6. Detailed mechanism with kinetic data.
Efforts42–46 to develop detailed charge-transfer kinetics in terms of elementary reac-
tion steps in a manner that parallels treatment of thermal heterogeneous chemistry40,41
are very new. These mechanisms are generally based on pattern-anode experiments77,84,85,89,90
that expose the TPB and remove any transport limitations of fuel delivery or product
removal from reactive sites. It would also allow competing charge-transfer pathways to
play themselves out without having to make an assumption about which is dominant in
accordance with real-time operating conditions (e.g., changing gas composition at the
TPB) or what step is rate determining. However, there is not yet a clear understanding
of the electrode kinetics, and more often than not, the number of unknowns cannot be
sufficiently determined from available data. Nonetheless, the process provides significant
quantitative insight about the fundamental chemical and transport processes responsible
for charge transfer.43
Let us take, for example, a recent detailed description of the reaction mechanism for
hydrogen charge transfer.43 Table 3 outlines a set of heterogeneous surface reactions and
several different charge-transfer pathways for H2-H2O in a Ni-YSZ anode. Reactions 1–5
describing the interactions of hydrogen, oxygen, and steam on nickel are adopted from
Deutschmann and co-workers,40,41 and are a subset of a larger mechanism describing
methane reforming on nickel (see Table 8). In these reactions, (Ni) represents an empty
42

Table 3Summary of the H2-H2O-Ni-YSZ surface and charge-transfer reactions in Ref. 43 a
Reaction A b or γ0c n b E b or βa
1 H2 + 2(Ni) 2H(Ni) 0.01 c 0.0 0.02 H2O + (Ni) H2O(Ni) 0.10 c 0.0 0.03 H(Ni) + O(Ni) (Ni) + OH(Ni) 5.00× 10+22 0.0 97.94 H(Ni) + OH(Ni) (Ni) + H2O(Ni) 3.00× 10+20 0.0 42.75 2OH(Ni) H2O(Ni) + O(Ni) 3.00× 10+21 0.0 100.0
6 O2−O + (χ) O2−(χ) + VO 7.30× 10+12 0.0 80.1
7 H2O + (Zr) + O2−(χ) OH−(Zr) + OH−(χ) 1.20× 10⁻⁴ c 0.0 86.88 OH−(χ) + (Zr) OH−(Zr) + (χ) 2.00× 10+10 0.0 0.09 H2 + (Zr) + O2−(χ) H−(Zr) + OH−(χ) 1.00× 10⁻⁸ c 0.0 20.0
Oxygen spillover
OS1 O2−(χ) O−(χ) + e−(Ni) 2.66× 10+06 0.0 0.50 d
OS2 O−(χ) + (Ni) O(Ni) + (χ) + e−(Ni) 2.66× 10+08 0.0 0.50 d
Hydrogen spillover (fixed β = 1/2)
HF1 H(Ni) + O2−(χ) (Ni) + OH−(χ) + e−(Ni) 5.00× 10+12 0.0 0.50 d
HF2 H(Ni) + OH−(χ) H2O(Ni) + (χ) + e−(Ni) 4.09× 10+09 0.0 0.50 d
Hydrogen spillover (single channel)
HS1 H(Ni) + O2−(χ) (Ni) + OH−(χ) + e−(Ni) 5.00× 10+12 0.0 0.50 d
HS2 H(Ni) + OH−(χ) H2O(Ni) + (χ) + e−(Ni) 1.55× 10+09 0.0 0.30 d
Hydrogen spillover (dual channel e)
HD1 H(Ni) + O2−(χ) (Ni) + OH−(χ) + e−(Ni) 5.00× 10+12 0.0 0.50 d
HD2 H(Ni) + OH−(χ) H2O(Ni) + (χ) + e−(Ni) 8.50× 10+08 0.0 0.25 d
HD3 H(Ni) + OH−(χ) H2O(Ni) + (χ) + e−(Ni) 1.36× 10+10 0.0 0.80 d
a Ni surface-site density is 1.7 × 10⁻⁹ mol/cm2. The total site density on the oxide surface is2.5× 10−9 mol/cm2, with 1.25 × 10⁻⁹ mol/cm2 available each to (Zr) and (χ) sites.
b Arrhenius parameters for the rate constants written in the form: k = ATn exp(−E/RT ). Theunits of A are given in terms of moles, centimeters, and seconds. E is in kJ/mol.
c Sticking coefficient in the form of γ = γ0 exp(−E/RT ). The sticking coefficient is dimensionless.d Because experimental data were available only at a single temperature of 700C (973 K), it was
not possible to further separate the rate constants into an activation energy and pre-exponentialfactor. The number listed in the far right column is the anodic symmetry factor βa.
e The physical basis for such a possibility is that reactions with the same reactants and productsmay occur on different types of surface sites (e.g., steps or ledges), resulting in different rates.
site on the nickel surface, H(Ni) is an adsorbed H atom, and so on. Similarly, reactions
6–9 detail the interactions of species on the YSZ surface, for which there are two types
of surface sites (χ) and (Zr), as well as bulk species O2−O and VO representing a bulk
43

Table 4Standard-state thermodynamic properties forspecies at 700C from Ref. 43
Species H (kJ/mol) S (J/mol/K)
H2 19.9 165.3H2O −217.8 231.5O2 21.8 242.3
(Ni) 0.0 0.0H(Ni) −32.7 39.6H2O(Ni) −281.6 122.5OH(Ni) −199.7 99.6O(Ni) −228.7 32.4
VO 0.0 0.0O2−
O −85.6 148.4
(χ) 0.0 0.0O2−(χ) −85.6 139.6O−(χ) −85.6 139.6OH−(χ) −173.8 124.5
(Zr) 0.0 0.0OH−(Zr) −208.8 124.5H−(Zr) 90.3 37.0
oxygen ion and vacancy, respectively.3 Of the two surface site types, (Zr) is a surface-
level zirconium cation site and (χ) is defined to be the position that a surface oxygen
would occupy if it were present. For all reactions in Table 3, the forward rates are in
Arrhenius form, and the reverse rates are calculated from the thermodynamic properties
in Table 4. This maintains strict thermodynamic consistency. Additional details about
the reactions and their rates can be found in Goodwin et al.43
In addition to the surface reactions, Table 3 also lists four different charge-transfer
pathways for hydrogen electrochemical oxidation. Each of these pathways is considered
separately with the surface mechanisms in a model that can be used to predict polariza-
tion characteristics and Tafel plots. The predicted Tafel plots are then compared directly
3The notation used in this instance is chosen to match the reference from where it was obtained(Ref. 43) and does not follow standard Kroger-Vink notation, where the lattice oxygen ion would normallyhave neutral charge (O×O) and the vacancy a double positive charge (V··O). Instead, the lattice oxygenion is given a double negative charge and the vacancy is neutral. In either case, the relative differencebetween the ion and the vacancy are identical.
44

with patterned-anode experiments from Mizusaki et al.77 and the resulting reaction-rate
parameters are those that give the best fit to the experimental data for each potential
mechanism.
The results of a computational model that represents the coupled behavior of elemen-
tary surface chemistry, electrochemistry, and transport in the vicinity of the TPB are
illustrated in Figure 9, reproduced from Goodwin et al.43. The Goodwin model (which
is based on integration of Eq. 10) is applied to assist the development and evaluation
of H2 charge-transfer reaction mechanisms for Ni-YSZ anodes. Previously published
patterned-anode experiments from Mizusaki et al.77 are used to evaluate the different
electrochemical charge-transfer mechanisms appearing in Table 3. For each of these path-
ways, the best-fit kinetic parameters were determined that provided a closest match to
the experimental results. Of the reaction schemes, the results show that a hydrogen-
spillover mechanism can explain the Mizusaki polarization measurements over a wide
range of gas compositions with anodic and cathodic biases.43
Although much effort has been focused on the mechanisms and elementary kinetic
models for H2 oxidation in the SOFC anode, it is evident from the above discussion that
there is no general consensus among researchers. In summary, the primary differences
include: (i) the location where thermochemical and electrochemical reactions take place,
i.e., catalyst or electrolyte; and (ii) the limiting reaction steps under different operat-
ing conditions (e.g., adsorption and desorption of hydrogen and water, charge-transfer
reactions, surface diffusion processes). To clarify these issues, more detailed experimen-
tal data and refinement of elementary kinetic and transport parameters are required to
improve quantitative model predictions over a wide range of conditions.
4.2. CO electrochemical oxidation
CO and H2 are the main species in fuel derived from steam reforming (both external
and internal), coal gasification, or biogas. Research on the subject of CO electrochemical
oxidation is much less expansive than H2 electrochemical oxidation. Because of the
promising and prominent role of CO as a fuel for SOFCs, knowledge and understanding
of the CO reaction mechanism is of significant importance.
Some study of CO electrochemistry using nickel-pattern anodes, nickel-point anodes,
and Ni-YSZ porous anodes can be found in the literature. It is generally agreed that the45

electrochemical reaction rate of CO is lower than that of H2.33,91–93 When pure CO is
supplied to a porous Ni-YSZ anode, Jiang and Virkar33 report that the maximum power
density reaches only about 40% of that obtained using pure H2. Similarly, according to
experimental results using a nickel-patterned anode on YSZ by Sukeshini et al.,90 the
maximum power density using CO is about 50% of that obtained from using H2 only.
While the lower power density from patterned-anode experiments is likely the result of
charge-transfer kinetics alone, the reduced power output from the porous anode is a
combination of slow CO electrochemical kinetics and increased resistance to transport
of CO to reaction sites because the relatively heavy CO molecules are characterized by
a lower diffusivity than their lighter H2 counterparts. Therefore, in real systems (i.e.,
those using porous electrodes), not only will CO be slower to reach the TPB, but it will
also be slower to react there.
Matsuzaki and Yasuda91 studied the electrochemical oxidation rate of H2 and CO
with a porous Ni-YSZ cermet electrode and YSZ electrolyte under constant oxygen partial
pressure. They found that the polarization resistance increased when the CO concentra-
tion ratio pCO/(pH2 +pCO) exceeded 0.2 at 750C and 0.5 at 1000C. The electrochemical
oxidation rate of H2 was 1.9–2.3 times higher than that of CO at 750C, and 2.3–3.1 times
higher at 1000C. Even though the CO electro-oxidation rate is slower than H2, Mat-
suzaki and Yasuda’s results indicate that it has the same order of magnitude, differing
only by a factor of two or three. That being the case, understanding the mechanism for
electrochemical conversion of CO is absolutely necessary for systems using CO-dominant
fuels, and may play a non-negligible role as a parallel charge-transfer pathway to H2
electro-oxidation.
4.2.1. CO electrochemical oxidation mechanisms.
A wide range of experimental conditions and electrode materials has resulted in sev-
eral proposed reaction mechanisms and various rate-determining steps for CO electro-
chemical oxidation. Perhaps the first CO electro-oxidation mechanisms were proposed
by Etsell and Flengas94 for CO electrochemical oxidation on porous Pt-YSZ electrodes.
The authors offered two possible mechanisms based on studies of the anodic reactions in
46

the range 700–1100C. The two mechanisms are:
1. Oxygen participation in charge transfer
O×O(YSZ) + (Pt/YSZ) O(Pt/YSZ) + V··O(YSZ) + 2e−(Pt)
CO(g) + O(Pt/YSZ) CO2(g) + (Pt/YSZ)
2. CO participation in charge transfer
CO(g) + O×O(YSZ) CO2(g) + V··O(YSZ) + 2e−(Pt)
In the notation above, the only surface species is adsorbed atomic oxygen O(Pt/YSZ)
on the metal or electrolyte surface, and empty surface sites (Pt/YSZ). Within the YSZ
electrolyte, O×O(YSZ) is a lattice oxygen and V··O(YSZ) is an oxygen vacancy. The only
other species e−(Pt) is an electron within the Pt anode.
Mechanism 1 postulates that adsorbed oxygen O(Pt/YSZ) is formed via the electro-
chemical charge-transfer reaction transferring oxygen from bulk YSZ to the anode or
electrolyte surface. The adsorbed oxygen is subsequently used in the second reaction
to oxidize gaseous CO, producing gas-phase CO2. In other words, CO does not partic-
ipate in the charge-transfer reaction directly, and instead reacts with the intermediate
O(Pt/YSZ) from the charge-transfer reaction (i.e., the first reaction in mechanism 1)
involving oxygen species only. This mechanism also appears in Table 5 as mechanism 1
(note the nomenclature uses generic material names in place of specific names, e.g.,
“a” for anode instead of “Pt”). Under conditions when the charge-transfer reaction in
mechanism 1 is slow, the exchange current density has the following form94
i0 = k(1− θCO)(pCO2
pCO
)1−α
(29)
where k is a constant, θCO is the surface CO coverage, and α is around 1/2.
In contrast to this, gas-phase CO and CO2 are directly involved in the electrochemical
reaction of mechanism 2 (above) appearing in Etsell and Flengas. An exchange current
density derived from mechanism 2 has the form94
i0 = k(1− θCO)p1−αCO2
pαCO, (30)
which supports the experimental observations of Etsell and Flengas in that it increases
with increasing CO partial pressure (unlike Eq. 29). The same dependence is obtained if47

Table 5CO electrochemical oxidation mechanisms appearing in Ref. 95 a
Mechanism Description and charge-transfer steps
1 Oxidation of gaseous CO by adsorbed atomic oxygen. Transfer of oxygen fromthe bulk electrolyte across the gas/electrolyte interface close to the TPB, follow-ed by oxidation of CO by adsorbed atomic oxygen Oad on the surface of theelectrode or electrolyte (see Etsell and Flengas94)
O×O(el) + (a/el) O(a/el) + V··O(el) + 2e−(a)
CO(g) + O(a/el) CO2(g) + (a/el)
2 Oxidation of adsorbed CO by adsorbed atomic oxygen. In a CO2-rich atmos-phere, surface-adsorbed oxygen on the electrolyte reacts at the TPB with COad
on the anode forming adsorbed CO2 species, also on the anode (see Mizusakiet al.96)
O×O(el) + (el) O(el) + V··O(el) + 2e−(a)
CO(a) + O(el) CO2(a) + (el) b
3 Oxidation of adsorbed CO by lattice oxygen in the electrolyte. The lifetime ofadsorbed atomic oxygen on the electrolyte is sufficiently short so that chargetransfer proceeds directly between COad and lattice oxygen close to the TPB
CO(g) + (a/el) CO(a/el)
CO(a/el) + O×O(el) CO2(g) + V··O(el) + 2e−(a) + (a/el)
4 Oxidation of adsorbed, diffusing CO by lattice oxygen in the electrolyte. Adsorb-ed CO moves to the TPB via surface diffusion, where it reacts with a latticeoxygen to produce CO2(g)
CO(g) + (a/el) CO(a/el) c
CO(a/el) + O×O(el) CO2(g) + V··O(el) + 2e−(a) + (a/el)
Coverage of COad controlled by surface diffusion
∂(ΓθCO)∂t
= Dad∂2(ΓθCO)
∂y2+ kad,COpCOΓ(1− θCO)− kdes,CO(ΓθCO) d
a When appropriate, the originating reference is given in parentheses for each mechanism. Note thenomenclature uses generic material names in place of specific names (e.g., “a” for anode catalystinstead of “Pt” or “Ni”).
b In Ref. 95 this reaction appears as CO2(g) + (el) + (a) O(el) + CO(a) coupled with the adsorp-tion/desorption reaction CO(a) (a) + CO(g).
c The forward and reverse rate coefficients of this reaction are kdes,CO and kad,CO, respectively.These appear in the diffusion equation described in the footnote below.
d In this equation, Γ is the total number of available adsorption sites and Dad is the surfacediffusion coefficient. The surface coverage of adsorbed CO is θCO and the rate coefficients are des-cribed in the footnote above.
CO is assumed to be adsorbed on the surface (with an additional adsorption/desorption
reaction added), and based on these findings, the authors note that gaseous or adsorbed
48

CO and gaseous CO2 must participate directly in the electrochemical steps of the elec-
trode reaction. For a relatively invariant surface coverage θCO, and for α ≈ 1/2, the
exchange current density of Eq. 30 will peak near 50% CO in CO2. Aaberg et al.97 later
report that the measured exchange current density for CO-CO2 mixtures on Ni-YSZ
cermet anodes has a maximum around 45% CO in CO2, which is in direct agreement
with this. The experimental data of Aaberg et al. correspond, to some extent, to the
second mechanism of Etsell and Flengas, where CO and CO2 are directly involved in the
charge-transfer step. These authors also note that the CO polarization resistance is 2–5
times higher than H2.
Mizusaki et al.96 also studied CO oxidation on porous Pt-YSZ electrodes for typical
SOFC operating temperatures in the range 600–1000C. In an effort to avoid carbon
deposition and subsequent fouling of the anode, the CO-CO2 ratio of the fuel stream was
selected to be CO2-rich for most cases (i.e, ratios in the range 10−4–101). Based on their
experimental observations, Mizusaki et al. suggest a reaction rate proportional to 1/2-
powers of the reactant activities (i.e., gas-phase partial pressures and surface coverages),
which is controlled by a simple chemical step at the TPB between adsorbed CO and CO2
on the Pt surface and adsorbed oxygen on the electrolyte surface. In equation form,
O×O(YSZ) + (YSZ) O(YSZ) + V··O(YSZ) + 2e−(Pt)
CO(Pt) + O(YSZ) CO2(Pt) + (YSZ)
This appears as mechanism 2 in Table 5, and is very similar to mechanism 1 of Etsell
and Flengas. The difference is that adsorbed oxygen O(YSZ) is assumed to exist only on
the electrolyte surface, and that both adsorbed CO and CO2 participate in the chemical
step (second reaction) as opposed to both being gas-phase species (or even adsorbed CO
and gaseous CO2).
4.2.2. The role of surface diffusion.
Matsuzaki and Yasuda91 investigated the characteristics of CO electrochemical ox-
idation at the interface of a porous Ni-YSZ cermet electrode and YSZ electrolyte, and
concluded that the lower electrochemical oxidation rate of CO (compared to that of H2)
is caused mainly by the larger diffusion resistance of CO on the electrode surface at
49

750C. At higher temperature (1000C), both surface diffusion and charge-transfer re-
sistance contribute to slow oxidation rates. Lauvstad et al.95,98 studied the polarization
curves and impedance response of a solid metal point electrode in contact with a solid,
oxygen-ion conducting electrolyte (i.e., Pt or Ni on YSZ) in CO-CO2 atmospheres. This
setup minimizes any limitations caused by gas-phase mass transport so that reaction
pathways and rate-determining steps can be deduced. The overall electrochemical reac-
tion is assumed to proceed in elementary steps, such as adsorption, diffusion of adsorbed
species, and charge transfer. They analyze four electrochemical oxidation mechanisms of
CO with different charge-transfer steps. The four mechanisms are detailed in Table 5.
Mechanisms 1 and 2 were adopted from Etsell and Flengas,94 and Mizusaki et al.,96
respectively, and include gas-phase species or species adsorbed on the surface of the elec-
trode and/or electrolyte. For mechanism 2, Lauvstad et al. only consider the adsorbed
species Oad and COad and assume gaseous CO2(g). This is in contrast to Mizusaki
et al. who assume adsorbed CO2(a) on the anode surface. Charge transfer for this
mechanism is assumed to proceed as in mechanism 1 with “a/el” (indicating anode or
electrolyte) replaced with “el” (electrolyte only). Mechanism 3 is a limiting case of mech-
anism 2, where Lauvstad et al. assume the lifetime of adsorbed atomic oxygen on the
electrolyte surface to be sufficiently short so that charge transfer occurs directly between
COad (the only adsorbed species) and lattice oxygen near the TPB. This mechanism
is essentially the same as mechanism 1—under the same assumption regarding the life-
time of Oad—with adsorbed rather than gaseous CO. Mechanism 4 includes the same
adsorption/desorption/charge-transfer reactions of mechanism 3, with the incorporation
of surface diffusion of COad species, which may exist on the electrode and/or electrolyte
surface. In all other mechanisms, surface diffusion is assumed fast so that adsorbed
species coverages are uniform.
Among these four possible mechanisms, modeling results95 and experimental mea-
surements98 of polarization curves and EIS indicate that mechanism 2 qualitatively
mimics the experimental impedance spectra over the entire frequency range under all
experimental conditions for both (Pt and Ni) electrode materials (with the exception
of Ni at cathodic overpotentials). In particular, only mechanism 2 reproduces the low
frequency inductive behavior, which is consistent with a reaction mechanism involving
50

two adsorbed intermediates. The Warburg impedance (associated with mass-transfer
diffusion limitations), which may result from mechanism 4 under certain conditions, was
never observed, so the assumption underlying the development of mechanisms 1, 2, and
3 (i.e., that diffusion is a fast process) is justified. The fact that limiting currents are
observed is thus not an indication of diffusion limitations, but is probably related to
insufficient supply/removal rates of adsorption/desorption processes taking place in the
vicinity of the TPB.98
4.2.3. Detailed mechanism with kinetic data.
A more recent, and perhaps the most comprehensive, analysis of CO charge transfer
and reaction kinetics on Ni-YSZ anodes appears in Yurkiv et al.46 The authors exam-
ine three possible charge-transfer pathways, but limit their analysis to oxygen-spillover
mechanisms only (i.e., only oxygen species are involved in charge transfer at the TPB as
oxygen ions in the electrolyte give up electrons and move to the anode). The CO (or any
fuel for that matter) is then oxidized by the oxygen that resides on the anode surface.
A summary of the surface reactions and three charge-transfer mechanisms appearing in
Yurkiv et al. are reproduced in Table 6. The kinetic parameters used for each reaction
are also given in Table 6. Standard-state thermodynamic properties for reaction species
are reproduced from the same reference and appear in Table 7. Note that the values
given are referenced to the vacancies of the associated phase.
Reactions 1–4 in Table 6 represent reactions on the Ni surface, reactions 5–7 on the
YSZ surface, and the three different charge-transfer mechanisms appear as O1 + O2,
O3 + O4, and O5, respectively. Each mechanism includes three possible species on the
anode surface—CO(Ni), CO2(Ni), O(Ni)—and empty surface sites (Ni). In O3 + O4 an
additional surface species O−(Ni) is allowed on the anode surface, for a total of four
adsorbed species plus empty sites. The only bulk species is an electron within the anode
e−(Ni). On the electrolyte surface, there are adsorbed CO(YSZ), O(YSZ), oxygen ions
O2−(YSZ), and empty sites (YSZ). It is interesting to note that adsorbed atomic oxygen
on the electrolyte O(YSZ) is consumed in the forward direction of reaction 7, yet it is
not produced in any other reaction. The coverage of O(YSZ) therefore only depends on
the equilibrium of reaction 7. An additional YSZ surface species O−(YSZ) is introduced
through the charge-transfer reactions O1 + O2. Within the bulk electrolyte there are
51

Table 6Summary of the CO-CO2-Ni-YSZ surface and charge-transfer reactions in Ref. 46 a
Reaction A b or γ0c n b E b or βa
1 CO + (Ni) CO(Ni) 5.0× 10⁻¹ c 0.0 0.02 CO2(Ni) (Ni) + CO2 7.0× 10+11 0.0 41.03 CO + O(Ni) (Ni) + CO2 1.0× 10+23 0.0 155.04 CO(Ni) + O(Ni) (Ni) + CO2(Ni) 2.0× 10+19 0.0 123.6
5 CO + (YSZ) CO(YSZ) 4.0× 10⁻² c 0.0 0.06 CO + O(YSZ) (YSZ) + CO2 1.0× 10+20 0.0 158.17 O2−(YSZ) + V··O(YSZ) (YSZ) + O×O(YSZ) 1.6× 10+22 0.0 90.9
O1 O2−(YSZ) O−(YSZ) + e−(Ni) 8.4× 10⁻⁶ 0.0 0.5 d
O2 O−(YSZ) + (Ni) O(Ni) + (YSZ) + e−(Ni) 7.4× 10⁻¹ 0.0 0.5 d
O3 O2−(YSZ) + (Ni) O−(Ni) + (YSZ) + e−(Ni) 5.3× 10⁻⁶ 0.0 0.5 d
O4 O−(Ni) O(Ni) + e−(Ni) 2.1× 10⁻¹ 0.0 0.5 d
O5 O2−(YSZ) + (Ni) O(Ni) + (YSZ) + 2e−(Ni) 4.9× 10⁻⁶ 0.0 0.5 d
a Ni and YSZ surface-site densities are 6.1× 10⁻⁹ mol/cm2 and 1.3× 10⁻⁹ mol/cm2, respectively.Anodic and cathodic symmetry factors of the charge-transfer reactions are 1/2.
b Arrhenius parameters for the rate constants written in the form: k = ATn exp(−E/RT ). The un-its of A are given in terms of moles, centimeters, and seconds. E is in kJ/mol.
c Sticking coefficient in the form of γ = γ0 exp(−E/RT ). The sticking coefficient is dimensionless.d Because experimental data were available only at a single temperature of 876C (1149 K), it was
not possible to further separate the rate constants into an activation energy and pre-exponentialfactor. The number listed in the far right column is the anodic symmetry factor βa.
oxygen ions O×O and vacancies V··O.
The results of a computational model (based on Eq. 10 and the framework following it)
that represents the coupled behavior of elementary surface chemistry, electrochemistry,
and transport in the vicinity of the TPB are illustrated in Figure 10, reproduced from
Yurkiv et al.46. The model by Bessler and co-workers (see Table 6) is used for the
evaluation of CO charge-transfer reaction mechanisms for Ni-YSZ anodes in accordance
with patterned-anode data from Lauvstad et al.98 Their results are most consistent with
an oxygen-spillover mechanism at the TPB proceeding through steps O1 and O2 in
Table 6.
To our knowledge, Yurkiv et al.46 are the first to publish a two-step charge-transfer
description of CO electro-oxidation. The kinetic parameters in Table 6 and thermochemi-
cal properties in Table 7 are obtained from various sources (when available) or empirically
52

determined based on numerical simulations formulated around one of the charge-transfer
mechanisms (i.e., O1+O2, O3+O4, or O5—each of these appears graphically in Fig. 11),
allowing for direct comparison to experimental steady-state polarization curves and elec-
trochemical impedance spectra from Lauvstad et al.98 Best agreement with the experi-
mental data is obtained through reaction pathway O1+O2 (see Fig. 10), in which oxygen
spillover occurs in the second step. This is in contrast to O3+O4, where oxygen spillover
at the TPB takes place in the first step, and O5, which is a two-electron net reaction
without the intermediate surface species. Although mechanism O1 + O2 yields good
agreement with Tafel plots, it fails to reproduce the low-frequency inductive loop that
was used as a determining factor in choosing a possible reaction pathway in Lauvstad
et al.
Table 7Standard-state thermodynamic properties forspecies at 876C from Ref. 46
Species H (kJ/mol) S (J/mol/K)
CO −84 238CO2 −353 275O2 26 247
(Ni) 0 0CO(Ni) −197 193CO2(Ni) −394 205O(Ni) −222 39O−(Ni) −222 39
(YSZ) 0 0CO(YSZ) −159 172O2−(YSZ) −236 0O−(YSZ) −236 0O(YSZ) a −236 0
V··O(YSZ) 0 0O×O(YSZ) −236 0
a Note that thermochemical data for O(YSZ)is not given in Ref. 46, so we use the samevalues as those reported for O−(YSZ) andO2−(YSZ).
53

4.2.4. Summary of published mechanisms.
A review of the current literature (some mentioned above, some not) pertaining to
CO electro-oxidation exposes several dissimilar or contradictory observations:
1. The dependence of the exchange current density i0 on the partial pressures of CO
(pCO) and CO2 (pCO2) are reported to be i0 ∝ p1/2CO2
p1/2CO by Etsell and Flengas94
(see Eq. 30), but Boulenouar et al.99 report average reaction orders of p1/4CO and
p1/2CO2
. However, Etsell and Flengas simultaneously varied both pressures in their
experiments (as opposed to Boulenouar et al., who systematically changed only one
while keeping the other constant), so the reaction orders from Etsell and Flengas
cannot be precisely determined. Nonetheless, there is likely a positive dependence
of the exchange current density on both pCO and pCO2 ;
2. Aaberg et al.97 report an apparent charge-transfer factor of αa = βane = 1, which
gives an anodic charge-transfer coefficient of βa = 1/2 because two electrons (i.e.,
ne = 2) are transferred in the overall electrochemical oxidation reaction of CO to
CO2. These values are consistent with Etsell and Flengas94 and Lauvstad et al.,98
but they differ from Sukeshini et al.90 who report αa to be in the range 0.25–0.45;
3. Setoguchi et al.100 report that the CO electrochemical oxidation reaction depends
only on oxygen partial pressure (pO2) and is independent of the fuel partial pressures
(which implies that CO and CO2 do not directly participate in the charge-transfer
reactions), but Matsuzaki and Yasuda91 and Boulenouar et al.99 show the exact
opposite (i.e., that CO electro-oxidation depends on the partial pressures pCO and
pCO2 , but not pO2);
4. The addition of water to the fuel was found to promote the kinetics of the overall
CO electrode reaction in Habibzadeh,89 but not in Sukeshini et al.90 (Note that
these two publications originate from the same group)
In addition to the striking ambiguities on some of the more basic dependencies, the
charge-transfer reaction models can be divided into two pathways given by the following
54

net reactions:
1. Oxygen participation in charge transfer as spillover at
the TPB region46,98,100
O×O(el) + (a) O(a) + V··O(el) + 2e−(a)
2. CO (adsorbed or gas-phase) direct participation in
charge transfer89,90,94,97
CO(g/a) + O×O(el) CO2(g) + V··O(el) + 2e−(a)
The same course of development for charge-transfer pathways is found in the H2
electrochemistry literature discussed in the foregoing sections. The two most frequently
studied pathways in H2 electrochemistry are a hydrogen-spillover mechanism and an
oxygen-spillover mechanism. Vogler et al.85 examine seven possible H2 charge-transfer
pathways, including hydrogen- and oxygen-spillover mechanisms, and find that only hy-
drogen spillover yields good agreement with the complete experimental data set from
Bieberle et al.84 on Ni-patterned anodes. Further, Goodwin et al.42,43 also find support
for the hydrogen-spillover mechanism based on comparison between modeling results and
experimental data from Mizusaki et al.,77 because it is the only pathway that provides
good quantitative representation of measured polarization behavior over a wide range
of gas-phase compositions with both anode and cathode biases. It is generally accepted
then that hydrogen spillover is the more probable pathway in the H2 electro-oxidation
mechanism.
Clearly, the same understanding of CO electrochemistry does not yet exist, but be-
cause of its arguably equal (and sometimes greater, depending on the system) importance,
research is actively being pursued in a manner analogous to H2. To further the point, a
general consensus concerning the mechanism of electrochemical oxidation of CO, or the
role of the electrode versus that of the electrolyte in the reactions has not yet even been
reached.
4.2.5. Unstable reaction rates.
Due to carbon deposition on the anode surface and a possible partial delamination
of the anode surface, unstable performance has been observed in SOFCs when operating
55

with pure CO and a Ni-YSZ anode at 950C. Holtappels et al.101 studied the electro-
chemistry of CO-CO2 oxidation on Ni-YSZ cermets as a function of CO and CO2 partial
pressures at 1000C. Time-dependent reaction rates were observed for the CO oxidation
reaction for oxygen activities corresponding to open circuit potentials in the range 0.75
to 1.01 V. The electrode changed between a passive state and several active states for the
CO-CO2 reaction. Periodic changes of the reaction rate for CO oxidation were observed
every 30 and 80 s. The unstable reaction rates of the electrochemical oxidation of CO
have been described by a “modified reconstruction model” as shown in Fig. 12.101
The impedance spectra recorded at the rest potential and the overpotential depen-
dence of the CO oxidation rate indicated a change in the number of active sites in the
reaction zone. In the active state, the CO oxidation reaction was more than one order
of magnitude slower than the hydrogen oxidation reaction in Ni-YSZ cermet electrodes.
Holtappels et al. point out that the direct observations of structural and chemical changes
on Ni-catalyst surfaces after carbon deposition (discussed in Ref. 102) can be taken as
indirect support of the described modified reconstruction model.
4.3. Syngas electrochemical oxidation
When CO and H2 are both present in the fuel stream the mechanism becomes even
more complicated because of parallel charge transfer, water-gas shifting, and the involve-
ment and interaction of additional gaseous and adsorbed species. Jiang and Virkar33
reported very little difference in anode-supported cell performance using H2 and CO
mixtures instead of pure H2, even with CO concentration is as high as 55% (e.g., refer
to the left panel of Fig. 13). These results can be explained through the water-gas shift
reaction occurring within the porous anode (water required for the reaction is a product
of the electrochemical oxidation of H2). As long as the H2 content in the fuel stream
is greater than 50%—so that sufficient H2O can be produced to react with CO—high
cell performance can be achieved because only a small amount of CO is left to directly
participate in electrochemical oxidation. The cell performance under these conditions is
similar to a cell operating with humidified H2.
Other researchers have obtained results similar to those published by Jiang et al.
For example, Weber et al.103 studied the oxidation of H2-CO mixtures in an electrolyte-
supported SOFC using Ni-YSZ cermet anodes at 950C, and observed a decrease in cell56

performance at high CO content (> 90%). Eguchi et al.92 also studied the effects of H2
and CO mixture compositions on the performance of an electrolyte-supported Ni-YSZ
planar cell. Results from their experiments indicate that H2-H2O-N2 and CO-CO2-N2
systems provide almost the same open circuit voltage when the H2-H2O and CO-CO2 ra-
tios are equal at a temperature of 1000C, as expected from thermodynamic equilibrium
(e.g., refer to Fig. 2). However, hydrogen is preferentially consumed by the electrode reac-
tion, as evidenced by higher cell voltages for H2 than CO under discharge conditions (i.e.,
the slope of the i-V curve is steeper for CO oxidation as the voltage decreases from the
open-circuit potential with increasing current density—refer to Fig. 13). The difference
in discharge curves is ascribed to activation and/or concentration polarizations, with
the latter assumed to be dominant.92 Sasaki et al.93 investigated the current-voltage
characteristics and electrode impedance of a tubular-type SOFC for mixed fuel gases,
consisting mainly of H2, CO, H2O and a carrier gas at 900C and 1000C. Their ex-
periments confirm that CO-rich gases give comparable performance to that of H2-rich
gases, thus concluding that mixed gases such as coal-derived syngas are useful fuels for
SOFC applications. Costa-Nunes et al.104 further explore SOFC performance using two
different composite anodes (Ni-YSZ and Cu-CeO2-YSZ) with H2, CO, and syngas fuels.
They found that the kinetics of hydrogen electrochemical oxidation have positive order
in H2 partial pressure for Cu-CeO2-YSZ and nearly zero order for Ni-YSZ. Likewise, the
oxidation of CO was found to have a positive-order dependence on CO partial pressure.
They suggest that the higher activity of H2 is due to spillover of H atoms from the Ni to
the YSZ surface where oxidation takes place. In contrast, spillover of CO adsorbed on
a metal to an oxide support generally does not occur (thus, reactions are limited to the
TPB and less so on the metal and oxide surfaces near the TPB). These spillover effects
are not observed for the Cu-CeO2-YSZ anode since the metal is largely inert and reac-
tions appear to take place on the ceria, which is active for both H2 and CO oxidation. It
is noteworthy that the performance of a cell with a Cu-Co-CeO2-YSZ anode, even with a
relatively thick electrolyte and operating at relatively low temperatures (700C), exhibits
a performance with CO that rivals that of some of the best Ni-YSZ cells operating on
H2.104
Habibzadeh89 experimentally studied the electrochemical oxidation mechanisms and
57

interactions of H2-CO fuel mixtures on patterned-nickel anodes with different pattern
geometries and various operating conditions (e.g., cell working temperature, cell over-
potential, fuel partial pressure, water partial pressure). Observations from the experi-
ments are compared to predictions from a detailed electrochemistry model adopted from
Bieberle and Gauckler78,79 and linked to Cantera.64 The elementary reaction steps used
by Habibzadeh are summarized below:
1. Adsorption/desorption
CO(g) + (Ni) CO(Ni)
CO2(g) + (Ni) CO2(Ni)
O2(g) + (Ni) 2O(Ni)
2. Surface reaction
CO(Ni) + O(Ni) CO2(Ni)
3. One-step electrochemistry
CO(Ni) + O2−(YSZ) CO2(Ni) + (YSZ) + 2e−(Ni)
4. Surface diffusion of CO
Evidence indicates that the rate-limiting process is primarily confined to a region very
near the TPB. The combination of anode overpotential and cell temperature had clear
and obvious effects on the rate-determining process: (i) at lower anode overpotential
and lower temperature, charge transfer and surface diffusion (or adsorption/desorption)
processes are both slow and potentially limiting; (ii) at higher anode overpotential or
higher temperature, charge transfer is the limiting step. The results also indicate that
the addition of H2O to CO-CO2 mixtures could reduce the low frequency resistance of
the anode and increase the rate of the charge-transfer process (by almost two times for
temperatures between 700C and 800C). This suggests a major role for the water-gas
shift affecting gas-phase species, and/or the ability of H2O to increase activity of the
anode catalyst.
Although Habibzadeh’s model is capable of qualitatively reproducing most of the
experimental data, there are some notable shortcomings. For simulated EIS, the sec-
ond loop, which is associated with surface transport of species (i.e., surface diffusion or
58

adsorption/desorption), is about six times smaller than that obtained by experimental
measurement. This may be attributed to the fact that the relaxation frequency of the
charge-transfer process in the model is about one order of magnitude higher than in ex-
periments. This allows the model to be dominated by the higher frequency mode, and it
will therefore not be able to capture processes occurring at lower relaxation frequencies.
To capture effects of adsorption/desorption and surface diffusion, further work involving
sensitivity studies and tweaking of the surface thermodynamics, particularly for YSZ
surfaces, are necessary. This is critical for optimizing Ni-YSZ anode design for operation
with CO-rich fuel streams.
Because there is no general agreement on and a lack of understanding of the mecha-
nism for CO electrochemical oxidation when it is the primary fuel species, this in turn
impacts the level of understanding for H2-CO mixtures. There is not a clear or common
conclusion on the oxidation mechanism, especially under different operating conditions.
More carefully designed and detailed experimental studies, as well as elementary reaction
models are needed to clarify the reaction pathways, kinetics, and interactions between
H2, CO, and other species.
4.4. Hydrocarbon electrochemical oxidation
Except for studies focusing on external or internal reforming of hydrocarbon fuels for
use in SOFCs, additional interest has been given to the tolerance of SOFC anodes to
direct conversion of dry hydrocarbon fuels. Direct conversion of a hydrocarbon means
conversion in the SOFC without pre-mixing the fuel gas with steam or CO2, and without
processing the fuel before it enters the stack. There is some difference in the terminology
found in the literature, and the use of “direct conversion” by many researchers, as well
as the definition adopted here, is taken directly from Mogensen and Kammer.31 Direct
conversion therefore only involves electrochemical oxidation of the fuel and/or cracking
products.
Murray et al.28 reported the direct electrochemical oxidation of nearly pure CH4 in
SOFCs using a ceria-based anode, which resulted in power densities up to 0.37 W/cm2
at 650C. This performance is comparable to that of fuel cells operating on hydrogen.
They concluded that direct oxidation of CH4 is the primary anode reaction based on
several observations. First, even after H2O and CO2 production, reforming rates are59

probably too low to compete with the direct electrochemical oxidation of CH4. Low
reforming rates are a result of small anode area (1 cm2), low temperature, and flushing
of products (i.e., H2O and CO2) from the anode compartment by relatively high fuel
flow. Second, supporting evidence for direct oxidation of CH4 is found in comparison of
EIS obtained from anodes subjected to dry and humidified methane fuel. These cases
give rise to impedance spectra with different shapes, and since the shape of the curve
is related to the mechanism governing fuel oxidation, this revealed that the primary
anode reaction was not consistent with a mechanism involving oxidation of hydrogen
produced by reforming of humidified methane. Putna et al.29 and Park et al.105 also
reported direct oxidation of CH4 in SOFCs. Park et al.38 more recently reported on the
direct electrochemical oxidation of various hydrocarbons (methane, ethane, 1-butene, n-
butane, and toluene) at 700C and 800C with a composite anode of copper and ceria
(or samaria-doped ceria). They demonstrate stable operation without carbon formation
in the anode, and that the final products of oxidation are CO2 and H2O. Experimental
measurements of CO2 production as a function of current density from methane and
n-butane (C4H10) fuels using a Cu-ceria composite anode indicate that direct oxidation
of CH4 and C4H10 occurs in a single step
CH4 + 4O2− CO2 + 2H2O + 8e−
C4H10 + 13O2− 4CO2 + 5H2O + 26e−
They also report that only trace levels of CO were observed in the anode outlet when
fueling with methane. This observation also supports direct single-step electro-oxidation.
Mogensen and Kammer31 provide a comprehensive review of the conversion of hy-
drocarbons in SOFCs, and are critical of the likelihood of single-step electrochemical
oxidation of a hydrocarbon fuel, even in the case of the simplest hydrocarbon, CH4.
Instead, the reactions may proceed via the following elementary reaction steps:
CH4 + O2− CH3OH + 2e−
CH3OH + 2O2− HCOOH + H2O + 4e−
HCOOH + O2− CO2 + H2O + 2e−
Alternatively, cracking of methane followed by electrochemical oxidation of the cracking60

products likely follows a path given by31
CH4 C + 2H2
C + 2O2− CO2 + 4e−
H2 + 2O2− H2O + 2e−
Mogensen et al. emphasized the importance of clarifying the precise mechanism of the
hydrocarbon conversion process. It is important to distinguish between the different
reaction pathways because the demands on the anode material differ significantly for
these pathways. For example, an electrode designed for direct electrochemical oxidation
of hydrocarbon should have a very high turnover rate of the hydrocarbon bond break-
ing. Cracking followed by electrochemical conversion of the cracking products requires
an electrode that is both highly active for the cracking of methane and active for the
oxidation of the cracking products. In other words, it is of great importance to know
the pathway by which the conversion of hydrocarbon is to proceed in order to determine
which properties of the anode should be optimized.31
4.5. Carbon electrochemical oxidation
Direct electrochemical oxidation of carbon also plays an important role when fuel-
ing SOFCs with carbon-based fuels. Anode stability can be seriously compromised by
deposited carbon, and other SOFC components are susceptible to carbon buildup and
eventual blockage if some method for removal of solid deposited carbon is not considered.
For example, new work has shown that nanostructured barium oxide/nickel (BaO/Ni)
interfaces (created by vapor deposition of BaO into Ni-YSZ) facilitate water-mediated
carbon-removal reactions in the anode.32 The nanostructures readily adsorb water, and
the dissociated OHad(BaO) from H2Oad(BaO) reacts with Cad(Ni) near the BaO/Ni in-
terface to produce CO and H species, which can be electrochemically oxidized at the TPB
in the anode. The BaO/Ni-YSZ anode displayed stable operation and high power den-
sity in C3H8, CO, and gasified carbon fuels at 750C, with no observable microstructural
change and minimal carbon buildup. Refer to Table 1 for a comparison of peak power
densities achieved with this cell and others operating with various fuels. To examine the
mechanism of carbon removal, Yang et al. constructed models for DFT calculations. On
61

the basis of that analysis, the most probable elementary processes on the anode with
nanostructured BaO/Ni interfaces are predicted:32
Dissociative adsorption of H2O on BaO:
H2O→ Had(BaO) + OHad(BaO)
COH formation on Ni:
Cad(Ni) + OHad(BaO)→ COHad(Ni)
CO and H formation on Ni (rate-determining):
COHad(Ni)→ COad(Ni) + Had(Ni)
Diffusion to the TPB:
COad(Ni)→ COTPB; Had(Ni)→ HTPB
CO oxidation at the TPB:
COTPB + O2− → CO2 + 2e−
H oxidation at the TPB:
2HTPB + O2− → H2O + 2e−
In addition, electrochemical oxidation of solid carbon is of great importance to SOFC
systems specifically designed for direct carbon conversion, typically abbreviated SO-
DCFC for solid-oxide direct carbon fuel cell (see, e.g., Refs. 106–109). While the literature
on electrochemical oxidation of carbon in molten-salt systems is vast, it is beyond the
scope of this paper. Very little is known about the direct electrochemical conversion
of solid carbon in an all-solid-state system. Pioneering work by the Danish company
Dinex Filter Technology A/S on the electrochemical oxidation of carbon in a reactor
constructed with porous ceria and catalytic active electrodes has been reported (see
Ref. 31 for a reference to this and discussion), but the work is carried out under net
oxidizing conditions—for diesel exhaust clean up—and not in an environment that is
similar to that of the anode compartment in a fuel cell.
Gur and Huggins,110 and subsequent more recent work from the same group (see, e.g.,
Refs. 111–116) are studying SOFCs utilizing fluidized-bed or gasification-driven mecha-
nisms to obtain CO gas from solid carbon via the Boudouard reaction. The design is in
principle an integrated gasifier, so that the SOFC is operating on CO as fuel and not62

directly on solid carbon. While their work is certainly of importance, the direct electro-
chemical conversion of solid carbon is not the primary current-producing mechanism.
The concept of rechargeable direct carbon fuel cells (RDCFCs) has been published
by Ihara et al.117 Their cell used pyrolytic carbon deposited by thermal decomposition
of dry methane as fuel, and they showed that the SOFC can generate electrical power in
repeated charging (i.e., repeated carbon-deposition cycles) and power-generation cycles—
the deposited carbon allowed the cell to essentially operate as a battery, or with a fuel
storage mode. Nickel-gadolinium-doped ceria (Ni-GDC) anodes showed 8.6 times higher
power density (66.5 mW/cm2) and 29 times more effective carbon mass used as fuel than
traditional Ni-YSZ anodes. Hasegawa and Ihara118 later studied the reaction mechanism
for the oxidation of deposited carbon in a SOFC anode, and suggested the pathways il-
lustrated in Fig. 14. Li et al.106 recently published a more in-depth analysis of the
mechanism for carbon direct electrochemical conversion, based on experimental investi-
gation of CH4-deposited carbon in an anode-supported cell consisting of a Ni-YSZ anode
support layer (680 µm), a Ni-scandium-stabilized zirconium (Ni-ScSZ) anode active inter-
layer (15 µm), a ScSZ electrolyte layer (20 µm), and a LSM-ScSZ cathode layer (15 µm).
63

The proposed mechanism appears as106
1. Oxygen-ion transfer between surface and bulk electrolyte
O×O O2− + V··O
2. First O2− adsorption
CRS + O2− CRSO2−
3. Fast discharge steps
CRSO2− CRSO− + e−
CRSO− CRSO + e−
4. Desorption of CO or second O2− adsorption by CRSO
CRSO→ CO(g)
CRSO + O2− CRSO2−2
5. Fast discharge and CO2 desorption
CRSO2−2 CRSO−2 + e−
CRSO−2 CO2(g) + e−
Net global reactions
CRS + O2− CO(g) + 2e−
CRS + O2− CO2(g) + 4e−
During discharge, the O2− is conducted into the anode ionic conductor YSZ, where
it reacts with a carbon reactive site CRS of the carbon deposited in the anode. Two
single-electron discharge steps follow to form a double-bonded adsorbed structure CRSO
(carbonyl group C=O, including adsorption with small and large lattice defects). The
CRSO desorbs as CO or absorbs a second O2− to eventually produce CO2.106
A fundamental understanding of carbon electrochemical oxidation is of significant
importance for SOFC anode design. Whether the goal is to mitigate carbon deposition to
prevent buildup and eventual loss of cell function in SOFCs utilizing hydrocarbon fuels, or
direct conversion in SOFCs using solid carbon fuel sources, reaction pathways for carbon
electrochemical oxidation are necessary to develop stable and optimized anodes. Recent64

reviews by Cao et al.119 and Giddey et al.120 provide a comprehensive picture of the
current state of direct-carbon fuel cells, with generous attention given to solid-electrolyte
systems.
65

0.0
0.5
1.0
1.5
2.0
0.0
0.1
0.2
0.3
0.4
0.5
0.6
0.7
0.8
0.9
0 1 2 3
Power density (W
/cm2)
Volta
ge (V
)
Current density (A/cm2)
800ºC1 atm
50% H2O+H266% H2O+H280% H2O+H2
0.0
0.5
1.0
1.5
2.0
0.0
0.2
0.4
0.6
0.8
1.0
1.2
0 1 2 3 4 5 6 7
Power density (W
/cm2)
Volta
ge (V
)
Current density (A/cm2)
800ºC1 atm
100% H215% H2O+H245% H2O+H2
Fig. 4.
66

Fig. 5.
67

Fig. 6.
68

Fig. 7.
69

-4
-3
-2
-1
0.0 0.1 0.2 0.3 0.4
ln(i
[A/c
m2 ]
)
Anode activation overpotential ηact,a (V)
(A) Full model(B) No H2O dissociation(C) Fully spreadedExperimental
1.5F/RT
1.0F/RT
0.5F/RT
700ºC1 atm
Fig. 8.
70

Fig. 9.
71

0.001
0.01
0.1
1
Cur
rent
den
sity
(mA
/cm
2 )
p = 67000 PaT = 876°C
CO2
p = 33300 Pap = 6700 Pap = 670 Pa
COCOCO
p = 33300 Pa
CO
p = 670 PaCO
p = 6700 Pa
CO
0.001
0.01
0.1
1
0.6 0.7 0.8 0.9 1.0
Cur
rent
den
sity
(mA
/cm
2 )
Cell potential (V)
p = 670 PaT = 876°C
CO2
p = 67 Pap = 13.4 Pap = 6.7 Pa
COCOCO
p = 6.7 PaCO
p = 67 PaCO
p = 13.4 Pa
CO
0.001
0.01
0.1
1
Cur
rent
den
sity
(mA
/cm
2 )
p = 67000 PaT = 876°C
CO2
p = 33300 Pap = 6700 Pap = 670 Pa
COCOCO
p = 33300 Pa
CO
p = 670 PaCO
p = 6700 Pa
CO
0.001
0.01
0.1
1
0.6 0.7 0.8 0.9 1.0
Cur
rent
den
sity
(mA
/cm
2 )
Cell potential (V)
p = 670 PaT = 876°C
CO2
p = 67 Pap = 13.4 Pap = 6.7 Pa
COCOCO
p = 6.7 PaCO
p = 67 PaCO
p = 13.4 Pa
CO
Fig. 10.
72

Fig. 11.
73

Low degree of C coverageNi surface modification with high C activity
High CO oxidation rate
Increasing C coverageDecreasing CO oxidation rate
(Slow process)
High C coverageNi surface modification with high C activity instability
Low CO oxidation rate
Reconstruction of Ni surfaceDecreasing CO coverage
Increasing CO oxidation rate(Spontaneous process)
Fig. 12.
74

0.0
0.5
1.0
1.5
2.0
0.0
0.2
0.4
0.6
0.8
1.0
1.2
0 1 2 3 4 5
Power density (W
/cm2)
Volta
ge (V
)
Current density (A/cm2)
Jiang and Virkar, J. Electrochem. Soc., 150(7):A942-A951, 2003.
800ºC1 atm
100% H214% CO+H232% CO+H246% CO+H255% CO+H268% CO+H280% CO+H2100% CO
0.00
0.05
0.10
0.15
0.20
0.25
0.0
0.2
0.4
0.6
0.8
1.0
1.2
0.0 0.1 0.2 0.3 0.4 0.5 0.6
Power density (W
/cm2)
Volta
ge (V
)
Current density (A/cm2)
850ºC1 atm
100 μm pattern33.3% H2 in Ar
50 μm pattern20 μm pattern10 μm pattern
100 μm pattern33.3% CO in Ar
50 μm pattern20 μm pattern10 μm pattern
Sukeshini et al., J. Electrochem. Soc., 153(4):A705-A715, 2006.
Fig. 13.
75

Fig. 14.
76

5. Thermochemistry in SOFC anodes
Typical operating temperatures of SOFCs are high enough that homogeneous gas-
phase chemistry within the anode and fuel channel should be considered with hydro-
carbon fuels. Moreover, because the most common anode metal is nickel, there are
abundant nickel catalysts to promote thermochemical reactions via heterogeneous chem-
istry. It is well known that nickel is an efficient catalyst for hydrocarbon cracking, and
is highly susceptible to carbon deposition sometimes leading to the growth of carbon
nanofibers (or whiskers), which separate the Ni particle from the YSZ.31,121,122 Both ho-
mogeneous and heterogeneous chemistry play key roles in reforming the hydrocarbon fuel
into a hydrogen- and CO-rich fuel. Inside the porous anode, homogeneous chemistry is
sometimes ignored based on the argument that homogeneous reactions of methane with
H2O and CO2 are very slow at 800C or lower.40,48 However, for higher hydrocarbon
fuels, higher temperatures, or partial oxidation conditions, homogeneous reactions are
important for controlling the relative composition of gas-phase species. In principle, the
majority of the anode channel is exposed to the interconnect material, and only a frac-
tion is exposed to the anode material containing Ni catalysts. Therefore, homogeneous
chemistry is of greater importance and cannot be ignored in the channel (i.e., where
oxidation products like H2O and CO2 combine with and reform the fuel as it moves
downstream).123,124
5.1. Reforming and shifting reactions
There are various alternatives for the reformation of hydrocarbons, including steam
reforming, dry reforming, partial oxidation, autothermal reforming, and thermal decom-
position. In the context of SOFCs, the reforming of hydrocarbon fuels may, in general,
take place externally in a separate process, or internally inside the hot stack. Each of
the aforementioned global reforming processes is briefly discussed below. The reader
is referred to Ref. 5 for a comprehensive discussion of and performance predictions of
an SOFC using syngas derived from partial oxidation (CPOx) or steam reforming of
methane and dodecane, and gasification of coal or biomass.
A thermodynamic summary of each of the reactions is provided graphically in Fig. 15.
These reforming reactions proceed through homogeneous and heterogeneous elementary
77

Table 8Heterogeneous reaction mechanism for CH4 reforming on Ni-based catalysts a
Reaction A b n b E b
1 H2 + (Ni) + (Ni)→ H(Ni) + H(Ni) 1.000× 10⁻² c 0.0 0.02 H(Ni) + H(Ni)→ (Ni) + (Ni) + H2 2.545× 10+19 0.0 81.23 O2 + (Ni) + (Ni)→ O(Ni) + O(Ni) 1.000× 10⁻² c 0.0 0.04 O(Ni) + O(Ni)→ (Ni) + (Ni) + O2 4.283× 10+23 0.0 474.95 CH4 + (Ni)→ CH4(Ni) 8.000× 10⁻³ c 0.0 0.06 CH4(Ni)→ (Ni) + CH4 8.705× 10+15 0.0 37.57 H2O + (Ni)→ H2O(Ni) 1.000× 10⁻¹ c 0.0 0.08 H2O(Ni)→ (Ni) + H2O 3.732× 10+12 0.0 60.89 CO2 + (Ni)→ CO2(Ni) 1.000× 10⁻⁵ c 0.0 0.010 CO2(Ni)→ (Ni) + CO2 6.447× 10+7 0.0 26.011 CO + (Ni)→ CO(Ni) 5.000× 10⁻¹ c 0.0 0.012 CO(Ni)→ (Ni) + CO 3.563× 10+11 0.0 111.3
εCO −50.0 d
13 O(Ni) + H(Ni)→ OH(Ni) + (Ni) 5.000× 10+22 0.0 97.914 OH(Ni) + (Ni)→ O(Ni) + H(Ni) 1.781× 10+21 0.0 36.115 OH(Ni) + H(Ni)→ H2O(Ni) + (Ni) 3.000× 10+20 0.0 42.716 H2O(Ni) + (Ni)→ OH(Ni) + H(Ni) 2.271× 10+21 0.0 91.817 OH(Ni) + OH(Ni)→ O(Ni) + H2O(Ni) 3.000× 10+21 0.0 100.018 O(Ni) + H2O(Ni)→ OH(Ni) + OH(Ni) 6.373× 10+23 0.0 210.919 O(Ni) + C(Ni)→ CO(Ni) + (Ni) 5.200× 10+23 0.0 148.120 CO(Ni) + (Ni)→ O(Ni) + C(Ni) 1.354× 10+22 −3.0 116.1
εCO −50.0 d
21 O(Ni) + CO(Ni)→ CO2(Ni) + (Ni) 2.000× 10+19 0.0 123.6
εCO −50.0 d
22 CO2(Ni) + (Ni)→ O(Ni) + CO(Ni) 4.653× 10+23 −1.0 89.323 HCO(Ni) + (Ni)→ CO(Ni) + H(Ni) 3.700× 10+21 0.0 0.0
εCO 50.0 d
24 CO(Ni) + H(Ni)→ HCO(Ni) + (Ni) 4.019× 10+20 −1.0 132.225 HCO(Ni) + (Ni)→ O(Ni) + CH(Ni) 3.700× 10+24 −3.0 95.826 O(Ni) + CH(Ni)→ HCO(Ni) + (Ni) 4.604× 10+20 0.0 110.027 CH4(Ni) + (Ni)→ CH3(Ni) + H(Ni) 3.700× 10+21 0.0 57.728 CH3(Ni) + H(Ni)→ CH4(Ni) + (Ni) 6.034× 10+21 0.0 61.629 CH3(Ni) + (Ni)→ CH2(Ni) + H(Ni) 3.700× 10+24 0.0 100.030 CH2(Ni) + H(Ni)→ CH3(Ni) + (Ni) 1.293× 10+23 0.0 55.331 CH2(Ni) + (Ni)→ CH(Ni) + H(Ni) 3.700× 10+24 0.0 97.132 CH(Ni) + H(Ni)→ CH2(Ni) + (Ni) 4.089× 10+24 0.0 79.233 CH(Ni) + (Ni)→ C(Ni) + H(Ni) 3.700× 10+21 0.0 18.834 C(Ni) + H(Ni)→ CH(Ni) + (Ni) 4.562× 10+22 0.0 161.135 O(Ni) + CH4(Ni)→ CH3(Ni) + OH(Ni) 1.700× 10+24 0.0 88.336 CH3(Ni) + OH(Ni)→ O(Ni) + CH4(Ni) 9.876× 10+22 0.0 30.437 O(Ni) + CH3(Ni)→ CH2(Ni) + OH(Ni) 3.700× 10+24 0.0 130.138 CH2(Ni) + OH(Ni)→ O(Ni) + CH3(Ni) 4.607× 10+21 0.0 23.639 O(Ni) + CH2(Ni)→ CH(Ni) + OH(Ni) 3.700× 10+24 0.0 126.840 CH(Ni) + OH(Ni)→ O(Ni) + CH2(Ni) 1.457× 10+23 0.0 47.141 O(Ni) + CH(Ni)→ C(Ni) + OH(Ni) 3.700× 10+21 0.0 48.142 C(Ni) + OH(Ni)→ O(Ni) + CH(Ni) 1.625× 10+21 0.0 128.6
a Based on Ref. 41, this mechanism can be downloaded from www.detchem.com.b Arrhenius parameters for the rate constants written in the form: k = ATn exp(−E/RT ). The un-
its of A are given in terms of moles, centimeters, and seconds. E is in kJ/mol.c Sticking coefficientd Coverage-dependent activation energy appearing in k = ATn exp(−E/RT ) exp(−εCOθCO/RT ).
The total available surface site density is Γ = 2.66× 10⁻⁹ mol/cm2. εCO is in kJ/mol.
78

thermochemical reaction steps. Homogeneous elementary chemistry is well developed in
the combustion literature, and Hecht et al.40 recently proposed an elementary heteroge-
neous reaction mechanism for CH4 on Ni-based catalysts. The reaction mechanism con-
sists of 42 irreversible reactions among 6 gas-phase and 12 surface-adsorbed species. The
full mechanism covers the global aspects of steam reforming, dry reforming, the water-gas
shift (forward and reverse), and carbon deposition. This mechanism was adopted by Zhu
et al.48 and later improved by Janardhanan and Deutschmann.41 The full mechanism
with reaction-rate constants is detailed in Table 8. For steam reforming on nickel-based
catalysts, the elementary reaction steps can be summarized according to:6
• CH4 adsorption and dehydrogenation to form the chemisorbed surface species
CH3(Ni), CH2(Ni), CH(Ni), and C(Ni);
• H2O adsorption and dissociation to form the surface species OH(Ni), H(Ni), and
O(Ni);
• formation of the intermediate surface species CHxO(Ni), which are related to the
formation of the precursors of CO and CO2;
• coke formation due to CH4 thermal cracking and Boudouard reaction;
• carbon gasification by CO2, H2, and steam.
5.1.1. Steam reforming.
Steam reforming (SR), sometimes called steam-methane reforming (SMR), is a pro-
cess in which high-temperature steam is used to produce a mixture of hydrogen and
CO (i.e., syngas) from methane, ethanol, propane, or even gasoline. The lighter hydro-
carbons react with hot water vapor in the presence of a catalyst to produce hydrogen,
carbon monoxide, and a relatively small amount of carbon dioxide. Steam reforming is
extremely endothermic, and therefore requires an external source of heat but can some-
times utilize recycled heat from exothermic processes depending on system configuration.
The reforming process is generally followed by the water-gas shift (WGS) reaction (mildly
exothermic), where the carbon monoxide can further react with steam to produce more
hydrogen. The SR and WGS reactions are, respectively,
CxHy + xH2O xCO +(x+
y
2
)H2
(∆CH4r H25C = 206.2 kJ/mol, ∆CH4
r H1000C = 227.5 kJ/mol)79

CO + H2O CO2 + H2
(∆rH25C = −41.2 kJ/mol, ∆rH
1000C = −32.1 kJ/mol)
5.1.2. Dry reforming.
It is well known that CO2 can behave as an oxidant for hydrocarbons in the presence
of a suitable catalyst, so-called dry reforming or carbon dioxide reforming. Carbon depo-
sition is a particular concern with dry reforming, especially with Ni-based catalysts. Dry
reforming is also a strongly endothermic reaction, but it provides a use for sequestered
CO2 to produce useful syngas mixtures. For a general hydrocarbon, the dry-reforming
reaction is
CxHy + xCO2 2xCO +y
2H2
(∆CH4r H25C = 247.3 kJ/mol, ∆CH4
r H1000C = 259.6 kJ/mol)
5.1.3. Partial oxidation.
Partial oxidation (POx) is a chemical reaction between the hydrocarbon and oxygen
(generally from air because of its convenience and cost) in a substoichiometric ratio,
hence the name “partial oxidation.” It is an exothermic process, and typically has lower
efficiency than other reforming methods because of energy loss in oxidizing the hydrocar-
bon. Because there is not a need for an external heat source, POx is characterized by a
much faster startup time than steam reformers. Catalytic partial oxidation (CPOx) re-
duces the required reforming temperature from around 1200C to 800–900C through the
use of a catalyst (e.g., nickel). Catalyst selection and stability can be an issue for high-
sulfur-containing fuels. The CPOx reaction is weakly exothermic, eliminating the need
for external thermal inputs. Partial oxidation is characterized by the general reaction
CxHy +x
2O2 xCO +
y
2H2
(∆CH4r H25C = −35.7 kJ/mol, ∆CH4
r H1000C = −21.9 kJ/mol)
5.1.4. Autothermal reforming.
Autothermal reforming (ATR) can be thought of as a combination of POx and steam
reforming (or dry reforming) as it uses oxygen and steam (or carbon dioxide) in a reaction
with methane, for example, to form syngas. It has merits from both processes in that
ATR is more flexible than SR with respect to startup time and has higher efficiency80

than POx. The heat produced by the partial oxidation reaction is used in the reforming
reaction. The reactions below are for ATR of methane—when steam is used, the resulting
syngas is a mixture of H2:CO=5:2, whereas when carbon dioxide is used, the syngas
mixture has a ratio H2:CO=1:1.
4CH4 + O2 + 2H2O 4CO + 10H2
(∆rH25C = 85.3 kJ/mol, ∆rH
1000C = 102.8 kJ/mol)
2CH4 + O2 + CO2 3CO + 3H2 + H2O
(∆rH25C = −15.1 kJ/mol, ∆rH
1000C = −5.81 kJ/mol)
5.1.5. Thermal decomposition.
Thermal decomposition is a chemical decomposition of the hydrocarbon that requires
heat to break the chemical bonds. High purity hydrogen can be obtained from such
processes, but removal of fuel impurities (e.g., sulfur) and solid carbon will be an issue
in SOFCs. Thermal decomposition of methane proceeds by the reaction
CH4 C + 2H2
(∆C(gr)r H25C = 74.9 kJ/mol, ∆C(gr)
r H1000C = 73.9 kJ/mol)
5.2. Carbon deposition
A significant concern during reforming processes is the formation of solid carbon
through undesired side reactions. Amongst other deleterious effects, solid carbon formed
in the anode can block the pores and increase transport resistance for gas species trying
to reach the TPB, and/or prevent reforming reactions by covering the catalyst particles.
At typical SOFC operating temperatures with hydrocarbon or syngas fuels, the extent of
carbon formation depends on factors such as the steam/carbon ratio, operating conditions
(e.g., temperature, pressure, current density), and anode catalyst. Although it is possible
to minimize carbon deposition on traditional Ni-YSZ anodes by providing sufficient H2O
in the fuel stream, the amounts required are generally excessive, diluting the fuel and
reducing overall efficiency, in addition to creating device- and systems-scale complexity
because of the need for water management solutions. In this light, analysis of carbon
deposition in the SOFC anode—including the deposition and growth mechanisms, and81

material tolerances—is absolutely necessary if SOFCs are to be a viable and economical
option for efficiently utilizing carbon-containing fuels.
5.2.1. Deposition and growth mechanisms.
82

-400
-300
-200
-100
0
100
400 600 800 1000 1200 1400 1600
Δ G
º (kJ
/mol
)
Temperature (ºC)
r
-100
0
100
200
300
400 600 800 1000 1200 1400 1600
Δ H
º (kJ
/mol
,
) or Δ
Sº (
J/m
ol/K
,
)
Temperature (ºC)
rr
Exothermic
Endothermic
CH4 + H2O <=> CO + 3H2CH4 + CO2 <=> 2CO + 2H2CO + H2O <=> CO2 + H24CH4 + O2 + 2H2O <=> 4CO + 10H22CH4 + O2 + CO2 <=> 3CO + 3H2 + H2OCH4 + (1/2)O2 <=> CO + 2H2CH4 <=> C(gr) + 2H2
Fig. 15.
83

Table
9D
iffer
ent
path
way
sfo
rca
rbon
dep
osi
tion
(adapte
dfr
om
Ref
.125)
Fib
rous
carb
on
Enca
psu
lati
ng
poly
mer
sP
yro
lyti
cca
rbon
Form
ati
on
path
way
•H
eter
ogen
eous
chem
istr
yon
am
etal•
Het
erogen
eous
chem
istr
yon
am
etal•
Hom
ogen
eous
gas-
phase
chem
-(e
.g.,
Ni)
cata
lyst
(e.g
.,N
i)ca
taly
stis
try
•D
iffusi
on
of
Cth
rough
the
Ni
latt
ice
•Slo
wp
oly
mer
izati
on
of
CnHm
rad-
•T
her
mal
crack
ing
of
hydro
carb
on
•N
ucl
eati
on
and
whis
ker
gro
wth
from
icals
on
the
Ni
surf
ace
,ev
entu
ally
•D
eposi
tion
of
Cpre
curs
ors
on
bel
owth
eN
ipart
icle
,ev
entu
ally
sep-
form
ing
an
enca
psu
lati
ng
film
cata
lyst
ara
ting
the
part
icle
from
the
elec
tro-
lyte
(see
Fig
.16)
Eff
ects
•N
odea
ctiv
ati
on
of
Ni
surf
ace
•P
rogre
ssiv
edea
ctiv
ati
on
•E
nca
psu
lati
on
of
cata
lyst
part
icle
•B
reakdow
nof
cata
lyst
and
incr
eas-
•D
eact
ivati
on
and
incr
easi
ng
ing
pre
ssure
dro
ppre
ssure
dro
p
Tem
per
atu
re>∼
450C
(∼720
K)
<∼
500C
(∼770
K)
>∼
600C
(∼870
K)
Cri
tica
lpara
met
ers•
Hig
hte
mp
eratu
re•
Low
tem
per
atu
re•
Hig
hte
mp
eratu
re•
Low
H2O
:CnHm
rati
o•
Low
H2O
:CnHm
rati
o•
Hig
hvoid
fract
ion
•L
owact
ivit
y•
Low
H2:CnHm
rati
o•
Low
H2O
:CnHm
rati
o•
Aro
mati
cfe
ed•
Aro
mati
cfe
ed•
Hig
hpre
ssure
•N
oen
hance
dH
2O
adso
rpti
on
•A
ctiv
ity
of
cata
lyst
84

There are two primary mechanisms for carbon formation in SOFC anodes: (i) het-
erogeneously formed carbon nanowires or nanofibers that grow on the catalyst;126,127
and (ii) homogeneously formed soot that can deposit anywhere in the anode.128–130 The
soot, or pyrolytic carbon, can encapsulate and deactivate catalyst particles. For each of
these mechanisms, the formation characteristics and resulting impact on the anode (and
therefore, the cell behavior) are summarized in Table 9.
Encapsulating carbon is known to form by slow polymerization of CnHm radicals on
the Ni surface, most often at temperatures lower than 500C. Because the operating
temperatures of SOFCs are typically well above this, it is not of much concern. However,
growth of carbon nanofibers and soot formation are prevalent at elevated temperatures
in the range of SOFC operation, and the mechanisms governing their formation have
been well investigated. Pyrolytic carbon has been studied extensively in combustion
science,128,129 and can be formed in the absence of a catalyst via gas-phase condensation
reactions.130 Simple hydrocarbon fuels react to form a poly-aromatic hydrocarbon (PAH)
via abstraction, beta-scission, and addition/recombination. These PAHs are regarded as
precursors of carbon deposition or soot formation. The deposition propensity is predicted
by the sum of mole fractions of all species containing five or more carbon atoms.124,130
Alternatively, the formation of carbon fibers involves a dissolution and diffusion of carbon
atoms into the metal catalyst (where the source of carbon originates from dissociation of
hydrocarbons over the catalyst), followed by precipitation of carbon atoms as a graphite
fiber on the surface.127 The formation of carbon fibers can result in removal of Ni particles
from the electrode—a process that occurs when the nickel catalyst is physically lifted from
the electrode by its attachment to the growing carbon fiber (see Fig. 16 and Ref. 126)—
and can eventually cause the electrode to fracture because of the mechanical stresses
induced by many growing fibers.131
The propensity for solid carbon formation has also been examined using equilibrium
thermodynamic calculations.35,123,132 Most thermodynamic analyses use thermochemi-
cal properties of graphite to represent the carbon phase because these values are readily
available. However, assuming graphitic carbon may not be appropriate for predicting the
onset of carbon deposition.127 There is evidence, for example, in which carbon deposition
has not been observed experimentally although thermodynamic equilibrium calculations
85

using properties of graphite predict its formation. In contrast, there are reports of
carbon formation under conditions where it is predicted to be thermodynamically unfa-
vorable.127 The predictive failures may result from a lack of thermodynamic information
for activation barriers relating to the carbon growth mechanism (e.g., the deposition and
growth of hollow carbon tubes would certainly have a different activation energy than a
solid fiber, and even more so than a deposited carbon film). Because the growth mech-
anism depends on operating conditions and catalyst type, the contribution of chemical
kinetics, which has similar dependencies, is also likely important.
5.2.2. Coking resistant anode materials.
Although carbon formation on Ni can be suppressed and sometimes avoided alto-
gether if there is sufficient steam to remove carbon faster than it deposits, using SOFCs
as a viable and promising technology with non-hydrogen fuels requires better suited an-
ode materials. The SOFC community has given cerium oxide much attention in recent
years because of its excellent oxidation catalysis effects for CO and hydrocarbons.133 In
addition, its mixed-ionic-electronic conducting ability in a reducing atmosphere has also
attracted interest,18 making ceria an ideal catalyst in SOFC anodes for hydrocarbon-fuel
applications.
A composite anode consisting of Cu-CeO2-YSZ/SDC has been used to demonstrate
the significant performance enhancement (compared to a Cu-YSZ/SDC cell) of a cell
operating on hydrocarbon fuels, and therefore, the promise of using ceria.18,25,38,105,134
Copper is not catalytically active for carbon deposition, but it is effective as a current
collector. Because of the lower catalytic activity, Cu-based anodes typically display
larger activation polarizations compared to Ni-based counterparts. Further, fabrication
procedures for Ni-based anodes are not suitable for Cu-based cermets because the melting
point of Cu is lower than Ni. Ceria provides high catalytic activity for hydrocarbon
reforming due to its oxygen storage and transport properties.
McIntosh et al.135 examined the changes that occur in hydrocarbon SOFC perfor-
mance by replacing nickel-based cermets with composites containing Cu and ceria. They
reported direct, electrochemical oxidation of various hydrocarbons (methane, ethane,
1-butene, n-butane and toluene) at 700C and 800C. Ye et al.136 explored the per-
formance of a Cu-CeO2-ScSZ (scandia-stabilized zirconia) composite anode for a SOFC
86

operating on ethanol fuel. The anode exhibited stable performance for a fuel stream of
ethanol and water, without any visible carbon deposition after 50 h.
Instead of complete substitution of nickel with copper, some attention has been given
to Cu-Ni alloys to improve the compatibility of Cu-based anodes. Kim et al.131 tested a
range of Cu-Ni alloys (with Ni compositions of 0, 10, 20, 50, and 100%) at 800C with dry
CH4 as fuel. The performance of a cell made with Cu(80%)-Ni(20%) showed a significant
increase in power density with time for 500 h of operation. This observation is attributed
to an increase in electronic conductivity in the anode due to small carbon deposits,
which likely increase connectivity of electronic conduction pathways without being severe
enough to have a deleterious effect. Lee et al.137 examined the performance of anodes
containing mixtures of Cu and Ni or Cu and Co operated with H2 and n-butane fuels at
700C and 800C. The bimetallic anodes exhibited improved performance in H2 at 700C
compared to Cu-based anodes, and were less susceptible to carbon formation in n-butane
compared to Ni- or Co-based anodes. Xie et al.138 also researched the performance of
metal-alloyed cermet anodes. A tri-metallic alloy of Fe-Co-Ni-SDC was used as the
cermet anode (in compositions of FexCo0.5−xNi0.5 with x = 0.1, 0.2, 0.25, 0.3, 0.4), with
a GDC electrolyte, and Sm0.5Sr0.5CoO3-SDC (SSC-SDC) cathode. With x = 0.25, the
cells showed the lowest interfacial resistance (e.g., 0.11 Ω cm2 at 600C with H2 and 3%
H2O) and highest power density (e.g., 0.75 W/cm2 at 600C with H2 and 3% H2O).
Similar work has shown that anode performance can be improved by adding no-
ble metals (e.g., Pt, Rh, Pd, or Ru), which effectively promote hydrocarbon reform-
ing reactions. Costa-Nunes et al.139 reported that the addition of 1 wt.% Pt into the
Cu-CeO2-based anode greatly improved the performance of a SOFC operating on hy-
drocarbon fuels. Hibino et al.37,140 used a Ru-Ni-GDC anode and a thin ceria-based
electrolyte-film hydrocarbon-fueld SOFC. The Ru catalyst was shown to effectively pro-
mote hydrocarbon reforming and the cell achieved a peak power density of 0.75 W/cm2
with dry methane, which is comparable to 0.769 W/cm2 with humidified (2.9 vol.% H2O)
hydrogen. Zhan et al.26,39 used a conventional anode with a Ru-CeO2 catalyst layer to
internally reform iso-octane without coking.
Other metals have also been used to decrease carbon deposition on a catalyst. A small
amount of gold present in a Ni-based catalyst has been shown to significantly reduce
87

carbon deposits during steam reforming of methane,141 most likely due to inhibition
of methane dissociation by Au.142,143 For example, Gavrielatos et al.144 tested an Au-
modified Ni-YSZ anode (1% Au with respect to Ni) in methane-rich steam reforming
conditions, and found the electrode to be highly tolerant to carbon deposits, even at
methane-to-water ratios as high as 3, at temperatures in the range 700–900C.
Perovskites are also commonly used as anode materials, which are metal-oxide com-
pounds with the general formula ABO3. Cations A and B are able to combine more than
two metal ions.1 Perovskite oxides containing transition metals at B sites have been
proven to be effective catalysts not only for electrochemical reduction of oxygen, but also
for the combustion of light hydrocarbons (e.g., CH4, C2H6).145,146 Hydrocarbon oxida-
tion over perovskite oxides is thought to proceed by both suprafacial and intrafacial reac-
tions.147 The suprafacial reactions take place between the adsorbed species on the surface
at relatively low temperatures, and the reaction rates appear to be correlated primarily
with the electronic configurations of the surface transition-metal ions. The intrafacial
reactions typically occur at high temperatures, with rates that are greatly dependent on
the thermodynamic stability of oxygen vacancies adjacent to the transition-metal ion.
Studies have reported that LSCF exhibits good catalytic activity for direct CH4 oxida-
tion and is less susceptible to deactivation through carbon deposition than conventional
Ni-YSZ anode catalysts. Electrochemical oxidation of methane on LSCF catalysts used
in a SOFC anode environment is thought to occur via:148 (1) CH4 decomposition; (2)
electrochemical oxidation of hydrogen species to H2O; and (3) electrochemical oxidation
of CO to O2. The formation of CO2 and CO takes place in a parallel pathway (i.e.,
C + 2O2− CO2 + 4e−, C + O2− CO + 2e−), where the intrinsic rate constant for
the formation of CO2 is greater than that of CO.
Despite the attention given to perovskite materials for applications as anodes in
hydrocarbon-fueled SOFCs,149–159 their performance is still less favorable compared to
Ni-YSZ cermet anodes. Aside from relatively low electrochemical activities, other issues
must be addressed if perovskites are to be used in SOFC anodes,1–3 including relatively
low stability in a reducing environment, and relatively low electronic conductivity com-
pared with metal catalysts.
88

5.3. H2S poisoning and oxidation5.3.1. H2S poisoning.
Most available hydrocarbon fuels contain some amount of sulfur, which is a poison
for nickel steam-reforming catalysts and for many anode catalysts including platinum.
The adsorption of sulfur on nickel is reversible at low concentrations. However, at high
concentrations, bulk sulfidation occurs causing permanent damage to the catalyst. The
sensitivity of nickel to sulfur poisoning decreases with increasing temperature, so SOFCs
are able to tolerate higher concentrations of sulfur in the fuel feed than other lower-
temperature fuel cells. In general, the concentration of sulfur in the fuel needs to be
reduced to 0.2 ppm or lower. Sulfur is mainly found in the form of hydrogen sulfide
because organic sulfur compounds, usually included as an odorant, reform to H2S during
desulfurization. The existence of H2S in the fuel gas decreases the anode electrochemical
activity as a result of contamination of reaction sites by sulfur adsorption on the Ni cata-
lyst surface. Outside of the anode, sulfur species can be equally deleterious because H2S
is a highly corrosive gas and its existence can lead to corrosion of other cell components.
To eliminate the need for desulfurization units in natural-gas- or coal-syngas-fueled
SOFC systems, developing anode materials with high sulfur tolerance is absolutely cru-
cial. Without having to expend energy to clean the fuel of sulfur, the overall system
efficiency can be improved, and system cost and complexity can be reduced. Even small
efficiency improvements and reductions in cost can have a big impact on overall cost per
kW—the DOE target for SOFCs to be commercially viable is $400/kW—because both
the numerator and denominator are contributing to a reduced ratio.
Experiments designed to study the effects of H2S on the performance of a Ni-YSZ
anode show the onset of performance degradation for H2S concentrations of 0.05, 0.5, and
2 ppm at operating temperatures of 750C, 900C, and 1000C, respectively.160,161 That
is, the cell was able to withstand higher concentrations of H2S at higher temperatures
before decreases in performance were observed. Losses in performance were shown to be
recoverable if the sulfur was removed, with better recovery at lower temperature. The
degradation phenomenon has been identified and confirmed by others, but the mecha-
nism causing deterioration has yet to be identified. Because of the ability to recover
performance—sometimes up to 90% recovery—it is presumed that the strong adsorp-
89

tion of sulfur or H2S on active sites in the Ni-YSZ anode blocks these sites from being
electrochemically active162 (i.e., there are less available sites for H2 species to adsorb,
dissociate, and participate in charge transfer). Irreversibilities, on the other hand, are
suggested to be the result of NiS formation.161 Studies of nickel-sulfide interactions by
Raman spectroscopy at high temperatures indicate that NiS is the prevalent species at
SOFC operating conditions.
Various H2S-tolerant materials have been studied. A Ni-GDC anode operating for
more than 500 h (at 850C and 0.2 A/cm2) on simulated coal syngas with up to 240 ppm
H2S had a degradation of 10–12.5% (measured as a decrease in power density com-
pared to the same cell without H2S).163 Cheng et al.164,165 analyzed the stability of
various perovskites—such as transition-metal carbides, borides, nitrides, and silicides—
for tolerance to sulfur in a SOFC anode environment using thermodynamic principles.
Estimation of the thermochemical data for oxides with perovskite structure provides
valuable predictions about the stability of those materials. Mukundan et al.166 tested
several perovskites and found that a Sr0.6La0.4TiO3-YSZ (50-50 wt.%) anode showed no
degradation in the presence of up to 5000 ppm of H2S in a hydrogen fuel. That same
anode was able to operate for 8 h with 1% H2S as a fuel and showed no degradation
when the fuel was switched back to hydrogen.
Although a selection of anode materials have potential as candidates when operating
with sulfur-containing fuels, other issues remain. For example, the anode must not only
tolerate sulfur contaminants while continuing to promote charge-transfer reactions, but
it must withstand other impurities that will most certainly be found in coal syngas from
coal gasification. Research in areas of material tolerance to contaminants must continue
to find effective catalysts in coal-syngas-fueled SOFCs.
5.3.2. H2S as a fuel, rather than pollutant.
Despite the observed performance drop potentially caused by the blockage of surface
reactive sites by sulfur species, the cell still has the ability to electrochemically oxidize
H2S,167–170 which demonstrates the possibility of using it as a fuel.
In a SOFC, oxide ions in the solid-oxide electrolyte can react with H2S in the anode
90

according to the charge-transfer reactions
H2S + O2− H2O +12
S2 + 2e− (Erev = 1.066 V at 800C)
H2S + 3O2− H2O + SO2 + 6e− (Erev = 0.856 V at 800C)
where the reversible Nernst potentials are calculated for a global redox reaction relative
to air, and assuming an equilibrated mixture of 98% H2S and 2% products in equal
mole amounts. Note also that the OCVs for the global redox reactions have different
dependencies on temperature; the top anodic half-cell reaction yields an OCV that in-
creases with increasing temperature, whereas the OCV associated with the lower half-cell
reaction decreases with increasing temperature. In addition to multiple oxidation path-
ways, the dominant mechanism may also involve thermal decomposition of H2S on the
anode (given by H2S H2 + (1/2)S2), as well as reactions between H2S and SO2 (e.g.,
2H2S + SO2 2H2O + (3/n)Sn). To complicate things even further, sulfur species
generated in the oxidation reactions can participate in charge transfer as well, e.g.,
S + 2O2− SO2 + 4e−
S2 + 4O2− 2SO2 + 8e−
Anode catalysts comprised of composite metal sulfides derived from mixtures of Mo
and other transition metals (e.g, Fe, Co, Ni) have been shown to be stable and effective
for conversion of H2S in SOFCs, with Co-Mo-S admixed with up to 10% Ag exhibiting su-
perior activity and longevity.169 Other reports in the literature confirm the performance
of metal sulfides as viable anode materials for carbon- and sulfur-resistant SOFCs.167
There is a general lack of knowledge regarding the oxidation mechanism for H2S, which
is certain to be catalyst-dependent. Monder et al.168 developed a hierarchy of models to
describe the performance of a single H2S-fueled SOFC button cell used previously in ex-
periments.169 The model objectives were to estimate kinetic parameters associated with
electrochemical reactions coupled with mass transfer. The models range in complexity
from an algebraic system of equations used to calculate activation, concentration, and
ohmic losses, to a physics-based two-dimensional finite-element model. However, com-
prehensive validation of the models and predicted parameters is still needed. Future work
should target detailed electrochemical studies of the electrodes to investigate the funda-91

mental reaction mechanisms, with multi-step elementary reactions including competitive
adsorption and desorption of reaction species.
92

Fig. 16.
93

6. Concluding remarks
The high fuel flexibility of solid-oxide fuel cells (SOFCs) makes it possible to use
relatively cheap, safe, and readily available hydrocarbon or coal syngas fuels, thereby
increasing the feasibility of near-term SOFC commercialization for cleaner and more effi-
cient conversion of these fuels to generate power. In the first part of this paper, the basic
operating principles and performance of SOFCs with different fuels were summarized.
Results from a wide range of studies indicate that SOFCs have unmatched potential for
replacing much dirtier, less efficient combustion systems while operating on the same raw
fuel sources. However, most of these results are reported for laboratory- or device-scale
experiments and there are still a set of challenges to overcome before single-cell exper-
iments are scaled up to large stacks and integrated with other components of a power
generation system.
Ni-yttria-stabilized zirconia (Ni-YSZ) cermets and slight variations thereof are cur-
rently the most common anode material for SOFC applications. The electrochemical
reaction mechanisms and transport processes of hydrocarbon and syngas fuels within
Ni-YSZ anodes is extremely complex, especially when additional consideration must be
given to complications of carbon deposition and sulfur poisoning. In the second part of
this paper, we have summarized several possible reaction mechanisms appearing in the
literature for the electrochemical oxidation of H2, CO, CH4, and solid carbon, as well
as other hydrocarbons. Even for the simplest and most studied fuel H2, there is still
not a clear and concise conclusion on the oxidation mechanism, charge-transfer, or rate-
determining kinetics, especially under different operating conditions. For all the fuels
considered in this paper, more carefully designed experimental studies and elementary
reaction models are needed to elucidate the reaction mechanisms and kinetic parameters
(at different operating conditions and on different relevant catalysts). It is important
to distinguish between the different reaction pathways (especially for hydrocarbon fuels)
because the demands on the anode material differ significantly for these pathways.
A significant concern during SOFC operation with hydrocarbon or syngas fuels is
the formation of solid carbon through undesired side reactions. The mechanisms for
solid carbon deposition are not yet known, but they will almost certainly depend on the
material and the operating conditions in the cell. Although carbon formation on Ni can94

be suppressed or avoided with changes in operating conditions (e.g., temperatures, and
most notably, steam content in the fuel stream), novel anode materials or additives must
be developed to extend the range of applicability of SOFCs beyond hydrogen-containing
fuels (e.g., dry-gasified solid carbon or pure CO). For instance, Cu-based, ceria-based,
metal alloys, and perovskite materials have been shown to at least have some potential.
These novel anode materials must not only be effective electrocatalysts without being
susceptible to coking, but they must also tolerate pollutants in the fuel stream that could
diminish SOFC performance. The existence of H2S in the fuel gas can decrease anode
electrochemical activity due to contamination of reactions sites by sulfur adsorption on
the Ni catalyst surface. The effects of sulfur in the fuel (some positive, most negative)
were also reviewed in this paper.
Electro- and thermochemistry are discussed in the context of SOFC-MEA modeling.
The missing piece to a fairly complete model is a representation of the mass transport
within the SOFC flow channel and porous electrodes. As a whole SOFC modeling is
a complex and crucial component of fuel cell development. The interdependence of
heterogeneous chemistry, charge-transfer processes, and transport determine the rate
and ability of the cell to deliver current to an external load. This interdependence
coupled with physical access limitations means it is difficult to study these processes
experimentally (except with well-thought-out setups such as pattern-anode experiments),
so mathematical and physical models are absolutely important to study each process and
its connection to the others. Understanding the rate-limiting processes and exploring the
impact of electrode microstructure on fuel cell performance are critical for optimization,
and essential to move SOFC technology to the forefront of cleaner and more efficient
power generation for near- and long-term solutions.
Appendix A
Discussion of current-dependent overpotentialsConcentration overpotential.
For open-circuit conditions (i.e., no current flow), the species concentrations at the elec-trode/electrolyte interface—otherwise known as the triple- or three-phase boundary (TPB)—arethe same as those at the channel/electrode interface. Denoting the partial pressure of species kin the channels as pk, the Nernst potential Erev can be written in the form:
Erev = E +RT
neF
KgXk=1
`νk,a − ν′k,a + νk,c − ν′k,c
´ln
„pkpatm
«(A-1)
95

where νk,a and νk,c are the stoichiometric coefficients for the anode-side (fuel) and cathode-side(oxidizer) channel reactants, and ν′k,a and ν′k,c the stoichiometric coefficients of the kth productspecies in the fuel and oxidizer channels, respectively. The number of gaseous species is Kg. Theremaining variables are E the ideal Nernst potential at standard conditions (patm = 1 atm), Tthe temperature in K,R = 8.314 J/mol/K the universal gas constant, and F = 96485.34 C/mol isFaraday’s constant. The ideal Nernst potential E = −∆G/neF , where ∆G is the standard-state change in Gibbs free energy associated with the global oxidation reaction. The molarspecies concentrations [Xk] are related to the partial pressures through the ideal gas equationof state, [Xk] = pk/RT .
When there is nonzero net current, there must be concentration gradients across the electrodestructures. This is because gaseous reactant species must be transported from the channelthrough the porous electrodes to reactive sites where they are consumed, and similarly, productspecies must be removed. Diffusion processes are the primary transport mechanism to supply thespecies fluxes and are driven by concentration gradients within the electrodes. Consequently,the molar species concentrations at the TPB [Xk]∗ = p∗k/RT are different from the channelconcentrations (i.e., the concentrations of reactant species are higher in the channel, whileproduct species concentrations are higher at the TPB). The Nernst potential E∗rev evaluated atthe TPB follows as
E∗rev = E +RT
neF
KgXk=1
`νk,a − ν′k,a + νk,c − ν′k,c
´ln
„p∗kpatm
«. (A-2)
In terms of species concentrations, the potential difference associated with the concentrationvariation is the concentration overpotential ηconc:
ηconc =Erev − E∗rev
=RT
neF
KgXk=1
`νk,a − ν′k,a + νk,c − ν′k,c
´ln
„[Xk]
[Xk]∗
«. (A-3)
The concentration overpotentials for the anode and cathode may be written independently as
ηconc,a =RT
neF
KgXk=1
`νk,a − ν′k,a
´ln
„[Xk]
[Xk]∗
«, (A-4)
ηconc,c =RT
neF
KgXk=1
`νk,c − ν′k,c
´ln
„[Xk]
[Xk]∗
«. (A-5)
Determining the concentrations at the triple-phase boundary. To compute the concentrationoverpotentials, the concentrations of gas species at the TPB is required. For reactive flow in theporous electrodes, the gas-phase species concentrations must satisfy
∂[Xk]
∂t= Ass
∼gas,k + sgas,k −∇ · Jk, k = 1, 2, ...,Kg (A-6)
where Jk is the net molar flux vector (units of mol/m2/s) of species k, As the active catalystarea per unit electrode volume (per m), s∼gas,k the production rate of gas species k due toheterogeneous chemistry (mol/m2/s), and sgas,k the production rate of gas species k due tohomogeneous gas-phase chemistry (mol/m3/s).
The net production rates are in general given by
sk =Xi
νkiqi, (A-7)
96

where qi is the rate of reaction i and νki is the net stoichiometric coefficient of species k inreaction i (taken to be positive for products and negative for reactants). The reaction ratesare computed from mass-action kinetics,58 with temperature-dependent rate coefficients in Ar-rhenius form ki = AiT
ni exp(−Ei/RT ).48 To compute the net production rates, a multistepreaction mechanism is needed. For example, the reactions of methane on nickel-based catalystshave been extensively studied in the literature, resulting in a reaction mechanism (see Table 8)consisting of 42 irreversible reactions among 6 gas-phase and 12 adsorbed species.40,41 Themultistep heterogeneous chemistry describing the reforming of methane on nickel can be usedto calculate s∼gas,k for each species k. This mechanism has been adopted in whole or in partin many SOFC models.42–44,48,49,56 Likewise, a mechanism describing homogeneous gas-phasethermochemistry can be included to compute sgas,k. Important thermochemical reactions (e.g.,reforming, water-gas shift, POx) are discussed in earlier sections of this paper.
The species molar fluxes Jk are evaluated with a transport model59 (e.g., Fick’s laws of dif-fusion, dusty-gas formulations,60 Stefan-Maxwell diffusion). Species transport in fuel cells hasalso been modeled using lattice-Boltzmann models61–63 and Monte-Carlo-type simulations topredict species diffusivities.19 Fuel cell models must accurately represent the major physical pro-cesses that affect transport in porous media, including molecular diffusion, Knudsen diffusion,surface diffusion, and viscous Darcy flow. The most comprehensive transport model is arguablythe dusty-gas model (DGM),60 which is a multicomponent transport model derived from kinetictheory. It is applicable over a full range of Knudsen numbers, from values much larger than1 (molecule-wall collisions dominate, and Knudsen diffusion is the controlling mechanism), tovalues much less than 1 (molecule-molecule collisions dominate, and bulk diffusion is control-ling).48 The DGM can be written as an implicit relationship among the molar concentrations[Xk], molar fluxes Jk, concentration gradient, and pressure gradient asX
` 6=k
[X`]Jk − [Xk]J`[XT ]De
k`
+Jk
Dek,Kn
= −∇[Xk]− [Xk]
Dek,Kn
B
µ∇p, (A-8)
for k = 1, 2, ...,Kg. Here, [XT ] = p/RT is the total molar concentration, B is the permeabilityof the porous electrode, µ the mixture viscosity, and De
k` and Dek,Kn the effective ordinary and
Knudsen diffusion coefficients, respectively. Because Knudsen diffusion is governed by molecule-wall collisions, it is highly dependent on the porous electrode microstructure, including porosityφ, tortuosity τ , and average pore radius rp. The effective diffusivities can be evaluated as
Dek` =
φ
τDk`, De
k,Kn =2
3rpφ
τ
r8RT
πWk, (A-9)
where Wk is the molecular weight of species k. The ordinary multicomponent binary diffusioncoefficients Dk` and mixture viscosity µ are determined from kinetic theory.58 Alternatively,software packages such as Cantera64 can be used to easily compute these.
One deficiency of the DGM is the exclusion of surface diffusion. While surface diffusion isneglected in some models because it is assumed that surface species are effectively immobile onlength scales larger than an individual particle,48,49 experiments by Williford et al.73,88 indicatethat species adsorption and surface diffusion limitations near the TPB may be the dominantphenomena giving rise to the concentration polarization. Surface diffusion has been includedby some,57 but its importance is still not entirely known, especially for the various speciesthat may participate in charge-transfer reactions. A more recent analysis by Janardhanan andDeutschmann171 shows that surface diffusion does not lead to concentration losses in solid oxidefuel cells, but the authors suggest that current-limiting behavior resulting from concentrationgradients may originate from the back diffusion of product species at the channel/electrodeinterface. This effect will only be important for low flow velocities in the channels, giving riseto species diffusion velocities on the same order as the mean flow velocity.
97

Ohmic overpotential.The three fundamental overpotentials appearing in Eq. 8 describing sources of voltage loss
in a fuel cell are the activation overpotentials ηact,i (due to losses associated with charge-transferkinetics), concentration overpotentials ηconc,i (due to losses associated with mass-transport lim-itations), and the ohmic overpotential ηohm (due to ion- and electron-transport resistances). Asin previous sections, the subscript i is used to indicate each electrode (“a” for anode and “c” forcathode). The activation overpotentials are introduced and discussed in the ensuing sections.The concentration overpotentials and their dependence on mass transport were discussed in theforegoing sections. For the purposes of completeness, it is certainly worthwhile to briefly discusslosses associated with transport of charged species.
The ohmic overpotential ηohm, due primarily to resistance of ion and electron transport, canbe represented as48
ηohm = Φe,a − Φe,c = iRtot (A-10)
where Rtot = Rel +Red is the total area-specific cell resistance, including the solid electrolyte Rel
and area-specific resistances in the electrodes Red. The overpotential is also written in termsof the potential difference across the electrolyte Φe,a − Φe,c. In composite cermet electrodes(e.g., Ni-YSZ anodes), the electrode resistance Red is usually negligible because of sufficientconduction paths for both ions and electrons. However, in ceramic electrodes such as an LSMcathode, the electrode ohmic resistance can be important.48 The most significant contributionto the total cell resistance is due to the electrolyte Rel, which can be determined from the ionicconductivity of the electrolyte σel as Rel = Lel/σel, where Lel is the electrolyte thickness.48 Theionic conductivity of the electrolyte is expressed as48,172
σel = σ0Tm exp
„−Eel
RT
«. (A-11)
In this Arrhenius-type expression, σ0 is the pre-factor, m is a dimensionless exponent (generallyless than zero), and Eel is the activation energy of O2− transport in the electrolyte. Notethat Rtot, Rel, and Red are not related to the charge-transfer resistance Rct; the former areassociated with the ohmic resistance to transport of charge carriers (i.e., ions and electrons),while the latter is a resistance describing the kinetics of charge-transfer chemistry.
A charge-transfer resistance Rct can be derived from the Butler-Volmer equation by takingthe partial derivative of the current density i with respect to the activation overpotential,47
R−1ct = ATPB
„∂i
∂ηact,i
«[Xk],T
= i0ATPBF
RT
"βa exp
βaFηact,i
RT
!
+βc exp
− βc
Fηact,i
RT
!#. (A-12)
In this equation ATPB is area of the TPB at which charge transfer occurs. At zero activationoverpotential, one obtains a relationship between the exchange current density and charge-transfer resistance
Rct =RT
i0ATPBF, (A-13)
where βa + βc = 1 has been used. The charge-transfer resistance can be determined fromelectrochemical impedance spectroscopy (EIS) measurements.173,174
98

Fig. 1. The basic operating principles in a SOFC membrane-electrode-assembly (MEA). In theleft bubble, oxygen molecules are reduced at the cathode and the oxygen ions are conductedthrough the electrolyte. The oxygen ions move through the electrolyte into the anode (rightbubble), where they are used for electrochemical oxidation of fuel at the three-phase boundary(TPB). Electrons released in the charge-transfer reactions are conducted through the anode(metal), to the external circuit.
Fig. 2. Reversible cell potentials Erev (or open-circuit voltages OCV) and thermodynamicefficiencies εrev (insets) for different fuels over a range of temperatures at pressures of 1 atm(thick lines) and 10 atm (thin lines). The fuel streams are equilibrated mixtures of the in-dicated ratios for fuel and oxidation products—as the fuel becomes more diluted, think ofthis as being representative of moving along the flow channel. The OCV is calculated as-suming air as the oxidant. The reversible efficiency is calculated from εrev = ∆rG/∆rH =|νO2 |(RT/∆H) ln(pO2,a/pO2,c) = −neFErev/∆H
, where ∆H is the temperature-dependentstandard-state enthalpy change associated with the global oxidation reaction. For ease of com-parison, all plots use the same horizontal and vertical scaling (the insets do not). The top leftpanel is for H2 electrochemical oxidation, top right for CO electrochemical oxidation, bottomleft for electrochemical oxidation of CH4, and bottom right for electrochemical oxidation ofsolid graphitic carbon C(gr). For methane oxidation, the straight lines give the OCV calculatedassuming full oxidation of methane to CO2 and H2O (pressure independent), and the curvesgive the OCV from a full equilibrium calculation using the GRI30 mechanism in Cantera.64
Reversible efficiencies are calculated based only on the full oxidation of methane. For carbonoxidation, the two straight lines assume oxidation to CO only (positive slope) or CO2 only(slight negative slope and independent of pressure) over the entire temperature range, whereasthe curved line accounts for the thermodynamically favored oxidation product (which shifts fromCO2 at lower temperatures, to CO at higher temperatures).
Fig. 3. Dependence of cell voltage, overpotentials, and power density on current density. Eachof the overpotential curves is illustrated in a cumulative fashion, meaning that overpotential isadded to the sum of overpotentials appearing below it. The curves are calculated using a one-dimensional MEA model described in Ref. 48 with modified transport parameters and constantleakage overpotential ηleak = 0.0618 V from Ref. 49. The physical parameters describing thestructure of the anode-supported MEA are described in the aforementioned references and basedon button-cell experiments from Ref. 33. The anode is a porous Ni-YSZ cermet that is 1.22 cmthick; the electrolyte is dense YSZ that is 25 µm thick; and the cathode is a 30 µm thick porousLSM structure. A modified Butler-Volmer formulation is used based on an assumption thatH(Ni) + OH−(YSZ) (Ni) + H2O(YSZ) + e−(Ni) is the rate-limiting charge-transfer step.
Fig. 4. Comparison of measured (symbols) and computed (solid lines) MEA performanceoperating on different H2-H2O mixtures at 800C and 1 atm. In each panel, the symbols areexperimental measurements of button-cell performance by Jiang and Virkar33 using a Ni-YSZporous anode. Symbols are connected for clarity. The solid lines are computed performanceof the same button cell using a rate-limiting switchover model as described in Lee et al.49
The left panel is for H2 concentrations less than or equal to 50%, and the right panel for H2
concentrations greater than 50%.
99

Fig. 5. Model for the catalytic effect of the addition of water in the fuel gas atmosphere on theperformance of SOFC anodes. The small arrows indicate the migration of the electrons. Fordetailed explanations refer to the text. Picture and description from Ref. 84.
Fig. 6. Electrochemical model for the Ni-H2-H2O/YSZ system under SOFC operating con-ditions. The numbers in the figure correspond to reactions given in the text. Picture anddescription from Ref. 79.
Fig. 7. Elementary kinetic scenarios at a Ni-YSZ TPB. Each charge-transfer reaction is areversible reaction taking up or releasing charge to the valence band of the Ni electrode. (a)Spillover of hydrogen from the Ni surface onto an oxygen ion or hydroxyl ion on the YSZ surface.(b) Charge-transfer reactions with and without spillover of oxygen ions from the YSZ surfaceto the Ni surface. (c) Hydroxyl spillover from the YSZ surface to the Ni surface. (d) Chargetransfer by an interstitial proton. (e) Charge-transfer and chemical reactions on the electrolytesurface only. The “walls” in panels (d) and (e) indicate potential segregated impurities. Graphicand description from Ref. 85.
Fig. 8. Comparison of Tafel slopes for double hydrogen spillover at different model assumptions:(A) full reaction-diffusion model, (B) full reaction-diffusion model without H2O dissociation onYSZ, and (C) fully spreaded charge-transfer model. The numbers indicate the transfer coefficientβ of the apparent Tafel slope βF/RT (see Eq. 26). Figure and description reproduced fromRef. 85, though the slopes in that reference are incorrectly labeled βRT/F .
Fig. 9 Comparison between the H2 charge-transfer mechanisms in Table 3 and the Mizusaki77
measurements in the form of Tafel plots. The left pair of plots show results using the oxygen-spillover model (reactions OS1 and OS2). The center pair of plots show results using the single-channel hydrogen-spillover model (reactions HS1 and HS2). This model is an improvement onthe fixed-β model. The right pair of plots show results using the dual-channel hydrogen-spillovermodel (reactions HD1, HD2, and HD3). The physical basis for such a possibility is that reactionswith the same reactants and products may occur on different types of surface sites (e.g., stepsor ledges), resulting in different rates. In all cases, the upper panel is for fixed pH2O and varyingpH2 . The lower panel is for fixed pH2 and varying pH2O. The system is isothermal at 700C and1 atm. The reaction A parameters are adjusted to achieve a best fit to the data. Figures andcaption adapted from Goodwin et al.43
Fig. 10. Comparison between the CO charge-transfer mechanisms in Table 6 and the Lauvs-tad98 measurements in the form of Tafel plots. The left pair of plots show results using theoxygen-spillover model described by reactions O1 and O2. The center pair of plots show resultsusing a different oxygen-spillover model (reactions O3 and O4). The right pair of plots showresults using the global oxygen-spillover reaction O5. All cases are for fixed pCO2 and varyingpCO. The system is isothermal at 876C and 1 atm (mixtures are balanced with Ar). Thereaction A parameters are adjusted to achieve a best fit to the data. Figures reproduced fromYurkiv et al.46
100

Fig. 11. Schematic illustration of the reaction mechanism and the three different charge-transferpathways taking place at the three-phase boundary of Ni, YSZ, and gas phase. The reactionsO1–O5 appear in Table 6. Picture and caption from Ref. 46.
Fig. 12. Illustration of periodically changing CO oxidation rates, initiated by carbon depositioncombined with reconstruction of the electrode surface. From Ref. 101.
Fig. 13. SOFC performance operating on H2-CO mixtures. The left panel is a reproduction ofexperimental measurements by Jiang and Virkar33 using a Ni-YSZ porous anode at 800C and1 atm. The right panel is a reproduction of experimental measurements by Sukeshini et al.90
using a nickel-pattern anode on YSZ at 850C and 1 atm. Points are connected for clarity.
Fig. 14. Anode reaction mechanism of a rechargeable direct carbon fuel cell (RDCFC). TPBindicates the three-phase boundary. Picture and description from Ref. 118.
Fig. 15. Plot of the reaction enthalpies (top panel, thick lines), entropies (top panel, thinlines), and Gibbs free energy change (bottom panel) for the reforming reactions and water-gasshift (WGS) as a function of temperature.
Fig. 16. Image sequence of a growing carbon nanofiber from methane decomposition over sup-ported nickel nanocrystals. Panels a–h illustrate the elongation/contraction process. Drawingsare included to guide the eye in locating the positions of mono-atomic Ni step edges at the C/Niinterface. The images are acquired in situ with CH4:H2=1:1 at a total pressure of 2.1 mbar withthe sample heated to 536C. All images are obtained with a rate of 2 frames per second. Scalebar (seen in panel a), 5 nm. Image and description from Ref. 126.
101

References
[1] Singhal, S.C., Kendall, K.. High Temperature Solid Oxide Fuel Cells: Fundamentals, Designand Applications. Elsevier: Oxford, UK; 2003.
[2] Minh, N.Q.. Solid oxide fuel cell technology—features and applications. Solid State Ionics2004;174:271–277.
[3] Larminie, J., Dicks, A.. Fuel Cell Systems Explained. John Wiley & Sons: Chichester, England;2000.
[4] Bove, R., Ubertini, S., editors. Modeling Solid Oxide Fuel Cells: Methods, Procedures andTechniques. Springer; 2008.
[5] Kee, R.J., Zhu, H., Sukeshini, A.M., Jackson, G.S.. Solid oxide fuel cells: Operating principles,current challenges, and the role of syngas. Combust Sci Technol 2008;180:1207–1244.
[6] Kee, R.J., Zhu, H., Goodwin, D.G.. Solid-oxide fuel cells with hydrocarbon fuels. Proc CombustInst 2005;30:2379–2404.
[7] Gross, M.D., Vohs, J.M., Gorte, R.J.. Recent progress in SOFC anodes for direct utilization ofhydrocarbons. J Mater Chem 2007;17:3071–3077.
[8] Williams, M.C., Strakey, J.P., Surdoval, W.A., Wilson, L.C.. Solid oxide fuel cell technologydevelopment in the US. Solid State Ionics 2006;177:2039–2044.
[9] Goodenough, J.B.. Ceramic technology: Oxide-ion conductors by design. Nature 2000;404:821–823.
[10] Yamamoto, O.. Solid oxide fuel cells: Fundamental aspects and prospects. Electrochim Acta2000;45:2423–2435.
[11] Brandon, N.P., Skinner, S., Steele, B.C.H.. Recent advances in materials for fuel cells. AnnuRev Mater Res 2003;33:183–213.
[12] Fleig, J.. Solid oxide fuel cell cathodes: Polarization mechanisms and modeling of the electro-chemical performance. Annu Rev Mater Res 2003;33:361–382.
[13] Fergus, J.W.. Oxide anode materials for solid oxide fuel cells. Solid State Ionics 2006;177:1529–1541.
[14] Jiang, S.P., Chan, S.H.. A review of anode materials development in solid oxide fuel cells. JMater Sci 2004;39:4405–4439.
[15] Tsipis, E.V., Kharton, V.V.. Electrode materials and reaction mechanisms in solid oxide fuel cells:A brief review. I. Performance-determining factors. J Solid State Electrochem 2008;12:1039–1060.
[16] Zhu, W.Z., Deevi, S.C.. A review on the status of anode materials for solid oxide fuel cells. MaterSci Eng, A 2003;362:228–239.
[17] EG&G Technical Services, Inc., . Fuel Cell Handbook. USDOE-NETL: Morgan-town, WV, USA; 7 ed.; 2004. Under contract no. DE-AM26-99FT40575. Online athttp://www.netl.doe.gov/technologies/coalpower/fuelcells/seca/pubs/FCHandbook7.pdf.
[18] McIntosh, S., Gorte, R.J.. Direct hydrocarbon solid oxide fuel cells. Chem Rev 2004;104:4845–4865.
[19] Hanna, J.. Solid-oxide fuel cell electrode microstructures: Making sense of the internal frameworkaffecting gas transport. Ph.D. thesis; California Institute of Technology, Pasadena, CA, USA;2010.
[20] Shi, Y., Cai, N., Li, C., Bao, C., Croiset, E., Qian, J., et al. Modeling of an anode-supportedNi-YSZ/Ni-ScSZ/ScSZ/LSM-ScSZ multiple layers SOFC cell. Part I: Experiments, model devel-opment and validation. J Power Sources 2007;172:235–245.
[21] Shi, Y., Cai, N., Li, C., Bao, C., Croiset, E., Qian, J., et al. Modeling of an anode-supportedNi-YSZ/Ni-ScSZ/ScSZ/LSM-ScSZ multiple layers SOFC cell. Part II: Simulations and discussion.J Power Sources 2007;172:246–252.
[22] Lefebvre-Joud, F., Gauthier, G., Mougin, J.. Current status of proton-conducting solid oxidefuel cells development. J Appl Electrochem 2009;39:535–543.
[23] Mogensen, M., Sammes, N.M., Tompsett, G.A.. Physical, chemical and electrochemical proper-ties of pure and doped ceria. Solid State Ionics 2000;129:63–94.
[24] Steele, B.C.H.. Appraisal of Ce1−yGdyO2−y/2 electrolytes for IT-SOFC operation at 500C.Solid State Ionics 2000;129:95–110.
[25] Lu, C., Worrell, W.L., Gorte, R.J., Vohs, J.M.. SOFCs for direct oxidation of hydrocarbonfuels with samaria-doped ceria electrolyte. J Electrochem Soc 2003;150:A354–A358.
[26] Zhan, Z., Barnett, S.A.. Operation of ceria-electrolyte solid oxide fuel cells on iso-octane-air fuelmixtures. J Power Sources 2006;157:422–429.
102

[27] Jia, L., Tian, Y., Liu, Q., Xia, C., Yu, J., Wang, Z., et al. A direct carbon fuel cell with(molten carbonate)/(doped ceria) composite electrolyte. J Power Sources 2010;195:5581–5586.
[28] Murray, E.P., Tsai, T., Barnett, S.A.. A direct-methane fuel cell with a ceria-based anode.Nature 1999;400:649–651.
[29] Putna, E.S., Stubenrauch, J., Vohs, J.M., et al., . Ceria-based anodes for the direct oxidationof methane in solid oxide fuel cells. Langmuir 1995;11:4832–4837.
[30] Atkinson, A., Barnett, S., Gorte, R.J., Irvine, J.T.S., McEvoy, A.J., Mogensen, M., et al.Advanced anodes for high-temperature fuel cells. Nat Mater 2004;3:17–27.
[31] Mogensen, M., Kammer, K.. Conversion of hydrocarbons in solid oxide fuel cells. Annu RevMater Res 2003;33:321–331.
[32] Yang, L., Choi, Y., Qin, W., Chen, H., Blinn, K., Liu, M., et al. Promotion of water-mediatedcarbon removal by nanostructured barium oxide/nickel interfaces in solid oxide fuel cells. NatCommun 2011;2:357.
[33] Jiang, Y., Virkar, A.V.. Fuel composition and diluent effects on gas transport and performanceof anode-supported SOFCs. J Electrochem Soc 2003;150:A942–A951.
[34] Liu, J., Barnett, S.A.. Operation of anode-supported solid oxide fuel cells on methane andnatural gas. Solid State Ionics 2003;158:11–16.
[35] Lin, Y., Zhan, Z., Liu, J., Barnett, S.A.. Direct operation of solid oxide fuel cells with methanefuel. Solid State Ionics 2005;176:1827–1835.
[36] Shao, Z., Mederos, J., Chueh, W.C., Haile, S.M.. High power-density single-chamber fuel cellsoperated on methane. J Power Sources 2006;162:589–596.
[37] Hibino, T., Hashimoto, A., Yano, M., Suzuki, M., Sano, M.. Ru-Catalyzed anode materialsfor direct hydrocarbon SOFCs. Electrochim Acta 2003;48:2531–2537.
[38] Park, S., Vohs, J.M., Gorte, R.J.. Direct oxidation of hydrocarbons in a solid-oxide fuel cell.Nature 2000;404:265–267.
[39] Zhan, Z., Barnett, S.A.. An octane-fueled solid oxide fuel cell. Science 2005;308:844–847.[40] Hecht, E.S., Gupta, G.K., Zhu, H., Dean, A.M., Kee, R.J., Maier, L., et al. Methane reforming
kinetics within a Ni-YSZ SOFC anode support. Appl Catal, A 2005;295:40–51.[41] Janardhanan, V.M., Deutschmann, O.. CFD Analysis of a solid oxide fuel cell with internal re-
forming: Coupled interactions of transport, heterogeneous catalysis and electrochemical processes.J Power Sources 2006;162:1192–1202.
[42] Goodwin, D.G.. A patterned anode model with detailed chemistry. In: Singhal, S.C., Mizusaki,J., editors. Solid Oxide Fuel Cells IX. Electrochemical Society: Pennington, NJ; 2005, p. 699–707.9th Int. Symp. on Solid Oxide Fuel Cells (SOFC-IX), Quebec, Canada.
[43] Goodwin, D.G., Zhu, H., Colclasure, A.M., Kee, R.J.. Modeling electrochemical oxidation ofhydrogen on Ni-YSZ pattern anodes. J Electrochem Soc 2009;156:B1004–B1021.
[44] DeCaluwe, S.C., Zhu, H., Kee, R.J., Jackson, G.S.. Importance of anode microstructure inmodeling solid oxide fuel cells. J Electrochem Soc 2008;155:B538–B546.
[45] Bessler, W.G., Gewies, S., Vogler, M.. A new framework for physically based modeling of solidoxide fuel cells. Electrochim Acta 2007;53:1782–1800.
[46] Yurkiv, V., Starukhin, D., Volpp, H.R., Bessler, W.G.. Elementary reaction kinetics of theCO/CO2/Ni/YSZ electrode. J Electrochem Soc 2011;158:B5–B10.
[47] Zhu, H., Kee, R.J.. A general mathematical model for analyzing the performance of fuel-cellmembrane-electrode assemblies. J Power Sources 2003;117:61–74.
[48] Zhu, H., Kee, R.J., Janardhanan, V.M., Deutschmann, O., Goodwin, D.G.. Modelingelementary heterogeneous chemistry and electrochemistry in solid-oxide fuel cells. J ElectrochemSoc 2005;152:A2427–A2440.
[49] Lee, W.Y., Wee, D., Ghoniem, A.F.. An improved one-dimensional membrane-electrode assemblymodel to predict the performance of solid oxide fuel cell including the limiting current density. JPower Sources 2009;186:417–427.
[50] Chinda, P., Chanchaona, S., Brault, P., Wechsatol, W.. Mathematical modeling of a solidoxide fuel cell with nearly spherical-shaped electrode particles. J Sustainable Energy & Environ2010;1:185–196.
[51] Kee, R.J., Zhu, H., Goodwin, D.G.. Modeling electrochemistry and solid-oxide fuel cells: I.Basic principles. J Combust Soc Japan 2005;47:192–204.
[52] Kim, J.W., Virkar, A.V., Fung, K.Z., Mehta, K., Singhal, S.C.. Polarization effects inintermediate temperature, anode-supported solid oxide fuel cells. J Electrochem Soc 1999;146:69–78.
[53] Zhao, F., Virkar, A.V.. Dependence of polarization in anode-supported solid oxide fuel cells on
103

various cell parameters. J Power Sources 2005;141:79–95.[54] Shi, Y., Li, C., Cai, N.. Experimental characterization and mechanistic modeling of carbon
monoxide fueled solid oxide fuel cell. J Power Sources 2011;196:5526–5537.[55] Bard, A.J., Faulkner, L.R.. Electrochemical Methods: Fundamentals and Applications. John
Wiley & Sons: New York; 2 ed.; 2000.[56] Lee, W.Y.. Modeling of solid oxide fuel cells. Master’s thesis; Massachusetts Institute of Tech-
nology, Cambridge, MA, USA; 2006.[57] Shi, Y., Cai, N., Li, C.. Numerical modeling of an anode-supported SOFC button cell considering
anodic surface diffusion. J Power Sources 2007;164:639–648.[58] Kee, R.J., Coltrin, M.E., Glarborg, P.. Chemically Reacting Flow: Theory and Practice. John
Wiley & Sons: Hoboken, NJ, USA; 2003.[59] Suwanwarangkul, R., Croiset, E., Fowler, M.W., Douglas, P.L., Entchev, E., Douglas, M.A..
Performance comparison of Fick’s, dusty-gas and Stefan-Maxwell models to predict the concen-tration overpotential of a SOFC anode. J Power Sources 2003;122:9–18.
[60] Mason, E.A., Malinauskas, A.P.. Gas Transport in Porous Media: The Dusty-Gas Model.Elsevier: New York; 1983.
[61] Chiu, W.K.S., Joshi, A.S., Grew, K.N.. Lattice Boltzmann model for multi-component masstransfer in a solid oxide fuel cell anode with heterogeneous internal reformation and electrochem-istry. Eur Phys J Special Topics 2009;171:159–165.
[62] Joshi, A.S., Peracchio, A.A., Grew, K.N., Chiu, W.K.S.. Lattice Boltzmann method forcontinuum, multi-component mass diffusion in complex 2d geometries. J Phys D: Appl Phys2007;40:2961–2971.
[63] Joshi, A.S., Peracchio, A.A., Grew, K.N., Chiu, W.K.S.. Lattice Boltzmann method formulti-component, non-continuum mass diffusion. J Phys D: Appl Phys 2007;40:7593–7600.
[64] Goodwin, D.G.. Cantera. 2001–2005. Http://code.google.com/p/cantera/.[65] Iwai, H., Shikazono, N., Matsui, T., Teshima, H., Kishimoto, M., Kishida, R., et al. Quantifi-
cation of SOFC anode microstructure based on dual beam FIB-SEM technique. J Power Sources2010;195:955–961.
[66] J. R. Izzo, J., Joshi, A.S., Grew, K.N., Chiu, W.K.S., Tkachuk, A., Wang, S.H., et al.Nondestructive reconstruction and analysis of SOFC anodes using x-ray computed tomography atsub-50 nm resolution. J Electrochem Soc 2008;155:B504–B508.
[67] Ruger, B., Joos, J., Weber, A., Carraro, T., Ivers-Tiffee, E.. 3D Electrode microstructurereconstruction and modelling. ECS Trans 2009;25:1211–1220.
[68] Wilson, J.R., Gameiro, M., Mischaikow, K., Kalies, W., Voorhees, P.W., Barnett, S.A.. Three-dimensional analysis of solid oxide fuel cell Ni-YSZ anode interconnectivity. Microsc Microanal2009;15:71–77.
[69] Wilson, J.R., Barnett, S.A.. Solid oxide fuel cell Ni-YSZ anodes: Effect of composition onmicrostructure and performance. Electrochem Solid-State Lett 2008;11:B181–B185.
[70] Wilson, J.R., Kobsiriphat, W., Mendoza, R., Chen, H.Y., Hiller, J.M., Miller, D.J., et al.Three-dimensional reconstruction of a solid-oxide fuel-cell anode. Nat Mater 2006;5:541–544.
[71] Bockris, J.O., Reddy, A.K.N., Gamboa-Aldeco, M.. Modern Electrochemistry 2A: Fundamentalsof Electrodics. Kluwer Academic/Plenum Publishers: New York; 2 ed.; 2000.
[72] Sun, C., Stimming, U.. Recent anode advances in solid oxide fuel cells. J Power Sources2007;171:247–260.
[73] Williford, R.E., Chick, L.A., Maupin, G.D., Simner, S.P., Stevenson, J.W.. Diffusion limitationsin the porous anodes of SOFCs. J Electrochem Soc 2003;150:A1067–A1072.
[74] Holtappels, P., de Haart, L.G.J., Stimming, U.. Reaction of hydrogen/water mixtures on nickel-zirconia cermet electrodes: I. DC Polarization characteristics. J Electrochem Soc 1999;146:1620–1625.
[75] Jiang, S.P., Badwal, S.P.S.. An electrode kinetics study of H2 oxidation on Ni/Y2O3-ZrO2
cermet electrode of the solid oxide fuel cell. Solid State Ionics 1999;123:209–224.[76] de Boer, B.. SOFC Anode: Hydrogen oxidation at porous nickel and nickel/yttria-stabilised
zirconia cermet electrodes. Ph.D. thesis; University of Twente, Netherlands; 1998.[77] Mizusaki, J., Tagawa, H., Saito, T., Kamitani, K., Yamamura, T., Hirano, K., et al. Preparation
of nickel pattern electrodes on YSZ and their electrochemical properties in H2-H2O atmospheres.J Electrochem Soc 1994;141:2129–2134.
[78] Bieberle, A.. The electrochemistry of solid oxide fuel cell anodes: Experiments, modeling, andsimulation. Ph.D. thesis; Swiss Federal Institute of Technology, Zurich, Switzerland; 2000.
[79] Bieberle, A., Gauckler, L.J.. State-space modeling of the anodic SOFC system Ni, H2-H2O/YSZ.
104

Solid State Ionics 2002;146:23–41.[80] Bessler, W.G., Warnatz, J., Goodwin, D.G.. The influence of equilibrium potential on the
hydrogen oxidation kinetics of SOFC anodes. Solid State Ionics 2007;177:3371–3383.[81] Mogensen, M., Lindegaard, T.. The kinetics of hydrogen oxidation on a Ni/YSZ SOFC electrode
at 1000C. In: Singhal, S.C., Iwahara, H., editors. Solid Oxide Fuel Cells III. ElectrochemicalSociety: Pennington, NJ; 1993, p. 484–493. 3rd Int. Symp. on Solid Oxide Fuel Cells (SOFC-III),Honolulu, HI, USA.
[82] Mogensen, M., Sunde, S., Primdahl, S.. SOFC anode kinetics. 1996, p. 77–100. Proc. of the17th Risø Int. Symp. on Mater. Sci.: High Temp. Electrochem.: Ceramics and Metals, Roskilde,Denmark.
[83] Jiang, S.P., Badwal, S.P.S.. Hydrogen oxidation at the nickel and platinum electrodes on yttria-tetragonal zirconia electrolyte. J Electrochem Soc 1997;144:3777–3784.
[84] Bieberle, A., Meier, L.P., Gauckler, L.J.. The electrochemistry of Ni pattern anodes used assolid oxide fuel cell model electrodes. J Electrochem Soc 2001;148:A646–A656.
[85] Vogler, M., Bieberle-Hutter, A., Gauckler, L., Warnatz, J., Bessler, W.G.. Modelling studyof surface reactions, diffusion, and spillover at a Ni/YSZ patterned anode. J Electrochem Soc2009;156:B663–B672.
[86] Gewies, S., Bessler, W.G.. Physically based impedance modeling of Ni/YSZ cermet anodes. JElectrochem Soc 2008;155:B937–B952.
[87] Ihara, M., Kusano, T., Yokoyama, C.. Competitive adsorption reaction mechanism ofNi/yttria-stabilized zirconia cermet anodes in H2-H2O solid oxide fuel cells. J Electrochem Soc2001;148:A209–A219.
[88] Williford, R.E., Chick, L.A.. Surface diffusion and concentration polarization on oxide-supportedmetal electrocatalyst particles. Surf Sci 2003;547:421–437.
[89] Habibzadeh, B.. Understanding CO oxidation in SOFC’s using nickel patterned anode. Ph.D.thesis; University of Maryland, College Park, MD, USA; 2007.
[90] Sukeshini, A.M., Habibzadeh, B., Becker, B.P., Stoltz, C.A., Eichhorn, B.W., Jackson,G.S.. Electrochemical oxidation of H2, CO, and CO/H2 mixtures on patterned Ni anodes on YSZelectrolytes. J Electrochem Soc 2006;153:A705–A715.
[91] Matsuzaki, Y., Yasuda, I.. Electrochemical oxidation of H2 and CO in a H2-H2O-CO-CO2
system at the interface of a Ni-YSZ cermet electrode and YSZ electrolyte. J Electrochem Soc2000;147:1630–1635.
[92] Eguchi, K., Kojo, H., Takeguchi, T., Kikuchi, R., Sasaki, K.. Fuel flexibility in power generationby solid oxide fuel cells. Solid State Ionics 2002;152/153:411–416.
[93] Sasaki, K., Hori, Y., Kikuchi, R., Eguchi, K., Ueno, A., Takeuchi, H., et al. Current-voltagecharacteristics and impedance analysis of solid oxide fuel cells for mixed H2 and CO gases. JElectrochem Soc 2002;149:A227–A233.
[94] Etsell, T.H., Flengas, S.N.. Overpotential behavior of stabilized zirconia solid electrolyte fuelcells. J Electrochem Soc 1971;118:1890–1900.
[95] Lauvstad, G.Ø., Tunold, R., Sunde, S.. Electrochemical oxidation of CO on Pt and Ni pointelectrodes in contact with an yttria-stabilized zirconia electrolyte. I. Modeling of steady-state andimpedance behavior. J Electrochem Soc 2002;149:E497–E505.
[96] Mizusaki, J., Tagawa, H., Miyaki, Y., Yamauchi, S., Fueki, K., Koshiro, I., et al. Kinetics ofthe electrode reaction at the CO-CO2, porous Pt/stabilized zirconia interface. Solid State Ionics1992;53–56:126–134.
[97] Aaberg, R.J., Tunold, R., Tjelle, S., Ødegard, R.. Oxidation of co and h2 on Ni/YSZ cermetelectrodes. In: Poulsen, F.W., Bonanos, N., Linderoth, S., Mogensen, M., Zachau-Christiansen,B., editors. High Temperature Electrochemistry: Ceramics and Metals. 1996, p. 511–518. Proc.17th Risø Int. Symp. on Materials Science, Roskilde, Denmark.
[98] Lauvstad, G.Ø., Tunold, R., Sunde, S.. Electrochemical oxidation of CO on Pt and Ni pointelectrodes in contact with an yttria-stabilized zirconia electrolyte. II. Steady-state and impedancemeasurements. J Electrochem Soc 2002;149:E506–E514.
[99] Boulenouar, F.Z., Yashiro, K., Oishi, M., Kaimai, A., Nigara, Y., Kawada, T., et al.Electrochemical oxidation of CO in a CO-CO2 system at the interface of Ni grid electrode/YSZelectrolyte. In: Yokokawa, H., Singhal, S.C., editors. Solid Oxide Fuel Cells VII. ElectrochemicalSociety: Pennington, NJ; 2001, p. 759–768. 7th Int. Symp. on Solid Oxide Fuel Cells (SOFC-VII),Tsukuba, Ibaraki, Japan.
[100] Setoguchi, T., Okamoto, K., Eguchi, K., Arai, H.. Effects of anode material and fuel on anodicreaction of solid oxide fuel cells. J Electrochem Soc 1992;139:2875–2880.
105

[101] Holtappels, P., de Haart, L.G.J., Stimming, U., Vinke, I.C., Mogensen, M.. Reaction ofCO/CO2 gas mixtures on Ni-YSZ cermet electrodes. J Appl Electrochem 1999;29:561–568.
[102] Rostrup-Nielsen, J.R.. Steam Reforming Catalysts. Springer-Verlag: Berlin; 1984.[103] Weber, A., Sauer, B., Muller, A.C., Herbstritt, D., Ivers-Tiffee, E.. Oxidation of H2, CO and
methane in SOFCs with Ni/YSZ-cermet anodes. Solid State Ionics 2002;152/153:543–550.[104] Costa-Nunes, O., Gorte, R.J., Vohs, J.M.. Comparison of the performance of Cu-CeO2-YSZ and
Ni-YSZ composite SOFC anodes with H2, CO, and syngas. J Power Sources 2005;141:241–249.[105] Park, S., Craciun, R., Vohs, J.M., Gorte, R.J.. Direct oxidation of hydrocarbons in a solid
oxide fuel cell: I. Methane oxidation. J Electrochem Soc 1999;146:3603–3605.[106] Li, C., Shi, Y., Cai, N.. Mechanism for carbon direct electrochemical reactions in a solid oxide
electrolyte direct carbon fuel cell. J Power Sources 2011;196:754–763.[107] Desclaux, P., Nurnberger, S., Rzepka, M., Stimming, U.. Investigation of direct carbon
conversion at the surface of a YSZ electrolyte in a SOFC. Int J Hydrogen Energy 2011;36:10278–10281.
[108] Nurnberger, S., Bußar, R., Desclaux, P., Franke, B., Rzepka, M., Stimming, U.. Direct carbonconversion in a SOFC-system with a non-porous anode. Energy Environ Sci 2010;3:150–153.
[109] Horita, T., Sakai, N., Kawada, T., Yokokawa, H., Dokiya, M.. An investigation of anodes fordirect-oxidation of carbon in solid oxide fuel cells. J Electrochem Soc 1995;142:2621–2624.
[110] Gur, T.M., Huggins, R.A.. Direct electrochemical conversion of carbon to electrical energy in ahigh temperature fuel cell. J Electrochem Soc 1992;139:L95–L97.
[111] Alexander, B.R., Mitchell, R.E., Gur, T.M.. Steam-carbon fuel cell concept for cogeneration ofhydrogen and electrical power. J Electrochem Soc 2011;158:B505–B513.
[112] Gur, T.M., Homel, M., Virkar, A.V.. High performance solid oxide fuel cell operating on drygasified coal. J Power Sources 2010;195:1085–1090.
[113] Gur, T.M.. Mechanistic modes for solid carbon conversion in high temperature fuel cells. JElectrochem Soc 2010;157:B751–B759.
[114] Lee, A.C., Mitchell, R.E., Gur, T.M.. Thermodynamic analysis of gasification-driven directcarbon fuel cells. J Power Sources 2009;194:774–785.
[115] Lee, A.C., Li, S., Mitchell, R.E., Gur, T.M.. Conversion of solid carbonaceous fuels in a fluidizedbed fuel cell. Electrochem Solid-State Lett 2008;11:B20–B23.
[116] Li, S., Lee, A.C., Mitchell, R.E., Gur, T.M.. Direct carbon conversion in a helium fluidized bedfuel cell. Solid State Ionics 2008;179:1549–1552.
[117] Ihara, M., Matsuda, K., Sato, H., Yokoyama, C.. Solid state fuel storage and utilization throughreversible carbon deposition on an SOFC anode. Solid State Ionics 2004;175:51–54.
[118] Hasegawa, S., Ihara, M.. Reaction mechanism of solid carbon fuel in rechargeable direct carbonSOFCs with methane for charging. J Electrochem Soc 2008;155:B58–B63.
[119] Cao, D., Sun, Y., Wang, G.. Direct carbon fuel cell: Fundamentals and recent developments. JPower Sources 2007;167:250–257.
[120] Giddey, S., Badwal, S.P.S., Kulkarni, A., Munnings, C.. A comprehensive review of directcarbon fuel cell technology. Prog Energy Combust Sci 2012;38:360–399.
[121] Gorte, R.J., Kim, H., Vohs, J.M.. Novel SOFC anodes for the direct electrochemical oxidationof hydrocarbon. J Power Sources 2002;106:10–15.
[122] Rostrup-Nielsen, J.R., Sehested, J., Nørskov, J.K.. Hydrogen and synthesis gas by steam- andco2 reforming. Adv Catal 2002;47:65–139.
[123] Gupta, G.K., Hecht, E.S., Zhu, H., Dean, A.M., Kee, R.J.. Gas-phase reactions of methane andnatural-gas with air and steam in non-catalytic regions of a solid-oxide fuel cell. J Power Sources2006;156:434–447.
[124] Walters, K.M., Dean, A.M., Zhu, H., Kee, R.J.. Homogeneous kinetics and equilibriumpredictions of coking propensity in the anode channels of direct oxidation solid-oxide fuel cellsusing dry natural gas. J Power Sources 2003;123:182–189.
[125] Anderson, J.R., Boudart, M., editors. Catalysis: Science and Technology; vol. 5. Springer-Verlag:Berlin; New York; 1984.
[126] Helveg, S., Lopez-Cartes, C., Sehested, J., Hansen, P.L., Clausen, B.S., Rostrup-Nielsen, J.R.,et al. Atomic-scale imaging of carbon nanofibre growth. Nature 2004;427:426–429.
[127] Kim, T., Liu, G., Boaro, M., Lee, S., Vohs, J.M., Gorte, R.J., et al. A study of carbonformation and prevention in hydrocarbon-fueled SOFC. J Power Sources 2006;155:231–238.
[128] Appel, J., Bockhorn, H., Frenklach, M.. Kinetic modeling of soot formation with detailed chem-istry and physics: Laminar premixed flames of C2 hydrocarbons. Combust Flame 2000;121:122–136.
106

[129] Kazakov, A., Wang, H., Frenklach, M.. Detailed modeling of soot formation in laminar premixedethylene flames at a pressure of 10 bar. Combust Flame 1995;100:111–120.
[130] Sheng, C.Y., Dean, A.M.. Importance of gas-phase kinetics within the anode channel of asolid-oxide fuel cell. J Phys Chem A 2004;108:3772–3783.
[131] Kim, H., Lu, C., Worrell, W.L., Vohs, J.M., Gorte, R.J.. Cu-Ni Cermet anodes for directoxidation of methane in solid-oxide fuel cells. J Electrochem Soc 2002;149:A247–A250.
[132] Koh, J.H., Kang, B.S., Lim, H.C., Yoo, Y.S.. Thermodynamic analysis of carbon deposition andelectrochemical oxidation of methane for SOFC anodes. Electrochem Solid-State Lett 2001;4:A12–A15.
[133] Deshpande, S., Patil, S., Kuchibhatia, S.V.N.T., Seal, S.. Size dependency variation in latticeparameter and valency states in nanocrystalline cerium oxide. Appl Phys Lett 2005;87:133113.
[134] Steele, B.C.H., Middleton, P.H., Rudkin, R.A.. Materials science aspects of SOFC technologywith special reference to anode development. Solid State Ionics 1990;40/41:388–393.
[135] McIntosh, S., Vohs, J.M., Gorte, R.J.. Role of hydrocarbon deposits in the enhanced performanceof direct-oxidation SOFCs. J Electrochem Soc 2003;150:A470–A476.
[136] Ye, X.F., Huang, B., Wang, S.R., Wang, Z.R., Xiong, L., Wen, T.L.. Preparation andperformance of a Cu-CeO2-ScSZ composite anode for SOFCs running on ethanol fuel. J PowerSources 2007;164:203–209.
[137] Lee, S., Vohs, J.M., Gorte, R.J.. A study of SOFC anodes based on Cu-Ni and Cu-Co bimetallicsin CeO2-YSZ. J Electrochem Soc 2004;151:A1319–A1323.
[138] Xie, Z., Zhu, W., Zhu, B., Xia, C.. FexCo0.5−xNi0.5-SDC Anodes for low-temperature solidoxide fuel cells. Electrochim Acta 2006;51:3052–3057.
[139] Costa-Nunes, O., Vohs, J.M., Gorte, R.J.. A study of direct-conversion SOFC with n-butane athigher fuel utilization. J Electrochem Soc 2003;150:A858–A863.
[140] Hibino, T., Hashimoto, A., Asano, K., Yano, M., Suzuki, M., Sano, M.. An intermediate-temperature solid oxide fuel cell providing higher performance with hydrocarbons than with hy-drogen. Electrochem Solid-State Lett 2002;5:A242–A244.
[141] Besenbacher, F., Chorkendorff, I., Clausen, B.S., Hammer, B., Molenbroek, A.M., Nørskov,J.K., et al. Design of a surface alloy catalyst for steam reforming. Science 1998;279:1913–1915.
[142] Rostrup-Nielsen, J.R., Alstrup, I.. Innovation and science in the process industry: Steamreforming and hydrogenolysis. Catal Today 1999;53:311–316.
[143] Triantafyllopoulos, N.C., Neophytides, S.G.. Dissociative adsorption of CH4 on NiAu/YSZ: Thenature of adsorbed carbonaceous species and the inhibition of graphitic C formation. J Catal2006;239:187–199.
[144] Gavrielatos, I., Drakopoulos, V., Neophytides, S.G.. Carbon tolerant Ni-Au SOFC electrodesoperating under internal steam reforming conditions. J Catal 2008;259:75–84.
[145] Schneider, R., Kiessling, D., Wendt, G., Burckhardt, W., Winterstein, G.. Perovskite-type oxidemonolithic catalysts for combustion of chlorinated hydrocarbons. Catal Today 1999;47:429–435.
[146] Forni, L., Rossetti, I.. Catalytic combustion of hydrocarbons over perovskites. Appl Catal, B2002;38:29–37.
[147] Belessi, V.C., Ladavos, A.K., Pomonis, P.J.. Methane combustion on La-Sr-Ce-Fe-O mixedoxides: Bifunctional synergistic action of SrFeO3−x and CeOx phases. Appl Catal, B 2001;31:183–194.
[148] Fisher, J.C., Chuang, S.S.C.. Investigating the CH4 reaction pathway on a novel LSCF anodecatalyst in the SOFC. Catal Commun 2009;10:772–776.
[149] Huang, Y.H., Dass, R.I., Denyszyn, J.C., Goodenough, J.B.. Synthesis and characterization ofSr2MgMoO6−δ. J Electrochem Soc 2006;153:A1266–A1272.
[150] Huang, Y.H., Dass, R.I., Xing, Z.L., Goodenough, J.B.. Double perovskites as anode materialsfor solid-oxide fuel cells. Science 2006;312:254–257.
[151] Sauvet, A.L., Irvine, J.T.S.. Catalytic activity for steam methane reforming and physical char-acterisation of La1−xSrxCr1−yNiyO3−δ. Solid State Ionics 2004;167:1–8.
[152] Sauvet, A.L., Fouletier, J., Gaillard, F., Primet, M.. Surface properties and physicochemicalcharacterizations of a new type of anode material, La1−xSrxCr1−yRuyO3−δ, for a solid oxide fuelcell under methane at intermediate temperature. J Catal 2002;209:25–34.
[153] Sauvet, A.L., Fouletier, J.. Electrochemical properties of a new type of anode materialLa1−xSrxCr1−yRuyO3−δ for SOFC under hydrogen and methane at intermediate temperatures.Electrochim Acta 2001;47:987–995.
[154] Ruiz-Morales, J.C., Canales-Vazquez, J., na Martinez, J.P., Lopez, D.M., nez, P.N.. Onthe simultaneous use of La0.75Sr0.25Cr0.5Mn0.5O3−δ as both anode and cathode material with
107

improved microstructure in solid oxide fuel cells. Electrochim Acta 2006;52:278–284.[155] Pudmich, G., Boukamp, B.A., Gonzalez-Cuenca, M., Jungen, W., Zipprich, W., Tietz, F..
Chromite/titanate based perovskites for application as anodes in solid oxide fuel cells. Solid StateIonics 2000;135:433–438.
[156] Sin, A., Kopnin, E., Dubitsky, Y., Zaopo, A., Arico, A.S., Gullo, L.R., et al. Stabilisationof composite LSFCO-CGO based anodes for methane oxidation in solid oxide fuel cells. J PowerSources 2005;145:68–73.
[157] Jiang, S.P., Chen, X.J., Chan, S.H., Kwok, J.T.. GDC-Impregnated(La0.75Sr0.25)(Cr0.5Mn0.5)O3 anodes for direct utilization of methane in solid oxide fuel cells.J Electrochem Soc 2006;153:A850–A856.
[158] Chen, X.J., Liu, Q.L., Chan, S.H., Brandon, N.P., Khor, K.A.. High-performance cathode-supported SOFC with perovskite anode operating in weakly humidified hydrogen and methane.Fuel Cells Bulletin 2007;2007:12–16.
[159] Vernoux, P., Guillodo, M., Fouletier, J., Hammou, A.. Alternative anode material for gradualmethane reforming in solid oxide fuel cells. Solid State Ionics 2000;135:425–431.
[160] Matsuzaki, Y., Yasuda, I.. Effect of a sulfur-containing impurity on electrochemical propertiesof a Ni-YSZ cermet electrode. In: Yokokawa, H., Singhal, S.C., editors. Solid Oxide Fuel CellsVII. Electrochemical Society: Pennington, NJ; 2001, p. 769–779. 7th Int. Symp. on Solid OxideFuel Cells (SOFC-VII),.
[161] Matsuzaki, Y., Yasuda, I.. The poisoning effect of sulfur-containing impurity gas on a SOFCanode: Part I. Dependence on temperature, time, and impurity concentration. Solid State Ionics2000;132:261–269.
[162] Edwin, E.H., Karoliussen, H., Odegard, R.. H2S in natural gas fuel reduces mechanical stress insolid oxide fuel cells. In: Stimming, U., Singhal, S.C., Tagawa, H., Lehnert, W., editors. SolidOxide Fuel Cells V. Electrochemical Society: Pennington, NJ; 1997, p. 839–846. 5th Int. Symp.on Solid Oxide Fuel Cells (SOFC-V), Aachen, Germany.
[163] Trembly, J.P., Marquez, A.I., Ohrn, T.R., Bayless, D.J.. Effects of coal syngas and H2S on theperformance of solid oxide fuel cells: Single-cell tests. J Power Sources 2006;158:263–273.
[164] Cheng, Z., Zha, S., Liu, M.. Erratum: Stability of materials as candidates for sulfur-resistantanodes of solid oxide fuel cells. J Electrochem Soc 2006;153:L23.
[165] Cheng, Z., Zha, S., Liu, M.. Stability of materials as candidates for sulfur-resistant anodes ofsolid oxide fuel cells. J Electrochem Soc 2006;153:A1302–A1309.
[166] Mukundan, R., Brosha, E.L., Garzon, F.H.. Sulfur tolerant anodes for SOFCs. ElectrochemSolid-State Lett 2004;7:A5–A7.
[167] Grgicak, C.M., Pakulska, M.M., O’Brien, J.S., Giorgi, J.B.. Synergistic effects of Ni1−xCox-YSZ and Ni1−xCux-YSZ alloyed cermet SOFC anodes for oxidation of hydrogen and methanefuels containing H2S. J Power Sources 2008;183:26–33.
[168] Monder, D.S., Nandakumar, K., Chuang, K.T.. Model development for a SOFC button cellusing H2S as fuel. J Power Sources 2006;162:400–414.
[169] Liu, M., Wei, G., Luo, J., Sanger, A.R., Chuang, K.T.. Use of metal sulfides as anode catalystsin H2S-air SOFCs. J Electrochem Soc 2003;150:A1025–A1029.
[170] Pujare, N.U., Semkow, K.W., Sommells, A.F.. A direct H2S/air solid oxide fuel cell. JElectrochem Soc 1987;134:2639–2643.
[171] Janardhanan, V.M., Deutschmann, O.. Modeling diffusion limitation in solid-oxide fuel cells.Electrochim Acta 2011;56:9775–9782.
[172] Ying, L., Jiang-Hong, G., Zi-Long, T., Yu-Sheng, X., Zhong-Tai, Z.. Temperature-independentactivation energy for ionic conduction of zirconia based solid electrolytes. Acta Phys-Chim Sin2001;17:792–796.
[173] Barsoukov, E., Macdonald, J.R., editors. Impedance Spectroscopy, Theory, Experiment, andApplications. John Wiley & Sons: Hoboken, NJ, USA; 2 ed.; 2005.
[174] Orazem, M.E., Tribollet, B.. Electrochemical Impedance Spectroscopy. John Wiley & Sons:Hoboken, NJ, USA; 2008.
108