fundamental. thinking. worldwide
TRANSCRIPT

Fundamental. Thinking. Worldwide.
International Equity Review | Second Quarter 2020

HARDING LOEVNER 2
Composite PerformanceAs of June 30, 2020
1Annualized Returns; 2Inception date: December 31, 1989; 3The Benchmark Index; 4Gross of withholding taxes.The performance returns shown are preliminary. The International Equity Composite contains fully discretionary, fee-paying accounts investing in non-US equity and equity-equivalent securities and cashreserves, and is measured against the MSCI All Country World ex-US Total Return Index (Gross) for comparison purposes. Harding Loevner LP is an investment adviser registered with the Securities andExchange Commission. Harding Loevner is an affiliate of Affiliated Managers Group, Inc. (NYSE: AMG), an investment holding company with stakes in a diverse group of boutique firms. Harding Loevnerclaims compliance with the Global Investment Performance Standards (GIPS®). Harding Loevner has been independently verified for the period November 1, 1989 through March 31, 2020. Verificationassesses whether (1) the firm has complied with all composite construction requirements of the GIPS standards on a firm-wide basis and (2) the firm’s policy and procedures are designed to calculate andpresent performance in compliance with GIPS standards. The International Equity Composite has been examined for the periods January 1, 1990 through March 31, 2020. The verification and performanceexamination reports are available upon request. Performance data quoted represents past performance; past performance does not guarantee future results. Returns are presented both gross and net ofmanagement fees and include the reinvestment of all income. Net returns are calculated using actual fees. The US dollar is the currency used to express performance. For complete information on theconstruction and historical record of the International Equity Composite, please contact Harding Loevner at (908) 218-7900 or visit www.hardingloevner.com. The firm maintains a complete list anddescription of composites, which is available upon request. Please read the disclosures on the last page, which are an integral part of this presentation.
Performance (% Total Return)
3 Months YTD 1 Year 3 Years1 5 Years1 10 Years1Since
Inception1,2
HL International Equity (gross of fees) 18.82 -4.05 3.49 5.47 6.60 8.68 8.21
HL International Equity (net of fees) 18.63 -4.35 2.83 4.79 5.91 8.01 7.41
MSCI All Country World ex-US Index3,4 16.30 -10.76 -4.39 1.61 2.74 5.45 4.79
Up/Down Capture (trailing five years, annualized): 108/90

HARDING LOEVNER 3
4.5
6.6
8.8
2.4
6.6
8.5
Sales Growth Earnings GrowthCash Flow
Growth
2.9 3.3
Std Dev of ROE
12.6
9.2
13.8
10.8
5.3
12.0
Profit Margin Return on Assets Return on Equity
Quality & Growth Investment PhilosophyAs of June 30, 2020
Source: FactSet. Growth and volatility metrics are based on five-year historical data; the other ratios are based on the most recent annual data. All metrics and ratios are percentagespresented as weighted medians. Please read the disclosures on the last page, which are an integral part of this presentation.
Faster GrowthMore Profitable Lower Risk
Harding Loevner International Equity Model MSCI All Country World ex-US Index
41.6
60.2
Debt/Equity

HARDING LOEVNER 4
An Economic Recovery?
01020304050607080
Jan-
19
Feb-
19
Mar
-19
Apr
-19
May
-19
Jun-
19
Jul-
19
Aug
-19
Sep
-19
Oct
-19
Nov
-19
Dec
-19
Jan-
20
Feb-
20
Mar
-20
Apr
-20
May
-20
Jun-
20
Oil Price (Brent $ per Barrel)
2
2.2
2.4
2.6
2.8
3
3.2
Dec
-18
Jan-
19
Feb-
19
Mar
-19
Apr
-19
May
-19
Jun-
19
Jul-
19
Aug
-19
Sep
-19
Oct
-19
Nov
-19
Dec
-19
Jan-
20
Feb-
20
Mar
-20
Apr
-20
May
-20
Jun-
20
Copper NYMEX ($/lb)
Source: OECD, FactSet. The composite leading indicator (CLI) is designed to provide early signals of turning points in business cycles showing fluctuation of the economic activity around its long term potential level. CLIs show short-term economic movements in qualitative rather than quantitative terms.
April: 93.8
June: 97.1
92
94
96
98
100
102
104
OECD Composite Leading Indicator (Long-Term Average = 100)
Recession CLI

HARDING LOEVNER 5
Unprecedented Monetary and Fiscal Stimulus in Response to COVID-19
Source: IMF (chart on top), Yale School of Management (chart on bottom), IMF Classified Advanced Economies: Australia, Canada, European Union, France, Germany, Italy, Japan, Korea, Spain, Belgium, Czech republic, Denmark, Finland, New Zealand, Norway, Singapore, Sweden, Switzerland, The Netherlands, United Kingdom, United States. IMF Classified Emerging Markets: Albania, Argentina, Brazil, Bulgaria, Chile, China, Colombia, Egypt, Georgia, India, Indonesia, Kazakhstan, Mauritius, Mexico, Pakistan, Peru, Philippines, Poland, Romania, Russia, Saudi Arabia, South Africa, Thailand, Tunisia, Turkey, United Arab Emirates. IMF Classified LIDCs: Bangladesh, Ethiopia, Ghana, Guinea-Bissau, Honduras, Kenya, Nigeria, Senegal, Vietnam.
0
100
200
300
400
Cou
nt
Weekly Count of Announced Monetary Stimulus Measures
0.0 2.0 4.0 6.0 8.0 10.0 12.0
Low Income Developing Countries
Emerging Markets
G20
Advanced Economies
Percent of GDP
Summary of Fiscal Measures Since Outbreak
Loans, equity, and guarantees Additional spending and forgone revenue

HARDING LOEVNER 6
Lingering Economic Uncertainty due to COVID-19
Source: OECD Economic Outlook, June 2020
Single-hit scenario: A second wave is avoided
Double-hit scenario: A second wave of infections hits before year-end
-16
-14
-12
-10
-8
-6
-4
-2
0
ESP
FRA
ITA
GB
RCZ
EP
RT
BE
LIS
LS
VK
LTU
LVA
AR
GN
ZLR
US
EST
CHE
NLD
HU
NG
RC
PO
LCA
NFI
NB
RA
SV
ND
EUIR
LR
OU
MEX
US
AIS
RZA
FTU
RB
GR
COL
SW
ELU
XW
LDA
UT
NO
RJP
NIN
DCH
LD
NK
AU
SCR
IID
NCH
NK
OR
2020 Projected Change in GDP
Single-Hit Scenario Additional Decline in Double-Hit Scenario

HARDING LOEVNER 7
MSCI ACW ex-US Index Total Returns by Quality, Growth, and Value Rank
Source: FactSet; Data as of June 30, 2020. Please read the disclosures on the last page, which are an integral part of this presentation.
2Q20Fastest growing and most expensive stocks performed best.
Year to DateHighest quality, fastest growth, & most expensive stocks strongly outperformed.
0
5
10
15
20
25
Highest Lowest
Ret
urn
(%)
Quality Rank Quintiles
0
5
10
15
20
25
Fastest Slowest
Growth Rank Quintiles
0
5
10
15
20
25
LeastExp.
MostExp.
Value Rank Quintiles
-25
-20
-15
-10
-5
0
5
Fastest Slowest
Growth Rank Quintiles
-25
-20
-15
-10
-5
0
5
Highest Lowest
Ret
urn
(%)
Quality Rank Quintiles
-25
-20
-15
-10
-5
0
5
LeastExp.
MostExp.
Value Rank Quintiles

HARDING LOEVNER 8
Canada
Pacific ex-Japan
Middle East
Europe EMU
HL Intl Equity Composite
Emerging Markets
MSCI ACWxUS Index
Japan
Europe ex-EMU
Materials
Info Technology
Cons Discretionary
HL Intl Equity Composite
Comm Services
Industrials
Health Care
MSCI ACWxUS Index
Utilities
Financials
Cons Staples
Energy
Real Estate
Benchmark Sector/Region ReturnsSecond Quarter
Source: FactSet; Data as of June 30, 2020. Past performance does not guarantee future results. Please read the disclosures on the last page, which are an integral part of this presentation.
Sector Total Return (%) Region Total Return (%)
8.2
10.1
10.5
11.5
11.7
16.3
16.6
17.6
18.1
18.8
20.0
24.7
25.7
0.0 10.0 20.0 30.0
11.1
11.6
16.3
18.2
18.8
20.1
20.1
20.2
20.4
0.0 5.0 10.0 15.0 20.0 25.0

HARDING LOEVNER 9
Performance Attribution: Composite vs BenchmarkSecond Quarter
1Includes companies classified in countries outside the Index. “Composite”: International Equity Composite. “Benchmark”: MSCI All Country World ex-US Index. Past performance does notguarantee future results. Sector and Region Attribution and Contributors and Detractors are shown as supplemental information only and complement the fully compliant International EquityComposite GIPS Presentation. The portfolio holdings identified above do not represent all of the securities held in the portfolio. It should not be assumed that investment in the securitiesidentified has been or will be profitable. The following information is available upon request: (1) information describing the methodology of the contribution data and (2) a list showing theweight and contribution of all holdings during the quarter. Contribution is the contribution to overall performance over the period. Contributors and detractors exclude cash and securities inthe Composite not held in the Model Portfolio. Quarterly data is not annualized. Please read the disclosures on the last page, which are an integral part of this presentation.
-1.0
0.0
1.0
2.0
3.0
INFT INDU RLST HLTH FINA UTIL ENER STPL COMM DSCR CASH MATS
Sector
Effe
ct (%
)
Top Five Contributors to Abolute Returns
Infineon Technologies
Adyen
Chugai Pharmaceutical
SAP
TSMC
Top Five Detractors from Absolute Returns
Royal Dutch Shell
China Mobile
Amadeus
Baidu
Standard Chartered-1.0
0.0
1.0
2.0
3.0
EMU JAPAN XEMU OTHER¹ CANADA MIDEAST CASH PACXJ EMERGE
Effe
ct (%
)
Region
Total Effect: 2.6
Selection Effect: 1.8
Allocation Effect: 0.8
Total Effect: 2.6
Selection Effect: 2.9
Allocation Effect: -0.3
Selection Effect Allocation Effect Total Effect

HARDING LOEVNER 10
-30.0%
-20.0%
-10.0%
0.0%
10.0%
20.0%
30.0%
40.0%
Dec
-15
Mar
-16
Jun-
16
Sep
-16
Dec
-16
Mar
-17
Jun-
17
Sep
-17
Dec
-17
Mar
-18
Jun-
18
Sep
-18
Dec
-18
Mar
-19
Jun-
19
Sep
-19
Dec
-19
Mar
-20
Jun-
20
2017 2018 2019 2020 2021
Growth ExpectationsEarnings expectations collapsed for 2020, but a rebound is anticipated in 2021
Source: OECD (2019), OECD Economic Outlook, Interim Report September 2019; FactSet , Harding Loevner.
MSCI AC World ex-US Index – EPS Growth (USD)2017 – 2021 Consensus Estimates
MSCI AC World ex-US Index – EPS Growth (USD)2007 – 2011 Consensus Estimates
-30.0%
-20.0%
-10.0%
0.0%
10.0%
20.0%
30.0%
40.0%
50.0%
Dec
-05
Mar
-06
Jun-
06S
ep-0
6D
ec-0
6M
ar-0
7Ju
n-07
Sep
-07
Dec
-07
Mar
-08
Jun-
08S
ep-0
8D
ec-0
8M
ar-0
9Ju
n-09
Sep
-09
Dec
-09
Mar
-10
Jun-
10S
ep-1
0D
ec-1
0M
ar-1
1Ju
n-11
Sep
-11
2007 2008 2009 2010 2011

HARDING LOEVNER 11
Highest-Growth Companies Becoming More ExpensiveWe have reduced our exposure to the highest two quintiles of growth in the benchmark as those stocks appear increasingly expensive.
Source: FactSet
(10)
(5)
0
5
10
15
20
25
30
35
Mar
-16
Jun-
16
Sep
-16
Dec
-16
Mar
-17
Jun-
17
Sep
-17
Dec
-17
Mar
-18
Jun-
18
Sep
-18
Dec
-18
Mar
-19
Jun-
19
Sep
-19
Dec
-19
Mar
-20
Jun-
20
Act
ive
Wei
ght
HL International Active Weight in Top Two Quintiles of Growth
Quintile 1 Quintile 2
0.00
0.10
0.20
0.30
0.40
0.50
0.60
0.70
0.80
Dec
-07
Aug
-08
Apr
-09
Dec
-09
Aug
-10
Apr
-11
Dec
-11
Aug
-12
Apr
-13
Dec
-13
Aug
-14
Apr
-15
Dec
-15
Aug
-16
Apr
-17
Dec
-17
Aug
-18
Apr
-19
Dec
-19
Chea
p
R
el V
alua
tion
Expe
nsiv
e
Valuation of MSCI ACWIxUS Index by Quintiles of Growth
Quintile 1 (Fastest Growth) Quintile 2
Quintile 3 Quintile 4
Quintile 5 (Slowest Growth) MSCI ACWIxUS

HARDING LOEVNER 12
Completed Portfolio Transactions
The portfolio is actively managed therefore holdings shown may not be current. The portfolio holdings identified above do not represent all of the securities held in the portfolio. It should notbe assumed that investment in the securities identified has been or will be profitable. To request a complete list of portfolio holdings for the past year, contact Harding Loevner. Holdings areshown as supplemental information only and complement the fully compliant International Equity Composite GIPS Presentation. Please read the disclosures on the last page, which are anintegral part of this presentation.
Company Country Sector
Alcon Switzerland Health Care
Alibaba China Cons Discretionary
Positions Established Positions Sold
Portfolio Turnover (5 year annualized average): 16.8%
Company Country Sector
Amadeus Spain Info Technology
Baidu China Comm Services
Second Quarter

HARDING LOEVNER 13
3.3
4.6
2.8
6.1
7.4
11.3
11.5
15.1
19.1
18.8
1.5
2.6
4.1
5.4
7.8
13.6
14.1
14.5
15.1
21.3
0.0 5.0 10.0 15.0 20.0 25.0
Cash
Energy
ConsumerDiscretionary
Comm Services
Materials
Industrials
Health Care
Cons Staples
Financials
Info Technology
6/30/2020 6/30/2019
Sector (%)
3.3
2.7
3.4
3.1
6.4
11.4
22.8
22.8
24.1
1.5
1.5
1.5
2.2
5.1
14.9
23.0
24.7
25.6
0.0 10.0 20.0 30.0
Cash
Middle East
Other¹
Canada
Pacificex-Japan
Japan
EmergingMarkets
Europe EMU
Europeex-EMU
6/30/2020 6/30/2019
June 30, 2020 vs June 30, 2019
1Includes companies classified in countries outside the Index. Sector and Region end weights are shown as supplemental information only and complement the fully compliant InternationalEquity Composite GIPS Presentation. Please read the disclosures on the last page, which are an integral part of this presentation.
Region (%)
Portfolio Allocation Comparison

HARDING LOEVNER 14
Geography HL% ACWIxUS% (Under) / Over
Europe ex-EMU 25.6 19.7
Europe EMU 24.7 20.8
Cash 1.5 —
Other1 1.5 —
Middle East 1.5 0.4
Frontier Markets2 0.0 —
Japan 14.9 16.5
Pacific ex-Japan 5.1 7.5
Canada 2.2 6.5
Emerging Markets 23.0 28.6
Portfolio ExposuresAs of June 30, 2020
1Includes companies classified in countries outside the Index; 2Includes countries with less-developed markets outside the Index.Source: Harding Loevner International Equity Model; MSCI Inc. and S&P. Sector and region end weights are shown as supplemental information only and complement the fully compliantInternational Equity Composite GIPS Presentation. Please read the disclosures on the last page, which are an integral part of this presentation.
Sector HL% ACWIxUS% (Under) / Over
Info Technology 21.3 11.0
Cons Staples 14.5 9.9
Health Care 14.1 10.7
Industrials 13.6 11.4
Cash 1.5 —
Materials 7.8 7.6
Comm Services 5.4 7.6
Energy 2.6 4.8
Real Estate 0.0 2.8
Financials 15.1 18.1
Utilities 0.0 3.5
Cons Discretionary 4.1 12.6
(12.0) (6.0) 0.0 6.0 12.0 (12.0) (6.0) 0.0 6.0 12.0
Ten Largest Holdings – Total Weight: 32.0%
Company Country Sector Wt (%)
Infineon Technologies Germany Info Technology 3.1
Samsung Electronics South Korea Info Technology 3.1
AIA Group Hong Kong Financials 3.0
Tencent China Comm Services 2.8
Chugai Pharmaceutical Japan Health Care 2.7
83% Active Share
Company Country Sector Wt (%)
TSMC Taiwan Info Technology 4.1
Roche Switzerland Health Care 3.4
L'Oréal France Cons Staples 3.3
SAP Germany Info Technology 3.3
Atlas Copco Sweden Industrials 3.2

HARDING LOEVNER 15
Harding Loevner ProfileAs of June 30, 2020
Data as of June 30, 2020. Total AUM includes all the assets under management and is presented as supplemental information. Please read the disclosures on the last page, which are anintegral part of this presentation.
42 investment professionals International Equity portfolio management team averages 14 years at Harding Loevner
Total Assets$67B
Strategy Assets Firm Assets
Global $17.8B 27%
International (Non-US) $32.7B 49%
Emerging Markets $15.9B 24%
Frontier Emerging Markets $0.2B <1%
Global Small Companies <$0.1B <1%
International Small Companies $0.4B 1%
Research Portfolios <$0.1B <1%

Appendix

HARDING LOEVNER 17
Health Care
Info Technology
Comm Services
HL Intl Equity Composite
Cons Staples
Utilities
Materials
Cons Discretionary
MSCI ACWxUS Index
Industrials
Real Estate
Financials
Energy
Middle East
HL Intl Equity Composite
Japan
Emerging Markets
MSCI ACWxUS Index
Europe EMU
Canada
Europe ex-EMU
Pacific ex-Japan
Benchmark Sector/Region ReturnsYear to Date
Source: FactSet; Data as of June 30, 2020. Past performance does not guarantee future results. Please read the disclosures on the last page, which are an integral part of this presentation.
Sector Total Return (%) Region Total Return (%)
-32.1
-23.0
-21.5
-13.1
-10.8
-8.9
-8.8
-5.9
-5.7
-4.0
1.4
3.0
6.3
-40.0 -30.0 -20.0 -10.0 0.0 10.0
-12.9
-12.9
-12.5
-12.0
-10.8
-9.7
-6.9
-4.0
-1.5
-15.0 -10.0 -5.0 0.0
HARDING LOEVNER 18
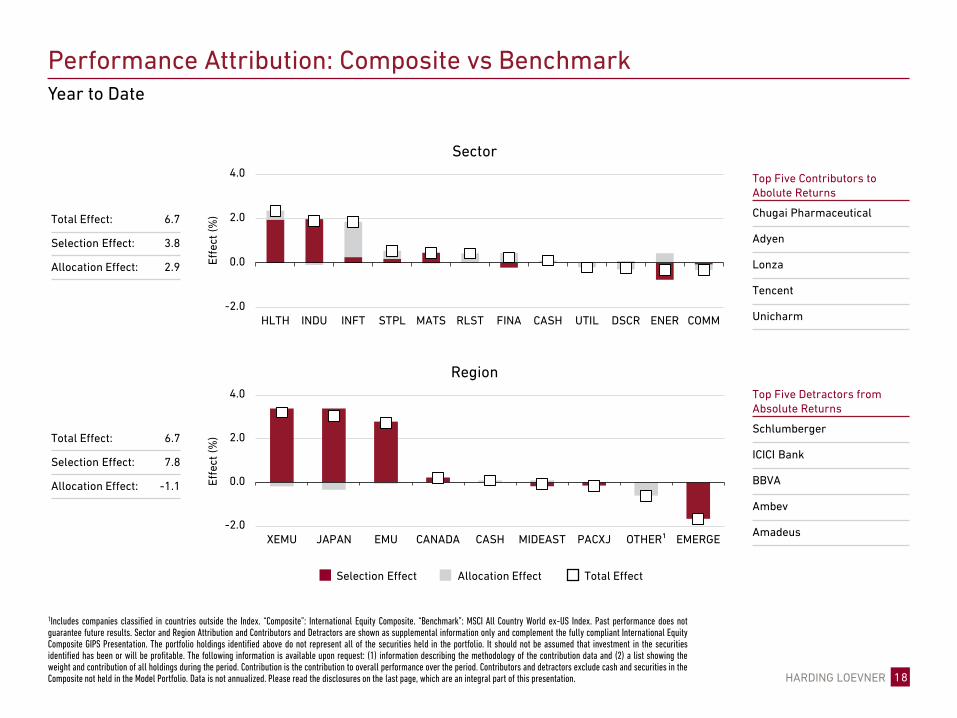
Performance Attribution: Composite vs BenchmarkYear to Date
-2.0
0.0
2.0
4.0
HLTH INDU INFT STPL MATS RLST FINA CASH UTIL DSCR ENER COMM
Sector
Region
-2.0
0.0
2.0
4.0
XEMU JAPAN EMU CANADA CASH MIDEAST PACXJ OTHER¹ EMERGE
Total Effect: 6.7
Selection Effect: 3.8
Allocation Effect: 2.9
Total Effect: 6.7
Selection Effect: 7.8
Allocation Effect: -1.1
1Includes companies classified in countries outside the Index. “Composite”: International Equity Composite. “Benchmark”: MSCI All Country World ex-US Index. Past performance does notguarantee future results. Sector and Region Attribution and Contributors and Detractors are shown as supplemental information only and complement the fully compliant International EquityComposite GIPS Presentation. The portfolio holdings identified above do not represent all of the securities held in the portfolio. It should not be assumed that investment in the securitiesidentified has been or will be profitable. The following information is available upon request: (1) information describing the methodology of the contribution data and (2) a list showing theweight and contribution of all holdings during the period. Contribution is the contribution to overall performance over the period. Contributors and detractors exclude cash and securities in theComposite not held in the Model Portfolio. Data is not annualized. Please read the disclosures on the last page, which are an integral part of this presentation.
Top Five Contributors to Abolute Returns
Chugai Pharmaceutical
Adyen
Lonza
Tencent
Unicharm
Top Five Detractors from Absolute Returns
Schlumberger
ICICI Bank
BBVA
Ambev
Amadeus
Selection Effect Allocation Effect Total Effect
Effe
ct (%
)Ef
fect
(%)

HARDING LOEVNER 19
Completed Portfolio Transactions
The portfolio is actively managed therefore holdings shown may not be current. The portfolio holdings identified above do not represent all of the securities held in the portfolio. It should notbe assumed that investment in the securities identified has been or will be profitable. To request a complete list of portfolio holdings for the past year, contact Harding Loevner. Holdings areshown as supplemental information only and complement the fully compliant International Equity Composite GIPS Presentation. Please read the disclosures on the last page, which are anintegral part of this presentation.
PositionsEstablished
Portfolio Turnover (5 year annualized average): 16.8%
PositionsSold
3Q19 4Q19 1Q20 2Q20
Alcon
Alibaba
Amadeus
Baidu
Adyen
NITORI
Shionogi
Dentsu
HSBC
Sasol
Schlumberger
Schneider Electric
Standard Chartered
Grifols
M3
Naspers
Prosus
Prosus*
Aspen Pharmacare
BMW
Trailing 12 Months

HARDING LOEVNER 20
International vs US Relative Valuation
Source: Bloomberg; FactSet. Data as of June 30, 2020
50%
60%
70%
80%
90%
100%
110%
Jun-
96
Jun-
97
Jun-
98
Jun-
99
Jun-
00
Jun-
01
Jun-
02
Jun-
03
Jun-
04
Jun-
05
Jun-
06
Jun-
07
Jun-
08
Jun-
09
Jun-
10
Jun-
11
Jun-
12
Jun-
13
Jun-
14
Jun-
15
Jun-
16
Jun-
17
Jun-
18
Jun-
19
Jun-
20
Relative Valuation ACWIxUS vs US Avg Relative ValuationValuation as of June 30, 2020(Based on most recent annual data)
P/E P/B P/CF
ACWI ex-US 16.0 1.6 9.1
Europe 15.9 1.7 8.8
Japan 15.9 1.3 7.9
EM 16.0 1.6 10.1
US 24.3 3.7 15.8
International vs US Relative Valuation(Equal-weighted composite of relative P/E, P/B, and P/CF multiples, ACWIxUS vs US)
HARDING LOEVNER 21
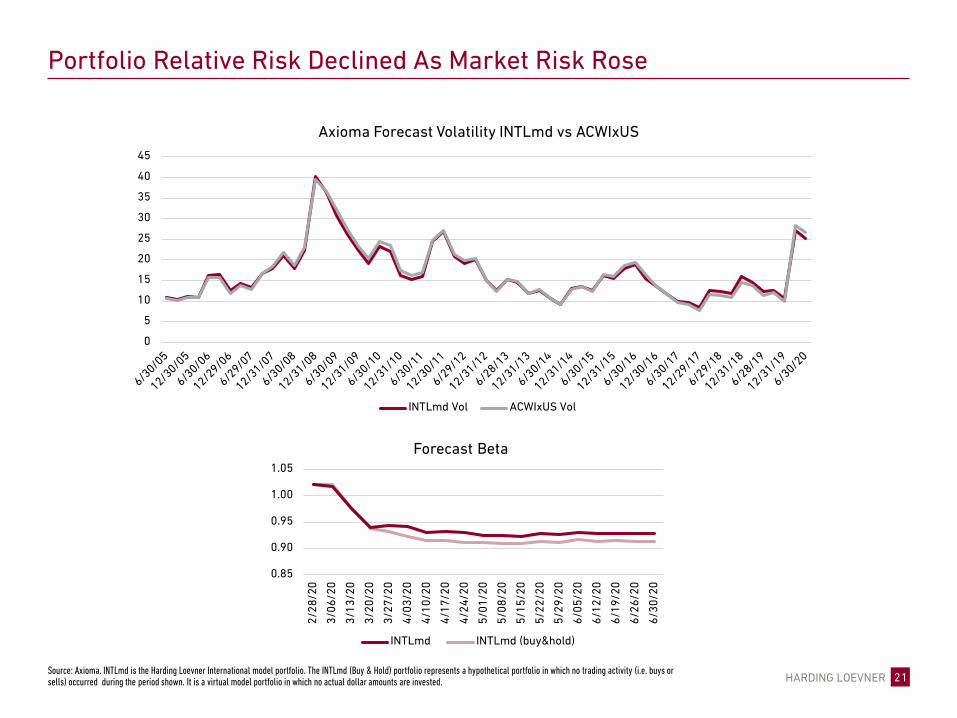
Portfolio Relative Risk Declined As Market Risk Rose
Source: Axioma. INTLmd is the Harding Loevner International model portfolio. The INTLmd (Buy & Hold) portfolio represents a hypothetical portfolio in which no trading activity (i.e. buys or sells) occurred during the period shown. It is a virtual model portfolio in which no actual dollar amounts are invested.
0.85
0.90
0.95
1.00
1.05
2/28
/20
3/06
/20
3/13
/20
3/20
/20
3/27
/20
4/03
/20
4/10
/20
4/17
/20
4/24
/20
5/01
/20
5/08
/20
5/15
/20
5/22
/20
5/29
/20
6/05
/20
6/12
/20
6/19
/20
6/26
/20
6/30
/20
Forecast Beta
INTLmd INTLmd (buy&hold)
0
5
10
15
20
25
30
35
40
45
Axioma Forecast Volatility INTLmd vs ACWIxUS
INTLmd Vol ACWIxUS Vol

HARDING LOEVNER 22
The information provided in this Presentation should not be considered a recommendation to purchase or sell a particular security. Unless otherwise stated, non-performance based criteria have been used to select the securitieslisted. The portfolio is actively managed therefore securities shown may not be current. It should not be assumed that investment in the securities identified has been or will be profitable. To request a complete list of portfolioholdings for the past year contact Harding Loevner. A complete list of holdings for the International Equity Model at June 30, 2020 is available on request.
Investing in stocks entails the risks of market volatility. The value of all types of stocks may increase or decrease over varying time periods. To the extent the investments depicted herein represent international securities, youshould be aware that there may be additional risks associated with international investing, including foreign economic, political, monetary and/or legal factors, changing currency exchange rates, foreign taxes, and differences infinancial and accounting standards.
Quality & Growth Characteristics, Investment Statistics, Benchmark Returns, Performance Attribution, Portfolio Exposures and Portfolio Transactions are shown as supplemental information only and complement the fullycompliant International Equity Composite GIPS Presentation, which is available on request.
Alpha: a measure of risk-adjusted return. Beta: a measure of the portfolio’s sensitivity to the market. R-Squared: a measure of how well a portfolio tracks the market. Standard Deviation: the statistical measure of the degree towhich an individual value in a probability distribution tends to vary from the mean of the distribution. Information Ratio: a measure of risk-adjusted return calculated by dividing the portfolio active return (i.e., portfolio returnsminus benchmark return) by the standard deviation of the active return. Sharpe Ratio: the return over the risk free rate per unit of risk. Up/Down Capture: a measure of the manager’s performance in up/down markets relative tothe market itself. Profit Margin: relationship of gross profits to net sales. Return on Assets: net income for past 12 months divided by total assets. Return on Equity: the net income divided by total common equity outstanding,expressed as a percent. Debt/Equity Ratio: total long-term debt divided by total shareholder’s equity. Sales Per Share: the total revenue earned per share over a 12-month period, net of returns, allowances, and discounts. EarningsPer Share: portion of a company’s profit allocated to each outstanding share of common stock. Cash Flow: a measure of the cash generating capability of a company calculated by adding non-cash charges (e.g. depreciation) andinterest expense to pretax income. Turnover: calculated by dividing the lesser of Purchases or Sales by Average Capital. Active Share: the proportion of holdings by weight that differ from holdings of the benchmark index.
The MSCI All Country World ex-US Index is a free float-adjusted market capitalization index that is designed to measure equity market performance in the global developed and emerging markets, excluding the US. The Indexconsists of 48 developed and emerging market countries. The MSCI USA Index is designed to measure the performance of the large and mid cap segments of the US market. With 637 constituents, the index covers approximately85% of the free float-adjusted market capitalization in the US. You cannot invest directly in these Indexes.
All performance and data shown are in US dollar terms, unless otherwise noted.
Harding Loevner’s Quality, Growth, and Value rankings are proprietary measures determined using objective data. Quality rankings are based on the stability, trend, and level of profitability, as well as balance sheet strength.Growth rankings are based on historical growth of earnings, sales, and assets, as well as expected changes in earnings and profitability. Value rankings are based on several valuation measures, including price ratios.
The Composite and Attribution returns may show discrepancies due to the different data sources for these returns. Composite performance is preliminary and obtained from Harding Loevner’s accounting system and Attributionreturns are obtained from the FactSet portfolio analysis system. Please note returns from FactSet are not audited for GIPS compliance and are for reference only.
Source (Benchmark Performance, Performance Attribution, Contributors and Detractors): FactSet, Harding Loevner International Equity Composite; MSCI Inc.
Source (Portfolio Exposures, Portfolio Transactions, Portfolio Allocation Comparison, Quality & Growth Characteristics [Run date: July 5, 2020, based on the latest available data in FactSet on this date.]): FactSet; Harding LoevnerInternational Equity Model; MSCI Inc.
Source (Investment Statistics): eVestment Alliance; Harding Loevner International Equity Composite, based on composite returns.
MSCI Inc. and S&P do not make any express or implied warranties or representations and shall have no liability whatsoever with respect to any GICS data contained herein.
FactSet Fundamentals, Copyright 2020 FactSet Research Systems, Inc. Axioma Portfolio and Risk Analytics. All rights reserved.
Disclosures