fundamental difference between urban people movement and urban goods movement people movement...
Post on 21-Dec-2015
231 views
TRANSCRIPT
Fundamental Difference between Urban People Movement and Urban Goods Movement
Fundamental Difference between Urban People Movement and Urban Goods Movement
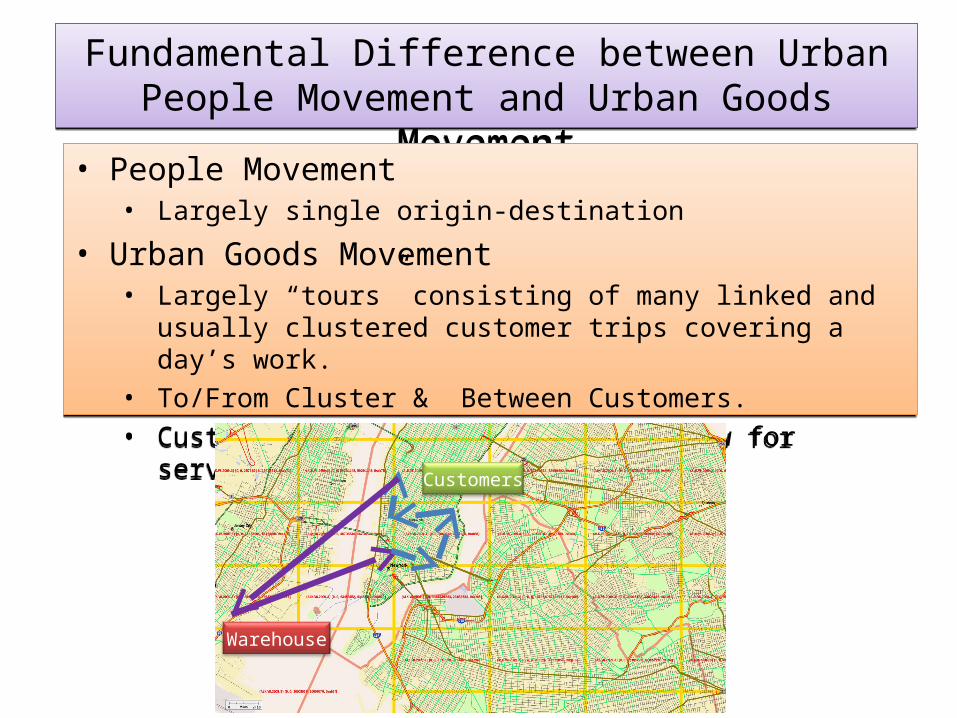
• People Movement • Largely single origin-destination
• Urban Goods Movement• Largely “tours” consisting of many linked and usually clustered
customer trips covering a day’s work. • To/From Cluster & Between Customers.• Customer often specifies time window for service
• People Movement • Largely single origin-destination
• Urban Goods Movement• Largely “tours” consisting of many linked and usually clustered
customer trips covering a day’s work. • To/From Cluster & Between Customers.• Customer often specifies time window for service
Warehouse
Customers
Objective of Pilot Test
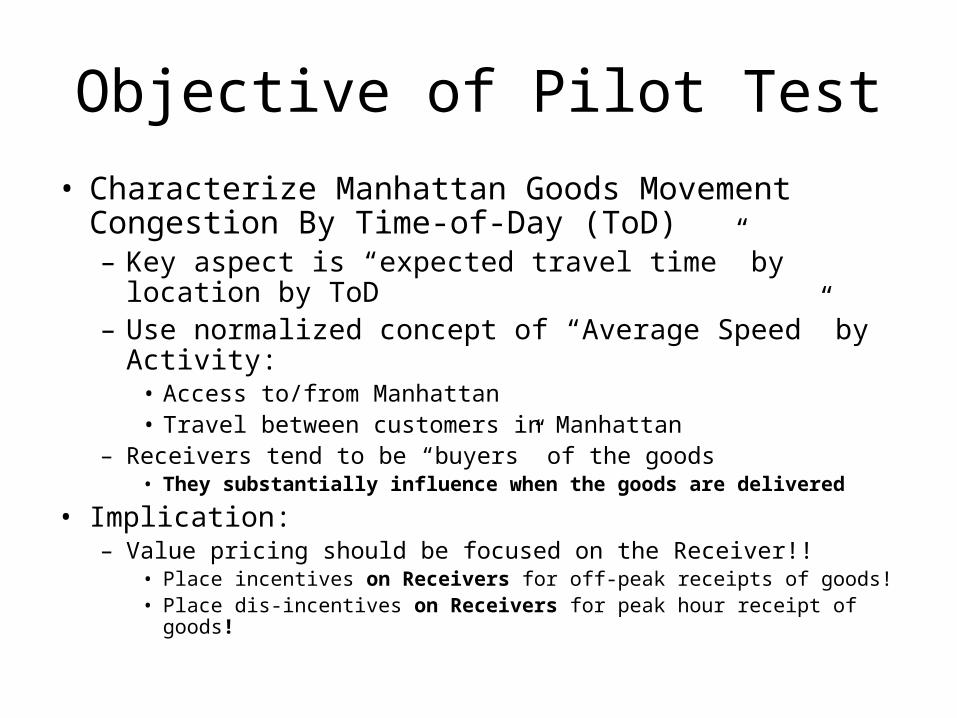
• Characterize Manhattan Goods Movement Congestion By Time-of-Day (ToD)– Key aspect is “expected travel time” by location by ToD– Use normalized concept of “Average Speed” by Activity:
• Access to/from Manhattan• Travel between customers in Manhattan
– Receivers tend to be “buyers” of the goods• They substantially influence when the goods are delivered
• Implication:– Value pricing should be focused on the Receiver!!
• Place incentives on Receivers for off-peak receipts of goods!• Place dis-incentives on Receivers for peak hour receipt of goods!
Quantifying ToD and Spatial Congestion
• Method:– Focused on using GPS to objectively measure the
performance of the of the urban freight system– Gather frequent (~ every 5 seconds) GPS
“Breadcrumb” data: ID, Position, Velocity, Date, Time– Analytically segregate customer stop activity from
movement activity• Must be done accurately:
– Congestion can look like a customer stop– A customer stop can look like congestion
GPS Data System
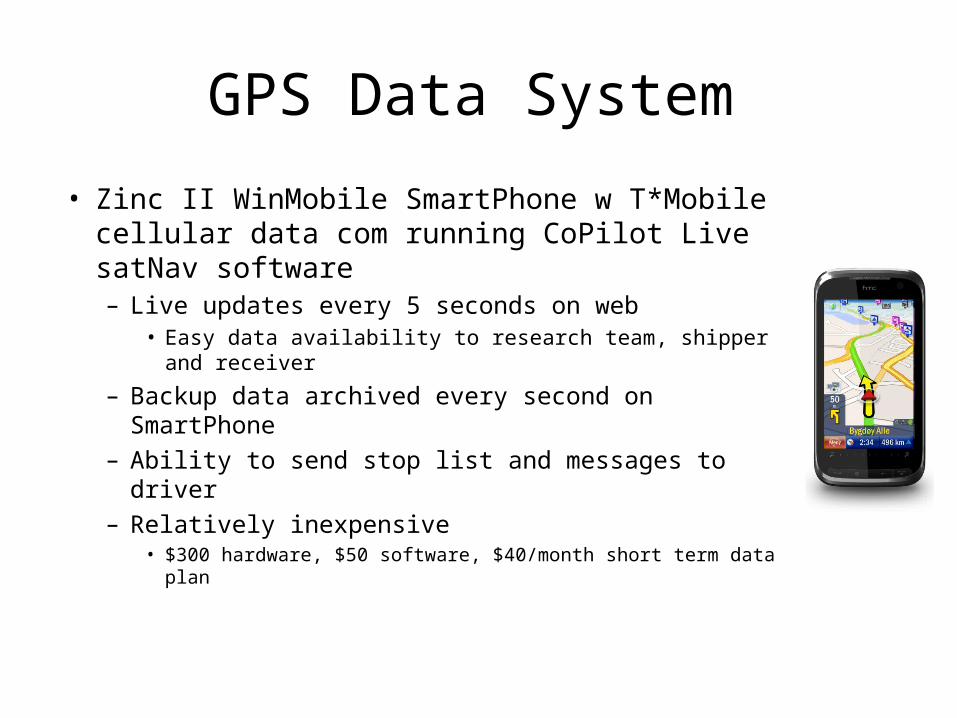
• Zinc II WinMobile SmartPhone w T*Mobile cellular data com running CoPilot Live satNav software – Live updates every 5 seconds on web
• Easy data availability to research team, shipper and receiver
– Backup data archived every second on SmartPhone– Ability to send stop list and messages to driver– Relatively inexpensive
• $300 hardware, $50 software, $40/month short term data plan
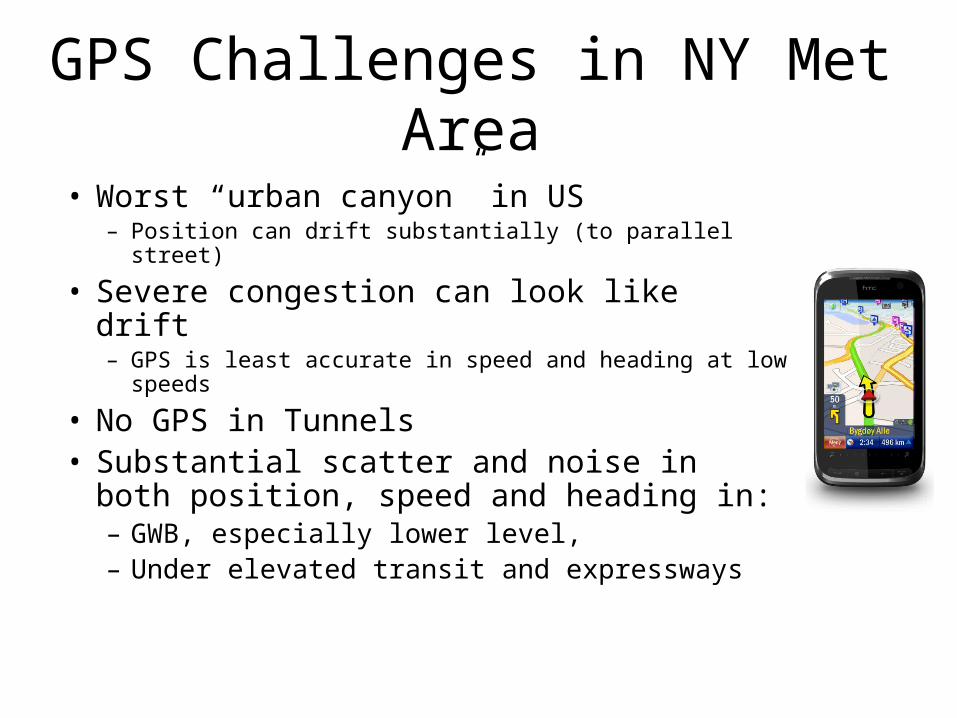
GPS Challenges in NY Met Area
• Worst “urban canyon” in US– Position can drift substantially (to parallel street)
• Severe congestion can look like drift– GPS is least accurate in speed and heading at low speeds
• No GPS in Tunnels• Substantial scatter and noise in both
position, speed and heading in:– GWB, especially lower level,– Under elevated transit and expressways

Preliminary Results from Two Carrier
• Baldor Specialty Foods
• New Deal Logistics (NDL)
Pilot Test:Remote Sensing of Off-Peak Deliveries:
Baldor Specialty Preliminary Results
5 Trucks from Nov 1 through Dec 2, 2009
Alain L. KornhauserDec 4, 2009
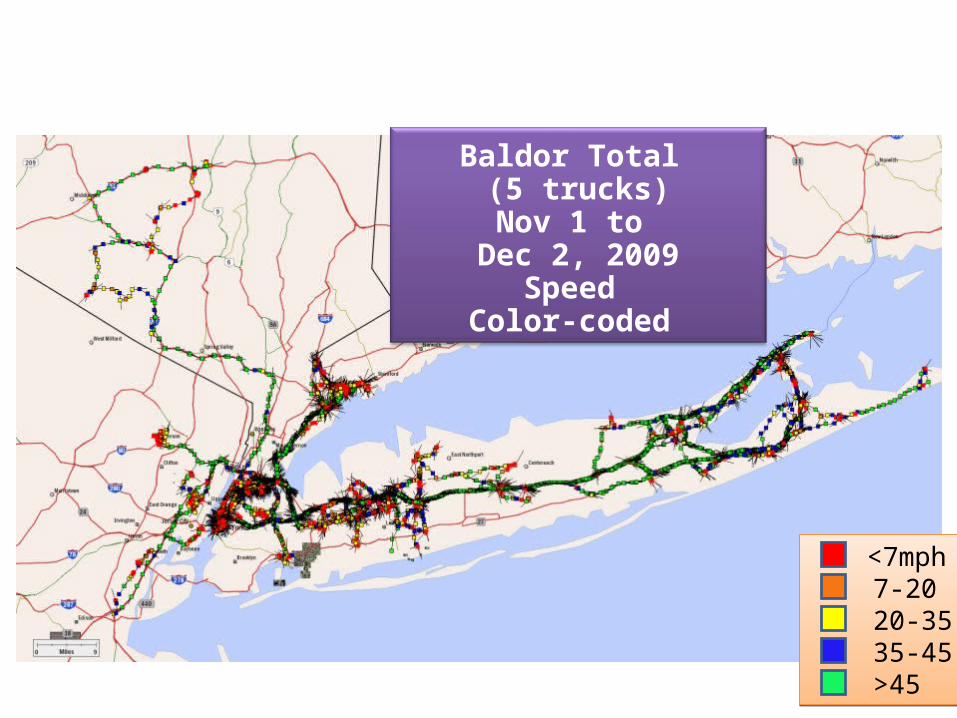
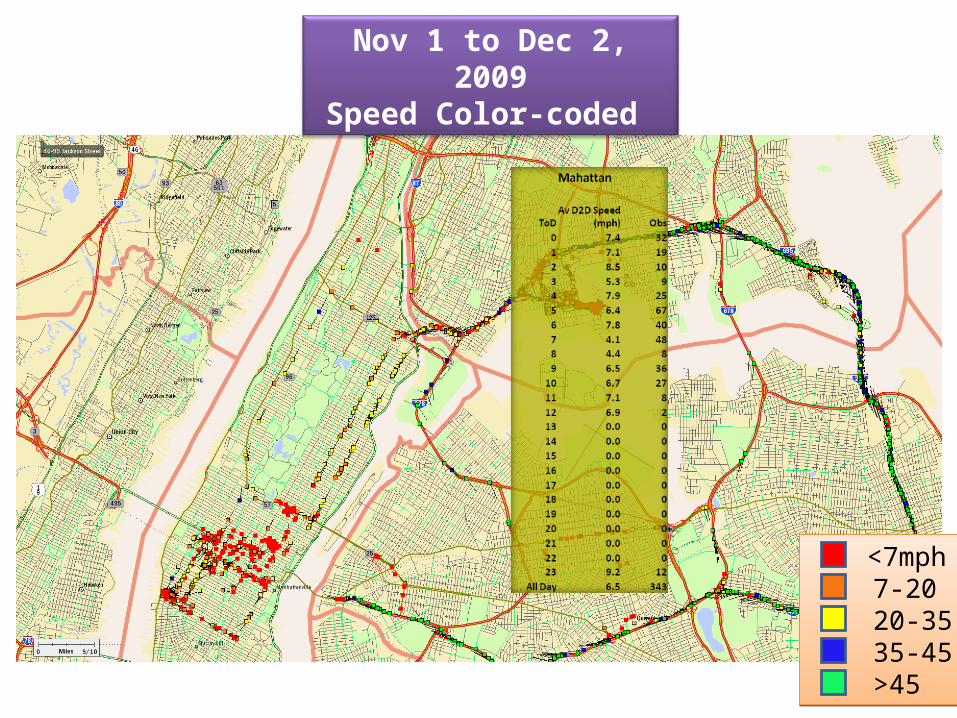
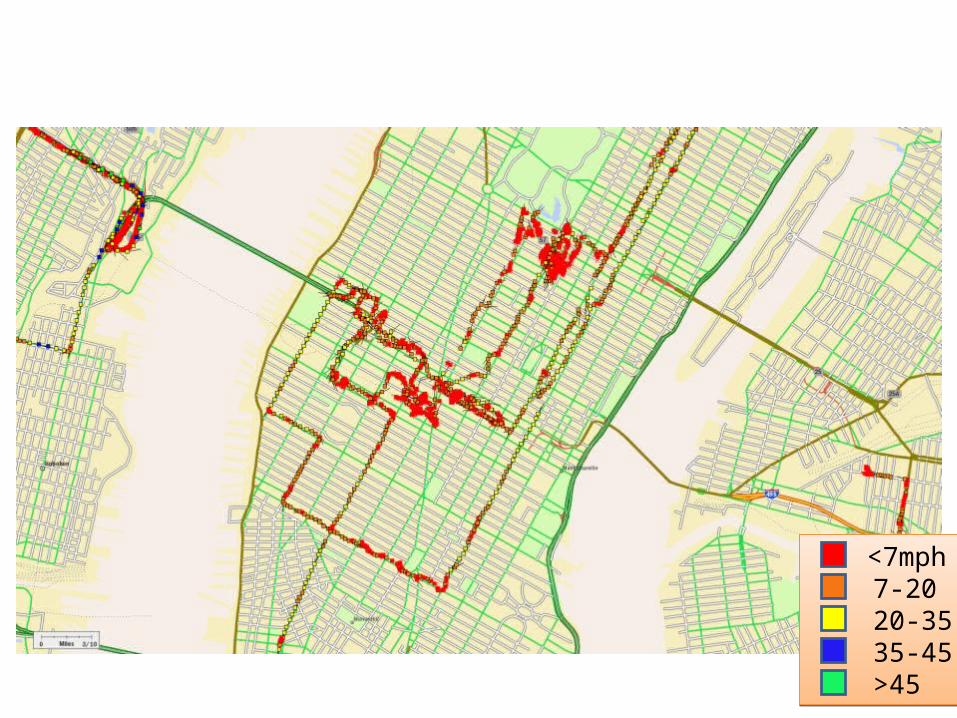
Baldor Total (5 trucks)Nov 1 to
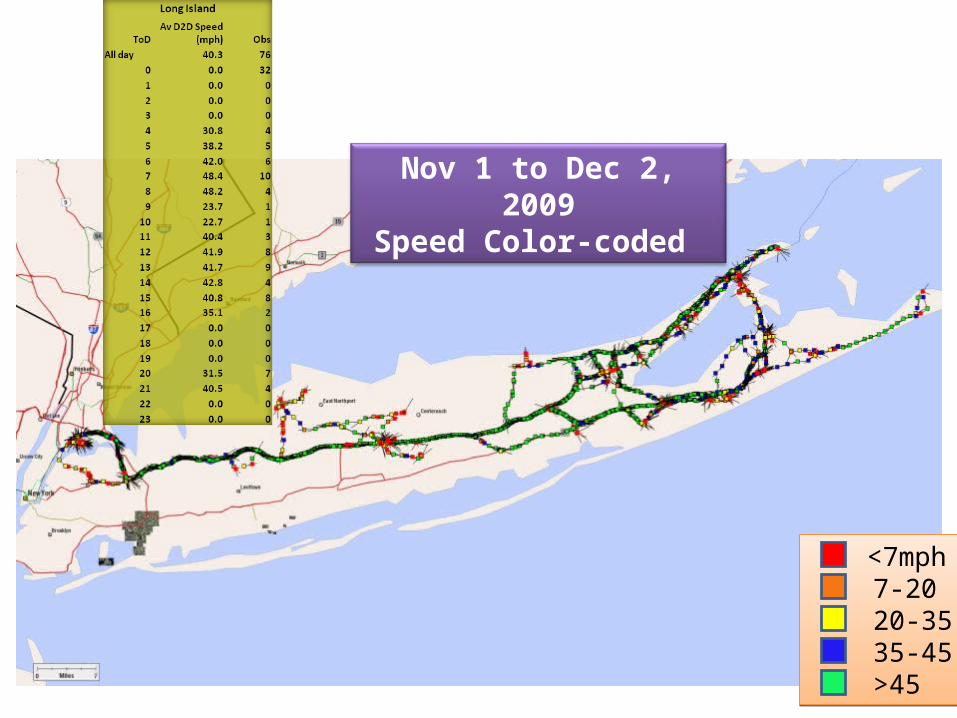
Dec 2, 2009Speed
Color-coded
<7mph 7-20 20-35 35-45 >45
<7mph 7-20 20-35 35-45 >45
<7mph 7-20 20-35 35-45 >45
<7mph 7-20 20-35 35-45 >45
Baldor Truck #1120 Nov 1 to Dec 2, 2009Speed Color-coded
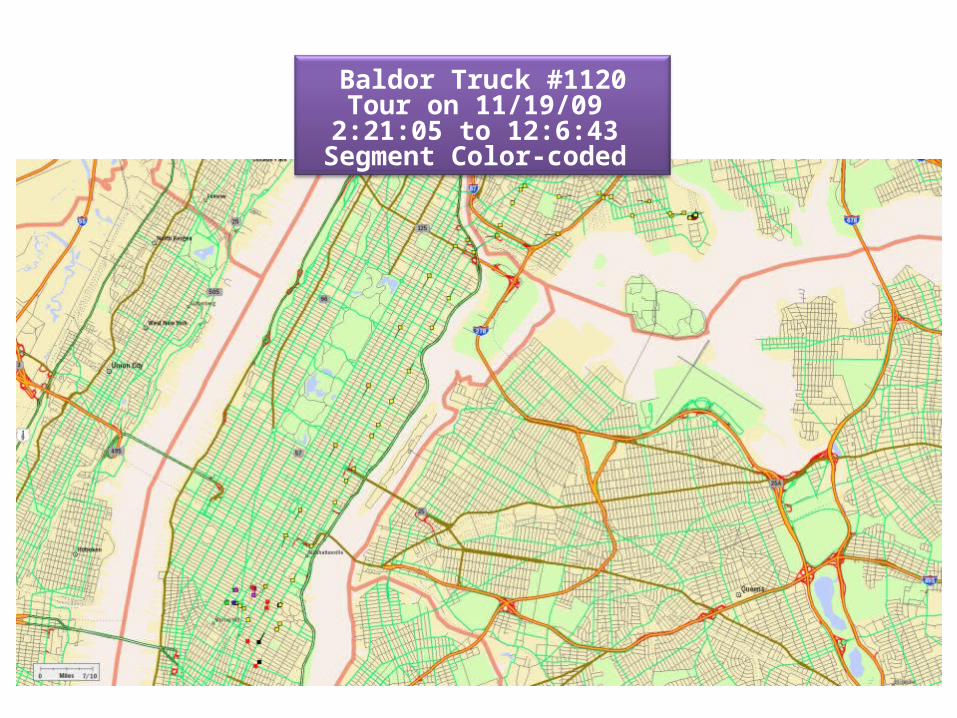
Baldor Truck #1120Tour on 11/19/09 2:21:05 to 12:6:43
Segment Color-coded
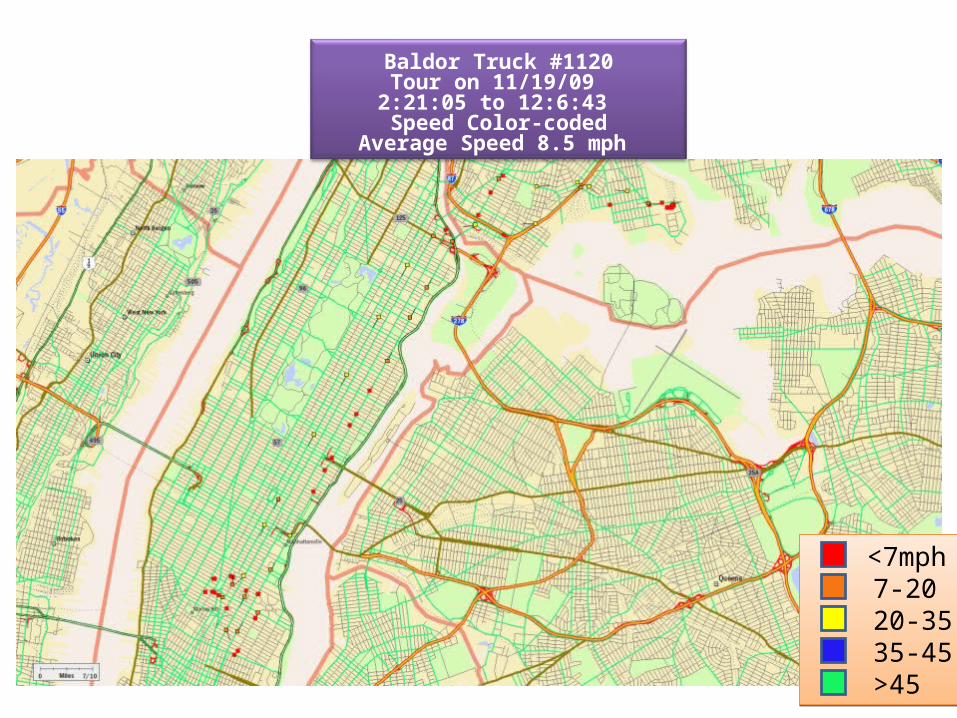
Baldor Truck #1120Tour on 11/19/09 2:21:05 to 12:6:43 Speed Color-coded
Average Speed 8.5 mph
<7mph 7-20 20-35 35-45 >45
<7mph 7-20 20-35 35-45 >45
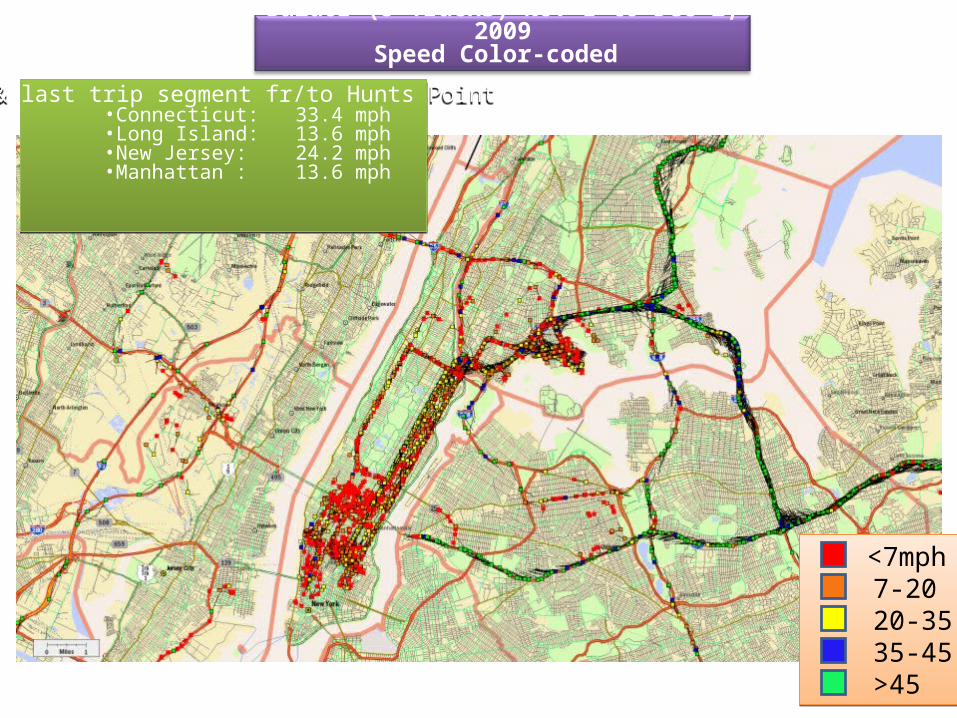
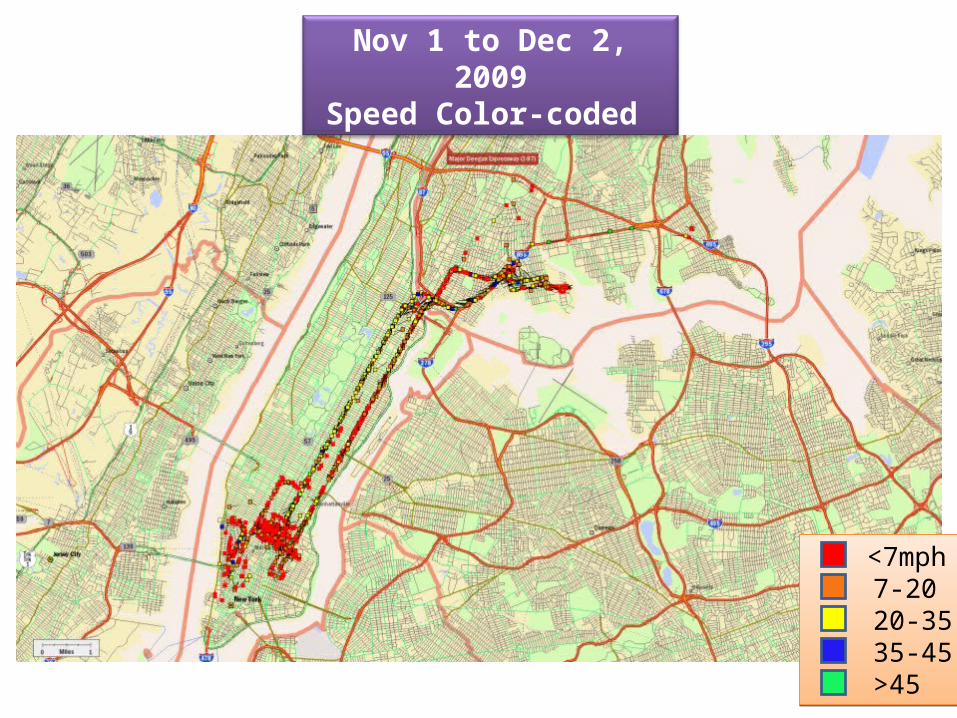
Baldor (5 Trucks) Nov 1 to Dec 2, 2009Speed Color-coded
<7mph 7-20 20-35 35-45 >45
<7mph 7-20 20-35 35-45 >45
1st & last trip segment fr/to Hunts Point•Connecticut: 33.4 mph•Long Island: 13.6 mph•New Jersey: 24.2 mph•Manhattan : 13.6 mph
1st & last trip segment fr/to Hunts Point•Connecticut: 33.4 mph•Long Island: 13.6 mph•New Jersey: 24.2 mph•Manhattan : 13.6 mph
Baldor Truck #931 Nov 1 to Dec 2, 2009Speed Color-coded
<7mph 7-20 20-35 35-45 >45
<7mph 7-20 20-35 35-45 >45
<7mph 7-20 20-35 35-45 >45
<7mph 7-20 20-35 35-45 >45
Baldor Truck #1040 Nov 1 to Dec 2, 2009Speed Color-coded
Pilot Test:Remote Sensing of Off-Peak Deliveries:
New Deal Logistics Preliminary Results
Initial use of 4 CoPilot | Live SmartPhones from Oct 2 through Oct 14, 2009
Alain L. KornhauserOct 19, 2009
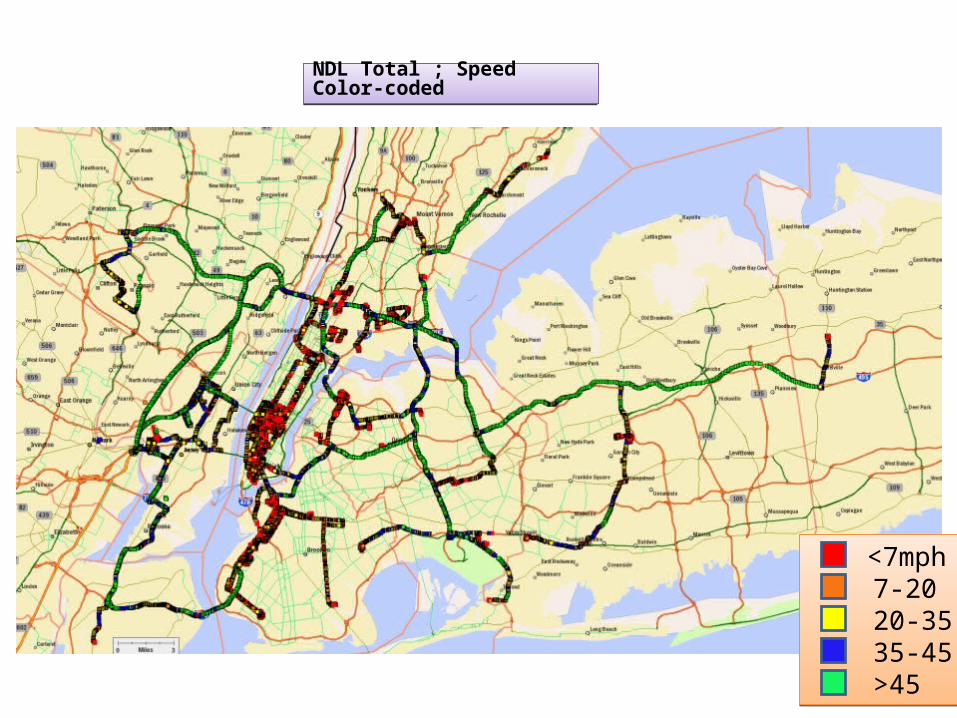
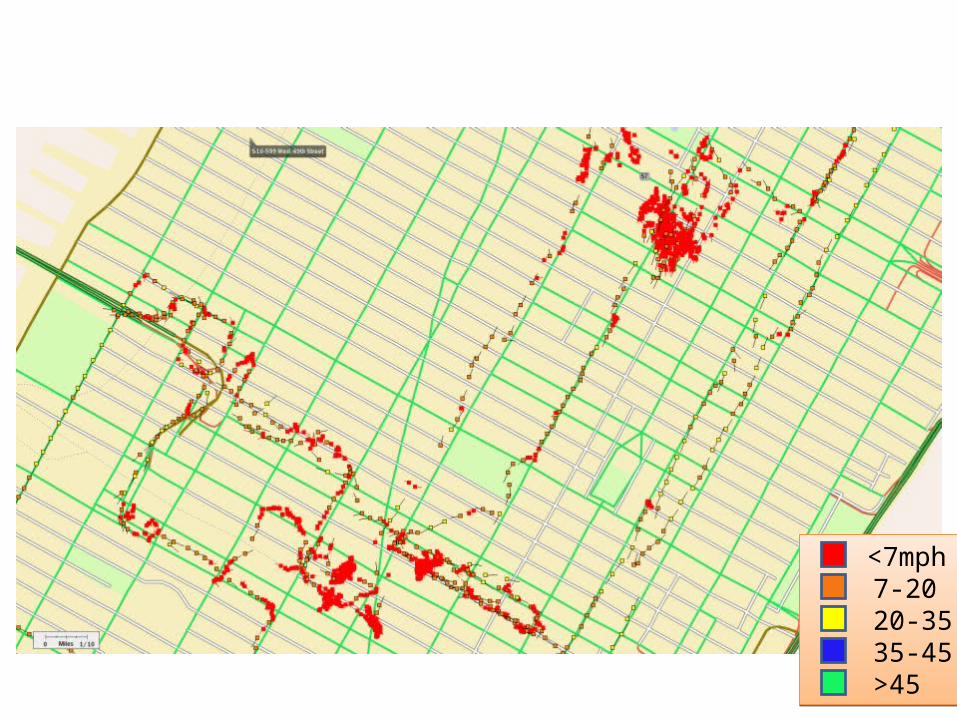
NDL Total ; Speed Color-coded NDL Total ; Speed Color-coded
<7mph 7-20 20-35 35-45 >45
<7mph 7-20 20-35 35-45 >45
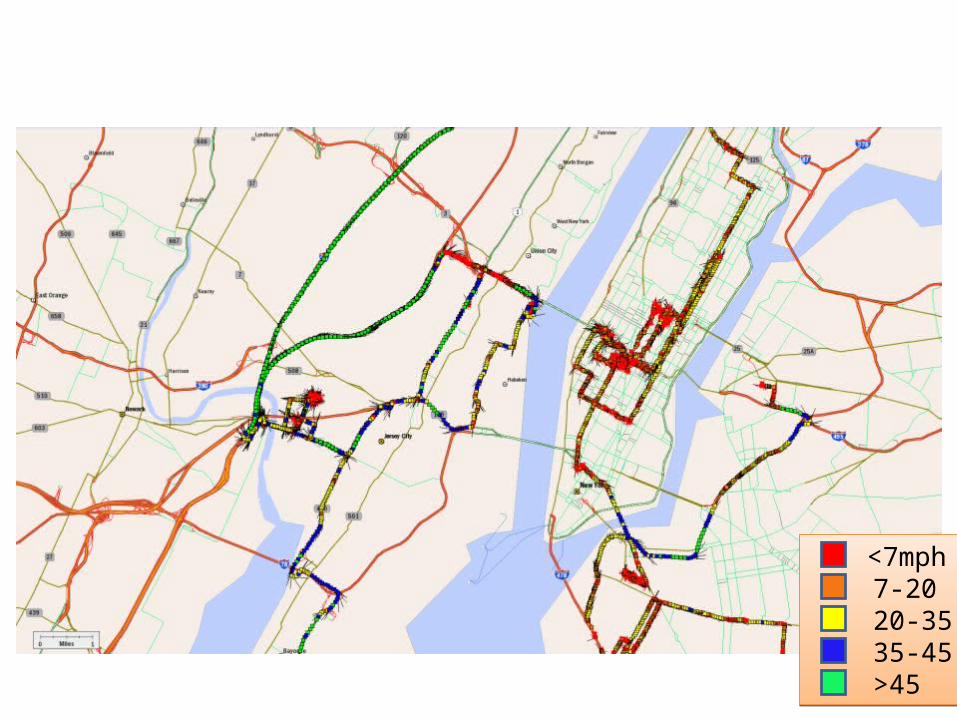
NDL2; Speed:
<7mph 7-20 20-35 35-45 >45
<7mph 7-20 20-35 35-45 >45
NDL2; Speed:
<7mph 7-20 20-35 35-45 >45
<7mph 7-20 20-35 35-45 >45
NDL2; Speed:
<7mph 7-20 20-35 35-45 >45
<7mph 7-20 20-35 35-45 >45
NDL1; Speed:
NDL1; Speed:
NDL1; Speed:
NDL2; P&D Stops:
NDL2; Speed:
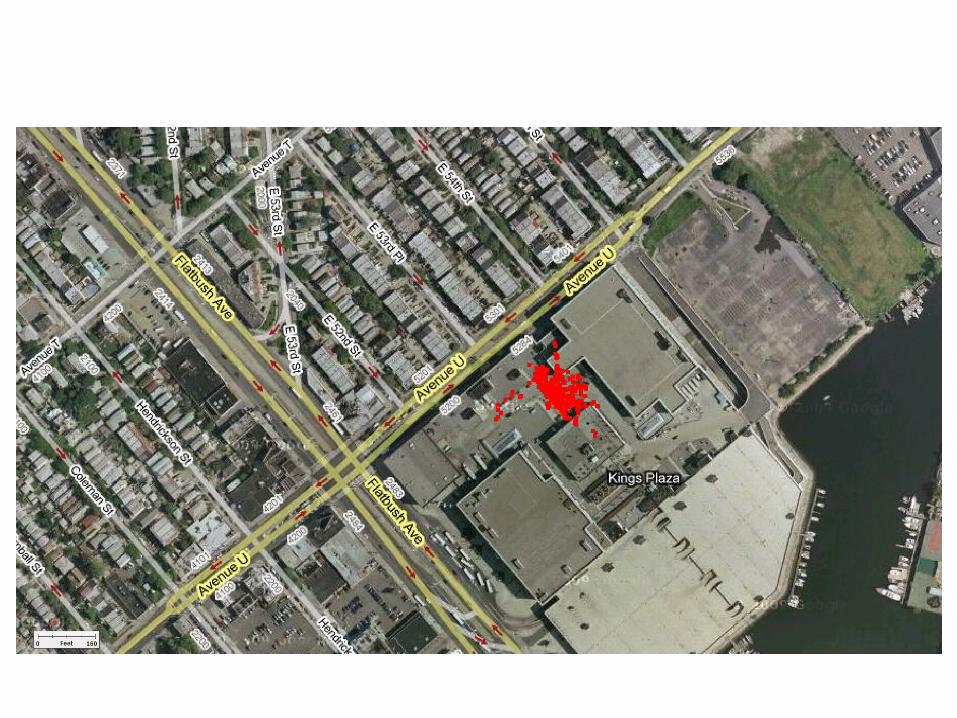
NDL2; P&D Stops: Kings Plaza
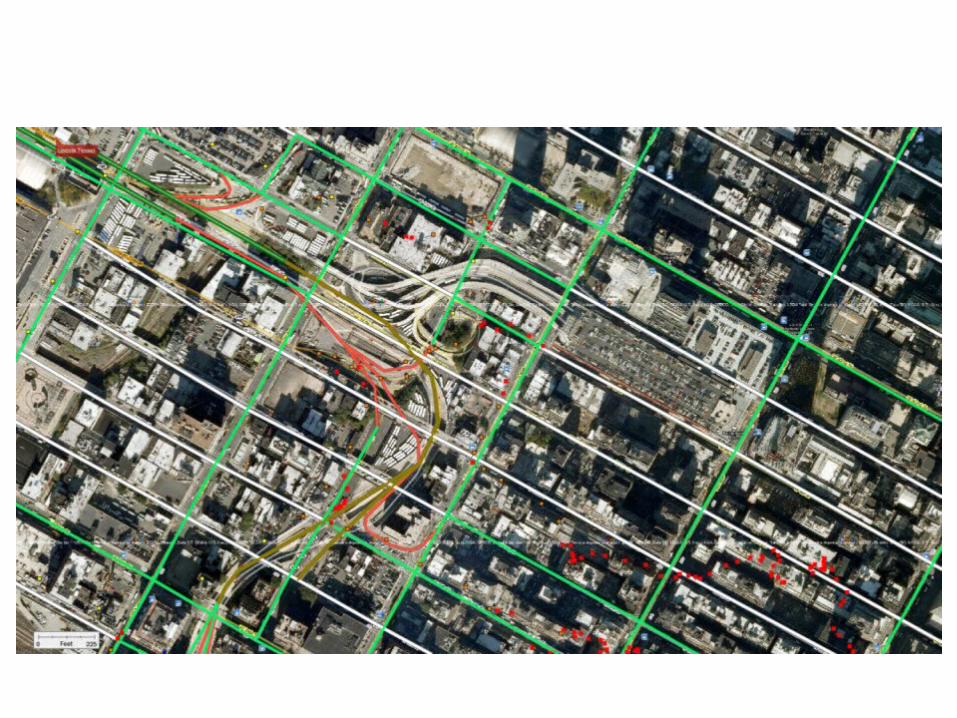
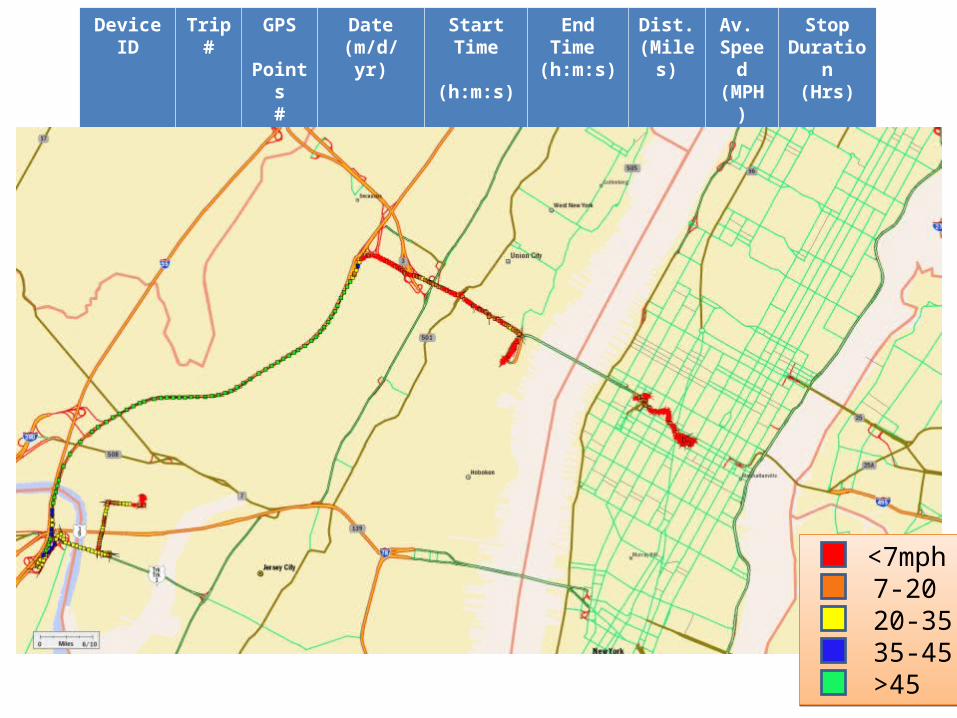
Tour Stop Segments Lincoln 8AM
Oct 5, 2009
Device ID Trip # GPS Points
#
Date(m/d/yr)
Start Time (h:m:s)
End Time (h:m:s)
Dist.(Miles)
Av. Speed(MPH)
Stop Duration
(Hrs)
NDL1 5 831 10/05/09 8:10:16 9:30:27 12.27 9.2 eod
<7mph 7-20 20-35 35-45 >45
<7mph 7-20 20-35 35-45 >45
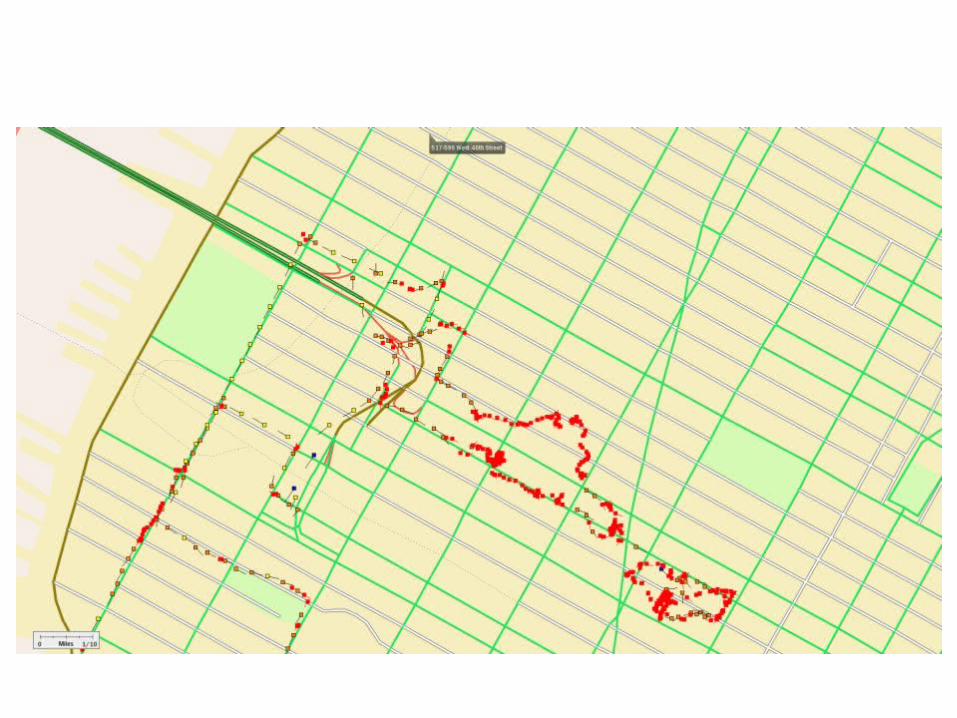
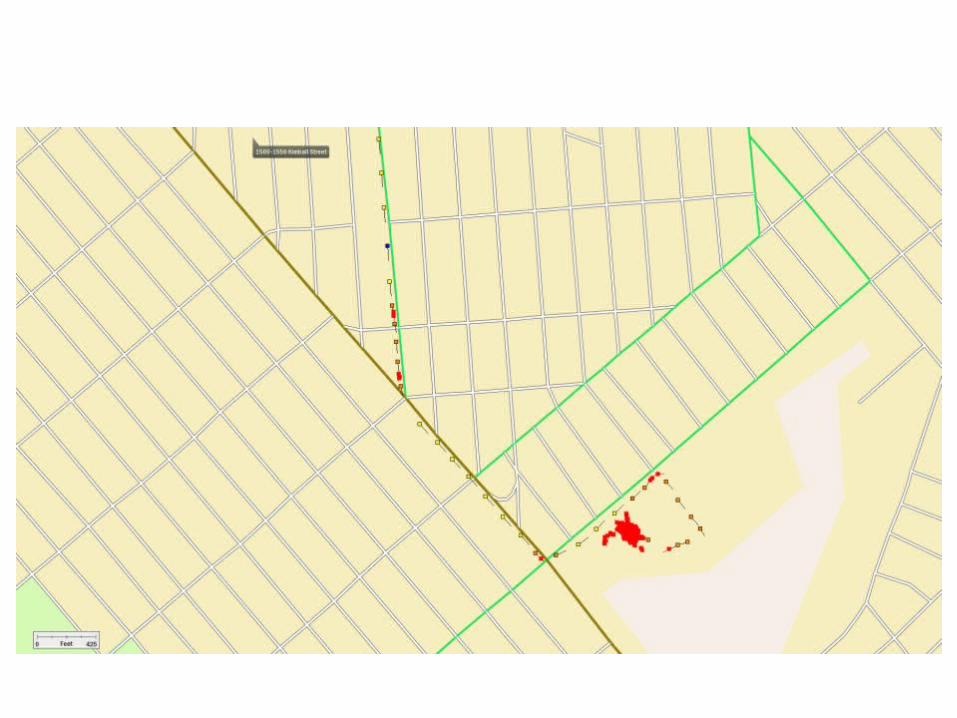
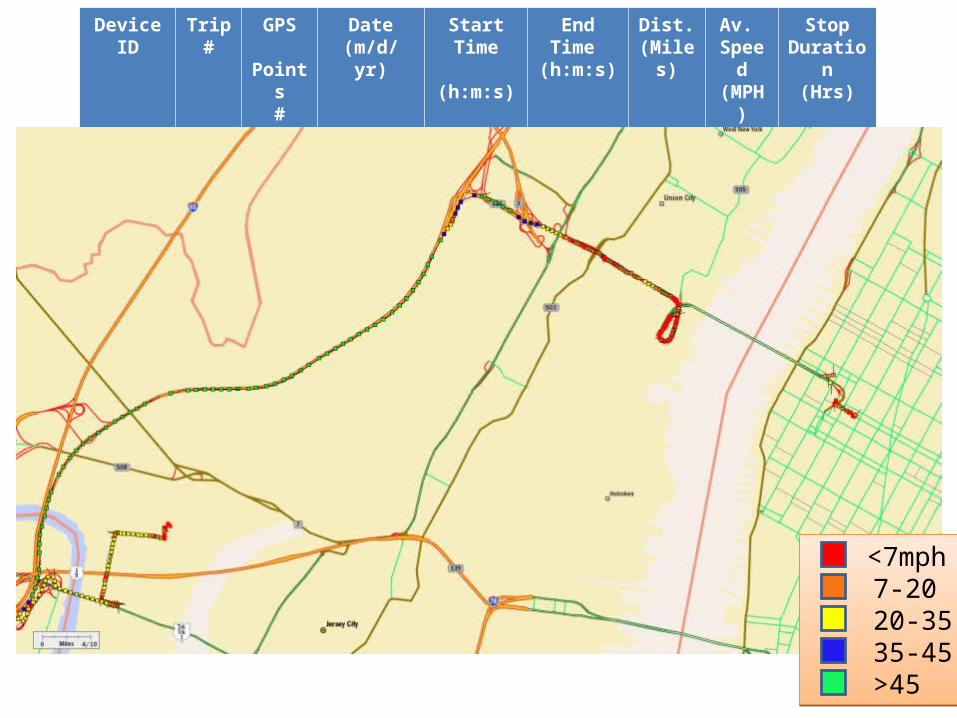
Tour Stop Segments – Lincoln 8AMOct 2, 2009
Device ID Trip # GPS Points
#
Date(m/d/yr)
Start Time (h:m:s)
End Time (h:m:s)
Dist.(Miles)
Av. Speed(MPH)
Stop Duration
(Hrs)
NDL1 3 440 10/02/09 7:56:27 8:42:01 12.33 16.2 0.30
<7mph 7-20 20-35 35-45 >45
<7mph 7-20 20-35 35-45 >45
Device ID Trip # GPS Points
#
Date(m/d/yr)
Start Time (h:m:s)
End Time (h:m:s)
Dist.(Miles)
Av. Speed(MPH)
Stop Duration
(Hrs)
NDL1 4 38 10/02/09 9:00:16 9:03:39 0.28 5.0 eod
<7mph 7-20 20-35 35-45 >45
<7mph 7-20 20-35 35-45 >45
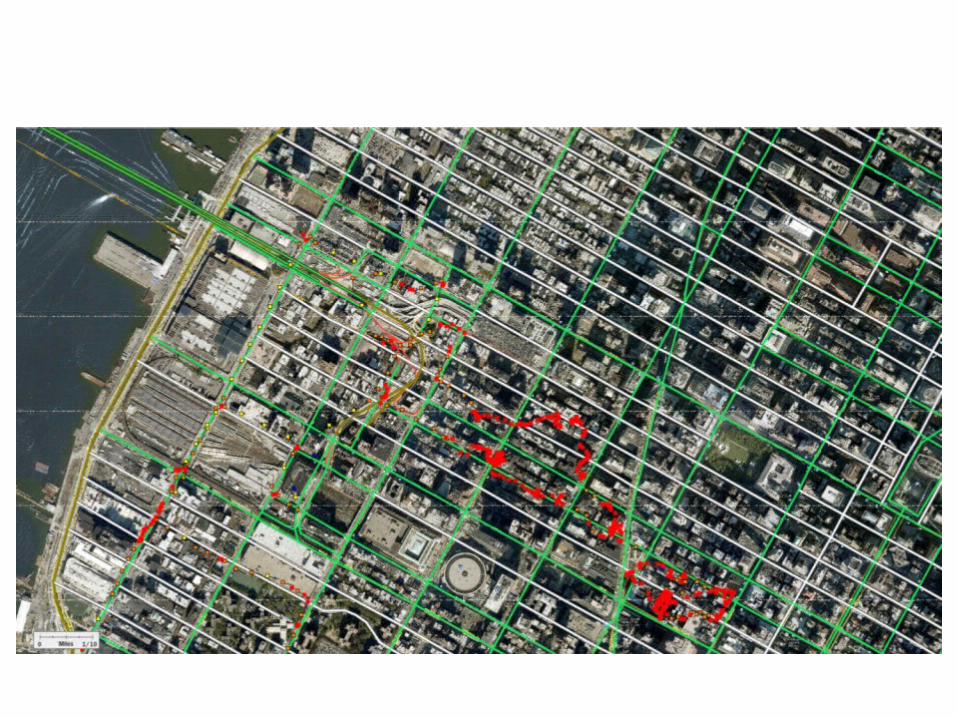
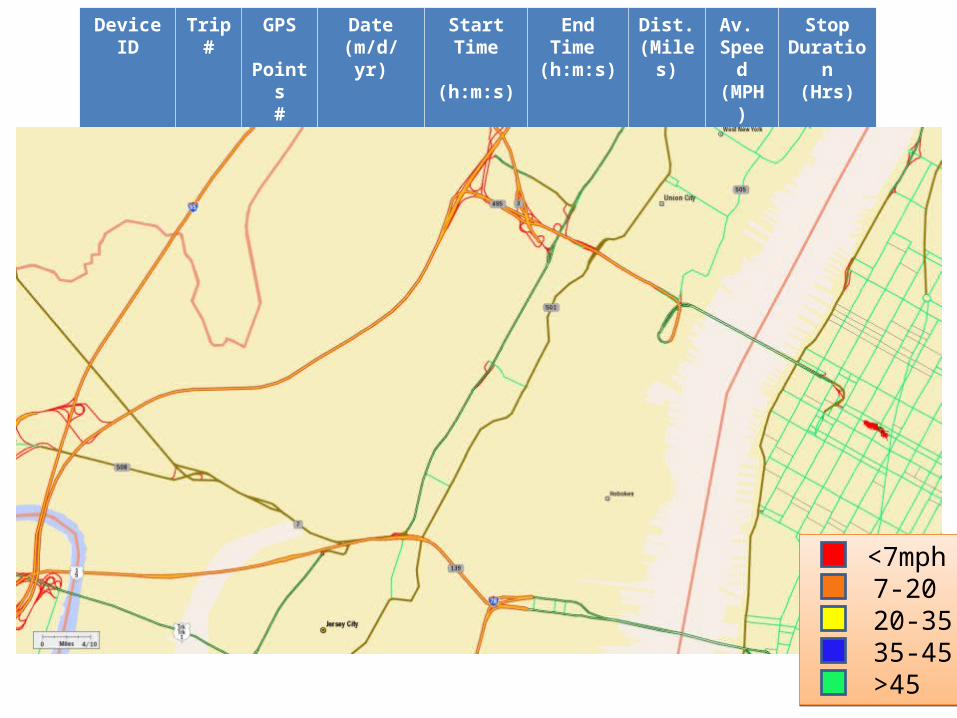
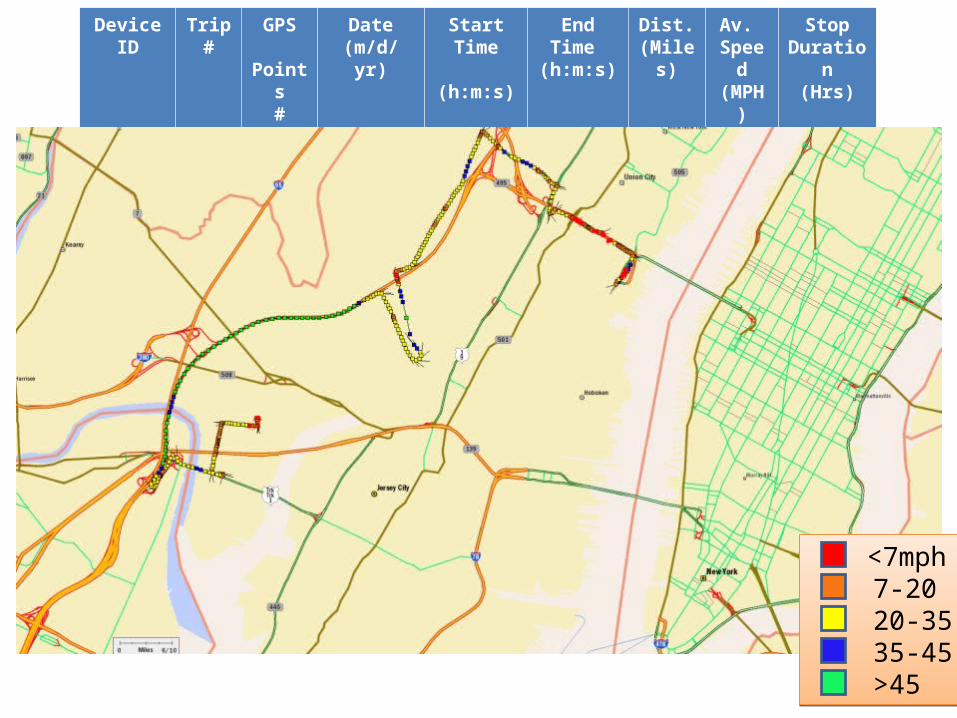
Tour Stop Segments – Lincoln 8AM - Wall St
Oct 7, 2009
Device ID Trip # GPS Points
#
Date(m/d/yr)
Start Time (h:m:s)
End Time (h:m:s)
Dist.(Miles)
Av. Speed(MPH)
Stop Duration
(Hrs)
NDL1 7 405 10/07/09 8:17:01 8:53:24 12.97 21.4 0.19
<7mph 7-20 20-35 35-45 >45
<7mph 7-20 20-35 35-45 >45
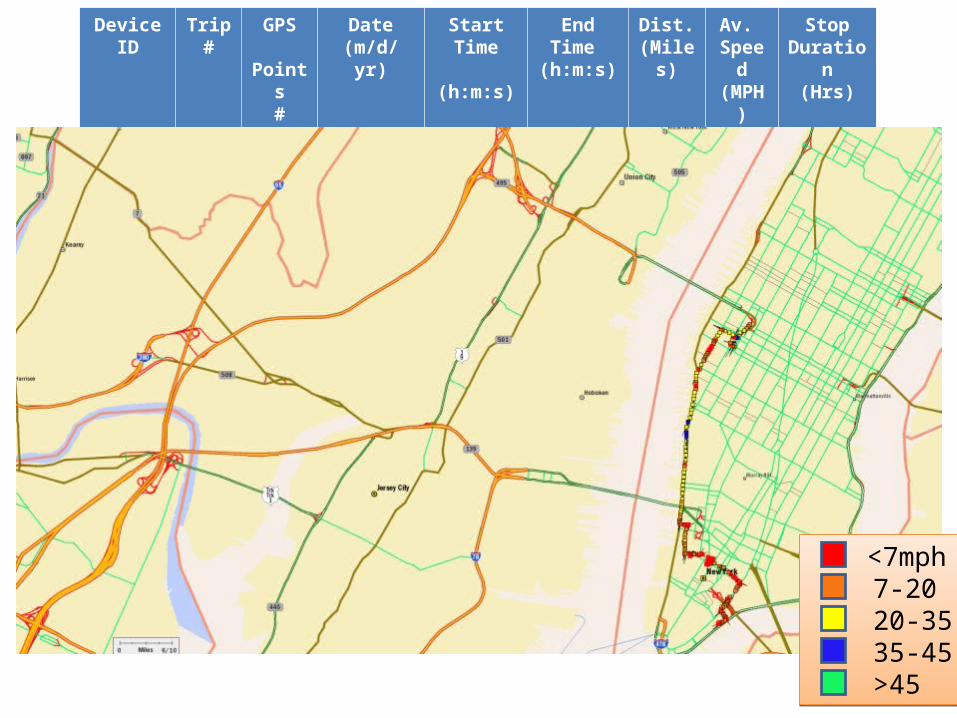
Device ID Trip # GPS Points
#
Date(m/d/yr)
Start Time (h:m:s)
End Time (h:m:s)
Dist.(Miles)
Av. Speed(MPH)
Stop Duration
(Hrs)
NDL1 8 405 10/07/09 9:04:55 9:36:04 4.96 9.6 eod
<7mph 7-20 20-35 35-45 >45
<7mph 7-20 20-35 35-45 >45
Tour Stop Segments – Lincoln 8PM Oct 7, 2009
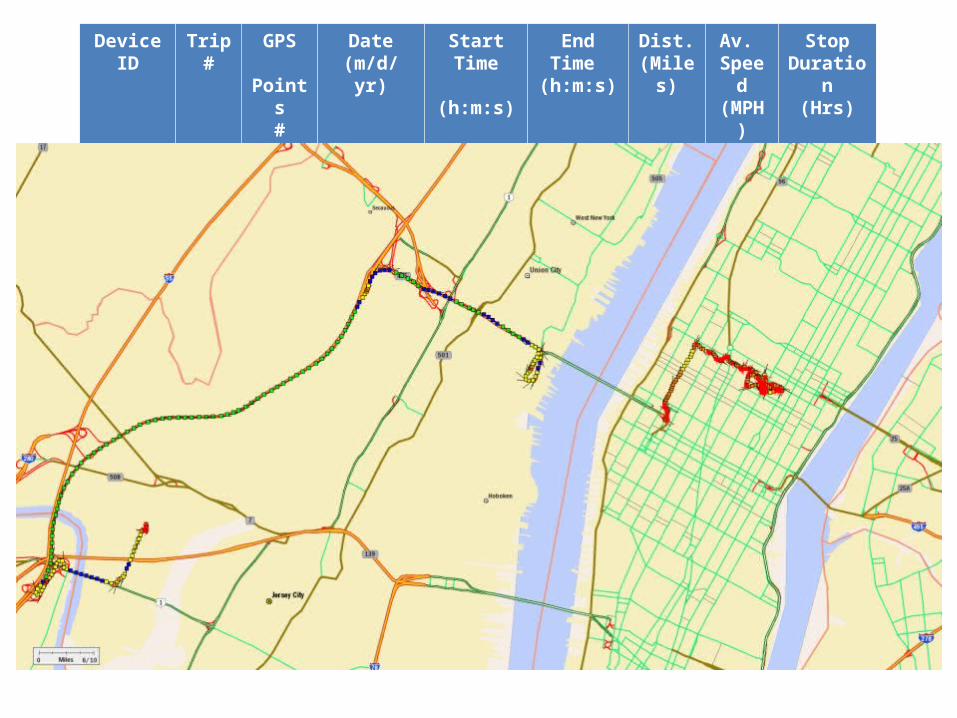
Device ID Trip # GPS Points
#
Date(m/d/yr)
Start Time (h:m:s)
End Time (h:m:s)
Dist.(Miles)
Av. Speed(MPH)
Stop Duration
(Hrs)
NDL3 88 654 10/14/09 20:15:10 21:13:37 16.15 16.6 4.13
Tour Stop Segments – Lincoln 5pmOct 13, 2009
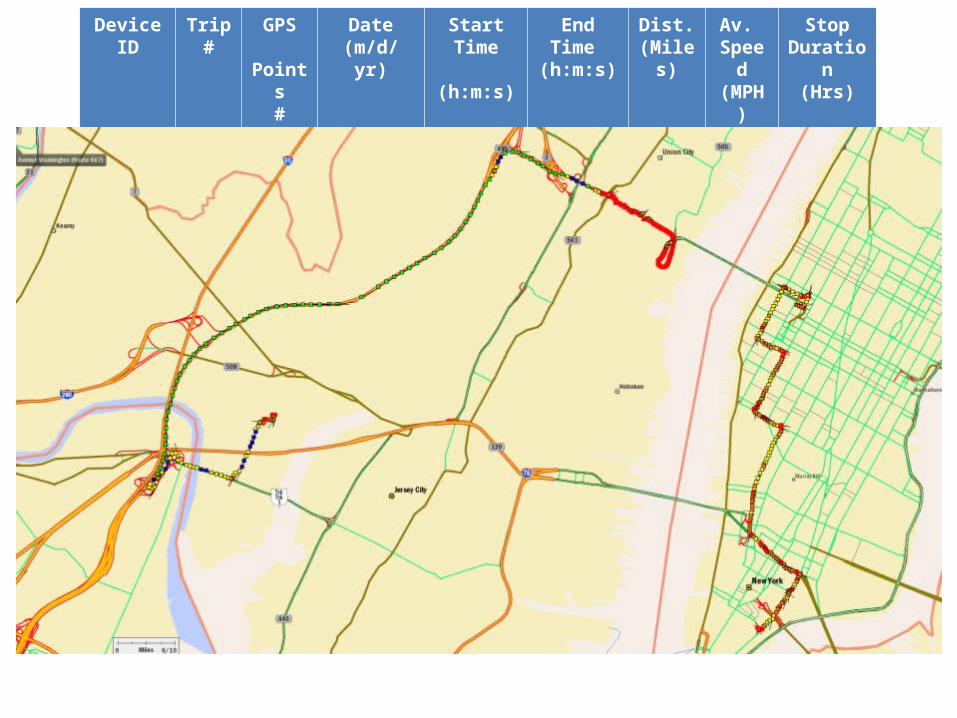
Device ID Trip # GPS Points
#
Date(m/d/yr)
Start Time (h:m:s)
End Time (h:m:s)
Dist.(Miles)
Av. Speed(MPH)
Stop Duration
(Hrs)
NDL1 15 986 10/13/09 17:53:45 19:25:59 16.8 10.9 eod
Tour Stop Segments – GWB – 7AMOct 2, 2009
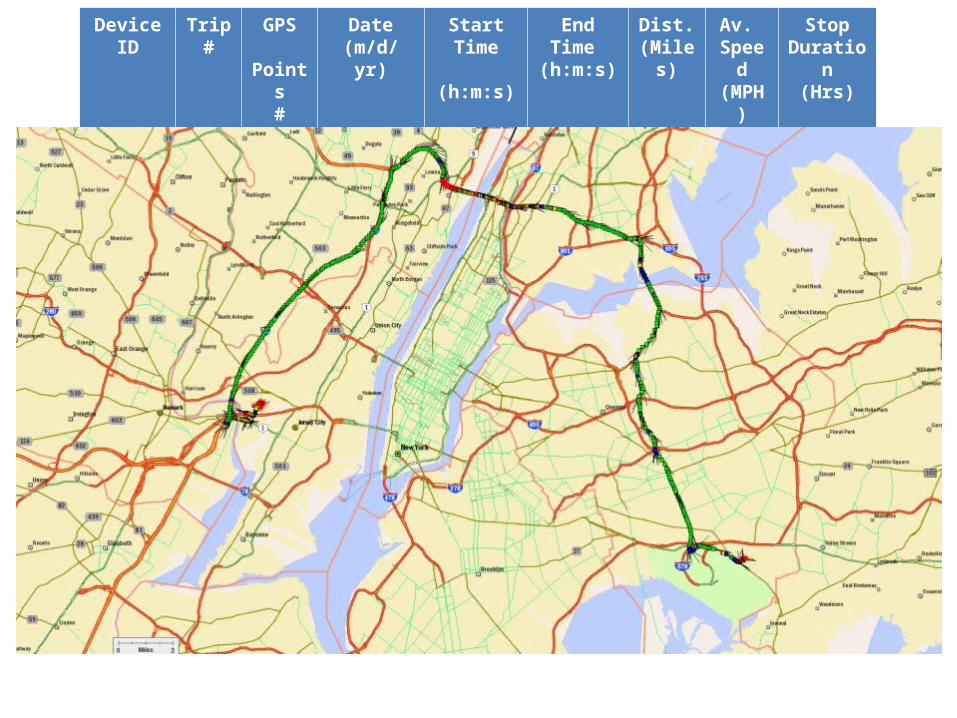
Device ID Trip # GPS Points
#
Date(m/d/yr)
Start Time (h:m:s)
End Time (h:m:s)
Dist.(Miles)
Av. Speed(MPH)
Stop Duration
(Hrs)
NDL2 19 774 10/02/09 6:53:22 8:05:44 39.5 32.8 2.06
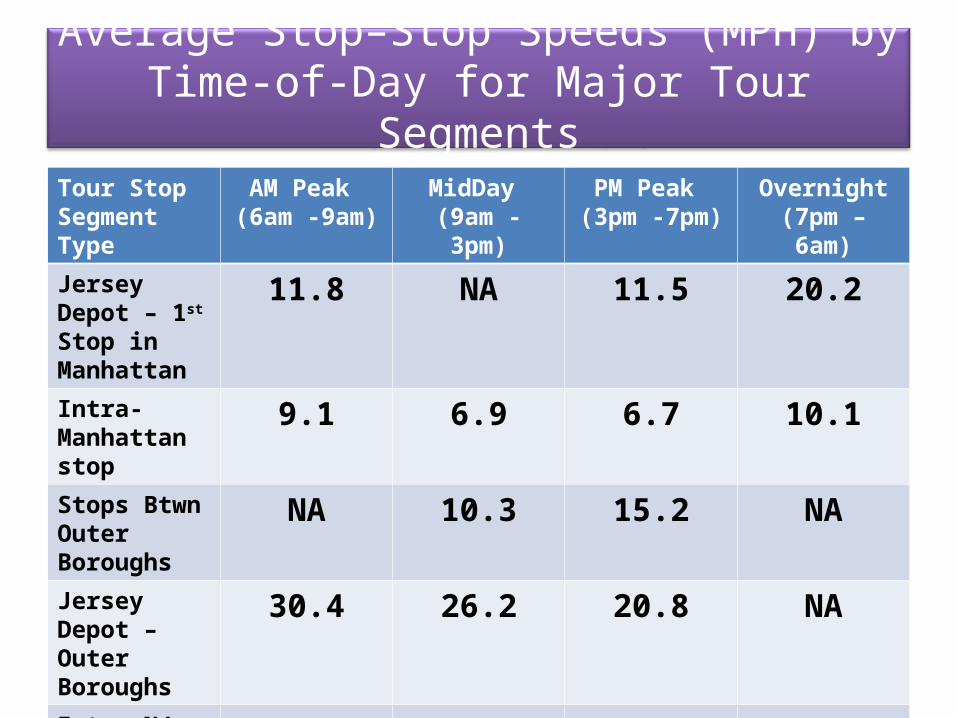
Average Stop–Stop Speeds (MPH) by Time-of-Day for Major Tour Segments
Preliminary results from Pilot Test (Oct 2- Oct 14, 2009)
Tour Stop Segment Type
AM Peak (6am -9am)
MidDay (9am - 3pm)
PM Peak (3pm -7pm)
Overnight(7pm – 6am)
Jersey Depot – 1st Stop in Manhattan
11.8 NA 11.5 20.2
Intra- Manhattan stop
9.1 6.9 6.7 10.1
Stops Btwn Outer Boroughs
NA 10.3 15.2 NA
Jersey Depot – Outer Boroughs
30.4 26.2 20.8 NA
Intra NJ Stops 21.4 30.2 27.3 NA